Embed Size (px)
Citation preview
b
Stuby the
udy one olde
n accer pop
S. I
Feb
cessinpulat
rudaya RSreerupa
bruary 20
ng hetion in
Rajan a
017
althcn Mya
care anmaar

Published by HelpAge International Myanmar Country Office No 25/A-1, New University Avenue Road, Saya San Ward, Bahan Township, Yangon, Myanmar Tel: +951 555351 Fax: +951 555351 Ext: 202 www.helpage.org www.ageingasia.org Author S. Irudaya Rajan Sreerupa
Acknowledgement We thank the European Union and governments of Australia, Denmark, France, Ireland, Italy, Luxembourg, the Netherlands, New Zealand, Sweden, Switzerland, the United Kingdom, the United States of America for their kind contributions to improving the livelihoods and food security of rural people in Myanmar. We would also like to thank the Mitsubishi Corporation, as a private sector donor. Disclaimer This document is supported with financial assistance from Australia, Denmark, the European Union, France, Ireland, Italy, Luxembourg, the Netherlands, New Zealand, Sweden, Switzerland, the United Kingdom, the United States of America, and the Mitsubishi Corporation. The views expressed herein are not to be taken to reflect the official opinion of any of the LIFT donors.
Copyright © HelpAge International 2017 This work is licensed under a Creative Commons Attribution-NonCommercial 4.0 International License, https://creativecommons.org/licenses/by-nc/4.0 Any parts of this publication may be reproduced without permission for non-profit and educational purposes. Please clearly credit HelpAge International and send us a copy or link.

i
Contents Contents i
List of tables iii
List of figures iv
List of boxes vi
List of abbreviations vii
Executive summary 1
1. Background 4
2. Nature of the study 5
3. Data and methods 7
Household survey 7
Sampling method 7
Household selection 8
Focus group discussions 8
4. Myanmar health system 9
5. Population ageing 11
6. Health status of older persons 14
Self-rated health status 14
Self-reported symptoms 14
Non-communicable diseases 15
Disability and functional limitation 16
Activities of Daily Living Scale 19
Risk Behaviors 20
7. Health care utilisation 21
8. Health seeking behaviour: outpatient healthcare 22
9. Barriers to accessing outpatient healthcare 26
Geographic accessibility of outpatient healthcare 26
Affordability of outpatient healthcare 28
Availability of outpatient healthcare 30
Acceptability of outpatient healthcare 34
10. Health seeking behaviour: inpatient healthcare 40
11. Barriers to accessing inpatient healthcare 43
Geographic accessibility of inpatient healthcare 43
Affordability of inpatient healthcare 44
Availability of inpatient healthcare 46
Acceptability of inpatient healthcare 50
ii
12. The way forward 53
Tackling poverty and lack of awareness 53
Strengthen the existing healthcare system 54
Greater investment in the public healthcare system 55
References 56
Annotated bibliography 59
iii
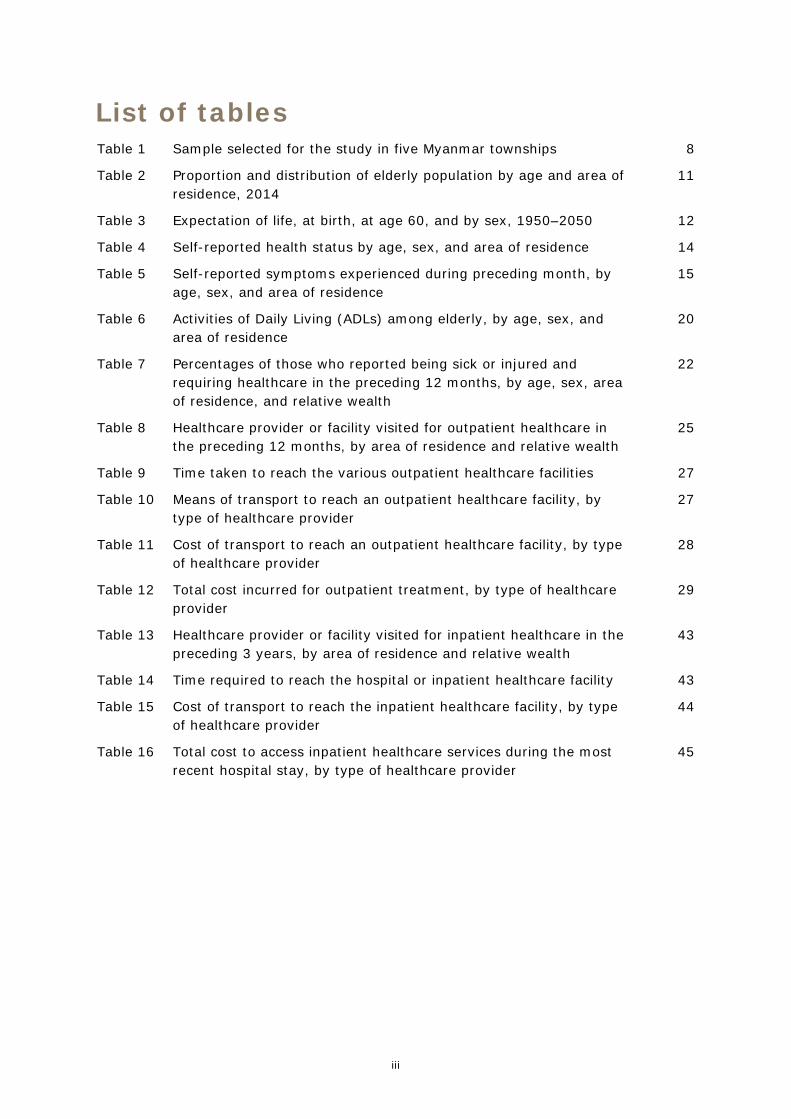
List of tables Table 1 Sample selected for the study in five Myanmar townships 8
Table 2 Proportion and distribution of elderly population by age and area of residence, 2014
11
Table 3 Expectation of life, at birth, at age 60, and by sex, 1950–2050 12
Table 4 Self-reported health status by age, sex, and area of residence 14
Table 5 Self-reported symptoms experienced during preceding month, by age, sex, and area of residence
15
Table 6 Activities of Daily Living (ADLs) among elderly, by age, sex, and area of residence
20
Table 7 Percentages of those who reported being sick or injured and requiring healthcare in the preceding 12 months, by age, sex, area of residence, and relative wealth
22
Table 8 Healthcare provider or facility visited for outpatient healthcare in the preceding 12 months, by area of residence and relative wealth
25
Table 9 Time taken to reach the various outpatient healthcare facilities 27
Table 10 Means of transport to reach an outpatient healthcare facility, by type of healthcare provider
27
Table 11 Cost of transport to reach an outpatient healthcare facility, by type of healthcare provider
28
Table 12 Total cost incurred for outpatient treatment, by type of healthcare provider
29
Table 13 Healthcare provider or facility visited for inpatient healthcare in the preceding 3 years, by area of residence and relative wealth
43
Table 14 Time required to reach the hospital or inpatient healthcare facility 43
Table 15 Cost of transport to reach the inpatient healthcare facility, by type of healthcare provider
44
Table 16
Total cost to access inpatient healthcare services during the most recent hospital stay, by type of healthcare provider
45

iv
List of figures Figure 1 Overview of identified supply-side and demand-side barriers along
four dimensions of access 6
Figure 2 The structure of the healthcare system in Myanmar 10
Figure 3 Growth rate of total population and elderly population, with proportion of elderly in Myanmar, 1950–2050
12
Figure 4 Population age pyramids, Myanmar, 1950, 2000, and 2050 13
Figure 5 Prevalence of top non-communicable diseases 16
Figure 6 Percentages of those with difficulties in moving around, by age, sex, and area of residence
17
Figure 7 Percentages of those with difficulties due to bodily aches, by age, sex, and area of residence
17
Figure 8 Percentages of those with vision difficulties, by age, sex, and area of residence
18
Figure 9 Percentages of those with hearing difficulties, by age, sex, and area of residence
18
Figure 10 Percentages of those with at least one ADL difficulty, by age, sex, and area of residence
20
Figure 11 Usage of tobacco, betel, and alcohol, by age, sex, and area of residence
21
Figure 12 Utilisation of outpatient healthcare in the preceding 12 months, by age, sex, area of residence, and relative wealth
23
Figure 13 Top ailments for which an outpatient healthcare visit was made in the preceding 12 months
24
Figure 14 Healthcare provider or facility visited to seek outpatient healthcare in the preceding 12 months
24
Figure 15 Healthcare provider or facility visited for outpatient healthcare for a chronic or new condition in the preceding 12 months
26
Figure 16 Perceptions of the care and attention received from the healthcare provider or facility during the most recent outpatient visit
31
Figure 17 Perceptions of the medical treatment received from the healthcare provider or facility during the most recent outpatient visit
31
Figure 18 Perceptions of the availability of medicines at the healthcare provider or facility during the most recent outpatient visit
32
Figure 19 Perceptions of the waiting time for treatment at the healthcare provider or facility during the most recent outpatient visit
33
Figure 20 Perceptions of the cleanliness of the facility during the most recent outpatient visit
33

v
Figure 21 Perceptions of being treated respectfully by the healthcare provider or facility during the most recent outpatient visit
35
Figure 22 Perceptions of how clearly things were explained by the healthcare provider during the most recent outpatient visit
35
Figure 23 Perceptions of being involved in the decision making regarding treatment during the most recent outpatient visit
36
Figure 24 Perceptions of being provided an opportunity to speak privately with the healthcare provider during the most recent outpatient visit
37
Figure 25 Perceptions regarding ease of access to a preferred provider at the facility during the most recent outpatient visit
37
Figure 26 Utilisation of inpatient healthcare in the preceding 3 years, by age, sex, area of residence, and relative wealth
41
Figure 27 Top conditions for which inpatient healthcare was utilised in the preceding 3 years
42
Figure 28 Healthcare facility visited to seek inpatient healthcare in the preceding 3 years
42
Figure 29 Perceptions of the care and attention received from the healthcare provider or facility during the most recent hospitalisation
47
Figure 30 Perceptions of the medical treatment received from the healthcare provider or facility during the most recent hospitalisation
47
Figure 31 Perceptions of the availability of medicines at the healthcare facility during the most recent hospitalisation
48
Figure 32 Perceptions of the waiting time for treatment at the healthcare provider or facility during the most recent hospitalisation
49
Figure 33 Perceptions of the cleanliness of the healthcare facility during the most recent hospitalisation
49
Figure 34 Perceptions of being treated respectfully by the healthcare provider or facility during the most recent hospitalisation
51
Figure 35 Perceptions of how clearly medical issues were explained by the healthcare provider during the most recent hospitalisation
51
Figure 36 Perceptions of being involved in the decision making regarding treatment during the most recent hospitalisation
52
Figure 37 Perceptions of being provided an opportunity to speak privately with the healthcare provider during the most recent hospitalisation
52
Figure 38 Perceptions regarding ease of access to a preferred provider at the facility during the most recent hospitalisation
53

vi
List of boxes Box 1 Rural health centres (RHCs) 38
Box 2 Drug stores 38
Box 3 Private doctors and private clinics 39
Box 4 Traditional healers 40

vii
List of abbreviations BHS Basic health staff
FGD Focus group discussion
GDP Gross domestic product
LHV Lady Health Visitor
LIFT Livelihoods and Food Security Trust Fund
MHC Maternal Health Centre
MMRD Myanmar Marketing Research and Development Ltd.
MOH Ministry of Health
NGO Non-governmental organization
OOP Out-of-pocket
PSU Primary Sampling Unit
RDF Revolving Drug Fund
RHC Rural Health Centre
RSBY Rashtriya Swasthya Bima Yojna
UHC Urban Health Centre
UN United Nations
WHO World Health Organization

1
Executive summary While World Health Organization (WHO) member countries endorsed a resolution to provide universal coverage1 as early as 2005, very few low-income countries have come close to achieving the objective (Jacobs et al. 2012). This has been mainly due to numerous supply-side and demand-side challenges and barriers that hamper access to needed health services. A recent study by WHO to review the health system of Myanmar revealed that over the years, Myanmar’s health system has suffered from gaps in supply-side investments as well as from demand-side challenges and health inequities (WHO 2014). To better understand the healthcare system challenges, and the particular challenges faced by older persons in Myanmar, HelpAge International commissioned this “Study on accessing healthcare by the older population in Myanmar”.2 This study analyses the health seeking behaviour and utilisation of healthcare services among older people. Further, it identifies and examines barriers to healthcare access along several dimensions including: availability, geographic accessibility, affordability and acceptability. These dimensions of accessibility are examined from both the supply side and the demand side.
The report examines the health status of older persons in Myanmar using various health indicators such as self-rated health status, self-reported symptoms, prevalence of non-communicable diseases, disability and functional limitations, and risk behaviours. The study found that poor health condition, morbidity, disability, and functional limitations increase with age, making the aged a significant group of potential healthcare seekers, particularly at older ages. The study also found that consistently more older women than older men in Myanmar reported poor health condition, morbidity, disability and functional limitations. The rural-urban differences were less conclusive for reported poor health condition and morbidity, but more urban residents reported disability and functional limitations compared to their rural counterparts.
The report examines patterns of utilisation of healthcare services to identify the groups that are at risk of poor access to healthcare. Results revealed that persons in the oldest age group (80 years and older) appear to be more vulnerable to poor utilisation of both outpatient and inpatient healthcare services, despite their higher levels of reported morbidity and poor health. Furthermore, a higher proportion of men compared to women utilised inpatient care services, in contrast to the higher utilisation of outpatient care among women. This suggests the possibility of a certain gender bias against women. Outpatient healthcare is a less expensive and often less intensive form of healthcare than inpatient care. It is intriguing that men more commonly access the more expensive kind of care although they report better health across indicators compared to women. In contrast, a higher percentage of urban residents compared to rural, and richer persons compared to poorer ones, utilised outpatient and inpatient care services, suggesting poor access to both outpatient and inpatient healthcare among the rural poor, particularly among the poorest group.
1Universal coverage is defined as access for all to appropriate promotive, preventive, curative and rehabilitative services at an affordable cost. 2The study is part of a wider project implemented by HelpAge International titled “Strengthening the Ministry of Social Welfare to Fulfill Its Role in Expanding Social Protection”, funded by the LIFT donor consortium in Myanmar. The project aims to address gaps in social protection capacity and systems in Myanmar.

2
Older persons from the poorest households consistently reported lower utilisation of outpatient care. The poorest group of older persons utilised healthcare nearly 15 percentage points less than the richest group of older persons in Myanmar. Similarly, the utilisation of inpatient care in Myanmar was lower among the poorest group by about 5 percentage points compared to the other groups, suggesting poor access to hospitalisation among the poorest group. These results raise concerns about equity with respect to access and utilisation of healthcare services.
Analysis of the various sources of outpatient healthcare using information from the sample survey and focus group discussions (FGDs) revealed that, among the rural and poorest older persons, rural health centres (RHCs) and sub-RHCs are the most commonly accessed sources of outpatient care. Township and station hospitals are the most commonly accessed sources of inpatient care for these groups. It seems the rural poor in Myanmar can be widely reached through the township healthcare system, which includes rural and sub-rural health centres and township and station hospitals. Thus, the report findings support the case for more investment in the township healthcare system to support and strengthen the system in order better to reach the poorest rural older persons in Myanmar.
Geographic accessibility of healthcare: With respect to outpatient healthcare, the study suggests that drug stores, RHCs, and sub-RHCs are the most geographically accessible sources of healthcare. The highest geographic accessibility barriers are associated with government hospitals, followed by private facilities. With respect to inpatient healthcare, all the demand-side and supply-side considerations indicate that the geographic barriers to accessibility are highest for district and general hospitals, and for private facilities. Meanwhile, township and station hospitals are the most geographically accessible healthcare facilities. The huge difference in the median cost of transport to reach a district or general hospital as compared to a township or station hospital—with the former costing median 11,500 kyat, more than double the cost to the latter—represents a substantial geographic barrier that could keep rural poor people from accessing the more specialised care available at district and general hospitals.
Affordability of healthcare: Results showed that the most affordable outpatient care providers were drug stores, followed by sub-RHCs and RHCs. Private clinics and hospitals were the least affordable, based on the average total cost of outpatient care. Furthermore, results showed that the cost burden of outpatient care on the household (determined in relation to average monthly expenditure) was nearly double for the poorest households as compared to the richest households in the sample. This raises concern about the burden of outpatient care expenses on the poorer households, particularly since the study results indicate that poorer households are accessing the least expensive sources of outpatient care.
Considering the total cost of hospitalisation at various inpatient facilities, study results revealed that private hospitals were the least affordable, while government township and station hospitals were the most affordable. Hospitalisation costs were at least three times more at private hospitals than at government hospitals. Furthermore, the average cost burden of hospitalisation on households (determined in relation to average monthly expenditure) was nearly double for rural households and for the poorest households as compared to urban households and the wealthiest households, respectively.

3
Availability of healthcare: With respect to the availability of outpatient healthcare, across most measures of availability, private facilities were rated higher than primary healthcare centres (RHCs and sub-RHCs) and government hospitals. Further, across the various measures of availability, drug stores had the highest percentages of older persons reporting indifference or dissatisfaction, except for the measure of waiting time. With respect to inpatient care (hospitalisation), overall, township and station hospitals were rated poorly and private facilities were rated favourably on the various measures of availability.
Acceptability of healthcare: Across the various measures of acceptability, more older persons reported a “very good” experience of outpatient care at a private clinic or hospital, or with a private doctor, followed by at a primary health centre, and finally at a government hospital. However, more older persons at government facilities compared to the private facilities reported their experience of outpatient care at government facilities to be “good”. With respect to inpatient care, analysis of older persons’ perceptions of “acceptability” across various measures and across various types of hospitals revealed that, on average, a higher percentage of older persons reported favorable experiences at private clinics and hospitals, compared to those who reported on government hospitals.
The report concludes that to achieve the goal of health equity, poverty will need to be addressed as a larger developmental goal. In the shorter term, group insurance programmes similar to the Rashtriya Swasthya Bima Yojana (RSBY) scheme in India could be a way forward. Furthermore, it is recommended that the existing healthcare system be strengthened to advance the goal of health equity. The rural healthcare system, which is the backbone of healthcare provision in Myanmar, is currently one of the more accessible and affordable sources of healthcare in rural areas. Therefore, the report calls for the rural healthcare system to be enhanced and strengthened through greater investment to expand the system’s reach to a vast majority of poor, rural, older persons.
The study also found that, in many cases, the midwives and other health staff at the sub-rural health centres were the first and sometimes the only trained healthcare providers that older persons in Myanmar can access. Heavy reliance on midwives is less than ideal, but with the increased scope of functioning of the RHC staff, it is imperative that these health workers are provided with requisite training and skill development. Moreover, the Department of Traditional Medicine (DTM) could play a vital role in facilitating the growth of traditional medicine as a valuable, reliable and affordable alternative source of healthcare for older persons in Myanmar, particularly in the rural and remote areas.
With increased investment in healthcare over the past few years, government healthcare facilities seem to be showing slow yet sure improvement. It is recommended that over the coming years, the government significantly increase public investment in healthcare, especially in the areas of infrastructure, human resources, and improved salaries of health personnel. The report recognises the great challenges facing the government related to optimum allocation of scarce resources among various pressing needs; however, it recommends that due prominence be given to the need for better health and access to healthcare.

4
1. Background While World Health Organization (WHO) member countries endorsed a resolution to provide universal coverage3 as early as in 2005, very few low-income countries have in fact come close to achieving the objective (Jacobs et al. 2012). This has been mainly due to numerous supply-side and demand-side challenges and barriers that hamper access to needed health services. Significantly, the last time the WHO ranked 191 countries across the globe based on overall health system performance, Myanmar ranked at the bottom against its global counterparts (WHO 2000, Tandon et al. 2000). A recent study by WHO to review the health system of Myanmar revealed that over the years, Myanmar’s health system has suffered from gaps in supply-side investments as well as demand-side challenges and health inequities (WHO 2014).
Decades of political unrest, armed conflicts, military rule, isolation and poor economic management have resulted in a weakened economy and poor public expenditure for basic services, including health services. Over the years, the public health system in Myanmar has remained severely under resourced and neglected, with the vast majority of the burden of healthcare expenses being borne by households (ibid.). Myanmar is one of the poorest countries in Asia and has about one fourth of its population living below the poverty line (approximately 1030 kyat per adult per day).4 Thus, one of the major challenges faced by Myanmar is providing healthcare in an equitable way, catering to the poorest of the population without increasing their burden of expenditure (ibid.).
In low-income countries like Myanmar, healthcare and related expenditures have featured prominently as causes of impoverishment (Van Doorslaer et al. 2006). In this context, older persons form a “vulnerable group”5 (Knodel 2014, Teerawichitchainan and Knodel 2015) of healthcare service users, and older women are particularly at risk of poor access to and utilisation of healthcare services (Sreerupa and Rajan 2010). Further confronted with demographic and epidemiological transition, low-income countries such as Myanmar will be facing a massive public health challenge. While high-income countries have had a century to adjust as the proportion of older adults doubled from 7 per cent to 14 per cent, low-income countries like Myanmar will be making this shift in less than one quarter the time (Kinsella and He 2009). Similarly, a transition from communicable to non-communicable diseases will add a double burden of diseases on an already overstretched healthcare system.
3 Universal coverage is defined as access for all to appropriate promotive, preventive, curative, and rehabilitative services at an affordable cost. 4 IHLCA Project Technical Unit (2011). 5 The “Survey of older persons in Myanmar (2012)” found that only about half of older persons were fully literate with women particularly likely to lack literacy. There was a general lack of education and literacy and hence a reduced ability among the older people in Myanmar to access information, including information regarding health. As income from work declines, children are the main source of material support for about 60 per cent of older people. The study also revealed that the older people in Myanmar typically live in low-income households. Almost 10 per cent reported that their household had a monthly income of no more than 25,000 kyat per day. Only a little more than half the older people felt that their income was regularly adequate to meet their daily needs (results summarised from Knodel 2014).

5
In this context, access to healthcare services becomes crucial to addressing the public health challenges posed by a fast-ageing population with a growing burden of diseases. To better understand the healthcare system challenges faced by the older person in Myanmar, HelpAge International commissioned this “Study on accessing healthcare by the older population in Myanmar”.6
2. Nature of the study This study analyses the health seeking behaviour, as well as access to and utilisation of healthcare services among older people. Further, it identifies and examines various dimensions of the barriers to access to healthcare, considered from both the supply side and the demand side.
Although there is no broad consensus on the definition of access to health services7, for the purpose of the study we have defined access to health services as the self-reported utilisation of outpatient and inpatient healthcare. Access to healthcare has four dimensions: availability, geographic accessibility, affordability, and acceptability (Penchansky and Thomas 1981, O’Donnell 2007). These barriers to accessing health services could originate from the demand side and/or the supply side (Ensor and Cooper 2004, O’Donnell 2007). Demand-side determinants are usually the factors that influence the ability of the individual, household or community to use health services, while supply-side determinants are the aspects inherent to the health system that hinder service uptake (Jacobs et al. 2012). In practice, however, supply- and demand-side issues are not so easily separated, and both sides have to be addressed concurrently (O’Donnell 2007). In the following sections, access to outpatient and inpatient care among older persons in Myanmar has been analysed using the comprehensive analytical framework suggested by Jacobs et al. (2012) to identify the different dimensions and aspects of barriers to access to healthcare both from the demand side and the supply side (Figure 1).
6 The study is part of a wider project implemented by HelpAge International titled “Strengthening the Ministry of Social Welfare to fulfill its role in expanding social protection” funded by the LIFT donor consortium in Myanmar. The project aims to address gaps in social protection capacity and systems in Myanmar. 7 In its most narrow sense, “access to health services” refers to geographic accessibility alone. Some researchers offer a more holistic definition wherein access is understood as the opportunity to use healthcare. Others draw no distinction between access and use (O’Donnell 2007, Jacobs et al. 2012), defining access as “the timely use of service according to need” (Peters et al. 2008).

6
Figure 1: Overview of identified supply-side and demand-side barriers along four dimensions of access
Supply-side barriers Demand-side barriers Geographic accessibility
Service location Indirect costs to household for transport
Means of transport available
Availability Unqualified health workers, staff
absenteeism, opening hours Information on healthcare service
providers Waiting time Education Motivation of staff Drugs and other consumables Lack of opportunity (exclusion from
services)
Late or no referral
Affordability Costs and prices of services,
including informal payments Household resources and
willingness to pay Private-public dual practices Opportunity costs
Cash flow within society
Acceptability Complexity of billing system and
inability for patients to know prices beforehand
Household’s expectations Low self-esteem and little
assertiveness Community and cultural
preferences Staff interpersonal skills, including
trust Stigma Lack of health awareness
Source: Jacobs et al. 2012

7
3. Data and methods This study is from the perspective of older persons as recipients or targets of healthcare services and uses a mixed method research design. The methodology includes a quantitative component employing a household survey8 and a qualitative component using post-survey focus group discussions among older persons in target communities. The sample of communities/households has been taken from one township in each of five geographic areas of the country: hilly, delta, dry zone, plain/coastal and metropolitan.
Zone Region/ State Township Hilly Kachin Mogaung Dry Mandalay Mahlaing Coastal/ plain Mon Thaton Delta Ayeyarawady Kyaiklat Metropolitan Yangon East Dagon and Shwe Pyi Thar
(split)
Household survey
Sampling method
The sample was distributed between five townships selected by HelpAge International using the 80:20 rural to urban ratio.9 This method was used to estimate the sample for all regions except Yangon, which is a metropolitan area. In Yangon, the study was conducted in wards instead of villages. The Probability Proportionate to Size (PPS) method was used to determine the number of wards or villages within townships, to ensure that the sampling was systematic and produced estimates with minimum bias. The sample of wards and villages was selected based on the population of older people per township.10 Further, a sample of 1000 elderly (size pre-determined by HelpAge International) was distributed among the selected wards and villages in the five townships.11
8 From January 11 to 26, 2016, Myanmar Marketing Research and Development Ltd. (MMRD) conducted a “Survey on accessing healthcare among older persons in Myanmar” under contract with HelpAge International. The researchers in consultation with MMRD developed the survey modules and sample design. The researchers have expertise in conducting ageing surveys and research in India and South Asia (Kerala Ageing Survey five round from 2004 to 2016) (Sreerupa and Rajan 2010, Rajan and Syamala 2016). 9As per Myanmar’s 2014 population and housing census report. 10The sample selection criteria used to select villages favoured officially listed villages, then those villages with a village administration office and finally those villages with the most number of houses. These selection criteria would have resulted in a sampling bias towards larger villages at the expense of smaller and possibly more remote villages. Further from the list of selected wards and villages, project villages were removed, leaving only non-project wards and village tracts on the list. The only exception to this method was Mogaung township, where HelpAge International supports cash transfer projects in all wards and village tracts. 11Elderly person and not household is the unit of analysis throughout the study.

8
Table 1: Sample selected for the study in five Myanmar townships12
Selected township
Estimated township population of older people (60 years and above)
No. of wards
No. of villages
No. of sample elderly per ward
No. of sample elderly per village
Total no. of sample elderly per township
Mogaung 7,103 2 8 40 160 200
Mahlaing 15,654 2 8 40 160 200 Thaton 21,436 2 8 40 160 200
East Dagon 25,409 4 200
0 200 Shwe Pyi
Thar 16,108 6 0
Kyaiklat 14,567 2 8 40 160 200
Total 100,277 18 32 360 640 1000
Household selection
Households were selected by conducting a random walk in the Primary Sampling Unit (PSU), following the Right Hand Rule. After every interview attempt, whether successful or not, the enumerator skipped to another household within a specified interval. Eligible respondents, that is, those aged 60 years and above, were interviewed from sampled households. As recommended by the researcher, in case of more than one eligible respondent in the sampled household, the data collection agency interviewed all of them until the target sample of 20 older persons was reached per PSU.
Focus group discussions
Semi-structured focus group discussions (FGDs) were conducted among participants 60 years and older, with a sufficient number of persons from various older age cohorts being represented. These FGDs tried to capture older persons’ experiences and perceptions regarding seeking healthcare while allowing them to raise the issues and concerns that are most important to them. For each of the five geographical regions, two to four FGDs were conducted. Each FGD consisted of 10 to 15 participants brought together to engage in a dynamic discussion. Each FGD lasted for no more than two hours. Oral consent was obtained from the participants before the beginning of each FGD. FGDs were conducted by the researchers with the help of the HelpAge International team in Myanmar. FGDs were translated into English and the transcripts were thematically analysed.
12 Unless otherwise noted, the source for table and figure data throughout this report is the household survey that was conducted for this study.

9
4. Myanmar health system Among the countries of the Southeast Asia and Western Pacific regions, the total expenditure on health in Myanmar is the lowest (WHO 2014). It averaged about 2 per cent of GDP between 2000–11. In 2011, the government’s share in this constituted just 13 per cent, hence the bulk of the expenditure burden at that time was met through out-of-pocket (OOP) expenditure of households, that is, 79 per cent of total expenditure (ibid.).13 Donors contributed the remaining 7 per cent. However, the previous government, which came to power in 2011, showed commitment to the task and health spending by the government quadrupled in 2012-13 (ibid.).
Until 1993, the government was the main source of financing and provided healthcare services free. With reforms in the 1990s, user-charges were introduced in the form of Community Cost Sharing (CCS) and a Revolving Drug Fund (RDF), which led to a stark increase in OOP financing of healthcare. More alarming is the fact that there is still no comprehensive health insurance system in Myanmar. The statutory Social Security system through the recent Social Security law (2012) covers less than 1 per cent of the population engaged in the formal sector (ibid.). Hence, there is an urgent need to provide financial risk protection to the poor and workers in the informal sector. Those who cannot afford healthcare often end up either in catastrophic debt or in health impoverishment by not opting for healthcare.
The Ministry of Health is the main player in the health arena, adopting the dual roles of a governing agency as well as a provider of healthcare. Both public and private health systems exist in Myanmar. As the vast majority of the country’s population resides in rural areas, the basic structure of the national health system lies at the township level. The township health system serves as the backbone of healthcare provision in Myanmar. Under the township health system, public health services are delivered to communities through sub-Rural Health Centres14, Rural Health Centres (RHCs), station hospitals, Urban Health Centres (UHCs), Maternal Health Centres (MHCs)15 and township hospitals. In a typical township health system, there should be a 25-bed township hospital with 2 to 4 doctors, one urban health unit/maternal health centre, one or two 16-bed station hospitals, 4 to 5 RHCs staffed by health assistants and lady health visitors (LHVs), 20 to 25 sub-RHCs staffed with midwives, and about 600 volunteer health workers (WHO 2014). At the district level, there are district hospitals (with 100 to 200 beds); at the region/state level, there are general hospitals (with 200 to 300 beds); and there are a few tertiary and specialty hospitals situated in Yangon, Mandalay and Naypyidaw. However, a major portion of the public health service component is delivered through a primary healthcare approach.
13 Out-of-pocket expenditure includes spending on private clinics, doctors, non-qualified health workers, drug stores as well as fees charged for food and drug costs incurred at state-run public health facilities. 14 Primary care infrastructure starts from the sub-rural health centre at the grassroots level, to rural health centre (RHC) where ambulatory services including delivery care are provided by the basic health staff (BHS) (WHO 2014). 15 In urban areas in some townships, there is an urban health centre that provides ambulatory care and dental care for general patients, and also a maternal and child health (MCH) centre that takes care of pregnant mothers and children under five years old (ibid.).

Figure
Source:
Over thpublic f(WHO 2those tmateriawhich con fore
Most ofin big conly cainsufficmost rucollaboremotecapacit2014, T
Health infrastr1000 pThailantotal heduring
16 A new the socia
2: The str
Health in My
he years, thfunds, but t2014). RHChat did notal capabiliticame to powign aid, esp
f the speciacities. Seveter to thoseient supplyural areas. ration with and bordey to pay foThailand Bu
service proructure devopulation ind, which ha
ealth workfthis period
government tl sectors.
ructure of
yanmar 2014,
here has bethis has comCs were hent receive does. Investmwer in 201pecially for
alised servicral private e who can
y. TraditionaIn conflict NGOs, UN
er areas is gr medical c
urma Borde
ovision in Mvelopment. n Myanmarave more tforce increa, doctors, n
took over in A
f the healt
, MOH, Myan
een a push me at the ence very deonor supporment in RHC1.16 Nevertvaccinatio
ces like ampharmaciesafford themal medicineareas, medagencies e
grossly insucare and traer Consortiu
Myanmar suFor instanc
r in 2010, whan 2 hosp
ased 20 pernurses, and
April 2016 and
10
thcare sys
mar
for expansexpense of ependent ort suffered Cs increasetheless, thens and mu
mbulatory as and drug
m. Public pres and healdical serviceetc. Howeveufficient anansport ratum 2004).
uffers from ce, on averwhich is verpital beds pr cent betwd midwives
d is still definin
tem in My
sion of hospexpandingn external from low te
ed under the governmelti-drug tre
nd emergestores hav
rovision of th practicees are deliver, health cd utilisationher than ne
severe gaprage there wry low com
per 1000 poween 2006–
increased
ng its prioritie
yanmar
pital infrastrural healtdonors for echnical, fin
he previous ent remainsatments (ib
ncy medicave been setmedicines s also play vered by MOcoverage inn of serviceeed (WHO
ps in humanwere 0.6 hopared to Ne
opulation (W07 and 201only from 1
es but has pro
ructure usithcare facilfunding, annancial and
s governmes highly depbid.).
al care exist up thoughis still plag a crucial rOH in
n conflict-rides depends 2014, Low
n resource ospital bedepal, VietnWHO 2014)10–11. How1.27 to 1.4
omised to emp
ng ities nd d nt pendent
t only h they ued by ole in
dden on et al.
and s per am and ). The wever, 49 per
phasise

11
1000 population, which is still well below the global standard of 2.28 health workers for 1000 population (ibid.).
Summing up, the major challenges facing the healthcare system are lack of social health protection for the poor, low investment in rural health services, low level of government investment, transfer of financial burden to households, and incessant dependence on fluctuating foreign aid.
5. Population ageing In a country with around 50 million people, slightly less than 5 million people are aged 60 years or above. Just about every tenth person in Myanmar is an older person, with the proportion of elderly population being around 9 per cent, according to the 2014 Myanmar census (see Table 2). It has been noted that in Myanmar, like most other countries in Southeast Asia, not only are the numbers of persons in older ages increasing but also their share of the total population (Knodel 2014). Within Myanmar, the proportion of elderly in the population is highest in Magway (10.8 per cent) and lowest in Kayah (6.0 per cent). Except Kachin and Kayah, all other states and regions fall into the United Nations defined “ageing” category, meaning people 60 years old and above account for 7 per cent or more of the total population. As in other countries, females are a higher proportion of the elderly than males. (Females also have a higher life expectancy.) The life expectancy at birth over the years has shown remarkable improvement (see Table 3). During 1950–1955, it was just 36.8 years. It increased to 56.2 years during 2000–2005 and is expected to increase by another 15.8 years by 2050. The size of the male-female gap in life expectancy is also increasing over the years.
Table 2: Proportion and distribution of elderly population by age and area of residence, 2014
Proportion of elderly in total population, by age group
Distribution of age groups among elderly population
60+ 70+ 80+ 60–69 70–79 80+ Total
Total 8.9 3.7 1.1 59.0 28.3 12.7 Male 7.9 3.1 0.9 61.3 27.6 11.1 Female 9.8 4.2 1.4 57.3 28.8 13.9
Urban
Total 9.2 3.7 1.2 59.4 27.7 12.8 Male 7.9 3.0 0.9 61.6 27.3 11.0 Female 10.4 4.4 1.5 57.9 28.0 14.1
Rural
Total 8.8 3.6 1.1 58.9 28.6 12.6 Male 7.9 3.1 0.9 61.2 27.7 11.1 Female 9.6 4.1 1.3 57.0 29.2 13.7
Source: 2014 Myanmar Population and Housing Census

12
Table 3: Expectation of life, at birth, at age 60, and by sex, 1950–2050
Expectation of Life at Birth at 60
Total Male Female Total Male Female 1950–1955 36.8 35.6 38.2 - - - 1975–1980 50.6 48.6 52.8 - - - 2000–2005 56.2 53.8 58.8 16.6 15.9 17.3 2025–2030 68.3 65.6 71.1 19.6 18.4 20.7 2045–2050 72.0 69.2 75.0 21.1 19.7 22.4
Source: UN Population Division, Department of Economic and Social Affairs, World population Prospects (Rev. 2015)
Figure 3 shows the change in age structure in Myanmar from 1950 to (projected) 2050. Over the period of these 100 years, the growth rate of the elderly population in Myanmar has nearly always been higher than the total population growth rate, with the difference in growth rate widening from 2010 onwards. The proportion of elderly to the total population has increased over the years from 5.6 per cent in 1950 to 7.1 per cent in 2000. By 2050 the proportion of elderly is expected to more than double and reach 18.8 per cent of the total population.
Figure 3: Growth rate of total population and elderly (60+) population, with proportion of elderly in Myanmar, 1950–2050
Source: UN Population Division, Department of Economic and Social Affairs, World Population Prospects (Rev. 2015)
Figure 4 shows the age structural transition in Myanmar through the age pyramids in three different years, 1950, 2000 and 2050. The population pyramid of 1950 had a broad base with a higher number in younger age groups than older age groups; however, by year 2000, this base started to shrink with the effect of fertility transition. The emerging proportion of youth bulges in the 2000 pyramid. By 2050, nevertheless the pyramid is projected to have broadened its shape at the top with larger cohorts of
0
2
4
6
8
10
12
14
16
18
20
1950 1960 1970 1980 1990 2000 2010 2015 2020 2030 2040 2050
60+ Total Population Proportion of 60+

13
middle and older age groups. The above findings suggest a rapid age structural transition in Myanmar, wherein the number of older persons as well as their share in the total population is rising quickly.
Figure 4: Population age pyramids, Myanmar, 1950, 2000 and 2050
Source: UN Population Division, Department of Economic and Social Affairs, World Population Prospects (Rev. 2015)
15 10 5 0 5 10 15 20
0‐4
10‐14
20‐24
30‐34
40‐44
50‐54
60‐64
70‐74
80+
FemaleMale
1950
15 10 5 0 5 10 15
0‐4
10‐14
20‐24
30‐34
40‐44
50‐54
60‐64
70‐74
80+
FemaleMale
2000
10 5 0 5 10
0‐4
10‐14
20‐24
30‐34
40‐44
50‐54
60‐64
70‐74
80+
FemaleMale
2050

14
6. Health status of older persons Before examining the healthcare seeking behaviour and access to healthcare among older persons, it is imperative to assess the health status of this population in Myanmar. This section maps out the health status of older persons in Myanmar using various health indicators such as self-rated health status, self-reported symptoms, prevalence of non-communicable diseases, disability and functional limitations, and risk behaviours. These health indicators have been analysed by age, sex and area of residence to assess older people’s need for healthcare.
Self-rated health status
Self-assessed current health status is a subjective measure closely associated with the feeling of wellbeing and with quality of life. Studies have found self- perceived health to be a reliable predictor of future functional status and even mortality (Idler and Benyamini 1997, Idler and Kasl 1995), thereby providing empirical support for the use of the same as a measure of overall health. Table 4 presents the results of self-rated health by the respondents. In our study, on average, every third older person reported either poor or very poor health while slightly more reported their health to be excellent or good. Across age groups, negative self-assessment of health increases at higher age groups and positive self-assessment decreases. More than 40 per cent of the oldest persons—those 80 years and older—reported poor to very poor health, compared to only about 30 per cent among the “younger elderly”—those 60 to 70 years old. These relations are inverted for reports of excellent to good health. Comparing men and women, around 5 per cent more women than men reported to be in poor/very poor health, whereas nearly 10 per cent more men than women reported to be in excellent/good health. Overall men reported better health outcomes than women. There was not much difference in perceptions of health when comparing urban and rural residents.
Table 4: Self-reported health status by age, sex, and area of residence (% distribution)
Self-reported health
Total
Age Sex Area of
residence 60–69 70–79 80+ Male Female Urban Rural
Excellent/Good 37.9 40.1 38.2 28.5 43.0 34.0 38.3 37.7 Fair 29.0 30.1 27.1 27.8 27.3 30.3 27.7 29.7 Poor/Very poor 33.1 29.8 34.7 43.7 29.8 35.6 34.0 32.6
Self-reported symptoms
Self-reporting of specific symptoms related to illness would be a useful indicator of poor health and undiagnosed illnesses, in a population with low levels of awareness and recognition of diseases and illnesses. Respondents to our 2016 “Survey of access to healthcare among older persons in Myanmar” were asked if they had experienced any of 18 possible symptoms during the past month. Results are presented in Table 5.

15
The single most common symptom that respondents reported was joint pain: 60 per cent of the older persons reported the symptom. The other two most common symptoms were weakness and dizziness, reported by 42 and 39 per cent of the older persons, respectively. Across the various symptoms, the “older elderly” (80 years and older) and women were more likely to report symptoms compared to the “younger elderly” (60 to 70 years old) and men, respectively. There was no clear pattern of rural–urban difference in the reporting of symptoms. The results from our 2016 survey are along the lines of the previous “Survey of older persons in Myanmar (2012)” (Knodel 2014), with a slightly higher reporting of symptoms overall.
Table 5: Self-reported symptoms experienced during preceding month, by age, sex, and area of residence (% distribution)
Self-reported symptoms Total
Age Sex Area of
residence 60–69 70–79 80+ Male Female Urban Rural
Pain in your joints
60.1 60.0 57.8 64.2 54.3 64.6 58.2 61.2
Feeling weak 42.5 38.1 44.2 57.0 36.5 47.1 41.6 43.0 Dizziness 39.3 37.3 39.4 47.0 30.9 45.7 38.3 39.9 Back or hip pain
33.9 34.9 32.3 32.5 28.2 38.3 36.4 32.4
Coughing 33.8 33.1 30.7 41.7 33.9 33.7 33.4 34.0 Headache 29.5 31.6 25.1 28.5 22.6 34.7 29.9 29.3 Shoulder pain 19.5 22.1 14.3 17.9 20.3 18.9 20.9 18.7 Fever 17.2 16.9 14.7 22.5 14.1 19.6 19.3 16.0 Constipation 16.6 16.6 14.7 19.9 14.5 18.2 17.4 16.1 Chest pain 13.3 15.1 9.2 13.2 11.5 14.6 13.9 13.0 Problems breathing 12.7 12.9 10.4 15.9 7.9 16.4 13.3 12.3 Trembling hands 11.5 8.5 11.6 23.2 11.8 11.3 14.1 10.0 Loss of bladder control 11.2 6.9 14.3 23.2 8.1 13.6 12.8 10.3 Skin problems 11.1 9.9 13.5 11.9 13.9 9.0 8.4 12.7 Stomach ache 9.5 10.9 6.0 9.9 9.0 9.9 12.8 7.6 Vomiting 4.9 5.4 3.2 6.0 3.0 6.3 4.9 4.9 Loss of bowel control 4.9 2.8 4.0 14.6 3.7 5.8 4.9 4.9 Diarrhea 3.9 2.8 4.4 7.3 2.5 4.9 4.3 3.6
Non-communicable diseases
Non-communicable diseases (NCDs), once called “diseases of affluence”, are no longer a problem only in wealthy countries (WHO 2011a). In fact, the years of life lost to NCDs among people age 60 and older in low- and middle-income countries is much greater

16
than for people in high-income countries (Scommegna 2012). According to WHO, NCDs contribute to approximately 40 per cent of all deaths in Myanmar (WHO 2011b).17
One of the most common NCDs and risk factors for other NCDs is hypertension or high blood pressure, and more than one third of the older population in Myanmar has been diagnosed with this condition (see Figure 5). The other common NCDs are cardiovascular diseases, cataract, stroke and arthritis. A high prevalence of NCDs increases the need for healthcare among older persons. However, a fragile health system that has focused more on treating infectious diseases would be challenged by the prolonged nature of NCDs, which may lead to increasing healthcare costs.
Figure 5: Prevalence of top non-communicable diseases (% distribution)18
Disability and functional limitation
Physical impairments in old age which reduce mobility and the capacity to perform personal self-care are the source of much ill health in later life (Arber and Ginn 1991). Disability leading to immobility is a cause for concern among the elderly as it increases their dependence on others, adversely affecting their quality of life.
17 It must be noted, however, that due to poor access to healthcare in Myanmar, the diagnosis of NCDs among the older persons would be poor as well. 18 The percentages in Figure 5 include older persons who reported that they had been diagnosed with an NCD by health personnel or otherwise informed that they had an NCD.
38
13
98 8 8
5
0
5
10
15
20
25
30
35
40
High bloodPressure
Cardiovasculardiseases
Cataract Stroke Arthritis Respiratorydisease
Diabetes

17
Figure 6: Percentages of those with difficulties in moving around, by age, sex, and area of residence
Mobility limitations are often an early sign of impending functional decline in old people. Survey respondents were asked whether or not they had difficulty moving around (see Figure 6). Roughly 4 per cent of the respondents expressed that they could not move at all. Differences according to age, sex and area of residence were evident from responses. There is not much variation between males and females in the category of people who cannot move at all, but more older women than men reported that they had some or a lot of difficulty with moving around. Findings show that the inability to move around increases with age: more than 10 per cent in the oldest category expressed that they were unable to move around. With respect to the area of residence, survey results indicate that urban residents suffer more than rural ones.
Arthritis and other musculoskeletal conditions frequently go undiagnosed and may be reported simply as symptoms such as bodily aches and pains (Edwards et al. 2006). The severity of the pain can influence the functional capacity of the older person (de Lucena et al. 2016). Figure 7 presents participants’ responses regarding whether or not they have experienced bodily aches. More than 2 per cent voiced that they could do nothing at all due to bodily aches. The condition of females is found to be poorer than that of males. With respect to age, the oldest group experiences more difficulty due to bodily aches than the other groups. There are urban–rural differences: the proportion of respondents who experience severe difficulty is larger in urban areas than in rural areas.
Figure 7: Percentages of those with difficulties due to bodily aches, by age, sex, and area of residence
010203040506070
Total 60‐69 70‐79 80+ Male Female Urban Rural
Age group Sex Area of Residence
Yes, with some difficulty
Yes, with a lot of difficulty
Cannot do at all
0
10
20
30
40
50
60
70
80
Total 60‐69 70‐79 80+ Male Female Urban Rural
Age group Sex Area of Residence
Yes, with some difficulty
Yes, with a lot of difficulty
Cannot do at all

18
Figure 8: Percentages of those with vision difficulties, by age, sex, and area of residence
Ageing can affect all of the senses, particularly hearing and vision (Fozard and Gordon-Salant 2001). Such devices as glasses and hearing aids, as well as lifestyle changes, can improve the ability to see and hear. Our field visits revealed poor utilisation of devices, particularly hearing aids, among older persons.
Figure 8 presents information about difficulties with sight among respondents. Nearly 2 per cent of survey respondents could not see at all, even in good lighting, and almost 12 per cent could see only with much difficulty. There is a wide variation between men and women, with females more likely than males to be in the category of those who can see but with a lot of difficulty. The oldest category (80 years and older) are the main sufferers. More urban residents reported difficulties with their vision than did rural residents.
Figure 9: Percentages of those with hearing difficulties, by age, sex, and area of residence
0
10
20
30
40
50
60
70
80
Total 60‐69 70‐79 80+ Male Female Urban Rural
Age group Sex Area of Residence
Yes, with some difficulty
Yes, with a lot of difficulty
Cannot do at all
0
10
20
30
40
50
60
Total 60‐69 70‐79 80+ Male Female Urban Rural
Age group Sex Area of Residence
Yes, with some difficulty
Yes, with a lot of difficulty
Cannot do at all
19
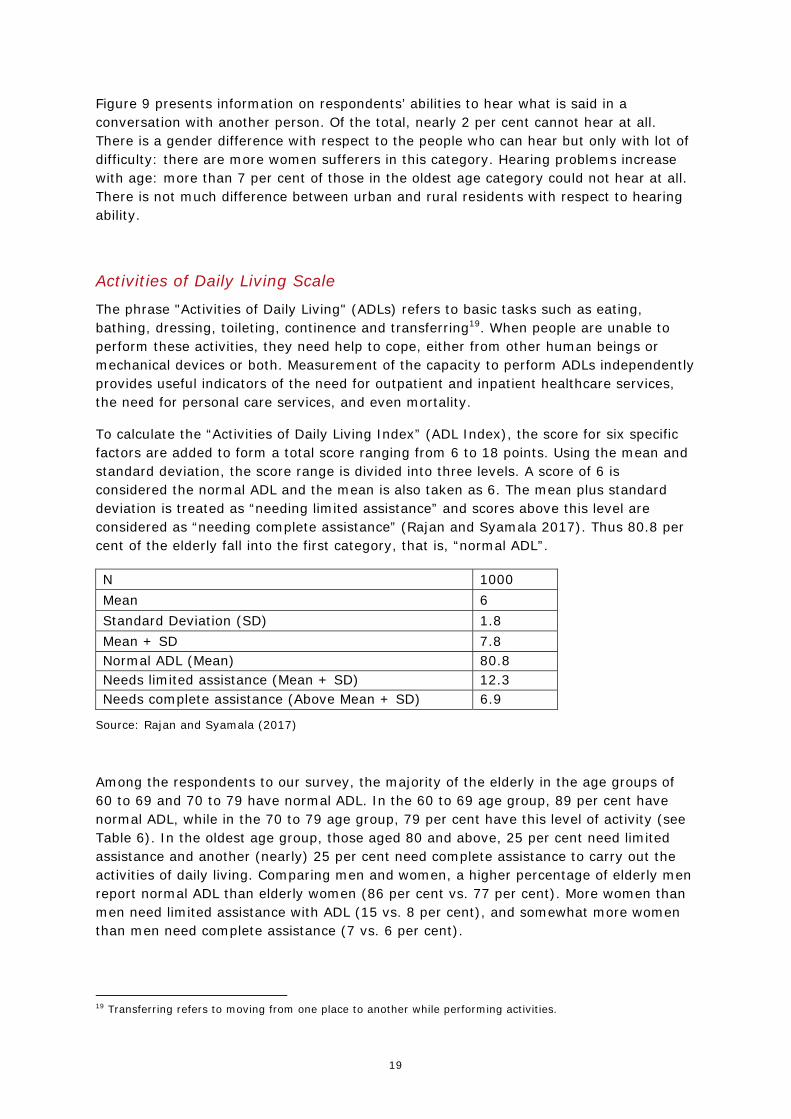
Figure 9 presents information on respondents’ abilities to hear what is said in a conversation with another person. Of the total, nearly 2 per cent cannot hear at all. There is a gender difference with respect to the people who can hear but only with lot of difficulty: there are more women sufferers in this category. Hearing problems increase with age: more than 7 per cent of those in the oldest age category could not hear at all. There is not much difference between urban and rural residents with respect to hearing ability.
Activities of Daily Living Scale
The phrase "Activities of Daily Living" (ADLs) refers to basic tasks such as eating, bathing, dressing, toileting, continence and transferring19. When people are unable to perform these activities, they need help to cope, either from other human beings or mechanical devices or both. Measurement of the capacity to perform ADLs independently provides useful indicators of the need for outpatient and inpatient healthcare services, the need for personal care services, and even mortality.
To calculate the “Activities of Daily Living Index” (ADL Index), the score for six specific factors are added to form a total score ranging from 6 to 18 points. Using the mean and standard deviation, the score range is divided into three levels. A score of 6 is considered the normal ADL and the mean is also taken as 6. The mean plus standard deviation is treated as “needing limited assistance” and scores above this level are considered as “needing complete assistance” (Rajan and Syamala 2017). Thus 80.8 per cent of the elderly fall into the first category, that is, “normal ADL”.
N 1000 Mean 6 Standard Deviation (SD) 1.8 Mean + SD 7.8 Normal ADL (Mean) 80.8 Needs limited assistance (Mean + SD) 12.3 Needs complete assistance (Above Mean + SD) 6.9
Source: Rajan and Syamala (2017)
Among the respondents to our survey, the majority of the elderly in the age groups of 60 to 69 and 70 to 79 have normal ADL. In the 60 to 69 age group, 89 per cent have normal ADL, while in the 70 to 79 age group, 79 per cent have this level of activity (see Table 6). In the oldest age group, those aged 80 and above, 25 per cent need limited assistance and another (nearly) 25 per cent need complete assistance to carry out the activities of daily living. Comparing men and women, a higher percentage of elderly men report normal ADL than elderly women (86 per cent vs. 77 per cent). More women than men need limited assistance with ADL (15 vs. 8 per cent), and somewhat more women than men need complete assistance (7 vs. 6 per cent).
19 Transferring refers to moving from one place to another while performing activities.

20
Table 6: Activities of Daily Living (ADLs) among elderly, by age, sex, and area of residence
60–69 70–79 80+ Male Female Urban Rural Normal ADL 89.0 78.5 52.3 85.7 77.1 78.3 82.3 Needing Limited Assistance
7.9 15.5 24.5 8.3 15.3 14.9 10.8
Needing Complete Assistance
3.2 6.0 23.2 6.0 7.6 6.8 7.0
Considering the area of residence, more elderly in rural areas report no difficulties with ADL than do those living in urban areas. Among the elderly in rural areas, 82.3 per cent have normal ADL. The percentage of elderly who need limited assistance is higher in urban areas (14.9 per cent) than in rural areas (10.8 per cent). The percentage of elderly requiring complete assistance is the same for both rural and urban areas: 7 per cent.
Figure 10: Percentages of those with at least one ADL difficulty, by age, sex, and area of residence20
When we analyse reporting of at least one ADL difficulty (Figure 10), one fifth of the elderly had at least one area of difficulty, while nearly half of the elderly aged 80 and above required some or full assistance in performing daily living activities. Women needed more assistance than men in performing daily activities. Urban elderly were more likely than their rural counterparts to require some or full assistance in performing at least one daily activity.
Risk Behaviors
The short- and long-term effects of alcohol and tobacco products on the human body, lifestyle and mental health are well established. Questions related to the use of tobacco, alcohol and betel were asked in the survey. Around one third of the respondents were found to be using betel and tobacco products. In general, alcohol consumption among the older persons was considerably less than tobacco and betel consumption. Use of all 20 In Figure 10, “at least one ADL difficulty” means the respondent reported that, with at least one of the six activities, they either could perform it only with assistance or could not perform it at all.
19
11
21
47
14
22 2117
0
10
20
30
40
50
Total 60‐69 70‐79 80+ Male Female Urban Rural

21
the three substances was higher among males than among females. Consumption of both alcohol and betel was found to be lower at higher age groups, whereas consumption of tobacco products remained high even among the oldest age group. Although the use of tobacco products and alcohol was higher among rural residents, the intake of betel was higher among urban residents.
The adverse effects of regular consumption of tobacco and betel were clearly reflected in the poor dental health of a large number of the older persons who participated in our focus group discussions, particularly in the rural areas.
Figure 11: Usage of tobacco, betel, and alcohol, by age, sex, and area of residence (% distribution)
7. Health care utilisation In the above sections we analysed the health status of the aged in Myanmar using selected health indicators. We found that morbidity, disability and functional limitations increase with age. Overall, in the older age groups, more women and urban residents reported morbidity, disability and functional limitations in comparison to men and rural residents, respectively. The higher reporting among urban residents could be due to higher education levels, better health awareness, and better access to healthcare facilities in urban areas.
Regarding the utilisation of healthcare among the older persons in Myanmar, survey respondents were asked if they had been sick or injured and needed healthcare during the preceding 12 months. Slightly over 60 per cent of the older persons reported that they had been sick or injured and had needed healthcare. This figure is considerably higher than the proportion of older persons with sickness and injury reported in the 2012 ageing survey (Knodel 2014). Presumably, the marked difference is due to the higher representation of the older two age groups (70 to 79 years, and 80 years or older) in our 2016 survey sample as compared to the 2012 study. A disaggregated analysis reveals that a higher proportion of women, older age groups, urban residents and wealthier
0
5
10
15
20
25
30
35
40
45
50
Total 60‐69 70‐79 80+ Male Female Urban Rural
Age group Sex Area of Residence
Alcohol Betel Chewing Tobacco products

22
persons reported being sick and injured, as compared to men, less-elderly age groups, rural residents and less wealthy persons, respectively (see Table 7). Those who reported that they had needed healthcare were probed further to find out whether they had, in fact, received some treatment; remarkably, nearly all reported that they had. This high reporting of utilisation of healthcare among older persons with sickness and injury is consistent with the results of the 2012 ageing survey (Knodel 2014)21.
Table 7: Percentages of those who reported being sick or injured and requiring healthcare in the preceding 12 months, by age, sex, area of residence, and relative wealth
Total
Age Sex Area of residence
Wealth Index22
60-69
70–79 80+ Male Female Urban Rural Lower
Lower middle Middle Upper
Yes 62.0 60.2 64.5 64.9 59.1 64.2 69.8 57.4 56.1 60.3 61.0 72.5
No 38.0 39.8 35.5 35.1 40.9 35.8 30.2 42.6 43.9 39.7 39.0 27.5
8. Health seeking behaviour: outpatient healthcare “Outpatient” healthcare refers to medical care or treatment that does not require an overnight stay in a hospital or medical facility (including traditional medicine). Outpatient care is the predominant kind of healthcare in Myanmar. To assess the utilisation of outpatient care among older persons in Myanmar, survey respondents were asked whether or not they had received any healthcare for an illness or injury, other than an overnight stay in a hospital over the preceding 12-month period. Fully 57 per cent reported that they had.
21 However, the high reporting of utilisation of healthcare among older persons with sickness and injury is quite counterintuitive given the weak healthcare system of Myanmar. 22 This “Wealth Index” has been calculated using the “Standard of Living Index” created by the National Family Health Survey (NFHS) as a summary household measure (International Institute of Population Sciences (IIPS) and Macro International 2000). The index is calculated by summing the weights that were developed by the IIPS/NFHS research team in India. The variables taken for the index are: house ownership, type of house, material of walls, material of roof, ownership of land in cents, source of light, cooking fuel, type of toilet, source of drinking water, income expenditure, and the presence of such household amenities as bicycle, radio, store-bought furniture, electric fan, two wheelers, four wheelers, black-and-white television, colour television, video/DVD player, telephone (land phone), mobile phone, refrigerator, rice cooker, motorised pump, washing machine, and computer or laptop. Based on the mean and standard deviation, the sample is distributed with the following categories: Lower (below (Mean – SD)), Lower Middle (between (Mean-SD) and Mean), Middle (between (Mean + SD) and Mean) and Upper (Above Mean + SD). The sample distribution across the various categories in the wealth index is: Lower: 157 households; Lower Middle: 257 households; Middle: 240 households, and Upper: 143 households.

23
Figure 12: Utilisation of outpatient healthcare23 in the preceding 12 months, by age, sex, area of residence, and relative wealth (% distribution)
Figure 12 shows the utilisation of outpatient care disaggregated by age, sex, and area of residence. Surprisingly, there was no increase in the utilisation of outpatient healthcare with the older age groups, as would be expected given the higher level of morbidity and poorer health reported in these groups. There was only a slightly higher usage of outpatient care among those aged 70 to 79. However, there were marked differences with respect to gender and area of residence. More women than men, and more urban residents than rural residents, utilised outpatient care services. Older persons in the urban areas used outpatient healthcare services 11 percentage points more than their counterparts in the rural areas. The utilisation of outpatient care is also closely associated with the relative wealth of the elderly person’s household. Survey respondents from the wealthier households consistently reported higher utilisation of outpatient care, and the most wealthy group used healthcare nearly 15 percentage points more than the poorest group in our survey sample.
23 This measure does not take into consideration whether or not multiple visits were made to outpatient healthcare facilities or providers during the period.
57 5659
5653
6064
53 5155 57
66
0
10
20
30
40
50
60
70
Total 60‐69 70‐79 80+ Male Female Urban Rural Lower Lowermiddle
Middle Upper
Total Age group Sex Area ofResidence
WealthIndex

24
Figure 13: Top ailments for which an outpatient healthcare visit was made in the preceding 12 months (% distribution)
Survey respondents who reported seeking outpatient care in the preceding 12 months were asked about the most recent ailment for which they had sought treatment. Figure 13 shows the top four ailments for which outpatient healthcare was sought and received.24 The highest percentage of respondents reported seeking outpatient healthcare for hypertension. Acute health conditions, like diarrhea, fever, flu and so on; chronic pain in the joints or arthritis; and problems with the heart or chest pain were the other most common ailments for which respondents had sought treatment. Chronic conditions dominate the top ailments for which older persons reported seeking outpatient care.
Figure 14: Healthcare provider or facility visited for outpatient healthcare in the preceding12 months (% distribution)25
24 Unless otherwise specified, the data presented in Figures 13 to 25 and Tables 8 to 12 refer to the most recent time that treatment was received for an illness or injury in the preceding 12 month period. 25 Private clinic refers to a privately funded and operated organised healthcare facility with one or more doctors. A private doctor refers to a private doctor’s office, usually a smaller medical facility (at times attached to a doctor’s home) in which a general practitioner provides outpatient care to patients.
26 25
8 7
0
5
10
15
20
25
30High blood pressure
& hypertension
Acute conditions
(diarrhea, fever, flu,
headaches, cough,
etc.)
Chronic pain in joints
& arthritis (in joints,
back, neck)
Problems with heart
incl. chest pains
26
21
17
13
74 3
0
5
10
15
20
25
30
Privateclinics &hospitals
Privatedoctors
Sub‐RHCs &RHCs
Governmenthospitals
Drug stores Midwives Visitingvillagenurses

25
Examining the percentages of older persons seeking outpatient healthcare across various types of care providers, one observes that the most commonly accessed sources of outpatient healthcare were private clinics or hospitals and then private doctor’s offices. These are followed by sub-RHC and RHCs and then government hospitals (see Figure 14). As per the survey results, other less utilised providers of outpatient healthcare not shown in Figure 14 include health assistants, charity clinics, health volunteers from NGOs),traditional healers and unlicensed healthcare providers.
Table 8: Healthcare provider or facility visited for outpatient healthcare in the preceding 12 months, by area of residence and relative wealth (% distribution)
Total
Area of residence Wealth Index
Urban Rural Lower Lower middle Middle Upper
Drug stores 6.6 5.9 7.1 3.0 4.7 9.1 8.8 Sub-RHC & RHCs 17.3 2.5 27.7 40.6 16.3 13.7 4.8 Private doctors 21.5 25.3 18.8 12.9 19.2 25.1 26.4 Private clinic & hospitals 26.2 45.6 12.5 18.8 25.0 26.3 33.6 Government hospitals26 13.1 11.4 14.3 8.9 15.7 14.3 11.2
To get a clearer picture of patterns of outpatient healthcare utilisation, the findings related to the top five care providers were disaggregated by area of residence (see Table 8).27 Interestingly, there was a stark difference in the pattern of utilisation of healthcare providers by the area of residence. In rural areas, outpatient healthcare is provided mainly through the sub-rural and rural health centres, followed by private doctors and private clinics or hospitals, while in urban areas, outpatient care is mostly provided by the private sector, led by private clinics and hospitals and followed by private doctors.
Focus group discussions among the older persons in rural areas revealed that the sub-rural health centres are mostly located in the main village of a village tract. In these village tracts, sub-RHCs and their staff were the most commonly accessed sources of healthcare followed by private clinics of general practitioners and others. However, in the case of villages that are located farther away from the sub-RHCs, traditional medicine providers and unlicensed providers were relied on to a far greater extent compared to the main village of a village tract.
Analysing the data on outpatient healthcare utilisation across various wealth groups, the utilisation of RHCs and sub-RHCs is highest in the lowest wealth group, at about 40 per cent. The usage of RHCs and sub-RHCs falls sharply with higher wealth. The usage of private clinics or hospitals and private doctors is highest with the highest income group and decreases at lower wealth levels. Utilisation of government hospitals was the highest among the middle income groups and lower for the lowest and highest wealth groups. It seems the poorest older persons in Myanmar are reached mainly through the rural and sub-rural healthcare system rather than through the network of government hospitals.
26 The category “government hospital” includes township hospitals, station hospitals, and district or general hospitals. 27Analysis is limited to the top five providers of outpatient healthcare due to an insufficient sample for disaggregated analysis of the other sources.

26
Figure 15: Healthcare provider or facility visited for outpatient healthcare for a chronic or new condition in the preceding 12 months (% distribution)
Considering the pattern of utilisation of different types of healthcare for chronic (ongoing) conditions and new conditions, the findings reveal that older persons accessed drug stores most commonly for treating their new conditions, followed by the RHCs and sub-RHCs. However, for chronic conditions, government run hospitals were most commonly accessed, followed by the private clinics and hospitals (see Figure 15).
9. Barriers to accessing outpatient healthcare In the following sections, access to outpatient and inpatient care among older persons in Myanmar is analysed using the comprehensive analytical framework developed by Jacobs et al. (2012). In this framework, four dimensions of access to healthcare are identified: availability, geographic accessibility, affordability and acceptability. These dimensions are considered from both the supply side and the demand side (see Figure 1).
Geographic accessibility of outpatient healthcare
Supply side
The time taken to reach the healthcare facility can be regarded as a proxy for service location barriers, helping to judge the possible distance travelled to reach the place of service delivery. Table 9 shows that 88 per cent of the older persons utilising drug stores, and 76 per cent of those accessing sub-RHCs and RHCs, required less than 30 minutes to reach the healthcare provider. However, only 45 per cent of our respondents seeking outpatient care at a township or district hospital could reach the facility in under 30 minutes, and 30 per cent of them required more than an hour. Overall, the drug stores and the sub-RHCs and RHCs appear to be most proximately located and most quickly accessible, while the government hospitals are farthest and take the longest to access.
0
10
20
30
40
50
60
70
Drug stores Sub‐RHCs &RHCs
Private doctors Private clinics &hospitals
Governmenthospitals
Chronic New

27
Table 9: Time taken to reach the various outpatient healthcare facilities (% distribution)
Total
Drug stores
Sub-RHCs & RHCs
Private doctors
Private clinics & hospitals
Government hospitals
Below 30 minutes 64.1 88.2 75.7 67.0 56.4 44.9 30 to 60 minutes 21.1 8.8 16.8 19.1 24.8 25.6 60 minutes and more 14.8 2.9 7.5 13.9 18.8 29.5
Demand side
Means of transport
A respondent’s means of transport to reach a healthcare facility suggests both the relative ease of access to that facility and the transportation costs incurred. Analysis of the means of transport to various healthcare facilities reveals that, on average, 21 per cent of the respondents utilise private vehicles, without much marked differences across the different healthcare facilities (see Table 10). On average, 10 per cent of the respondents utilised public transport, with the exception of those who received treatment from the rural health centres and sub-RHCs and private hospitals. Across the various healthcare facilities, there is significant variation in the use of the following modes of travel: walking, bicycles/trishaws and taxis. As drug stores and RHCs tend to be fairly close to home, the older persons generally either walked or used bicycles or trishaws to reach them: only 5 to 16 per cent took taxis28 to access this kind of care. In contrast, among the older persons using outpatient care at township or district hospitals, only 24 per cent reached the facility by walking, bicycle, or trishaw, and 41 per cent took taxis, suggesting that government hospitals are less accessible than drug stores and rural health centres and sub-RHCs. With respect to private healthcare facilities, one observes more even mix of private and public transport indicating a moderate level of accessibility.
Table 10: Means of transport to reach an outpatient healthcare facility, by type of healthcare provider (% distribution)
Mode of Travel Total
Drug stores
Sub-RHCs & RHCs
Private doctors
Private clinics & hospitals
Government hospitals
Private Vehicle 20.9 21.1 24.2 22.0 21.3 22.7 Public Transportation 10.6 10.5 0.0 13.0 18.7 12.0 Taxi 23.4 5.3 16.2 27.6 27.3 41.3 Walked 27.7 34.2 52.5 25.2 14.0 6.7 Bicycle/ Trishaw 13.6 28.9 3.0 12.2 18.7 17.3
28 “Taxi” refers to any paid, private, motorised transport in Myanmar including motorcycle taxis (popular in rural areas), pickup trucks and vans, and the taxi cabs common in cities.

28
Cost of transport
Geographical accessibility can be improved if transport costs are lowered (Jacobs et al. 2012). The cost of transportation can be an important barrier to accessing healthcare in a low-income country like Myanmar. Table 11 reports the costs incurred to reach various healthcare facilities and providers.
Table 11: Cost of transport to reach an outpatient healthcare facility, by type of provider (% distribution and median cost in Myanmar kyat)29
Total Drug stores
Sub-RHCs & RHCs
Private doctors
Private clinics & hospitals
Government hospitals
Less than 1000 kyat (%)
57.8 85.3 76.4 51.3 41.6 38.5
1000 to 3000 kyat (%)
24.8 14.7 11.8 29.6 38.9 26.9
3000 kyat or more (%)
15.0 0.0 5.5 17.4 18.1 32.1
Median cost (in kyat)
0.0 0.0 0.0 500.0 1000.0 1000.0
The results show that the median cost of transport is lowest for accessing the drug stores and RHC (0 kyat), with more than half of the older persons accessing these facilities either by walking or using bicycles or trishaws. The median cost of transport to private facilities was between 500 to 1000 kyat,30 while the median cost of travel to government hospitals was 1000 kyat.
Considering demand-side and supply-side geographical barriers, it seems the access barriers are highest for government hospitals, followed by private facilities, while drug stores and rural health centres and sub-RHCs are the most geographically accessible facilities. In focus group discussions, respondents revealed that often the healthcare facilities with the easiest, cheapest geographical access were the small, local medicine shops, including nearby grocery shops that sell basic medicines, and also the sub-RHCs, particularly in the main village of the village tracts since sub-RHCs and such shops were usually located there. Private healthcare facilities such as clinics and hospitals are usually located in and near the urban areas and so are farther away and more expensive to access. Government hospitals were among the farthest and most expensive facilities to access.
Affordability of outpatient healthcare
Accessing healthcare entails supply-side costs, including healthcare providers’ fees and costs for medicines and tests, as well as indirect, demand-side costs, such as expenses for transport, food for the patient, accommodation for care-givers, and opportunity costs, that is, loss of income in the period the patient is seeking healthcare (Jacobs et al.
29 In Table 11, “do not know” responses have been omitted from the analysis. 30 At the time of the study, US $1 was roughly 1200 kyat.

29
2012, McPake et al. 2002). However, due to a very low response rate to our questions pertaining to the different components that constitute total healthcare cost, our analysis will be limited to the total cost, combining supply-side and demand-side expenses, and the total cost as a percentage of household expenditure.
Supply side
Cost
The cost of service delivery is a significant supply-side barrier. The average total cost of outpatient care across the various types of healthcare providers is shown in Table 12. The lowest average cost of outpatient care was found with drug stores (2000 kyat), followed by sub-RHCs and RHCs (3000 kyat), then government hospitals and private doctors (5000 kyat). Private clinics and hospitals were the least affordable with the total cost of outpatient care averaging around 6000 kyat. Nearly three quarters of the older persons visiting drug stores and half of the older persons visiting sub-RHCs and RHCs accessed these services for less than 3000 kyat, compared to about one quarter of older persons visiting other facilities. Private clinics and hospitals followed by private doctors and government hospitals are the most expensive sources of outpatient care, while the least expensive are drug stores and primary healthcare centres (RHCs and sub-RHCs).
Table 12: Total cost incurred for outpatient treatment, by type of healthcare provider (% distribution and median cost)
Total
Drug stores
Sub-RHCs & RHCs
Private doctors
Private clinics & hospitals
Government hospitals
Less than 3000 kyat (%) 32.5 73.5 47.3 20.0 17.4 25.6 3000 to 9000 kyat (%) 42.2 20.6 40.0 51.3 48.3 38.5 9000 and 15,000 kyat (%) 6.1 0.0 2.7 10.4 8.1 5.1 15,000 kyat and more (%) 18.5 5.9 9.1 17.4 25.5 30.8 Median cost (in kyat) 4000 2000 3000 5000 6000 5000
Another potential supply-side barrier to outpatient healthcare is the presence of a public-private dual practice, which exposes the older patients to (public) health workers’ private practices, increasing the chances of spiraling treatment costs. The experience of one old woman seeking treatment from a specialist doctor at a private hospital is a case in point.
[The woman] saw a specialist doctor at a private hospital and each visit, she had to buy the medicine prescribed by the specialist, which was quite expensive. After about ten visits, she couldn’t afford the cost of the medicine and enquired about the medicine at another pharmacy outside the hospital. Only then did she realise that the medicine at this pharmacy was only half of the price charged at the private hospital. But by that time, she had needed to sell some of her land to pay for the medicine.
Source: Notes from the field
30
Demand side
Cost of outpatient care as a percentage of household expenditure
To assess the demand-side cost barriers to outpatient care, we have calculated the total cost of the respondents’ most recently received outpatient care as a percentage of the household total monthly expenditure. On the whole, the median total cost of most recent outpatient care was around 3 per cent of household median monthly expenditure. The median total cost of the outpatient care accounted for around 3 per cent of rural households’ median monthly expenditure, and 4 per cent of the poorest households’ (in the “lower” category of the Wealth Index) median monthly expenditure. In comparison, the median total cost of the most recent outpatient care was 2 per cent of both the urban households’ and the richest households’ (“upper” in the Wealth Index) median monthly expenditure. The cost of outpatient care in relation to average monthly expenditure is nearly double for the poorest households (4 per cent) as compared to the richest households (2 per cent). This raises concern about the burden of outpatient care expenses on the poorer households, particularly when these households were found to be accessing cheaper sources of outpatient care (see Tables 8 and 12).
Other important demand-side barriers identified in the literature are a general lack of economic resources, and more specifically, low availability of liquid cash when the patient is seeking care (Khun and Manderson 2007). Limited cash flow correlates with seasonality, especially in agrarian societies (Jacobs et al. 2012).
Availability of outpatient healthcare
Supply side
A host of factors can affect the availability of adequate healthcare, but often in poor countries the root cause of supply-side barriers is the substantial gap that exists between actual health spending and the spending that is required to provide essential health services (WHO 2001, O’Donnell 2007). The lack of adequate funding for the healthcare system manifests at the ground level in unqualified health workers, insufficient number of health workers, staff absenteeism, late opening hours, long waiting times, lack of motivation among staff, lack of availability of drugs and other consumables and so on. For instance, in the year 2010–11 in Myanmar, the ratio of doctors, nurses and midwives per 1000 population was only 1.49, well below the global standard of 2.28 health workers per 1000 population (WHO 2014). Long waiting times for services indicates that staff and equipment are not distributed according to need (Jacobs et al. 2012). Furthermore, when poorly paid public healthcare providers set up private practices (or “private-public dual practice”), it has adverse effects on the availability of staff at public facilities. Staff absenteeism, limited opening hours and long waiting times erode the availability of adequate and timely care for older patients.
In order to ascertain the supply-side barriers to healthcare availability, a set of questions was asked of older persons to assess their perceptions regarding “care and attention”, “medical treatment”, “availability of medicines”, “waiting time” and “cleanliness” at their healthcare facilities. Respondents were asked to rate how satisfied they were with the healthcare services they received on a five-point scale from very satisfied to very dissatisfied. Overall, only an extremely small number of older persons rated themselves to be “dissatisfied” or “very dissatisfied” with the healthcare they received. This may

31
reflect reluctance to express dissatisfaction, or low expectations, or both. More respondents appeared to be willing to express indifference about the quality of healthcare, prompting us to combine the “neither satisfied nor dissatisfied” rating with the “dissatisfied” and “very dissatisfied” ratings and use this as a proxy for some degree of inadequacy in satisfaction with the healthcare services.
Figure 16: Perceptions of the care and attention received from the healthcare provider or facility during the most recent outpatient visit (% distribution)31
Figure 17: Perceptions of the medical treatment received from the healthcare provider or facility during the most recent outpatient visit (% distribution)
31 In Figures 16, 17 and 18, “others” refers to reports of “neither satisfied nor dissatisfied”, “dissatisfied”, or “very dissatisfied”.
16 1126
34
11
6183
7061
79
24
6 4 5 11
0%
10%
20%
30%
40%
50%
60%
70%
80%
90%
100%
Drug stores Sub‐RHCs & RHCs Private doctors Private clinics &hospitals
Governmenthospitals
Very Satisfied Satisfied Others
18 1124 25
8
61 79
73 68
75
2110 3 7
17
0%
10%
20%
30%
40%
50%
60%
70%
80%
90%
100%
Drug stores Sub‐RHCs & RHCs Private doctors Private clinics &hospitals
Governmenthospitals
Very Satisfied Satisfied Others

32
Figure 18: Perceptions of the availability of medicines at the healthcare provider or facility during the most recent outpatient visit (% distribution)
Analysing the older persons’ perceptions of the care and attention they received, the quality of medical treatment, availability of medicines, waiting times, and cleanliness of the facility across various healthcare facilities revealed the following (see Figures 16 to 20). The highest percentage of respondents were “very satisfied” with the healthcare services provided by private clinics and hospitals, followed by the private doctors, drug stores, and finally RHCs and sub-RHCs and government hospitals (combining township/station hospitals and district/general hospitals). Further, considering the percentage of older persons reporting to be “satisfied” with various aspects related to healthcare availability (see Figures 16,17,18, 20), it becomes clear that overall, respondents rate private facilities higher compared to the government-run RHCs and sub-RHCs and government hospitals, with respect to the care and attention they received, the quality of medical treatment, and the availability of medicines. An exception to the pattern is the measure of waiting time (see Figure 19). A higher proportion of older persons reported that the overall waiting time at RHCs was better than at private facilities. In addition, across the various measures of availability, drug stores had the highest percentage of older persons reporting either indifference or dissatisfaction, except with respect to waiting times. At the same time, drug stores were also among the top three outpatient care providers for which the highest percentage of older persons reported being “very satisfied” (behind the private facilities and ahead of the government facilities). The reporting of a high proportion of both high and poor rating across the various measures of availability among drug stores is quite intriguing. It may suggest a great deal of diversity within this category of provider, ranging from small neighbourhood medicine shops to big pharmacies, as well as the lack of regulation and limited standardisation of services.
13 1120 19
4
6171
7466
76
2618
615 20
0%
10%
20%
30%
40%
50%
60%
70%
80%
90%
100%
Drug stores Sub‐RHCs & RHCs Private doctors Private clinics &hospitals
Governmenthospitals
Very Satisfied Satisfied Others

33
Figure 19: Perceptions of the waiting time for treatment at the healthcare provider or facility during the most recent outpatient visit (% distribution)32
Figure 20: Perceptions of the cleanliness of the facility during the most recent outpatient visit (% distribution)
Focus group discussions revealed older persons’ perceptions about the availability of outpatient services at the different sources.
Regarding private facilities:
“If we go to the private clinic, on-duty medical staff are always present. The staff treat us attentively. There is neither a waiting list nor any need to come back later.”
32 In Figures 19 and 20, “others” refers to reports of “moderate”, “poor”, or “very poor”.
11 8 11 173
5073
54 41
45
39
1935
4352
0%
10%
20%
30%
40%
50%
60%
70%
80%
90%
100%
Drug stores Sub‐RHCs & RHCs Private doctors Private clinics &hospitals
Governmenthospitals
Very Good Good Others
21 1724 30
11
5876
69 61
72
217 7 9
17
0%
10%
20%
30%
40%
50%
60%
70%
80%
90%
100%
Drug stores Sub‐RHCs & RHCs Private doctors Private clinics &hospitals
Governmenthospitals
Very Good Good Others

34
Regarding RHCs and sub-RHCs:
“There is only one health worker for nearly 1000 households.”
“Since the doctors are out of our reach we have to depend mainly on other health workers whether we like it or not.… We need more qualified staff at the RHC.”
“There are frequent shortages of medicines at the RHC.”
Regarding government hospitals:
“All the best doctors are in the government hospitals, but they do not have time and are busy. These doctors spend some time at the government hospital and then work as consultants in private hospitals or work in their private clinics.”
Some older persons in the urban areas were found to access outpatient care at charity-based clinics. During a FGD, an older person noted the barriers to accessing the free outpatient care at these clinics:
“There is a charity medical clinic open to everyone, established by a well-known Buddhist monk. But the problem is the clinic only opens on Tuesday and Friday from 12 to 4 p.m. As a result, the waiting time to get the service is extremely long, which is not appropriate for the elderly person.”
Acceptability of outpatient healthcare
Supply side
One of the critical supply-side barriers related to the “acceptability” dimension is an unwelcoming attitude or poor interpersonal skills on the part of the healthcare providers and staff, as found in Laos by Paphassarang et al. (2002). A related issue is the users’ lack of trust in the healthcare providers or their intermediates, as found in rural Cambodia (Ozawa and Walker 2009). To understand these barriers that make people reluctant to use health services, the older persons were asked to rate their experiences during their most recent visit to a healthcare provider or facility as “very good”, “good”, “moderate”, “poor” or “very poor”. Acceptability was assessed with respect to respondents’ experiences of being treated respectfully, provided clear explanations, involved in the decision making, talked to privately and provided access to a preferred provider. Once again, due to low reporting of “poor” and “very poor” experiences, these responses were combined with “moderate” ratings for purposes of analysis. Figures 21 to 25 show that, across the various measures of acceptability, the highest percentage of older persons reported a “very good” experience at a private clinic or hospital or with private doctor, followed by at a primary healthcare centre (RHC and sub-RHC), and finally at a government hospital. Once again, a high percentage of both high and poor ratings were reported among drug stores, across the various measures of acceptability, making it difficult to assess a common level of acceptability for drug stores.

35
Figure 21: Perceptions of being treated respectfully by the healthcare provider or facility during most recent outpatient visit (% distribution)33
Regarding respectful treatment by healthcare providers (Figure 21), evidently many more older persons felt that they were being treated respectfully in the private healthcare facilities or doctor’s offices (28 and 23 per cent) as compared to their experiences in primary healthcare centres of RHCs and sub-RHCs (13 per cent) or government hospitals (9 per cent). However, only a very small proportion of the older persons visiting either a private or a government facility felt that the experience was less than good (that is, “moderate”, “poor”, or “very poor”).
Figure 22: Perceptions of how clearly things were explained by the healthcare provider during the most recent outpatient visit (% distribution)
33 In Figures 21 to 25, “others” refers to reports of “moderate”, “poor”, or “very poor”.
18 1323 28
9
53
82 69 65
83
29
5 8 7 8
0%
10%
20%
30%
40%
50%
60%
70%
80%
90%
100%
Drug stores Sub‐RHCs &RHCs
Private doctors Private clinics &hospitals
Governmenthospitals
Very Good Good Others
13 8 11 131
50 59
7050
65
37 3319
37 33
0%
10%
20%
30%
40%
50%
60%
70%
80%
90%
100%
Drug stores Sub‐RHCs &RHCs
Private doctors Private clinics &hospitals
Governmenthospitals
Very Good Good Others

36
Regarding how clearly healthcare providers explained things (see Figure 22), only a small proportion of older persons had a “very good” experience at any facility, ranging from 13 per cent at a private clinic or hospital, to 8 per cent at the primary healthcare centres (RHCs and sub-RHCs), to only 1 per cent at government hospitals. At most facilities, fairly high percentages of older persons, 33 and 37 per cent, felt that their experience of healthcare providers’ explanations was moderate to poor, except at private doctors’ offices, wherein only 19 per cent of respondents had a moderate to poor experience.
Figure 23: Perceptions of being involved in decision making regarding treatment during the most recent outpatient visit (% distribution)
Regarding older persons’ experiences of being involved in making decisions about their treatment (see Figure 23), once again a much higher proportion of older persons felt that their experience was “very good” at either a private clinic or hospital (28 per cent) or at a private doctor’s office (22 per cent), as compared to their experiences at government facilities. Only 7 per cent of the older persons visiting primary healthcare centres shared that they had had a “very good” experience with respect to decision making, and none of the older persons visiting government run hospitals reported “very good” experiences in this regard. A higher percentage of older persons who sought treatment at drug stores and government facilities rated their experience of the decision-making process as “moderate to poor”, compared to those who sought treatment at private facilities.
167
22 28
4773
65 57
77
37
2013 15
23
0%
10%
20%
30%
40%
50%
60%
70%
80%
90%
100%
Drug stores Sub‐RHCs &RHCs
Private doctors Private clinics &hospitals
Governmenthospitals
Very Good Good Others

37
Figure 24: Perceptions of being provided an opportunity to speak privately with the healthcare provider during the most recent outpatient visit (% distribution)
Drug stores, again, had the highest percentage of respondents reporting both “very good” and “moderate” to “very poor” experience with regard to having an opportunity to speak privately with their care providers. Excluding the drug stores, around 10 per cent of respondents felt that their experience with regard to having an opportunity to speak privately with their care providers was “very good” (see Figure 24). In contrast, about double that number (20 per cent) felt that they had had a “moderate” to “very poor” experience at the various facilities, except at primary healthcare centres, where only 9 per cent had had a “moderate” to “very poor” experience. Furthermore, around one third of respondents reported that their access to a preferred healthcare provider was “moderate” to “very poor” across the healthcare facilities (see Figure 25).
Figure 25: Perceptions regarding ease of access to a preferred provider at the facility during the most recent outpatient visit (% distribution)
18 12 11 13 7
5379
69 68 75
29
920 19 19
0%
10%
20%
30%
40%
50%
60%
70%
80%
90%
100%
Drug stores Sub‐RHCs & RHCs Private doctors Private clinics &hospitals
Governmenthospitals
Very Good Good Others
3 9 12 164
42
58 56 43 67
55
33 3241
29
0%
10%
20%
30%
40%
50%
60%
70%
80%
90%
100%
Drug stores Sub‐RHCs & RHCs Private doctors Private clinics &hospitals
Governmenthospitals
Very Good Good Others

38
Box 1: Rural health centres (RHCs)
“Since the doctors are out of our reach we have to depend mainly on other health workers whether we like it or not.”
“There is only one health worker for nearly 1000 households”
Sub-RHCs are usually located at village tract level and provide healthcare services to about eight surrounding villages in a three-mile radius. A sub-RHC is usually staffed with at least one midwife, who lives in the main village of the village tract and visits the other villages three or four times a month. (There may also be auxiliary midwives at the sub-RHC.) The midwives’ primary mandate is to conduct maternal health checkups, deliver babies and provide immunization, but they may attend to others with mild illnesses in the community, including older persons. In the context of a general shortage of doctors and nurses, these sub-RHC midwives provide basic primary healthcare services at the village level, in addition to caring for pregnant women and delivering babies. These sub-RHC midwives were providing healthcare beyond their target group. For example, in one of the focus group discussions, a 60-year-old woman informed us that the local midwife regularly monitored her high blood pressure and adjusted the dosage of her medicine.
The availability of healthcare staff at sub-RHCs and RHCs has important implications for patterns of utilisation of various sources of healthcare. An older woman in Kyaiklat narrated how she went to the sub-RHC suffering from a high fever and high blood pressure, only to find that the midwife had gone away to attend a meeting. Unable to wait, she called the local healer from a nearby village to come and give her medicines. Especially in villages that are far from the sub-RHC, traditional healers and unlicensed providers are often the first source of healthcare. Sub-RHC staff may also visit the homes of older persons if they are called about a need or emergency. While treatment during duty hours is free, the healthcare staff have to be paid for home visits. Some of the staff also had private practices. The older persons noted that “during the duty-hours, there are no extra charges, but for home visits one has to pay the nurse”.
Source: Notes from the field
Box 2: Drug stores
“For all intents and purposes the drug store owner is our local doctor.”
According to Myanmar Food and Drug Administration (FDA) division data, there are 10,000 drug stores and pharmacies, including wholesale and retail outlets, throughout Myanmar (WHO 2014). Drug stores in Myanmar not only sell medicines, but also provide medical advice based on rudimentary medical checkups like measuring blood pressure. Drug stores often sell non-prescription medicines and give advice about medicines. Many drug stores sell both traditional and Western medicines side by side. Most drug stores are located in urban areas while in the main village of the village tracts there were small grocery stores selling common medicines providing easy access to medicines for those who can afford them. We learned that older persons either visited drug stores by themselves or received the medicines through a family member, friend or local

39
healthcare worker. Older persons in villages frequently relied on others to purchase medicines for them, particularly from the larger drug stores in the urban areas.
A common practice among older persons, particularly in urban areas, was to rely on a nearby drug store for treating mild symptoms and to visit a doctor only when very ill. Many older persons continue taking prescription medicines from drug stores for long durations without going back to the doctor for a follow up consultation. It seems drug stores may encourage self-medication and less than optimal use of medicines among older persons.
One 75-year-old participant in a focus group discussion was a case in point. This man had knee pain with underlying hypertension. He went to the local drug store and got treatment to relieve his knee pain: 10 doses, which he was supposed to take one at a time, for a total 1500 kyat. He got some relief when he was taking the medicine, so he continued the treatment from the drug store. As there were no symptoms from his underlying high blood pressure, he didn’t bother to seek treatment for it.
Source: Notes from the field
Box 3: Private doctors and private clinics
“When we go to private clinics, medical staff are always on duty. The staff treat us attentively. There is neither a waiting list nor any need to come back later.”
“We get good treatment at the private clinics, but the only drawback is that the treatments are very expensive.”
In Myanmar, public-sector health workers are permitted to have a private practice during their off-hours in order to earn additional income (WHO 2014). Government doctors run a large number of private clinics, mostly in and around urban areas. As noted, private clinics are not the first source of healthcare for most older persons in Myanmar: people generally do not go to private clinics for mild symptoms, but only when they have substantial discomfort or persistent symptoms. There is also poor follow-up with the private clinics. This may be because the treatment is expensive, with the consultation alone often costing somewhere between 2000 to 5000 kyat, apart from the cost of medicine. Nevertheless, older persons reported that they got good treatment in the private clinics and they trusted the care they received there. The clinics are open on most days, and the on-duty staff are perceived to be available, attentive and kind. They provide services with very little waiting time.
Source: Notes from the field

40
Box 4: Traditional healers
“He is like a family member to us, very approachable and available 24/7.”
Traditional medicine is still a commonly accessed form of healthcare, particularly in rural and remote areas. Traditional medicines are obtained either from drug stores or traditional healers or are prepared by the older persons themselves. They are used for mild symptoms and to keep more persistent symptoms in check, so as to avoid other, more expensive forms of healthcare. Traditional healthcare is often cheaper and more easily accessible than Western medicine. In urban areas, people do not go to traditional healers, but they can get traditional medicines from drug stores. In villages, it is common to have a practicing traditional healer in one’s village or nearby. One can visit the healer or request a home visit to receive the required medicines. In focus group discussions, many older persons expressed that their traditional healer was like a family member, someone who was very approachable and “available 24/7”. They said that these traditional doctors were patient with them, and willing to answer questions about the illness, unlike the other doctors, who would not entertain more than three or four questions. Traditional doctors will also spend more time with their patients, perhaps even staying overnight with them if needed. The relationship is based on trust and comfort. However, it seems these unlicensed traditional doctors are also giving injections to their patients, to provide quick relief, which suggests that unqualified practitioners sometimes may be promoting an irrational use of medicines.
Source: Notes from the field
10. Health seeking behaviour: inpatient healthcare Inpatient healthcare refers to medical care or treatment that requires an overnight stay in a hospital or medical facility. It is a small subset within the general category of healthcare services. To study the utilisation of inpatient care among older persons in Myanmar, survey respondents were asked whether they had stayed overnight in a hospital or other healthcare facility at any time in the preceding three years. Nearly 15 per cent reported that they had.

41
Figure 26: Utilisation of inpatient healthcare in the preceding 3 years, by age, sex, area of residence, and relative wealth (% distribution)
Figure 26 shows the utilisation of inpatient care disaggregated by age, sex, area of residence and relative wealth (with reference to the “Wealth Index” described above). Surprisingly, there was a slight decrease, rather than an increase, in the utilisation of inpatient healthcare with increasingly older age groups. There was an even more pronounced difference in the use of inpatient healthcare by sex and between urban and rural residents. A higher proportion of men compared to women utilised inpatient care services, in contrast to the higher utilisation of outpatient care among women mentioned above (see Figure 12). This suggests the possibility of a gender bias against women. Outpatient healthcare is much cheaper than inpatient care. Although men report better health across indicators compared to women, it seems they are more likely than women to access the more expensive form of healthcare.
A higher percentage of urban residents compared to rural utilised inpatient healthcare services, but this was the case with outpatient care services as well. Regarding relative wealth, the utilisation of inpatient care was about 5 percentage points lower among the poorest group as compared to the other groups, suggesting poor access to hospitalisation among poorer people.
15
14 13
16
13
17
13
10
1515
16
0
2
4
6
8
10
12
14
16
18
60‐69 70‐79 80+ Male Female Urban Rural Lower Lowermiddle
Middle Upper
Age Gender Area of residence WealthIndex

42
Figure 27: Top conditions for which inpatient healthcare was utilised in the preceding 3 years (% distribution)34
Figure 27 shows the top four conditions for which older persons were hospitalised. The hospitalisation rate was highest for surgery, followed by acute conditions (such as diarrhea, fever, flu, cough and so on), respiratory ailments, and then heart diseases.
Figure 28: Healthcare facility visited to seek inpatient healthcare in the preceding 3 years (% distribution)35
A look at rates of hospitalisation across the various types of care facilities (Figure 28) suggests that hospitalisation is highest at township or station hospitals (44 per cent), next highest at district or general hospitals (33 per cent), then at private hospitals (16 per cent) and charity-run hospitals (6 per cent). Interestingly, the pattern of inpatient healthcare utilisation across the various types of facilities is similar for rural and urban areas as shown in Table 13.
34 The analysis of inpatient healthcare utilisation shown in Figures 27 to 38 and Tables 13 to 16 refers to the most recent experience of hospitalisation at any facility in the preceding three years, unless otherwise specified. 35 Other low reported sources of inpatient healthcare not represented in the graph are traditional medical hospitals.
24
19
7 6
0
5
10
15
20
25
30
Surgery
Acute conditions
(diarrhea, fever,
flu, headaches,
cough, etc.)
Problems with
breathing
Problems with
heart incl. chest
pains
44
33
16
6
0
10
20
30
40
50
Township & stationhospitals
District & generalhospitals
Private hospitals Charity run hospitals

43
Table 13: Healthcare provider or facility visited for inpatient healthcare in the preceding 3 years, by area of residence and relative wealth (% distribution)36
Area of residence
Wealth Index
Total Urban Rural Lower Lower middle
Middle Upper
Township & station hospitals 43.8 45.2 42.7 65.0 43.8 46.7 25.8 District & general hospitals 32.6 35.5 30.5 15.0 35.4 33.3 38.7 Private hospitals 16.0 12.9 18.3 10.0 14.6 13.3 25.8
Comparing across the various categories in the wealth index, the highest utilisation of township and station hospitals was among the poorest group (44 per cent) while the lowest was among the richest group (26 per cent). Meanwhile, the highest rate of hospitalisation at private hospitals was among the richest group (26 per cent), while the lowest utilisation was among the poorest group (15 per cent).
11. Barriers to accessing inpatient healthcare Geographic accessibility of inpatient healthcare
Supply side
The time taken to reach a healthcare facility can be regarded as a proxy for geographic barriers related to the distance from the household to the healthcare facility. Table 14 suggests that the closest hospitals are the township or station hospitals: about 60 per cent of the older persons could reach these facilities within one hour. The district or general hospitals and the private hospitals were among the farthest, with more than 65 per cent of the older persons needing more than an hour to reach these facilities.
Table 14: Time required to reach the hospital or inpatient healthcare facility (% distribution)
Township & station hospitals
District & general hospitals
Private hospitals
Total
Less than 30 minutes 28.6 17.0 4.3 18.8 30 to 60 minutes 31.7 17.0 30.4 24.3 60 to 120 minutes 27.0 31.9 26.1 28.4 120 minutes and more 12.7 34.1 39.2 28.5
36 Analysis in Table 13 and subsequent sections refers only to the top three sources of inpatient healthcare due to lack of sufficient sample for disaggregated analysis of the other sources.

44
Demand side
Cost of transport
The median cost of transport to a township or station hospital was relatively lower at 4000 kyat compared to the cost of transport to a private hospital, at 10,000 kyat, or to a district or general hospital, at 11,500 kyat (see Table 15). One third of the older persons accessing township or station hospitals incurred transport costs of less than 2000 kyat, while 22 per cent incurred more than 14,000 kyat. In comparison, only 9 per cent of the older persons seeking hospitalisation in private facilities spent less than 2000 kyat for transportation.
Table 15: Cost of transport to reach the inpatient healthcare facility, by type of healthcare provider (% distribution and median cost)37
Forty-five per cent of the older persons accessing the district or general hospitals incurred more than 14,000 kyat for transportation. The huge cost of transport to reach a district or general hospital suggests a substantial geographic barrier that could keep a number of rural poor people from accessing the specialised care at these facilities.
Taken together, these demand-side and supply-side factors indicate the highest geographical barrier for those accessing district or general hospitals and private facilities. The township or station hospitals were the most geographically accessible inpatient healthcare facilities.
Affordability of inpatient healthcare
Accessing inpatient healthcare entails supply-side costs for health services, such as healthcare provider’s fees and the cost of medicines and tests, and indirect, demand-side costs for transport, patient food, care-giver accommodations and opportunity costs, that is, loss of income in the period the patient is seeking healthcare (Jacobs et al. 2012,McPake et al. 2002). However, due to a lack of responses to our questions on disaggregated expenses for inpatient healthcare, our analysis is limited to the total cost, combining supply-side and demand-side costs, and the total cost of hospitalisation as a percentage of total monthly household expenditure.
37 In Table 15 and subsequent tables, “do not know” reports have been omitted from the analysis.
Township & station hospitals
District & general hospitals
Private hospitals
Total
Less than 2000 kyat (%) 33.3 17 8.7 22.2 2000 to 8000 kyat (%) 23.8 21.3 30.4 22.9 8000 to 14,000 kyat (%) 17.5 14.9 17.4 17.4 More than 14,000 kyat (%) 22.2 44.7 39.1 34.7 Median cost (in kyat) 4000 11,500 10,000 10,000

45
Supply side
Cost
The average total cost of hospitalisation was found to be lowest for township or station hospitals (70,000 kyat) followed by the district and general hospitals (110,000 kyat) (see Table 16). Private hospitals were the least affordable with an average total cost of hospitalisation of around 300,000 kyat, which was three times more than the cost at government hospitals. One third of the older persons hospitalised in township or station hospitals could access the services for less than 50,000 kyat. In comparison, only one fifth of the older persons hospitalised in district or general hospitals and none of those hospitalised in private hospitals could access the services for less than 50,000 kyat. On the other hand, more than half the persons hospitalised in private hospitals incurred more than 250,000 kyat, compared to only 17 per cent of those hospitalised in township or station hospital. The total cost of hospitalisation across the various facilities reveals that private hospitals were the least affordable, followed by district or general hospitals, and then township or station hospitals.
Table 16: Total cost to access inpatient healthcare services during the most recent hospital stay, by type of healthcare provider (% distribution and median cost)
Township & station hospitals
District & general hospitals
Private hospitals
Total
Less than 50,000 kyat (%) 33.3 21.2 0.0 23.6 50,000 to 150,000 kyat (%) 34.9 38.3 30.4 36.1 150,000 to 250,000 kyat (%) 14.3 12.8 17.4 13.9 250,000 kyat and above (%) 17.5 27.7 52.2 26.4 Median cost (in kyat) 70,000 110,000 300,000 107,000
In the focus group discussions, older persons commented on the high cost of hospitalisation in the private hospitals, as follows:
“For services, private hospitals are better, but the cost is forbidding. We can hardly afford room charges let alone treatment and service charges.”
“If you want to get treatment from the private hospital, you must have more than enough money for the services they provide. If you only have just enough money to pay the hospital bills, it would be very difficult to stay in the hospital comfortably.”
In the course of discussions about district and general hospitals, older persons complained about the extra costs for purchasing medicines from outside, and having to give informal payments to staff during hospitalisation:
A 68-year-old woman was hospitalised at the government general hospital: she was admitted for four days to treat an asthma attack. At the hospital, she got an examination and intravenous infusion. The medications were not available in the

46
hospital and had to be purchased from outside. She added, “If you can’t pay the money, the care-givers will not look after you. Only when you are near your last breath, will they give you some oxygen. You can’t go to the hospital without money. You have to pay from your own pocket to the trolley pusher, the cleaners and so on.”
“Another problem with government general hospital is with any kind of operation, one feels pressured to give presents or cash to the attending doctors and nurses for preferential services.”
Demand side
To assess demand-side barriers to hospitalisation, we calculated the total cost of hospitalisation as percentage of a household’s total monthly expenditure. On average, we found that the median total cost of an episode of hospitalisation constituted more than 70 per cent of the household’s median monthly expenditure. Disturbingly, the median total cost of the most recent hospitalisation accounted for more than 95 per cent of the rural households’ and 90 per cent of the poorest (“lower” wealth category) households’ median monthly expenditures, respectively. In comparison, the cost of the most recent hospitalisation constituted only about 50 per cent of household median monthly expenditure for both the urban households and the richest households (in the “upper” category of the wealth index). The average cost burden for hospitalisation in relation to average monthly expenditure is nearly double for rural households and for the poorest households, as compared to urban households and the richest households.
As mentioned in the discussion of outpatient care, other important demand-side barriers include a general lack of economic resources, and in particular, a low availability of liquid cash at the time the patient is seeking care (Khun and Manderson 2007).
Availability of inpatient healthcare
Supply side
Supply-side barriers related to availability include the motivation of staff, the qualifications of the staff, staff absenteeism, opening hours, waiting times, the availability of drugs and other consumables and so on (Jacobs et al. 2012). In order to ascertain the supply-side barriers related to inpatient healthcare availability, we asked a set of questions about older persons’ perceptions regarding “care and attention”, “medical treatment”, “availability of medicines”, “waiting times” and “cleanliness” at the healthcare facilities. The respondents were asked to rate how satisfied they were with the healthcare services they received on a five-point scale: “very satisfied”, “satisfied”, “neither satisfied nor dissatisfied”, “dissatisfied” or “very dissatisfied”. As with our previous analysis of availability and acceptability of outpatient healthcare, an extremely small number of older persons reported being “dissatisfied” or “very dissatisfied” with the healthcare they received, prompting us to combine the “neither satisfied nor dissatisfied” rating with the poor ratings and use the combined score as a proxy for some degree of discontent with the healthcare services.

47
Figure 29: Perceptions of the care and attention received from the healthcare provider or facility during the most recent hospitalisation (% distribution)38
Figure 30: Perceptions of the medical treatment received from the healthcare provider or facility during the most recent hospitalisation (% distribution)
38 In Tables 29 to 31, “other” responses include “neither satisfied nor dissatisfied”, “dissatisfied” and “very dissatisfied”.
1423 21
60
6173
2514
4
0%
10%
20%
30%
40%
50%
60%
70%
80%
90%
100%
Township & station hospitals District & general hospitals Private hospitals
Very Satisfied Satisfied Others
11 2717
17
59 73
17
12 8
0%
10%
20%
30%
40%
50%
60%
70%
80%
90%
100%
Township & station hospitals District & general hospitals Private hospitals
Very Satisfied Satisfied Others

48
Figure 31: Perceptions of the availability of medicines at the healthcare facility during the most recent hospitalisation (% distribution)
Regarding our respondents’ perceptions of the care and attention they received, the medical treatment, and the availability of medicines across various healthcare facilities, results revealed that the highest percentage of older persons were “very satisfied” with the healthcare services provided by district or general hospitals or by private hospitals (see Figures 29 to 31). A slightly higher percentage of older persons found the medical treatment and the attention provided in the district or general hospital to be “very satisfying”, compared to the other options. However, upon combining “satisfied” and “very satisfied” responses, it seems that more respondents favoured private facilities. In terms of the availability of medicines, respondents were most satisfied with private facilities. Overall, the township or station hospitals received the lowest ratings on the above characteristics. In general, ratings of the waiting times at the various types of hospitals followed a similar pattern, with more than a quarter of the older persons reporting “moderate” to “very poor” waiting times (see Figure 32). Regarding the cleanliness of the various facilities, all the older persons who had been hospitalised in private facilities reported “very good” or “good”, in comparison to the relatively poor ratings for cleanliness for both kinds of government facilities (see Figure 33). On the whole, the private facilities were rated favourably on the different measures of availability.
19 19 21
5061
73
3019
4
0%
10%
20%
30%
40%
50%
60%
70%
80%
90%
100%
Township & station hospitals District & general hospitals Private hospitals
Very Satisfied Satisfied Others

49
Figure 32: Perceptions of the waiting time for treatment at the healthcare provider or facility during the most recent hospitalisation (% distribution)39
Figure 33: Perceptions of the cleanliness of the healthcare facility during the most recent hospitalisation (% distribution)
39 In Figures 32 to 38, “other” responses include ratings of “moderate”, “poor” and “very poor”.
17 14 13
49 59 60
3325 26
0%
10%
20%
30%
40%
50%
60%
70%
80%
90%
100%
Township & station hospitals District & general hospitals Private hospitals
Others Good Very Good
23 21
39
55 59
60
20 19
0%
10%
20%
30%
40%
50%
60%
70%
80%
90%
100%
Township & station hospitals District & general hospitals Private hospitals
Very Good Good Others

50
Focus group discussions revealed older persons’ dissatisfactions with the general hospitals:
“There are about five private clinics in the area. However, for acute and serious cases, we have to rely on the general hospital. Sometimes, we go to the private specialist clinics, but not because we have plenty of money. It is because the private clinics provide all the necessary medications and supplies, whereas the general hospital asks us to find and buy them, which becomes very difficult.”
“To be fair, nowadays, the general hospital is getting better gradually. A lot of essential medical drugs and supplies are available there. We have to find and buy outside only the uncommon medications or supplies.”
“Another problem with the general hospital is the terrible smell, probably due to bad hygiene.”
“Government hospitals have a waiting list system. That means you can’t see the doctor the same day you get a symptom. You have to book first so that you may see him or her the next day. All government appointed doctors have their own private clinics. You can see them there, but if they are not in, you have to wait until they are available.”
Acceptability of inpatient healthcare
Supply side
To capture the acceptability barriers to inpatient healthcare, the older persons were asked about their experiences during their most recent hospitalisation in relation to being treated respectfully, provided clear explanations, involved in decision making, talked to privately and provided access to a preferred healthcare provider. They were asked to rate their experiences on a five-point scale, using “very good”, “good”, “moderate”, “poor” or “very poor”. Once again, due to low reporting of “poor” and “very poor” experiences, these responses were combined with reports of “moderate” experiences for purposes of analysis.
Regarding these various measures of acceptability, Figures 34 to 38 show that the highest percentage of older persons reported “very good” or “good” experiences at private facilities. Conversely, the highest proportion of older persons reported “moderate”, “poor” or “very poor” experiences at both types of government facilities.
Nearly all of the older persons who were hospitalised in private hospitals felt that they had been treated respectfully and that medical matters had been explained to them clearly (see Figures 34 and 35). However, about 15 per cent of respondents who were hospitalised in district or general hospitals and 11 per cent of those hospitalised in township or station hospitals reported experiences that were less than “good”. Similarly, 23 per cent of respondents hospitalised in district or general hospitals and 17 per cent of those hospitalised in township or station hospitals reported that their experiences with respect to providers’ explanations of medical issues were less than “good”.

51
Figure 34: Perceptions of being treated respectfully by the healthcare provider or facility during the most recent hospitalisation (% distribution)
Figure 35: Perceptions of how clearly medical issues were explained by the healthcare provider during the most recent hospitalisation (% distribution)
A high percentage of older persons reported that their experiences of being involved in decision making about treatment and having an opportunity to talk privately with healthcare provider were less than “good” (see Figures 36 and 37). However, a much lower percentage of older persons hospitalised in private hospitals reported a lack of involvement in decision making about treatment (17 per cent), compared to those
12 17 21
76 68
73
11 144
0%
10%
20%
30%
40%
50%
60%
70%
80%
90%
100%
Township & stationhospitals
District & general hospitals Private hospitals
Very Good Good Others
1219 17
69 57
82
1723
0%
10%
20%
30%
40%
50%
60%
70%
80%
90%
100%
Township & stationhospitals
District & general hospitals Private hospitals
Very Good Good Others

52
hospitalised in government hospitals (36 to 38 per cent) (see Figure 36). Similarly a much lower percentage of older persons hospitalised in private hospitals reported a lack of opportunity to talk privately with the healthcare provider (13 per cent), compared to those who received services in government hospitals of various types (31and 49 per cent) (see Figure 37).
Figure 36: Perceptions of being involved in the decision making regarding treatment during the most recent hospitalisation (% distribution)
Figure 37: Perceptions of being provided an opportunity to speak privately with the healthcare provider during the most (% distribution)
144 8
4759
73
38 36
17
0%
10%
20%
30%
40%
50%
60%
70%
80%
90%
100%
Township & station hospitals District & general hospitals Private hospitals
Very Good Good Others
11 6
3961
87
49
31
13
0%
10%
20%
30%
40%
50%
60%
70%
80%
90%
100%
Township & station hospitals District & general hospitals Private hospitals
Very Good Good Others

53
Figure 38: Perceptions regarding ease of access to a preferred provider at the facility during the most recent hospitalisation (% distribution)
Higher percentages of older persons who were hospitalised in various types of government hospitals reported that their access to a preferred healthcare provider was less than “good” (19 and 25 per cent), compared to those who were admitted to private hospitals (8 per cent) (see Figure 38).
During the focus group discussions, older persons expressed similar sentiments about government hospitals:
“The doctors and nurses were quite reasonable, but the other staff and workers were quite rude towards the patient’s caregivers, shouting all the time about small errors.”
“There are very kind-hearted staff in the hospital, but I am sorry to say they are in the minority. Therefore, a lot of people do not notice these people and they think everyone in the hospitals is bad.”
12. The way forward Tackling poverty and lack of awareness
Following public health scholarship, our study has reemphasized that poverty is closely linked to access to adequate healthcare, as also noted by the older persons during the focus group discussions. This underscores the need to address poverty. While that remains a larger long-term developmental goal, group insurance programmes similar to the Rashtriya Swasthya Bima Yojana (RSBY) scheme of India40 could be a way forward in the short run.
40 Rashtriya Swasthya Bima Yojana (RSBY) is government run health insurance scheme in India, launched in 2008, that provides health insurance coverage of up to Rs 30,000 for hospitalisation, initially only for Below Poverty Line (BPL) households, but later extended to cover certain other categories including the unorganised
11 10 8
63 7082
25 198
0%
10%
20%
30%
40%
50%
60%
70%
80%
90%
100%
Township & stationhospitals
District & general hospitals Private hospitals
Very Good Good Others

54
The study found that a crucial barrier to healthcare among older persons is poor awareness regarding their health and regarding the availability of healthcare services. It is recommended that the government invest in programmes for creating awareness about health conditions and healthcare services, including their availability and associated costs.
Strengthen the existing healthcare system
Primary healthcare was endorsed in 1978 by WHO member countries as a paradigm designed to reduce inequities in health, partly through enabling universal access to health services (Rasanathan et al. 2011). Following the exemplar, it is recommended that the rural healthcare system in Myanmar be strengthened, since it is one of the more accessible and affordable sources of outpatient care in rural areas. This could remedy many of the issues of poor availability and acceptability resulting from the rural healthcare facilities and workers being under resourced and overstretched. Further the geographic accessibility of the rural healthcare system could be improved to reach the remote villages and the villages located at a distance from the sub-RHCs, so that rural elderly need not resort to seeking treatment from unqualified health practitioners. The rural healthcare system needs to be strengthened to increase the reach of healthcare facilities to the vast majority of poor, rural, older persons.
During field visits, the older persons asked for better healthcare facilities at the village level, such as a sub-RHC in each village with trained health staff and well stocked with essential medicines and visiting doctors, so that they do not have to go to township facilities that are far away and expensive to reach. This could remedy the rural-urban gap in the distribution of health facilities and particularly benefit the older persons, many of whom suffer from functional limitations that hamper their ability to reach far away healthcare facilities.
Furthermore, the midwives and other health staff at the sub-RHCs were the first and sometimes the only trained healthcare providers that a large majority of older persons could access. In the context of a general shortage of doctors and nurses, these sub-RHC midwives have become responsible for providing basic primary healthcare services at the village level. Heavy reliance on midwives is less than ideal, but with the increased scope of RHC staff responsibilities, it is imperative that these health workers are provided with requisite training and skill development.
Similarly, traditional medicines and health practices are widely in demand in most rural areas. The government has provided acceptance and support to traditional medicine by setting up the Department of Traditional Medicine (DTM) and by facilitating its inclusion in the healthcare system. As a step further, the DTM could train, certify, standardise and regulate the traditional medical practitioners scattered across the country to ensure that these practitioners become a valuable and reliable alternative source of healthcare,
sector workers (Narayana, 2010). The programme covers dependents including elderly members of the household. The household only needs to register with a token fee while the premium is shared by the central (75 per cent) and state governments (25 per cent). The beneficiary has the choice of seeking treatment in the public or private hospitals for cashless treatment. Hospitals also have an incentive to treat beneficiaries, as under RSBY the money will flow directly to the concerned hospital (Narayana, 2010).

55
particularly in rural and remote areas. Additionally DTM could act to regulate the manufacturers of traditional medicines.
It is recommended that easily accessible, dedicated geriatric clinics, similar to the WHO-supported “Wednesday geriatric clinics” (established in the project areas), be established to target older person’s healthcare since, as revealed during the FGDs, many older persons felt that they were not a priority for government-run healthcare facilities like the RHCs and hospitals.
Greater investment in the public healthcare system
The cost of private outpatient and, particularly, inpatient healthcare in Myanmar is forbiddingly higher than that of government healthcare. Although private healthcare has substantial affordability barriers, the ratings of user satisfaction with various healthcare services indicate higher levels of satisfaction with private healthcare compared to government healthcare facilities. The availability and acceptability barriers associated with government healthcare facilities take the form of shortage of healthcare workers, unqualified healthcare workers, lack of motivation among staff, lack of care and attention, disrespectful treatment, lack of sanitation and hygiene, long waiting times, lack of availability of drugs and other consumables, and so on. However, the root cause of the problem lies in the substantial gaps that exist between the actual health spending and the spending required to provide essential health services. As noted by the older persons in the focus group discussions, the government healthcare facilities have improved over the past few years. With increased investment in healthcare in recent years, there seems to be slow yet sure improvement. Therefore, it is recommended that the government should try to significantly increase investment in public healthcare over the coming years, especially for infrastructure, human resources and increased salaries for healthcare personnel. The results of the study could be used as a baseline against which the new government could measure future progress.

56
References Arber, S. & Ginn, J. (1991). Gender and Later Life: A Sociological Analysis of Resources and Constraints. London: Sage Publication.
de Lucena, A. P. V., Fernandes, D. S. D. S. L., Nunes, E. M., Nóbre, J. D. O. C., Crispiniano, E. C., Marques, A. C. M. L., ... & Neto, C. D. M. (2016). Influence of Low Back Pain in the Functional Capacity of Older People. International Archives of Medicine, 9(1).
Edwards, R. R., Bingham, C. O., Bathon, J., & Haythornthwaite, J. A. (2006). Catastrophizing and pain in arthritis, fibromyalgia, and other rheumatic diseases. Arthritis & Rheumatism, 55: 325–332. doi:10.1002/art.21865.
Ensor, T. & Cooper, S. (2004). Overcoming barriers to health service access: influencing the demand side. Health Policy Planning 19: 69–79.
Fozard, J. L. & Gordon-Salant, S. (2001). Changes in vision and hearing with aging. Handbook of the psychology of aging, 5, 241–266.
Government of Myanmar 2015. The 2014 Myanmar Population and Housing Census, The Union Report, Census Report Volume 2. https://data.unhcr.org/thailand/download.php?id=421
Idler, E. L. &Benyamini, Y. (1997). Self rated Health and Mortality: a review of twenty seven community studies, Journal of Health and Social behavior, Vol. 38, No. 1, 21–37.
Idler, E. L. & Kasl, S. V. (1995). Self-Ratings of Health: Do They Also Predict Change in Functional Ability? Journals of Gerontology: Social Sciences. 50B:S344–S353.
IHLCA Project Technical Unit (2011). Integrated household living conditions survey in Myanmar (2009–2010) Poverty Profile. Yangon. http://www.mm.undp.org/content/dam/myanmar/docs/FA1MMRPovertyProfile_Eng.pdf
International Institute of Population Sciences (IIPS) & Macro International (2000). National Family Health Survey (NFHS-2), 1998–99: India. International Institute of Population Sciences, Mumbai.
Jacobs, B., Ir, P., Bigdeli, M., Annear, P.L. & Van Damme, W. (2012). Addressing access barriers to health services for the poor: An analytical framework for selecting appropriate interventions in low income countries. Health Policy and Planning, 27(4): 288–300.
Khun, S. & Manderson, L. (2007). Health seeking and access to care for children with suspected dengue in Cambodia: An ethnographic study. BMC Public Health 7: 262.
Kinsella, K. & He, W. (2009). U.S. Census Bureau, International Population Reports, P95/09-1, An Aging World: 2008, U.S. Government Printing Office.
Knodel, J. (2014). The situation of older persons in Myanmar: Results from the 2012 survey of older persons (Rev. 2014). Yangon: HelpAge International.
McPake, B., Kumaranayake, L. & Normand, C. (2002). Health Economics: An International Perspective. London: Routledge.

57
Myanmar, Ministry of Health (2014). Health in Myanmar 2014.
Narayana, D. (2010). Review of the Rashtriya Swasthya Bima Yojana. Economic and Political Weekly. Volume No.29.
O’Donnell, O. (2007). Access to health care in developing countries: Breaking down demand side barriers. Cadernos de Sau´de Publica 23: 2820–34.
Ozawa, S. & Walker, D.G. (2009). Trust in the context of community-based health insurance schemes in Cambodia: Villagers’ trust in health insurers. Advances in Health Economics and Health Services Research 21: 107–32.
Paphassarang, C., Philavong, K., Boupha, B. & Blas, E. (2002). Equity, privatization and cost recovery in urban health care: The case of Lao PDR. Health Policy and Planning 17(Suppl. 1):72–84
Penchansky, R. & Thomas, J.W. (1981).The concept of access: Definition and relationship to consumer satisfaction. Med Care 19:127–40
Peters, D. H., Garg, A., Bloom, G., Walker, D. G., Brieger, W. R., & Rahman, M. H. (2008). Poverty and access to health care in developing countries. Annals of the New York Academy of Sciences, 1136(1), 161–171.
Rajan, S.I. & Syamala, S. (2017). Life satisfaction among the Elderly in Kerala: A longitudinal analysis. In S. Irudaya Rajan and U.S. Mishra (eds.), India’s Aged: Needs and Vulnerabilities. Hyderabad: Orient Blackswan. (Forthcoming).
Rasanathan, K., Montesinos, E.V., Matheson, D., Etienne, C.& Evans, T. (2011). Primary Health Care and the social determinants of health: Essential and complementary approaches for reducing inequities in health. Journal of Epidemiology and Community Health. Aug;65(8):656–60
Scommegna, P. (2012). Noncommunicable diseases among older adults in low- and middle-income countries. Population Reference Bureau. Today’s Research on Aging. No. 26, August 2012.
Low, S., et al. (2014). Human resources for health: Task shifting to promote basic health service delivery among internally displaced people in ethnic health program service areas in eastern Burma/Myanmar. Global Health Action, Pp 86–95.
Sreerupa & Rajan, S.I. (2010). Gender and widowhood: Disparity in health and healthcare utilisation among aged in India. Journal of Ethnic and Cultural Diversity in Social Work (Special issue on Women and Aging International: Diversity, Challenges and Contributions). Vol 19: 4, pp 287–304.
Tandon, A., Murray, C.J.L., Lauer, J., & Evans, D. (2000). Measuring overall health system performance for 191 countries. Geneva: World Health Organization, 2000 (Global programme on evidence for health policy discussion paper No 30.)
Teerawichitchainan, B. & Knodel, J. (2015). Economic status and old-age health in poverty-stricken Myanmar. Journal of Aging and Health, 27(8), 1462–1484.
Thailand Burma Border Consortium (2004). Internal Displacement and Vulnerability in Eastern Burma. Thailand Burma Border Consortium, Bangkok.

58
United Nations 2015. World Population Prospects, The 2015 Revision. Department of Economic and Social Affairs Population Division. https://esa.un.org/unpd/wpp/publications/files/key_findings_wpp_2015.pdf
Van Doorslaer, E., O'Donnell, O., Rannan-Eliya, R. P., Somanathan, A., Adhikari, S. R., Garg, C. C., ...& Karan, A. (2006). Effect of payments for health care on poverty estimates in 11 countries in Asia: An analysis of household survey data. The Lancet, 368(9544), 1357–1364.
World Health Organization (2000). The World Health Report 2000: Health systems: Improving performance. Geneva.
World Health Organization (2001). Commission on Macroeconomics and Health. Macroeconomics and Health: Investing in health for economic development. Geneva.
World Health Organization (2011a). Global Status Report on Noncommunicable Diseases 2010. Geneva.
World Health Organization (2011b). Myanmar NCD [Noncommunicable Diseases] Country Profiles 2011. http://www.who.int/nmh/countries/mmr_en.pdf, (accessed 6 May 2016).
World Health Organization (2014). The Republic of the Union of Myanmar: Health system review, Health Systems in Transition (HiT), Vol.4 No. 3, WHO Press (on behalf of the Asia Pacific Observatory on Health Systems and Policies).

59
Annotated bibliography Aung Zaw Moe (2015). Understanding the health seeking behavior of community people with Lay-ngan-yaw-gar (stroke) in Myanmar: A study in Bago. This paper, which was presented at the International Conference on Burma/Myanmar in Transition: Connectivity, Changes and Challenges held at Chiang Mai University, Thailand during 24–25 July 2015, analyses how people in rural areas seek medical care in Myanmar. It is found that health seeking behavior is mainly determined by communication between the patient and provider, trust, competency of provider, matching expectations and socio-economic conditions. People tend to have a high incidence of morbidity in rural areas, but they rarely seek treatment, which indicates the lack of health knowledge among rural people. In the case of sudden onset of illness, richer households consulted doctors in the private sector, while middle income and poor families mainly consulted general practitioners, traditional massage practitioners, and spiritual mediums due to a combination of factors including communication, trust, competency of provider, matching expectations and socio-economic conditions.
Beyrer, C., & Lee, T. J. (2008). Responding to infectious diseases in Burma and her border regions. Conflict and Health, 2(1), 1. The paper reviews the conference titled Responding to Infectious Diseases in the Border Regions of South and Southeast Asia conducted by a collaborative group including the Center for Public Health and Human Rights at Johns Hopkins University, The Human Rights Center at the University of California – Berkeley, and the Global Health Access Program, and hosted by the Faculty of Tropical Medicine of Mahidol University in Bangkok, Thailand. The paper highlights the neglect of health issues and its impact on the states bordering Myanmar such as China, India, Thailand and Bangladesh. The border regions neighbouring Myanmar have been most affected by HIV/AIDS and other diseases, which are mainly considered to be Myanmar “exports”.
Bodeker, Gerard, and Neumann, Cora (2012).Revitalization and development of Karen traditional medicine for sustainable refugee health services at the Thai–Burma border. Journal of Immigrant & Refugee Studies, 10:6–30. This article examines how Karen people are adapting traditional medical systems to meet current needs in the face of displacement and protracted conflict at the Thai–Burma border. This study found that the camp-based traditional health clinics and traditional health practitioners are helping to address the health problems of Karen refugees and migrants along the border. The preservation and perpetuation of traditional health practices are accomplished through a series of training programmes provided by a network of Karen traditional health practitioners in refugee camps and within the IDP areas.
Cesar Chelala (2012, May 11). Chance to improve public health in Myanmar, Japan Times. Retrieved from http://www.japantimes.co.jp/ This article indicates that the government spending on health in Myanmar has been very low (less than 0.5 per cent of GDP) in the recent decades. According to the WHO, Burma was the second-worst country in terms of the overall performance of the health system in 2000. There were wide inequalities between rural and urban areas and health services failed to cover the most peripheral regions in the country. Malaria remains the leading cause of mortality and morbidity in the country. Myanmar is also one of 22 countries

60
with the highest burden of tuberculosis. Increasingly, TB patients are showing multidrug resistance to available treatment. Non-communicable diseases such as diabetes mellitus, cardiovascular diseases (including hypertension) and cancers are increasingly becoming public health problems due to widespread risk factors in the population such as smoking. At the same time, malnutrition, including several micronutrient deficiencies, continues to be a serious health concern in Myanmar. Since the public health care system is under-resourced, there are negative consequences for access to health services. New measures are badly needed to improve the health system in Myanmar.
Grundy, John (2013). Road to recovery: Charting a course to Universal Health Coverage in Myanmar. Health policy and health finance knowledge hub (1–4). In this paper, the author suggests guidelines to be taken by Myanmar in the wake of political, economic, demographical changes currently being experienced with relation to the policy of Universal Health Coverage (UHC). The data for this article were collected in nine visits between 2007 and 2012 to study health systems planning and assessment, especially in relation to immunisation, health system strengthening, health finances and post-Cyclone Nargis recovery planning. The paper considers recent political reforms like decentralisation, encouragement of civil society, and the introduction of a constitution that makes the state responsible for providing health care facilities and measures that are aimed at providing UHC. In addition, the increase in overseas aid, budgetary allocation and investment combined with economic growth gives much needed resources for executing policy measures. The paper also points out possible challenges when UHC is introduced in Myanmar and possible remedies.
Han, Myint (2012). Health care of the elderly in Myanmar. Regional Health Forum 16(1), 23–28. In this paper, the author discusses the models of care giving, available policies, programmes and legislation related to the elderly in Myanmar. The author points out people’s preferences for familial care over institutional care for their elders, and the need for comprehensive geriatric services comprising home visits, outreach activities, outpatient care, inpatient care and long-stay rehabilitation services. The paper also discusses the legislative measures, policies, initiatives and programmes undertaken in Myanmar. The Constitution of Myanmar has made provisions to make the state responsible for the care of mothers and children, orphans, children of fallen defense services personnel, the aged and disabled people. They have formulated a National Policy on Ageing, which is awaiting approval. There is also a WHO-supported Health Care for Elderly program that has been implemented. The general objective of the programme is to promote health among the elderly in Myanmar and to increase the accessibility of geriatric care services. An important part of the programme is establishing “Wednesday geriatric clinics” in project areas including the rural health centres. The programme aims to increase awareness about the issues of ageing and will carry out research on these issues in rural and urban areas. The programme was developed in collaboration among various local and international NGOs. The author also discusses the social care work done in the country by various agencies and proposes action plans for the future, which include awareness programmes with culturally appropriate messages aimed at lifelong healthy lifestyles, health promotion and preventive approaches, an age-oriented approach in policy development, protective measures for the elderly in disaster situations, more efficient and age-friendly health systems, and social and financial security.

61
Htet, S., Alam, K., & Mahal, A. (2014). Economic burden of chronic conditions among households in Myanmar: The case of angina and asthma. Health policy and planning, 30:1173–1183. This study examines the household-level economic burden of two chronic diseases, angina and asthma, using household survey data from the World Health Survey (WHS). The study found that household out-of-pocket expenditure significantly increased medical impoverishment. Asthma-affected households were 4 to 8 per cent more likely to report medical impoverishment due to out-of-pocket expenses, relative to angina-affected households. Households mainly rely on borrowing and asset sales to finance healthcare.
Knodel, J. and Nguyen, M. D. (2015). Grandparents and grandchildren: care and support in Myanmar, Thailand and Vietnam, Ageing and Society, Vol. 35, No. 9, pp.1960–1988.
The paper analyses grandparents’ and grandchildren’s care and support in Myanmar, Thailand and Vietnam. The study found that three-fourths of older persons in Myanmar live with at least one child. At the same time, the proportion of older persons that have at least one child living away from them is highest in Thailand and lowest in Myanmar. Similarly, a higher proportion of older persons in Thailand live only with grandchildren, as compared to older persons in Myanmar and Vietnam. This is because Thailand has achieved advanced economic development, which generates greater employment opportunities for young people outside their parent’s locality, stimulating migration from their place of origin. The older people in Thailand are also more than twice as likely as those in Myanmar to be providing care to grandchildren; this is especially the case for women and those in rural areas. Most grandparents consider that providing care is not a serious burden. Moreover, grandparental care is not always uni-directional: grandchildren also contribute to household material support and help with household chores.
Knodel, John (2014). The situation of older persons in Myanmar: Results from the 2012 Survey of Older Persons. HelpAge International. The report used survey data from 4080 persons aged 60 and above in Myanmar and focused on the social characteristics of older people, economic activities and income, material wellbeing, living arrangements, family support and exchanges, and health. Only about half of older persons were fully literate, with women particularly likely to lack literacy. There was a general lack of education and literacy, and hence a reduced ability to access information, including health information, among the older people in Myanmar. As income from work declines, children are the main sources of material support for about 60 per cent of older people. The study also revealed that older people in Myanmar typically live in low income households. Almost 10 per cent reported that their household had a monthly income of no more than 25,000 kyat, or less than US$ 3 per day (at current rates) and just over 60 per cent reported that their household income was no more than US$ 9 per day. Only a little more than half the older people felt that their income was regularly adequate to meet their daily needs. This study also shows that one third of older people have good health condition. Poor health increases from 17 per cent to over 30 per cent between the 60 to 64 age group and those 80 years and above. Two fifths of older people reported that they had experienced symptoms of joint pain and dizziness during the preceding month. Other commonly reported health problems were feeling weak, coughing, headache, hearing problems, and back or hip pain. Among those

62
who experienced illness, nearly 95 per cent had received treatment. The most common source of treatment was a private clinic or hospital.
Lönnroth, K., Aung, T., Maung, W., Kluge, H., & Uplekar, M. (2007). Social franchising of TB care through private GPs in Myanmar: An assessment of treatment results, access, equity, and financial protection. Health Policy and Planning, 22(3), 156–166. This study analyses the quality of treatment under the social franchising of tuberculosis (TB) services in Myanmar. The study found that highly subsidised TB care delivered through a social franchise scheme in the private sector in Myanmar helped to reach poor people with quality services, while partly protecting them from high health care expenditure.
Mahn, M., Maung, C., ShweOo, E. K., Smith, L., Lee, C. I., Whichard, E. & Lee, T. J. (2008). Multi-level partnerships to promote health services among internally displaced in eastern Burma. Global Public Health, 3(2), 165–186. The study highlights the importance of local-global partnerships between indigenous and international participants in providing health services to internally displaced people in the eastern part of the country, where traditional humanitarian models are unable to assist people caught in war zones. The authors discuss such indigenous organisations as the Back-Pack Health Worker Team (BPHWT) that provides widespread health care to internally displaced people and war-affected populations in the black zones, backed by regional and international partners providing support with technical assistance, training, resources, and advocacy. Given the success of the locally-driven health care providers, the authors stress that these organisations should be prioritised for international policy and investment to reach out not only to internally displaced people, but also to other war-torn areas around the world.
Myanmar Ministry of Health (2014). Health in Myanmar. The Ministry of Health is the major provider of comprehensive health care in Myanmar. The country has a pluralistic mix of public and private systems in organising, financing and provision of care. The Department of Health is one of the seven departments under the Ministry of Health, which provides comprehensive health care throughout the country including to remote and hard to access areas. Along with this, some ministries provide health care for their employees and their families, including the Ministries of Defense, Mines, Industry, Energy and so on.
Health care providers can be categorised into three groups: government, private for-profit, and private nonprofit. The private for-profit sector has been generally providing ambulatory care and in certain larger cities has ventured into institutional care. Private nonprofit care has been run by community-based and religious-based organisations. Private sector institutions have been regulated by a private health care services law. Medical associations and their branches provide a link between these institutions and their counterparts in the public sector. Further, a unique and important feature of the health system in Myanmar is the existence of traditional medicine.
A series of national health plans based on primary health care services has been developed and implemented with the aim of “health for all”. Along with People’s health plans, starting from 1978, national health plans were formulated and implemented by the ministry. Considering the rapid changes in demographic, epidemiological, and economic trends, the Myanmar Health Vision 2000–2001 to 2030–2031 was proposed.

63
To promote active and healthy ageing, the Ministry of Health implemented the elderly care project. Initiated in 1992–93 in six townships, the project has expanded into 4 to 6 additional townships each year. At the end of 2013, Wednesday clinics had been established in township and station hospitals and rural health centers in 161 townships. The elderly health care programme aims to provide 20 per cent of the ambulatory care for the elderly with geriatric clinic services. It encourages home based geriatric care through families, health volunteers and NGOs, so training of these personnel is a major activity of this programme.
Nishino, Y., & Koehler, G. (2011). Social protection in Myanmar: Making the case for holistic policy reform. IDS Working Papers No. 386, 1–27. This study shows that Myanmar has been performing poorly on human development, with especially high child and maternal mortality rates, issues of malnutrition, income poverty and unemployment. The formal social security system covers only 1 per cent of the population. With respect to old age pensions, the social security system covers only government employees, while there is no mechanism to ensure income transfers to the aged outside of the system. Out-of-pocket payments comprise 87 per cent of the total cost of national health expenditures. The cost of healthcare can push people into poverty. Therefore, the country needs to improve its formal social security policy.
Oo, M. Y., Punpuing, S. and Chamchan, C. (2015). Factors affecting quality of life of older people in Taungu township, Bago region, Myanmar. Journal Health Research, Vol. 29, No. 4, pp. 235–42. This paper analyses the factors associated with quality of life for older people in Bago region of Myanmar. The authors found that quality of life of older persons is significantly and positively associated with individual income. Older persons with higher individual income are more likely to be satisfied with their psychological status than those with less or no income. Further, older people who are currently working and not drinking alcohol have better physical health status than their counterparts. The older people who do not drink alcohol are free from disease, do not need medical treatment, and have enough energy to carry out their daily chores. Older people living with their spouses, family members or relatives have a higher quality of life than those who live alone. Living with family members or a spouse means there is someone who can take care of the older person and support physical, psychological, and social needs.
Parmar, P. K., Benjamin-Chung, J., Smith, L. S., Htoo, S. N., Laeng, S., Lwin, A. & Lee, T. (2014). Health and human rights in eastern Myanmar prior to political transition: A population-based assessment using multi-staged household cluster sampling. BMC International Health and Human Rights, 14(1), 1. Set in the context of Myanmar receiving development assistance and humanitarian assistance after the democratic election in 2010, the study contributes in providing baseline evidence from conflict-ridden eastern Myanmar to understand health and human rights conditions by conducting a large population based survey just before the transition. The survey found that eastern Myanmar experienced higher rates of diseases than reported at the national level. Over one third of the households reported at least one human rights violation from the preceding year.
Risso-Gill, I., McKee, M., Coker, R., Piot, P., & Legido-Quigley, H. (2013). Health system strengthening in Myanmar during political reforms: Perspectives from international agencies. Health Policy and Planning, 29:466–474.

64
This study analyses how international aid agencies are working to strengthen health systems in Myanmar after political reform. International aid agencies reported challenges in engaging with the government, reflecting the disharmony between actors, economic sanctions and barriers to service delivery due to health system weaknesses and bureaucracy. Weaknesses included human resources, data and medical products/infrastructure and logistical challenges.
Saw, Y. M., Win, K. L., Shiao, L. W., Thandar, M. M., Amiya, R. M., Shibanuma, A., ... & Jimba, M. (2013). Taking stock of Myanmar's progress toward the health-related Millennium Development Goals: Current roadblocks, paths ahead. International Journal of Equity Health, 12, 78. The study examines the progress of Myanmar on three under-examined health related MDGs (MDGs 4, 5, and 6). The study with its limited data found that progress is off track in terms of maternal and child health care (MDGs 4 and 5) and there has been some achievement on targets on HIV/AIDS, malaria and tuberculosis (MDG 6). The authors suggest greater investment and commitment in health systems order to move further with the post-2015 development agenda, while taking on board World Health Organization and other global development partners who will provide greater development assistance.
Low, S. et al. (2014). Human resources for health: Task shifting to promote basic health service delivery among internally displaced people in ethnic health program service areas in eastern Burma/Myanmar. Global Health Action, 86–95. This study examines how existing healthcare resources reach the vulnerable population in eastern Myanmar. The authors found that, although the skilled medical professionals are insufficient, ethnic health organisations and community-based organisations have been serving the population through less specialised health workers. Clinics and mobile teams work in partnership, focusing on primary care with some aspects of secondary care.
Spoorenberg, T. (2013). Demographic changes in Myanmar since 1983: An examination of official data. Population and Development Review, Vol. 39, No. 2, pp. 309–324. The paper investigates the recent demographic changes in Myanmar using the 1983 census and the 1991 Myanmar population changes and fertility survey data. Since census data has not been available from 1983 onwards, the population figure for the country is based on official population projections. The official total population of Myanmar reached 59.8 million in 2010 from 35.3 million in 1983. Fertility has declined from a level of 4.5 children per woman in the 1980s to replacement level in the decade 2000 to 2010. Under-five mortality fell from a level of 180 deaths per thousand in the 1970s to about 50 deaths per thousand in the 2000s. Life expectancy at birth increased by ten years for both sexes between 1983 and 2010: from 53.8 years to 63.9 years for men and from 58.5 years to 67.7 years for women.
Teerawichitchainan, B. and Knodel, J. (2016). Long-term care needs in the context of poverty and population aging: The case of older persons in Myanmar. Population Studies Center Research Report 16–853, University of Michigan. The paper examines the prevalence of physical difficulties, the likelihood of receiving regular assistance in daily living, and unmet needs among older persons in Myanmar, using the Myanmar Aging Survey 2012. The authors found that female and urban older

65
persons have a higher prevalence of physical difficulties compared to male and rural older persons. Moreover, nearly 64 per cent of older persons receive assistance in daily activities. Children are usually the primary care providers, and daughters are the main caregivers rather than sons. The study shows that it is extremely rare in Myanmar for non-family members such as friends, neighbours, or domestic workers to be the main provider of care for the elderly. The study also indicates that older persons living alone are more likely to experience unmet need for care compare to those who co-reside with children and spouse. The probability of unmet need for care significantly increases with increasing physical difficulties. Further, the study found that those whose primary caregiver is a son are far more likely to report inadequate care compared to those who have a daughter as caretaker.
Teerawichitchainan, B., Pothisiri, W. and Long, G.T. (2015). How do living arrangements and intergenerational support matter for psychological health of elderly parents? Evidence from Myanmar, Vietnam, and Thailand. Social Science & Medicine, 136, pp.106–116. The paper examines how living arrangements and intergenerational exchanges of financial and emotional support are associated with older persons’ psychological health in Myanmar, Vietnam and Thailand. The authors found that older persons in Myanmar are more likely to live with at least one child, as compared to older persons in Vietnam and Thailand. As compared to isolated living arrangements, co-residence with a child has a significant and positive impact on the psychological wellbeing of older persons in the three countries. Living with a married son significantly improves the psychological wellbeing of older persons in Vietnam, while living with a daughter brings greater benefits to older persons in Thailand and Myanmar. This is because daughters are emotionally closer to parents and often have more skill in providing personal care for elderly parents. Moreover, financial support and physical visits from non-resident children also significantly improve the mental health of older persons in these three countries.
World Health Organization (2014). World Health Organization country cooperation strategies at a glance - Myanmar. This report reviews the health situation, health policies and health system, cooperation for health, and the WHO country cooperation strategic agenda for 2013 to 2017. The report notes the health achievements and challenges facing Myanmar, particularly in terms of the Millennium Development Goals. Various initiatives and strategies drawn up to meet the future health challenges are also reviewed, such as the ”Myanmar Health Vision 2030”, the National Health Plan 2011–2016, the Universal Health Coverage strategy, and the Nay Pyi Taw Accord. The report states the five strategic priorities and main focus areas for WHO cooperation. The five strategic priorities were: (1) strengthening the health system, (2) enhancing the achievement of communicable disease control targets, (3) controlling the growth of non-communicable diseases burden, (4) promoting health throughout the life course, and (5) strengthening capacity for emergency risk management and surveillance systems against various health threats.
WHO (2014). The Republic of the Union of Myanmar: Health system review. Health Systems in Transition (HiT), Vol.4 No. 3, WHO Press (on behalf of the Asia Pacific Observatory on Health Systems and Policies).

66
The report provides a detailed description of the health system and the reform and policy initiatives that are either in progress or under development in Myanmar. The comprehensive report provides insights about the organisation, financing and delivery of health services; the institutional framework, process, content, and implementation of health care reform programmes; and an overall assessment of the healthcare system highlighting challenges and areas that require improvement.
The report notes that the total expenditure on health in Myanmar is the lowest among the countries of the WHO South-East Asia and Western Pacific Regions. It averaged about 2 per cent of GDP between 2000–11. The government’s share in this constitutes just 13.6 per cent (in 2011), hence the bulk of the expenditure burden is met through out-of-pocket (OOP) expenditure of households, that is, 79.3 per cent of total expenditure. Donors contribute the remaining 7 per cent.
The Ministry of Health is the main player in the health arena, adopting the dual roles of a governing agency as well as a provider of health care. Both public and private health systems exist in Myanmar and a process of decentralisation in the provision of healthcare is underway, albeit with some challenges. On average there are 0.6 hospital beds per 1000 population in Myanmar in 2010. This is very low compared to Timor Leste, Nepal, Vietnam and Thailand, which have more than 2 hospital beds per 1000 population.
Public health services are delivered to communities through RHCs and sub-RHCs. As 70 per cent of the country’s population resides in rural areas, the township-level health system serves as the backbone of health care provision in Myanmar. A major portion of the public health service delivery is through a primary healthcare (PHC) approach. However, most of the specialised services like ambulatory and emergency medical care only exist in big cities. Although many private pharmacies and drug stores have come up, they only cater to those who can afford them. Public provision of medicines is still plagued by insufficient supply.
Several laws emerged between 1988 and 2013 aimed at protecting and promoting health, improving safety standards, and the quality of products and professionals. Unfortunately, enforcement and regulation is still very weak and needs strengthening for impact. The health development efforts in Myanmar need to focus especially on addressing failed reforms and advancing universal health coverage. Some of the main obstacles are social health protection for the poor, low investment in rural health services, low level of government investment, the transfer of financial burden to households and incessant dependence on fluctuating foreign aid.
Zaw, P. P. T., Htoo, T. S., Pham, N. M., & Eggleston, K. (2015). Disparities in health and health care in Myanmar. Lancet (London, England), 386(18), 2053. The article highlights the disparities in health and health care in Myanmar as it undergoes economic and political transformation from a long civil war to peace and democratisation. In terms of health outcomes, Myanmar is the worst in South Asia with huge regional disparities. The Ministry of Health has goals of achieving Universal Health Coverage by 2030, and as a result, government expenditure in healthcare has increased 8.7 times between 2011 and 2015. However, out-of-pocket expenditure in Myanmar is still one of the highest globally at 81 per cent. The authors stress the need for professional and innovative leadership and policies that will ensure equitable distribution of resources and cater to the needs of most vulnerable.

HelpAge International helps older people claim their rights, challenge discrimination and overcome poverty, so that they can lead dignified, secure, active and healthy lives.
HelpAge International, Myanmar Country Office No 25/A-1, New University Avenue Road, Saya San Ward, Bahan Township, Yangon, Myanmar Tel: +951 555351 Fax: +951 555351 Ext: 202 www.helpage.org www.ageingasia.org
Publication ID: EAPRDC0051