Embed Size (px)
Citation preview

Study on business-related services Main report Client: European Commission, DG Enterprise and Industry
Rotterdam, 12 December 2012


Study on business-related services Main report
Client: European Commission, DG Enterprise and Industry Nora Plaisier Gert-Jan Linders Erik Canton Rotterdam, 12 December 2012

2
SJ-M/GJL FN97638Rep
About Ecorys
At Ecorys we aim to deliver real benefit to society through the work we do. We offer research, consultancy and project management, specialising in economic, social and spatial development. Focusing on complex market, policy and management issues we provide our clients in the public, private and not-for-profit sectors worldwide with a unique perspective and high-value solutions. Ecorys’ remarkable history spans more than 80 years. Our expertise covers economy and competitiveness; regions, cities and real estate; energy and water; transport and mobility; social policy, education, health and governance. We value our independence, integrity and partnerships. Our staff are dedicated experts from academia and consultancy, who share best practices both within our company and with our partners internationally. Ecorys Netherlands has an active CSR policy and is ISO14001 certified (the international standard for environmental management systems). Our sustainability goals translate into our company policy and practical measures for people, planet and profit, such as using a 100% green electricity tariff, purchasing carbon offsets for all our flights, incentivising staff to use public transport and printing on FSC or PEFC certified paper. Our actions have reduced our carbon footprint by an estimated 80% since 2007. ECORYS Nederland BV Watermanweg 44 3067 GG Rotterdam P.O. Box 4175 3006 AD Rotterdam The Netherlands T +31 (0)10 453 88 00 F +31 (0)10 453 07 68 E [email protected] Registration no. 24316726 W www.ecorys.nl
Table of contents
3
Study on business-related services
Preface 5
Summary 7
1 Introduction 11
2 Services in the EU economy: some key issues 13 2.1 Business services in the EU economy: overview of the sector 13
Industry definition 13 Industry overview 13 Importance of business services in the sector structure of the EU economy 18
2.2 Productivity in business services 19 2.3 Interaction with downstream sectors 22
Outsourcing 22 Co-production 23 Knowledge spill-overs 24
2.4 Information asymmetry and the role of standards 24 Current status of standards development 25 The role of service standards 26 Standardization versus customization in services 27
2.5 Selection of sectors for detailed analysis 27
3 Main findings on advertising and market research 31 3.1 Sector overview 31 3.2 Competitive position 31 3.3 Market conditions, downstream relations and business response 31 3.4 Framework and regulatory conditions 32 3.5 SWOT analysis 34
4 Main findings on design 35 4.1 Sector overview 35 4.2 Competitive position 35 4.3 Downstream relations and market conditions 35 4.4 Framework and regulatory conditions 36 4.5 SWOT analysis 37
5 Main findings on facility management 39 5.1 Sector overview: industrial cleaning 39 5.2 Competitive position of the industrial cleaning sector 39 5.3 Downstream relations and market conditions of the industrial cleaning sector 40 5.4 Framework and regulatory conditions for the cleaning sector 40 5.5 SWOT analysis for the cleaning sector 41 5.6 Sector overview for private security services 42 5.7 Competitive position of private security services 43 5.8 Downstream relations and market conditions for private security services 43 5.9 Framework and regulatory conditions for private security services 44
4
Study on business-related services
5.10 SWOT analysis for private security services 45
6 Main findings on technical consulting 47 6.1 Sector overview 47 6.2 Competitive position 47 6.3 Downstream relations and market conditions 48 6.4 Framework and regulatory conditions 48 6.5 SWOT analysis 50
7 SWOT analysis of business services: a synthesis of the sector studies 51 7.1 Strengths 51 7.2 Weaknesses 51 7.3 Opportunities 52 7.4 Threats 53
8 Market failures relevant to business services 55 8.1 Market structure- existence of entry and exit barriers? 55 8.2 Asymmetric information 57 8.3 Spill-over effects 59
9 Policy recommendations 61 9.1 Reducing information asymmetry in the interaction with the client 61 9.2 Enhancing innovation and knowledge spill-overs 62 9.3 Addressing entry and exit barriers 65
References 69

5
Study on business-related services
Preface
This report presents the results of the study on business-related services, which is carried out by Ecorys for the European Commission (DG Enterprise) under the framework contract for Sector Competitiveness Studies (SCS).The project started in September 2011 with data analysis and a literature review, the results of which were presented in the interim report in January 2012. In addition, four case studies were conduced by the following experts: Gert-Jan Linders, Lars Meindert and Susan Warmerdam (Ecorys) conducted the study on Advertising and Market research. Isabelle de Voldere (IDEA) was leading the study on design services, Paul Baker (Ecorys) the study on Facility Management (industrial cleaning and private security services), and Benita Kidmose Rytz (DTI) the study on technical consulting. This report contains a summary of the literature and case studies, provides a synthesis of the strengths, weaknesses, opportunities and threats, identifies market failures and formulates policy recommendations for business services. We would like to thank the interviewees for their co-operation in this study, and Henk Kox (CPB) for constructive feedback on draft versions of this report. We also want to thank officials from the European Commission, and in particular Peder Christensen, Chris Allen and Jerneja Jug, for their guidance and feedback during all stages of the project. Erik Canton Teamleader


7
Study on business-related services
Summary
Background and objectives Over the last few decades, the EU has become a “service economy” as service sectors have grown faster than manufacturing sectors, and services now account for some 70 percent of the EU economy. This also implies that the performance of the EU economy will largely depend on the performance of the service sectors. In this report we concentrate on an important segment of the service sectors, namely business services. The business service sector currently accounts for almost 2000 billion euro turnover and 24 million people are directly employed in the sector in a total of more than 5 million enterprises. Several studies have shown that the level of productivity in business services is substantially below that of the U.S., explaining a large part of the productivity gap between the EU and the U.S. at the macroeconomic level. The question then comes to the fore what is behind this malfunctioning of EU business services, and what can be done at EU and national policy levels to improve its performance. We focus in particular on four business to business service sectors: 1) advertising and market research; 2) design; 3) facility management; and 4) technical consulting. The study should provide a comprehensive analysis of the strategic issues for each of the selected service sectors and explore strategies to respond to the challenges. We make policy recommendations both for the individual sectors and across sectors. Key issues The vast majority of enterprises in business services are SMEs, with strong emphasis on the micro and small enterprise segments. The medium sized category is underrepresented in the business services sector. Productivity performance of business services over time is lagging behind compared to manufacturing. This malfunctioning of business service sectors may also affect the performance of downstream sectors, as the importance of business services in value chains of manufacturing and service industries has grown rapidly since the last decade of the previous century. The increased demand for specialized knowledge inputs in manufacturing, combined with outsourcing of parts of these services, implies that performance of manufacturing and service industries in the EU have become more interdependent. About 12% of intermediate consumption in manufacturing is accounted for by business services. Three forms of interactions with downstream sectors are of particular importance: (1) outsourcing, (2) co-production, and (3) knowledge spill-overs. These interactions can co-exist, and are not mutually exclusive. With regard to outsourcing it is important to distinguish between two very different types of outsourcing: outsourcing of low-skilled activities versus outsourcing of high-skilled activities. Outsourcing of the first type of activities is driven almost exclusively by cost considerations, whereas outsourcing of high-skilled activities is often influenced by skills considerations as well. In knowledge intensive sectors companies tend to outsource those specialised (and often complex in nature) services for which they lack the required expertise in-house or for which no full time position within the company can be created. The production of services often requires interaction between client and provider. This is referred to as co-production. Hence, service providers need clients with sufficient “absorptive capacity”

8
Study on business-related services
(knowledge, capacity and dedicated resources and effort) to be productive and provide effective services. Clients need to find service providers that will be willing and able to engage in effective co-production. Knowledge spill-overs yield economic benefits for client firms of business service sectors. Particularly for knowledge intensive and creative services, co-production of service solutions by service provider and client involves knowledge transfers. This can lead to innovation in client sectors. We summarise in this main report our findings from the four in-depth sector studies on advertising and market research, design, facility management and technical consulting and provide a synthesis of these sectors in terms of their strengths, weaknesses, opportunities and threats (SWOT). Common strengths of the business service sectors is that they have been able to effectively respond to their clients’ needs. Increased multidisciplinarity in their service provision allows business service providers to interact with the client at multiple stages of the value chain. Business service firms often play a role in their clients’ innovation. The market structure, and in particular the “missing middle”, is considered a weakness of the business service sector. For a variety of reasons, micro and small companies show limited growth. At the same time, there is increased consolidation, concentration and scale enlargement, which discourages competition. Some services are particularly vulnerable to business cycle fluctuations. A number of developments provide opportunities for business service sectors. The economic downturn may cause clients to seek cost savings from outsourcing of certain services, and especially in the New Member States there seems to be scope for further expansion due to this outsourcing. Technological developments, further uptake of ICT and social media, and the shift to more sustainable modes of production opens new markets and creates opportunities for innovative firms. Threats, or better called challenges, mainly refer to the hard economic situation, which makes it for example more difficult to get access to finance, which is needed to be able to innovate. Some business service sectors are affected by the fact that the European industrial base is declining, and production activities are relocated outside Europe. Especially in engineering consulting, skill shortages are creating bottlenecks to the expansion of business activities. Market failures in business service sectors Next we address the issues identified in the sector studies in more detail to investigate whether certain issues are related to market failure, as market failure can provide a reason for government policy intervention. In particular we look at: (1) market structure, (2) asymmetric information, and (3) spill-overs. Regarding market structure, we find that all four business service sectors show a prevalence of micro and small enterprises, including a large number of self-employed, and a limited number of large players. On the one hand it can be argued that such a market structure is the outcome of market segmentation, in the sense that the small and large companies serve different markets and do not directly compete with each other, and related transaction costs. On the other hand, this phenomenon of the missing middle may be worrying, as recent research provides indications that small companies in business services witness lower productivity performance. Market failures related to imperfect information and the specific characteristics of business services as experience

9
Study on business-related services
goods may prevent small companies from growing to medium-sized and large companies. Market segmentation could diminish when small and large companies would work together more intensively. This improves access to larger markets for small firms. Asymmetric information on the value of the delivered service can make clients hesitant to buy these services from business service sectors. This has to do with the experience good character mentioned earlier (the value of the service becomes known only after delivery to the client), but also with the complex nature of the service which require a certain in-house knowledge base in the client company in order to be able to effectively engage in co-production of the requested service. Thirdly, knowledge intensive business services contribute to the innovation potential of their clients and the exchange of knowledge often takes place beyond the usual market transactions and can thus be labelled as knowledge spill-overs. The “owner” of the knowledge cannot appropriate the full benefits of his or her investment to acquire or develop the knowledge, which may lead to under-investment in innovation from a social viewpoint. This introduces the issue of intellectual property rights, and how these rights should be protected by the business service providers. We notice that the IPR issue becomes particularly complex in environments where production of the service is the outcome of complex interactions between multiple actors (co-production with the client, cooperation with academic partners, insights from other disciplines etc.). Policy recommendations The policy recommendations in our study follow naturally from our observations regarding market failures. Information asymmetry in the interaction with the client can, in principle, be reduced by using standards. Such standards in business services are typically more oriented towards process (e.g. ISO standards regarding process quality in market research) and input (such as minimum standards on labour qualifications of staff), as outputs are mostly intangible and often tailor-made. Next to standards there are other avenues to reduce information asymmetry and increase transparency in business services, for example websites with client rating of services. Innovation in business services can be promoted along various lines, including through supplying labour with the right skills (certainly in the area of science, mathematic and technological skills), fostering science-industry collaborations, providing the right incentive structures for cooperation with third parties, and promoting innovative solutions in procurement. Addressing entry and exit barriers will help micro and small companies in their development to medium-sized and large companies. Implementation of the Small Business Act principles will help to address some of the entry or further growth barriers of small companies. Another factor that may foster growth is to increase awareness in client sectors of the added value and innovation business services can bring. One reason why client firms may undervalue business services is lack of absorptive capacity.


11
Study on business-related services
1 Introduction
Background Over the last few decades, the EU has become a “service economy” as service sectors have grown faster than manufacturing sectors, and services now account for some 70 percent of the EU economy. This also implies that the performance of the EU economy will largely depend on the performance of the service sectors. This is not only because of the large share of services in the economy, but also because of indirect effects: many companies in the manufacturing sector rely on external services providers for both routine services and specialist expertise (business services). A better functioning of business services industries and markets would therefore also benefit other sectors and ultimately consumers. This study analyses four business to business service sectors: 1) advertising and market research; 2) design; 3) facility management; and 4) technical consulting. Objectives of the study The study should provide a comprehensive analysis of the strategic issues for each of the selected service sectors and explore strategies to respond to the challenges. It should make policy recommendations both for the individual sectors and across sectors. A key part of the analysis is to examine the relationship between the selected service sectors and some of the most important manufacturing client sectors, to illuminate the main issues related to outsourcing, market fragmentation, internationalisation and innovation in business related services. Structure of the report This report is structured as follows. Chapter 2 looks in more detail at the role of the services sectors in the EU economy and explores some of the key issues. This sets the stage for the remainder of the report. Chapter 3 to 6 summarise the main findings for the selected services sectors: advertising and market research (Chapter 3); design (Chapter 4); facility management (Chapter 5); and technical consulting (Chapter 6). Chapter 7 presents the strategic outlook for the sectors and analyses their strengths, weakness, opportunities and threats (SWOT). Chapter 8 identifies and describes several market failures prevalent in the selected sectors. Finally, Chapter 9 concludes with policy recommendations. The detailed sector studies are available in a separate annex.


13
Study on business-related services
2 Services in the EU economy: some key issues
In the previous chapter we mentioned the importance of the services sectors in the EU economy. In this chapter we elaborate on the role of business services in the EU economy, and we sketch the key issues that will be discussed in greater detail in the remainder of the report.
2.1 Business services in the EU economy: overview of the sector
Industry definition Business services consist of a range of professional services and support services. This includes knowledge-intensive and creative professional services (such as management consultancy, design activities, marketing services and architectural and engineering services) and IT services, but also labour recruitment services and support services such as security services and industrial cleaning activities. To demarcate the activities classified as business services, we start from an operational definition of business services provided by Eurostat as consisting of the activities in NACE revision 1.1 Divisions 72 and 74.1 We will make use of the most recent data for the industry overview, based on NACE revision 2 classification where possible. The correspondence of these two NACE classifications unavoidably leads to some small differences in the operational demarcation of industries in the business services sector, but we stay as close as possible to the demarcation above and include all industries that fall within our definition as far as data are available. Industry overview The business service sector currently accounts for almost 1,500 billion euro turnover and 21 million people are directly employed in the sector at a total of almost 4 million enterprises (see table 2.1 below). Firms from the UK, Germany and France together account for about 56% of total EU turnover in the sector. Average firm size in terms of persons employed in Sweden, Italy and (to a lesser extent) Poland and Spain is smaller than in these three countries. Turnover per person employed is lower in Poland, compared to other countries reported in the table. Table 2.1 Business services: number of enterprises, turnover and number of persons employed (2010)
Number of enterprises (thousands)
Turnover (billion euro) Number of persons employed (thousands)
EU 27** 3,907 1,518 20,695
Germany 392 269 4,026
Spain 357 107 1,800
France 430 248 2,772
Italy* 700 144 2,107
Poland 207 32 862
Sweden 182 54 512
United Kingdom 432 328 3,619 Notes: Business services are defined closely following the operational definition of Eurostat and Kox (2012), as far as NACE rev. 2 correspondence and data availability allow. The activities of head offices are excluded. * Data for Italy are for 2009. ** Data for investigation activities for EU27 is for 2008. Source: Eurostat SBS.
1 See e.g. http://epp.eurostat.ec.europa.eu/portal/page/portal/european_business/special_sbs_topics/business_services
and Chapter 25 of Eurostat (2009) European business — Facts and figures. The business services sector includes among others the five industries that have been selected for detailed sector studies (see section 2.5): private security, industrial cleaning, design services, technical consulting, and advertising and market research. Design activities are somewhat hidden in the NACE revision 1.1 class 74.87 Other business activities n.e.c.
14
Study on business-related services
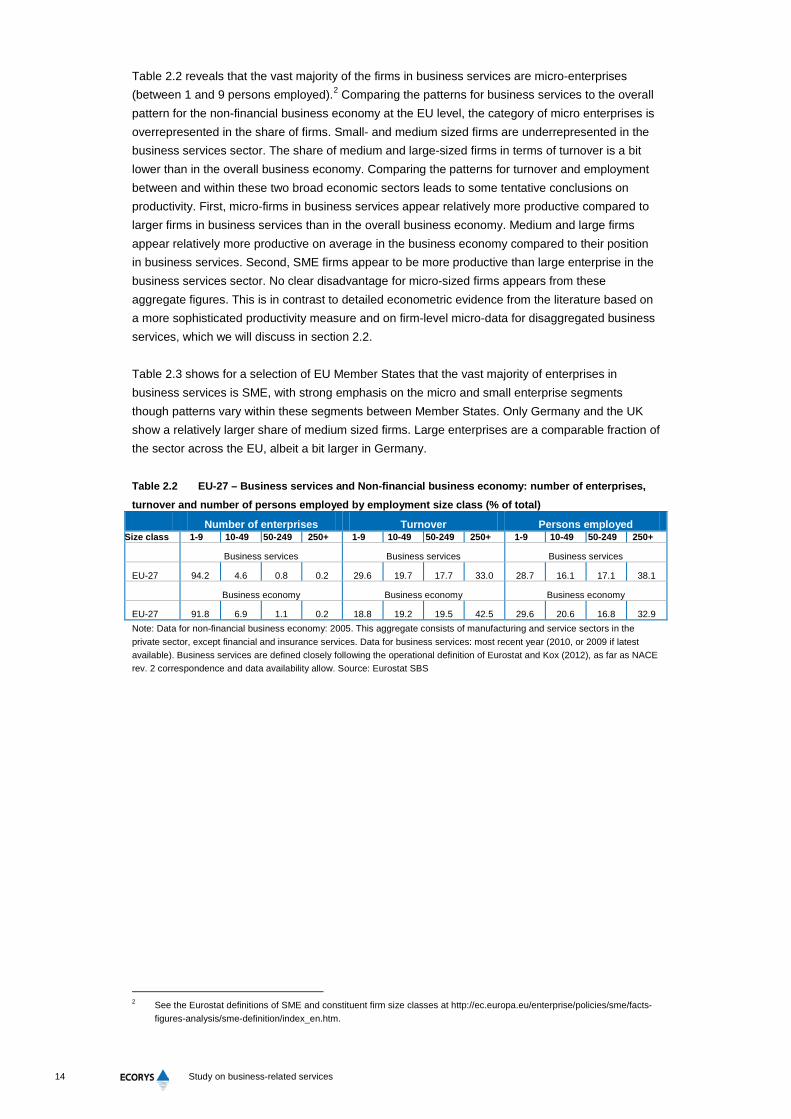
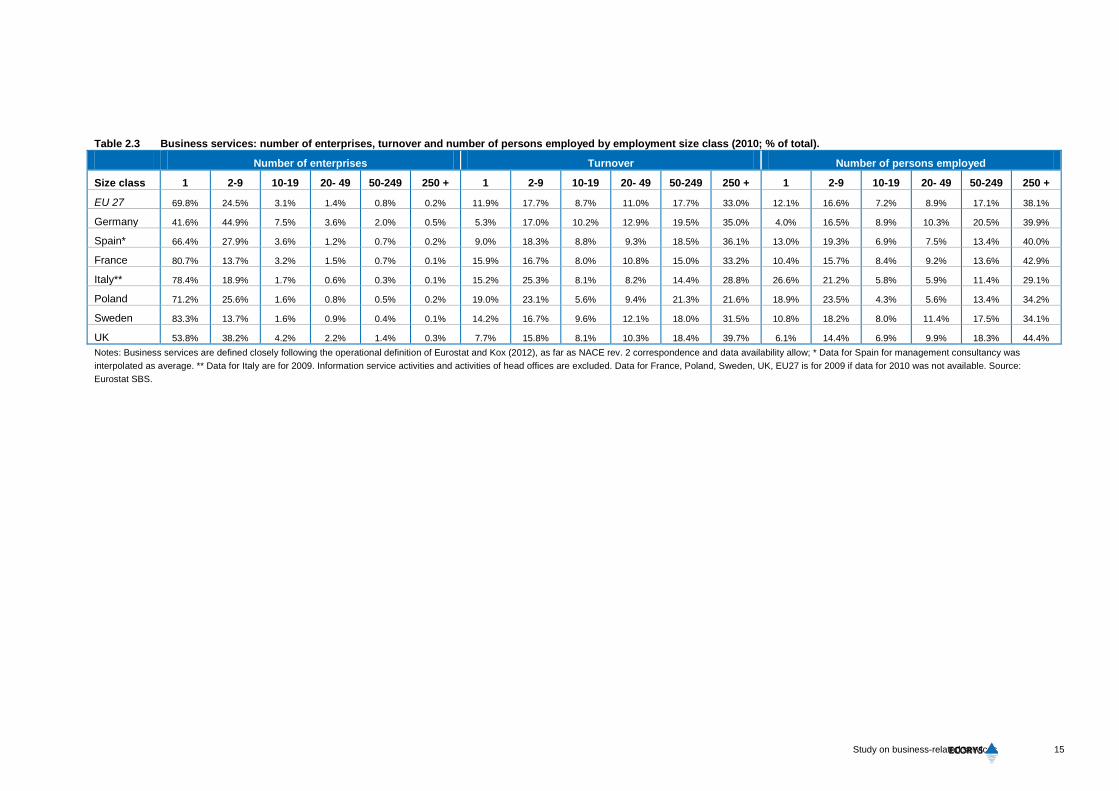
Table 2.2 reveals that the vast majority of the firms in business services are micro-enterprises (between 1 and 9 persons employed).2 Comparing the patterns for business services to the overall pattern for the non-financial business economy at the EU level, the category of micro enterprises is overrepresented in the share of firms. Small- and medium sized firms are underrepresented in the business services sector. The share of medium and large-sized firms in terms of turnover is a bit lower than in the overall business economy. Comparing the patterns for turnover and employment between and within these two broad economic sectors leads to some tentative conclusions on productivity. First, micro-firms in business services appear relatively more productive compared to larger firms in business services than in the overall business economy. Medium and large firms appear relatively more productive on average in the business economy compared to their position in business services. Second, SME firms appear to be more productive than large enterprise in the business services sector. No clear disadvantage for micro-sized firms appears from these aggregate figures. This is in contrast to detailed econometric evidence from the literature based on a more sophisticated productivity measure and on firm-level micro-data for disaggregated business services, which we will discuss in section 2.2. Table 2.3 shows for a selection of EU Member States that the vast majority of enterprises in business services is SME, with strong emphasis on the micro and small enterprise segments though patterns vary within these segments between Member States. Only Germany and the UK show a relatively larger share of medium sized firms. Large enterprises are a comparable fraction of the sector across the EU, albeit a bit larger in Germany. Table 2.2 EU-27 – Business services and Non-financial business economy: number of enterprises,
turnover and number of persons employed by employment size class (% of total)
Number of enterprises Turnover Persons employed Size class 1-9 10-49 50-249 250+ 1-9 10-49 50-249 250+ 1-9 10-49 50-249 250+
Business services Business services Business services
EU-27 94.2 4.6 0.8 0.2 29.6 19.7 17.7 33.0 28.7 16.1 17.1 38.1
Business economy Business economy Business economy
EU-27 91.8 6.9 1.1 0.2 18.8 19.2 19.5 42.5 29.6 20.6 16.8 32.9 Note: Data for non-financial business economy: 2005. This aggregate consists of manufacturing and service sectors in the private sector, except financial and insurance services. Data for business services: most recent year (2010, or 2009 if latest available). Business services are defined closely following the operational definition of Eurostat and Kox (2012), as far as NACE rev. 2 correspondence and data availability allow. Source: Eurostat SBS
2 See the Eurostat definitions of SME and constituent firm size classes at http://ec.europa.eu/enterprise/policies/sme/facts-
figures-analysis/sme-definition/index_en.htm.
15
Study on business-related services
Table 2.3 Business services: number of enterprises, turnover and number of persons employed by employment size class (2010; % of total).
Number of enterprises Turnover Number of persons employed
Size class 1 2-9 10-19 20- 49 50-249 250 + 1 2-9 10-19 20- 49 50-249 250 + 1 2-9 10-19 20- 49 50-249 250 +
EU 27 69.8% 24.5% 3.1% 1.4% 0.8% 0.2% 11.9% 17.7% 8.7% 11.0% 17.7% 33.0% 12.1% 16.6% 7.2% 8.9% 17.1% 38.1%
Germany 41.6% 44.9% 7.5% 3.6% 2.0% 0.5% 5.3% 17.0% 10.2% 12.9% 19.5% 35.0% 4.0% 16.5% 8.9% 10.3% 20.5% 39.9%
Spain* 66.4% 27.9% 3.6% 1.2% 0.7% 0.2% 9.0% 18.3% 8.8% 9.3% 18.5% 36.1% 13.0% 19.3% 6.9% 7.5% 13.4% 40.0%
France 80.7% 13.7% 3.2% 1.5% 0.7% 0.1% 15.9% 16.7% 8.0% 10.8% 15.0% 33.2% 10.4% 15.7% 8.4% 9.2% 13.6% 42.9%
Italy** 78.4% 18.9% 1.7% 0.6% 0.3% 0.1% 15.2% 25.3% 8.1% 8.2% 14.4% 28.8% 26.6% 21.2% 5.8% 5.9% 11.4% 29.1%
Poland 71.2% 25.6% 1.6% 0.8% 0.5% 0.2% 19.0% 23.1% 5.6% 9.4% 21.3% 21.6% 18.9% 23.5% 4.3% 5.6% 13.4% 34.2%
Sweden 83.3% 13.7% 1.6% 0.9% 0.4% 0.1% 14.2% 16.7% 9.6% 12.1% 18.0% 31.5% 10.8% 18.2% 8.0% 11.4% 17.5% 34.1%
UK 53.8% 38.2% 4.2% 2.2% 1.4% 0.3% 7.7% 15.8% 8.1% 10.3% 18.4% 39.7% 6.1% 14.4% 6.9% 9.9% 18.3% 44.4% Notes: Business services are defined closely following the operational definition of Eurostat and Kox (2012), as far as NACE rev. 2 correspondence and data availability allow; * Data for Spain for management consultancy was interpolated as average. ** Data for Italy are for 2009. Information service activities and activities of head offices are excluded. Data for France, Poland, Sweden, UK, EU27 is for 2009 if data for 2010 was not available. Source: Eurostat SBS.


17
Study on business-related services
Productivity performance of the business services sector over time remains a little behind compared to the manufacturing sector. The table 2.4 below shows average productivity growth between 2003 and 2010 in selected business service industries. The sectors in the table formed the focus for sector-specific analysis in this study.3 Table 2.4 Wage adjusted labour productivity: average annual growth rates 2003-2010 (%).
country/sector Manufacturing Advertising Market
research Engineering
activities Private security
Cleaning services
EU 27 0.64 -0.58 -0.24 -0.09 -0.15 0.33
Germany 1.39 -0.88 -0.02 0.23 0.26 0.93
Spain -0.56 -0.93 -1.20 -2.24 -0.28 -0.02
France 0.92 1.92 -0.63 0.08 0.44 -0.21
Italy -2.00 -5.69 0.71 -0.15 -0.18 -0.28
Poland -1.64 8.46 1.83 3.73 0.26 3.14
Sweden 0.95 3.26 3.67 2.48 0.13 -1.07
United
Kingdom 2.44 -0.30 5.54 0.06 -0.90 0.17 Note: Average annual growth rate computed as arithmetic average of year-to-year growth rates. Source: Eurostat SBS.
Figure 2.1 Index of wage adjusted labour productivity by sector: EU-27 (2003 = 100)
Note: EU-27 represents the aggregate group of the 27 countries that form the EU as of 2007. For earlier years, some of these countries were not members of the EU. Source: Eurostat SBS.
Figure 2.1 above presents an overview of the development of labour productivity in the selected business service sectors (design services are not included due to lack of data over time) at the EU-27 level, compared to the manufacturing sector. The overall picture of stagnating productivity growth at the EU level is confirmed. Productivity appears to be pro-cyclical over the recent economic crisis (though with a delay for engineering services). From 2003 onwards, the data do not provide strong evidence for a relative stagnation of the service industries compared to the manufacturing sector.4 Volatility of labour productivity, at least at the level of individual industries,
3 Design services are also one of the business related (sub)-sectors included in this study. Due to lack of data over time, this
sector is not reported in the table on productivity. 4 In the next section of this report, we discuss evidence that productivity growth in business services is lower than for the
rest of the economy in the EU, partly explaining the productivity (growth) gap between the EU and the U.S. economy. This evidence is based on trends over a longer time series and a different measure of productivity, total factor productivity. This productivity measure, unlike our measure of labour productivity, is not affected by changes over time in capita-labour ratios and relative wages, which may lead to somewhat different conclusions.
70
75
80
85
90
95
100
105
110
115
120
2003 2004 2005 2006 2007 2008 2009 2010
Advertising
Architectural andengineering activities
Private security
Cleaning services
Manufacturing
Market research
18
Study on business-related services
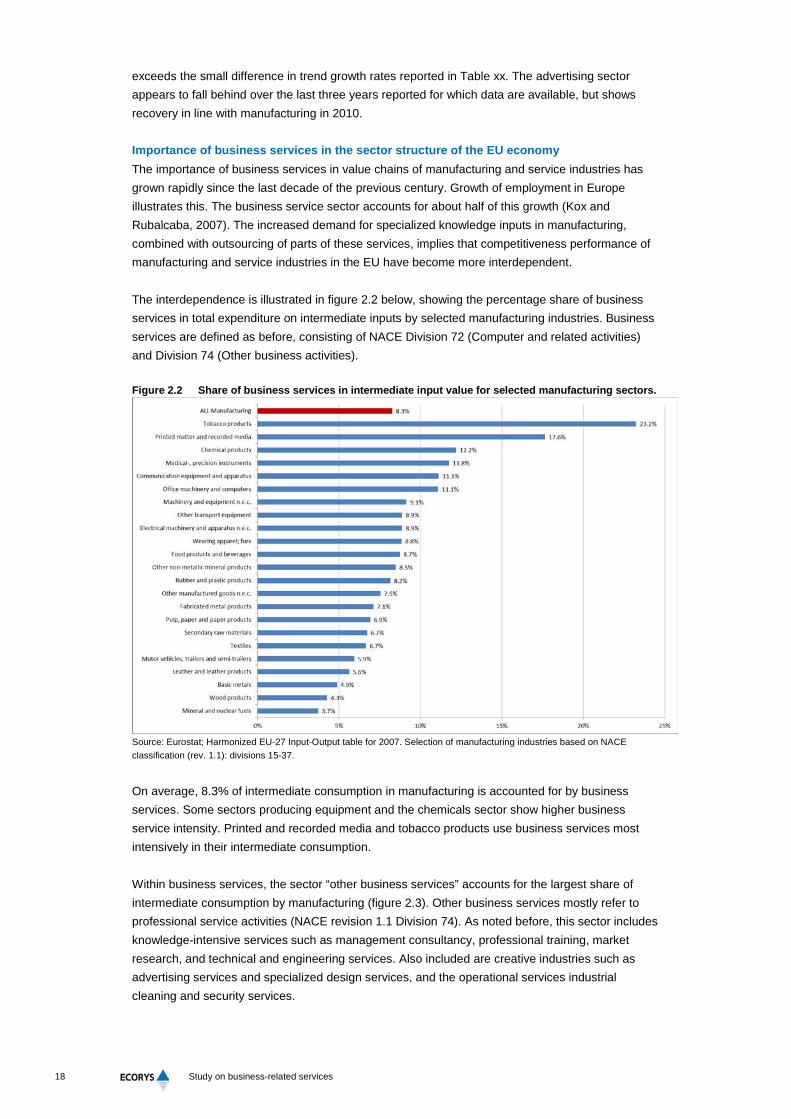
exceeds the small difference in trend growth rates reported in Table xx. The advertising sector appears to fall behind over the last three years reported for which data are available, but shows recovery in line with manufacturing in 2010. Importance of business services in the sector structure of the EU economy The importance of business services in value chains of manufacturing and service industries has grown rapidly since the last decade of the previous century. Growth of employment in Europe illustrates this. The business service sector accounts for about half of this growth (Kox and Rubalcaba, 2007). The increased demand for specialized knowledge inputs in manufacturing, combined with outsourcing of parts of these services, implies that competitiveness performance of manufacturing and service industries in the EU have become more interdependent. The interdependence is illustrated in figure 2.2 below, showing the percentage share of business services in total expenditure on intermediate inputs by selected manufacturing industries. Business services are defined as before, consisting of NACE Division 72 (Computer and related activities) and Division 74 (Other business activities).
Figure 2.2 Share of business services in intermediate input value for selected manufacturing sectors.
Source: Eurostat; Harmonized EU-27 Input-Output table for 2007. Selection of manufacturing industries based on NACE classification (rev. 1.1): divisions 15-37.
On average, 8.3% of intermediate consumption in manufacturing is accounted for by business services. Some sectors producing equipment and the chemicals sector show higher business service intensity. Printed and recorded media and tobacco products use business services most intensively in their intermediate consumption. Within business services, the sector “other business services” accounts for the largest share of intermediate consumption by manufacturing (figure 2.3). Other business services mostly refer to professional service activities (NACE revision 1.1 Division 74). As noted before, this sector includes knowledge-intensive services such as management consultancy, professional training, market research, and technical and engineering services. Also included are creative industries such as advertising services and specialized design services, and the operational services industrial cleaning and security services.

19
Study on business-related services
Figure 2.3 Two main groups of business services in intermediate input value for selected manufacturing sectors (million euro)
Source: Eurostat; Harmonized EU-27 Input-Output table for 2007. Selection of manufacturing industries based on NACE classification (rev. 1.1): divisions 15-37.
2.2 Productivity in business services
The business services sector has grown over the past few decades in terms of output and employment and provides a larger share of intermediate inputs than before. However, productivity growth in the sector is lower than the economy wide average in the EU, and has stagnated relative to the U.S. over the past two decades. Evidence suggests that the level of productivity in business services is substantially below that of the U.S. (see e.g. Inklaar et al. 2008; Kox 2012). The relative performance of business services appears to be particularly relevant for a number of empirical results on productivity performance in market services and downstream client industries that emerge from recent research: • Productivity growth in market services in continental Europe lags behind U.S. growth rates that
have recently accelerated; • Lagging productivity performance in EU services seems to reflect the relative absence of
catching up and a lack of innovation; • Lagging productivity performance in services contributes largely to explain the widening
productivity gap at the macroeconomic level, among other things by impeding productivity growth in ICT-using sectors that make relatively intense use of intermediate services.
A substantial body of recent academic literature has linked the lagging productivity performance in market services sectors (such as retail, transport, post and telecommunications, financial services and business services) to the macroeconomic productivity gap between the EU and the U.S. and its recent apparent widening.5 This reflects a direct effect on productivity, as business services
5 Many of the recent studies make use of the recently developed EU KLEMS database that allows analysis and
decomposition of productivity levels and growth in a variety of service and manufacturing sectors for a set of OECD countries.

20
Study on business-related services
account for a substantial share of value added in the EU, and the indirect effects of business related services on productivity in downstream sectors (see Camacho and Rodriguez 2007). Triplett and Bosworth (2006) report that labour productivity growth rates in most market services have accelerated in the U.S. since the mid-1990s, whereas a similar pattern is not found for continental Europe. Timmer et al. (2011) report that most of the difference in labour productivity growth in services between the EU and the U.S. can be attributed to the performance of distribution services (retail and wholesale, and transport services) and business services. Labour productivity growth can be related to capital deepening (e.g. using more ICT and non-ICT capital goods or human capital per hour worked) and to technological progress (increasing the productive efficiency of combining production factors to produce output). Technological progress here needs to be interpreted broadly to include all ‘hard’ and ‘soft’ factors that can increase efficiency (innovation induced by technical or scientific R&D, changes in the organizational structure, management and work practices). The impact of technological progress on productivity growth is reflected in the literature by the development of multifactor productivity (MFP). Timmer et al. (2010) find that lagging MFP growth is the main source of the difference in labour productivity growth in business services, financial services and distribution services between the U.S. and the EU. Two mechanisms of MFP growth are potentially relevant. First, technological progress can be absorbed by imitation, leading to catch-up to the frontier of innovation. Second, innovation of products, production process and organization can spur productivity growth. The latter form of technological progress becomes more important once an industry or firm is closer to the technology state of the art. For some services, such as retail trade, transport and financial intermediation, the EU countries do not lag far behind the U.S. in terms of MFP, or even exceed U.S. MFP. For business services, however, there is a clear gap between the EU and the U.S. leading technology position. While other Anglo-Saxon economies such as the UK, Canada and Australia, show clear catch-up growth in MFP relative to the U.S., the (continental) EU countries do not make use of this catch-up potential (see Inklaar et al. 2007). As growth in other services sectors also lags behind, the EU appears to experience problems to realize productivity growth both via catching-up and innovation in services sectors. Recent literature points at the likely importance of anticompetitive (i.e. restrictive) regulation and the advent of ICT in a context of deepening globalization to explain the variation in growth performance. Restrictive regulation refers to mostly national regulation that restricts domestic competition and market selection processes and hampers the operation of the Internal Market for services. This varies from direct government involvement in business operation, administrative burdens on start-ups and bankruptcy, legal barriers, antitrust exemptions, labour contract regulations (see Kox, 2012), to required professional qualification of personnel, regulation on legal form and capital ownership of the service provider (European Commission 2011, 2012)6. Direct impacts of capital deepening (in recent years particularly related to ICT capital goods such as software, computers and communication equipment) and education of the workforce do not suffice to explain the difference in MFP growth (e.g. see Inklaar et al. 2008). Yet, the successful incorporation of ICT in production processes via a combination of organizational change and “hard” technological change is an important source for productivity growth. The importance of ICT uptake holds for both catch-up growth (see Conway et al. 2006) and for innovation processes (e.g. Arnold 6 European Commission (2011), Towards a better functioning Single Market for services – building on the results of the
mutual evaluation process of the Services Directive, COM(2011)20 27 January 2011, Brussels; and, European Commission (2012) The economic impact of the Services Directive: A first assessment following implementation, Note for the Economic Policy Committee, DG ECFIN (section Product Market Reforms), Ares(2012)504112, Brussels, as referred to in Kox (2012).

21
Study on business-related services
et al. 2008, 2011), and most for relatively intensive ICT-using industries and services. Restrictive regulation, particularly in intermediate services sectors, raises the cost of doing business and hampers productivity performance both in the services sectors and – e.g. via the input-output linkages discussed in the previous sub-section – in downstream (manufacturing) sectors. Conway et al. (2006) show that weak competition and regulatory burdens reduce productivity growth particularly for countries and sectors that start with relatively low productivity levels and mostly so for sectors that are ICT-using. Barone and Cingano (2011) show that the impact of services regulation on productivity performance is mostly related to regulation in the energy and business services sectors. Arnold et al. (2008) provide evidence that, at the level of individual firms within a sector, restrictive regulation affects primarily the most efficient firms in ICT-using sectors, thus obstructing the diffusion of technology. They reveal that more restrictive regulation of services distorts the allocation of resources towards firms with the highest growth potential and that would be most likely to increase domestic technological standards. Bourlès et al. (2010) stress that restrictive regulation of upstream services reduces access to downward markets (particularly when service inputs are needed that are more difficult to obtain on international markets). Moreover, market power of service providers reduces the incentive for efficiency improvement in client sectors because the profits generated will more likely be partly appropriated by higher prices charged by intermediate service providers. The evidence reported above points at the importance of regulatory conditions and import competition for effective competition and productivity growth in business services, with potentially large implications for economy-wide productivity performance. Recent research by Kox and Van Leeuwen (2012) suggests that the productivity difference between the U.S. and the EU can be traced to the persistence of two types of inefficiencies in the EU business services sector. First, small and very large firms have lower scale efficiency compared to the optimal firm size in the sector. Small firms suffer from high average fixed costs and low specialization due to the scale of output volumes at which they operate. Empirical evidence confirms and shows that scale efficiency increases along with the size of firm, but reaches an optimum; for very large firms, internal transaction costs increase and compensate the decline in average fixed costs. Second, within size classes large differences in production efficiency exist, implying that many firms operate at lower efficiency than the technology frontier in their size class. This form of inefficiency is known under the heading X-inefficiency. Kox (2012) argues that the persistence of scale inefficiency and X-inefficiency implies that dynamic market selection does not function properly. During their life cycle, successful small firms would expand and grow to benefit from economies of scale. Firms that are too large, would be forced to rationalize and reduce their size and market share. Firms that operate below the technology frontier would not be able to cope with competition and suffer from low profitability. In the EU, however, the size class with lowest overall efficiency, the very small firms, represent the vast majority (93%, Kox 2012) of firms in business services. Overall efficiency in the EU business service sectors has stagnated since the late 1990s, as well as average efficiency in most EU countries. This suggests that market segmentation, related to search costs, and lack of transparency of services markets obstructs competitive selection. Large and small firms may serve different markets and competition within the market served by smaller firms may be mostly local. Medium sized firms appear to have the highest overall efficiency, but most small firms do not seem to manage to grow to the medium range. Large firms appear to have a stable position, possibly related to market power. The medium size range, though most sustainable on the basis of market selection, is smaller than expected. This mystery of the missing middle may have important implications for competitiveness of EU business services and their client sectors. As noted by Canoy and Smith (2008, p. 324), the way

22
Study on business-related services
that anticompetitive regulation combines with the specific characteristics of individual service markets “determines to a large extent the economic performance of services”. While, the spectrum between goods and services is gradual and some of their characteristics are becoming more shared, (business) services tend to be more intensely related to issues like asymmetric information and co-production. It is to these characteristics of services and the interaction with client sectors that we turn next.
2.3 Interaction with downstream sectors
Service and manufacturing industries have become more and more interlinked. This party reflects changes in economic structure due to (technology enabled) outsourcing of business services and partly an increased demand for specialized knowledge inputs. Competitiveness of downstream sectors (manufacturing and services) depends on access to a wide variety of well performing business related services (see, e.g., Camacho and Rodriguez, 2007). Performance and effectiveness of these services relies on organization structure (decision to provide in-house or outsource the services), client and service provider capacities to interact in co-production of business related services, and the implications for knowledge creation and spill-overs in service-client interaction. The relevance and implications of these three forms of interrelations in the value chain are briefly discussed below in more detail. Outsourcing partly explains the high growth of employment and value added in business services over the recent past. Co-production emphasizes the important role of business services as inputs that are closely related to core business processes of clients, such as product development and innovation. Knowledge transfer and spill-overs are important channels for creating value added in the supply chain. Outsourcing The main driver of outsourcing activities is cost reduction. Companies with a high-skilled workforce are more likely to outsource low-skilled, labour-intensive services like cleaning. Other factors that are positively related to outsourcing include: • Size of the company: the larger the company and thus the more complex the internal
organisation, the more the company will choose to externalise activities; • High significance of geographical proximity: in sectors where geographical proximity is
important (e.g. courier, security), the presence of good local service providers in the region increases outsourcing;
• Preferences of manufacturing companies for flexibility. Access to a labour force at a global scale favours outsourcing and offshoring activities to countries with low labour cost (for example low-skilled operational services, call centres) for both high-skilled and low-skilled service sectors. Furthermore, globalization of activities through e.g. outsourcing of activities leads to increased diversity of services, like provision of services at 7/7 and 24/24 basis (Ecorys et al. 2008). It is important to distinguish between two very different types of outsourcing: outsourcing of low-skilled activities versus outsourcing of high-skilled activities. Outsourcing of the first type of activities is driven almost exclusively by cost considerations, whereas outsourcing of high-skilled activities often is influenced by skills considerations as well. In knowledge intensive sectors companies tend to outsource those specialized (and often complex in nature) services for which they lack the required expertise in-house. Kox and Rubalcaba (2007) found that in the mid-1990s business service sectors that produce very specialized services have

23
Study on business-related services
gained most from outsourcing activities. This has happened because the very specific activities and the high quality of knowledge needed for the production are the main reasons why client sectors have chosen to outsource these activities. Although relative wages seem to be a less important driver for outsourcing of this type of activities, Merino and Rodriguez (2007) point out that the high wage costs of skilled workers imply that outsourcing the activities instead of in-house production might be more profitable from a cost perspective. As a countervailing force, manufacturing firms have become more service oriented as well due to increased demand for customization by their clients. Before and after sale services are increasingly important for competitiveness. This implies that service activities that are close to the core production process are more likely to remain largely in-house, apart from those services that require highly specialized knowledge (as mentioned before). Co-production Many services, in order to be produced, require interaction between client and provider. Consumption and production processes may coincide (e.g., health or transport services). Production of other services such as cleaning services requires access to the premises of the client. Also for business related services, customer-provider interaction is often a vital element for the productivity of the service provision and for the service to have the intended impact on client performance (see Ecorys et al. 2008). The various forms of interaction needed for services to be effectively provided are grouped under the heading ”co-production of services”. Following studies by Bitner et al. (1997), Bettencourt et al. (2002), and Kuusisto (2008), a typology of co-production is presented in the 2008 study by the Ecorys led consortium. Services that deal with more peripheral business processes and that require little client participation, tend to be more standardized products and can be provided independent of the consumer (such as uniform cleaning services). These services still need the client to give property access to the service provider. Services for which customer input (information, materials) is necessary for effective provision but that are still provided mainly by the service firm usually require moderate interaction. Here, the customer could be seen as co-performing the service as it is involved in some supporting tasks. Examples are freight transport, engineering services and advertising campaigns. These services can be highly specialized (engineering) or more standardized (transport). When interactions between client and service staff are more prominent in the creation of the service, high participation is needed. These services tend to be the most customized and are provided via co-creation or involve co-designing the division of labour (where the client performs some of the supporting and essential service tasks. Examples include marketing campaigns, design services and management consulting. Highly knowledge-intensive or creative services tend to be more customized and more interaction intensive. The importance of co-production has potentially large implications for the structure of business service markets, service procurement and the process of innovation in services and client products. Both service providers and clients derive competitive advantage from selecting partners that match well. Hence, management of co-production is important for both client and provider. Service providers need clients with sufficient “absorptive capacity” (knowledge, capacity and dedicated resources and effort) to be productive and provide effective services. Clients need to find service providers that will be willing and able to engage in effective co-production. Both sides in the service transaction need to deal with information asymmetries and transaction costs. Client and service providers need to be competent and have specific knowledge, and the lack of transparency of this search-and-match process tend to increase market segmentation in business related services (see, e.g., Kox, 2012).

24
Study on business-related services
Solutions to select and manage co-production do not always match (see for example Bettencourt et al. 2002 and Geis 2007); clients may favour competition among providers via framework contract procurement; providers may favour partnership-building to ensure commitment. Yet, reputation signalling and reputation building mechanisms are important for both sides. Knowledge spill-overs Co-production linkages between business related services and client industries are important channels for knowledge transfer. Knowledge intensive and creative business related services contribute to the innovation process of their clients. Nesta (2008), for example, finds that stronger business-to-business linkages with creative industries complement stronger innovation performance of client firms7. Nesta (2010) shows that highly innovative sectors and activities such as R&D services generate spill-overs to other sectors in the economy. Spill-overs result in economic benefits for other firms while the innovative firm is not able to capture the reward for these benefits. Particularly for knowledge intensive and creative services, co-production of service solutions by service provider and client involves knowledge transfers. This can lead to innovation in client sectors. Moreover, spill-overs can occur from scale advantages realized by outsourcing and specialization in business related services. Camacho and Rodriguez (2007) show that intermediate use of business related services is an important source of knowledge diffusion and productivity for their client sectors across the economy. The impact of business services on innovation processes of purchasing firms can be direct. For example, design services and engineering services are used in the process of innovation and advertising agencies offer specialized services in the development of a marketing campaign for new products. The knowledge created in these processes of co-production directly benefits the client in its innovation process. However, not all aspects of this knowledge can be codified and protected. Part of the knowledge, co-produced in innovation, adds to the pool of experience of client and service provider that can be used in subsequent service transactions, potentially with a different client or provider. Knowledge spill-overs outside the service transaction and innovation processes that generated the knowledge are generally not compensated for. This provides a rationale for policy intervention.
2.4 Information asymmetry and the role of standards
Information asymmetry refers to the situation when one party has more or better information than the other. The quality of business services depends on many factors that are difficult to observe or assess before a transaction takes place. Information asymmetry is the reality concerning the capabilities of service providers for a specific assignment and the capacity of clients to absorb the service. Markets for business services, particularly for more specialized and customized knowledge intensive and creative services, are not transparent (see Kox and Rubalcaba 2007). As intangible products that require some degree of client participation in co-production, services are “experience products” and a successful match requires a search for investments from both client and provider. Signals that can indicate quality are important in order to reduce uncertainty in service transactions. Standardization of services – resulting in certification (professional qualifications or association membership), and reputation building (conveyed in project references and long-term network relations) can provide signals to help clients to assess the expected match with service providers (Ecorys et al. 2008). Services that need less intense client participation (e.g. cleaning) are 7 See also WIFO (2011), Innovation and competitiveness of the creative industries. 2011/077/S/WIFO project no: 10209.

25
Study on business-related services
more likely candidates for process standardization. However, more knowledge intensive services also offer a perspective for standardization, when essential parts of the process can be codified into norms of conduct and procedures (e.g., market research). However, even if standardization of (parts of the) production process or service is possible, reputation is an important asset for signalling the quality of the service. The two approaches can be pursued separately, depending on the context, but may also reinforce each other. Certificates of compliance, and industry self-regulation and conformity assessment may reinforce reputation and can be sought after for this purpose. Traditionally, services were believed to be only domestically consumed involving face-to-face interaction between consumer and producer (restaurant or haircut services, see Baumol, 1967). Technological changes altered also the service world. As a result, services acquired the characteristics of goods and have become increasingly tradable (Bhagwati, 1984). Growing importance of services in GDP and their increased tradability have triggered research on various aspects of services. More recently, this includes the service standardization process. Service standardization occurs at national, European and international levels. Standardization bodies such as the Netherlands Standardization Institute (NEN) and the German Institute for Standardization (DIN) are the institutions responsible at the national level. At the European level, organizations like the European Committee for Standardisation (CEN) have been established. Correspondingly, the international standards organisations such as the International Organization for Standardization (ISO), and International Electrotechnical Commission (IEC) serve at the international level. Standardization of services guarantees that they adhere to the same set of design standards. It facilitates the functioning of the single market in the EU by protecting consumers and environment, fostering competitiveness and the innovation process, according to the Annual European standardisation work programme 2012. Moreover, standardization opens the market to small and medium sized enterprises (SME) which account for almost 99% of all enterprises in Europe. Still, the evidence suggests that large companies are more likely to be involved in the process of standardisation due to high costs of implementation (Blind and Hipp, 2003). Current status of standards development Service standards have developed more slowly than standards for goods. In the year 2000, services accounted for around 5% of all European standards (Blind, 2006), while the services sector generates about 70% of total value added in the European Union. Lissaur (2008) indicates that service standards are focused more on the process than on the product. Moreover, service standards are dispersed. The most common areas for existing service sector standards are: quality assurance, environmental and safety management, working conditions, education, ethical standards, contractual standards, complaints handling and price regulations. The Services Directive (2006/123) was adopted in 2006 to simplify procedures and formalities for service providers when establishing a local presence in another EU country or supplying services across borders within the EU. In this context, accompanying measures at the level of Member States, in co-operation with the Commission, were envisaged to ensure high quality of services throughout the EU. One such important measure was the development of voluntary European standards for services. A number of sectors are not covered by the Services Directive including financial services, electronic communications services, most transport services, health care, temporary work

26
Study on business-related services
agencies, private security services, audio-visual services, gambling, certain social services provided by the state, and services provided by notaries and bailiffs. The role of service standards Standardization benefits the service providers and their customers on macro and micro level (Blind and Jungmittag, 2008; Jungmittag et al., 1999, Swann, 2010). In particular, minimum quality and safety standards reduce transaction costs especially on markets for complex, innovative services. Standards also foster the development of new markets and high quality segments of existing markets, enhancing economic growth. They restrict negative externalities that influence health and environment. Though standards might reduce the variety of services provided, this allows the exploitation of economies of scale (Dixit, Stiglitz, 1977). Ritzer (1993) indicates that standardization results not only in economies of scale but also higher productivity. Taking McDonalds as an example, customers gain from lower prices due to standardisation though suffer from limited choice. On the downside, standardisation might strengthen the position of incumbents, restricting competition by raising rivals’ costs. Standardization is usually an outcome of consensus of all interested parties representing mostly multinational enterprises. Thus, the standards of dominant players may prevent newcomers from obtaining access to the market and also restrict the innovation process. In addition, standardization offers knowledge diffusion and promotes trade. In order to innovate successfully a firm should be actively involved in R&D activities or in the transfer of technology as a substitute to R&D activities (e.g. Love and Roper, 1999). Therefore, innovative companies use standardization more often. Blind (2002) found confirmation that innovative firms (R&D sectors) use standardization more often. However, when the share of R&D activities within the company reaches a certain point, he finds that it is less willing to participate in standardization (Blind, 2006). Information and communication technologies are important for innovation in many business related service industries (see Barcet, 2010). Therefore, standardization of ICT tools will enhance innovative activities in these services. Blind (2002) determined that export-oriented companies are more likely to join standardization processes. In addition, the company’s size also determines the involvement in the standardization process since absorptive capacity is required to participate in the process (Blind, 2006; Blind and Hipp, 2003). Export-intensive companies generate higher output of standards since they use standardization to avoid heterogeneity and information asymmetries (Blind, 2002). A number of studies proposed that market concentration can also be an explanatory factor for the standardization process. The results of the study by Blind (2002) suggests that there is an inverse U-shaped pattern that describes the relationship between market concentration and standardization. It is easier for fewer companies to agree upon a common standard up to the moment where just a few or even one company dominates the market. There are a number of barriers to the development of service standardisation: • Low awareness of the advantages of the standardization and its role leads to the fact that
companies are less willing to participate in the development of service standards. • Negative perceptions of the impact of standards (see Blind, 2009) reduces the willingness to
commit to a standardization process. Service standardization may reduce choice and the incentives to innovate; it may eliminate differentiation and result in a situation with a uniform service allowing only price competition.
• The high costs of development and implementation of standards also reduces the incentive to engage in standardization. High development costs of standards will induce prices of services to rise, but it is unclear whether customers will be willing to pay more for such a service.

27
Study on business-related services
• If service standards are developed at the national level, the differences in standards and regulation can negatively influence standardisation at the international level.
Standardization versus customization in services Even though the benefits of standardization are explored in the literature, companies still do not fully standardize their services. Many services are differentiated by nature. Co-production and customization often go hand-in-hand. However, based on a survey among service firms in Denmark, Sundo (2002) concludes that many services combine elements of two opposite types of services, customization and standardisation, into another type, modularity. The standard modules are produced by the service provider but the customer can combine different modules which allow a full adaptation to the needs of customers. Bettio et al. (2011) conducted an empirical study of knowledge intensive business services (KIBS) in Italy that specialised in design and communication. The findings suggest that a large amount of services is fully customised but multiple types of services are provided, including modular services. Hipp et al. (2000) examine the pattern of innovation that relates to standardization and customization of services. Based on a survey on innovation in German services companies Hipp et al. (2000) derived the distribution of the firm’s income among standardised, partially customized and bespoke (fully customized) services. Wholesale and retail trade provide the most standardised services, whereas knowledge intensive business services (KIBS) provide the largest amount of partially or fully customised services. The level of service customization offered by KIBS is higher on average than in other service sectors, however, the services provided by them are not fully customized (Corrocher et al., 2009). KIBS industries have been among the most rapidly growing service sectors in the EU countries since the mid-1980s. KIBS contribute to their clients’ innovation processes, whether these are knowledge-producing or knowledge-using. Strambach (2008) suggests that standardisation and modularisation processes in knowledge intensive activities foster tradability of knowledge products and geographical dispersion in some subsectors of KIBS (e.g. the software industry). Engineering services are essential to the productivity and sustainability of various other economic activities (Cattaneo, 2010). Quality standards in engineering, such as professional, process, and product standards determine trade opportunities. Engineering organizations invest in the development of standards influencing the competitive position of their engineering professionals. This in turn results in the mutual recognition of qualification requirements. When education for the engineering service providers is standardized, engineers can work on projects both domestically and abroad. The studies related to the marketing services (e.g. Prahalad and Doz,1986; Kanso and Nelson, 2002; Samiee et al.; 2003; Vrontis, 2003) suggest that both customization and standardization are (simultaneously) relevant in this industry. Companies should adapt to change in a socio-economic and cultural context, but standardization of some of the service dimensions generates lower costs and improves market access.
2.5 Selection of sectors for detailed analysis
More detailed analysis of a selection of business related services sectors is a key part of this study. The Terms of Reference of this study listed five business related service sectors. During the

28
Study on business-related services
inception phase, the final choice8 was made to consider the following business related services sectors in the detailed analysis: • Private security; • Industrial cleaning; • Design; • Technical consulting; • Advertising and market research. These sectors are in line with various demarcations used in the literature describing business services, such as the definition we introduced in section 2.1. The list includes knowledge intensive sectors such as technical consulting and market research; creative industries such as advertising and design; and operational support services such as private security and industrial cleaning. These sectors also cover the range of client-provider participation in co-production and the relation to innovation and performance in the value chain discussed above. Moreover, the selection aligns with the evidence on value chain relations that we presented in this chapter. All five sectors are part of other business services, the professional and support services that account for the bulk of intermediate use of business services in value chains across the manufacturing sector. Table 2.5 presents some basic statistical information on each of these business related services sectors for the EU-27. Several observations on the basis of the comparative overview in the table are listed below: • The technical consulting sector has by far the largest turnover value, while cleaning activities is
the largest sector in terms of employed persons; • Average firm size in number of persons employed is largest in the two support service sectors,
security and cleaning. Even average firm size in advertising and market research is substantially smaller. In all selected business related service sectors, the average firm is small or even micro-level firm;
• Labour productivity, controlling for average wage levels, is highest in the advertising and market research and design sectors. This measure of productivity would have been higher in design if a smaller proportion of employed persons was self-employed and/or owner-worker;
• Profit shares in value added are highest in the design sector, but this is partly a reflection of the fact that income of self-employed designers is counted as profit rather than personnel costs. Measured using the share of personnel costs in value added, cleaning and security appear most labour intensive in production. The figure for design in particular underestimates the importance of labour as production factor for the same reason as before;
• Advertising and market research make most intensive use of intermediate goods and services in production, reflected in the relatively low share of value added in production value.
The next chapters provide more information and insight into the main findings from the detailed sector studies for each of these five selected business related services.
8 The sectors listed in the Terms of Reference were: logistics, marketing and advertising, facility management, technical and
engineering services, and design. The final choice resulted in splitting facility management in two distinct sectors. Logistics was not selected for detailed analysis.

29
Study on business-related services
Table 2.5 EU-27 – Key statistical indicators for five selected business related service sectors for 2010
Technical
consulting
Advertising
and market
research
Design
services
Security and
investigation
activities
Cleaning
activities
Number of enterprises 594,189 274,345 132,422 56,830 208,000
Turnover or gross premiums
written (million euro)
217,763 157,860 17,177 43,700 81,039
Production value (million euro) 201,436 132,648 15,275 41,921 80,600
Value added at factor cost
(million euro)
103,319 46,697 7,855 30,076 55,300
Gross operating surplus (million
euro)
37,460 16,891 4,490 4,159 9,650
Personnel costs (million euro) 65,859 29,807 3,365 25,916 45,700
Number of persons employed
(in hundred persons)
19,484 11,430 2,000 13,920 33,900
Number of persons employed
per enterprise
3 4 2 24 16
Turnover per person employed
(thousand euro per person)
112 138 86 31 24
Wage adjusted labour
productivity (%)
117 129 123 112 114
Share of employees in persons
employed (%)
75 82 53 97 94
Gross operating
surplus/turnover (gross
operating rate) (%)
17 11 26 10 12
Share of gross operating
surplus in value added (%)
36 36 57 14 17
Share of personnel costs in
value added (%)
64 64 43 86 83
Share of personnel costs in
production (%)
33 22 22 62 57
Value added at factor cost in
production value (%)
51 35 51 72 69
Total purchases of goods and
services (million euro)
119,805 111,674 9,303 13,777 27,000
Share of personnel costs in total
purchases of goods and
services
55 27 36 188 169
Notes: Source: Eurostat SBS for 2010 based on NACE industry classification, revision 2. For design services, data for 2009 were used if 2010 data were not reported. Turnover per employee in design services is derived based on the estimates provided for turnover and persons employed; the figure is missing in the source data due to confidentiality reasons.

31
Study on business-related services
3 Main findings on advertising and market research
3.1 Sector overview
The advertising and market research sector is a diverse sector and we provide an overview of both the advertising segment and the market research segment. The latter segment also includes public opinion polling. Eurostat data indicate that there were 178,147 advertising agencies in the EU, employing around 606,000 employees (or some 440,000 FTEs) and generating a turnover of EUR 87 billion and added value of EUR 27 billion. The market research segment is smaller, with 36,340 companies in 2009 that together employ around 175,000 people (or some 133,000 FTE) and generate a turnover of EUR 18 billion and value added of EUR 9 billion. Both sectors are concentrated in a few EU Member States, in particular the larger Western EU Member States (Germany, UK, France, Spain, Italy), the Netherlands and Poland. In terms of market structure, the number of SMEs in both sectors is high, as reflected in the small average number of employees per company: around three persons in advertising and nine in market research. In advertising even 67 percent of the business consists of self-employed. Nevertheless, the market is dominated by a small group of large players in both market segments. Usually, the large players are represented by holdings or networks of companies covering several SMEs. Only these SMEs are included in Eurostat statistics while the holdings or networks of companies are not.. But according to the European Association of Communications Agencies (EACA), the biggest five players account for some 80 percent of global turnover in both segments.
3.2 Competitive position
The average share of personnel costs in total production costs is 22 percent for advertising and 38 percent for market research. These figures should however be interpreted with caution. Most likely they underestimate the importance of personnel costs given the high share of self-employed and micro-sized enterprises, of which workers are often not on the payroll and thus not included in the total personnel costs at sector level. The differences in firm size among Member States therefore partly explain the large differences in the share of personnel costs. In 2009, the average turnover per person employed was EUR 112,000 for advertising and EUR 87,000 for market research. In terms of the position on the world market, the EU is among the largest markets for both advertising and market research, but it is losing market share in world markets as other countries and regions experience higher growth rates.
3.3 Market conditions, downstream relations and business response
The main clients for both advertising and market research agencies are traditionally industries that want to sell fast moving consumer goods. However, recently there has also been an increased demand for advertising and market research for durable goods and consumer services (e.g. leisure, financial services) as well as an increase in business-to-business advertising.

32
Study on business-related services
Both advertising and market research have an intermediary position in the value chain as they provide services that support the core production activities of their clients. They can also be seen as an essential part of the innovation cycle, as they take a central role in guiding product development, positioning products and evaluating the performance of products and brand label image on the consumer market. This positions the advertising and market research sectors both at the beginning and at the end of the production process of their clients. There are several studies that find that especially the advertising sector shows relatively high levels of innovation but also that companies that have stronger business-to-business linkages with creative industries have stronger innovation performance. Technological developments have had a significant impact on the sector. Especially developments with respect to digital and social media are sources for more growth, and have also led to the emergence of new small companies entering the market, although it appears that consolidation starts to take place. Technological developments (like the emergence of ICT solutions) have also made it easier to separate the creative and complex tasks in advertising and market research from more standard logistic tasks. Selective subcontracting or outsourcing of these activities (depending on the transaction costs involved and the possibility to manage the quality of the work) provides a way of reducing costs and increasing competitiveness of the sector. The close relation between advertising and market research on the one hand and product development and sales on the other implies that in many client companies a large share of marketing is performed in-house. But specialised advertising and market research expertise for marketing campaigns is generally thought to be more efficiently sourced from the market.9 This combination of core marketing activity supported by specific knowledge intensive input from external suppliers indicates the important role of co-production in marketing campaign projects. Colocation is linked to this co-production: co-location between the creative subsectors advertising and software and other innovative industries is found to be high. The increased specialisation that is partly driven by the above developments, possibly coupled with the scale of advertising and market research sectors, also creates potential for knowledge spill overs. It increases the flexibility for both agencies (co-operation with other agencies) and clients. Thus the expertise built is a form of knowledge spill-over within and between client industries (i.e. different experiences with the same client or experience with different clients).
3.4 Framework and regulatory conditions
Labour and skills Given the knowledge intensive character of the advertisement and market research sectors, the availability and skills of the right people is a crucial element. There are currently no problems in attracting labour to the sector. A clear trend is an increasing importance of free lancers in the sectors, which is witnessed by the decrease in the share of in-house staff in the marketing sector (a decrease from 65 to some 35 percent over the last decade). The reason for this development is the need for flexibility in human resources and costs.
9 According to EACA, some large Asian brands have their own advertising agencies in-house. Most OECD and EU based
multinationals outsource advertising services.

33
Study on business-related services
With respect to the free movement of labour in the internal market, the issues do not differ much from ‘mobility barriers’ in other sectors. Some sector representatives see further standardisation of educational and/or professional qualifications as an important way to increase this flexibility. For example, the European Marketing Confederation has developed and accreditation system to standardise the educational and professional qualification levels. This allows for comparison of different qualifications. Knowledge and innovation As indicated above, the sectors are relatively innovative, and they also impact on the innovativeness of client firms, especially in the context of co-production. In the context of innovation, intellectual Property Right (IPR) protection is important. Traditionally in advertising, the IP was transferred to the client of the advertising agency. Currently new business models are explored where the advertising agency retains the IP. Appropriate skills are needed, as the IP will only generate revenues if exploited effectively. As trade in creative industries, such as marketing services, has experienced a fast growth due to the rise of multimedia solutions for sharing creative goods and services, the appropriate governance of IPR in a multilateral competitive context has become increasingly important. Standards and regulations European regulations provide an important framework for the sector. Relevant regulations for the sector includes the following: • Regulation related to privacy, which notably includes the General Data Protection Regulation
and the Directive on protecting personal data processing and the E-privacy Directive. Although the sector supports cross-border consistency in regulation, there is also concern about the extent to which the regulation will affect their business model as the use of personal data is crucial for their performance.
• Regulation related to audiovisual media services, which limits some advertisement possibilities (e.g. prohibition of product placement, requirement of clear recognition of sponsored audiovisual media services).
• Product-specific regulations that set additional rules for other advertising in the media, notably for products that may have important health effects, like tobacco, medicines, and to some extent also for alcohol and food products.
• Regulation that requires Member States to ensure adequate and effective means to combat misleading advertising and enforce compliance with the provisions on comparative advertising.
• Self regulation (at world level of some 150 companies) for online behavioural advertising (OBA, which covers among other things transparency of data collection and use, and limitations on the collection and use of sensitive personal data for OBA.
National regulatory regimes are based on the European framework. However, as the European regulation only defines minimum, national regimes still vary across the countries. Representative sector associations for advertising and media call for harmonisation of legislation, but this is difficult to achieve also because the interests of the sector compete with other interests in society like privacy rights, net neutrality, health and consumer protection as well as IT and cyber security. Market access: internal market and cross-border trade Barriers to the internal market are largely related to the above issues of differences in national regulation. To what extent this limits the internal market and cross-border trade is unclear.
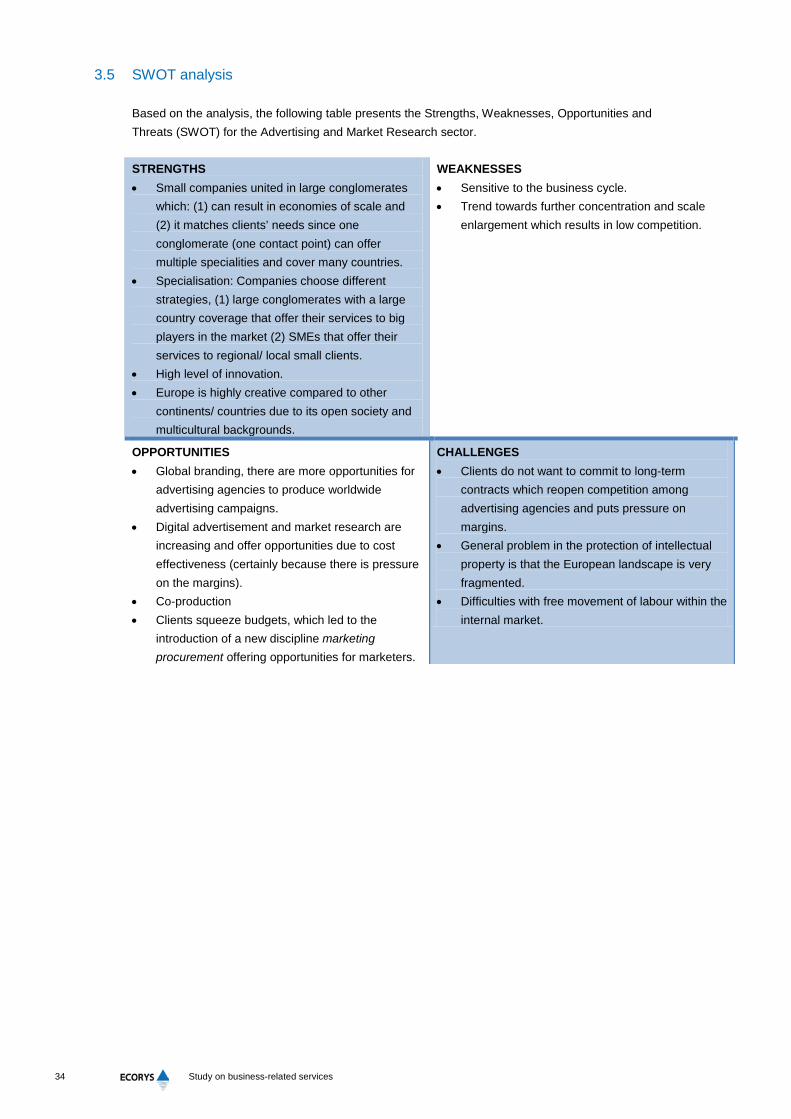
34
Study on business-related services
3.5 SWOT analysis
Based on the analysis, the following table presents the Strengths, Weaknesses, Opportunities and Threats (SWOT) for the Advertising and Market Research sector. STRENGTHS • Small companies united in large conglomerates
which: (1) can result in economies of scale and (2) it matches clients’ needs since one conglomerate (one contact point) can offer multiple specialities and cover many countries.
• Specialisation: Companies choose different strategies, (1) large conglomerates with a large country coverage that offer their services to big players in the market (2) SMEs that offer their services to regional/ local small clients.
• High level of innovation. • Europe is highly creative compared to other
continents/ countries due to its open society and multicultural backgrounds.
WEAKNESSES • Sensitive to the business cycle. • Trend towards further concentration and scale
enlargement which results in low competition.
OPPORTUNITIES • Global branding, there are more opportunities for
advertising agencies to produce worldwide advertising campaigns.
• Digital advertisement and market research are increasing and offer opportunities due to cost effectiveness (certainly because there is pressure on the margins).
• Co-production • Clients squeeze budgets, which led to the
introduction of a new discipline marketing procurement offering opportunities for marketers.
CHALLENGES • Clients do not want to commit to long-term
contracts which reopen competition among advertising agencies and puts pressure on margins.
• General problem in the protection of intellectual property is that the European landscape is very fragmented.
• Difficulties with free movement of labour within the internal market.

35
Study on business-related services
4 Main findings on design
4.1 Sector overview
Eurostat estimates for 2009 show that the design services sector (NACE 74.10) employed some 176,000 people (or 82,000 FTEs), generating a total turnover of EUR 15 million and value added of EUR 6.9 million. There is a strong geographical concentration of the sector, with more than half of the companies located in three countries: Italy (27% of all companies), Germany (14% and the UK (14%). In most Eastern European countries the sector is very small. Also employment is highly concentrated, with the UK accounting for one third of total EU employment in design services. The sector is dominated by micro-enterprises and self-employment: 42% of all design companies have 0 or 1 employee, and 85% have less than 20 employees. The UK is the only country having a non-negligible share of large companies in the sector. Based on UK data, company size also seems to depend on the type of design activities, especially in product and industrial design services and communication design services business tend to be larger. Companies with less than 20 staff account for more than 70 percent of turnover and value added in the sector on average in the EU.
4.2 Competitive position
Compared to other service sectors, design services are not very labour intensive as reflected in the relatively low share (21.6 percent) of personnel costs in total production costs according to Eurostat estimates. These data should however be interpreted with caution and are likely to underestimate the importance of personnel costs. Given the high share of self-employed and micro-sized enterprises, many design workers are not on the payroll and thus not included in the total personnel costs at sector level. In 2009, the average turnover per employee in the EU27 was EUR 82,500, while average value added per person employed was about EUR 38,000. There are significant differences between Member States, which partly reflect differences in average wage levels. Correcting for these differences, highest productivity levels are achieved in Latvia, the UK and Romania, while among the large EU economies Spain and Italy have relatively low wage-adjusted productivity levels.
4.3 Downstream relations and market conditions
The increased awareness about the importance of design and its further integration in the value chain of clients, has led to an increasing demand for services from different sectors. An important driver behind the increasing demand for aesthetic design services in the so called ‘experience economy’ where products and services distinguish themselves by adding symbolic value e.g. through design. In addition, there is increasing awareness of the importance of (non-technological) innovation to remain competitive and the role of design in this process. For both aesthetic and integral product design there is a trend towards a broadening of the client base. UK Design Council research (2005) on the design industry found that in the UK the main clients for design services come from the services industries and that almost a quarter of the design services companies’ work for clients in manufacturing. Looking at the various client sectors,

36
Study on business-related services
manufacturing industries are most likely to use at least one type of design, and manufacturing also accounts for most industrial design registrations. Over time there has been a development from design primarily being focused on aesthetic design, to functional design having become more important - designers are now considered to play a critical role in innovation activities of client companies. The role of design services companies has therefore shifted from value adding to a more strategic role within client companies. Especially larger client firms recognize the important role of design, which is not limited to design better products and processes but also to design entirely new systems and business models. In smaller companies, design services are still largely used for more ad hoc value adding activities. The use of design in R&D and product development is especially prevalent in manufacturing. Whereas for design services focused on aesthetic design the interaction between client and service provider is primarily based on outsourcing to tap into specialised non-core knowledge, the interaction between client manufacturers and design services providers in R&D and new product development is much more focused on co-production (also referred to co-creation), and design is considered to be an integral part of innovation. Next to this co-production, there are also companies that insource (part of) the design function. The rise in the number of in-house teams (especially in the manufacturing sector) indicates that the value of design as a tool – and therefore the value of holding design knowledge in-house – is growing, despite an overall dip in in-house budgets during the recession.10 Competition is mainly local or regional in the sector. Competition from outside the EU is primarily found for product and industrial design. In these disciplines, the USA and Japan are the main competitors, but other emerging countries like Korea and Singapore are also becoming strong market players. There is also increased competition of alternative providers of design (e.g. from management consultants). In view of this competition, the EU industry is challenged to focus more on strategic design, and working for example in multidisciplinary teams (e.g. with experts in e.g. ICT, energy efficiency, business planning, anthropology).
4.4 Framework and regulatory conditions
Labour and skills The design sector has a well-educated and skilled workforce. In view of the increasingly complex, interdisciplinary and international projects lead to increased demand for a diverse set of skills. Many design schools still focus on design as a “ technical” subject however and have less attention to developments like “design thinking”. This leads to an increased skill gap between education and design practice. In different markets there is an oversupply of design graduates. There are no major issues with respect to labour regulations affecting the industry. Knowledge and innovation The design industry is an important driver of innovation in the economy, which is largely driven by innovation in the sector itself. The use of new technologies, scientific viewpoints and multidisciplinary teams are elements of innovation in the sector. The level of innovativeness in the sector is strongly influenced by the degree of collaboration and knowledge sharing. Not all companies, especially smaller specialised ones are eager to share know-how and consider open innovation more as a threat than opportunity. The intellectual property rights protection (IPR)
10 Design Industry Insights 2010.

37
Study on business-related services
system offer safeguards in this respect (copyright, patents, trademarks, registered industrial property rights and utility models), but some business models are constrained by differences in IPR regimes in different countries. Market access: internal market and cross border trade No important barriers are identified that limit market access. However, some industry characteristics make internationalisation relatively difficult for the sector, notably the small size of companies, limited access to finance and a lack of sufficient entrepreneurial and intercultural skills in many companies. The UK has a strong position, especially in strategic design thinking where multinationals lead the market. This appears to be mainly due to the strong and historic reputation, the language and support to the sector, which gives UK companies an advantage. Standards and regulatory conditions There are no sector-specific standards or regulations for the design sector. Every country has its own policy support to design services. The UK has the most sophisticated design support, and it is also well developed in Denmark, Germany, Sweden and the Netherlands. The UK has set up the Design Council to promote the improvement of design in the products of British industry. This has helped to create space for larger design companies. From this experience, it seems better to limit policy intervention to the promotion of the industry and the organisation of the sector than providing direct support, which would make the industry too dependent on government support. Skill improvement to professionalise the sector would also benefit the sector. Because of the strong variety of the design services sector and the corresponding variety of problems that differ by country, many of the issues are tackled at the national rather than the EU level. The EC has highlighted the importance of design in innovation in a working document, and took some initiatives to promote design, e.g. in the Eco-design Directive (stimulating the design industry to invest in energy efficient processes and create more sustainable products) and the European Design Innovation initiative (funding to projects stimulating research and innovation and raising SME performance).
4.5 SWOT analysis
Based on the analysis, the following strengths, weaknesses, opportunities and challenges can be identified. STRENGTHS • Ability to challenge clients and bring in new ways
of thinking, thus directly contributing to the innovation process
• Capacity to combine technological developments with user-demand
• Provide specialised and multidisciplinary knowledge to clients
• Europe’s ability to integrate technical design with aesthetic design and sustainability
• Historically strong design clusters with world class reputation (Italy, UK)
WEAKNESSES • Micro-size of design companies hampers
collaboration with especially large client companies
• Design service providers are not good enough at communicating about the added value of design in client companies
• Term ‘design’ is vague and covers different meanings, leading to misconceptions about what designers do
• Lack of managerial skills in many design SMEs • Fragmentation of the market, primarily due to
cultural and linguistic barriers – low level of internationalisation
• Lack of understanding about the importance of

38
Study on business-related services
IPR in design businesses
OPPORTUNITIES • Increased importance of (non-technological)
innovation, combined with increased awareness about the importance of design in the innovation process
• Experience economy • Increasing investments in sustainable growth • Boosting demand for design in emerging markets • Untapped potential for market growth in SMEs
and Eastern European countries • Low entry barriers: relatively open markets • Technological progress provides new
opportunities to solve particular problems • European authorities’ commitment to tackle large
societal problems such as mobility, climate change, greying of economy
CHALLENGES • Lack of understanding about the added value of
design in manufacturing companies, especially with SMEs
• Design services often seen as commodity services, resulting in price competition
• Increased competition from management consulting and alike
• Development of dedicated in-house design capacity by client companies
• Skills shortage / lack of qualified staff • Economic and financial crisis • Increased global competition, especially from fast
growing Asian economies • Lack of good data on design services sector and
lack of knowledge about the added value of design with authorities hampers the development of a good policy framework
• Current curricula at design schools do not yet reflect recent evolutions in design thinking
• Interaction between design sector, industry and research institutes still weak
• Shrinking European industrial base and relocation of production and innovation activities outside Europe

39
Study on business-related services
5 Main findings on facility management
The facility management sector consists of two separate service activities: industrial cleaning and private security services. Although there are some companies that provide combined facilities management, in this study we have treated them as separate subsectors, as they clearly have their own characteristics and challenges. The first part of this chapter covers industrial cleaning (sections 5.1-5.5), while the second part looks into private security services (sections 5.6-5.10).
5.1 Sector overview: industrial cleaning
Eurostat estimates for 2009 indicate that the cleaning sector (NACE 81.2) comprised around 189 thousand enterprises and employed around 3.4 million persons in the EU27, generating a total turnover of € 76.4 billion and a value added of € 52.9 billion11. General cleaning activities (non-specialised cleaning of buildings, mostly interior cleaning) comprise the major share of total cleaning activities, accounting for close to three-quarters of turnover and 85% of employment. While the sector experienced substantial growth over the past two decades (annual growth of around 10 percent up to 2008), more recently it has been affected by the economic crisis which caused a contraction of the sector in 2009, although there appears to have been a slight recovery in 2010 and 2011. The firm structure of the sector is characterised by a prevalence of small companies, with around three quarters of all companies in the sector employing less than 10 people according to the European Federation of Cleaning Industries (EFCI). EFCI data also show that those companies employing more than 500 persons (approximately 1.4 % of total firms) account for around half of total turnover in the sector. In general, the market share – in turnover and employment terms – of larger companies is typically smaller in new Member States while higher shares are observed in countries like the UK, Germany, Spain and Finland. It can be noted that countries with high market shares of larger companies tend to be those where there is a higher overall market penetration of specialised cleaning service providers (i.e. where a larger proportion of cleaning activities has been contracted-out as opposed to done ‘in-house’).
5.2 Competitive position of the industrial cleaning sector
Cleaning is a highly labour intensive activity and therefore personnel costs typically account for a large share of total costs (around 80% of total costs for cleaning services). This in turn implies that costs are a priori higher in countries with higher wages and tax systems. The estimated average turnover per employee in the cleaning sector was approximately € 22,600 in 2009, and estimated average value added per person employed € 16,000. There are large differences between Member States, which partly reflect differences in average wage levels. Correcting for these differences in wage levels, highest productivity levels are achieved in Latvia,
11 Data from the European Federation of Cleaning Industries (EFCI) for 2008, which cover 20 countries (AT, BE, CH, CZ,
DK, DE, ES, FR, FI, HU, IT, LU, NL, NO, PL, PT, SE, SI, SK, UK), indicate a total of 158.4 thousand firms, 3.75 million persons employed, and turnover of € 62 billion.

40
Study on business-related services
Romania, Bulgaria and Slovakia. Among the larger EU Member States, the UK and Germany show the highest wage adjusted productivity levels while Sweden, Spain and Italy have the lowest levels.
5.3 Downstream relations and market conditions of the industrial cleaning sector
Industry estimates indicate that office cleaning accounts for nearly half of total turnover of the sector, while cleaning of industrial sites accounts for 11% of total turnover. The public sector accounts for an important part of the market for cleaning services (on average 35% of the total turnover of companies in the sector). Cleaning services intervene throughout value chains rather than being associated with specific type of production activities or position within a value chain. As a predominately ‘non-core’ activity for most businesses, cleaning services are typically among the support services that are most susceptible to outsourcing12. Demand for external provision of cleaning services appears to increase across all industrial sectors, particularly in sectors where cost-based international or global competition is important. The fact that cost saving is a priority for clients constitutes a major challenge for the sector. In general, the pressure to reduce costs means that cost (lowest price) considerations tend to dominate over quality aspects. This is partly related to the problem that it may be difficult to specify and measure the quality of cleaning services. Consequently, cleaning requirements are often specified in terms of the tasks to be carried out (including criteria such as the methods, equipment and products to be used) and the intervals at which they are to be conducted. Clients thus use a process approach rather than a results based approach. The fact that in some EU countries market penetration of cleaning services is already high, combined with the current economic crisis and the pressure of clients to make cost-savings, has led cleaning companies to review their business strategy. They attempt to move away from a relationship with their clients based simply on the provision of cleaning services and to reposition themselves in a more strategic long-term role in which they act as partners that understand their clients business and are able to provide a diversified and non-standard range of services accordingly. This is reflected in 1) the trend in the sector towards integrated services and facilities management (and other support services) and 2) the development of more specialised and non-standardised cleaning services. Another important factor influencing business strategy is the increasing attention given by clients to environmental and sustainability issues, which made cleaning companies increasingly focus on these issues as well.
5.4 Framework and regulatory conditions for the cleaning sector
Labour and skills The sector is dominated by low-skilled workers (some 90%) and a large part of the workers is female (75%). The sector itself seeks to promote greater professionalism through vocational training, though the focus on professional development appears to differ significantly across 12 Outsourcing implies a permanent – or at least long term – shift of responsibility for delivery of the service from the primary
(outsourcing) firm to an external service provider. Thus, from a value chain perspective, outsourcing represents an extension/fragmentation of the value chain to include the external service provider. At the same time, there is a corresponding reduction in the part of the primary firm in the overall value chain. Essentially, on the one hand, outsourcing represents a lengthening of external value chains and, on the other, a shortening of internal value chains within firms.
41
Study on business-related services
countries and also depends on company size. There is a certain degree of conflict between demand side pressure to keep down costs and supply side efforts to raise the profile, attractiveness and ultimately professionalism of the cleaning sector. In terms of national-level regulations of relevance to the industrial cleaning sector, the most important are those relating to wages and social security payment and employment conditions. Knowledge and innovation The main impetus for technological innovation in the cleaning sector comes largely from the side of cleaning equipment and cleaning product suppliers. However, the scope for innovation seems to stem more from the organisation and processes adopted, rather than from these improvements in inputs. An example would be increased use of day-time working that is also linked to technological developments such as quieter and cordless cleaning equipment. Market access: internal market and cross-border trade Entry barriers into the industrial cleaning sector are limited. The industrial cleaning sector is included within the scope of the Services Directive. Market access is not seen as a particularly major issue for the sector; though there may be some small impact from the existence of different national standards relating to cleaning requirements (health, hygiene, safety etc.) for some client segments and types of cleaning activities. Despite the limited barriers, cross-border trade of industrial cleaning is close to zero, and is mostly limited to close to the border activities and some highly specialised services. This is mainly due to the fact that provision of cleaning services is an activity undertaken at the client’s location which implies that the operations of cleaning firms and their workers need to be located in geographical proximity to their clients. In addition, most companies – including many of the larger ones – tend to be family based businesses that operate on national markets or with limited international presence. Standards and regulations The industrial cleaning sector is not subject to specific industry-level regulations and compulsory standards- it is only affected by relevant standards and regulations of its clients. At the European level, CEN published a European standard on ‘Cleaning services – Basic requirements and recommendations for quality measurement systems’13 in 2001, but this appears to have generated little interest from the sector. In 2008 the CEN Technical committee (CEN TC 328) dealing with ‘standard measuring system for cleaning performance’ was declared dormant, as no agreement on a European standard could be reached. There seems to be little enthusiasm in the sector for formal standards, as it would hamper the flexibility in responding to different client’s needs that also change over time. There does however appear to be an interest in promoting greater ‘professionalisation’ of the sector (e.g. through vocational training) and improving the sectors image and recognition through improvements in the quality of service provision (e.g. improved techniques, products, working conditions etc.). Given these priorities, it would seem that there is scope for enhancing national-level recognition of industry training schemes and qualifications and systems for quality accreditation of service providers, which could benefit both the sector itself (and workers therein) and provide customers with greater information on the quality of services to be expected from contract cleaning companies.
5.5 SWOT analysis for the cleaning sector
Based on the analysis and inputs from sector stakeholder, the following strengths, weaknesses, opportunities and threats (SWOT) can be identified. 13 EN 13549.

42
Study on business-related services
STRENGTHS • Ability to adapt to clients’ needs and develop new
methods of service delivery. • Creation of consumer orientated long term
relationships based on understanding of clients’ businesses and opportunities for outsourcing of additional and non-standard services.
• People management: a core skill of cleaning service providers which enables the facilitation and diversification into other labour-based service areas.
WEAKNESSES • Industry structure: prevalence of micro and small
enterprises offering basic cleaning services with limited scope for quality and productivity enhancement.
• Low wage levels and often unsocial and poor working conditions.
• Use of ‘grey market’ and illegal working practices by some service providers (e.g. circumvention of tax, social security and working condition requirements in order to reduce labour costs).
• Low growth prospects (compared to historical rates) in mature markets with already high penetration rates.
OPPORTUNITIES • Economic conditions: increased demand as
clients seek cost savings from outsourcing/externalisation of cleaning services.
• Market growth: possibilities to increase penetration of contract cleaning, especially in less developed and peripheral Member States
• Sustainability and environmental aspects: growing adoption of lifecycle approaches (e.g. environmentally friendly products, recycling, low energy use, low water consumption etc.)
• Diversification: multi-service / facilities management approaches to integrated service delivery.
• Specialisation: provision of specialised cleaning services for specific client segments (e.g. hospitals, schools, public transport, etc.)
• Internationalisation / globalisation: cross-border provision and establishment within Single Market; client demand for multi-country service provision.
• Technology developments: use of new technologies (e.g. quieter, cordless cleaning machines) offering possibilities to improve/adapt organisation of service activities.
CHALLENGES • Economic conditions: increased pressure for cost
savings in service provision (reduced prices and/or frequency) leading to even lower margins.
• Procurement conditions: promoting fair competition and ‘best value’ approaches in a price driven market.
• Demographic change / workforce: difficulties in recruitment and retention of employees / high staff turnover.
• Professionalisation of the sector: e.g. vocational training and career development.
• Quality and reliability metrics: development of measures and schemes to define and monitor the performance of cleaning activities
5.6 Sector overview for private security services
According to Eurostat estimates for 2008, there are 35,000 companies in the EU classified under private security services (NACE 80.10), and1.2 million people are employed in the private security activities. The sector generates a turnover of EUR 35.3 billion and a value added of EUR 25.4 billion. Overall demand for security services is cyclical, linked to the level and growth of economic activity. It is also influenced by security or special events (e.g. the 9/11 terrorist attack, London Olympics) and country-specific factors (e.g. changes in regulations).

43
Study on business-related services
The sector is characterised by a prevalence of small companies, with over 50 percent of enterprises in the sector having only one employee.14 Only about 1.7 percent of companies have 250 or more employees, but these companies account for over half of turnover and over 60 percent of employment. Market concentration in the private security market appears to be influenced by the strictness of the regulatory framework - in countries with strong regulation of the sector, the total number of companies tends to be smaller and large multinational companies tend to dominate. This may be due to the fact that stricter regulations increase the costs of service provision and act as a market entry barrier.
5.7 Competitive position of private security services
Security services are highly labour intensive activities and personnel costs account for over 60 percent of total production costs, implying that costs are a priori higher in countries with higher wages and tax systems. Regulations can also affect costs for the sector (e.g. screening of personnel, training) and also cause differences between Member States. Eurostat estimates for 2009 indicate that the average turnover per person employed is around EUR 30,000 in the EU, and average value added per person employed EUR 21,000. Turnover and value added levels tend to be higher in countries associated with stricter regulatory environments with respect to the private security sector. Differences between Member States also reflect differences in average wage levels. Correcting for these differences in wages, highest productivity levels are typically achieved in relatively low-cost labour countries (e.g. Bulgaria, Romania, Estonia and Latvia) but also in some of the “old” EU Member States).
5.8 Downstream relations and market conditions for private security services
The Confederation of European Security Services (COESS) estimates that general guarding services account for around 60% of total turnover in the market. Beyond this is a diverse range of market segments that includes activities such as transport of valuable goods and money, airport and maritime security, monitoring and remote surveillance and many others. In terms of clients, it estimates that the private market accounts for around three-quarters of the market and the public sector for around a quarter15. Private sector demand for private security services is associated with changes in the production process. The increased fragmentation of production and outsourcing means that not all parts of production are performed in house which implies a greater need for industrial companies to adopt good integrated security systems. In relation to industrial companies and private security providers there is often a tension between the demand for an effective security system and the amount of information companies are willing to disclose. Private sector demand is linked to general economic cycles which has currently been affected by the economic downturn. This may be explained by the fact that clients see limited direct value added, also because not all the work is seen and of a preventive nature. In such an environment, there is pressure on private security providers to lower prices rather than the quality of the services provided.
14 Please note that the figures in this paragraph refer to the broader security and investigation services sector (NACE 80).
Private security is the most important activity in this broader sector, accounting for 87 percent of employment and 84% of turnover.
15 In-house (own supply) of private security services is estimated at less than 2% of the market.

44
Study on business-related services
Public sector demand has been affected by restructuring of public sector security services, which has led to a growing demand for private security services to become involved in ‘public’ activities. This increased role for private security is accompanied by greater emphasis by public authorities on setting (stringent) regulatory frameworks and control systems to guard against any possible abuse of power. This also leads to a tension between a demand for high quality services but also the need to keep costs limited. Although there is a high concentration of market share in some Member States, competition in the sector is intense. Profit margins are relatively low. Moreover, developments in the market mean that new competitors previously not active in the private security market enter the market (niches), such as ICT companies focusing on ‘digital security’ or property investment funds entering the private security market to evolve into ‘total facilities management’ service providers. As for the business models that private security companies use, it is expected that the market will split up in two different segments, with small and medium-sized companies operating in niches predominately of the private kind and large companies working for state and institutional clients, as well as large-scale surveillance customers such as banks, airports, etc. It is expected that in the first segment, mainly local companies will operate, while large multinational companies are likely to be the primary players in the second segment. Some nationally-based companies could also be successful in expanding market share internationally, through the development of strong client relationships and having lower overheads compared to multinational service providers.
5.9 Framework and regulatory conditions for private security services
Labour and skills As a labour-intensive sector, skill requirements and training are important to the sector. There is no consensus of what appropriate training would be, in the absence of standardisation on the level of training required to become a private security employee and the large differences between Member States (in terms of number of hours, in house company training versus training regulated by the Ministry of Home Affairs). EU harmonisation of training requirements is unlikely to occur. With the technological developments in the sector, work processes have become less-labour intensive and more worker-friendly, thereby improving labour conditions. The innovations also increase the required technological skills of employees. Knowledge and innovation New developments in ICT (e.g. new communication systems, eye recognition security systems) have changed the work of private security workers significantly over the last decade, and have made productivity gains possible. Technological innovation has also led to the development of a new area of activity in the sector: “digital security”, which refers to digital interaction such as mobile telephones, smart cards, etc., and has led to new companies entering the sector, or new partnerships with ICT companies to acquire the necessary skills. Market access: internal market and cross-border trade Market access in the private security service sector is strongly affected by differences in national regulation that require, for example, specific permits or that place geographical /territorial limits on the provision of services (for firms or individuals). As a consequence of these national differences, the private security services sector was allowed more time to assess if harmonisation would be appropriate the industry was granted (temporary) exclusion from the EU Services Directive.

45
Study on business-related services
At the level of individual security personnel, international mobility within the sector is relatively limited. This primarily seems to reflect in general, low mobility of security personnel, including basic factors such as lack of language skills. In addition, security checks and background enquiries for foreign workers are more difficult. Despite differences in professional (e.g. training) requirements noted earlier, it does not appear that there are significant problems associated with the lack of recognition of professional qualifications. Standards and regulations The regulatory conditions relevant for the private security industry are predominantly set at the national level. As there are differences across countries in defining the industry and in terms of the vision of the industry’s role in society, this results in significant differences in the regulatory framework across countries. Because of these differences in regulation at national level, the industry strongly argued for (an at least temporary) exclusion from the EU Services Directive, but there also seems to be a need to achieve common ground for the regulation of the private security industry, particularly given the fact that stricter regulation of the sector is associated with effective security. The differences in regulations also make it difficult to develop common standards for the sector. The development of standards would also require a common definition of the sector. Through the national associations and the European association COESS, the industry does a lot of self-regulation. At a European level, self-regulation has taken place in the form of the European code of conduct signed by both COESS and UNI-Europa (representing the trade unions)16. This code of conduct covers a wide array of topics, ranging from the selection, recruitment and training of workers to the relations with the police and other private security companies. Another example is the European Vocational Training Manual for Basic Guarding which has been agreed upon by COESS and UNI-Europa. Although it remains a training manual, it introduces the standards which should be considered as a minimum basis for the training of security guards17.
5.10 SWOT analysis for private security services
Based on the analysis and the input of sector stakeholders, the following table presents the Strengths, Weaknesses, Opportunities and Threats (SWOT). STRENGTHS • Europe is home to the leading global private
security companies. • Professionalisation: significant investments of
private security services companies have invested a considerable amount of effort into developing quality schemes and training programmes to enhance the quality of security services.
WEAKNESSES • Fragmentation of the EU private security market
resulting from different national approaches, legislation and regulatory environments for private security.
• Fragmentation also implies that the quality of services provided and operational costs can vary greatly across Member States.
• Low wage levels and often unsocial and poor working conditions.
OPPORTUNITIES • Increased perception of insecurity: leads to
increased demand for security in areas where insecurity grows.
• Greater security threats and risks: at various
CHALLENGES • Willingness of clients to pay a price that reflects
the quality of service and appropriate remuneration reflecting working conditions of security staff.
16 European code of conduct signed in private security sector, European industrial relations observatory on-line, available at:
http://www.eiro.eurofound.eu.int/2003/08/feature/eu0308203f.html 17 Source: Born, H., Caparini, M., and Cole, E. (2006)

46
Study on business-related services
geopolitical levels (local, national, international) and from various sources (criminality, terrorism, etc.)
• Demographic and social developments impact on security requirements: ageing population, individualisation of society, migration flows etc. Combined with new security problems from societal changes (e.g. industrial/economic restructuring, urbanisation, new types of criminality, etc.)
• Market growth: declining public/police capacities (e.g. public finance constraints) lead to outsourcing and development of public-private partnerships for security provision.
• Sustainability and environmental aspects: growing adoption of lifecycle approaches (e.g. environmentally friendly products, recycling, low energy use, low water consumption etc.)
• Specialisation: increased provision of specialised security services provides opportunities to expand market (i.e. greater scope for externalisation of security functions)
• Technology developments: use of new technologies offering possibilities to improve/adapt organisation of service activities and raise value added.
• Economic conditions: increased pressure for cost savings in service provision.
• Procurement conditions: promoting fair competition and ‘best value’ approaches in a price driven market.
• Demographic change / workforce: difficulties in recruitment and retention of employees / high staff turnover.
• Professionalisation of the sector: e.g. vocational training and career development.
• Public attitudes and legal framework: particularly in relation to opportunities to enhance the role of private security services in sensitive areas (e.g. critical infrastructure, transport).

47
Study on business-related services
6 Main findings on technical consulting
6.1 Sector overview
Technical consulting mainly covers engineering consulting and architectural services. The case study focuses on engineering consulting services, although statistics are mainly available at a higher level of sector classification (NACE 71- Architectural and engineering services, technical testing and analysis). According to Eurostat data, the sector employed just above 2 million full-time employees in 2009 and generated a turnover of around EUR 255 billion in the EU27. ECFA estimates that the engineering consulting sector accounts for about half of employment of the total sector, and about 40 percent of total turnover. The sector was also affected by the economic crisis, as turnover levels decreased in 2008 and 2009. The sector structure is characterised by the prevalence of both small and very large companies. The number of middle-sized companies is relatively low and the economic crisis has further reduced their number. In most European countries there are many small engineering consultancy firms. The very small companies with only 1 employee (self-employed) are especially common in Italy, Portugal, Hungary, and Belgium, while large companies are especially predominant in the Nordic countries, the Netherlands and the UK, where a trend towards consolidation in the sector started about a decade ago. Large companies (250+) generate almost one third of the total turnover (28%) in the EU 27, and micro-enterprises (<10 employees) account for almost the same percentage, i.e. 23%. The differences in sector structure can be explained by differences in tradition. In countries with a high degree of consolidation (mainly Northern/Anglo-Saxon countries), there is a tradition for strong consultancies with a large degree of responsibility towards the clients (which create large companies), whereas engineering consultants in other countries (typically Southern European countries) usually provide services to large contractors and are thereby traditionally smaller.
6.2 Competitive position
The share of personnel costs amounts to 33 percent of total production costs in the EU in the engineering consulting sector, despite employing mainly high-skilled labour. The figure seems underestimated, as according to EFCA data employee costs account for more than 70% in Denmark, Sweden, Germany, Finland, and the Netherlands (EFCA 2011). The difference can partly be explained by the fact that in micro-enterprises, payment to the owner is registered under operating surplus and not personnel cost. The average gross value added per employee was EUR 66,000 in the EU27 in 2009. There are significant differences between Member States, which partly reflect differences in average wage levels. Correcting for these differences, highest productivity levels are achieved in Romania and Bulgaria, while Hungary, Ireland and Italy have the lowest levels. There are some indications that lower productivity may be associated with a smaller company size, but available data are not conclusive.

48
Study on business-related services
6.3 Downstream relations and market conditions
The engineering consulting sector is diverse and involved in different areas of activity, related to e.g. buildings, infrastructure, public utilities, and industrial plants. For most companies in the sector, construction is the main client sector, with transportation, environment and energy being other important client sectors. In terms of the services provided, a distinction is made between specialist engineering consultants (often SMEs) that provide a single service to their client or several services to a specific sector and generalists (typically large firms) that provide multidisciplinary services. Although there are differences between sectors and countries, the prevailing trend is that customers ask for an integrated process from design to operation (such as DBFO- Design, Build, Finance, Operate), as they want to focus on their core activities. The increased outsourcing by major clients and the increased demand for multidisciplinary services have resulted in larger assignments and contracts. Partly as a result of this development, an increasing number of engineering consultants now covers the entire supply chain and this trend is likely to continue. Price is also an important factor for competition in the sector. This is especially true for contracts with public clients as the use of procurement rules favour transparent parameters. In order to reduce costs, engineering consulting companies have moved some of their activities to lower-cost countries such as India, although there are also companies that have moved activities back due to problems with culture, distance and differences in perceived quality levels. Outsourcing mainly seems to be applied for standard solutions. For smaller clients, trust and management of client relations are vital for the engineering consultancies to remain competitive, next to good knowledge and insight into local market conditions, requirements and client needs. The size of client companies plays a role in the degree of innovation, as innovation in the engineering sector typically takes place in the project work with large (notably private sector) clients. This can be process innovation, linked to the provision of integrated or multidisciplinary services described above, but also technological innovation. The innovation can take place at the request of a client seeking an innovative solution for a specific problem, even if this may be more expensive in the short run. Other types of innovation are not client driven and are often developed anticipating future client demands (several clients). This latter type of innovation is a prevalent trend, and leads to an increasing interaction between science and industry, e.g. through co-operating on framework projects such as the FP7. This type of innovation also benefits clients. Innovations in the area of sustainability constitute an example where industry-science relations have been successful and the innovations have been commercialised by the sector.
6.4 Framework and regulatory conditions
Labour and skills The engineering consulting sector is characterised by a highly skilled workforce. There is a lack of certain types of engineers (e.g. construction, offshore, energy, infrastructure), and this shortage of labour acts as a barrier to the sector’s development. The problem is less pressing for global engineering companies as these companies can often find the required engineers abroad. In some countries there is also a skills shortage. According to EFCA, the EU skills shortage in STEM (Science, Technology, Education and Math) is considered to be one of the main obstacles to economic growth (EFCA 2011). Several initiatives are being introduced to help remedy the situation.

49
Study on business-related services
Although national labour standards and regulations shape the sector, local presence is more important than differences in or the level of labour regulation. Nevertheless, there are examples of language skills being used for protectionist purposes. With respect to labour mobility in the EU, companies still face problems. Although engineering consultants qualified in a Member State can apply for the recognition of their qualification in another Member State according to the rules defined in the Professional Qualifications Directive, there are situations where the recognition process lasts up to six months and can cost several hundred Euros together with certification and translation costs. Knowledge and innovation As mentioned before, knowledge and innovation can be created in the service company itself as well as in close co-operation with the client. Especially in the case of innovation at the request of clients, it is important to be physically present when developing a new product, service, or process, which is often difficult in a global/international context. A recent study seems to suggest that knowledge management in a company is important for the relation between knowledge-intensive business services (KIBS) and their ability to co-innovate. Market access: internal market and cross-border trade While some services can be provided through cross-border trade (e.g. software, product development), in many cases market presence is required as the work needs to be carried out close to production. When operating in foreign countries, companies therefore open subsidiaries to understand the needs of the local clients. The decision whether to establish a company in a country depends on the business climate and local market conditions, and there are differences between EU countries in this respect. Cross-border work in Europe is also still affected by administrative burdens. Outside the EU, countries such as China, the Middle East, Russia and Brazil provide opportunities for the sector. These are particularly being absorbed by large engineering consultancies which are financially better able to deal with the challenges for foreign expansion. Standards and regulations The client sector varies and so do the standards and regulations to which engineering consultants must adhere. In general, the standards and regulations of the client sector do not present large barriers to engineering consultants but obviously need to be considered in the project. In the construction sector, which is the largest client sector, Eurocodes were introduced in 2009 as common standards for technical design and construction of buildings and are reported to work well.18 According to EFCA, sector level standards and regulations vary considerably from country to country, but they do not create a major barrier to trade across EU borders. The reason for this variation is primarily to be found in how the engineering consultants and contractors traditionally have divided the work and client responsibility19. Public procurement is also important for the sector. There are some clauses in the European Public Procurement Directive that support innovation but that could be promoted more, although not all projects lend themselves for innovative solutions. Another issue related to public procurement is that public contract documents are often published in the national language, making it difficult for foreign engineering consultants to bid for a project, although this problem is limited by the fact that engineering consultancies rarely enter a market where they are not present or have a local partner.
18 http://eurocodes.ds.dk/en/what-are-eurocodes/ 19 Interviews with FRI, Ramboll.

50
Study on business-related services
6.5 SWOT analysis
The following tables provide an overview of the strengths, weaknesses, opportunities and threats (SWOT) for the engineering consulting sector. Strengths
• Close relationships with clients – “trusted advisors”
• Large companies: Multidisciplinary staff – can be moved to other business areas in times of crisis
• Large companies: Provider of multidisciplinary solutions – can meet the clients’ needs
• Small companies: close relations with contractors
Weaknesses • Medium-sized companies: lack of
ability to provide multidisciplinary services and too large to be a niche player
• Lack of visibility of engineering consultancy services – companies are not good enough to promote themselves
Opportunities • Creating innovation together with
universities • Clients become more educated &
professional • Increasing life-cycle and quality of life
considerations by clients, thus making it possible for the engineering consultants to provide services along the clients’ value chain
• Low barriers: relatively open markets and competition (potential for innovation)
• Contractors as clients and partners (especially for small companies)
Threats • Price competition • Credit crunch • Labour shortage • Skills shortage / lack of qualified staff • Limited political focus on promoting
engineering consulting as a high-profile sector
• Public clients’ knowledge of engineering consulting services is insufficient and can result in price competition which in turn can reduce the incentive for creating innovative solutions and/or the quality of the solution

51
Study on business-related services
7 SWOT analysis of business services: a synthesis of the sector studies
Although the sectors analysed in the previous chapters are diverse in their characteristics and development (see chapter two), this chapter assesses the commonalities and differences between the sectors, by analysing the strengths, weaknesses, opportunities and threats (SWOT).
7.1 Strengths
The common strength of all service sectors is that they have been able to develop in a way that fits their clients’ needs. In most of the sectors large European companies are among the top players in the world. Larger companies have been able to do this mainly by diversifying their services (notably in technical engineering, cleaning, and design): they do not only provide their core expertise to the client, but also provide other services in the value chain, thereby enabling their clients to focus more on their core activities. The increased multidisciplinarity of the business service providers also makes them less vulnerable in times of crisis. Smaller firms sometimes also offer multidisciplinary services through co-operating with other companies but their main strength is their close relation with clients. There are also (often small) firms that are highly specialised in certain market niches. Trust is important for business services, especially if the service is provided in close co-operation which is the case for many of the knowledge-intensive services (co-production). This trust is created by close relations with the client (especially for small firms), by reputation (e.g. the UK and Italian design sector benefit from a strong design reputation, but also individual companies), or by initiatives to promote quality in the sector. With respect to the latter, private security services have for example taken several initiatives for professionalisation (training programmes, development of quality schemes) which can be considered a strength. A strength of the knowledge intensive sectors is the level of innovation and the role they play in their clients’ innovation.
7.2 Weaknesses
The market structure is considered for many sectors to be a weakness. For most sectors, this is reflected in the prevalence of micro and small companies. These companies are often not able to serve large clients, have limited scope for quality and productivity enhancement, and can also suffer from a lack of business skills. In advertising and market research, this is also an issue but at the same time the increased level of concentration and scale enlargement is considered a weakness as it results in low competition. In most sectors there is a ‘missing middle’ (see also chapter 2), which is explicitly noted in the technical consulting study: middle-sized companies are too small to provide multidisciplinary services but too large to be a niche player. Market fragmentation also reduces competition in business services. This can be due to cultural and linguistic barriers (as noted for the design sector), and differences in national legislation and

52
Study on business-related services
regulations (particularly relevant for the private security services), which limits internationalisation of the sector. For industrial cleaning and private security services the low wage levels and often unfavourable working conditions (e.g. working times outside office hours) are a weakness, making the sector unattractive to work in. Especially in industrial cleaning an additional weakness is the grey market and also the illegal working practices by some service providers, which leads to unfair competition and has negative social consequences. Although all business services are sensitive to the business cycle, this appears to be a particular problem for advertising and market research and private security services, probably because these have a less direct effect on the production process-production can continue without these services. For design and engineering consulting services the visibility of the sector and the ability to promote themselves are considered to be disadvantages, as client sectors do not seem to be fully aware of the positive contribution these services can make to their performance. The limited awareness and ability to protect intellectual property rights has been highlighted in the studies on design and advertising and market research.
7.3 Opportunities
Despite the current economic situation, there are a number of developments that provide opportunities for the sector to expand. For some sectors, the economic downturn may cause clients to seek cost savings from outsourcing of certain services. They may also prefer to outsource activities to be more flexible in terms of costs. This may be the case in sectors like industrial cleaning and advertising and market research. Especially in less developed and peripheral Member States there seems to be scope for further expansion of the services sectors due to this outsourcing. For example, market penetration of industrial cleaning providers is much lower than in larger Western European Member States, which suggests there is room for catching up. Client companies can also be induced to outsource more activities if service providers can offer specialised services or offer multiple services, a trend already observed over the last years. In addition, new services can be provided. The introduction of evidence based marketing consultancy based on real-time and online market research and consumer involvement possibilities in response to the advent of ICT is a case in point. The internationalisation and globalisation of clients provides opportunities for larger service providers who are able to provide their services internationally. For many sectors, technological developments and innovation (have the potential to) increase the value added of the services provided and hence benefit clients. For example the use of social media in market research makes it possible to better target consumers for clients. Digital advertising is increasing and this is for a large part additional demand (rather than replacing existing demand through other types of advertising). Increased co-operation between service providers and universities in engineering consulting create opportunities for innovation and using the acquired knowledge for clients. Technological developments may also alter the way a service is provided, e.g. in industrial cleaning it may be possible to work during the day due to more silent vacuum cleaners. More generally, the increased importance of (non-technological) innovation and

53
Study on business-related services
increased awareness of the role of knowledge intensive services especially can play in this respect is increasingly recognised. Growing attention for and investments in sustainable growth provide opportunities for design services and engineering consulting services, as these sectors can play a role in finding solutions that contribute to sustainability (e.g. energy efficiency in buildings, minimising the amount of material required in product design). But also in other sectors the focus on sustainability offers opportunities, e.g. in industrial cleaning it may involve the use of environmentally friendly products or reduced water use. There are also opportunities that are more sector specific. For the creative sectors, opportunities are provided by a deepening of the ‘experience’ economy where authenticity, creativity and the story behind the good or service have gained importance. This has increased the demand for personal luxury goods, and in turn has had positive effects on the available budgets for design and advertising and market research. This also increases the demand for these services in emerging economies, including in Central and Eastern European Member States. For security, a decline in the public capacity to provide security services leads to outsourcing and the development of public-private partnerships for security provision. For both design and security, social developments are considered to provide opportunities. E.g. the need for security may increase with developments like the individualisation of society and migration flows. With regards to design the EU’s commitment to tackle societal problem like climate change provides opportunities.
7.4 Threats
Threats to the business services can probably be better called challenges: if companies find a way to deal with these challenges they are likely to be successful in the market. The current economic situation can be considered a challenge, given the sensitivity of business services to the business cycle. It also leads to reduced access to finance, needed for companies to innovate and/or expand. Another trend that is partly related to the economic situation is found in marketing and advertising: clients are less willing to enter into long-term contractual agreements but prefer to have more flexibility. This can be because of cost reasons and because of a desire to get fresh ideas. In a number of sectors, competition has increased and is likely to increase further. This can be competition from abroad as well as competition from other sectors, which also seek new markets to counter the economic downturn or that can enter the market because of technological developments (e.g. ICT companies in digital security). Although sector stakeholders may consider this a threat, it should be noted that this is especially true for the position of the incumbents – at the same time it may also bring benefits to newcomers. Especially in design services there is increased competition from the emerging Asian economies, where partly as a result of increased local markets for design, the number and quality of designers is increasing. In advertising and market research, EU turnover is growing at a slower pace than in other parts of the world, which is likely to affect the market position of EU companies. Some sectors

54
Study on business-related services
are also affected by the fact that the European industrial base is declining and production and innovation activities are relocated outside Europe. As most services require some kind of proximity of the service providers to their clients, this reduces their market unless they are able to follow their clients abroad by opening offices locally. Increased competition from other services is taking place in several sectors: e.g. management consulting companies compete with design companies in strategic design, ICT companies focusing on ‘digital security’ with private security providers. Procurement conditions have also been identified as an area that may affect the sectors. There is often a strong emphasis on the lowest price rather than the best value for money (combination of price and quality), especially in public procurement, and many sector stakeholders indicate that this affects the quality of the services they provide and/or the level of innovation in their services. The extent to which this is really the case is difficult to judge. For clients a focus on price may be a valid argument as cost considerations may be the primary reason to outsource certain services (especially in areas like industrial cleaning). In addition, there has been extensive discussion in literature on the trade-off between lower prices and innovation, but the common idea is that competition may also induce innovation (especially in the absence of scale economies), e.g. as witnessed in the diversification of services provided by some companies over the last years. With respect to labour, especially the industrial cleaning and private security sectors face a challenge in attracting and retaining employees, mainly as a result of the relatively low wage levels, the part-time nature of the work, and the poor image of the sector. Demographic developments may exacerbate the problem with an expected decline in the available workforce in the near future. This is closely related to the need for professionalisation of these sectors through training and career development. Also in engineering consulting a labour shortage may affect the sector: there is a lack of certain types of engineers and in certain countries also a skills shortage in STEM (Science, Education, Technology and Math). In the design industry there is no shortage of labour and in some markets even an oversupply of design graduates. Nevertheless, there appears to be a growing mismatch in education and required skills as the current education still focuses on design as a ‘technical’ subject and pays less attention to developments like ‘design thinking’ which requires a more diverse set of skills. In a number of sectors there are other specific issues that limit the scope for expansion. For example, in private security services current public attitudes and regulations limit the use of private security services in sensitive areas. In design and engineering consulting there is too little knowledge about the value added of design in client companies and this hampers the development of a good policy framework, e.g. to promote the sector better.

55
Study on business-related services
8 Market failures relevant to business services
In the previous chapters we have identified a number of cross-cutting issues that may affect the performance of the selected business services sectors and their client sectors. These are notably the limited number of middle-sized companies (‘missing middle’), an apparent market segmentation between small and large companies, limited increases in productivity compared to the goods sector, asymmetric information between providers and clients of the services, and spill-overs between the selected service sectors and their client sectors (both positively and negatively). This chapter addresses these issues in more detail to identify whether certain issues are related to market failure, as market failure can provide a reason for government policy intervention. We do this under the three headings 1) Market structure; 2) Asymmetric information; and 3) Spill-overs.
8.1 Market structure- existence of entry and exit barriers?
All four services sectors showed a more or less similar market structure, with the prevalence of micro and small enterprises, including a large number of self-employed, and a limited number of large players. The large players however often dominate the market: in advertising and market research, industrial cleaning, and private security services large companies account for more than half of the total EU turnover in their sector. Only in the design sector, the small companies account for the majority of the market, while in engineering consulting, there is a difference between Northern and Southern Member States: whereas in the North the large ones dominate the market, in Southern Member States large companies are less prevalent and important in the market. The question is whether this market structure is a problem. We did not identify clear examples of abuse of market power by large companies. But recent research provides some indications that small companies in business services are associated with a lower productivity performance (see section 2.2), which would suggest that especially the prevalence of small companies is a problem in the sense that service delivery is relatively inefficient. It would also suggest that the problem is not so much in entering the market, but in growing from a small to a medium or large company. Although this study cannot fully explain the issue, there are a number of observations we can make based on the sector studies. On the one hand, there are signs of market segmentation20 in the business service markets. This could explain why small firms with lower productivity levels can survive in markets dominated by a few large players. More specifically, to some extent large and small players seem to be operating in ‘different markets’ and are thus not competing with each other - growing from a small company into a large company would therefore mean switching between markets. While large service providers often have large clients (e.g. as observed in the industrial cleaning and advertising & market research sectors), small service providers usually have small clients and operate locally. It should be noted that this is not true for the entire sector, e.g. there are also large companies providing services to small companies or small companies delivering services to larger clients. The latter is more likely if the small companies are particularly innovative or operating in a certain niche, although the provision of services to large clients also takes place indirectly, through co-operation with larger service providers. It can also relate to the divisibility of the services to be provided, for
20 It should be noted that market segmentation is common way for companies to address different clients with different
products and approaches. Here we talk about segmentation by size specifically, not only in the demand but also the supply side.

56
Study on business-related services
example a large client may use a number of smaller providers where the service can be supplied on a project basis (e.g. design services). There are a number of possible explanations for this market segmentation. For example, especially for small clients search costs may play a role- searching for possible service providers takes time and money. In addition, these clients may be less aware of the added value that service providers can bring to their business and instead focus more on cost and flexibility of service providers. A good match between client and provider raises the effectiveness and chances for successful service provision and absorption. Search costs and lack of matching expertise and capabilities may prevent small (large) clients to engage with large (small) providers. Such a pattern tends to persist over time. This is also related to the fact that business services are experience goods- you only know the value of the service after it has been provided. The experience good aspect of service delivery de facto raises switching costs, as a client can better assess the value of a service transaction when he has worked with the service provider previously. The focus of small companies on low costs and flexibility may also be one of the reasons why large service providers do not target small clients. Once the small clients have selected a service provider and are satisfied with the services delivered, they are therefore also less likely to change this provider. This is one of the reasons why good client relations are crucial for small business. For large clients, search costs are less important, considering that these costs are smaller in relation to the potential efficiency gains that are involved due to scale effects. In addition, the ability of large service providers to offer their services in different locations depending on the client requirements or to provide multidisciplinary services will benefit large clients as it reduces transaction costs. The importance of these factors is partly sector-specific. E.g. the delivery of multiple services was observed especially in industrial cleaning and engineering consulting, the ability to provide global services was found especially important for marketing and advertising. The limited importance of large companies (relative to the other sectors) observed in design may partly be related to large clients increasingly having in-house design teams, with thus a reduced need for external service providers. For both small and large companies reputation is important (see also next section) which creates an entry barrier. Next to market segmentation, there may be other reasons that explain the observed market structure. First, there are also signs that micro and small companies (especially self-employed persons) do not always have the ambition to grow, or lack the required business skills to do so. The limited ambition to grow may also be related to ‘exit’ barriers, or barriers related to downsizing of companies, which increases the risk related to expanding the company. These barriers mostly relate to specific policy measures, like laws that limit labour market flexibility, bankruptcy laws that reduce possibilities to start a new business after bankruptcy. In addition, there may be certain market conditions that prevent them from growing, like access to finance problems. Access to finance may be an issue particularly relevant for business services because they produce intangible experience or credence products. Foregoing examples show that regulation is also likely to affect the market structure. The private security services sector study showed a connection between the level of regulation and market structure: in Member States with strong sector regulation, the total number of companies tends to be smaller and large multinational companies tend to dominate the market. This may be due to the fact that stricter regulations increase the costs of service provision and act as a market entry barrier (although not necessarily to inefficiency). Also in an international context, regulation is likely to

57
Study on business-related services
affect market structure: access to foreign markets increases the size of the market, thus allowing service providers to expand their size and reap economies of scale.21 However, internationalisation is still limited among small and medium sized business services providers. The sector study results have not identified any regulations that prevent international market entry, but show that differences in regulations (intra and extra EU) raise the costs of doing business internationally, which prevents service companies to increase their operations. In addition to limiting scale economies from exports, the regulatory differences also have an effect on imports, while imports increase competition they also help to increase efficiency. In summary, there are a number of valid economic arguments explaining the market structure that are not related to market failures, related for example to transaction costs and market segmentation. There are also elements that may point to market failure, notably: • lack of awareness among clients about the added value business services can bring to their
performance; • the characteristics of an experience good: the value of the service is only known after
consumption; • lack of business skills among micro and small enterprises; • lack of access to finance; • high search costs (only to the extent it concerns information asymmetry, see next section). These are therefore areas where policy interventions may be justified. In addition to possible market failures we identified that certain laws and regulations may prevent service providers from growing (related to differences in regulations between countries, but also to labour laws, bankruptcy laws and certain policies/regulations related to company size (e.g. tax and administrative requirements)) which may limit their efficiency. These issues will be discussed in the next chapter which presents the policy recommendations.
8.2 Asymmetric information
In the previous section, we already noted that selecting a service provider involves search costs for client companies. This is related to the fact that with services, the quality of outputs cannot objectively be assessed in contrast to some physical goods. Standards are less prevalent in business services, as analysed in section 2.4. If a client wants to know if it will get services of good quality, it has to rely more on subjective factors, like reputation and personal experience, which contribute to higher search costs. Likewise, providers rely on co-production by their clients. This implies that clients should provide a good scoping of the service requirements and purpose beforehand and commitment and absorptive capacity during co-production to ensure effective provision and use of the service. Information on the quality of each of these participation aspects of clients is difficult to assess by the provider when considering what assignment to tender for. The market for business services is thus characterised by asymmetric information.22 In the service to consumer market there are various private business initiatives to reduce this information asymmetry, notably by increasing transparency for potential clients. Examples include websites containing customer reviews (e.g. in the tourism sector) or websites comparing different service providers in price and quality (e.g. comparing different insurance providers). We have not encountered such examples in the sector studies. This is probably due to the fact that the
21 This argument would especially be valid for somewhat larger companies-or niche players- not the smaller ones providing
‘general’ services as most of them operate only locally, not even nationally. 22 Although the problem of asymmetric information may be relevant from other perspectives as well (e.g. in access to
finance), we focus here on information asymmetry in the interaction with the client notably the selection process.

58
Study on business-related services
consumer service market is homogenous and therefore more transparent than the business services market in the sense that it is easier to obtain information on the services provided. This in turn is partly related to the higher degree of customisation in business services. It is difficult to compare customised services. In addition, service providers are less likely to be transparent about their offers, as this will reveal confidential information on how they address a certain problem (approach) at what costs (budget), which could possibly benefit their competitors. The above is linked to the degree of standardisation of a service. The more standardised is the service, the easier it is to provide meaningful price/quality comparisons. Another explanation could be that these kinds of websites are often private initiatives from companies that see the market value of this information- they can attract a large number of visitors to their website, which generates interests from companies willing to advertise on these websites. Similar initiatives for business services are less likely to attract an equally large number of visitors and are thus commercially less attractive. Apart from these initiatives, there are industry led initiatives that increase transparency. The latter include requirements for memberships of professional associations / certification schemes / industry codes of conduct etc. These can also be considered as initiatives to increase transparency about the quality of service provision. We have seen such initiatives in for example market research (codes of professional conduct) and marketing (recognition of professional qualification). These initiatives are closely linked to service (process) standards, and stay relatively more limited than for goods sectors. The limited use of standards in the service sector was confirmed in our sector studies. Of course, business services have to take into account the standards of their client sectors. This is notably important in engineering consulting and industrial cleaning. But we did not find extensive use of sector-specific standards. Only market research companies increasingly seem to be making use of international industry-specific ISO standards, like 20252:2012. This is a process quality standard, which establishes terms, definitions and service requirements and deals with issues such as data collection, data management and processing, and project documentation. The standard does not address design quality as there is no consensus on what constitutes quality and because ‘good’ quality design will partly depend on the purpose of the research. Nevertheless, use of the standard allows companies to carry out cross-border, multi-country research studies as the standard helps to regulate cultural, social and behavioural differences between countries, thereby reducing the barriers between countries.23 In private security services, there is some self-regulation at national and EU level through the relevant associations. An example is the establishment of a code of conduct that addresses among others the selection, recruitment and training of workers. This is not a formal standard and thus not checked by an independent organisation as in the case of ISO standards. The application of standards is more difficult in sectors with a high degree of customisation, and given that three out of four sector studies are KIBS with highly customised goods, the limited use of standards is not a complete surprise. It should also be noted that the initiatives identified in the sector studies confirm the findings from the literature (section 2.4) that standards in the services sectors are focused more on process than on product. This implies that even if standards are applied, they still do not give a guarantee for a certain quality and thus only partially reduce the information asymmetry problem. There may be more scope for performance standards in more standardised business services. In this study, industrial cleaning is the sector delivering most standardised services. Indeed there were some initiatives for standards in this sector, as in 2001 CEN produced a standard on cleaning services. This seems to have generated little interest for the sector, however, and the technical committee dealing with cleaning performance was declared dormant in 2008. Still there may be scope for such standards, as for example Sweden, Norway and Denmark have been able to develop a Nordic standard INSTA-800 (revised and published as 23 Based on BSI website.

59
Study on business-related services
INSTA 800 E:2007 – ‘Cleaning quality – Measuring system for assessment and rating of cleaning quality’).24 This striking difference in experience may have to do with the fact that there are differences in opinions as to the extent to which cleaning services are standardised. Although participation by clients generally remains mostly limited to the procurement stage, this already implies that the service provided is specific to the requirement of each client. Acceptance of a Nordic standard in contrast may reflect the fact that market conditions are quite similar in these countries and leading companies are already operating at a regional level. Concluding, market asymmetry is a market failure putting clients at a disadvantage and there are less initiatives to reduce the information asymmetry as compared to the goods sector (standards) or consumer services (transparency initiatives). This issue will therefore be further addressed in the next chapter on policy recommendations.
8.3 Spill-over effects
Given the linkages between business services and other sectors of the economy, the performance of the business sector will have effects on other parts of the economy as well, the so-called spill-over effects. The limited increases in productivity in business services (see section 2.1, 2.2) affect productivity of the economy as a whole (negative spill-over effect). On the other hand, KIBS can also especially contribute to the innovation of their clients, generating positive spill-over effects. This latter effect is confirmed by the sector studies. In the economy, these kinds of spill-overs are often not or only partially reflected in the price of a product, and can therefore be considered a market failure. We encountered several examples of the positive knowledge spill-overs that contribute to innovation for clients. • Clients benefit if service providers can bring experience from similar clients: they already know
some do’s and don’ts and what works better or not, which leads to more efficient and effective service delivery for the next client. Also experience in other countries can help to develop new ideas. This is valid for all sectors.
• Clients benefit if the service providers can bring experience from other client sectors, e.g. solutions in one specific sector can be ‘transformed’ or partially applied in other sectors as well.
• Clients benefit from multidisciplinary service providers- either from one service provider or from a consortia of companies. The innovative solution for building the tunnel under the Fehmarnbelt between Denmark and Germany in the engineering consulting study is an example of this, or the development of digital security in private security services.
• Clients benefit from co-operation of service providers with universities. This is also particularly relevant for the engineering consulting sector. Often these service providers try to establish links with universities, in anticipation of future client demands. Sometimes potential clients also participate in this co-operation, e.g. in projects under the FP7.
• Clients benefit from innovations/ special areas of attention of the business service providers. These can include societal developments- e.g. in design and advertising the ‘experience economy’ idea has been picked up and they feed this into their clients. Also the attention for sustainability is partly driven by the attention for this in the business services, as found particularly in the design and engineering consulting sectors.
As can be seen from the above, there are often knowledge spill-overs both ways- it is not only the client that learns from the service provider but the service provider also learns from the client, which
24 For details, see Technopolis (2010), “Mapping service standardisation in Europe”, Report for the Danish Enterprise and
Construction Authority.

60
Study on business-related services
is partly due to the relative importance of co-production for the KIBS. This co-production thus internalises the knowledge transfer to some extent. It is clear that innovative solutions of service providers (whether in co-production or not) can have a significant impact on clients. For engineering consulting this is best visible as it is relatively easier to quantify the impact. For example, an engineering consultancy company led the design process for the Shell Technology Centre that resulted in a building where all electricity is generated by a North Sea wind farm and includes other notable features such as an underground thermal storage system that controls indoor temperature. Compared to conventional installations, it is estimated that the new building produces 60% lower CO2 emissions.25 In the consulting engineering sector it was also found that private companies are often more open for innovative solutions than public clients and sometimes even explicitly ask for this in their tenders. There are often good reasons for more standard solutions in a government project (e.g. budget considerations), but it is also partly related to procurement rules and the measurement of innovation. Although there are clauses in the EU procurement rules that allow one to assess bids on factors other than price, including innovation, in practice innovative concepts are not explicitly rewarded, also because it is difficult to find objective indicators to assess the innovative concepts and compare them. Given the important spill-over effects of the service sectors, there may be scope for policy intervention to further promote these spill-over effects. This topic is therefore further discussed in the next chapter.
25 http://www.arcadis.com/Projects/Shell_Technology_Centre_Amsterdam.aspx

61
Study on business-related services
9 Policy recommendations
Based on the literature review, data analysis, the four sector studies and the identification of possible market failures in the previous chapters, this chapter distils policy recommendations to address the identified market failures. Although we grouped them under three headings in line with the identified market failures, it should be noted that some policy measure may (partially) address several market failures at the same time. To avoid overlap, we make cross-references where relevant.
9.1 Reducing information asymmetry in the interaction with the client
The previous chapter (section 8.2) showed that the initiatives in business services to reduce information asymmetry between client interaction (i.e. to inform the potential client about the quality of the service provider) are limited compared to the goods sector (standards) or consumer services (transparency initiatives). However, they can still have several advantages such as contributing to transparency of services quality. Moreover, they can, for example, also stimulate innovation and competitiveness.
Information asymmetry: standards in market research and possible competitiveness impacts
An example of the use of standards in business services is provided in market research. Industry standards
serve to formalize deontological codes of conduct and rules that ensure good quality and ethics in market
research. These standards imply that the practice of market research continuously needs to evolve and
innovate, driven by for example new communication technology and social media platforms, to safeguard
good professional and ethical conduct. While adherence to these standards provides an implicit quality
label that is a competitive asset, new technologies also imply that boundaries between direct sales
activities and market research are increasingly fluid. Agencies that have their core business in direct sales
and telemarketing move into the market for market research, without necessarily complying to the sector’s
deontological rules and standards. Despite the quality signalling of standards, these new entrants
increasingly pose challenges to the competitive position of incumbent market research agencies, for
example by price cutting in order to use spare capacity to do assignments in market research.
One of the tools to reduce information asymmetry in the interaction with the client is the use of standards. For the basic business support services like industrial cleaning, there is a Nordic standard for the sector. As the performance standards in this field are not very wide spread yet, it remains to be seen, what the success factors have been that led to the development of this standard and to identify the benefits as perceived by the clients of the service providers using the standard. As the Nordic initiative shows, standards could be one of the right tools to promote the performance of a sector; this is why their promotion throughout the EU might be envisaged. Given the high-level of customisation of especially knowledge-intensive and creative services (design, advertising and market research, engineering consulting), creating performance standards for these type of services might be quite challenging. Process standards are more likely to be achieved, although these would only partially lower the information asymmetry problem, as they do not guarantee a minimum level of quality. The benefits of standards will also depend on whether they are adopted at national or EU/international level. If standards are adopted at the international/EU level they can regulate or reduce differences between countries (as in the case of the ISO standard for market research),

62
Study on business-related services
thereby reducing entry barriers and facilitating the internationalisation of these business services (section 9.3). If they are adopted at the national level, however, standards may differ between countries, causing additional costs and thus entry barriers when companies want to provide their services abroad. A recent study 26 indicates that there might be a risk of entry barriers in notably security and cleaning services, given the multiple certification schemes linked to several different sets of requirements in several different countries in these sectors. A possible role of the EC would therefore be to monitor and support (the development of) standards in the business services sector especially at the EU level (to limit the possibility for standards to create entry barriers). SMEs should be helped so that standards adoption and formation become more accessible to them. Minimum labour qualification standards for the staff of service providers could also help to give some indication of the quality of the services that will be provided, although the benefits may be limited as experience and can often be more important than education. Another avenue to reduce information asymmetry for clients in the selection of business service providers is to increase transparency in less formal ways than standards. As noted in the previous section, there is probably less scope for private initiatives in business services like in consumer services (website with consumer rating of services, or websites offering comparisons between services). But reputation is only partly tacit and relation-specific. There is also some kind of ‘evidence’ for reputation, for example in the form of project references, CVs of service providers, or letters of satisfaction of clients. The availability of this information could help clients in their selection process. As asking different companies for this information would still involve considerable search costs, however, there may be scope for initiatives to collect this information from different companies, e.g. through national or European associations, and make this publicly available. The advantages and disadvantages of such initiatives could be further discussed with relevant stakeholders.
9.2 Enhancing innovation and knowledge spill-overs
This study has clearly confirmed the existence of knowledge spillovers of business services, especially for knowledge-intensive and creative services (advertising and market research, design, engineering consulting services). These positive effects create room for policy makers to further promote these spill-over effects. Promoting spillover effects starts with contributing to good quality service providers. This means first that it is important that education is geared towards requirements of the market. In the study, we found there is a particular concern about the availability of labour with the right skills in engineering consulting, where the science, mathematic and technological skills appear to be lacking. There are various initiatives (mostly at national level) to improve the situation, which could be further promoted. A forum where Member States could meet, exchange information and learn from each other could be a viable first step. In design, education was found to be still focused on ‘pure’ design, rather than on ‘design thinking’ which has become more important in the market, and involves among others working multidisciplinary teams. Initiatives to create more linkages between education and business and the sector could help to reduce this problem. Increasing the availability of skilled staff would also contribute to reducing entry barriers (section 9.3). Closely related to the above are the positive effects of co-operation between universities and business service providers, to make sure on the one hand that science focuses on issues that are important to solve current and future society demands (e.g. increasing energy efficiency) and on the 26 Technopolis (2012) A study on services certification linked to service standards at national level in Europe.

63
Study on business-related services
other that innovations are commercialised. Business representatives in university boards, co-operation between business service providers, universities and possibly also clients in for instance FP7 projects should therefore be stimulated. A study by Nesta (2008) reports that creative industries can foster innovation in their clients. Stronger business linkages between creative services and their industrial clients tend to go along with stronger innovation performance. Combining expertise from university research and creative services consultancy could further enhance knowledge creation and spill-overs into downstream manufacturing industries. An example would be the combination of academic technological know-how and design and marketing expertise to promote energy and resource efficient production and consumption. In general, universities are more open towards cooperation with business to develop applied knowledge for use in innovative product and process solutions that are commercially viable and socially beneficial. Government initiatives that recognize this potential for complementarities, synergy and spill-overs between university research, business services and industrial clients are increasingly common, both at national level and at the EU level (e.g. FP research programs). In order for business services providers to keep contributing to innovation of the clients, it is also important they will innovate themselves and invest in this. Policy could play a role in creating the right incentive structure, e.g. with financial, fiscal or institutional incentives. Also better protection of IPRs could benefit innovation in the sector. The sector studies confirmed that that business service providers hardly protect their IP. This is an area that should be further investigated. The case study for advertising and market research pointed at the increasing importance of the design and governance of IPR in a context where cross border trade in creative services is growing fast, business models of agency-client interaction are changing and new flexible arrangements of services provision (e.g., crowdsourcing) emerge. IPR policy is important in shaping the incentives for innovation and risk taking in services provision. A successful marketing campaign can be extended across borders or partly inspire new campaigns, leading to spill-overs of knowledge and appropriation of rents. The arrangements for who owns what in terms of IP, which constructions for licensing apply, and which parts of intellectual assets should be protected or not are important for the continued development of productivity, effective service provision and shared efforts in co-production. New developments in ICT are an important channel for innovation in business services and in enhancing interaction with client sectors. ICT investments can help firms to increase productivity by allowing them to expand their product range, customize their products, reduce inventories and respond better to client demands. Web based advertising and market research offer examples of how new ICT technology can help to create new value for clients in terms of targeting consumer markets, involving consumers in product development and generating brand loyalty by associating to consumer life styles. Although ICT investments by EU service sectors have contributed to productivity, the impact on productivity growth has been much lower in Europe than in the U.S., Australia and Canada. This holds in particular since 1995 (e.g. Triplett and Bosworth 2006). In the EU, the UK and Finland appear to have been best able to generate productivity growth in services. This low productivity growth, in particular for business services, contributes to explaining the gap in productivity growth between the EU and the aforementioned countries. The uptake of ICT investments has not yielded the same level of productivity advantages in the EU. Empirical research has uncovered a link between the extent of competition and regulatory burdens in services and productivity growth. Particularly for technology-driven ICT producing and ICT using sectors, weak competition and regulatory burdens (such as regulation-linked start-up costs, labour inflexibility and exit costs) are harmful for productivity growth. ICT can and does play an important role in the way business services contribute to economic performance and development. However, specific factors that limit competition and market selection in service sectors, such as regulatory

64
Study on business-related services
burdens, need to be addressed to increase uptake of ICT and improve innovation capacity in business services. Sustainability is another direction that business services could take in order to boost their performance. The sector studies have shown that business services (notably design and engineering services) have played an important role in finding solutions that contribute to a better sustainability. For example, in the engineering consulting study, the engineering of the Shell Technology Centre is a case in point. The design process for this Centre (led by an engineering consultancy) resulted in a building where all electricity is generated by a North Sea wind farm and it includes other notable features such as an underground thermal storage system that controls indoor temperature. Compared to conventional installations, it is estimated that the new building produces 60% lower CO2 emissions.27 Also design can have an impact on the environment in different ways (Deniz 2002): e.g. through the extraction of raw materials, e.g. by minimizing the total amount of materials required and opting for the least polluting materials (‘material design’), through the design of the manufacturing process focusing on the reduction of energy consumption and the minimisation of waste and pollution process (‘process design’), through how the product is used and distributed and what happens when the product reaches the end of its useful life (e.g. bio plastics that break down in salt water). But also in a business service sector like industrial cleaning there are sustainability issues, like the use of environmentally friendly cleaning products. Given the EU’s focus on sustainable growth (see e.g. Europe’s 2020 strategy and policy initiatives like the energy efficiency plan 2011 and the Sustainable Consumption and Production and Sustainable Industrial Policy Action Plan)28 and the new industrial change that is linked to it29, this is an area for continued growth. In various EC Communications on industrial policy, the important role of business services in the value chain (both in terms of innovation and competitiveness) is recognised, and several planned policy initiatives will also be relevant for business services (e.g. standards, IPR, access to finance). It is important that the policies will take into account the specific needs of business services, given their role in the value chain. Procurement could foster innovation. One of the findings is that large private clients are more open to (or even stimulate) innovative solutions from business service providers than governments and small clients. As innovation and its effects are difficult to measure, there is often a focus on other factors, notably price in public procurement. The development of key performance indicators (KPIs) has been put forward as a way to make the innovative tenders more transparent without using price as the decisive factor. For instance, the European Electricity Grid Initiative has developed a number of KPIs which sets out to measure, ex ante, the economic effectiveness of the innovations. It is however not always easy to develop such indicators. The sector itself could be challenged to develop performance indicators which would help to put more emphasis on innovation and quality. Another possibility to promote more attention to quality and innovation in procurement is put forward by the engineering consulting sector. This sector suggests putting increased focus on the life-cycle of built assets (initiative-initiation-design-construction-usage-end of life). This means that clients will be made more aware of the effects of the solutions in the long-run. For example, if a certain innovative solution may be more expensive, but will result in a significant reduction of annual energy costs that outweigh the initial additional investment costs, this innovative solution is more likely to be selected. This is interesting to explore further. Possible drawbacks like the need to make more technical information available to bidders beforehand and the tendency of bidders to overestimate long-term effects need to be taken into account. 27 See http://www.arcadis.com/Projects/Shell_Technology_Centre_Amsterdam.aspx. 28 Communication from the Commission to the European Parliament, the Council, the European Economic and Social
Committee and the Committee of the Regions of 25 June 2008 on the ‘Sustainable Consumption and Production and Sustainable Industrial Policy Action Plan’ [COM(2008) 397 final].
29 See e.g. http://ec.europa.eu/enterprise/magazine/articles/industrial-policy/article_11038_en.htm.

65
Study on business-related services
These possible ways to award innovation in procurement are particularly relevant to technical innovation (e.g. in engineering consulting and to some extent design) rather than more soft (non-technical) innovation found in marketing and design. This is partly related to the fact that these are experience goods- you only know the value of these products after they have been produced. But still these providers could also think of KPIs themselves, or make their price bid partially dependent on attaining certain achievements. In advertising it was found that physical proximity between service providers and clients can also be important to create or enhance knowledge spill-overs. Also co-location of creative and other innovative industries is found to have positive spill-over effects. Governments may therefore enhance knowledge spill-overs by creating incentives for relevant sectors and companies to locate in certain locations (e.g. in business parks, or shared office buildings/old factories).
9.3 Addressing entry and exit barriers
In Chapter 8 we found that the market structure in business services with many small companies and some large companies can partly be explained by market segmentation, which is to some extent a ‘natural ’result of how markets work. There are also various factors however which make it difficult for small companies to expand to middle-size companies, thus not allowing them to reap economies of scale. Although the extent to which these are real market failures is not always fully clear, they point to a number of areas where policies could help improve the performance of the sector. The Small Business Act (SBA) already addresses various issues that were found to limit the growth of micro and small companies to middle-sized companies, in all business service sectors studied. Notably, it stimulates entrepreneurship- addressing the identified lack of business skills; it helps to improve access to finance for SMEs, which may help them to expand and innovate; it promotes mechanisms to take SME interest into account in new regulations, helping to avoid the creation of new entry barriers; and it promotes a second chance, giving entrepreneurs a chance to start a business also after they had an experience of bankruptcy. Implementation of the SBA should therefore help to address some of the entry or further growth barriers of small enterprises. One could look more into the extent to which business services have special requirements that differ from other parts of the economy that would therefore merit special attention. This may be the case for access to finance, as business services have reputation capital that may not be sufficient collateral to get access to (bank) finance. Market segmentation could diminish when small and large companies would work together more intensively. This improves access to larger markets for small firms. A series of policies could foster such collaborations, including stronger protection of intellectual property (including better enforcement of existing legislation), support of venture capital, and liaison offices to promote business partnerships. Increasing the awareness in client sectors of the added value and what innovation business services can bring to their company may also help to develop the sector and create more medium-sized companies. The design study suggests that promotion of design by the UK Design Council is one of the explanations for the higher incidence of medium-size enterprises in design as compared to other Member States. While the awareness issue was raised several times by the sector representatives interviewed for this project, it is not obvious whether this is connected with failing markets. Why do some client firms underestimate the value of business services to their company?

66
Study on business-related services
One reason here could be lack of absorptive capacity in the downstream companies. In order to fully benefit from professional services, companies need skilled in-house staff to internalise the knowledge provided by the service sector. This is even more important in case of co-production. Such joint production will be less efficient when the client company cannot provide the right staff to interact with the service company. The co-production aspect of service delivery is related to the transmission of tacit knowledge: knowledge spill-overs between co-producers taking place through social interaction. For some business services, such as design and engineering, intermediary public research organizations such as TNO in the Netherlands or FOI in Sweden can play a role in generating and providing absorptive capacity to clients to make effective use of these services (see Canton et al. 2005). An example could be that the research organizations provide testing and showcase platforms for new design or engineering solutions. These platforms can serve to bring together a sufficiently large body of expertise, range of services and technological solutions to effectively inform potential end users (particularly SME) of the possibilities and to work together with clients and providers of services to customize the solutions for effective use by clients. Again, EU initiatives such as network of excellence or demonstration projects under FP research programs can help to generate awareness and involve SME from both the supplier and user sides. Related with this absorptive capacity issue is the fact that small client firms encounter issues with regard to the indivisibility of labour. The company cannot hire a specialised engineer for 50% (or only at a high premium). Small client firms can get access to specialised knowledge by doing business with service companies, but this is only part of the story and client firms also need to be able to absorb the knowledge and turn it into profitable business activities. All in all, the awareness issue may be much more complicated than it seems at first sight, and if the above described mechanisms are at work, then simply trying to raise awareness would only have a limited impact and could be left to the sector itself. Micro and small enterprises also face difficulties to operate in an environment where increased multidisciplinary work becomes more common. There may be a role for business associations of different sectors to create linkages which would help these smaller players to find each other and broaden/improve their services. Barriers to internationalisation are an issue as they reduce the scope for scale economies and also limit competition. Examples are national regulations stipulating required professional qualifications of personnel in services, regulations on legal form, capital ownership and local insurance for services providers (see Kox, 2012). We found that what seem to matter most are differences in regulations that pose additional costs for companies wanting to export their services and consequently limit the internationalisation of business service providers. Initiatives to further harmonise regulations at least in the EU is expected to lead to more international activity of business services. Mobility of staff is also essential for internationalisation of business services. Mobility across borders allows services providers to gain expertise on foreign markets for cross-border trade of business services. In this context, the Professional Qualifications Directive is important to the sectors as it facilitates recognition of professional qualifications, which make it easier to work abroad. At least in the engineering consulting sector the procedures were found to be long and costly, due to large differences in regulations between countries in this sector. Harmonisation would there also here contribute to faster and cheaper procedures. However, in contrast, the profession is not regulated in many Member States and therefore harmonisation might have the counterproductive effect of introducing regulation everywhere which could create additional obstacles to mobility. The European Association FEANI promotes the use of a so-called engineerING card, which documents educational and professional qualifications according to

67
Study on business-related services
international standards. This would improve transparency and thus facilitate labour mobility. Also in marketing there are sector initiatives to reach a uniform professional qualification framework for marketers. Other ways to reduce time and costs should be further explored in the revision of the Directive which is currently taking place, taking into account these initiatives at sector level. It should be noted that mobility of labour is not only important for internationalisation of business service companies, but also for attracting staff and increasing the capacity for effective provision and absorption of services. In some countries there may be a lack of staff with certain professional qualifications and labour mobility could help to reduce the lack of skilled staff, both for the service providers and for their clients. Mobility of staff across countries is still relatively limited in the EU and there are various other policy areas which could help facilitate labour mobility, e.g. improved portability of pension rights, or bridging cultural differences (that is already partially promoted through existing programmes like the Erasmus programme (exchange of students).


69
Study on business-related services
References
• Arnold, J., Nicoletti, G. and Scarpetta, S. (2011): Does anti-competitive regulation matter for productivity? Evidence from European firms, IZA DP, No. 5511.
• Arnold, J., Nicoletti, G. and Scarpetta, S. (2008): ‘Regulation, allocative efficiency and productivity in OECD countries: Industry and firm-level evidence’, OECD Economics Department Working Papers, No. 616.
• Barcet, A. (2010): Innovation in services: a new paradigm and innovation model. Gallouj, F.; Djellal, F. (ed.): The handbook of innovation and services. Edward Elgar, pp. 49-67.
• Barone, G. and F. Cingano (2011). ‘Service Regulation and Growth: Evidence from OECD countries’ The Economic Journal, 121 (September), 931–957.
• Baumol, W. J. (1967), “Macroeconomics of Unbalanced Growth: The Anatomy of Urban Crisis”, The American Economic Review, Vol. 57, No. 3, pp. 415-426.
• Bettencourt, L. A., Ostrom, A. L., Brown, S. W., Roundtree, R. I., (2002), “Client Co-Production in Knowledge-Intensive Business Services” California Management Review, Vol. 44, Issue 4.
• Bettoil, M., Di Maria, E. and Grandinetti, R. (2011) “Market extension and knowledge management strategies of knowledge-intensive business services”, Knowledge Management Research & Practice, 9(4), pp. 305-314.
• Bitner, M. J., Faranda, W. T., Hubbert, A. R., & Zeithaml, V. A., (1997), ”Customer contributions and roles in service delivery” International Journal of Service Industry Management, Vol. 8 Issue 3, p193 -206.
• Bhagwati, J. N. (1984), “Why are Services Cheaper in the Poor Countries?”, The Economic Journal, Vol. 94, No. 274, pp. 279-286.
• Blind, K. (2002). “Driving forces for standardization at standardization development organization”, Applied Economics, 34(16), 1985-1998.
• Blind, K. (2003): Standards in the Service Sector: An Explorative Study, Final Report to DG Enterprise of the European Commission. Karlsruhe. Fraunhofer ISI.
• Blind, K. (2006). Explanatory Factors for Participation in Formal Stadardization Processes: Empirical Evidence at Firm Level”, Economics of Innovation and New Technology, 15 (2), pp. 157-170.
• Blind, K. (2009) “Standardization: a catalyst for innovation”, Rotterdam: Erasmus Research Institute of Management - ERIM.
• Blind, K., Jungmittag, A. (2008), “The impact of patents and standards on macroeconomic growth: A panel approach covering four countries and 12 sectors”, Journal of Productivity Analysis 29, 51-60.
• Blind, K., Hipp, C. (2003) “The Role of Quality Standards in Innovative Service Companies: An Empirical Analysis for Germany”, Technological Forecasting and Social Change 70 (7), pp. 653-669.
• Bourlès, R., G. Cette., J. Lopez, J. Mairesse, and G. Nicoletti (2010). ‘Do product market regulations in upstream sectors curb productivity growth? Panel data evidence for OECD countries’, NBER Working Paper 16520.
• Camacho, J.A. and Mercedes Rodriguez, M. (2007) “Integration and Diffusion of KIS for Industry Performance” in Kox, H. and Rubalcaba, L. (2007).
• Canoy, M. and Smith, P. (2008): Services and the Single market Journal of Industry, Competition and Trade, Volume 8, pp. 319-347.
• Canton, E., Lanser, D., Noailly, J., Rensman, M. and Van de Ven, J. (2005): Crossing borders: when science meets industry, CPB Document No. 98, CPB Netherlands Bureau for Economic Policy Analysis, The Hague.

70
Study on business-related services
• Cattaneo, O. (2010) International trade in services: new trends and opportunities for developing countries, World Bank.
• Conway, P., D. de Rosa, G. Nicoletti and F. Steiner (2006), "Product Market Regulation and Productivity Convergence", OECD Economic Studies No. 43: 39-76.
• Corrocher, N., Cusmano, L., Morrison, A. (2009), "Modes of innovation in knowledge-intensive business services evidence from Lombardy", Journal of Evolutionary Economics, Springer, vol. 19(2), pages 173-196, April.
• Danish Enterprise and Construction Authority, (2010) “Mapping services standardization in Europe”, Final report.
• Deniz D. (2002), “Sustainability and Environmental Issues in Industrial Product Design”, Dissertation for Master of Industrial Design, Izmir Institute of Technology.
• Dixit, A., Stiglitz J. (1977) Monopolistic competition and optimum product diversity. Am Econ Rev 67:297–308.
• ECORYS et al. (2008) “Study on Industrial Policy and Services”, commissioned by European Commission, DG Enterprise and Industry.
• Geis, G.S. (2007) “Business Outsourcing and the Agency Cost Problem” Notre Dame Law Review, Vol 82 no 3 pp 101-146.
• Hipp, C., Tether B., & Miles I., (2000) “The Incidence And Effects Of Innovation In Services: Evidence From Germany” International Journal of Innovation Management, Vol. 4, No. 4, pp 417-454.
• Inklaar, R., Timmer, M. and van Ark, B. (2008). ‘Market services productivity across Europe and the US’, Economic Policy, vol. 23, pp. 141-94.
• Inklaar, R., M. P. Timmer and B. van Ark (2007). ‘Mind the gap! International comparisons of productivity in services and goods production’, German Economic Review, 8(2), pp. 281–307.
• Jungmittag, A., Blind, K., Grupp, H. (1999) “Innovation, standardisation and the long-term production function. A cointegration analysis for Germany 1960–96”, Zeitschrift fuer Wirtschafts- und Sozialwissenschaften (ZWS) 119, 205–222.
• Kanso, A. and Nelson, R.A., (2002) “Advertising Localization Overshadows Standardization”, Journal of Advertising Research, Vol. 42, no. 1, pp. 79-89.
• Kox, H. (2012): “Unleashing competition in EU business services”, CPB Policy Brief, 2012/04. • Kox, H. and Van Leeuwen, G. (2012): “Dynamic market selection in EU business services”,
CPB Discussion Paper no. 210. • Kox, H. and L. Rubalcaba (eds) (2007), Business Service in European Economic Growth,
Palgrave Macmillan. • Kuusisto, A., (2008), “Customer roles in business service production - implications for involving
the customer in service innovation”, in Kuusisto & Päällysaho (2008) • Kuusisto, A. and Päällysaho, S. (2008), “Customer role in service production and innovation –
looking for directions for future research”, Lappeenranta University Of Technology, Faculty of Technology Management Research Report 195.
• Lissaur, Q. (2008), “CHESSS Feasibility Study– CEN’s Horizontal European Service Standardization Strategy. Final report”, Project M/ 371-1, 2008, CEN.
• Love, J. and S. Roper (1999), “The determinants of innovation: R & D, technology transfer and networking effects”, Review of Industrial Organization, Springer, vol. 15(1), pp. 43-64, August.
• Merino and Rodriguez (2007), “Business services outsourcing by manufacturing firms”, Industrial and Corporate Change, Volume 16, Number 6, pp. 1147–1173
• Nesta (2008) ”Creating Innovation. Do the creative industries support innovation in the wider economy?”
• Nesta (2010) “Creative clusters and innovation. Putting creativity on the map”, 2010. • Prahalad, C.K., and Doz, Y., (1986), The Multinational Mission: Balancing Local Demands and
Global Vision, New York: The Free Press. • Ritzer, G. (1993) “The McDonalization of Society”, Sage, Newbury Park, CA.
71
Study on business-related services
• Samiee, S., Jeong, I., Pae, J.H., and Tai, S., (2003), “Advertising Standardization in Multinational Corporations: The Subsidiary Perspectives”, Journal of Business Research, Vol. 56, no. 8, pp. 613-626.
• Strambach, S. (2008), “Knowledge-Intensive Business Services (KIBS) as drivers of multilevel knowledge dynamics”, International Journal of Services Technology and Management, Vol. 10, No. 2/3/4, pp.152-174.
• Sundo, J. (2002) “The Service Economy: Standardisation or Customization?” The Service Industries Journal, Vol. 22 No. 4, pp.93-116.
• Swann, G. M. P., (2010), “The economics of standardization: An update”, Report for the UK Department of Business, Innovation and Skills (BIS).
• Timmer, M. P., R. Inklaar, M. O’Mahony, and B. van Ark. (2011). ‘Productivity and Economic Growth in Europe: A Comparative Industry Perspective’, International Productivity Monitor, No 21, Spring 2011.
• Triplett, J.E. and B.P. Bosworth (2006). ‘ “Baumol’s Disease” Has Been Cured: IT and Multifactor Productivity in US Services Industries’, in D.W. Jansen (ed.), The New Economy And Beyond. Past, Present and Future, Cheltenham: Edward Elgar.
• Vrontis, D. (2003), “Integrating Adaptation and Standardisation in International Marketing”, Journal of Marketing Management, Vol. 19, no. 3 & 4, pp. 283-305.
• Wakke, P. (2010) “Explanatory Factors for Service Standardization at National Standards Bodies: Empirical Evidence at Sector Level”, Proceedings of the 20th RESER Conference 2010, Gothenburg, Sweden.

Sound analysis, inspiring ideas
BELGIUM – BULGARIA – HUNGARY – INDIA – THE NETHERLANDS – POLAND – RUSSIAN FEDERATION – SOUTH AFRICA – SPAIN – TURKEY – UNITED KINGDOM
P.O. Box 4175
3006 AD Rotterdam
The Netherlands
Watermanweg 44
3067 GG Rotterdam
The Netherlands
T +31 (0)10 453 88 00
F +31 (0)10 453 07 68
W www.ecorys.nl


![Division R – SERVICES, N.E.C. · (1) Services providing skills and techniques related to waste disposal [“Waste disposal business”]. (2) Services providing skills and techniques](https://img.pdfslide.net/doc/110x75/5f53b874b97fba67775ee123/division-r-a-services-nec-1-services-providing-skills-and-techniques-related.jpg)