Embed Size (px)
Citation preview
Japan International Cooperation Agency (JICA) Comisión Nacional de Desarrollo The Republic of El Salvador
The Study on Economic Development, Focusing on the Eastern Region, of the Republic of El Salvador
RECS International Inc. Nippon Koei Co., Ltd.
UNICO International Corp.
Final Report
March 2004
S S F
J R
04-24
No.
Volume 2 Master Plan Report
Japan International Cooperation Agency (JICA) Comisión Nacional de Desarrollo The Republic of El Salvador
The Study on Economic Development, Focusing on the Eastern Region, of the Republic of El Salvador
Final Report Volume 2
Master Plan Report
March 2004
RECS International Inc. Nippon Koei Co., Ltd.
UNICO International Corp.
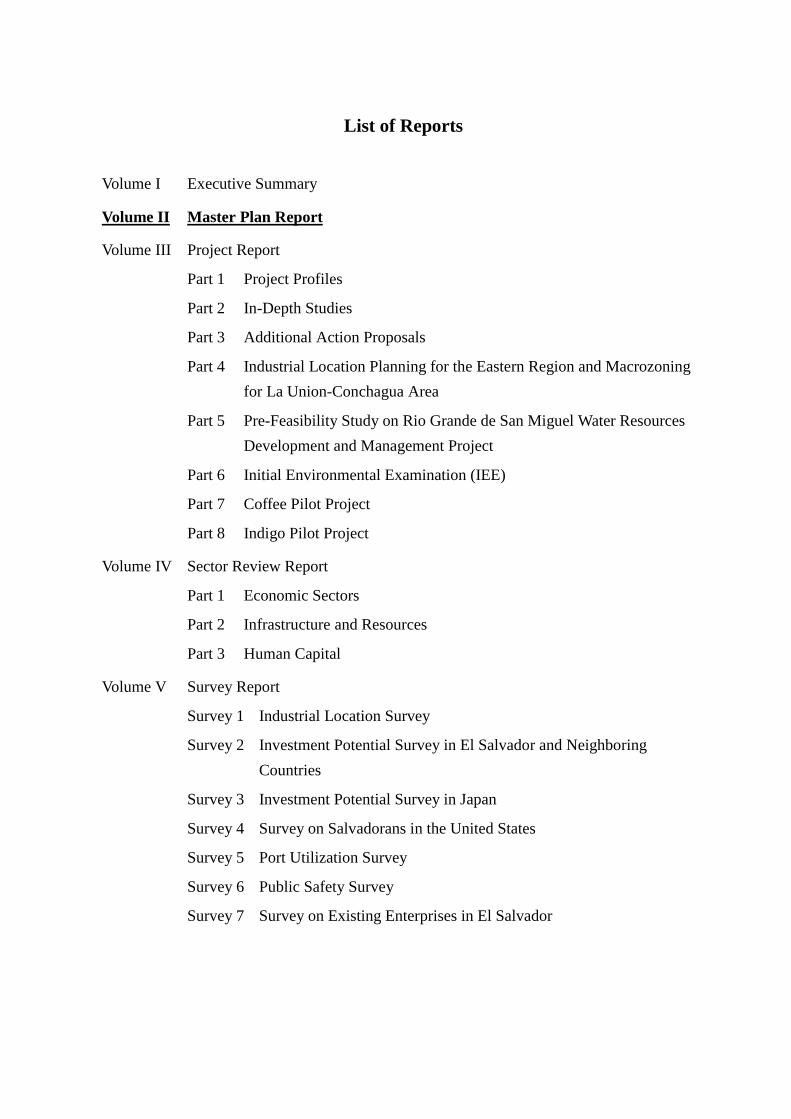
List of Reports
Volume I Executive Summary
Volume II Master Plan Report
Volume III Project Report
Part 1 Project Profiles
Part 2 In-Depth Studies
Part 3 Additional Action Proposals
Part 4 Industrial Location Planning for the Eastern Region and Macrozoning for La Union-Conchagua Area
Part 5 Pre-Feasibility Study on Rio Grande de San Miguel Water Resources Development and Management Project
Part 6 Initial Environmental Examination (IEE)
Part 7 Coffee Pilot Project
Part 8 Indigo Pilot Project
Volume IV Sector Review Report
Part 1 Economic Sectors
Part 2 Infrastructure and Resources
Part 3 Human Capital
Volume V Survey Report
Survey 1 Industrial Location Survey
Survey 2 Investment Potential Survey in El Salvador and Neighboring Countries
Survey 3 Investment Potential Survey in Japan
Survey 4 Survey on Salvadorans in the United States
Survey 5 Port Utilization Survey
Survey 6 Public Safety Survey
Survey 7 Survey on Existing Enterprises in El Salvador
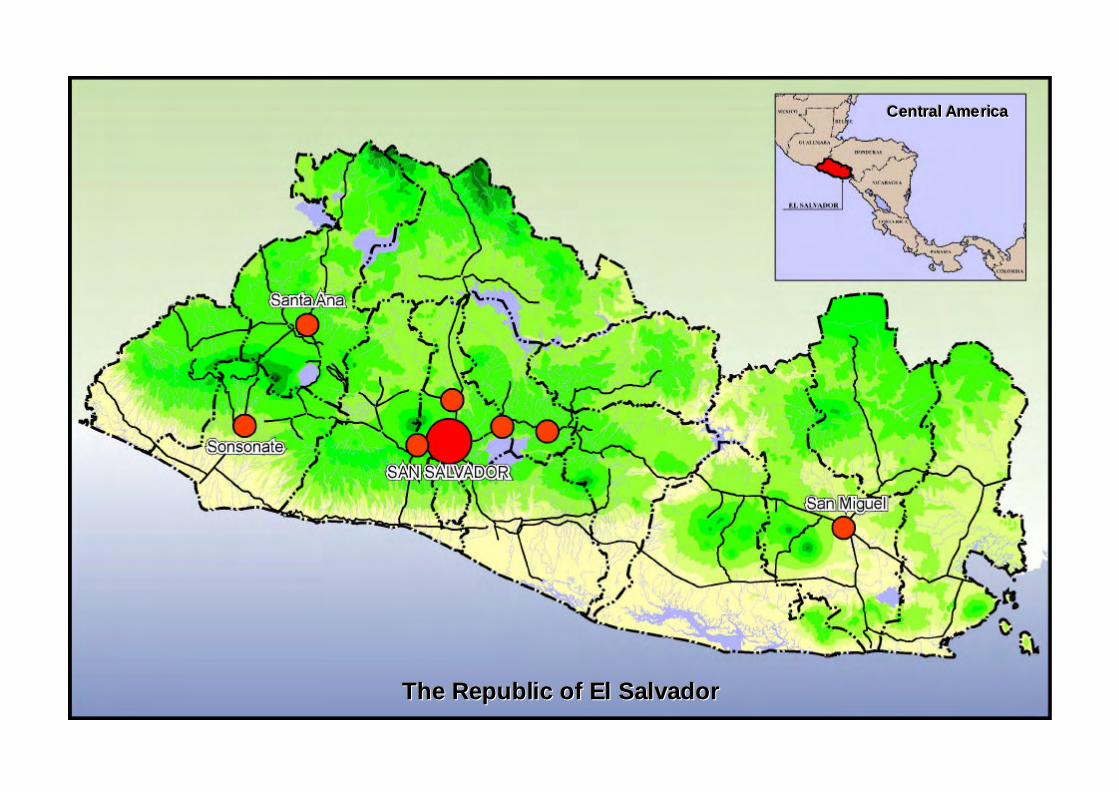
TTThhheee RRReeepppuuubbbllliiiccc ooofff EEElll SSSaaalllvvvaaadddooorrr
CCCeeennntttrrraaalll AAAmmmeeerrriiicccaaa
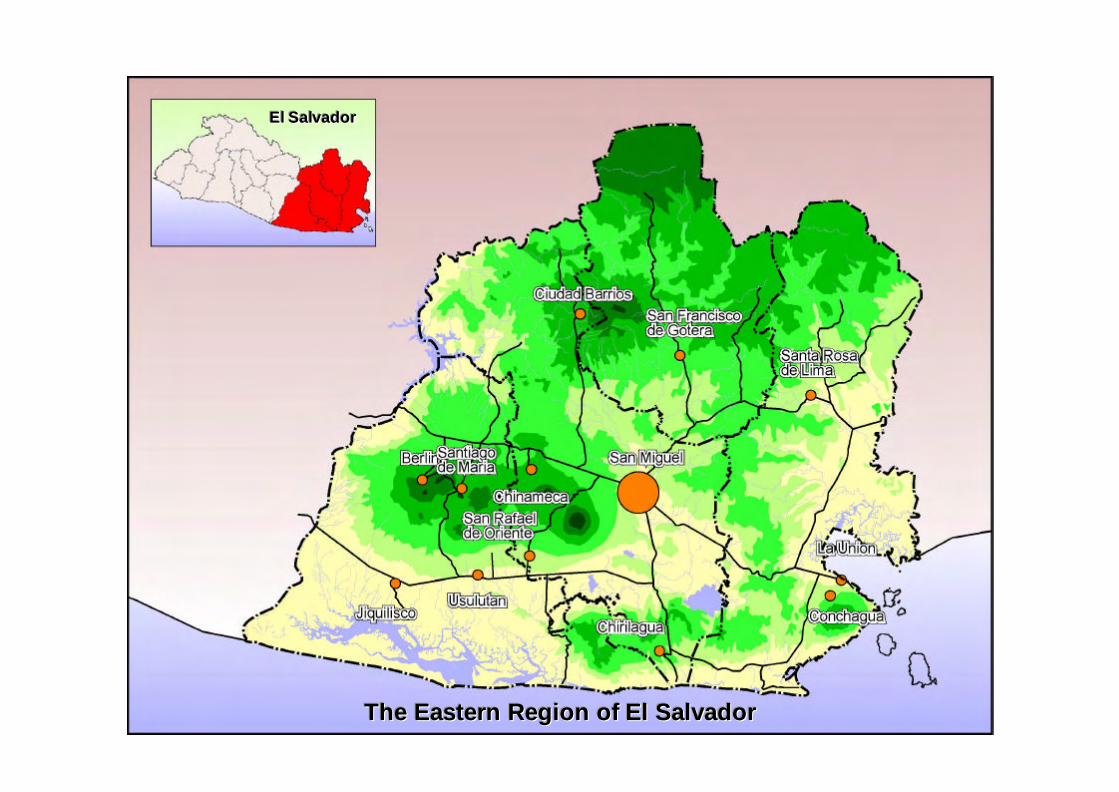
TTThhheee EEEaaasssttteeerrrnnn RRReeegggiiiooonnn ooofff EEElll SSSaaalllvvvaaadddooorrr
EEElll SSSaaalllvvvaaadddooorrr
i
The Study on Economic Development, Focusing on the Eastern Region, of the Republic of El Salvador
Final Report
Volume 2: Master Plan Report
Contents Page Chapter 1 INTRODUCTION 1-1 1.1 Background 1-1 1.1.1 Study rationale 1-1 1.1.2 The Study Area 1-3 1.1.3 Study objectives 1-3 1.2 Work Progress 1-5 1.2.1 Inception works 1-5 1.2.2 Analysis on existing conditions 1-5 1.2.3 Restructuring and resumption of the Study 1-6 1.2.4 Preparation of economic development master plan focusing on
the Eastern Region 1-6 1.2.5 Revision of the master plan and action planning 1-7 1.2.6 Preparation of the draft final report 1-8 1.2.7 Finalization of the Study 1-8 1.3 Guide to the Report 1-9
Chapter 2 NATIONAL ECONOMIC AND SPATIAL DEVELOPMENT 2-1 2.1 National Economic Development 2-1 2.1.1 Overview of performance 2-1 2.1.2 Problem structure of macro-economy 2-6 2.2 National Spatial Development 2-7 2.2.1 Overview 2-7 2.2.2 Urban centers 2-8 2.2.3 Artery network 2-11 2.2.4 Land use 2-12
Chapter 3 OBJECTIVES AND STRATEGY FOR ECONOMIC DEVELOPMENT FOCUSING ON THE EASTERN REGION 3-1
3.1 Objectives and Strategy for National Development 3-1 3.2 Position of the Eastern Region 3-2 3.2.1 Comparative analysis 3-2 3.2.2 Important characteristics 3-4 3.3 Objectives and Strategy for the Eastern Region Development 3-8 3.3.1 Problem structure 3-8 3.3.2 Opportunities to be seized 3-10 3.3.3 Regional development objectives 3-11 3.3.4 Basic strategy for the Eastern Region development 3-12
ii
Chapter 4 COMPETITIVE ENVIRONMENT OF EL SALVADOR AND INVESTMENT AND EXPORT PROMOTION STRATEGY 4-1
4.1 Competitive Environment of El Salvador 4-1 4.1.1 Comparison by investment-related indices 4-1 4.1.2 Existing promotion measures 4-2 4.1.3 Family remittance 4-5 4.1.4 CAFTA 4-6 4.1.5 Security conditions in El Salvador and the Eastern Region 4-12 4.2 SWOT Analysis on Salvadoran Economy for Investment and Export 4-14 4.2.1 Strengths 4-14 4.2.2 Weaknesses 4-15 4.2.3 Opportunities 4-16 4.2.4 Threats 4-17 4.3 Strategy for Investment and Export Promotion 4-17 4.3.1 Investment promotion strategy 4-17 4.3.2 Export promotion strategy 4-20
Chapter 5 COMPETITIVENESS OF SALVADORAN INDUSTRIES AND COMMODITIES AND THEIR PROMOTION STRATEGIES 5-1
5.1 Promising Subsector Industries and Commodities 5-1 5.1.1 Analysis on competitiveness by subsector industry 5-1 5.1.2 Identification of promising import/export industries 5-3 5.1.3 Identification of promising indigenous industries in the
Eastern Region 5-5 5.1.4 Promising import/export industries in the Eastern Region 5-12 5.2 Promotion Strategies for Import/Export Manufacturing 5-13 5.2.1 Strategies for promotion of Model 1 industries 5-14 5.2.2 Strategies for promotion of Model 2 industries 5-15 5.3 Promotion Strategies for Indigenous Industries 5-18 5.3.1 Broad strategies for all the commodity groups 5-18 5.3.2 Strategy for most promising commodities in the Eastern
Region 5-19 5.4 Promotion Strategies for Textile and Apparel Industries 5-37 5.4.1 Existing conditions and prospects of textile and apparel
industries 5-37 5.4.2 Strategies to promote textile and apparel industries 5-40
Chapter 6 DEVELOPMENT FRAMEWORKS FOR EL SALVADOR AND THE EASTERN REGION 6-1
6.1 Socioeconomic Framework for El Salvador and the Eastern Region Development 6-1
6.1.1 National socioeconomic framework 6-1 6.1.2 Socioeconomic framework for the Eastern Region
development 6-3 6.1.3 Micro estimate and projections of agricultural and industrial
value-added 6-5 Box 1 Assumptions for Crop Value-added Projection 6-7 Box 2 Assumptions for Manufacturing Value-added Projection 6-9
iii
6.2 Spatial Framework for the Eastern Region 6-11 6.2.1 Urban centers 6-11 6.2.2 Artery network 6-11 6.2.3 Land use 6-12
Chapter 7 DEVELOPMENT SCENARIO FOR THE EASTERN REGION WITH LA UNION PORT REVITALIZATION 7-1
7.1 Scenario for the La Union Port Revitalization 7-1 7.1.1 Development of traffic demand 7-1 7.1.2 Basic conditions for La Union port revitalization 7-7 Box 3 Free Zones Development in Asian Developing Countries 7-9 7.1.3 La Union port revitalization by phase 7-13 7.2 Scenario for the Eastern Region Development 7-15 7.2.1 Phase 1: 2004-09 7-15 7.2.2 Phase 2: 2010-14 7-18 Box 4 Agro-Industrial Complex and Industrial Clusters 7-20 7.2.3 Phase 3: 2015-19 7-22 7.3 Impact of La Union Port Revitalization on the Eastern Region and El
Salvador 7-23
Chapter 8 DEVELOPMENT STRATEGY BY SECTOR 8-1 8.1 Economic Development 8-1 8.1.1 Strategy for agricultural development 8-1 8.1.2 Strategy for industrial development 8-12 8.1.3 Strategy for tourism development 8-18 8.1.4 Strategy for commerce and services development 8-23 8.2 Infrastructure Development 8-27 8.2.1 Strategy for transportation development 8-27 8.2.2 Strategy for power development 8-36 8.2.3 Strategy for telecommunications and ICT 8-42 Box 5 ICT Development in Developing Countries: Cases of India
and Costa Rica 8-49 8.2.4 Strategy for water resources development and management 8-50 8.2.5 Strategy for solid wastes and wastewater treatment 8-55 8.3 Human Development 8-61 8.3.1 Strategy for educational development 8-61 8.3.2 Strategy for vocational training and ICT human resources
development 8-67
Chapter 9 DEVELOPMENT PLANS, PROGRAMS AND PROJECTS 9-1 9.1 Development Plan for the Eastern Region 9-1 9.2 Development Plan for the La Union Port and Its Hinterland 9-2 9.2.1 Planning framework for macrozoning 9-2 9.2.2 Macrozoning 9-3 9.2.3 Urban and infrastructure development projects in La
Union-Conchagua area 9-7 9.3 Development Programs and Projects 9-11 9.3.1 Agro-Industrial Complex (AIC) Development 9-11
iv
Box 6 One Village-One Product Approach, Oita Prefecture, Japan 9-16 9.3.2 Watershed Development and Management 9-18 Box 7 Tank Irrigation System, Southern India and Sri Lanka 9-22 9.3.3 Environment and Tourism Development 9-27 9.3.4 Spatial Structure Strengthening 9-29 9.3.5 La Union Port Revitalization 9-33 9.3.6 Entrepreneurial Base Development 9-34 Box 8 Shenzhen Technology Center, People’s Republic of China 9-38 9.4 Institutional and Financial Measures 9-40 9.4.1 Institutional arrangements for the Eastern Region development
with the La Union port 9-40 Box 9 Subic Special Economic and Freeport Zone, Philippines 9-44 9.4.2 Funding for the Eastern Region development 9-47 9.5 Indicative Investment Schedule 9-53 9.5.1 Framework for investment planning 9-53 9.5.2 Project prioritization 9-54 9.5.3 Indicative investment schedule 9-55
Chapter 10 ACTION PLAN 10-1 10.1 Master Plan Adoption and Promotion 10-1 10.1.1 Master Plan adoption 10-1 10.1.2 Promotion and marketing 10-2 10.2 Pilot Project Implementation 10-3 10.2.1 Extension of indigo industrialization pilot project 10-3 10.2.2 Initiation/Continuation of additional pilot projects 10-4 10.2.3 Formulation of more pilot projects 10-6 10.3 Further Project Development 10-9 10.3.1 Agro-Industrial Complex Development 10-9 10.3.2 Watershed Development and Management 10-9 10.3.3 Environment and Tourism Development 10-11 10.3.4 Spatial Structure Strengthening 10-12 10.3.5 La Union Port Revitalization 10-12 10.3.6 Entrepreneurial Base Development 10-13 10.4 Strengthening of Implementing Arrangements 10-14 10.4.1 Institutional framework with CND 10-14 10.4.2 Strengthening of regional functions 10-14 10.4.3 Central Government initiative 10-15 10.4.4 Implementing arrangements for La Union-Conchagua area 10-16 10.4.5 Funding mechanism 10-17 10.5 Initial Fund Allocation and Fund Sourcing 10-18
v
List of Tables Table 1.1 Comparison between El Salvador and the Eastern Region by Socioeconomic
Indices, 2000 1-4 Table 2.1 Macroeconomic Performance of El Salvador, 1994-2002 2-2 Table 2.2 Changes in Economic Structure and GDP Growth, 1980-2000 2-2 Table 2.3 Export and Import Value by Commodity, 1994-2002 2-3 Table 2.4 Export and Import Value by Trade Partner, 1994-2002 2-4 Table 2.5 Trade Structure of El Salvador with Regions and Countries, 1998 2-5 Table 2.6 Public Finances of El Salvador, 1994-2002 2-5 Table 2.7 Comparison of El Salvador with Selected Countries by Basic Indices, 2000 2-6 Table 2.8 Comparison between El Salvador and Selected Countries for Investment and
Saving Structure, 1990-2000 2-6 Table 2.9 Comparison of 14 Departments by Basic Indices 2-8 Table 2.10 Ranking of Major Urban Centers in El Salvador by Five Indices 2-10 Table 2.11 Changes in Land Use in El Salvador, 1980-1990 2-13 Table 2.12 Distribution of Land Capability Classes by Department 2-14 Table 3.1 Expedient Definition of Regions for Comparative Analysis 3-3 Table 3.2 Basic Data on Six Adopted Regions of El Salvador, 2000 3-3 Table 3.3 Shares of the Eastern Region in Selected Aspects, 2000 3-4 Table 4.1 Comparison of El Salvador with Selected Countries by Investments-related
Indices 4-1 Table 4.2 Cost Comparison for Production Input 4-3 Table 4.3 Comparison of Applicable Incentives in Free Trade Zones 4-4 Table 4.4 Results of PROESA Investment Promotion, July 2000-July 2003 4-5 Table 4.5 Remittances to Latin America and the Caribbean, 2001 4-6 Table 4.6 CAFTA Tariff Reduction Schedule 4-7 Table 4.7 Exportable Products Actually Consumed in the U.S. 4-9 Table 4.8 National Crime Statistics, 2000-2003 4-13 Table 4.9 Homicide Rate by Department, 1999-2000 4-13 Table 5.1 Export Growth, 1997-2001 5-2 Table 5.2 Import and Export Related Industries Revealed by Industrial Interview
Survey 5-4 Table 5.3 Promising Commodities in the Eastern Region Identified through Field
Surveys 5-7 Table 5.4 Criteria for Evaluation of Promising Commodities in the Eastern Region 5-10 Table 5.5 Initial Evaluation of Potential Products in the Eastern Region 5-11 Table 5.6 Second Evaluation of Potential Products in the Eastern Region 5-12 Table 5.7 Broad Promotion Strategies by Commodity Group 5-18 Table 5.8 Import of Cashew Nuts by Country, 1999 5-23 Table 5.9 Production of Cashew Nuts by Country 5-23 Table 5.10 Profitability of Coffee Production in Central American Countries 5-25 Table 5.11 Comparison of Cost Structure by Alternative Marketing Channels 5-26 Table 5.12 Milk Production in Central American Countries 5-27 Table 5.13 Chicken Meat Production in Central America and Major Producers 5-31 Table 5.14 Import of Chicken Meat Products and Eggs by Central American Countries 5-31 Table 5.15 Comparison of Aviculture Production Costs 5-32 Table 5.16 CBPTA Provisions for Textile and Apparel Industries 5-39
vi
Table 6.1 Projections of GDP and Employment by Sector, 2000-2019 6-2 Table 6.2 Projections of GRDP and Employment in the Eastern Region, 2000-18 6-4 Table 6.3 Estimated Agricultural Value-added in the Eastern Region, 2000 6-5 Table 6.4 Projection of Agricultural Value-added in the Eastern Region, 2019 6-7 Table 6.5 Estimate of Manufacturing Value-added in the Eastern Region, 2000 6-9 Table 6.6 Projection of Industrial Value-added in the Eastern Region, 2000 & 2019 6-10 Table 6.7 Present Land Use by Department in the Eastern Region, 1996 6-13 Table 6.8 Distribution of Land Capability Classes by Department in the Eastern Region 6-14 Table 6.9 Land Use Conversion Matrix for Future Land Use in the Eastern Region 6-14 Table 6.10 Future Land Use in the Eastern Region 6-15 Table 7.1 Forecast Cargo Volume at La Union Port 7-3 Table 7.2 Unit Data for Model Comparison of Transport Costs 7-3 Table 7.3 Model Comparison of Transport Costs from Central America to the U.S.
West Coast 7-4 Table 7.4 Model Comparison of Transport Costs from Guatemala to Asia 7-5 Table 7.5 Cost Estimates for Transport from Miami to La Union by Two Routes 7-6 Table 7.6 Cost Estimates for Transport from Miami and San Salvador by Two Routes 7-7 Table 7.7 Top 20 Critical Locational Factors for Foreign Direct Investments 7-11 Table 7.8 Selected Asian Cases of Large Special Area Designation 7-12 Table 7.9 La Union Port Revitalization by Phase 7-14 Table 7.10 Estimate of Value-added and Employment Generation by AIC 7-26 Table 8.1 Allocation of Government Ordinary Budget by Sector 8-2 Table 8.2 Budget Allocation to the Agricultural Sector in Central American Countries 8-3 Table 8.3 Provision of Loans to the Agriculture and Livestock Sectors 8-3 Table 8.4 Main Agro-products in the Eastern Region and Their Target Markets 8-12 Table 8.5 Composition of Manufacturing Companies by Sub-industry 8-13 Table 8.6 Composition of Manufacturing Companies in the Eastern Region 8-14 Table 8.7 Typical Maritime Freight Costs per Container from Central America to the
U.S. 8-28 Table 8.8 Import and Export Volume at Atlantic and Pacific Ports of Central America,
1999 8-29 Table 8.9 Results of OD Survey in the Eastern Region 8-33 Table 8.10 Composition of Cargoes at Survey Stations 8-35 Table 8.11 Electricity Coverage in El Salvador and the Eastern Region, 2000 8-38 Table 8.12 El Salvador’s Ranking in Geothermal Generation, 2000 8-39 Table 8.13 Fair Market Value Estimates on Geothermal Plants 8-39 Table 8.14 Input and Output Relationship Between GDP and Electricity Consumption 8-40 Table 8.15 Power Demand and Supply 8-40 Table 8.16 Comparison of El Salvador with Selected Countries by ICT-related Indices 8-42 Table 8.17 Infocentros in the Eastern Region 8-45 Table 8.18 Water Supply and Sanitation Coverage by Department, 2001 8-52 Table 8.19 Coverage by Sewage Systems 8-57 Table 8.20 Water Quality Data on La Union Bay 8-59 Table 8.21 Water Quality Data on Rio Grande de San Miguel 8-59 Table 8.22 Composition of Solid Wastes, La Union City 8-60 Table 8.23 Budget Allocation and Population Distribution by Department, 1997 8-62 Table 8.24 Educational Budget as Percentage of National Budget and GDP in Central
American Countries, 1997 8-63
vii
Table 8.25 Secondary Education Enrollment Rates in Latin American Countries, 1999 8-63 Table 8.26 Number of Students by Major and Degree in Higher Education, 2000 8-64 Table 8.27 Number of Secondary Schools and Enrollment by Department, 1998 8-65 Table 8.28 Example of Training Courses to Be Offered in the Eastern Region 8-68 Table 8.29 Examples of Knowledge and Skills Needed by Various Groups in ICT
Human Resources Development 8-70 Table 9.1 Industrial Land Demand in El Salvador and the Eastern Region in 2019 9-3 Table 9.2 Scale of Coffee Cultivation under Intensive Production System 9-25 Table 9.3 Current Situation of Urban Water Supply System by ANDA in the Eastern
Region, 2000 9-26 Table 9.4 Alternative Institutional Arrangements for the Eastern Region Development 9-42 Table 9.5 Comparison of Municipal Associations in the Eastern Region 9-48 Table 9.6 Income from Public Services of Municipalities in the Eastern Region, 1999 9-49 Table 9.7 Family Remittances and GDP in El Salvador 9-50 Table 9.8 Investment Performance in Recent Years, El Salvador 9-54 Table 9.9 Projection of Public Investment and Allocation to the Eastern Region 9-55 Table 9.10 Indicative Investment Schedule for Eastern Region Development 9-58 Table 10.1 Small-scale Irrigation Project in the Eastern Region (FS by MAG, 1989 and
1991) 10-8 Table 10.2 Master Plan Strategy for Most Promising Commodities and Target Markets 10-10 Table 10.3 Proposed Fund Allocation during Phase 1 before and after the La Union Port
Commissioning 10-19 Table 10.4 Proposed Fund Sources and External Support during Phase 1 (2004-09) 10-21
viii
List of Figures Figure 2.1 Existing Urban Centers Hierarchy in El Salvador 2-11 Figure 2.2 Artery Network in El Salvador 2-12 Figure 2.3 Potential Irrigation Areas in El Salvador 2-15 Figure 3.1 Problem Structure of the Eastern Region 3-9 Figure 4.1 Matching Mechanism for Overseas Salvadoran Investors and Local Projects 4-19 Figure 5.1 Growth of Apparel Export from El Salvador to the U.S., 1992-2002 5-38 Figure 5.2 Price Trend of Textile and Apparel Export to the U.S. 5-40 Figure 6.1 Logistic Circuits of the Eastern Region 6-12 Figure 6.2 Spatial Framework of the Eastern Region 6-13 Figure 6.3 Future Land Use in the Eastern Region 6-16 Figure 7.1 Image of Eastern Region Development with FPEZ 7-12 Figure 7.2 Evolution of Eastern Region Development Centering on La Union Port
Utilization 7-15 Figure 8.1 Self-Evaluation of Factors Related to Corporate Management 8-16 Figure 8.2 Traffic Volume at 20 Stations 8-31 Figure 8.3 Traffic Flow in El Salvador 8-34 Figure 8.4 SIEPAC Line for Integrated Power System 8-37 Figure 8.5 Cost of Computers and Internet Charges 8-43 Figure 8.6 Ranking of El Salvador in Networked Readiness Index 2002-2003 8-44 Figure 8.7 How Governments Make and Influence ICT Decisions 8-48 Figure 8.8 Educational Budget as Percentage of National Budget and GDP, 1992-1998 8-62 Figure 9.1 Structure of the Eastern Region Development Master Plan with Six Broad
Programs 9-2 Figure 9.2 Land Use of La Union-Conchagua Area, 2002 9-5 Figure 9.3 Macrozoning for La Union-Conchagua Area 9-6 Figure 9.4 Schematic of AIC Development Process 9-13 Figure 9.5 Proposed Rio Grande de San Miguel Water Resources Development and
Management 9-19 Figure 9.6 Micro-scale Irrigation by Small Reservoir Tank System 9-24 Figure 9.7 Logistic Circuits Strengthening 9-30 Figure 9.8 Commodity Flows with Logistic Circuits 9-31 Figure 9.9 Organizational Structure of Agro-industrial Technology Center 9-40 Figure 9.10 Possible Organizational Structure of FPEZ Development Corporation 9-47 Figure 10.1 Prospective Sites for Small-scale Irrigation Project Identified by MAG 10-8
ix
Abbreviations ADEL Local Economic Development Agency AECI Spanish Agency for International Cooperation AIC Agro-industrial complex AITC Agro-industrial technology center AMBIDESSAL Environment and Sustainable Development Association in El Salvador AMCHAM American Chamber of Commerce AMI Mesoamerican Freeway of Information AMP Maritime Port Authority ANDA National Water Supply and Wastewater Administration ANTEL National Telecommunications Administration APE Export Promotion Agency APHIS Animal and Plant Health Inspection Service APREMAT Technical Medium Education Reform Process Assistance AT Appropriate technology ATC Agreement on textile and clothing AVES Aviculture Association of El Salvador AZULES Indigo Producers’ Association of El Salvador BCIE Central American Bank for Economic Integration BCR Central Reserve Bank of El Salvador BFA Bank for Agricultural Promotion BMI Multi-sector Investment Bank (Banco Multisectorial de Inversiones) BOD Biological oxygen demand BOO Backoffice outsourcing BPO Business process outsourcing CAFTA Central America Free Trade Agreement CATIE Tropical Agriculture Research and Higher Learning Center CBD Commercial and business district CBI Caribbean Basin Initiative CBTPA Caribbean Basin Trade Partnership Act CDA Departmental Council of Mayors CEL Executive Commission of Lempa River Hydropower CENDEPESCA Fishery and Aquaculture Development Center CENTA Center for Agriculture and Forestry Technology CENTREX Center for Export Producers CENTROMYPE Foundation for Promoting Competitiveness of Micro and Small Enterprises CEPA Executive Commission for Autonomous Ports CEPAL Economic Commission for Latin America CESSA Cementos de El Salvador CIF Cost, insurance and freight CND National Development Commission CNR National Center of Registrations COCATRAM Central American Commission for Maritime Transportation COD Chemical oxygen demand COEN National Emergency Committee COMTELCA Regional Technical Commission of Telecommunications COMURES Municipal Corporation of the Republic of El Salvador CONACYT National Council for Science and Technology
x
CONAMYPE National Commission for Micro and Small Enterprises CONAPIS National Commission of Salvadoran Apiculture CORSAIN Salvadoran Investment Corporation CORSATUR Salvadoran Tourism Corporation CRA Learning resource center CRM Customer relationship management CTE Company of Telecommunications DANIDA Danish International Development Assistance DD Detailed design DEE Electric Power Division DGALE Directorate General for Attention to Overseas Communities DGEC / DIGESTYC
General Directorate of Statistics and the Census
ECAT Central American Transport Study EDI Electronic data interchange EEO Eastern Electricity Company ENA National Agricultural School ETESAL El Salvador Electricity Transmission Company FAO Food and Agriculture Organization FDA Food and Drug Administration FDI Foreign direct investment FEDAVICAC Central American Federation of Aviculture FEPADE Foundation of Enterprises for Education Development FINET Fund of National Investment in Electricity and Telecommunications FISDL Social Investment for Local Development Fund FOB Free on board FODES Social and Economic Development Fund FOEX Export Promotion Fund FOSEP Pre-investment Study Fund FOVIAL Road Maintenance Fund FPEZ Free port and economic zone FS Feasibility study FTA Free trade agreement FTZ Free trade zone FUNDAUNGO Doctor Guillermo Manuel Ungo Foundation FUNDE Foundation for Development FUSADES Economic and Social Development Foundation FZ Free zone GATT General Agreement on Tariffs and Trade GCF Gross capital formation GDI Gender related development index GDP Gross domestic product GRDP Gross regional domestic product GESAL National Geothermal Company GIS Geographic information system GNP Gross national product GTZ German Technical Cooperation Agency HDI Human development index HPI Human poverty index
xi
ICO International Coffee Organization ICOR Incremental capital-output ratio ICT Information and communication technology IDB / IADB Inter-American Development Bank IE Industrial estate IEE Initial environmental examination IICA Interamerican Institute for Agricultural Cooperation INBI Unfulfilled basic needs index INCAE Central American Institute of Business Administration INSAFOCOOP Salvadoran Institute for Promotion of Cooperatives INSAFORP Salvadoran Institute of Professional Formation IQF Individually quick frozen IRR Internal rate of return ISDEM Salvadoran Institute of Municipal Development IT Information technology ITCA Central American Institute for Technology ITU International Telecommunications Union ITUS Technological Institute of Usulutan IVA Value-added tax JAF Jute and allied fiber JBIC Japan Bank for International Cooperation JETRO Japan External Trade Organization JICA Japan International Cooperation Agency LASF Dry fertilizer family latrine LMU Local management unit LUCPA La Union-Conchagua Planning Area MAG Ministry of Agriculture and Livestock MARN Ministry of Environment and Natural Resources MFA Multi-fiber Agreement MICE Meetings, incentives, conventions, and exhibitions MIGA Multilateral Investment Guarantee Agency MINED Ministry of Education MOE Ministry of Economy MOP Ministry of Public Works NAFTA North America Free Trade Agreement NGO Non-governmental organization NIP Employer Identification Number NIT Tributary Identification Number O&M Operation and maintenance OCIA Organic Crop Improvement Association OD Origin-destination OML Observatory of Neighbor Market ONI National Investment Office OTEXA Office of Textile and Apparel PET Polyethylene terephthalate PNC National Civil Police PNCES National Competitiveness Program of El Salvador PNODT National Plan for Regional Arrangement PPP Plan Puebla-Panama
xii
PROARCA Regional Environmental Program for Central America PROCAFE Coffee Producers Association PROCANA Sugar Cane Producers Association PRODERNOR Rural Development Project for the North-Eastern Region PROESA Promoting Investment in El Salvador (National Commission for Investment
Promotion) PROGOLFO Project for Conservation of the Coastal Ecosystems in the Gulf of Fonseca PROMUDE Advisory Program for the Municipal Promotion and the Decentralization QC(C) Quality control (circles) R&D Research and development SALT Sloping agricultural land technology SAMO Agroindustrial System of Organic Cashew SCM Supply chain management SICA Central American Integration System SICEX Foreign Trade Integrated System SIECA Secretariat for Central American Economic Integration SIEPAC Central American Electric Interconnection System SIGET General Superintendence of Electricity and Communications SME Small and medium enterprise SNET National Service for Territorial Studies SRMU Sub-regional management unit SS Suspended solids SSMR San Salvador metropolitan region T&V Training and visit TDS Total dissolved solids TPL Tariff preference level TSC Trade specialization coefficient UCA Central American University UCRAPROBEX Union of Agrarian Reform Cooperatives of Producers, Processors and
Exporters of Coffee UES University of El Salvador UGB Universidad Gerardo Barrios UNCTAD United Nations Conference on Trade and Development UNDP United Nations Development Program UNICEF United Nations Children’s Fund UNIVO University of the East UPREX Usulutan Producers and Exporters Union USAID United States Agency for International Development USGS United States Geological Survey UT Unit of transactions VA Value-added VAT Value-added tax VMVDU Vice Ministry of Housing and Urban Development VOC Vehicle operating costs WTC World Trade Center WTO World Trade Organization
xiii
Abbreviations of Measures Length Weight ft foot, feet (≈0.3048m) kg kilogram m meter lb pound (≈453g) km kilometer mg milligram mi mile (≈1.609km) MT metric ton Nmi nautical mile (≈1.852km) TEU twenty feet equivalent unit Volume gal. gallon (US≈3.785l) Area l liter ha hectare m3 cubic meter km2 square kilometer qq quintal (≈100lb) m2 square meter mz manzana (≈0.7ha) Energy SME square meter equivalent GWh gigawatt per hour kWh kilowatt per hour Other MW megawatt ¢ colon(es) min. minute mo. month n.a. not available or not applicable p.a. per annum % percent
Currency Equivalents US$1.00=¢8.75 (fixed as of January 1, 2001) US$1.00=¥106.59 (average Interbank rate for January 2004) Source: “Historical Rates”, OANDA.COM, http://www.oanda.com.
1-1
Chapter 1 INTRODUCTION
1.1 Background
1.1.1 Study rationale
(1) Recovery from the civil war
The economy of El Salvador recovered rapidly from the civil war, which ended in 1992 after over a decade of turmoil. The gross domestic product (GDP) increased during the postwar period of 1992-95 at the average annual rate of 6.2% (Central Reserve Bank of El Salvador). The economic growth slowed down subsequently to attain the average annual growth of GDP at 3.0% for 1995 through 2000. The economic growth has further slowed down thereafter partly due to the devastating earthquakes of early 2001.
The population of El Salvador started to increase at a high rate after the civil war. It increased from 5.1 million in 1990 to 5.6 million in 1994 at the average annual rate of 2.4%. The population growth has slowed down subsequently to the level of 1.9% per annum.
The economic reform program of the Government, including trade liberalization, privatization and dollarization, has supported the relatively high economic performance of El Salvador. The program has helped suppress inflation and stabilize the macro economy, and the Heritage Foundation assesses El Salvador as one of the three Latin American countries with most advanced economic liberalization.
(2) Challenges
While the Salvadoran economy has diversified during the recovery period, overcoming the dependence on coffee, sugar and other traditional industries, it has become increasingly dependent on the low value-added textile industry. Following the establishment of free trade zones, the export of textile products through “maquila” increased to claim a 60% share in the total export value, dominated by the export to the U.S.
The trade balance has been constantly in the red, compensated largely by remittances from overseas Salvadorans, which has accounted for 13-15% of the GDP in recent years. The gross capital formation (GCF) accounted only for 17% of the GDP in 2000, among the lowest of Central American countries, and the ratio of gross domestic saving to the GDP was mere 2% in 2000. Although foreign direct investment (FDI) and development aid increased significantly during the recovery period, they accounted for 8.3% and 8.0% of the GCF respectively in 2000, generally lower than the levels in other Central American countries.
Through the economic recovery, disparities among the people and the regions have widened. The average income in the northern frontier along the borders with Honduras and in the Eastern Region is much lower than the national average. The poverty incidence in Morazan in the
1-2
northeast, for instance, was 58.5% as compared to the national average of 38.8%.
Extensive agricultural practices relying on generally rich soil and water resources have resulted in reduced land productivity in some areas. Forest resources degraded further due to the civil war. These conditions make the land of El Salvador vulnerable, aggravating damages by natural disasters such as the hurricane Mitch in 1998 and the earthquakes in 2001.
(3) Opportunities
Owing to its geographic location and the successful economic reform, El Salvador has benefited from economic globalization and trade liberalization. The total export and import value doubled during 1994-2001. In particular, the maquila export and import accounted for 57.7% and 23.1% respectively of the total export and import value in 2001. El Salvador has concluded a free trade agreement (FTA) with Mexico, Chile, Dominican Republic, and Panama, and is negotiating the same with Canada, the U.S. and EU. Practically no customs duties exist between El Salvador, Guatemala, Honduras, and Nicaragua.
It is expected that the La Union port at the eastern end of the Country will be revitalized with support of an yen loan in the amount of ¥11.23 billion (about US$90 million) provided by the Japan Bank for International Cooperation (JBIC). It will become the only port on the Pacific side of Central America with a large container terminal. It will constitute core facilities of the transportation infrastructure to support the Central America Integration System (SICA) according to the Plan Puebla Panama (PPP). The port of La Union may serve as a hub of international trade not only for Central America but also for the Americas and even beyond at large.
(4) Need for the Study
El Salvador needs to overcome these economic, social and environmental problems as outlined above in order to attain sustainable development. To continue the economic growth in increasing globalization of the world economy and further trade liberalization, El Salvador needs to deepen its economic structure through increase in FDI and introduction and innovation of associated technologies. The planned revitalization of the La Union port may be effectively utilized to increase trade and attract foreign investment.
To realize sound and sustainable development, however, such foreign trade and investment must be utilized to benefit the people of El Salvador through creating income generating opportunities and developing domestic industries based on indigenous resources as well as imported goods and materials. To utilize indigenous resources effectively, environmental quality and capacity need to be restored and enhanced through proper management of land and water resources; human resources capacity should be expanded; and resources of overseas Salvadorans should be mobilized.
1-3
Increase in foreign trade and investment and development of indigenous industries in association with the export industry including export processing and transshipment need to be planned carefully so that they will contribute to deepening the economic structure, generating income and employment opportunities and alleviating poverty. A planning study (the Study, hereafter) should delve into all the possibilities, both positive and negative, that may evolve from the expected revitalization of the La Union port.
1.1.2 The Study Area
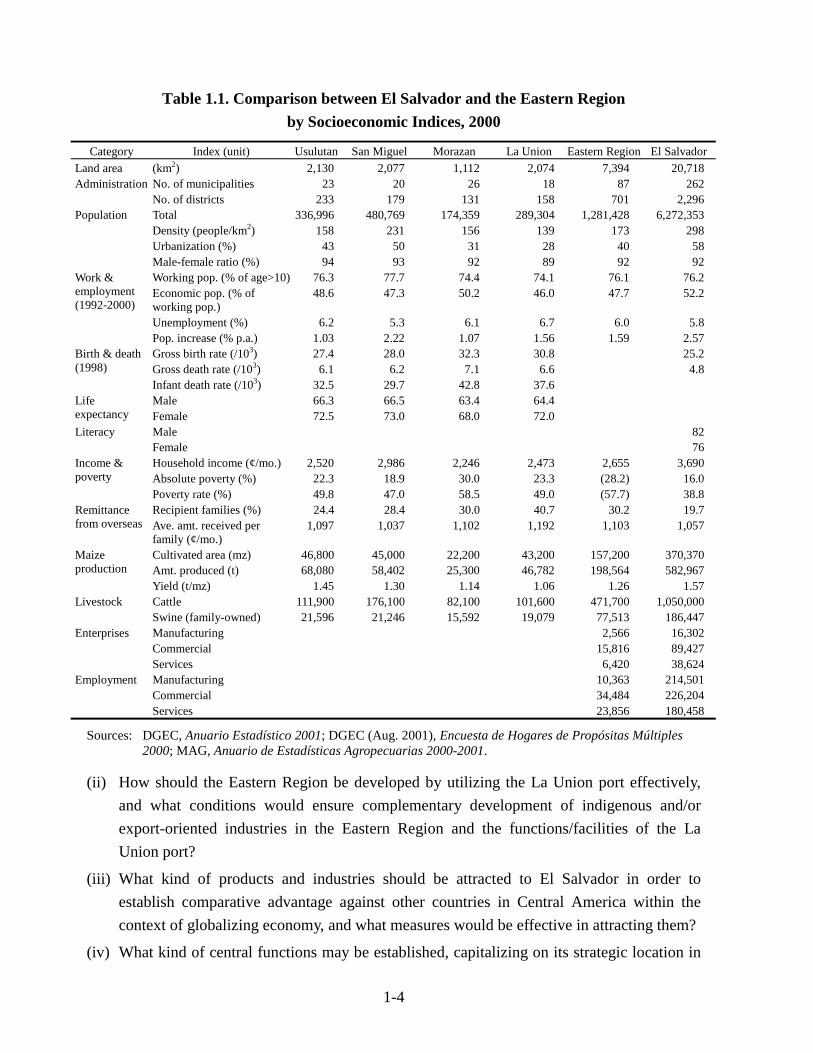
The Study will cover the entire El Salvador for economic development framework focusing particularly on the Eastern Region and the La Union port located at the eastern end of the Region for detailed analysis and planning (referred to as the Eastern Region or the Region, hereafter). The Country has land area of 20,718km2 and a population of 6,272,353 (as of 2000). The Eastern Region consists of four departments of San Miguel, La Unión, Morazán, and Usulután (the latter three to be spelled La Union, Usulutan and Morazan, respectively hereafter). The Region has land area of 7,394km2 or 35.7% of the national land, and its population of 1,281,428 as of 2000 accounts for 20.4% of the total population in the Country. The Eastern Region with the four departments and El Salvador are compared in Table 1.1 by selected socioeconomic indices.
1.1.3 Study objectives
Based on the scope of work for the Study agreed between National Development Commission (Comisión Nacional de Desarrollo/CND) of the Government of the Republic of El Salvador and the Japan International Cooperation Agency (JICA), the official agency responsible for the implementation of technical cooperation under the official development aid program of the Government of Japan, the objectives of the Study are as follows:
(1) To formulate a master plan for the balanced economic development of El Salvador aiming at strengthening the competitiveness of El Salvador through promoting export and FDI and developing the Eastern Region of the Country; and
(2) To enhance the capacity of the national and regional counterparts to promote and lead the economic development, assuring the ownership by the Government of El Salvador in the implementation of the master plan.
The master plan to be formulated through the Study should provide answers to the following key issues related to the economic development of El Salvador, development of the Eastern Region, and utilization of the La Union port.
(i) What functions and facilities should the La Union port be equipped with for the port to serve Central America, and what infrastructure and institutional measures would support such functions?
1-4
Table 1.1. Comparison between El Salvador and the Eastern Region by Socioeconomic Indices, 2000
Category Index (unit) Usulutan San Miguel Morazan La Union Eastern Region El Salvador Land area (km2) 2,130 2,077 1,112 2,074 7,394 20,718 Administration No. of municipalities 23 20 26 18 87 262 No. of districts 233 179 131 158 701 2,296 Population Total 336,996 480,769 174,359 289,304 1,281,428 6,272,353 Density (people/km2) 158 231 156 139 173 298 Urbanization (%) 43 50 31 28 40 58 Male-female ratio (%) 94 93 92 89 92 92
Working pop. (% of age>10) 76.3 77.7 74.4 74.1 76.1 76.2 Economic pop. (% of working pop.)
48.6 47.3 50.2 46.0 47.7 52.2
Unemployment (%) 6.2 5.3 6.1 6.7 6.0 5.8
Work & employment (1992-2000)
Pop. increase (% p.a.) 1.03 2.22 1.07 1.56 1.59 2.57 Gross birth rate (/103) 27.4 28.0 32.3 30.8 25.2 Birth & death
(1998) Gross death rate (/103) 6.1 6.2 7.1 6.6 4.8 Infant death rate (/103) 32.5 29.7 42.8 37.6
Male 66.3 66.5 63.4 64.4 Life expectancy Female 72.5 73.0 68.0 72.0 Literacy Male 82 Female 76
Household income (¢/mo.) 2,520 2,986 2,246 2,473 2,655 3,690 Income & poverty Absolute poverty (%) 22.3 18.9 30.0 23.3 (28.2) 16.0 Poverty rate (%) 49.8 47.0 58.5 49.0 (57.7) 38.8
Recipient families (%) 24.4 28.4 30.0 40.7 30.2 19.7 Remittance from overseas Ave. amt. received per
family (¢/mo.) 1,097 1,037 1,102 1,192 1,103 1,057
Cultivated area (mz) 46,800 45,000 22,200 43,200 157,200 370,370 Maize production Amt. produced (t) 68,080 58,402 25,300 46,782 198,564 582,967 Yield (t/mz) 1.45 1.30 1.14 1.06 1.26 1.57 Livestock Cattle 111,900 176,100 82,100 101,600 471,700 1,050,000 Swine (family-owned) 21,596 21,246 15,592 19,079 77,513 186,447 Enterprises Manufacturing 2,566 16,302 Commercial 15,816 89,427 Services 6,420 38,624 Employment Manufacturing 10,363 214,501 Commercial 34,484 226,204 Services 23,856 180,458
Sources: DGEC, Anuario Estadístico 2001; DGEC (Aug. 2001), Encuesta de Hogares de Propósitas Múltiples 2000; MAG, Anuario de Estadísticas Agropecuarias 2000-2001.
(ii) How should the Eastern Region be developed by utilizing the La Union port effectively, and what conditions would ensure complementary development of indigenous and/or export-oriented industries in the Eastern Region and the functions/facilities of the La Union port?
(iii) What kind of products and industries should be attracted to El Salvador in order to establish comparative advantage against other countries in Central America within the context of globalizing economy, and what measures would be effective in attracting them?
(iv) What kind of central functions may be established, capitalizing on its strategic location in
1-5
Central America and the La Union port, for El Salvador to enhance its international status in relation particularly to Asia?
1.2 Work Progress
1.2.1 Inception works
A team of experts led by RECS International Inc. in association with Nippon Koei Co., Ltd. and UNICO International Corp. was nominated by JICA to undertake the Study. The team (the JICA Study Team hereafter) started preparatory works in Japan and compiled the Inception Report at the end of October 2002. The first fieldwork started upon the arrival of the first group of the JICA Study Team in El Salvador on November 5, 2002. The JICA Study Team had a series of intensive discussions with CND on the scope of work for the Study based on the Inception Report. CND and the JICA Study Team agreed on the basics of the Study and also on the procedure to harmonize the views of both sides on the Inception Report. Based on the agreement, CND convened the first meeting of the Steering Committee for the Study on November 8. Over 30 representatives of various organizations and institutes participated in the meeting. Representatives of CND and the JICA Study Team signed the minutes of meetings.
During the following week between November 11 and 13, CND and the JICA Study Team had follow up discussions as agreed above. Emphasis on different tasks of the Study as well as some expressions in the Inception Report were adjusted. Also, CND and the JICA Study Team concluded a protocol for the joint undertaking of the Study.
The CND/JICA joint team conducted the first fieldtrip to the Eastern Region during November 20 through 27. The joint team held a series of meetings with various groups involved in the management and development of the Region. The team also visited several sites of ongoing or planned development activities.
The results of works during this inception stage were compiled into the Initial Fieldwork Report, which was submitted in early December 2002. The report contains a revised version of the Inception Report as discussed and agreed between CND and the JICA Study Team, and initial analysis on territorial development with clarification of the position of the Eastern Region and its development issues.
1.2.2 Analysis on existing conditions
The Study continued after the submission of the initial fieldwork report to analyze existing conditions by sector. To supplement readily available data and study reports, a few surveys were conducted during this period in close collaboration with Salvadoran experts and assistants. The survey on the existing enterprises was entrusted to a local firm under the supervision of the
1-6
Study Team. Salvadoran experts and the Study Team conducted other surveys jointly.
The existing conditions were analyzed, development issues clarified, and prospects for development assessed by sector. Partial output of the surveys was also utilized for the analysis. Based on these analyses, the Progress Report 1 was compiled. Some survey results were not fully analyzed due to their timing, and thus not reflected in the Report.
Based on the outcomes during this period, a regional workshop was held in San Miguel on February 21. Some 140 people representing various local organizations participated in the group discussions as well as plenary sessions. Also, a central seminar was convened in San Salvador on February 24 to exchange views on the prospects for the Eastern Region development.
1.2.3 Restructuring and resumption of the Study
Based on the progress of the Study during the first fieldwork from November 2002 through March 2003 and the comments on the Progress Report 1, emphases on different aspects of the Study were modified. After a series of discussions and preparatory works, JICA and the consultants of the JICA Study Team agreed on restructuring the Study with additional tasks.
The second fieldwork of the Study started on April 28, 2003 with the dispatch of the team leader and deputy team leaders of the JICA Study Team together with the JICA Advisory Team. At the beginning, they had intensive discussions with CND on the scope of work for the second fieldwork and specific tasks based on the paper that the Study Team prepared in Japan and submitted to CND in advance. They also had a series of discussions with key agencies related to the Study, including the Ministries of Foreign Affairs, Finance, Economy, Environment and Natural Resources, Agriculture and Livestock, and Education; CEPA and PROESA. The Advisory Team visited the Eastern Region and had discussions with various groups.
1.2.4 Preparation of economic development master plan focusing on the Eastern Region
The Study progressed by sector to prepare the first draft of the economic development master plan focusing on the Eastern Region. Some supplemental works to the first fieldwork were also carried out. The results of all the surveys conducted during the first fieldwork were fully compiled and analyzed.
The JICA Study Team established its San Miguel office in mid-May. More Study Team members spent longer periods of time in the Eastern Region based at this office to communicate with local people and visit potential project sites.
Additional surveys were conducted in cooperation with Salvadoran experts and assistants. A survey on potential investors was carried out in both Japan and the neighboring countries to examine private firms’ perceptions of El Salvador as investment destination and conditions that
1-7
they require. A survey on locational conditions for industrial establishments was carried out to facilitate the formulation of proposals to establish an FTZ and other facilities in the Eastern Region. Another survey was conducted to elucidate intentions of potential users, ideas and conditions for use concerning the utilization of the La Union port. As an initial step, seminars were organized in San Pedro Sula, Honduras, on June 3 and San Salvador on June 11. In connection with the former, the CND/JICA joint team organized a field trip along the route of the proposed inter-oceanic logistic corridor from El Amatillo, through Comayagua to the Cortes port.
A survey on Salvadorans living in the U.S. was carried out, including a questionnaire survey in Los Angeles, San Francisco and Washington D.C. A new survey on the conditions of public safety in the Eastern Region was also carried out.
The rural socioeconomic survey, which started during the first fieldwork, proceeded to the second phase to formulate rural development projects by a participatory approach. The results of the survey during the first fieldwork were taken as the point of departure, and the existing development initiatives were identified, which were elaborated through community workshops. Also, candidate pilot projects for rural development were identified. In this connection, the Study Team participated in the project formulation workshops of different groups in the Eastern Region organized by CND on May 28, 2003. The results were reflected in the initial formulation of priority projects.
A pilot project on indigo industrialization was initiated during this period. The pilot project was continued through this stage of the Study.
1.2.5 Revision of the master plan and action planning
Compiling the outcome of all the works outlined above, an Interim Report was prepared and submitted in August 2003. Upon submitting the Report, the third central seminar was convened in San Salvador on August 12, and the third regional workshop was organized in San Miguel on August 13. CND and the JICA Study Team also held separate sessions to discuss the contents of the Interim Report and the tasks of the subsequent stage of the Study. Based on these, minutes of meetings were prepared and signed by representatives of CND and the JICA Study Team. The JICA Study Team received additional comments later in writing from several Salvadoran Government agencies and institutes.
After the submission of the Interim Report, the JICA Study Team further elaborated various project proposals in cooperation with relevant agencies and institutes as well as CND, analyzed investment trends, and prepared an indicative investment schedule. Including the latter as well as reflecting the comments on the Interim Report, the draft master plan was revised. Moreover, an action plan was prepared, highlighting initial actions to be taken immediately following the
1-8
master plan completion through up to the year 2009.
During this period, all the surveys initiated during the second fieldwork that started in April 2003 were completed. In addition to the ongoing pilot project on indigo industrialization, the CND/JICA joint team formulated some more pilot projects through communications with various local groups in the Eastern Region. A local consulting firm selected through competitive bidding also embarked on the initial environmental examination (IEE) of the two priority projects, viz., the Rio Grande de San Miguel water resources development and the free port and economic zone (FPEZ) establishment.
1.2.6 Preparation of the draft final report
Elaboration of the master plan and proposed measures continued for October through December. For selected priority projects, in-depth studies were carried out to prepare more detailed project proposals. IEE of the two priority projects was completed. The initial phase of the pilot project on indigo industrialization was effectively completed. Preparation for its continuation and the initiation of a few other pilot projects was also completed. The results of all the surveys conducted as part of the Study were compiled. Including all these works, the Draft Final Report was compiled.
To present the Draft Final Report formally, the JICA Study Team took on its final fieldwork from January 11 through 18, 2004 together with the Advisory Committee Chairperson and representatives of the JICA headquarters. The fourth central seminar was convened in San Salvador on January 13, and the fourth regional workshop was organized in San Miguel on January 14. CND and the JICA Study Team had separate sessions to discuss the Draft Final Report and also possible follow-ups of the Study. Based on these, minutes of meetings were prepared and signed by representatives of CND and the JICA Study Team on January 16.
1.2.7 Finalization of the Study
Several Salvadoran Government agencies and institutes as well as CND submitted their comments on the Draft Final Report. They were transmitted to the JICA headquarters in Tokyo and the JICA Study Team for review. Based on the review, necessary revisions have been made on the Draft Final Report and the Final Report of the Study prepared with the following five volumes.
Volume 1: Executive Summary Volume 2: Master Plan Report Volume 3: Project Report Volume 4: Sector Review Report Volume 5: Survey Report
The present volume is Volume 2: Master Plan Report, containing the Master Plan for the
1-9
Economic Development Focusing on the Eastern Region. Volume 1 presents a summary version of the Master Plan. Volume 3 contains more detailed proposals and analyses, including project profiles, in-depth studies, initial environmental examination, and the indigo pilot project. The remaining volumes are supporting reports. Volume 4: Sector Review Report presents the analyses on existing conditions by sector. Volume 5: Survey Report contains the results of the surveys conducted as part of the Study.
1.3 Guide to the Report
The remaining part of the Master Plan Report is organized in the following way. In Chapter 2, macro pictures of national economic and spatial development are presented to clarify development issues that may be addressed in pursuing the economic development focusing on the Eastern Region. In Chapter 3, the objectives and strategy for the economic development focusing on the Eastern Region, established through the first fieldwork, are presented together with national visions and objectives.
In Chapter 4, conditions that affect the competitiveness of the Salvadoran economy are examined, the comparative position of El Salvador clarified, and the strategy for investment and export promotion presented. In Chapter 5, the competitiveness of Salvadoran industries and commodities is assessed, those promising in the Eastern Region identified, and the strategy to promote most promising industries/commodity groups in the Eastern Region derived.
Chapter 6 presents the socioeconomic framework for the Eastern Region in the context of national socioeconomic development, and the spatial development framework for the Region as well. In Chapter 7, the development scenario for the Eastern Region is presented vis-à-vis the scenario for the La Union port revitalization. The impact of the La Union port revitalization on the Eastern Region and, in turn, on the Salvadoran economy is also examined. In Chapter 8, the development strategy by sector is presented for economic development, infrastructure development, and human development.
In Chapter 9, development plans are presented for the Eastern Region and the La Union-Conchagua area, and development programs and projects are described. Institutional and financial measures to support the Eastern Region development are also proposed, and an indicative investment schedule presented. The action plan is presented, including initial actions to be taken upon the Master Plan completion.
2-1
Chapter 2 NATIONAL ECONOMIC AND SPATIAL DEVELOPMENT
2.1 National Economic Development
2.1.1 Overview of performance
(1) Economy
The economy of El Salvador made steady growth during 1970’s, as reflected in continuous increase in per capita GDP up to 1978, from ¢9,219 in 1975 to ¢10,145 in 1978 at constant 1990 prices (Central Reserve Bank of El Salvador). This was supported mainly by the agricultural sector, which contributed to some 40% of the GDP, two-third of foreign currency earnings by agricultural exports, and 25% of the income tax at the end of 1970’s. The sector provided well over 50% of employment opportunities. The economy started to deteriorate as the civil war intensified on a full scale in 1979, when the per capita GDP also started to decline.
The Salvadoran economy as a whole stagnated almost completely during 1980’s. During this period, the per capita GDP decreased from ¢8,271 in 1980 to ¢6,926 in 1989 at constant 1990 prices. The economic structure changed drastically over the decade. While the industry and the services sectors attained modest gains, the agricultural GDP decreased by more than 50%. This is due to the neglect by both the Government without any adequate agricultural policy and the people involved inevitably in armed conflicts. Ironically, increased emigrants and family remittances from abroad during the civil war contributed to the services sector development with booming financial services.
The economy of El Salvador started to recover rapidly as the civil war ended in 1992. The GDP increased during the post war period of 1992-95 at the average annual rate of 6.2% (Central Reserve Bank). This is largely due to the structural adjustment policy and the economic stabilization program adopted in 1989. The policy aimed to restore macroeconomic stability and establish market-oriented economy through tight money policy, deregulation of interest rates, foreign exchange, trade restrictions and subsidies on sugar and coffee markets and other areas, tax reform, and financial strengthening of State banks for privatization. These measures have been taken over by successive administrations. In addition, the dollarization was introduced in 2001, which has resulted in the reduction in interest rates.
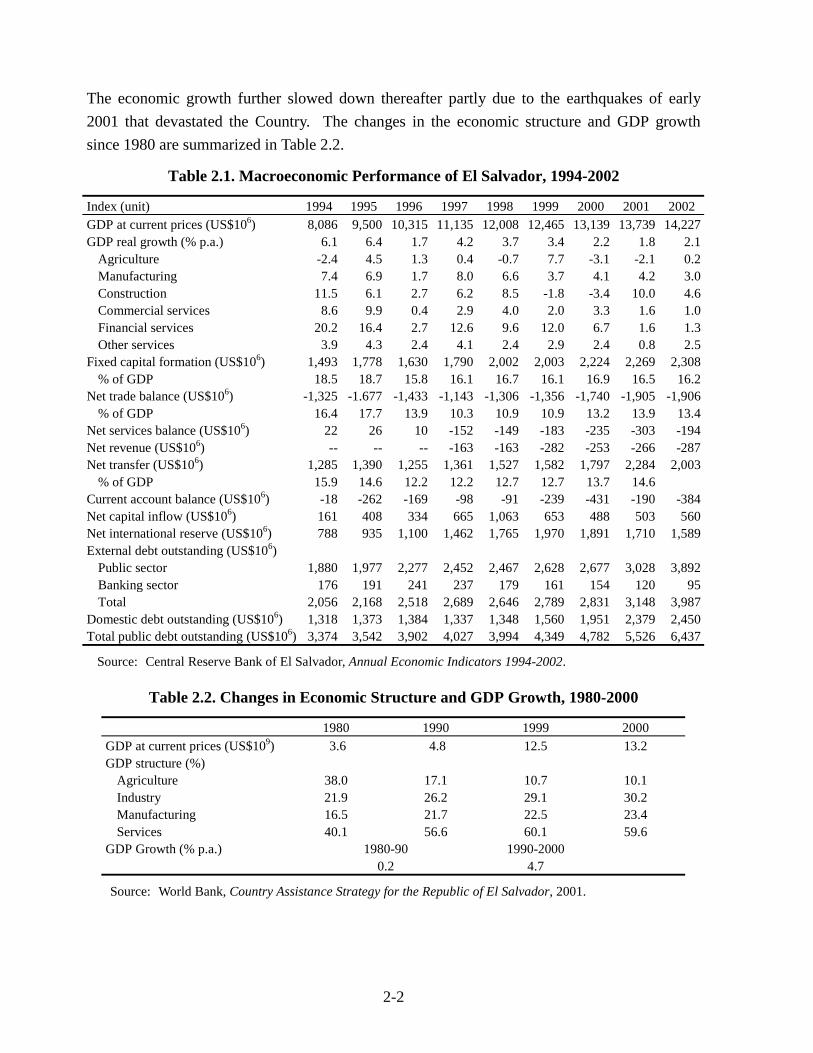
The economic growth slowed down subsequently, averaging at 3.0% for 1995 through 2000 (Table 2.1). Factors contributing to the slowdown are: falling export prices of coffee and sugar in 1996-97, the impact of the hurricane Mitch in late 1998, and an adverse external environment after 1999, including the further decline in coffee prices, loss of regional competitiveness due to the depreciation of the Guatemalan Quetzal, increased competition for non-traditional and maquila exports to the U.S. market, higher world oil prices, and an increase in crime and violence (World Bank, Country Assistance Strategy for the Republic of El Salvador, 2001).
2-2
The economic growth further slowed down thereafter partly due to the earthquakes of early 2001 that devastated the Country. The changes in the economic structure and GDP growth since 1980 are summarized in Table 2.2.
Table 2.1. Macroeconomic Performance of El Salvador, 1994-2002
Index (unit) 1994 1995 1996 1997 1998 1999 2000 2001 2002 GDP at current prices (US$106) 8,086 9,500 10,315 11,135 12,008 12,465 13,139 13,739 14,227 GDP real growth (% p.a.) 6.1 6.4 1.7 4.2 3.7 3.4 2.2 1.8 2.1
Agriculture -2.4 4.5 1.3 0.4 -0.7 7.7 -3.1 -2.1 0.2 Manufacturing 7.4 6.9 1.7 8.0 6.6 3.7 4.1 4.2 3.0 Construction 11.5 6.1 2.7 6.2 8.5 -1.8 -3.4 10.0 4.6 Commercial services 8.6 9.9 0.4 2.9 4.0 2.0 3.3 1.6 1.0 Financial services 20.2 16.4 2.7 12.6 9.6 12.0 6.7 1.6 1.3 Other services 3.9 4.3 2.4 4.1 2.4 2.9 2.4 0.8 2.5
Fixed capital formation (US$106) 1,493 1,778 1,630 1,790 2,002 2,003 2,224 2,269 2,308 % of GDP 18.5 18.7 15.8 16.1 16.7 16.1 16.9 16.5 16.2
Net trade balance (US$106) -1,325 -1.677 -1,433 -1,143 -1,306 -1,356 -1,740 -1,905 -1,906 % of GDP 16.4 17.7 13.9 10.3 10.9 10.9 13.2 13.9 13.4
Net services balance (US$106) 22 26 10 -152 -149 -183 -235 -303 -194 Net revenue (US$106) -- -- -- -163 -163 -282 -253 -266 -287 Net transfer (US$106) 1,285 1,390 1,255 1,361 1,527 1,582 1,797 2,284 2,003
% of GDP 15.9 14.6 12.2 12.2 12.7 12.7 13.7 14.6 Current account balance (US$106) -18 -262 -169 -98 -91 -239 -431 -190 -384 Net capital inflow (US$106) 161 408 334 665 1,063 653 488 503 560 Net international reserve (US$106) 788 935 1,100 1,462 1,765 1,970 1,891 1,710 1,589 External debt outstanding (US$106)
Public sector 1,880 1,977 2,277 2,452 2,467 2,628 2,677 3,028 3,892 Banking sector 176 191 241 237 179 161 154 120 95 Total 2,056 2,168 2,518 2,689 2,646 2,789 2,831 3,148 3,987
Domestic debt outstanding (US$106) 1,318 1,373 1,384 1,337 1,348 1,560 1,951 2,379 2,450 Total public debt outstanding (US$106) 3,374 3,542 3,902 4,027 3,994 4,349 4,782 5,526 6,437
Source: Central Reserve Bank of El Salvador, Annual Economic Indicators 1994-2002.
Table 2.2. Changes in Economic Structure and GDP Growth, 1980-2000
1980 1990 1999 2000 GDP at current prices (US$109) 3.6 4.8 12.5 13.2 GDP structure (%)
Agriculture 38.0 17.1 10.7 10.1 Industry 21.9 26.2 29.1 30.2 Manufacturing 16.5 21.7 22.5 23.4 Services 40.1 56.6 60.1 59.6
GDP Growth (% p.a.) 1980-90 1990-2000 0.2 4.7
Source: World Bank, Country Assistance Strategy for the Republic of El Salvador, 2001.
2-3
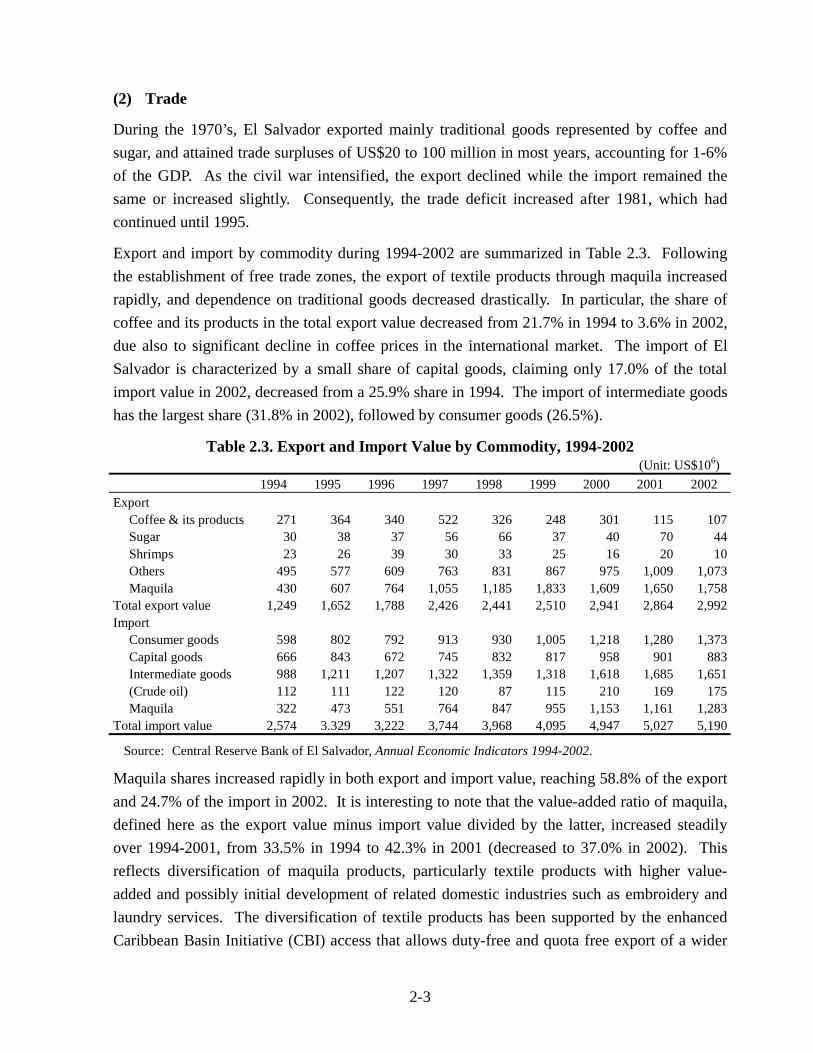
(2) Trade
During the 1970’s, El Salvador exported mainly traditional goods represented by coffee and sugar, and attained trade surpluses of US$20 to 100 million in most years, accounting for 1-6% of the GDP. As the civil war intensified, the export declined while the import remained the same or increased slightly. Consequently, the trade deficit increased after 1981, which had continued until 1995.
Export and import by commodity during 1994-2002 are summarized in Table 2.3. Following the establishment of free trade zones, the export of textile products through maquila increased rapidly, and dependence on traditional goods decreased drastically. In particular, the share of coffee and its products in the total export value decreased from 21.7% in 1994 to 3.6% in 2002, due also to significant decline in coffee prices in the international market. The import of El Salvador is characterized by a small share of capital goods, claiming only 17.0% of the total import value in 2002, decreased from a 25.9% share in 1994. The import of intermediate goods has the largest share (31.8% in 2002), followed by consumer goods (26.5%).
Table 2.3. Export and Import Value by Commodity, 1994-2002 (Unit: US$106)
1994 1995 1996 1997 1998 1999 2000 2001 2002 Export
Coffee & its products 271 364 340 522 326 248 301 115 107 Sugar 30 38 37 56 66 37 40 70 44 Shrimps 23 26 39 30 33 25 16 20 10 Others 495 577 609 763 831 867 975 1,009 1,073 Maquila 430 607 764 1,055 1,185 1,833 1,609 1,650 1,758
Total export value 1,249 1,652 1,788 2,426 2,441 2,510 2,941 2,864 2,992 Import
Consumer goods 598 802 792 913 930 1,005 1,218 1,280 1,373 Capital goods 666 843 672 745 832 817 958 901 883 Intermediate goods 988 1,211 1,207 1,322 1,359 1,318 1,618 1,685 1,651 (Crude oil) 112 111 122 120 87 115 210 169 175 Maquila 322 473 551 764 847 955 1,153 1,161 1,283
Total import value 2,574 3.329 3,222 3,744 3,968 4,095 4,947 5,027 5,190
Source: Central Reserve Bank of El Salvador, Annual Economic Indicators 1994-2002.
Maquila shares increased rapidly in both export and import value, reaching 58.8% of the export and 24.7% of the import in 2002. It is interesting to note that the value-added ratio of maquila, defined here as the export value minus import value divided by the latter, increased steadily over 1994-2001, from 33.5% in 1994 to 42.3% in 2001 (decreased to 37.0% in 2002). This reflects diversification of maquila products, particularly textile products with higher value-added and possibly initial development of related domestic industries such as embroidery and laundry services. The diversification of textile products has been supported by the enhanced Caribbean Basin Initiative (CBI) access that allows duty-free and quota free export of a wider
2-4
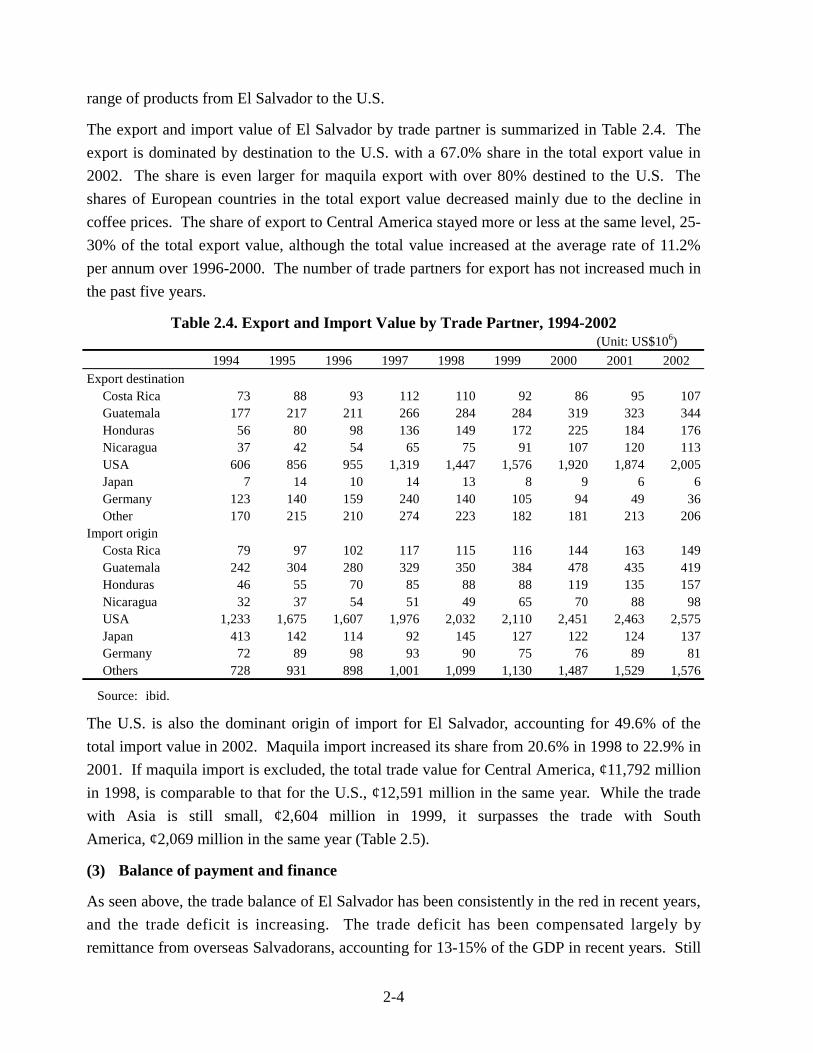
range of products from El Salvador to the U.S.
The export and import value of El Salvador by trade partner is summarized in Table 2.4. The export is dominated by destination to the U.S. with a 67.0% share in the total export value in 2002. The share is even larger for maquila export with over 80% destined to the U.S. The shares of European countries in the total export value decreased mainly due to the decline in coffee prices. The share of export to Central America stayed more or less at the same level, 25-30% of the total export value, although the total value increased at the average rate of 11.2% per annum over 1996-2000. The number of trade partners for export has not increased much in the past five years.
Table 2.4. Export and Import Value by Trade Partner, 1994-2002 (Unit: US$106)
1994 1995 1996 1997 1998 1999 2000 2001 2002 Export destination
Costa Rica 73 88 93 112 110 92 86 95 107 Guatemala 177 217 211 266 284 284 319 323 344 Honduras 56 80 98 136 149 172 225 184 176 Nicaragua 37 42 54 65 75 91 107 120 113 USA 606 856 955 1,319 1,447 1,576 1,920 1,874 2,005 Japan 7 14 10 14 13 8 9 6 6 Germany 123 140 159 240 140 105 94 49 36 Other 170 215 210 274 223 182 181 213 206
Import origin Costa Rica 79 97 102 117 115 116 144 163 149 Guatemala 242 304 280 329 350 384 478 435 419 Honduras 46 55 70 85 88 88 119 135 157 Nicaragua 32 37 54 51 49 65 70 88 98 USA 1,233 1,675 1,607 1,976 2,032 2,110 2,451 2,463 2,575 Japan 413 142 114 92 145 127 122 124 137 Germany 72 89 98 93 90 75 76 89 81 Others 728 931 898 1,001 1,099 1,130 1,487 1,529 1,576
Source: ibid.
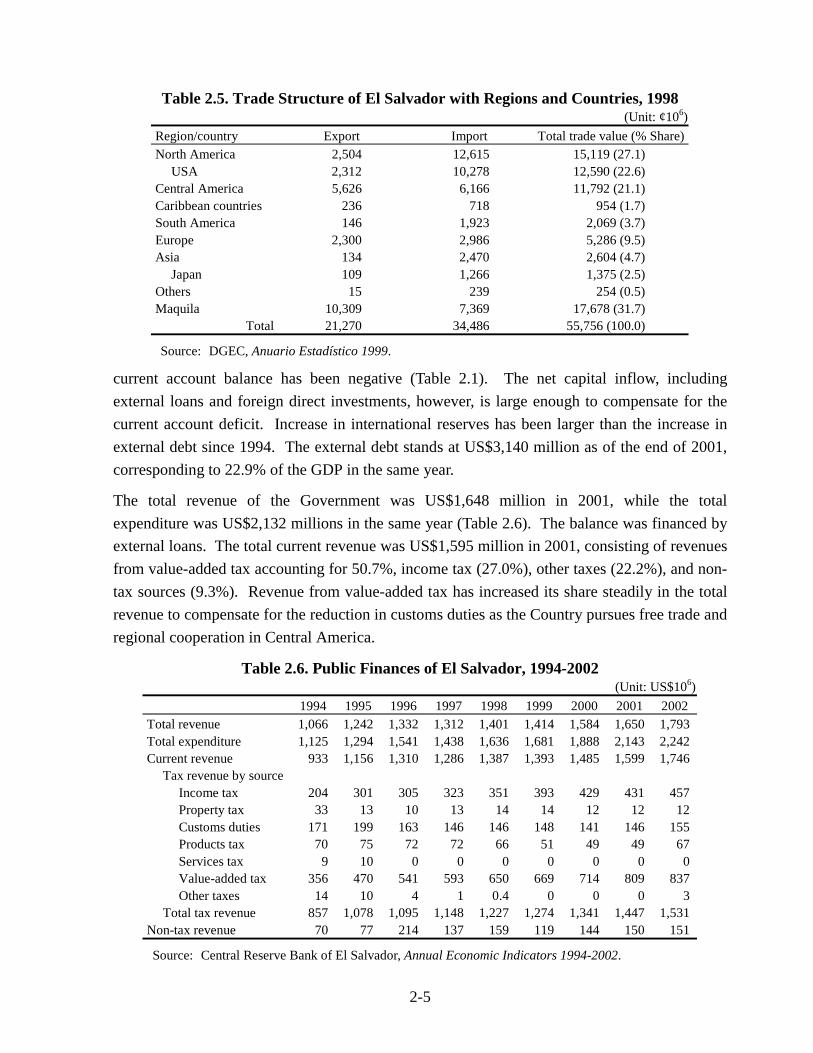
The U.S. is also the dominant origin of import for El Salvador, accounting for 49.6% of the total import value in 2002. Maquila import increased its share from 20.6% in 1998 to 22.9% in 2001. If maquila import is excluded, the total trade value for Central America, ¢11,792 million in 1998, is comparable to that for the U.S., ¢12,591 million in the same year. While the trade with Asia is still small, ¢2,604 million in 1999, it surpasses the trade with South America, ¢2,069 million in the same year (Table 2.5).
(3) Balance of payment and finance
As seen above, the trade balance of El Salvador has been consistently in the red in recent years, and the trade deficit is increasing. The trade deficit has been compensated largely by remittance from overseas Salvadorans, accounting for 13-15% of the GDP in recent years. Still
2-5
Table 2.5. Trade Structure of El Salvador with Regions and Countries, 1998 (Unit: ¢106)
Region/country Export Import Total trade value (% Share) North America 2,504 12,615 15,119 (27.1)
USA 2,312 10,278 12,590 (22.6) Central America 5,626 6,166 11,792 (21.1) Caribbean countries 236 718 954 (1.7) South America 146 1,923 2,069 (3.7) Europe 2,300 2,986 5,286 (9.5) Asia 134 2,470 2,604 (4.7)
Japan 109 1,266 1,375 (2.5) Others 15 239 254 (0.5) Maquila 10,309 7,369 17,678 (31.7)
Total 21,270 34,486 55,756 (100.0)
Source: DGEC, Anuario Estadístico 1999.
current account balance has been negative (Table 2.1). The net capital inflow, including external loans and foreign direct investments, however, is large enough to compensate for the current account deficit. Increase in international reserves has been larger than the increase in external debt since 1994. The external debt stands at US$3,140 million as of the end of 2001, corresponding to 22.9% of the GDP in the same year.
The total revenue of the Government was US$1,648 million in 2001, while the total expenditure was US$2,132 millions in the same year (Table 2.6). The balance was financed by external loans. The total current revenue was US$1,595 million in 2001, consisting of revenues from value-added tax accounting for 50.7%, income tax (27.0%), other taxes (22.2%), and non-tax sources (9.3%). Revenue from value-added tax has increased its share steadily in the total revenue to compensate for the reduction in customs duties as the Country pursues free trade and regional cooperation in Central America.
Table 2.6. Public Finances of El Salvador, 1994-2002 (Unit: US$106)
1994 1995 1996 1997 1998 1999 2000 2001 2002 Total revenue 1,066 1,242 1,332 1,312 1,401 1,414 1,584 1,650 1,793 Total expenditure 1,125 1,294 1,541 1,438 1,636 1,681 1,888 2,143 2,242 Current revenue 933 1,156 1,310 1,286 1,387 1,393 1,485 1,599 1,746
Tax revenue by source Income tax 204 301 305 323 351 393 429 431 457 Property tax 33 13 10 13 14 14 12 12 12 Customs duties 171 199 163 146 146 148 141 146 155 Products tax 70 75 72 72 66 51 49 49 67 Services tax 9 10 0 0 0 0 0 0 0 Value-added tax 356 470 541 593 650 669 714 809 837 Other taxes 14 10 4 1 0.4 0 0 0 3
Total tax revenue 857 1,078 1,095 1,148 1,227 1,274 1,341 1,447 1,531 Non-tax revenue 70 77 214 137 159 119 144 150 151
Source: Central Reserve Bank of El Salvador, Annual Economic Indicators 1994-2002.
2-6
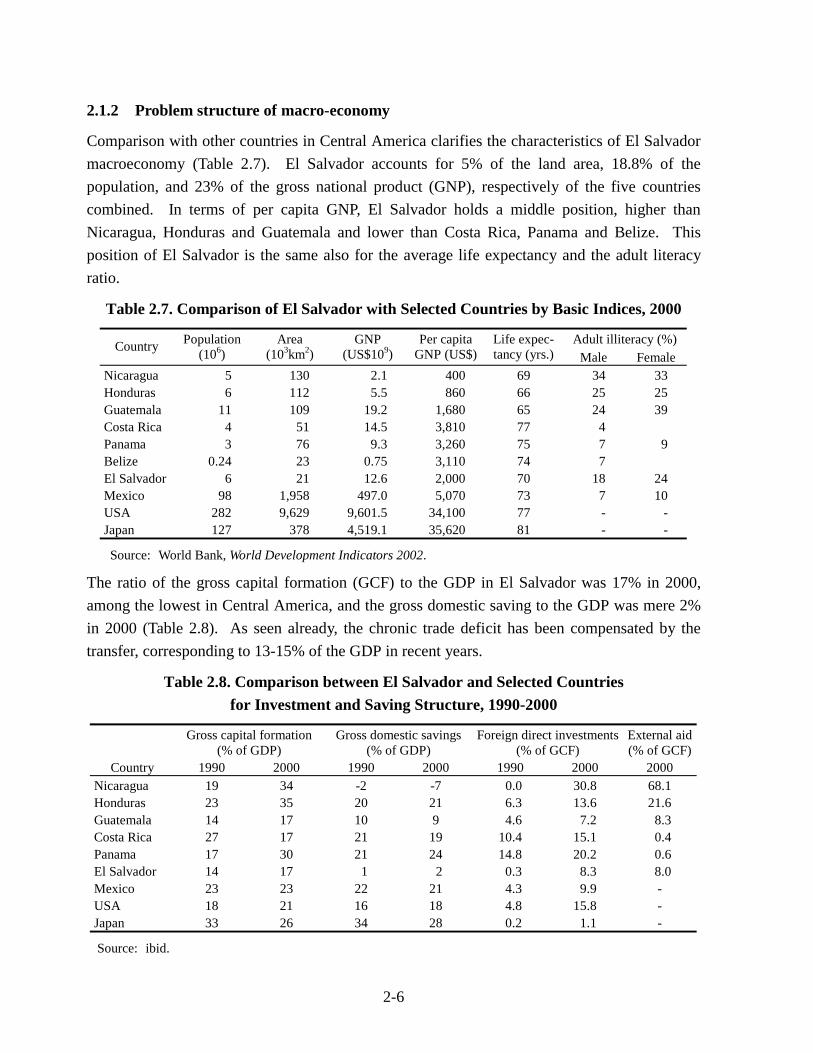
2.1.2 Problem structure of macro-economy
Comparison with other countries in Central America clarifies the characteristics of El Salvador macroeconomy (Table 2.7). El Salvador accounts for 5% of the land area, 18.8% of the population, and 23% of the gross national product (GNP), respectively of the five countries combined. In terms of per capita GNP, El Salvador holds a middle position, higher than Nicaragua, Honduras and Guatemala and lower than Costa Rica, Panama and Belize. This position of El Salvador is the same also for the average life expectancy and the adult literacy ratio.
Table 2.7. Comparison of El Salvador with Selected Countries by Basic Indices, 2000
Adult illiteracy (%) Country Population (106)
Area (103km2)
GNP (US$109)
Per capita GNP (US$)
Life expec-tancy (yrs.) Male Female
Nicaragua 5 130 2.1 400 69 34 33 Honduras 6 112 5.5 860 66 25 25 Guatemala 11 109 19.2 1,680 65 24 39 Costa Rica 4 51 14.5 3,810 77 4 Panama 3 76 9.3 3,260 75 7 9 Belize 0.24 23 0.75 3,110 74 7 El Salvador 6 21 12.6 2,000 70 18 24 Mexico 98 1,958 497.0 5,070 73 7 10 USA 282 9,629 9,601.5 34,100 77 - - Japan 127 378 4,519.1 35,620 81 - -
Source: World Bank, World Development Indicators 2002.
The ratio of the gross capital formation (GCF) to the GDP in El Salvador was 17% in 2000, among the lowest in Central America, and the gross domestic saving to the GDP was mere 2% in 2000 (Table 2.8). As seen already, the chronic trade deficit has been compensated by the transfer, corresponding to 13-15% of the GDP in recent years.
Table 2.8. Comparison between El Salvador and Selected Countries for Investment and Saving Structure, 1990-2000
Gross capital formation (% of GDP)
Gross domestic savings (% of GDP)
Foreign direct investments (% of GCF)
External aid (% of GCF)
Country 1990 2000 1990 2000 1990 2000 2000 Nicaragua 19 34 -2 -7 0.0 30.8 68.1 Honduras 23 35 20 21 6.3 13.6 21.6 Guatemala 14 17 10 9 4.6 7.2 8.3 Costa Rica 27 17 21 19 10.4 15.1 0.4 Panama 17 30 21 24 14.8 20.2 0.6 El Salvador 14 17 1 2 0.3 8.3 8.0 Mexico 23 23 22 21 4.3 9.9 - USA 18 21 16 18 4.8 15.8 - Japan 33 26 34 28 0.2 1.1 -
Source: ibid.
2-7
Thus, the overseas remittance effectively serves as an alternative to savings although its contribution to investment is limited. This is in contrast with other countries where foreign direct investments or aids or both are more important in filling the saving-investment gaps. In El Salvador, foreign direct investments and aids correspond to 8.3% and 8.0% respectively of the GCF, relatively low by the Central American standards. While El Salvador has been successful in increasing the tax revenue with the introduction of the value-added tax as custom duties have decreased along with the promotion of free trade, the national finance is still debt-stricken.
Although the Salvadoran economy has diversified especially after the civil war, overcoming the dependence on coffee, sugar and other traditional industries, it has become increasingly dependent on the low value-added textile industry. While the export has expanded rapidly following the establishment of free trade zones, most maquila industries are textile manufacturers (121 out of 127 establishments in free zones as of 2001), relying heavily on export to the U.S. They are benefiting from the enhanced CBI effected in late 2000.
El Salvador will have to cope with further economic liberalization and free trade with the problem structure of its macroeconomy described above. Particularly in the short to medium term future, El Salvador is vulnerable to adverse external developments including: (i) a longer than expected slowdown in the world economy, especially in the U.S. and Central America; (ii) loss of export competitiveness following dollarization and eventual strong dollar; (iii) declining terms of trade; and (iv) uncertainty over the sustained competitiveness of maquila export (World Bank, op. cit.).
2.2 National Spatial Development
2.2.1 Overview
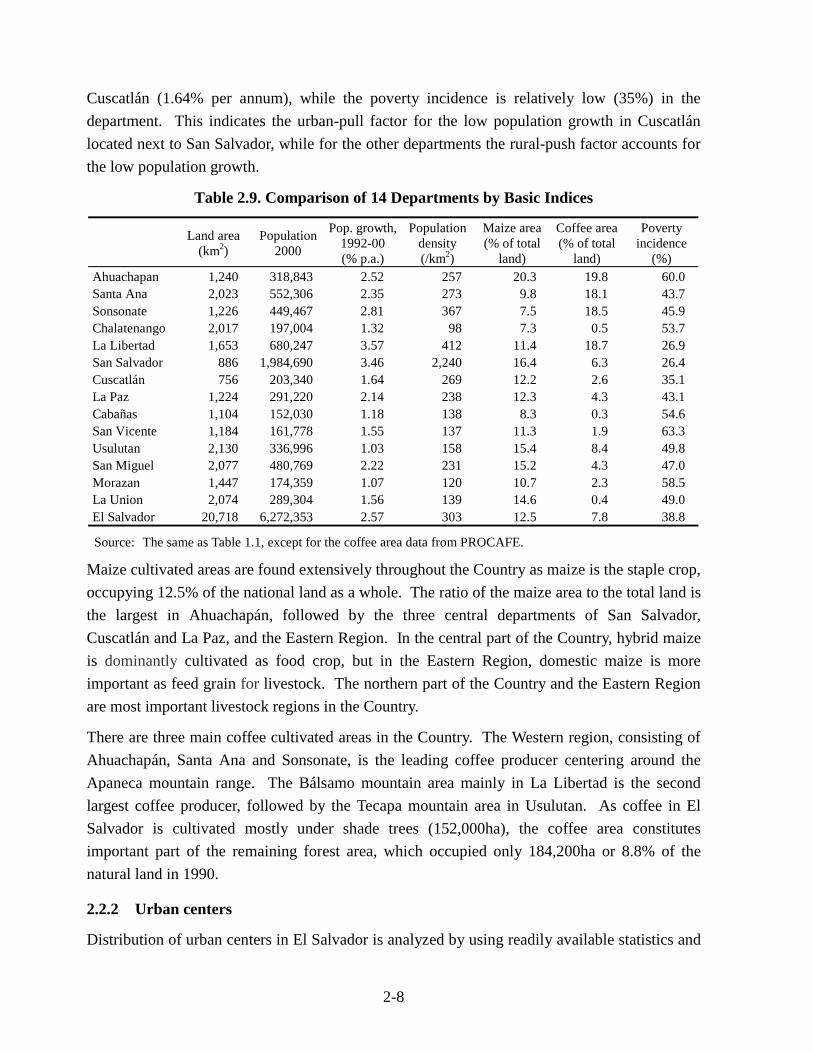
The Republic of El Salvador occupies the central part of the Central American isthmus, facing the Pacific Ocean, with a total land area of 20,718km2. Administratively, it is subdivided into 14 departments, consisting in total 262 municipalities and 2,296 districts (cantón). The 14 departments are compared in Table 2.9 by selected indices to see the spatial distribution of some basic aspects of development.
The population density varies widely between departments, from the extreme in San Salvador at 2,240 per km2, followed by 412 per km2 in La Libertad to 98 per km2 in Chalatenango. Four departments with the northern border with Honduras, except San Miguel, have low density below 200 per km2, together with San Vicente and Usulutan. Population grown rates are also low in these six departments, below 1.6% per annum during 1992-2000, indicating the lack of economic dynamics. Of these departments, poverty incidence is over 50% in the four departments of Chalatenango, Cabañas, San Vicente, and Morazan and close to 50% in the two departments of Usulutan and La Union. The population growth is relatively low also in
2-8
Cuscatlán (1.64% per annum), while the poverty incidence is relatively low (35%) in the department. This indicates the urban-pull factor for the low population growth in Cuscatlán located next to San Salvador, while for the other departments the rural-push factor accounts for the low population growth.
Table 2.9. Comparison of 14 Departments by Basic Indices
Land area (km2)
Population 2000
Pop. growth, 1992-00 (% p.a.)
Population density (/km2)
Maize area (% of total
land)
Coffee area (% of total
land)
Poverty incidence
(%) Ahuachapan 1,240 318,843 2.52 257 20.3 19.8 60.0 Santa Ana 2,023 552,306 2.35 273 9.8 18.1 43.7 Sonsonate 1,226 449,467 2.81 367 7.5 18.5 45.9 Chalatenango 2,017 197,004 1.32 98 7.3 0.5 53.7 La Libertad 1,653 680,247 3.57 412 11.4 18.7 26.9 San Salvador 886 1,984,690 3.46 2,240 16.4 6.3 26.4 Cuscatlán 756 203,340 1.64 269 12.2 2.6 35.1 La Paz 1,224 291,220 2.14 238 12.3 4.3 43.1 Cabañas 1,104 152,030 1.18 138 8.3 0.3 54.6 San Vicente 1,184 161,778 1.55 137 11.3 1.9 63.3 Usulutan 2,130 336,996 1.03 158 15.4 8.4 49.8 San Miguel 2,077 480,769 2.22 231 15.2 4.3 47.0 Morazan 1,447 174,359 1.07 120 10.7 2.3 58.5 La Union 2,074 289,304 1.56 139 14.6 0.4 49.0 El Salvador 20,718 6,272,353 2.57 303 12.5 7.8 38.8
Source: The same as Table 1.1, except for the coffee area data from PROCAFE.
Maize cultivated areas are found extensively throughout the Country as maize is the staple crop, occupying 12.5% of the national land as a whole. The ratio of the maize area to the total land is the largest in Ahuachapán, followed by the three central departments of San Salvador, Cuscatlán and La Paz, and the Eastern Region. In the central part of the Country, hybrid maize is dominantly cultivated as food crop, but in the Eastern Region, domestic maize is more important as feed grain for livestock. The northern part of the Country and the Eastern Region are most important livestock regions in the Country.
There are three main coffee cultivated areas in the Country. The Western region, consisting of Ahuachapán, Santa Ana and Sonsonate, is the leading coffee producer centering around the Apaneca mountain range. The Bálsamo mountain area mainly in La Libertad is the second largest coffee producer, followed by the Tecapa mountain area in Usulutan. As coffee in El Salvador is cultivated mostly under shade trees (152,000ha), the coffee area constitutes important part of the remaining forest area, which occupied only 184,200ha or 8.8% of the natural land in 1990.
2.2.2 Urban centers
Distribution of urban centers in El Salvador is analyzed by using readily available statistics and
2-9
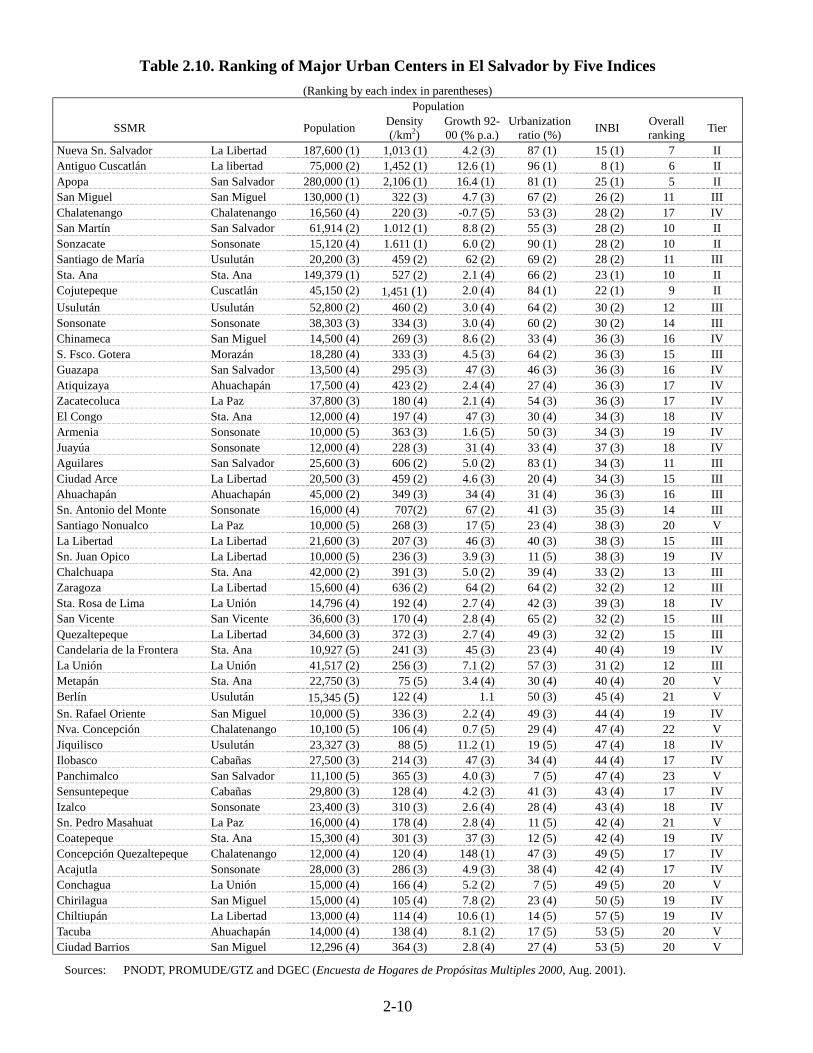
data derived from recent studies to clarify the existing urban hierarchy. Out of 262 municipal capitals, only those having larger urban population are subject to the analysis. The PNODT study has classified municipal areas into four classes: A for urban core of municipal capital including its spillover area, B for large settlement or population center in dominantly rural area, C for other settlements in dominantly rural area, and D for village/hamlet in strictly rural area (PNODT, Primer Informe Parcial – Diagnóstico Sistema Urbano y Poblamiento 6. Demografía e Información Básica Municipal, June 2002). Only 61 municipalities having urban population of Class A over 10,000 are selected for the analysis. Of these, nine are considered to constitute the core of the San Salvador metropolitan region (SSMR) with a total population of 1,352,037 and at the top of the urban hierarchy (Tier I).
The remaining 52 urban centers are analyzed with respect to potentials to serve various urban functions expected at different tiers of the hierarchy. Five criteria are used. The size of population is used to represent agglomeration economies. Population density indicates certain aspect of efficiency for urban services. The average annual rate of population increase over 1992-2000 is used to reflect economic dynamism. The urbanization ratio of each municipality is taken to see effectiveness of urban services. To reflect social aspects in the analysis, an index defined by a recent GTZ study is used (PROMUDE/GTZ, Propuesta de una Tipología de Municipios para El Salvador). This is a composite index defined by combining various factors related to the quality and levels of urban services, and called unfulfilled basic needs index (INBI). All the data are given in Table 2.10.
Ranking of urban centers
All the urban centers are classified into five ranks for each index as shown below to normalize the evaluation by different indices for comparison.
Rank Population Population density (/km2)
Population growth (% p.a.)
Urbanization ratio (%) INBI
1 Over 100,000 Over 1,000 Over 9.0 Over 80 8-25 2 40,000-99,999 400-999 5.0-8.9 60-79 26-33 3 20,000-39,999 200-399 3.5-4.9 40-59 34-39 4 12,000-19,999 100-199 2.0-3.4 20-39 40-47 5 Below 11,999 Below 99 Below 1.9 Below 19 Over 48
The overall rank of any urban center is determined by simply adding ranks by different indices. Based on the overall ranking, the 52 urban centers are categorized into four tiers: rank 5 to 10 for Tier II (seven urban centers), rank 11 to 15 for Tier III (13 urban centers), rank 16 to 19 for Tier IV (22 urban centers), and rank over 20 for Tier V (10 urban centers). More urban centers may need to be defined for Tier V. The results are illustrated in Figure 2.1 (also shown in Table 2.10).
2-10
Table 2.10. Ranking of Major Urban Centers in El Salvador by Five Indices (Ranking by each index in parentheses)
Population
SSMR Population Density (/km2)
Growth 92-00 (% p.a.)
Urbanization ratio (%) INBI Overall
ranking Tier
Nueva Sn. Salvador La Libertad 187,600 (1) 1,013 (1) 4.2 (3) 87 (1) 15 (1) 7 II Antiguo Cuscatlán La libertad 75,000 (2) 1,452 (1) 12.6 (1) 96 (1) 8 (1) 6 II Apopa San Salvador 280,000 (1) 2,106 (1) 16.4 (1) 81 (1) 25 (1) 5 II San Miguel San Miguel 130,000 (1) 322 (3) 4.7 (3) 67 (2) 26 (2) 11 III Chalatenango Chalatenango 16,560 (4) 220 (3) -0.7 (5) 53 (3) 28 (2) 17 IV San Martín San Salvador 61,914 (2) 1.012 (1) 8.8 (2) 55 (3) 28 (2) 10 II Sonzacate Sonsonate 15,120 (4) 1.611 (1) 6.0 (2) 90 (1) 28 (2) 10 II Santiago de María Usulután 20,200 (3) 459 (2) 62 (2) 69 (2) 28 (2) 11 III Sta. Ana Sta. Ana 149,379 (1) 527 (2) 2.1 (4) 66 (2) 23 (1) 10 II Cojutepeque Cuscatlán 45,150 (2) 1,451 (1) 2.0 (4) 84 (1) 22 (1) 9 II Usulután Usulután 52,800 (2) 460 (2) 3.0 (4) 64 (2) 30 (2) 12 III Sonsonate Sonsonate 38,303 (3) 334 (3) 3.0 (4) 60 (2) 30 (2) 14 III Chinameca San Miguel 14,500 (4) 269 (3) 8.6 (2) 33 (4) 36 (3) 16 IV S. Fsco. Gotera Morazán 18,280 (4) 333 (3) 4.5 (3) 64 (2) 36 (3) 15 III Guazapa San Salvador 13,500 (4) 295 (3) 47 (3) 46 (3) 36 (3) 16 IV Atiquizaya Ahuachapán 17,500 (4) 423 (2) 2.4 (4) 27 (4) 36 (3) 17 IV Zacatecoluca La Paz 37,800 (3) 180 (4) 2.1 (4) 54 (3) 36 (3) 17 IV El Congo Sta. Ana 12,000 (4) 197 (4) 47 (3) 30 (4) 34 (3) 18 IV Armenia Sonsonate 10,000 (5) 363 (3) 1.6 (5) 50 (3) 34 (3) 19 IV Juayúa Sonsonate 12,000 (4) 228 (3) 31 (4) 33 (4) 37 (3) 18 IV Aguilares San Salvador 25,600 (3) 606 (2) 5.0 (2) 83 (1) 34 (3) 11 III Ciudad Arce La Libertad 20,500 (3) 459 (2) 4.6 (3) 20 (4) 34 (3) 15 III Ahuachapán Ahuachapán 45,000 (2) 349 (3) 34 (4) 31 (4) 36 (3) 16 III Sn. Antonio del Monte Sonsonate 16,000 (4) 707(2) 67 (2) 41 (3) 35 (3) 14 III Santiago Nonualco La Paz 10,000 (5) 268 (3) 17 (5) 23 (4) 38 (3) 20 V La Libertad La Libertad 21,600 (3) 207 (3) 46 (3) 40 (3) 38 (3) 15 III Sn. Juan Opico La Libertad 10,000 (5) 236 (3) 3.9 (3) 11 (5) 38 (3) 19 IV Chalchuapa Sta. Ana 42,000 (2) 391 (3) 5.0 (2) 39 (4) 33 (2) 13 III Zaragoza La Libertad 15,600 (4) 636 (2) 64 (2) 64 (2) 32 (2) 12 III Sta. Rosa de Lima La Unión 14,796 (4) 192 (4) 2.7 (4) 42 (3) 39 (3) 18 IV San Vicente San Vicente 36,600 (3) 170 (4) 2.8 (4) 65 (2) 32 (2) 15 III Quezaltepeque La Libertad 34,600 (3) 372 (3) 2.7 (4) 49 (3) 32 (2) 15 III Candelaria de la Frontera Sta. Ana 10,927 (5) 241 (3) 45 (3) 23 (4) 40 (4) 19 IV La Unión La Unión 41,517 (2) 256 (3) 7.1 (2) 57 (3) 31 (2) 12 III Metapán Sta. Ana 22,750 (3) 75 (5) 3.4 (4) 30 (4) 40 (4) 20 V Berlín Usulután 15,345 (5) 122 (4) 1.1 50 (3) 45 (4) 21 V Sn. Rafael Oriente San Miguel 10,000 (5) 336 (3) 2.2 (4) 49 (3) 44 (4) 19 IV Nva. Concepción Chalatenango 10,100 (5) 106 (4) 0.7 (5) 29 (4) 47 (4) 22 V Jiquilisco Usulután 23,327 (3) 88 (5) 11.2 (1) 19 (5) 47 (4) 18 IV Ilobasco Cabañas 27,500 (3) 214 (3) 47 (3) 34 (4) 44 (4) 17 IV Panchimalco San Salvador 11,100 (5) 365 (3) 4.0 (3) 7 (5) 47 (4) 23 V Sensuntepeque Cabañas 29,800 (3) 128 (4) 4.2 (3) 41 (3) 43 (4) 17 IV Izalco Sonsonate 23,400 (3) 310 (3) 2.6 (4) 28 (4) 43 (4) 18 IV Sn. Pedro Masahuat La Paz 16,000 (4) 178 (4) 2.8 (4) 11 (5) 42 (4) 21 V Coatepeque Sta. Ana 15,300 (4) 301 (3) 37 (3) 12 (5) 42 (4) 19 IV Concepción Quezaltepeque Chalatenango 12,000 (4) 120 (4) 148 (1) 47 (3) 49 (5) 17 IV Acajutla Sonsonate 28,000 (3) 286 (3) 4.9 (3) 38 (4) 42 (4) 17 IV Conchagua La Unión 15,000 (4) 166 (4) 5.2 (2) 7 (5) 49 (5) 20 V Chirilagua San Miguel 15,000 (4) 105 (4) 7.8 (2) 23 (4) 50 (5) 19 IV Chiltiupán La Libertad 13,000 (4) 114 (4) 10.6 (1) 14 (5) 57 (5) 19 IV Tacuba Ahuachapán 14,000 (4) 138 (4) 8.1 (2) 17 (5) 53 (5) 20 V Ciudad Barrios San Miguel 12,296 (4) 364 (3) 2.8 (4) 27 (4) 53 (5) 20 V
Sources: PNODT, PROMUDE/GTZ and DGEC (Encuesta de Hogares de Propósitas Multiples 2000, Aug. 2001).
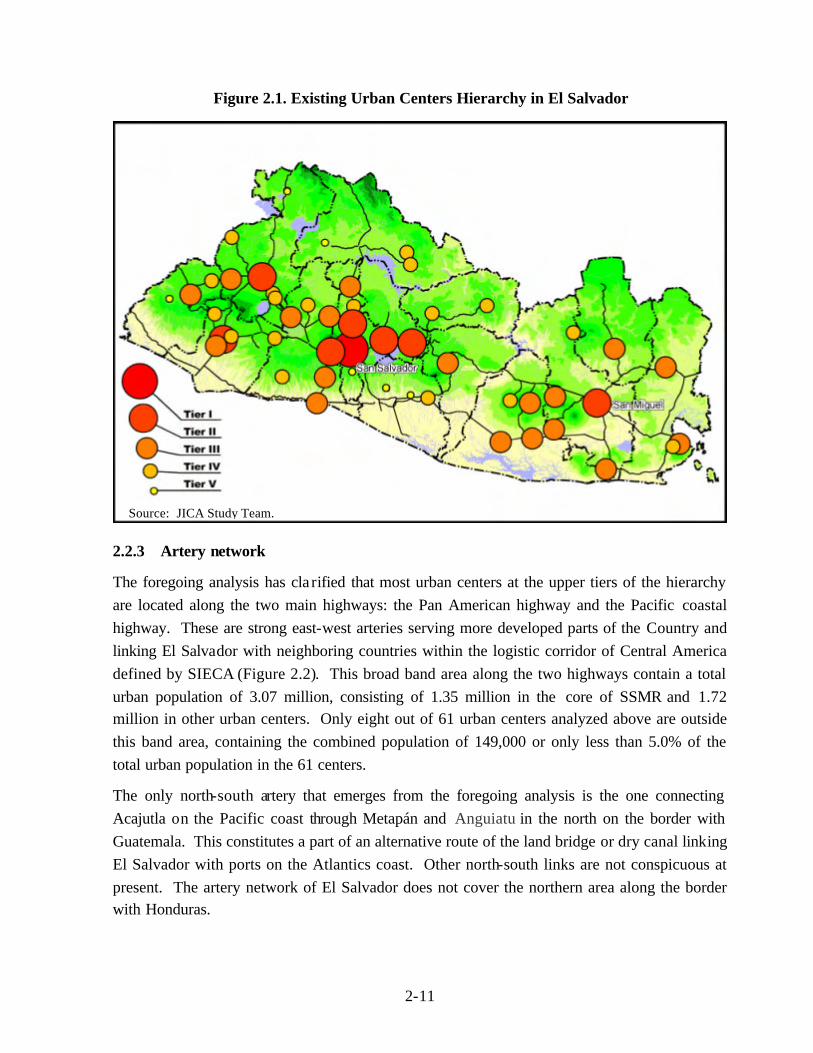
2-11
Figure 2.1. Existing Urban Centers Hierarchy in El Salvador
2.2.3 Artery network
The foregoing analysis has cla rified that most urban centers at the upper tiers of the hierarchy are located along the two main highways: the Pan American highway and the Pacific coastal highway. These are strong east-west arteries serving more developed parts of the Country and linking El Salvador with neighboring countries within the logistic corridor of Central America defined by SIECA (Figure 2.2). This broad band area along the two highways contain a total urban population of 3.07 million, consisting of 1.35 million in the core of SSMR and 1.72 million in other urban centers. Only eight out of 61 urban centers analyzed above are outside this band area, containing the combined population of 149,000 or only less than 5.0% of the total urban population in the 61 centers.
The only north-south artery that emerges from the foregoing analysis is the one connecting Acajutla on the Pacific coast through Metapán and Anguiatu in the north on the border with Guatemala. This constitutes a part of an alternative route of the land bridge or dry canal linking El Salvador with ports on the Atlantics coast. Other north-south links are not conspicuous at present. The artery network of El Salvador does not cover the northern area along the border with Honduras.
Source: JICA Study Team.
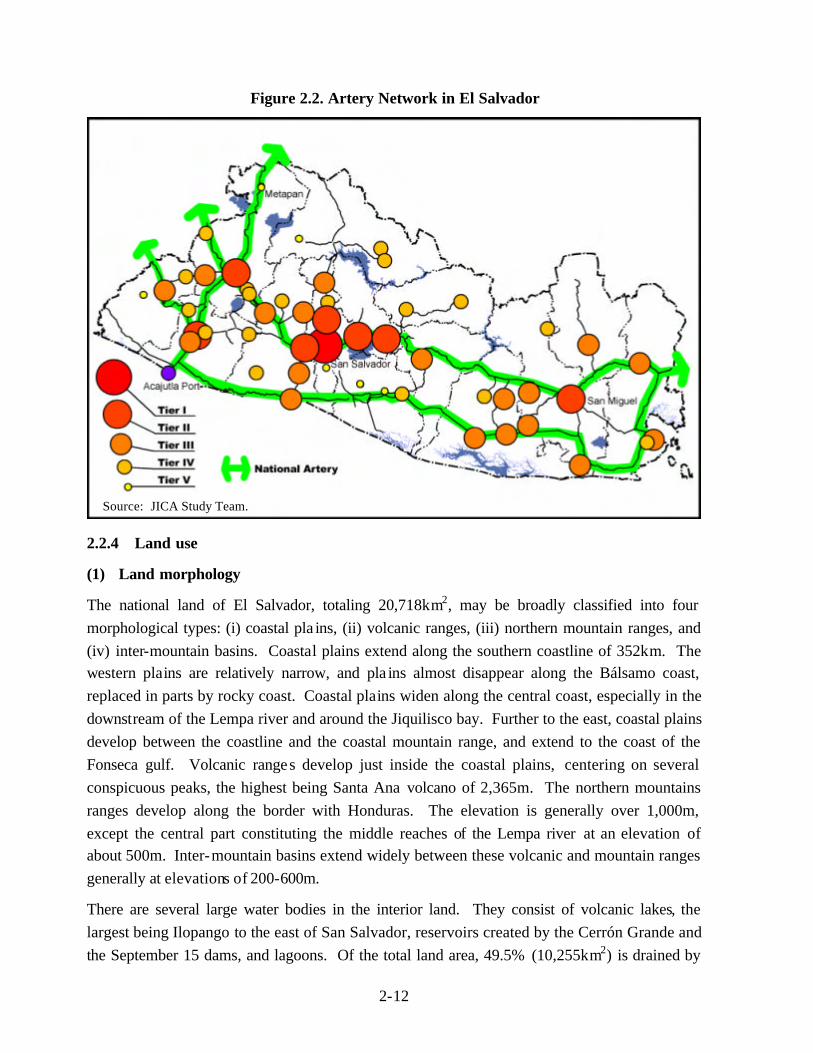
2-12
Figure 2.2. Artery Network in El Salvador
2.2.4 Land use
(1) Land morphology
The national land of El Salvador, totaling 20,718km2, may be broadly classified into four morphological types: (i) coastal pla ins, (ii) volcanic ranges, (iii) northern mountain ranges, and (iv) inter-mountain basins. Coastal plains extend along the southern coastline of 352km. The western plains are relatively narrow, and pla ins almost disappear along the Bálsamo coast, replaced in parts by rocky coast. Coastal plains widen along the central coast, especially in the downstream of the Lempa river and around the Jiquilisco bay. Further to the east, coastal plains develop between the coastline and the coastal mountain range, and extend to the coast of the Fonseca gulf. Volcanic ranges develop just inside the coastal plains, centering on several conspicuous peaks, the highest being Santa Ana volcano of 2,365m. The northern mountains ranges develop along the border with Honduras. The elevation is generally over 1,000m, except the central part constituting the middle reaches of the Lempa river at an elevation of about 500m. Inter-mountain basins extend widely between these volcanic and mountain ranges generally at elevations of 200-600m.
There are several large water bodies in the interior land. They consist of volcanic lakes, the largest being Ilopango to the east of San Salvador, reservoirs created by the Cerrón Grande and the September 15 dams, and lagoons. Of the total land area, 49.5% (10,255km2) is drained by
Source: JICA Study Team.
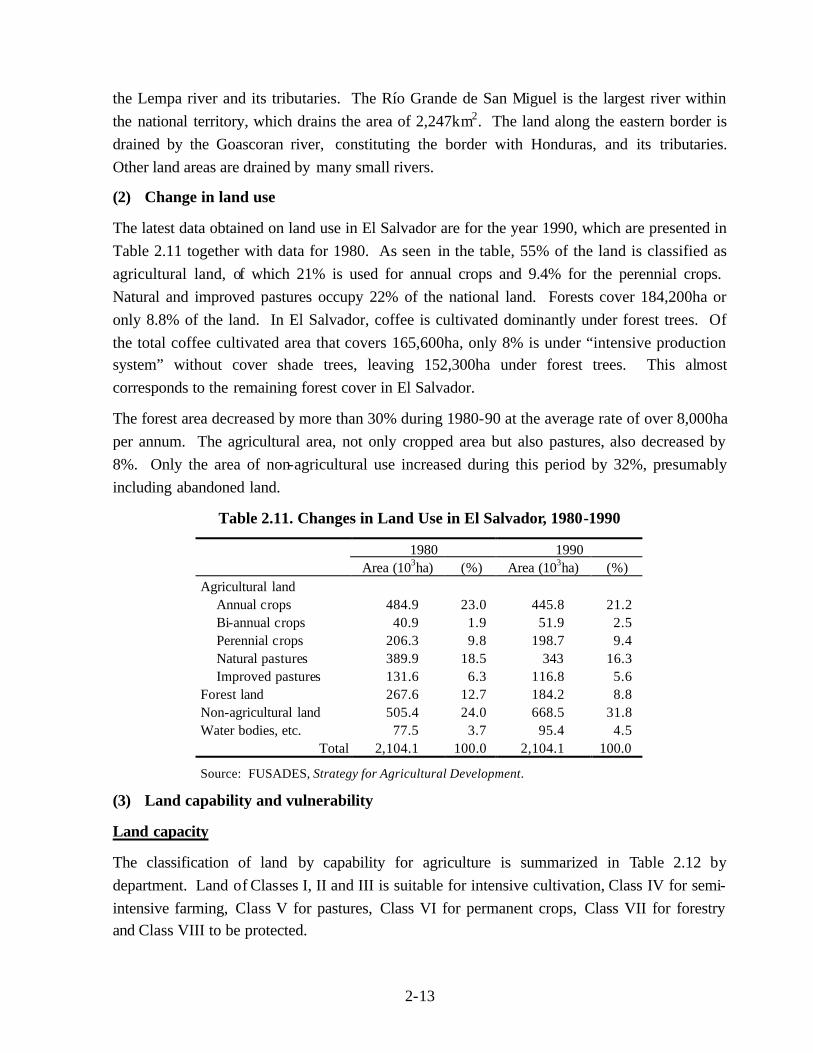
2-13
the Lempa river and its tributaries. The Río Grande de San Miguel is the largest river within the national territory, which drains the area of 2,247km2. The land along the eastern border is drained by the Goascoran river, constituting the border with Honduras, and its tributaries. Other land areas are drained by many small rivers.
(2) Change in land use
The latest data obtained on land use in El Salvador are for the year 1990, which are presented in Table 2.11 together with data for 1980. As seen in the table, 55% of the land is classified as agricultural land, of which 21% is used for annual crops and 9.4% for the perennial crops. Natural and improved pastures occupy 22% of the national land. Forests cover 184,200ha or only 8.8% of the land. In El Salvador, coffee is cultivated dominantly under forest trees. Of the total coffee cultivated area that covers 165,600ha, only 8% is under “intensive production system” without cover shade trees, leaving 152,300ha under forest trees. This almost corresponds to the remaining forest cover in El Salvador.
The forest area decreased by more than 30% during 1980-90 at the average rate of over 8,000ha per annum. The agricultural area, not only cropped area but also pastures, also decreased by 8%. Only the area of non-agricultural use increased during this period by 32%, presumably including abandoned land.
Table 2.11. Changes in Land Use in El Salvador, 1980-1990
1980 1990 Area (103ha) (%) Area (103ha) (%) Agricultural land
Annual crops 484.9 23.0 445.8 21.2 Bi-annual crops 40.9 1.9 51.9 2.5 Perennial crops 206.3 9.8 198.7 9.4 Natural pastures 389.9 18.5 343 16.3 Improved pastures 131.6 6.3 116.8 5.6
Forest land 267.6 12.7 184.2 8.8 Non-agricultural land 505.4 24.0 668.5 31.8 Water bodies, etc. 77.5 3.7 95.4 4.5
Total 2,104.1 100.0 2,104.1 100.0
Source: FUSADES, Strategy for Agricultural Development.
(3) Land capability and vulnerability
Land capacity
The classification of land by capability for agriculture is summarized in Table 2.12 by department. Land of Classes I, II and III is suitable for intensive cultivation, Class IV for semi-intensive farming, Class V for pastures, Class VI for permanent crops, Class VII for forestry and Class VIII to be protected.
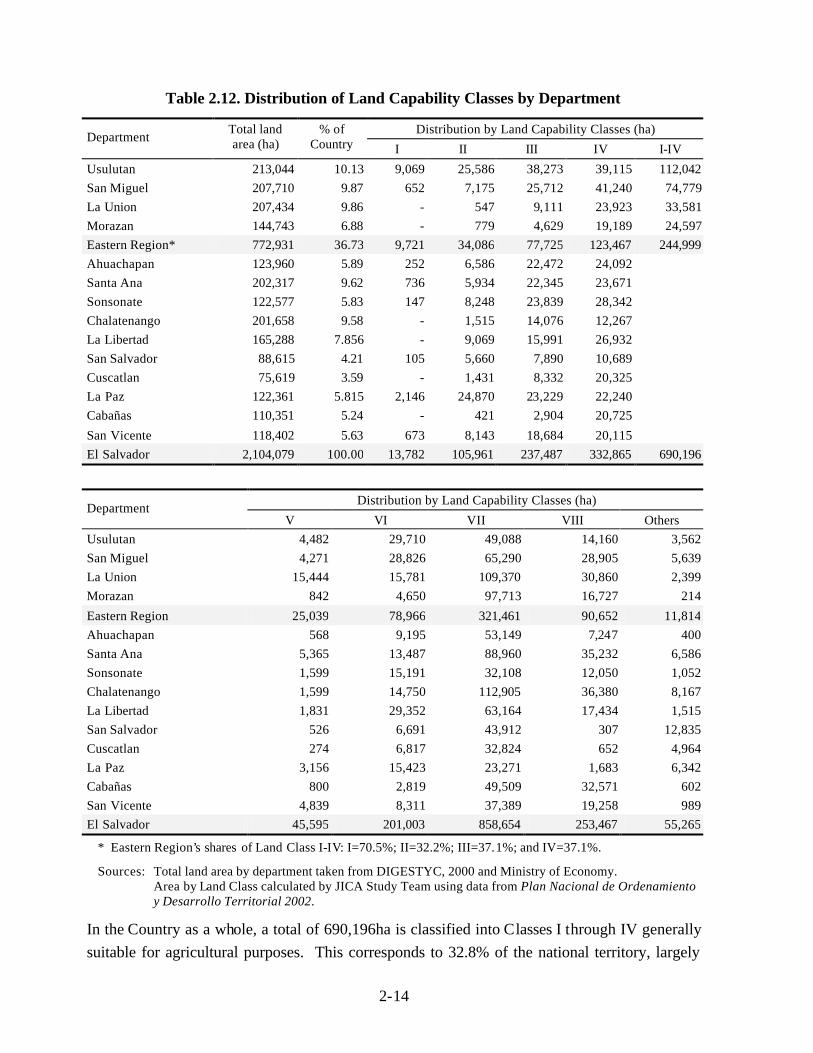
2-14
Table 2.12. Distribution of Land Capability Classes by Department
Distribution by Land Capability Classes (ha) Department Total land area (ha)
% of Country I II III IV I-IV
Usulutan 213,044 10.13 9,069 25,586 38,273 39,115 112,042 San Miguel 207,710 9.87 652 7,175 25,712 41,240 74,779 La Union 207,434 9.86 - 547 9,111 23,923 33,581 Morazan 144,743 6.88 - 779 4,629 19,189 24,597 Eastern Region* 772,931 36.73 9,721 34,086 77,725 123,467 244,999 Ahuachapan 123,960 5.89 252 6,586 22,472 24,092 Santa Ana 202,317 9.62 736 5,934 22,345 23,671 Sonsonate 122,577 5.83 147 8,248 23,839 28,342 Chalatenango 201,658 9.58 - 1,515 14,076 12,267 La Libertad 165,288 7.856 - 9,069 15,991 26,932 San Salvador 88,615 4.21 105 5,660 7,890 10,689 Cuscatlan 75,619 3.59 - 1,431 8,332 20,325 La Paz 122,361 5.815 2,146 24,870 23,229 22,240 Cabañas 110,351 5.24 - 421 2,904 20,725 San Vicente 118,402 5.63 673 8,143 18,684 20,115 El Salvador 2,104,079 100.00 13,782 105,961 237,487 332,865 690,196
Distribution by Land Capability Classes (ha) Department
V VI VII VIII Others Usulutan 4,482 29,710 49,088 14,160 3,562 San Miguel 4,271 28,826 65,290 28,905 5,639 La Union 15,444 15,781 109,370 30,860 2,399 Morazan 842 4,650 97,713 16,727 214 Eastern Region 25,039 78,966 321,461 90,652 11,814 Ahuachapan 568 9,195 53,149 7,247 400 Santa Ana 5,365 13,487 88,960 35,232 6,586 Sonsonate 1,599 15,191 32,108 12,050 1,052 Chalatenango 1,599 14,750 112,905 36,380 8,167 La Libertad 1,831 29,352 63,164 17,434 1,515 San Salvador 526 6,691 43,912 307 12,835 Cuscatlan 274 6,817 32,824 652 4,964 La Paz 3,156 15,423 23,271 1,683 6,342 Cabañas 800 2,819 49,509 32,571 602 San Vicente 4,839 8,311 37,389 19,258 989 El Salvador 45,595 201,003 858,654 253,467 55,265
* Eastern Region’s shares of Land Class I-IV: I=70.5%; II=32.2%; III=37.1%; and IV=37.1%.
Sources: Total land area by department taken from DIGESTYC, 2000 and Ministry of Economy. Area by Land Class calculated by JICA Study Team using data from Plan Nacional de Ordenamiento y Desarrollo Territorial 2002.
In the Country as a whole, a total of 690,196ha is classified into Classes I through IV generally suitable for agricultural purposes. This corresponds to 32.8% of the national territory, largely
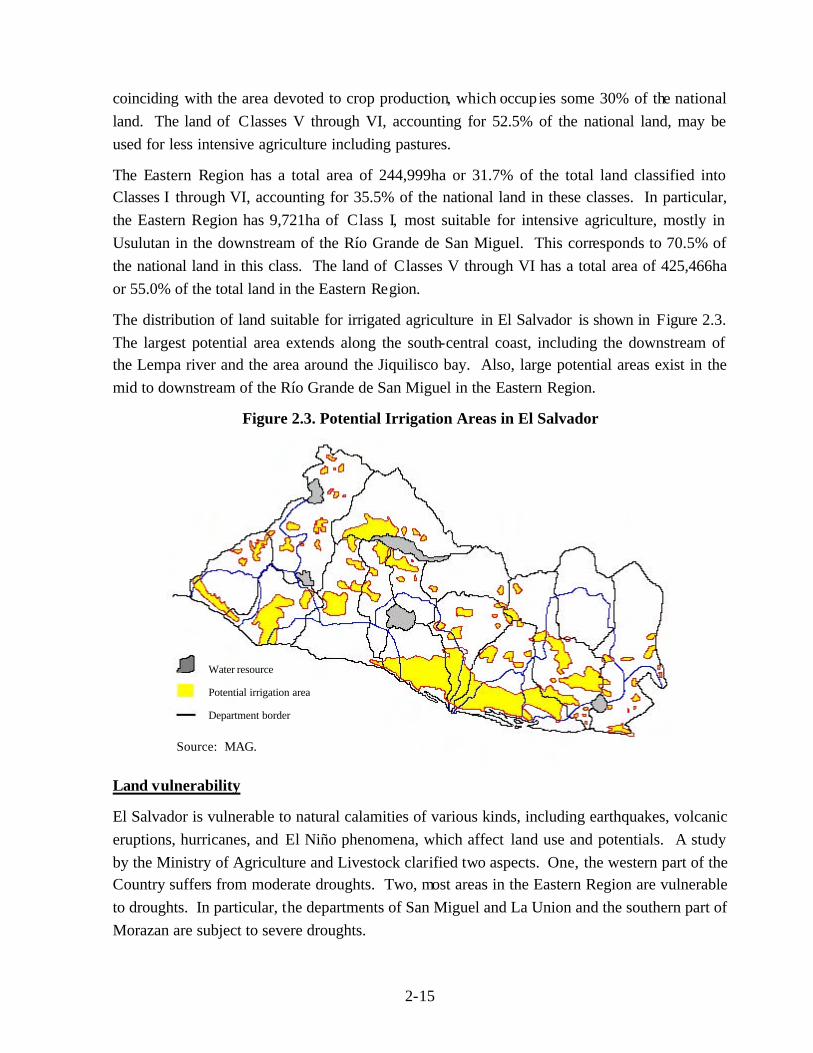
2-15
coinciding with the area devoted to crop production, which occupies some 30% of the national land. The land of Classes V through VI, accounting for 52.5% of the national land, may be used for less intensive agriculture including pastures.
The Eastern Region has a total area of 244,999ha or 31.7% of the total land classified into Classes I through VI, accounting for 35.5% of the national land in these classes. In particular, the Eastern Region has 9,721ha of Class I, most suitable for intensive agriculture, mostly in Usulutan in the downstream of the Río Grande de San Miguel. This corresponds to 70.5% of the national land in this class. The land of Classes V through VI has a total area of 425,466ha or 55.0% of the total land in the Eastern Region.
The distribution of land suitable for irrigated agriculture in El Salvador is shown in Figure 2.3. The largest potential area extends along the south-central coast, including the downstream of the Lempa river and the area around the Jiquilisco bay. Also, large potential areas exist in the mid to downstream of the Río Grande de San Miguel in the Eastern Region.
Figure 2.3. Potential Irrigation Areas in El Salvador
Land vulnerability
El Salvador is vulnerable to natural calamities of various kinds, including earthquakes, volcanic eruptions, hurricanes, and El Niño phenomena, which affect land use and potentials. A study by the Ministry of Agriculture and Livestock clarified two aspects. One, the western part of the Country suffers from moderate droughts. Two, most areas in the Eastern Region are vulnerable to droughts. In particular, the departments of San Miguel and La Union and the southern part of Morazan are subject to severe droughts.
Potential irrigation area
Source: MAG.
Water resource
Department border

2-16
There are also areas in El Salvador that are habitually flooded. These areas are distributed mostly along the coast. A large flood–prone area exists along the middle and lower reaches of Río Grande de San Miguel. A small area in the midstream of the Lempa river is also flood–prone.
3-1
Chapter 3 OBJECTIVES AND STRATEGY FOR ECONOMIC DEVELOPMENT FOCUSING ON
THE EASTERN REGION
3.1 Objectives and Strategy for National Development
(1) Main directions after the civil war
The structural adjustment policy and the economic stabilization program adopted in 1989 aimed to restore macroeconomic stability and establish market-oriented economy (Section 2.1). This basic policy was taken over by successive administrations, and various measures were taken for deregulation of the trade and the financial sectors, tax reform, privatization of state banks and public utilities, and dollarization.
While a sound and stable macroeconomic framework was largely established during the 1990s, the Salvadoran economy faced difficulty in establishing competitiveness in the rapidly globalizing economy. Though increasing overseas remittances helped maintain macroeconomic stability, reliance on them undermined the competitiveness of most domestic commodities, particularly consumer goods. Also, widening disparities between regions and widespread poverty became another focus of the national development as the society recovered from the civil war.
(2) CND initiative
CND was created in May 1997, tasked to fill in various gaps existing and seemingly developing at that time. These gaps, as mentioned already, are represented by the gap between the macroeconomic performance and the microeconomic difficulty, the gap in income levels among different segments of the society, and disparities between regions. Naturally from its beginning, CND has adopted a participatory mechanism in preparing a National Plan that should be broadly supported by all the segments of the society.
The vision for national development articulated by CND encompasses the value that the Nation should pursue in social, economic, institutional and political aspects: 1) social inclusion to overcome poverty, 2) self-reliance, 3) society of law, 4) competitive economy, 5) borderless society, 6) rational environmental idea, and 7) family value (CND, Building a National Plan for El Salvador, May 1997-April 2002, 2003). These are in line with the consistent development strategy of the Government with four pillars: (i) poverty reduction through investment in human capital, (ii) strengthening economic competitiveness under free trade and open economy policy, (iii) improving public services and judicial systems, and (iv) ensuring environmental sustainability.
Under the vision, CND identified priorities along the lines of principal preoccupations of people: unemployment, social exclusion and marginalization. Initial actions of the National Plan identified three structural development axes: regional development and decentralization,
3-2
restructuring of productive base, and Central American integration. Continued CND efforts with extensive consultation with various groups of people resulted in specific proposals for five geographic areas in the Country constituting “Territorial Actions”. Unfortunately, the earthquakes in 2001 forced the reconsideration of priorities for national development. A Strategy for Development, published after the earthquakes, reconfirmed the territorial focus. A takeoff strategy was set out for the Eastern Region as it was planned to establish a new port in La Union, which would contribute to strengthening the competitiveness of the Salvadoran economy.
3.2 Position of the Eastern Region
3.2.1 Comparative analysis
The position of the Eastern Region in El Salvador is clarified in relation to other parts of the Country. For this comparative analysis, other regions are defined here in an expedient way broadly in line with the National Plan. That is, the definition of the regions in the National Plan is made to adapt to departmental boundaries in such a way that the entire territory of El Salvador is covered as shown in Table 3.1. This definition does not in any way mean to interfere or suggest an alternative to the ongoing efforts to redefine the administrative division of the Country. Basic data on the regions thus defined are summarized in Table 3.2, based on the data on the main departments constituting each region.
The position of the Eastern Region in relation to other regions by basic socio-economic indices is summarized below.
Eastern Region’s position Other regions Land area largest 2nd largest in the Western region Population 3rd largest largest in the SSMR, followed by the Western region Population density 2nd lowest lowest in the Lempa northern region Population increase 2nd lowest lowest in the Lempa northern region Economic population lowest ratio followed by the South-central (Comalapa) and Lempa
northern regions Household income 2nd lowest lowest in the Western region Poverty incidence highest followed by the Lempa northern and Western regions Dependence on remittances highest 2nd highest in the Lempa northern region
Source: Table 3.2.
As seen from the table above, the Eastern Region, and the Lempa northern region are the two least developed regions in El Salvador. Both are livestock regions in the Country. The Eastern Region appears to be less developed in terms of economic indices, but poverty depth is not as significant as in the Lempa northern region and even two other regions (i.e., Western and South-central), presumably reflecting its inherently favorable natural conditions with extensive lowland of good soil conditions.
3-3
Table 3.1. Expedient Definition of Regions for Comparative Analysis
Region in the National Plan Adopted region for diagnosis Main departments Related departments Volcano region Western region Ahuachapán, Santa Ana,
Sonsonate
Bálsamo mountain region Bálsamo (La Libertad) region
La Libertad Sonsonate, San Salvador
Comalapa south-central region
South-central (Comalapa) region
La Paz, San Vicente Cuscatlán, La Libertad, Usulutan
San Salvador metropolitan region
San Salvador metropolitan region
San Salvador La Libertad
Lempa northern region Lempa northern region Chalatenango, Cuscatlán, Cabañas
Santa Ana
Fonseca gulf region Eastern Region Usulutan, San Miguel, Morazan, La Union
Source: Defined by the JICA Study Team only for the comparative analysis; no implications to new administrative division intended.
Table 3.2. Basic Data on Six Adopted Regions of El Salvador, 2000
Western Bálsamo South- central SSMR Lempa
northern Eastern El Salvador
Land area (km2) 4,489 1,653 2,408 886 3,876 7,394 20,718 Number of municipalities 41 22 35 19 58 87 262 Total population 1,320,616 680,247 452,998 1,984,690 552,374 1,281,428 6,272,353 Population density (/km2) 294 411 188 2,240 143 173 298 Working age pop. (% over age 10) 74.5 724 74.3 77.9 73.9 76.1 76.2 Economic pop. (% of working age pop.) 51.7 53.1 50.9 55.4 51.1 47.7 52.2 Unemployment (%) 7.1 5.2 6.6 5.4 5.4 6.0 5.8 Population increase 92-00 (% p.a.) 2.55 3.57 1.92 3.46 1.40 1.59 2.57 Gross birth rate 1998 (/103) 27.0/32.0 27.6 29.6/31.2 23.5 29.6/32.5 27.4/32.3 Gross death rate 1998 (/103) 5.9/6.3 5.9 6.5/7.3 5.5 6.3/7.3 6.1/7.1 Infant death rate 1998 (/103) 27.9/39.0 31.6 32.5/40.9 26.2 36.0/40.9 29.7/42.8 Life expectancy (yrs): Male
Female 63.3/68.1 68.2/73.7
67.1 72.8
63.7/64.4 69.4/71.5
68.5 74.0
62.5/65.6 67.7/72.4
63.4/66.5 68.0/73.0
Household income (¢/mo) 2,646 4,856 2,706 4,981 2,726 2,655 3,690 Absolute poverty (%) 22.4 10.6 19.5 7.6 24.0 18.2 16.0 Poverty incidence (%) 48.2 26.9 47.2 26.5 49.0 49.7 38.8 Remittance receiving families (%) 16.5 15.1 19.7 16.2 22.9 30.2 19.7 Average remittance received (¢/mo) 1,023 969 938 1,101 998 1,103 1,057 Maize cultivated area (ha) 54,743 19,050 28,788 14,730 33,653 111,327 262,292 Maize production (t) 135,718 52,127 73,191 40,264 83,104 198,564 582,967 Maize yield (t/ha) 2.48 2.74 2.54 2.73 2.47 1.78 2.22 Cattle population 156,450 70,500 126,500 13,350 211,500 471,700 1,050,000 Swine population (family owned) 28,791 18,934 27,747 210 33,252 77,513 186,447
Source: The same as Table 1.1.
The Eastern Region and the Western region are comparable in terms of population, household income and poverty incidence. However, the Eastern Region is clearly less developed with much smaller shares of manufacturing, commercial and services establishments and employment than the Western region, except for services employment as shown below. The larger share of services employment in the Eastern Region may be due to its comparatively
3-4
larger government services.
Shares of Establishments and Employment per Sector in the National Total, 1997 (Unit: %)
Establishments Employment Manufacturing Commercial Services Manufacturing Commercial Services Eastern Region 15.7 17.7 16.6 4.8 15.2 13.2 Western region 19.5 24.7 18.3 7.3 17.2 11.6
Source: DGEC, Anuario Estadístico 1999.
Some characteristics of the Eastern Region may also be seen from its shares of the national total in various aspects summarized in Table 3.3. The Eastern Region depends comparatively more on overseas remittance since its shares in the number of households receiving remittances and the total amount of remittances in the Region are much larger. The total household income is only 14.5% of the total in the Country. The share of the Eastern Region in maize cultivated area is 42.4 %, much larger than would its share of land claim. The cattle population in the Region accounts for 44.9 % of the total in the Country. The Region’s share in coffee area is significant, but the share in high elevation coffee area is much smaller, presumably due to the relatively late introduction of this crop to the Region.
Table 3.3. Shares of the Eastern Region in Selected Aspects, 2000
Aspect Eastern Region Eastern Region’s share (%) Land area 7,394km2 35.7 Population 1,281,428 20.4 Household income ¢770 million/mo. 14.5 Households receiving remittance 87,491 30.8 Total remittance ¢96.5 million/mo. 32.2 Maize cultivated area 111,327ha 42.4 Maize production 198,564t 34.1 Cattle population 471,700 44.9 Coffee area 31,002ha 19.1 High elevation coffee area 2,402ha 9.6 Criminal activities registered (2000-May 2003) 174,920 18.3
Sources: The same as Table 1.1, except coffee data from PROCAFE and crime data by PNC.
3.2.2 Important characteristics
(1) Livestock region
The Eastern Region is a livestock region. It accounts for over 40% respectively of the cattle population and the area cultivated with maize, which is dominantly domestic maize cultivated as a feed crop. Main production areas are the southern area along lower reaches of Río Grande in San Miguel and part of Usulutan and the northern area centering on Morazan. In the southern area, the high input-high yield mode of cattle production is well established. Large cattle farmers cultivate forage in grazing land to make it effectively managed pasture, and
3-5
combine with supplemental feeding in sheds for high productivity. The breed is well improved. The use of feed concentrates and silage is common, and there is no shortage of feed or water. The farmers suffer, however, from competition with Honduran and Nicaraguan cheese. Inundation of pasture by flooding of Río Grande is another constraint.
Livestock farmers in the northern area face shortages of water and feed. Grazing in grassland rather than managed pasture is more common, and silage production has just started in some areas. They experience dry spells even during the rainy season. In addition to the competition with cheese from Honduras and Nicaragua, reliance on middlemen for marketing is another constraint.
(2) Largely neglected and low productivity crop production
The Eastern Region has most extensive lowland areas potentially suitable for crop production, e.g., 70.5% of the national land in Class I (Subsection 2.2.4). Most lands are suitable for production of upland crops and various fruits, including slopelands in the northern area. Highlands in the north with cool climate are suitable for vegetable production. These potentials, however, are not well developed and people in the Region consume increasing amount of agricultural products imported from Honduras and Nicaragua. Maize is produced dominantly as feed grains together with sorghum and in low yields. Sugarcane is practically the only commercial crop cultivated in sizable area. Fruit trees are largely neglected presumably due to the lack of market and shortages of manpower resulting from the outmigration. Some lowland areas are subject to habitual flooding, hindering any productive use of the land other than grazing.
For promoting fruit production, a key may be specialization in a few selected fruits based on land suitability and market opportunities. Fruit trees on the northern slopes would serve effectively for productive reforestation. To produce the selected fruits in marketable quantity and quality, farmer organizing would be a pre-requisite together with extension and training.
Promotion of vegetable production in the northern highlands is subject to the development of urban market within the region. With this respect, vegetable production in the northern part of La Union seems to be quite promising as the La Union city is expected to develop rapidly as the port is revitalized. Organic vegetable production may be pursued to appeal to health-conscious international communities there. Sugarcane is suited to climatic conditions in the region, and its expansion is conditional on land suitability and full utilization of processing opportunities including production of high quality feed, liquor and energy from molasses.
(3) Rich but underutilized water resources
Other than the Lempa northern region, the Eastern Region is the only region drained by a sizable river, Río Grande de San Miguel. Water resources in Río Grande, however, are not properly managed and used. Forest degradation aggravates habitual flooding in the lower basin,
3-6
and dry spells occur in the upper basin even during the rainy season. Irrigation is very limited throughout the basin. Hydropower development of a sizable scale is found to be infeasible due to the topography. Degrading quality of river water is another concern. Municipalities constituting the Río Grande basin are planning to take a step to dispose solid waste and to treat sewage properly through joint efforts.
A basin-wide approach is indispensable to deal with both the quality and the quantity problems in the Río Grande basin. On-going efforts by the municipal association are commendable. The Olomega lagoon should be taken as an integral part of the Río Grande river system.
Irrigation development in the basin is to be pursued in the form of supplemental irrigation to bridge dry spells during the rainy season and to extend cropping season by a few months at most rather than irrigating crops in the middle of the dry season. At present, some farmers in more favorable downstream areas produce second crops effectively by utilizing residual soil moisture at the beginning of the dry season. Supplemental irrigation, large and small, may use various water sources, including small reservoirs and ponds, springs and groundwater.
(4) Organizational strength
People in the Eastern Region appear to be more organized, presumably reflecting the solidarity during the civil war. This is an advantage to be utilized for the development. Ongoing initiatives of municipal associations and other organized movements will ensure the viability of the participatory development. The organizational strength is present also among entrepreneurs in San Miguel and Santa Rosa de Lima and livestock farmers in San Miguel. This will help ensure equal partnership with foreign investors for any joint venture arrangement.
Small supplemental irrigation schemes may be constructed, operated and maintained by organized farmers. Naturally, proper farmer organizing is a prerequisite to water allocation and on-farm water management. The viability of such arrangements is manifested for instance by the irrigators’ association in Hacienda Nueva, Usulután. Organized farmers may undertake joint procurement of agricultural input and joint marketing of their products. This may prove to be an effective way to establish specialty products even for export.
The organizational strength may extend to overseas Salvadorans as well. At present, the Eastern Region depends most heavily on remittance from them. While the remittance tends to be used mostly for consumptive purposes, cases of overseas Salvadorans and returnees contributing to investments are not rare either. A few examples are a touristic/experimental farm in Monteca, a hotel in Meanguera, and road improvement in Olomega. New mechanism may be introduced to increase the portion of overseas remittance used for investments rather than consumption.
3-7
(5) Environmental concerns and tourism
The Eastern Region has most diversified environmental resources, ranging from volcanic mountains to coastal areas and islands, from part of the Central America biological corridor to coastal wetlands including the Jiquilisco bay area and the Jocotal lagoon, and from highland with cool climate to hot and humid lowland. Protection and enhancement of these resources and their effective use for production activities are essential for sustainable development of the Eastern Region. Concerns of local people and municipalities on these aspects are reflected, among others, in municipal associations for joint treatment of solid wastes and organized activities to promote tourism in different areas of the region.
For proper solid waste management, sanitary landfill is the state-of-art that should be applied in the Eastern Region as well, as a matter of principle. Separation of wastes of different kinds at source is also common in most developed and some developing countries, but proper levels of separation vary depending on local conditions. At least, separation of non-biodegradable wastes should be established as a norm, and hospital wastes should be separately treated in any case. Enhancement of people’s awareness is an important component of any solid waste management program.
Tourism in the Eastern Region may be pursued with the concept of alternative tourism rather than mass tourism. Eco-tourism, agro-eco-tourism and rural tourism as conceived by various tourism promoters are in the right direction. A next step would be to develop tourism products, with brands if possible, in the form of tourism circuits, combining different tourism objects. These are mainly for domestic tourism. For international tourism, cruise industry may develop along the Pacific coast of Central America with the revitalized La Union port as a base, although stops within El Salvador may be limited such as the Jiquilisco bay in the Eastern Region.
(6) Key infrastructure to link with other regions
The Eastern Region has not benefited much from links with other regions, and the lack of key infrastructure is a factor for this poor communications. This situation was aggravated by physical and political separation during the civil war. The Western region has the port of Acajutla, and the Bálsamo (La Libertad) region benefits from its location along the main route linking the port and the SSMR. The three central regions, Bálsamo, South-central (Comalapa) and the SSMR, and Cuscatlán benefit from their proximity to the capital. One specific example is the prevalence of hybrid maize. The South-central region has the international airport.
The revitalization of the La Union port and the northern longitudinal road will change this situation in a drastic way. To make such changes to benefit the local people the most and realize the sustainable development of the Eastern Region as a whole, its spatial structure needs to be strengthened. This would include selective strengthening of urban functions as indicated,
3-8
full rehabilitation of the Pan American highway, and enhancement of land productivity through proper management of water and land resources and land use rationalization.
These physical changes need to be supported by institutional arrangements to allow effective planning, implementation and management of spatial development. The ongoing administrative reform with municipal associations as micro-regions should be pursued along this line, together with enhanced people’s participation built into it. Especially for the La Union port and its hinterland a new institutional mechanism may be introduced to allow people’s participation in development management.
3.3 Objectives and Strategy for the Eastern Region Development
3.3.1 Problem structure
The existing conditions in the Eastern Region have been analyzed by sector during the first fieldwork. The position and characteristics of the Eastern Region have been clarified as summarized in the previous section. Some positive characteristics of the Eastern Region are noted in relation to other regions. Still, the Eastern Region faces various problems, which combined would work as constraints to the regional development.
Many of these problems are interrelated to cause undesirable phenomena observed. A problem structure analysis is a method to clarify these interrelationships in a macroscopic way. The analysis, usually undertaken during the initial stage of the planning, would allow a broad perspective without getting into details to identify more essential factors and major problems to be alleviated through planned development efforts. The analysis is used here to define development objectives and basic strategy for the Eastern Region development.
A problem structure analysis has been conducted for the Eastern Region, and the results are shown in Figure 3.1. In the figure, more important problem factors and phenomena are shown, expressed in generic terms to imply many specific problems in different sectors. The figure also shows only main interrelationships among them.
As shown in Figure 3.1, many problems are rooted in the comparative neglect by past administrations and aftereffects of the civil war. Maldistribution of water resources in both time and space is another inherent problem that the Eastern Region faces. The other two problems are more institutional than physical: inadequate land and water resources development and management, and weak local administration and finance.
(1) Major problem phenomena
In Figure 3.1, major problem phenomena of the economic, social and environment sectors in the Eastern Region are identified. The main problem of the economic sector is summarized as the weak economic structure causing widespread poverty and unemployment, and the resultant outmigration and manpower shortages, as well as the over dependence on overseas remittance
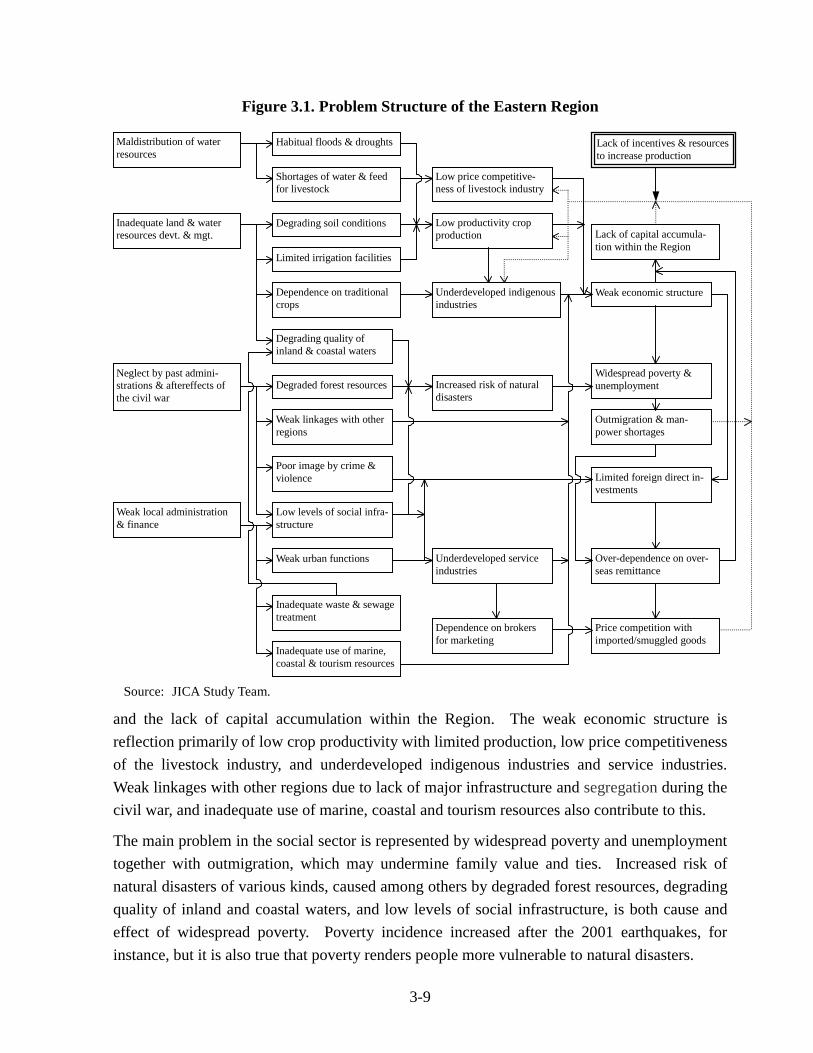
3-9
Figure 3.1. Problem Structure of the Eastern Region
Source: JICA Study Team.
and the lack of capital accumulation within the Region. The weak economic structure is reflection primarily of low crop productivity with limited production, low price competitiveness of the livestock industry, and underdeveloped indigenous industries and service industries. Weak linkages with other regions due to lack of major infrastructure and segregation during the civil war, and inadequate use of marine, coastal and tourism resources also contribute to this.
The main problem in the social sector is represented by widespread poverty and unemployment together with outmigration, which may undermine family value and ties. Increased risk of natural disasters of various kinds, caused among others by degraded forest resources, degrading quality of inland and coastal waters, and low levels of social infrastructure, is both cause and effect of widespread poverty. Poverty incidence increased after the 2001 earthquakes, for instance, but it is also true that poverty renders people more vulnerable to natural disasters.
Maldistribution of water resources
Inadequate land & water resources devt. & mgt.
Neglect by past admini-strations & aftereffects of the civil war
Weak local administration & finance
Habitual floods & droughts
Shortages of water & feed for livestock
Degrading soil conditions
Limited irrigation facilities
Dependence on traditional crops
Degrading quality of inland & coastal waters
Degraded forest resources
Weak linkages with other regions
Poor image by crime & violence
Low levels of social infra-structure
Weak urban functions
Inadequate waste & sewage treatment
Inadequate use of marine, coastal & tourism resources
Low price competitive-ness of livestock industry
Low productivity crop production
Underdeveloped indigenous industries
Increased risk of natural disasters
Underdeveloped service industries
Dependence on brokers for marketing
Lack of incentives & resources to increase production
Lack of capital accumula-tion within the Region
Weak economic structure
Widespread poverty & unemployment
Outmigration & man-power shortages
Limited foreign direct in-vestments
Over-dependence on over-seas remittance
Price competition with imported/smuggled goods
3-10
The main problem in the environment sector is expressed as the degrading environmental quality represented by reduction in soil fertility, degraded forest resources, water quality problems, and inadequate wastes and sewage treatment. As seen in Figure 3.1, these problems are identified in relatively lower tiers of the problem structure compared to economic and social problem phenomena.
As shown in Figure 3.1, the weak economic structure causes both the widespread poverty and unemployment, resulting in outmigration and manpower shortages, and the lack of capital accumulation within the Region. These problems, in turn, become factors causing the low price competitiveness of the livestock industry, low productivity crop production and underdeveloped indigenous industries to create a “vicious cycle” linking back to the weak economic structure. This vicious cycle tends to be sustained without intervention since the local people are deprived of incentives and resources to increase production, as indicated in Figure 3.1.
(2) Fundamental problem factors
As seen in Figure 3.1, four fundamental problems are identified. Of these, maldistribution of water resources is an inherent problem, which may be overcome by solving other problems; inadequate land and water resources development and management are the real problem. The neglect by the past administrations and aftereffects of the civil war typically show in insufficient provision of basic infrastructure. This situation not only deprives the local people of adequate provision of basic social services but also has far reaching effects through undermining the locational conditions of the Eastern Region for industrial development and investment attraction. Improving these conditions is the main theme of the Eastern Region development. To realize this, another fundamental problem of weak local administration and finance needs to be addressed as well.
Therefore, three fundamental problem factors have been identified, which should be the main subjects for planned development efforts. These are (i) the inadequate land and water resources development and management, (ii) the insufficient provision of basic infrastructure and services, and (iii) the weak local administration and finance.
3.3.2 Opportunities to be seized
While the Eastern Region faces a complex multiplicity of problems as analyzed above, new opportunities are also emerging, which may affect the Eastern Region development. They are mainly due to the establishment of the La Union port, forthcoming conclusion of the CAFTA with the U.S., and the promotion of the PPP. Conditions to seize these opportunities guide the establishment of development objectives and basic strategy for the Eastern Region development. Specific opportunities to evolve are suggested in Section 7.3.
The establishment of the La Union port would expand opportunities for new import and export related economic activities as well as those directly related to the port operation. They include
3-11
various export-processing, indigenous resources-based activities oriented for export, processing and distribution of imported goods and materials, and related service activities such as logistic services.
The CAFTA with the U.S. would affect comparative advantages of various economic activities and products existing in El Salvador and the Eastern Region. It may also induce new economic activities including those to be transferred from other areas of Central America. While the CAFTA may increase export of some Salvadoran products to the U.S. (e.g., those for overseas Salvadorans), production of vegetables, fruits and dairy products may be negatively affected unless their productivity and quality are improved.
The PPP would improve trans-territorial infrastructures, such as highways, power and telecommunications, and also integrate various institutions among Central American countries. In either way, transaction costs between these countries would be reduced, facilitating the establishment of comparative advantages of these countries, respectively.
To take advantage of these opportunities for the Eastern Region development, the resources capacity in the Region needs to be greatly enhanced, encompassing human resources as well as land and water resources. The CAFTA would affect the competitiveness of agro-products most significantly. To ensure the competitiveness of agro-products produced in the Eastern Region after the CAFTA, the land and water resources capacity needs to be enhanced through proper management and human resources trained and equipped with new skills.
Also, the spatial structure should be strengthened to take full advantage of the La Union port by upgrading related transport infrastructures and other terminal facilities for active economic interactions within the Region and with other regions and neighboring countries. The PPP initiative should be effectively utilized to improve and upgrade key inter-territorial infrastructures.
3.3.3 Regional development objectives
The objectives for the Eastern Region development are defined addressing to the major problem phenomena identified above in the economic, social and environment sectors. The main economic problem has been identified as the weak economic structure due to low productivity crop production, livestock with low competitiveness, underdeveloped indigenous industries, inadequate use of marine, coastal and tourism resources, and weak linkages with other regions. The main social problem has been identified as the widespread poverty and unemployment together with outmigration. The main environmental problem has been identified as the degrading environmental quality, particularly of water and related land regime.
Three objectives corresponding to these economic, social and environment problems, respectively, are defined as follows.
3-12
(1) To strengthen the regional economic structure through enhancing agricultural productivity for price competitiveness, establishing competitive industries, and promoting service linkages with stronger urban functions;
(2) To alleviate poverty and reduce unemployment through human and institutional development that will allow utilization of emerging opportunities associated with the La Union port revitalization; and
(3) To restore and enhance the environmental quality and resource capacity to support indigenous industries, to reduce vulnerability to natural disasters, and to enhance amenity for local people and visitors.
3.3.4 Basic strategy for the Eastern Region development
The basic strategy for the regional development indicates general directions commonly pursued for development efforts in different sectors and areas. It may be established effectively by addressing to more fundamental problem factors that are at the root of many specific problems, while effectively utilizing the emerging opportunities presented by the La Union port, the CAFTA with the U.S. and the PPP. The three fundamental problem factors in the Eastern Region identified in Subsection 3.3.1 are: (i) inadequate land and water resources development and management, (ii) insufficient provision of basic infrastructure and services, and (iii) weak local administration and finance.
Corresponding to these fundamental problem factors, the basic strategy for the Eastern Region development may be established with the following components:
1) Land and water resources development and management particularly of the Río Grande de San Miguel and the upper catchment areas in the north,
2) Spatial structure strengthening with the establishment of key infrastructure facilities capitalizing on the La Union port, selective strengthening of urban functions, and rationalization of land use, and
3) Human and institutional development based on local government strengthening and people organizing and participation.
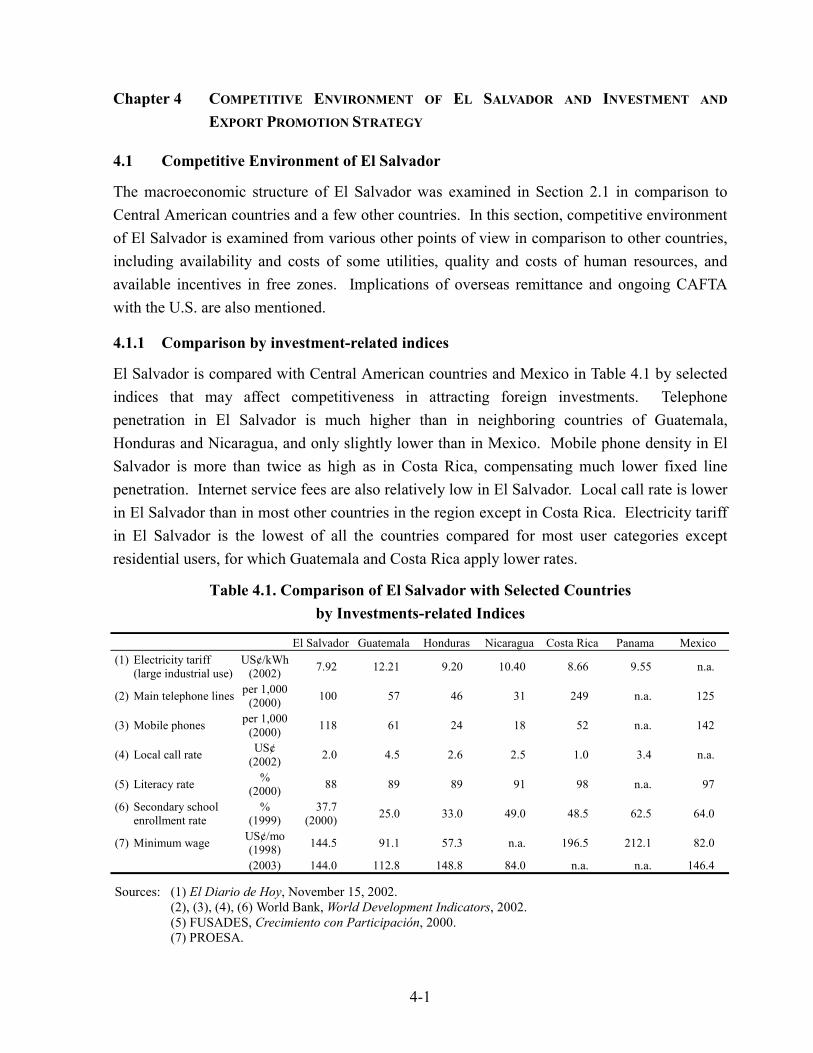
4-1
Chapter 4 COMPETITIVE ENVIRONMENT OF EL SALVADOR AND INVESTMENT AND
EXPORT PROMOTION STRATEGY
4.1 Competitive Environment of El Salvador
The macroeconomic structure of El Salvador was examined in Section 2.1 in comparison to Central American countries and a few other countries. In this section, competitive environment of El Salvador is examined from various other points of view in comparison to other countries, including availability and costs of some utilities, quality and costs of human resources, and available incentives in free zones. Implications of overseas remittance and ongoing CAFTA with the U.S. are also mentioned.
4.1.1 Comparison by investment-related indices
El Salvador is compared with Central American countries and Mexico in Table 4.1 by selected indices that may affect competitiveness in attracting foreign investments. Telephone penetration in El Salvador is much higher than in neighboring countries of Guatemala, Honduras and Nicaragua, and only slightly lower than in Mexico. Mobile phone density in El Salvador is more than twice as high as in Costa Rica, compensating much lower fixed line penetration. Internet service fees are also relatively low in El Salvador. Local call rate is lower in El Salvador than in most other countries in the region except in Costa Rica. Electricity tariff in El Salvador is the lowest of all the countries compared for most user categories except residential users, for which Guatemala and Costa Rica apply lower rates.
Table 4.1. Comparison of El Salvador with Selected Countries by Investments-related Indices
El Salvador Guatemala Honduras Nicaragua Costa Rica Panama Mexico (1) Electricity tariff
(large industrial use) US¢/kWh
(2002) 7.92 12.21 9.20 10.40 8.66 9.55 n.a.
(2) Main telephone lines per 1,000 (2000) 100 57 46 31 249 n.a. 125
(3) Mobile phones per 1,000 (2000) 118 61 24 18 52 n.a. 142
(4) Local call rate US¢ (2002) 2.0 4.5 2.6 2.5 1.0 3.4 n.a.
(5) Literacy rate % (2000) 88 89 89 91 98 n.a. 97
(6) Secondary school enrollment rate
% (1999)
37.7 (2000) 25.0 33.0 49.0 48.5 62.5 64.0
(7) Minimum wage US¢/mo (1998) 144.5 91.1 57.3 n.a. 196.5 212.1 82.0
(2003) 144.0 112.8 148.8 84.0 n.a. n.a. 146.4
Sources: (1) El Diario de Hoy, November 15, 2002. (2), (3), (4), (6) World Bank, World Development Indicators, 2002. (5) FUSADES, Crecimiento con Participación, 2000. (7) PROESA.
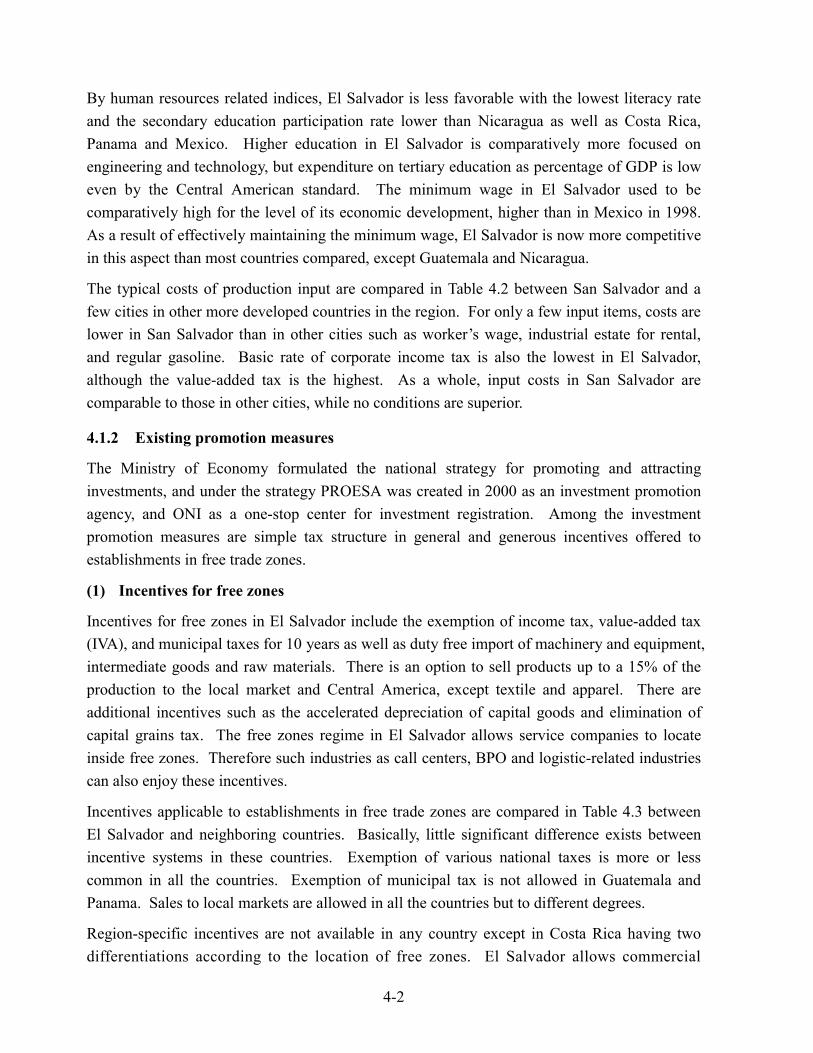
4-2
By human resources related indices, El Salvador is less favorable with the lowest literacy rate and the secondary education participation rate lower than Nicaragua as well as Costa Rica, Panama and Mexico. Higher education in El Salvador is comparatively more focused on engineering and technology, but expenditure on tertiary education as percentage of GDP is low even by the Central American standard. The minimum wage in El Salvador used to be comparatively high for the level of its economic development, higher than in Mexico in 1998. As a result of effectively maintaining the minimum wage, El Salvador is now more competitive in this aspect than most countries compared, except Guatemala and Nicaragua.
The typical costs of production input are compared in Table 4.2 between San Salvador and a few cities in other more developed countries in the region. For only a few input items, costs are lower in San Salvador than in other cities such as worker’s wage, industrial estate for rental, and regular gasoline. Basic rate of corporate income tax is also the lowest in El Salvador, although the value-added tax is the highest. As a whole, input costs in San Salvador are comparable to those in other cities, while no conditions are superior.
4.1.2 Existing promotion measures
The Ministry of Economy formulated the national strategy for promoting and attracting investments, and under the strategy PROESA was created in 2000 as an investment promotion agency, and ONI as a one-stop center for investment registration. Among the investment promotion measures are simple tax structure in general and generous incentives offered to establishments in free trade zones.
(1) Incentives for free zones
Incentives for free zones in El Salvador include the exemption of income tax, value-added tax (IVA), and municipal taxes for 10 years as well as duty free import of machinery and equipment, intermediate goods and raw materials. There is an option to sell products up to a 15% of the production to the local market and Central America, except textile and apparel. There are additional incentives such as the accelerated depreciation of capital goods and elimination of capital grains tax. The free zones regime in El Salvador allows service companies to locate inside free zones. Therefore such industries as call centers, BPO and logistic-related industries can also enjoy these incentives.
Incentives applicable to establishments in free trade zones are compared in Table 4.3 between El Salvador and neighboring countries. Basically, little significant difference exists between incentive systems in these countries. Exemption of various national taxes is more or less common in all the countries. Exemption of municipal tax is not allowed in Guatemala and Panama. Sales to local markets are allowed in all the countries but to different degrees.
Region-specific incentives are not available in any country except in Costa Rica having two differentiations according to the location of free zones. El Salvador allows commercial
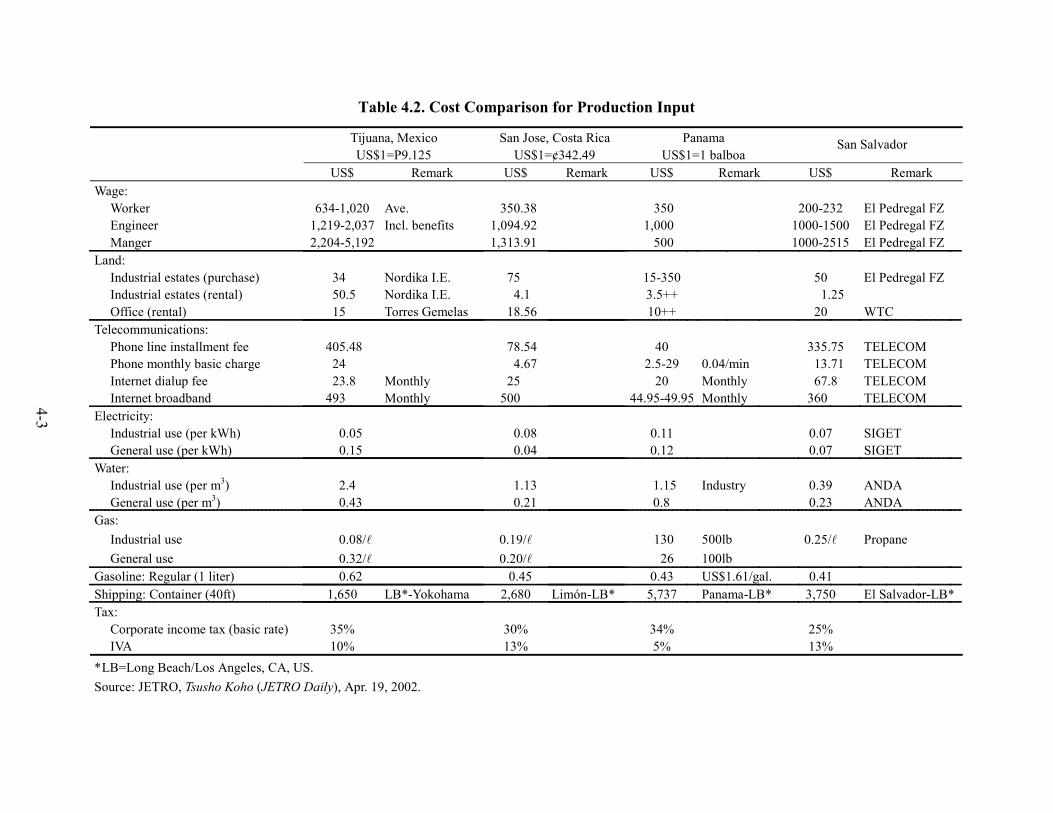
4-3
Table 4.2. Cost Comparison for Production Input
Tijuana, Mexico San Jose, Costa Rica Panama US$1=P9.125 US$1=¢342.49 US$1=1 balboa
San Salvador
US$ Remark US$ Remark US$ Remark US$ Remark Wage:
Worker 634-1,020 Ave. 350.38 350 200-232 El Pedregal FZ Engineer 1,219-2,037 Incl. benefits 1,094.92 1,000 1000-1500 El Pedregal FZ Manger 2,204-5,192 1,313.91 500 1000-2515 El Pedregal FZ
Land: Industrial estates (purchase) 34 Nordika I.E. 75 15-350 50 El Pedregal FZ Industrial estates (rental) 50.5 Nordika I.E. 4.1 3.5++ 1.25 Office (rental) 15 Torres Gemelas 18.56 10++ 20 WTC
Telecommunications: Phone line installment fee 405.48 78.54 40 335.75 TELECOM Phone monthly basic charge 24 4.67 2.5-29 0.04/min 13.71 TELECOM Internet dialup fee 23.8 Monthly 25 20 Monthly 67.8 TELECOM Internet broadband 493 Monthly 500 44.95-49.95 Monthly 360 TELECOM
Electricity: Industrial use (per kWh) 0.05 0.08 0.11 0.07 SIGET General use (per kWh) 0.15 0.04 0.12 0.07 SIGET
Water: Industrial use (per m3) 2.4 1.13 1.15 Industry 0.39 ANDA General use (per m3) 0.43 0.21 0.8 0.23 ANDA
Gas: Industrial use 0.08/l 0.19/l 130 500lb 0.25/l Propane General use 0.32/l 0.20/l 26 100lb
Gasoline: Regular (1 liter) 0.62 0.45 0.43 US$1.61/gal. 0.41 Shipping: Container (40ft) 1,650 LB*-Yokohama 2,680 Limón-LB* 5,737 Panama-LB* 3,750 El Salvador-LB* Tax:
Corporate income tax (basic rate) 35% 30% 34% 25% IVA 10% 13% 5% 13%
* LB=Long Beach/Los Angeles, CA, US. Source: JETRO, Tsusho Koho (JETRO Daily), Apr. 19, 2002.
4-3
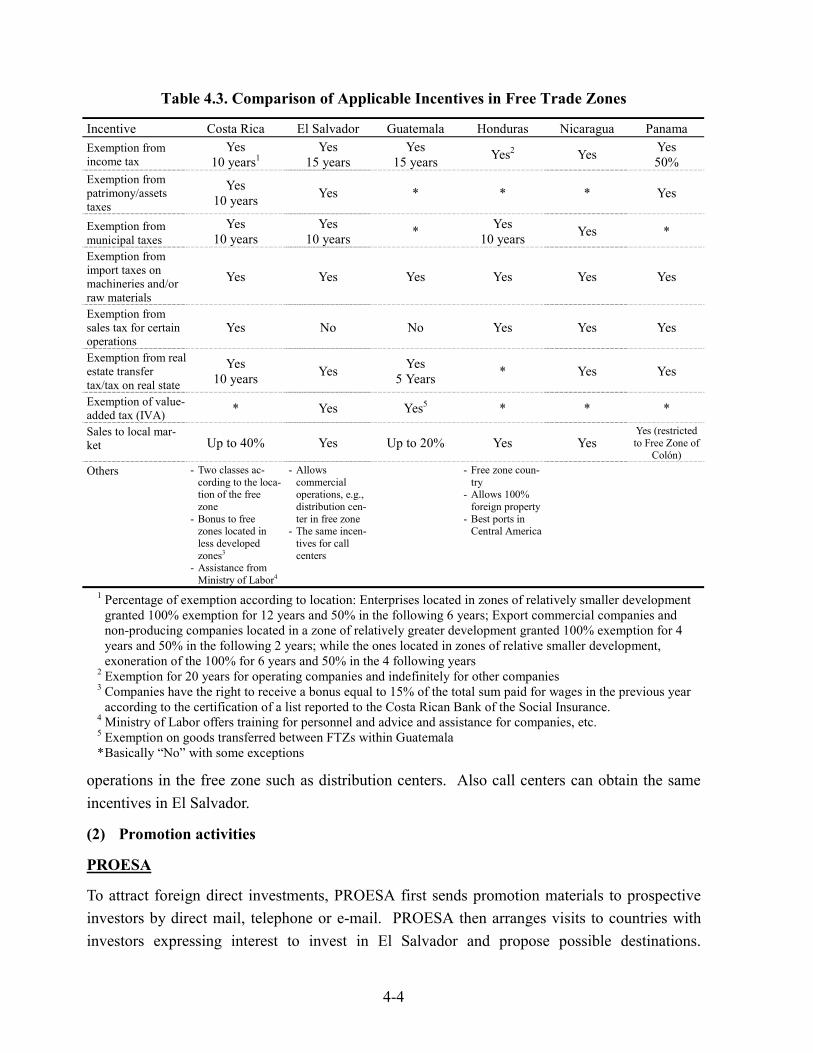
4-4
Table 4.3. Comparison of Applicable Incentives in Free Trade Zones
Incentive Costa Rica El Salvador Guatemala Honduras Nicaragua Panama Exemption from income tax
Yes 10 years1
Yes 15 years
Yes 15 years Yes2 Yes Yes
50% Exemption from patrimony/assets taxes
Yes 10 years Yes * * * Yes
Exemption from municipal taxes
Yes 10 years
Yes 10 years * Yes
10 years Yes *
Exemption from import taxes on machineries and/or raw materials
Yes Yes Yes Yes Yes Yes
Exemption from sales tax for certain operations
Yes No No Yes Yes Yes
Exemption from real estate transfer tax/tax on real state
Yes 10 years Yes Yes
5 Years * Yes Yes
Exemption of value-added tax (IVA) * Yes Yes5 * * *
Sales to local mar-ket Up to 40% Yes Up to 20% Yes Yes
Yes (restricted to Free Zone of
Colón) Others - Two classes ac-
cording to the loca-tion of the free zone
- Bonus to free zones located in less developed zones3
- Assistance from Ministry of Labor4
- Allows commercial operations, e.g., distribution cen-ter in free zone
- The same incen-tives for call centers
- Free zone coun-try
- Allows 100% foreign property
- Best ports in Central America
1 Percentage of exemption according to location: Enterprises located in zones of relatively smaller development granted 100% exemption for 12 years and 50% in the following 6 years; Export commercial companies and non-producing companies located in a zone of relatively greater development granted 100% exemption for 4 years and 50% in the following 2 years; while the ones located in zones of relative smaller development, exoneration of the 100% for 6 years and 50% in the 4 following years
2 Exemption for 20 years for operating companies and indefinitely for other companies 3 Companies have the right to receive a bonus equal to 15% of the total sum paid for wages in the previous year
according to the certification of a list reported to the Costa Rican Bank of the Social Insurance. 4 Ministry of Labor offers training for personnel and advice and assistance for companies, etc. 5 Exemption on goods transferred between FTZs within Guatemala * Basically “No” with some exceptions
operations in the free zone such as distribution centers. Also call centers can obtain the same incentives in El Salvador.
(2) Promotion activities
PROESA
To attract foreign direct investments, PROESA first sends promotion materials to prospective investors by direct mail, telephone or e-mail. PROESA then arranges visits to countries with investors expressing interest to invest in El Salvador and propose possible destinations.
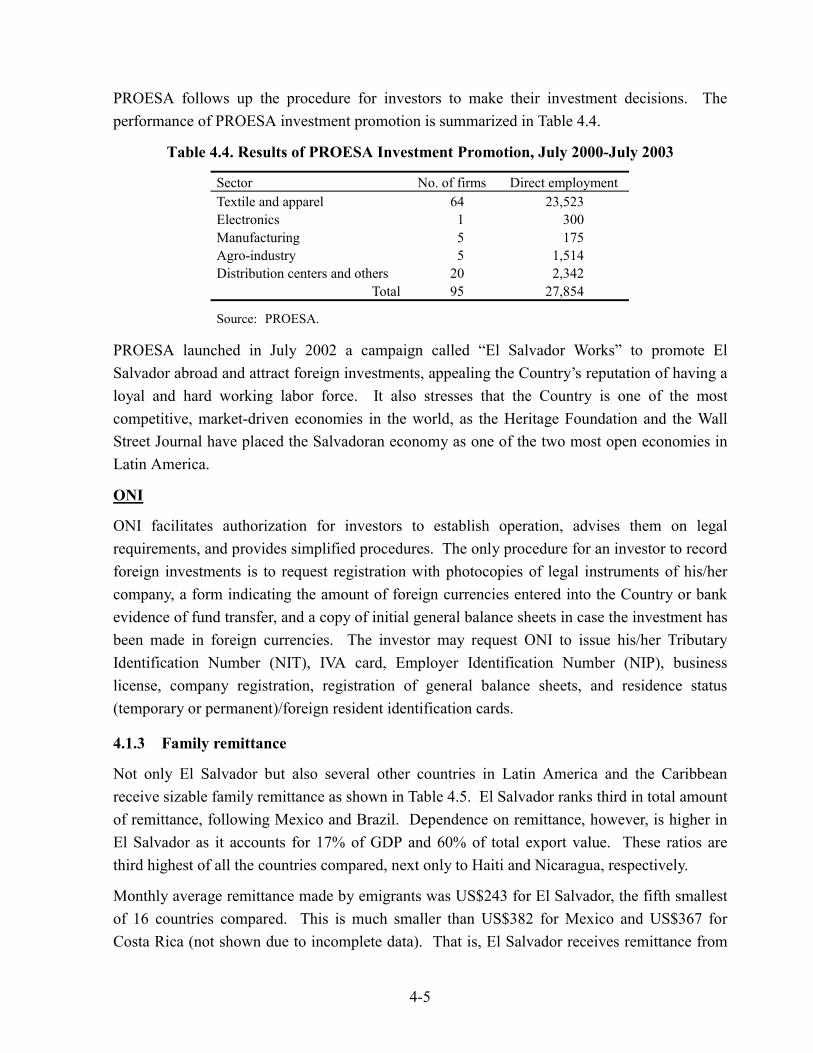
4-5
PROESA follows up the procedure for investors to make their investment decisions. The performance of PROESA investment promotion is summarized in Table 4.4.
Table 4.4. Results of PROESA Investment Promotion, July 2000-July 2003
Sector No. of firms Direct employment Textile and apparel 64 23,523 Electronics 1 300 Manufacturing 5 175 Agro-industry 5 1,514 Distribution centers and others 20 2,342
Total 95 27,854
Source: PROESA.
PROESA launched in July 2002 a campaign called “El Salvador Works” to promote El Salvador abroad and attract foreign investments, appealing the Country’s reputation of having a loyal and hard working labor force. It also stresses that the Country is one of the most competitive, market-driven economies in the world, as the Heritage Foundation and the Wall Street Journal have placed the Salvadoran economy as one of the two most open economies in Latin America.
ONI
ONI facilitates authorization for investors to establish operation, advises them on legal requirements, and provides simplified procedures. The only procedure for an investor to record foreign investments is to request registration with photocopies of legal instruments of his/her company, a form indicating the amount of foreign currencies entered into the Country or bank evidence of fund transfer, and a copy of initial general balance sheets in case the investment has been made in foreign currencies. The investor may request ONI to issue his/her Tributary Identification Number (NIT), IVA card, Employer Identification Number (NIP), business license, company registration, registration of general balance sheets, and residence status (temporary or permanent)/foreign resident identification cards.
4.1.3 Family remittance
Not only El Salvador but also several other countries in Latin America and the Caribbean receive sizable family remittance as shown in Table 4.5. El Salvador ranks third in total amount of remittance, following Mexico and Brazil. Dependence on remittance, however, is higher in El Salvador as it accounts for 17% of GDP and 60% of total export value. These ratios are third highest of all the countries compared, next only to Haiti and Nicaragua, respectively.
Monthly average remittance made by emigrants was US$243 for El Salvador, the fifth smallest of 16 countries compared. This is much smaller than US$382 for Mexico and US$367 for Costa Rica (not shown due to incomplete data). That is, El Salvador receives remittance from
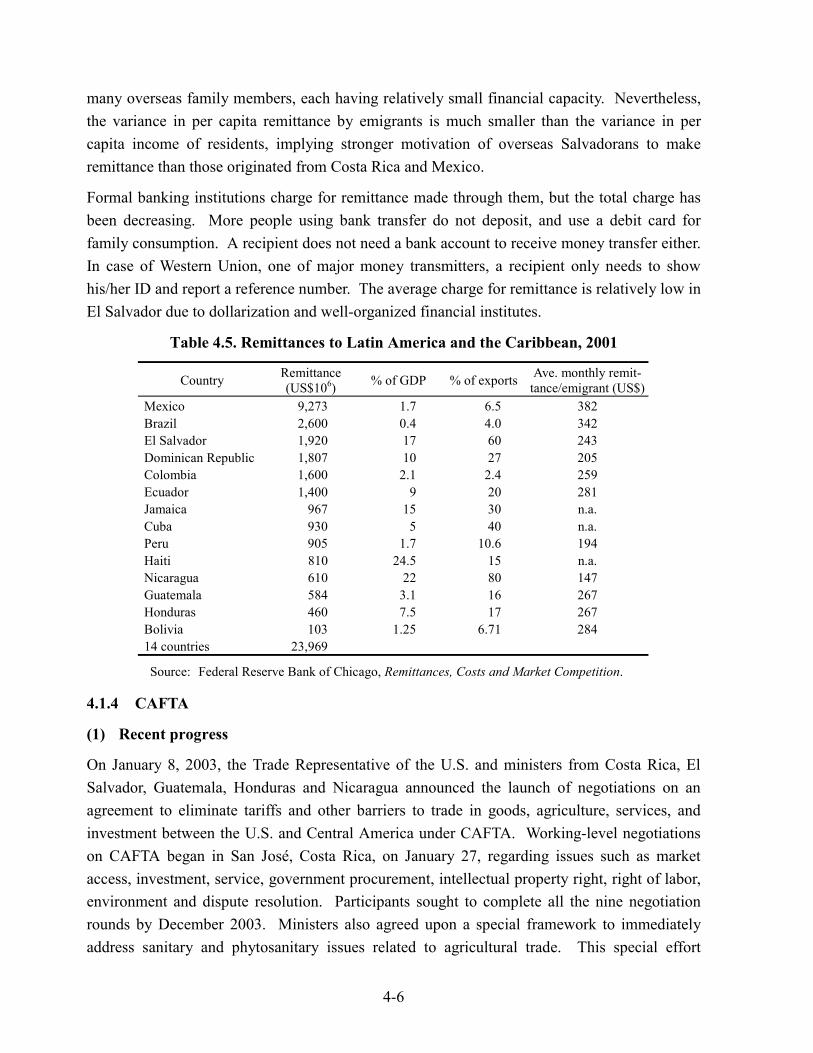
4-6
many overseas family members, each having relatively small financial capacity. Nevertheless, the variance in per capita remittance by emigrants is much smaller than the variance in per capita income of residents, implying stronger motivation of overseas Salvadorans to make remittance than those originated from Costa Rica and Mexico.
Formal banking institutions charge for remittance made through them, but the total charge has been decreasing. More people using bank transfer do not deposit, and use a debit card for family consumption. A recipient does not need a bank account to receive money transfer either. In case of Western Union, one of major money transmitters, a recipient only needs to show his/her ID and report a reference number. The average charge for remittance is relatively low in El Salvador due to dollarization and well-organized financial institutes.
Table 4.5. Remittances to Latin America and the Caribbean, 2001
Country Remittance (US$106) % of GDP % of exports Ave. monthly remit-
tance/emigrant (US$) Mexico 9,273 1.7 6.5 382 Brazil 2,600 0.4 4.0 342 El Salvador 1,920 17 60 243 Dominican Republic 1,807 10 27 205 Colombia 1,600 2.1 2.4 259 Ecuador 1,400 9 20 281 Jamaica 967 15 30 n.a. Cuba 930 5 40 n.a. Peru 905 1.7 10.6 194 Haiti 810 24.5 15 n.a. Nicaragua 610 22 80 147 Guatemala 584 3.1 16 267 Honduras 460 7.5 17 267 Bolivia 103 1.25 6.71 284 14 countries 23,969
Source: Federal Reserve Bank of Chicago, Remittances, Costs and Market Competition.
4.1.4 CAFTA
(1) Recent progress
On January 8, 2003, the Trade Representative of the U.S. and ministers from Costa Rica, El Salvador, Guatemala, Honduras and Nicaragua announced the launch of negotiations on an agreement to eliminate tariffs and other barriers to trade in goods, agriculture, services, and investment between the U.S. and Central America under CAFTA. Working-level negotiations on CAFTA began in San José, Costa Rica, on January 27, regarding issues such as market access, investment, service, government procurement, intellectual property right, right of labor, environment and dispute resolution. Participants sought to complete all the nine negotiation rounds by December 2003. Ministers also agreed upon a special framework to immediately address sanitary and phytosanitary issues related to agricultural trade. This special effort
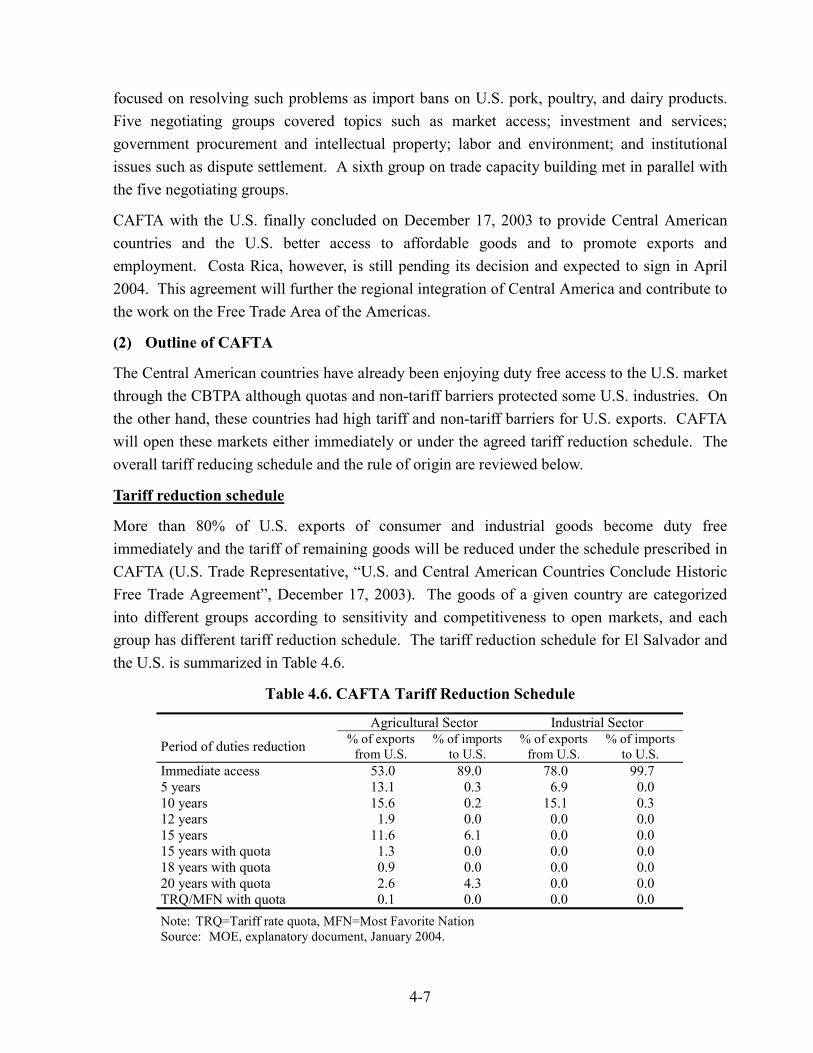
4-7
focused on resolving such problems as import bans on U.S. pork, poultry, and dairy products. Five negotiating groups covered topics such as market access; investment and services; government procurement and intellectual property; labor and environment; and institutional issues such as dispute settlement. A sixth group on trade capacity building met in parallel with the five negotiating groups.
CAFTA with the U.S. finally concluded on December 17, 2003 to provide Central American countries and the U.S. better access to affordable goods and to promote exports and employment. Costa Rica, however, is still pending its decision and expected to sign in April 2004. This agreement will further the regional integration of Central America and contribute to the work on the Free Trade Area of the Americas.
(2) Outline of CAFTA
The Central American countries have already been enjoying duty free access to the U.S. market through the CBTPA although quotas and non-tariff barriers protected some U.S. industries. On the other hand, these countries had high tariff and non-tariff barriers for U.S. exports. CAFTA will open these markets either immediately or under the agreed tariff reduction schedule. The overall tariff reducing schedule and the rule of origin are reviewed below.
Tariff reduction schedule
More than 80% of U.S. exports of consumer and industrial goods become duty free immediately and the tariff of remaining goods will be reduced under the schedule prescribed in CAFTA (U.S. Trade Representative, “U.S. and Central American Countries Conclude Historic Free Trade Agreement”, December 17, 2003). The goods of a given country are categorized into different groups according to sensitivity and competitiveness to open markets, and each group has different tariff reduction schedule. The tariff reduction schedule for El Salvador and the U.S. is summarized in Table 4.6.
Table 4.6. CAFTA Tariff Reduction Schedule
Agricultural Sector Industrial Sector
Period of duties reduction % of exports from U.S.
% of imports to U.S.
% of exports from U.S.
% of imports to U.S.
Immediate access 53.0 89.0 78.0 99.7 5 years 13.1 0.3 6.9 0.0 10 years 15.6 0.2 15.1 0.3 12 years 1.9 0.0 0.0 0.0 15 years 11.6 6.1 0.0 0.0 15 years with quota 1.3 0.0 0.0 0.0 18 years with quota 0.9 0.0 0.0 0.0 20 years with quota 2.6 4.3 0.0 0.0 TRQ/MFN with quota 0.1 0.0 0.0 0.0 Note: TRQ=Tariff rate quota, MFN=Most Favorite Nation Source: MOE, explanatory document, January 2004.
4-8
Mainly agro-products are granted longer tariff reduction periods (over 10 years). Also, if domestic agro-industries in any participating country suffer significant damage from rapid increase in imports from other participating countries, the country is entitled to impose safeguard measures on the imports during the tariff reduction period. El Salvador can impose the safeguard measures on poultry, cheese, butter, milk powder, ice cream, liquid dairy and other dairy products, pork, rough rice, milled rice, beans, sorghum, vegetable oil, canned meat, and high fructose corn syrup.
Rule of origin
Goods obtained or produced entirely in the CAFTA participating countries apply to tariff free trade. Non-originating materials used in the production of goods with applicable changes in the tariff classification defined in the CAFTA or goods that satisfy any applicable regional value content or other requirements may also be considered as CAFTA originating goods.
Certain percentage of regional content value is required for some goods to be treated as CAFTA originating goods. This rule applies mainly to goods assembled from many parts. Simple methods have been adopted to calculate the regional content value. The good that does not undergo a change in tariff classification may still be considered as CAFTA originating, provided that the value of raw materials and parts originated in an area outside the CAFTA countries accounts for less than 10% of the adjusted value of the good (cf. the “de minimis” rule).
(3) Expected macro impact
CAFTA is expected to contribute to free trade, investment promotion and economic reform in Central America. The case of Mexico under NAFTA as a precursor may be indicative of macro impact of CAFTA on Central America. Foreign direct investment (FDI) in Mexico increased from the annual average of US$3.6 billion during 1986-93 to US$8.9 billion during 1994-2000. The average export value increased from US$93 billion in the former to US$192 billion in the latter period. Based on this NAFTA impact on Mexico, trade and investments in Central America are projected to increase at 7.8% and 4.1% per annum, respectively. Consequently, the per capita GDP of the region is expected to increase at 3.6% per annum.
Another subtle effect of CAFTA on Central America may be improvement of images of Central American countries from civil war torn, natural disaster stricken countries to open and viable economies. Through CAFTA discussions on intellectual property right, labor issues and environmental concerns, sense of more equal partnership may develop between Central America and the U.S.
From NAFTA experiences, the following advantages are expected of CAFTA: 1) increase of export competitiveness by reduced tariffs, 2) decrease in import costs,
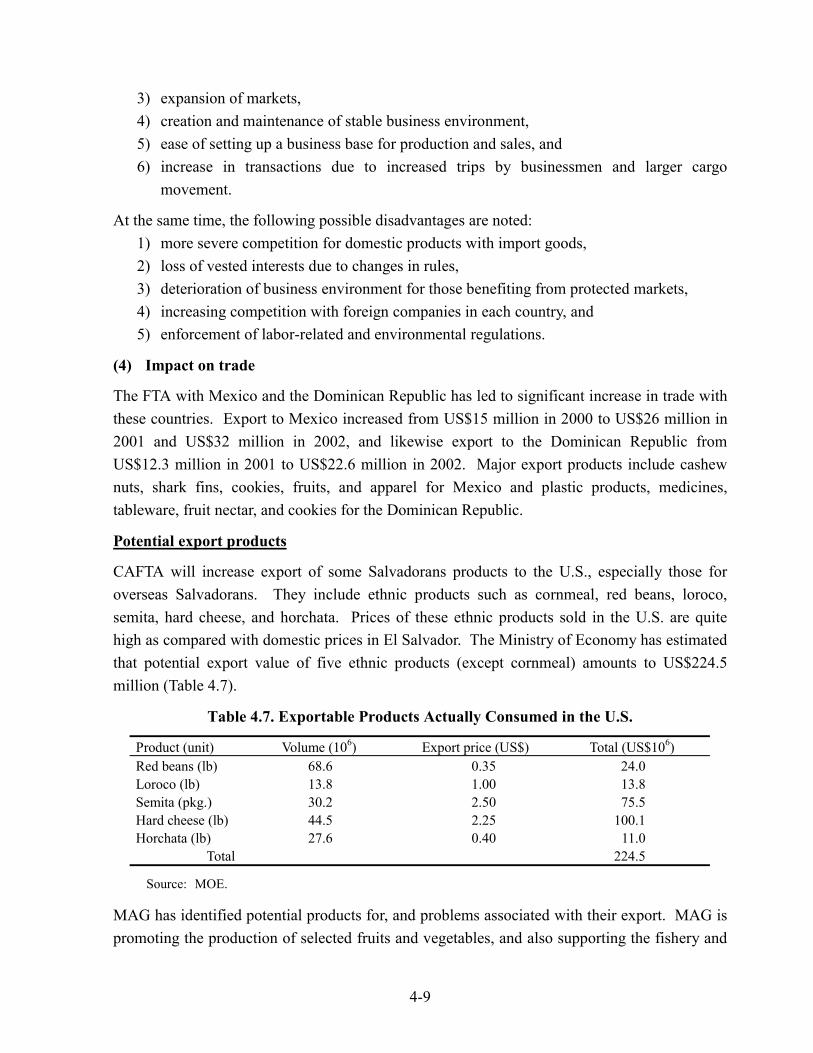
4-9
3) expansion of markets, 4) creation and maintenance of stable business environment, 5) ease of setting up a business base for production and sales, and 6) increase in transactions due to increased trips by businessmen and larger cargo
movement.
At the same time, the following possible disadvantages are noted: 1) more severe competition for domestic products with import goods, 2) loss of vested interests due to changes in rules, 3) deterioration of business environment for those benefiting from protected markets, 4) increasing competition with foreign companies in each country, and 5) enforcement of labor-related and environmental regulations.
(4) Impact on trade
The FTA with Mexico and the Dominican Republic has led to significant increase in trade with these countries. Export to Mexico increased from US$15 million in 2000 to US$26 million in 2001 and US$32 million in 2002, and likewise export to the Dominican Republic from US$12.3 million in 2001 to US$22.6 million in 2002. Major export products include cashew nuts, shark fins, cookies, fruits, and apparel for Mexico and plastic products, medicines, tableware, fruit nectar, and cookies for the Dominican Republic.
Potential export products
CAFTA will increase export of some Salvadorans products to the U.S., especially those for overseas Salvadorans. They include ethnic products such as cornmeal, red beans, loroco, semita, hard cheese, and horchata. Prices of these ethnic products sold in the U.S. are quite high as compared with domestic prices in El Salvador. The Ministry of Economy has estimated that potential export value of five ethnic products (except cornmeal) amounts to US$224.5 million (Table 4.7).
Table 4.7. Exportable Products Actually Consumed in the U.S.
Product (unit) Volume (106) Export price (US$) Total (US$106) Red beans (lb) 68.6 0.35 24.0 Loroco (lb) 13.8 1.00 13.8 Semita (pkg.) 30.2 2.50 75.5 Hard cheese (lb) 44.5 2.25 100.1 Horchata (lb) 27.6 0.40 11.0
Total 224.5
Source: MOE.
MAG has identified potential products for, and problems associated with their export. MAG is promoting the production of selected fruits and vegetables, and also supporting the fishery and
4-10
livestock sectors to meet requirements of the market.
(5) Impact on industrial goods
Practically all the industrial products exported to the U.S. will enjoy no tariff immediately with only 0.27% of products having no trade records in the past three years subject to tax reduction up to 10 years. This is expansion of the benefits by the CBI, which allows only duty preferences. The products that will be granted these benefits include: tuna canned in oil, jewel cases, textile and apparel products, shoes, jewelry, fishing hooks, shovels, hoes, packaging materials, iron and steel products, etc.
On the other hand, 78% of industrial goods imported from the U.S. to El Salvador will have an immediate tax cut. This represents 77% of the industrial goods trade, of which 90% already enjoys free trade with the Most Favored Nation import duty. The remaining products will undergo the tax relief over 5-10 years, according to the sensitivity of the products to free trade. To protect some of them during such periods, non-linier tax cut will apply to reduce the impact during the initial years.
(6) Impact on agricultural goods
Of agricultural products, 89% will enjoy duty free access to the U.S. market, which represents 95% of the Salvadoran trade towards the U.S. The products subject to this category are: natural honey, fruit juice (e.g., peach, apple and pear), sodas, beer, ethnic beverages (e.g., horchata, cebada and fresco de chan) and ethnic products (e.g., sesame, hard and soft cheeses, semitas, quesadillas, tamales, and pupusas), and spices. In addition, fruits and vegetables (e.g., papayas, jacamas and loroco), flowers, and ornamental plants, which benefited from the CBI, may have permanent duty free access to the U.S. market.
The sugar quota for the U.S. market has been increased by 24,000MT immediately, and will increase every year up to 63,040MT in 2019. It should be noted that sweets and other products containing over 65% of sugar (in weight), packaged for retail sales, are subject to neither the quota nor import duties.
The U.S. government agreed to set up a representative office of the Animal and Plant Health Inspection Service (APHIS) in El Salvador, responsible for directly inspecting the sanitary conditions of both plants and animals to be exported to the U.S. A main characteristic of the CAFTA with the U.S., as compared to WTO mandates, is that sensitive agricultural products are put through transition periods and its special agricultural safeguards. According to the explanatory document issued by MOE in January 2004, those sensitive products that are protected include the following.
- Poultry: Tax cut for 18 years with a 10-year grace period without tax cut. An agricultural safeguard can be implemented during the tax cut period. For the inner parts of chicken, which are more sensitive to external conditions, tax relief at the rate of 164.4% begins as
4-11
duty compliance to WTO consolidates.
- Dairy products: Tax break for 20 years with a 10-year grace period. The application of a special agricultural safeguard will be guaranteed while the tax relief is in effect.
- Rice: A non-linear tax break for 18 years with a 10-year grace period.
- White maize: Tax free access has been agreed only for a yearly increasing quota.
- Yellow maize: A non-linear tax break for 15 years has been agreed.
- Pork: A non-linear 15-year tax break has been agreed. The application of a special agricultural safeguard has been ensured for the tax relief period.
For coffee, a rigid origin rule has been agreed upon, which demands the use of coffee produced in the participating countries for the benefits of the treaty. Only coffee cultivated in Central America or the U.S. will be entitled to free trade. Likewise processed coffee products must be made of such coffee to enjoy the benefits of the treaty.
(7) Impact on textiles and apparel
CAFTA has given greater flexibility to the textile and apparel industry by improving the preference level of the CBI. MOE expects more investment, technological enhancement and increase in export, thereby generating more employment opportunities. MOE summarizes the positive effects of CAFTA on the sector as follows.
- CAFTA will improve the preferences of the CBI as any garment processed in the Central American countries using regional fabrics and threads will immediately enter the U.S. free of duties.
- CAFTA’s specific rule of origin allows, in most cases, importing fibers (raw material) to produce threads, fabrics and garments. This will expand the textile industry’s business opportunities.
- CAFTA permits exporting cut and processed products made of fabrics from the U.S. and threads from anywhere in the world. The duty to be charged will only be based on the added value in El Salvador.
- CAFTA permits procuring materials including flat knit fabrics from Mexico and Canada. By CAFTA, products made of such materials are considered to be goods originated in the CAFTA countries. The initial limit on materials to be imported is 100 million m2 of fabric. This limit may increase by 100 million m2 in 2004 through the bonus for increasing acquisitions of threads and fabrics from the U.S. In the future, the amount of materials that can be imported may increase by 200 million m2 every year without limit.
- CAFTA’s broad list of low supply for fabrics and threads not produced in sufficient amounts both in the U.S. and Central America offers the opportunity to procure such products considered to be of low supply from anywhere in the world, process and export to the U.S.
4-12
without paying duties on final garments.
(8) Impact on the services sector
The impact of CAFTA on the services sector would be large as most small and medium enterprises (SMEs) operate service-oriented business. In order for them to benefit from CAFTA, entrepreneurs would need to link with export, packaging and transport services. For distribution industries, El Salvador has already been open to foreign investors. FTAs with other countries not as open as El Salvador would attract such industries to locate in El Salvador.
4.1.5 Security conditions in El Salvador and the Eastern Region
As part of the Study, a survey on public safety in El Salvador focusing on the Eastern Region has been conducted, combining a review of the existing data and study reports, a questionnaire survey with over 800 samples, and three focus groups’ discussion. The main results are summarized.
According to the data of the National Civil Police (PNC), the number of criminal activities in El Salvador has been declining for the past few years: from 61,546 in 2000, 53,110 in 2001 and 44,595 in 2002, to 15,669 in January-May 2003 (Table 4.8). The Eastern Region is not the area with the highest crime rate in the Country. The total number of criminal activities reported in the Region in 2000-02 accounts for 18.3% of the national total, smaller than its population share. The crime rate is the highest in San Salvador with a 36.8% share, followed by La Libertad with 10.5%, and Santa Ana with 7.7%. The shares of the Eastern Region, however, are larger in domestic violence (20.1%), rape (21.7%), assault (22.4%), extortion (22.5%), and negligent manslaughter (22.7%).
In the Eastern Region, the homicide rate is higher than the national average (56.6 per 100,000 inhabitants in 2000) in Usulutan (65.6) and La Union (62.6), and lower in San Miguel (53.5) and Morazan (31.1), according to the Attorney General’s Office (Table 4.9). Rates of other violent crimes are lower than the national average in all the four departments (PNC).
According to the questionnaire survey results, inhabitants in the Eastern Region perceive criminal activities as the main problem, identified by 27% of the respondents. However, they report economy-related problems (e.g., unemployment, poverty, dollarization, inflation/high prices, etc.) to be the main problem much more (a 52% share as combined) than all the crime-related problems combined (33%).
Practically a half of the survey respondents in the Eastern Region admit that they have had to change their behavior because they felt unsafe. Of the business owners who responded, 8% closed their businesses in 2002 due to their fear of becoming crime victims. It is interesting to note that their behavioral changes derived from perceptions of unsafeness are positively correlated with exposure to news by the mass media.
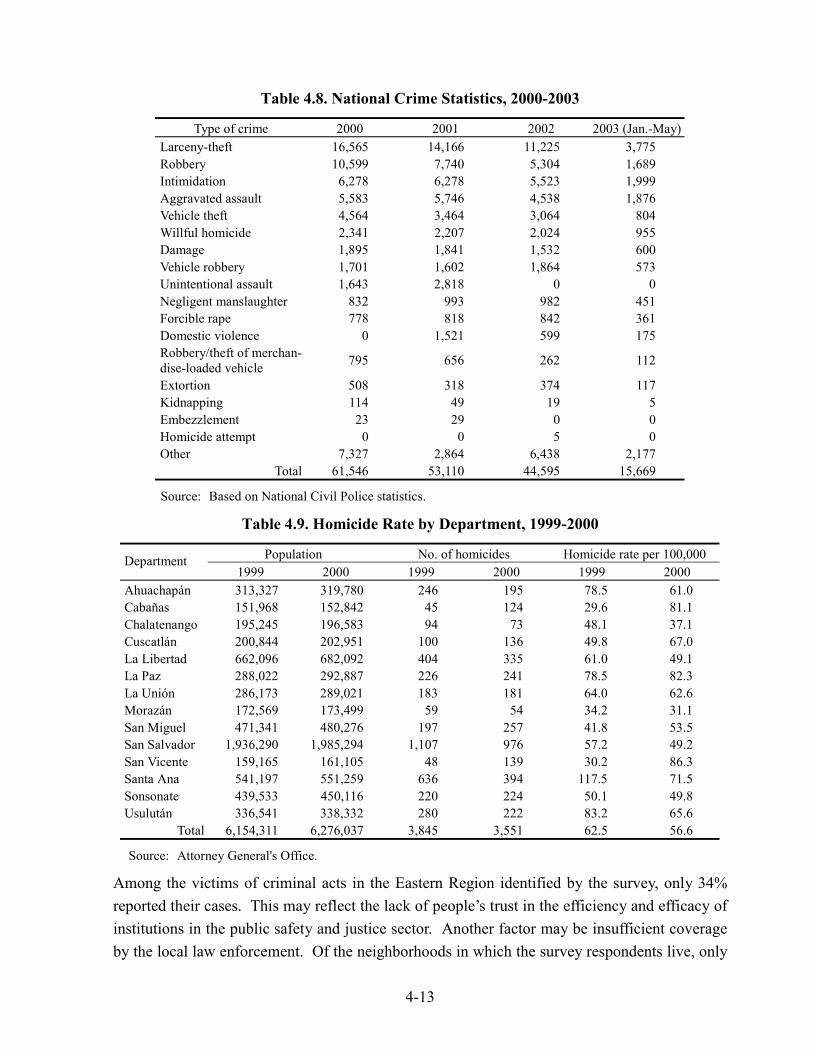
4-13
Table 4.8. National Crime Statistics, 2000-2003
Type of crime 2000 2001 2002 2003 (Jan.-May) Larceny-theft 16,565 14,166 11,225 3,775 Robbery 10,599 7,740 5,304 1,689 Intimidation 6,278 6,278 5,523 1,999 Aggravated assault 5,583 5,746 4,538 1,876 Vehicle theft 4,564 3,464 3,064 804 Willful homicide 2,341 2,207 2,024 955 Damage 1,895 1,841 1,532 600 Vehicle robbery 1,701 1,602 1,864 573 Unintentional assault 1,643 2,818 0 0 Negligent manslaughter 832 993 982 451 Forcible rape 778 818 842 361 Domestic violence 0 1,521 599 175 Robbery/theft of merchan-dise-loaded vehicle 795 656 262 112
Extortion 508 318 374 117 Kidnapping 114 49 19 5 Embezzlement 23 29 0 0 Homicide attempt 0 0 5 0 Other 7,327 2,864 6,438 2,177
Total 61,546 53,110 44,595 15,669
Source: Based on National Civil Police statistics.
Table 4.9. Homicide Rate by Department, 1999-2000
Population No. of homicides Homicide rate per 100,000 Department 1999 2000 1999 2000 1999 2000
Ahuachapán 313,327 319,780 246 195 78.5 61.0 Cabañas 151,968 152,842 45 124 29.6 81.1 Chalatenango 195,245 196,583 94 73 48.1 37.1 Cuscatlán 200,844 202,951 100 136 49.8 67.0 La Libertad 662,096 682,092 404 335 61.0 49.1 La Paz 288,022 292,887 226 241 78.5 82.3 La Unión 286,173 289,021 183 181 64.0 62.6 Morazán 172,569 173,499 59 54 34.2 31.1 San Miguel 471,341 480,276 197 257 41.8 53.5 San Salvador 1,936,290 1,985,294 1,107 976 57.2 49.2 San Vicente 159,165 161,105 48 139 30.2 86.3 Santa Ana 541,197 551,259 636 394 117.5 71.5 Sonsonate 439,533 450,116 220 224 50.1 49.8 Usulután 336,541 338,332 280 222 83.2 65.6
Total 6,154,311 6,276,037 3,845 3,551 62.5 56.6
Source: Attorney General's Office.
Among the victims of criminal acts in the Eastern Region identified by the survey, only 34% reported their cases. This may reflect the lack of people’s trust in the efficiency and efficacy of institutions in the public safety and justice sector. Another factor may be insufficient coverage by the local law enforcement. Of the neighborhoods in which the survey respondents live, only
4-14
29% have police posts.
In the Eastern Region, people have better assessment of police efficacy to apprehend offenders and criminals, compared to the justice system’s capacity to judge and punish them. There are some cases of coordination between private enterprises and PNC reported in the cities of San Miguel and La Union.
In sum, criminal activities have steadily been decreasing in the Country as a whole in recent years, and the crime rate is lower in the Eastern Region than other advanced regions in the Country. The local residents perceive poverty and other economic problems to be more serious than crime-related problems.
4.2 SWOT Analysis on Salvadoran Economy for Investment and Export
Based on the foregoing examination of competitive environment of El Salvador and interviews with entrepreneurs and investors as well as government officials, strengths (S), weaknesses (W), opportunities (O), and Threat (T) for investment and export in El Salvador are analyzed. This SWOT analysis clarifies the comparative position of El Salvador for attracting investments and promoting export.
4.2.1 Strengths
(1) Strategic location in Central America
That El Salvador is centrally located in Central America, neighboring on Guatemala, Honduras and Nicaragua, allows the Country to benefit more from the Central American integration. Its proximity to the U.S. markets gives the Country advantage over competitors of China and other Asians countries. The hub function of its international airport and frequent flight services to main cities in the U.S. provide additional advantages.
Its location facing the Pacific ocean has not much benefited El Salvador, for its main markets have been the U.S. gulf coast and European countries such as Germany and Belgium. This may change if El Salvador becomes the gateway for Central America connecting with the U.S. west coast and Asian countries. Realization of this potential, however, depends on the development of transportation network and transport related industries in Central America.
(2) Labor force
It has been stressed on various occasions that Salvadoran workers, fast learners in nature, make loyal labor force to ensure high productivity and low employee turnover for companies. Also, the Government efforts to focus on the basic education in the recent years have improved the quality of labor. It is difficult to evaluate, however, whether or not Salvadoran workers are ready for new industries that call for more complexities and precision in manufacturing processes. Further, that the number of college graduates is not increasing currently may
4-15
constrain the development of more technology-oriented industries.
(3) Relatively transparent and stable government and economy
El Salvador has a relatively transparent and stable government in comparison with other Latin American countries. The government has put a lot of effort into setting up good business climates through the improvement of regulatory and institutional frameworks. One of good examples is El Salvador’s Foreign Trade Integrated System (SICEX) – an online clearinghouse – that enables exporters to obtain an export permit within one hour.
FTA negotiations and provision of financial incentives are some of the tools to change the business environment for export and investment. This alone, however, cannot ensure success or competitiveness to the firms over their rivals in neighboring countries since the conditions are almost the same throughout Central America with only a few minor differences as noted in the previous section. The transparency and stability of the government are important factors to maintain a positive business environment for export and investment. A recent survey by the American Chamber of Commerce (AMCHAM) shows that the business environment in El Salvador has improved and that one of the most positive factors is monetary stability due to dollarization.
4.2.2 Weaknesses
(1) Limited size of local market
The size of the local market is not large enough to justify mass production of certain commodities. The total population of all the Central American countries is little more than 30 million, and the combined GDP some US$45 billion, corresponding to less than a half of the economy of Thailand. Since the industry sector has not much developed in the Country and in the region, the demand for intermediate goods is quite limited except the textile and garment industry.
(2) Image of the Country and security problem
The country still suffers from the image of the civil war and natural disasters, and the security problems hinder foreign direct investments. PROESA has been working to change these image problems by the “El Salvador Works” campaign. According to the data provided by the National Civil Police (PNC), however, criminal activities have declined constantly for the past few years (Subsection 4.1.5).
(3) High cost of operation
One of the reasons for higher transportation costs is the inefficiency of the existent domestic port so that a great amount of raw materials and intermediate goods are imported through ports in Guatemala and Honduras at present. The transportation costs are expected to decrease with the privatization of the high-cost Acajutla port and the operation of the new La Union port.
4-16
El Salvador has higher wages than Nicaragua by 20-30% but the high productivity compensates for this disadvantage. It is obvious, however, that El Salvador cannot compete with Asian countries, especially China, in term of labor cost per unit of production. Small domestic markets also hinder reduction in unit cost because many companies cannot introduce mass production machinery.
The privatization of the electricity sector has improved the quality of electricity supply, but the electricity price has not been reduced significantly. While the level of electricity price for commercial and industrial uses is low compared with neighboring countries and the U.S., many SMEs complain about the high energy cost.
(4) Low level of industrial accumulation
Historically, El Salvador depended on traditional commodities such as coffee, sugar and shrimp. Only the textile and apparel sector has been developed save a few existing light industries. The industrial sector is still undeveloped and thus the level of accumulation in terms of the number of companies, human resources and the level of technology is low. This situation impedes not only technology-based investment but also human resources development in the Country.
4.2.3 Opportunities
(1) CAFTA with the U.S.
CAFTA is expected to provide Central American countries and the U.S. better access to affordable goods and to promote export and employment. The experience of Mexico with NAFTA indicates rapid increase in investment by FTA.
According to a FUSADES survey, there are more firms (60%) that find some benefit brought by free trade agreements already concluded than those (40%) that do not. The same survey shows that three main advantages of their products and services are quality (reported by 69.9% of the respondent companies), good service and efficiency (57%), and prices (54.4%). Nevertheless, based on the information collected through a series of interviews, those companies, especially SMEs, are not ready for real free trade with major industrialized countries and those that are confident in their products may have never confronted serious competition from outside Central America.
(2) Central American integration
El Salvador is in the position to benefit from the ongoing SICA and PPP initiatives. Particularly, the unified customs system under the Central American Customs Union and the integration of transport, power and telecommunications infrastructures will facilitate investment and export promotion.
4-17
(3) La Union port and related infrastructures
The establishment of the La Union port and related infrastructures will reduce the cost of import and export, particularly of container cargoes, which are presently loaded and unloaded at the costly Acajutla port or other ports in Guatemala and Honduras. The realization of full potentials will be subject to the upgrading of artery roads and links with the existing airport and port.
4.2.4 Threats
(1) Dependency on the U.S. economy
The recent deceleration of the U.S. economy has affected investment and export in El Salvador. There always exist threats derived from fluctuations of the U.S. economy, on which Salvadoran export depends heavily. Despite the government efforts to diversify export destinations, it has been difficult to change the structure of the maquila industry.
(2) Increasing competition
Although FTAs will certainly promote export, the domestic market will face fierce competitions from industrialized countries at the same time. Easier access to the Asian countries by the opening of the La Union port may allow inexpensive Asian products to flow into the country.
(3) Abolition of export promotion measures
In compliance with the WTO’s Trade-related Investment Measures, some incentives and measures for export promotion will be abolished in steps, including the exemption of import/export duties and most, if not all, of other incentives associated with free zones. There are many uncertainties related to the abolition schedule of other measures.
4.3 Strategy for Investment and Export Promotion
The strategy for investment and export promotion in El Salvador is established, focusing on the Eastern Region. The strategy should utilize or further enhance the strengths and overcome the weaknesses identified in the previous section, taking advantage of the opportunities and coping with the threats also clarified by the SWOT analysis. Strategies commonly applicable to investment and export promotion are presented in Subsections 4.3.1 and 4.3.2, respectively. Under these common strategies, more promising industries and commodities are identified, and specific strategies for those industries and commodities established in Chapter 5
4.3.1 Investment promotion strategy
(1) Targeted and proactive marketing
Marketing for investment opportunities should be targeted more at U.S. based firms. Most firms have headquarters functions for Latin American operations in Miami, New York and
4-18
Houston. As CAFTA with the U.S. is effected, new opportunities would emerge to attract investments by U.S. based firms.
Proactive marketing should be combined with broad-based investment promotion. A database for potential investors should be elaborated by PROESA, and investment information should be sent out periodically via the Internet. Information may be customized to meet the needs of various investors. A customer relationship management (CRM) system may be eventually introduced.
Most embassies have investment-related brochures produced by PROESA but lack knowledge on what investors need. Staff of embassies and consulates should be trained to serve as proactive marketing agents. They should be able to answer basic questions by potential investors and collect basic data for market research. Also, correspondents should be placed, on a commission basis at the beginning, in target cities such as New York, Miami, Houston and Los Angeles to collect information on investors and convey investors’ requests to PROESA.
(2) Promotion group
A promotion group should be established to attract investments in the Eastern Region with the participation of CND, CEPA, PROESA, MOE, MAG, and other agencies and institutes. The roles of this group are 1) planning and coordinating investment promotion activities among actors, 2) exchange of investment information, and 3) monitoring of ongoing projects. The group should also undertake the marketing of the La Union port in cooperation with the private sector to attract more cargoes and shipping lines. Specific activities include 1) conducting port seminars, 2) setting up a website and permanent sales window, 3) dispatching missions to the U.S., and 4) producing brochures. Domestic promotion should target at industries including maquilas currently using Port Cortes or Santo Tomas de Castilla for export.
(3) Strengthening of network with overseas Salvadorans
Overseas Salvadorans, especially those in the U.S., are potentially most significant investors but currently lacking in access to information on business opportunities in El Salvador and also mutual trust to undertake joint investments. They should be linked by information network. A database should be established on potential investors and also possible investment opportunities. Through the network, overseas Salvadoran investors and local projects are matched (Figure 4.1).
(4) Incentives
Labor costs in the Eastern Region should be reduced to attract labor-intensive industries such as textile and apparel. One way is to introduce exclusive labor incentives such as subsidized training and job bonus, practiced in Costa Rica for a designated area. Another possibility is to introduce differential minimum wage rates and apply a lower rate in the Eastern Region for a limited time. Employment at the lower wage would be definitely preferable to unemployment.
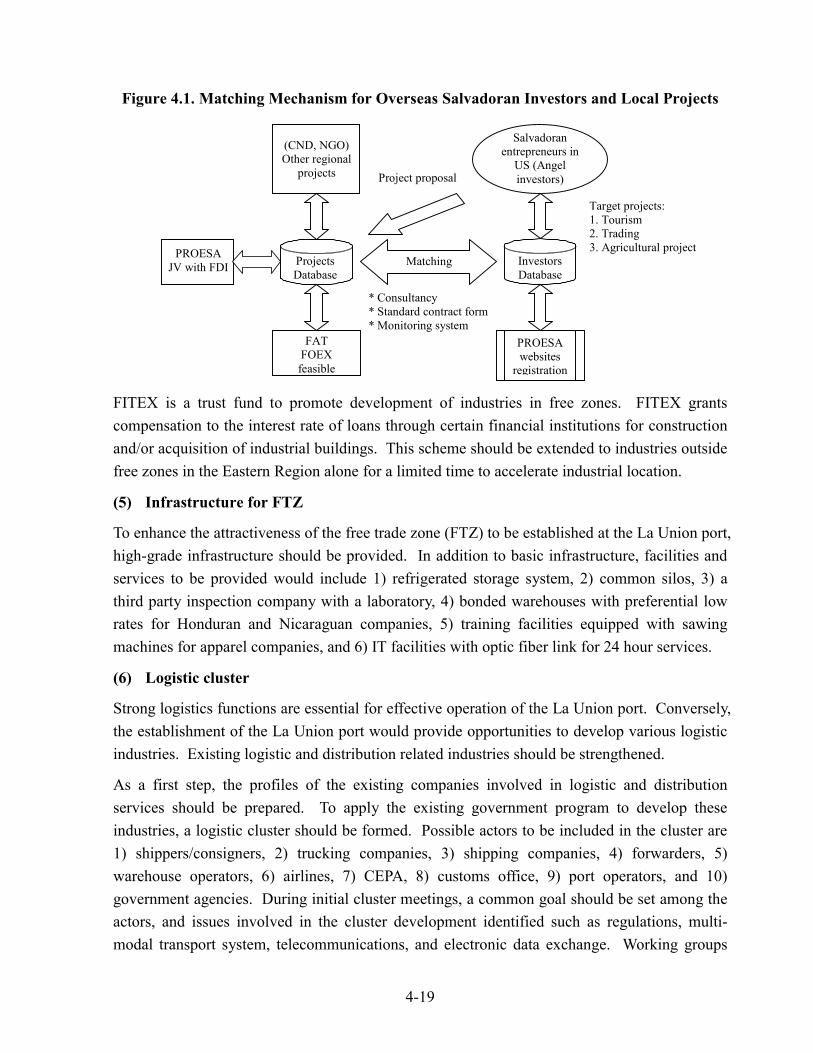
4-19
Figure 4.1. Matching Mechanism for Overseas Salvadoran Investors and Local Projects
FITEX is a trust fund to promote development of industries in free zones. FITEX grants compensation to the interest rate of loans through certain financial institutions for construction and/or acquisition of industrial buildings. This scheme should be extended to industries outside free zones in the Eastern Region alone for a limited time to accelerate industrial location.
(5) Infrastructure for FTZ
To enhance the attractiveness of the free trade zone (FTZ) to be established at the La Union port, high-grade infrastructure should be provided. In addition to basic infrastructure, facilities and services to be provided would include 1) refrigerated storage system, 2) common silos, 3) a third party inspection company with a laboratory, 4) bonded warehouses with preferential low rates for Honduran and Nicaraguan companies, 5) training facilities equipped with sawing machines for apparel companies, and 6) IT facilities with optic fiber link for 24 hour services.
(6) Logistic cluster
Strong logistics functions are essential for effective operation of the La Union port. Conversely, the establishment of the La Union port would provide opportunities to develop various logistic industries. Existing logistic and distribution related industries should be strengthened.
As a first step, the profiles of the existing companies involved in logistic and distribution services should be prepared. To apply the existing government program to develop these industries, a logistic cluster should be formed. Possible actors to be included in the cluster are 1) shippers/consigners, 2) trucking companies, 3) shipping companies, 4) forwarders, 5) warehouse operators, 6) airlines, 7) CEPA, 8) customs office, 9) port operators, and 10) government agencies. During initial cluster meetings, a common goal should be set among the actors, and issues involved in the cluster development identified such as regulations, multi-modal transport system, telecommunications, and electronic data exchange. Working groups
Target projects: 1. Tourism 2. Trading 3. Agricultural project
* Consultancy * Standard contract form * Monitoring system
PROESA websites
registration
Salvadoran entrepreneurs in
US (Angel investors)
Matching
FAT FOEX feasible
Investors Database
Project proposal
PROESA JV with FDI
(CND, NGO) Other regional
projects
Projects Database
4-20
may be formed to conduct research on more essential issues.
4.3.2 Export promotion strategy
(1) Export orientation
Most SMEs in the Eastern Region have never considered export business seriously. Export orientation should be provided for local entrepreneurs to raise awareness for export opportunities, particularly associated with the La Union port. As a first step, COEXPO should organize a seminar or workshop in San Miguel, for the first time in the Eastern Region. Subjects to be covered include export diagnostics, successful cases, available services and fund by export promotion agencies, and basic export procedure. Similar seminars/workshops should be conducted in series in Usulutan, La Union and Santa Rosa de Lima, while responses of participants should be evaluated each time for more effective programs.
(2) Stepwise development of export capacity
It is much easier for SMEs to replace goods in the domestic market imported from the neighboring countries rather than to export goods. Most goods imported from the neighboring countries are also produced domestically, but production costs are generally higher. To outdo imported goods in the domestic market, local SMEs should aim at high-quality market in the Country. In so doing, SMEs would improve their productivity necessary to produce for the export market. Also, production capacity needs to be expanded to overcome the threshold of export quantity. Cooperative-based production of vegetables should be encouraged. In most cases, even cooperatives are too small to produce for export, and a consortium needs to be formed.
Development of export capacity should be realized selectively to create export winners. For this purpose, a database of potential exporters/suppliers in the Eastern Region should be prepared by CENTROMYPE, and more promising entrepreneurs or companies selected for assistance.
5-1
Chapter 5 COMPETITIVENESS OF SALVADORAN INDUSTRIES AND COMMODITIES AND
THEIR PROMOTION STRATEGIES
5.1 Promising Subsector Industries and Commodities
Promising subsector industries in El Salvador are identified focusing on the Eastern Region, based on macro trade statistics and the results of surveys conducted as part of the Study. First, the competitiveness of subsector industries in El Salvador is analyzed in Subsection 5.1.1 based on trade statistics. Second, the results of the surveys are summarized in Subsection 5.1.2 for advantages and disadvantages of El Salvador as perceived by potential investors and also for possible new industries that may be established in the Eastern Region. Third, combining these analyses, three models for promising industries in the Eastern Region are clarified also in Subsection 5.1.2 in relation to the La Union port. Two models represent manufacturing industries that may be established in the Eastern Region induced by improved locational conditions provided by the La Union port. The third model represents indigenous resources-based industries.
Industries of the third model are further examined in Subsection 5.1.3, combining the analysis on the trade statistics in Subsection 5.1.1, and interviews and field surveys in the Eastern Region. More specific commodity groups are identified, and more promising ones are selected by a set of evaluation criteria.
5.1.1 Analysis on competitiveness by subsector industry
(1) Competitiveness by commodity group in El Salvador
Competitiveness of the existing economic activities is analyzed to identify more promising ones that may be promoted further. For El Salvador has been pursuing open economic policy and free trade, the competitiveness of any activity or commodity may be judged based on its export performance. Table 5.1 presents the export performance in recent years by commodity class. Other than textile dominantly of maquila, four growth areas are identified with export value of more than US$100 million in 2001: (i) prepared foodstuffs, (ii) wood pulp products, (iii) base metals and their articles, and (iv) machinery and mechanical appliances.
The trade specialization coefficient (TSC) may be used to make a broad judgment on comparatively better export competitiveness. This is defined as the export value minus the import value divided by their sum. As also shown in Table 5.1, the TSC is negative for all the commodity groups, except vegetable products, and textile and textile articles, indicating that El Salvador imports these goods more than it exports. Taking those groups with the TSC value larger than -0.50, the following are identified as more promising commodity groups:
1) Animals and animal products, 2) Vegetable products,
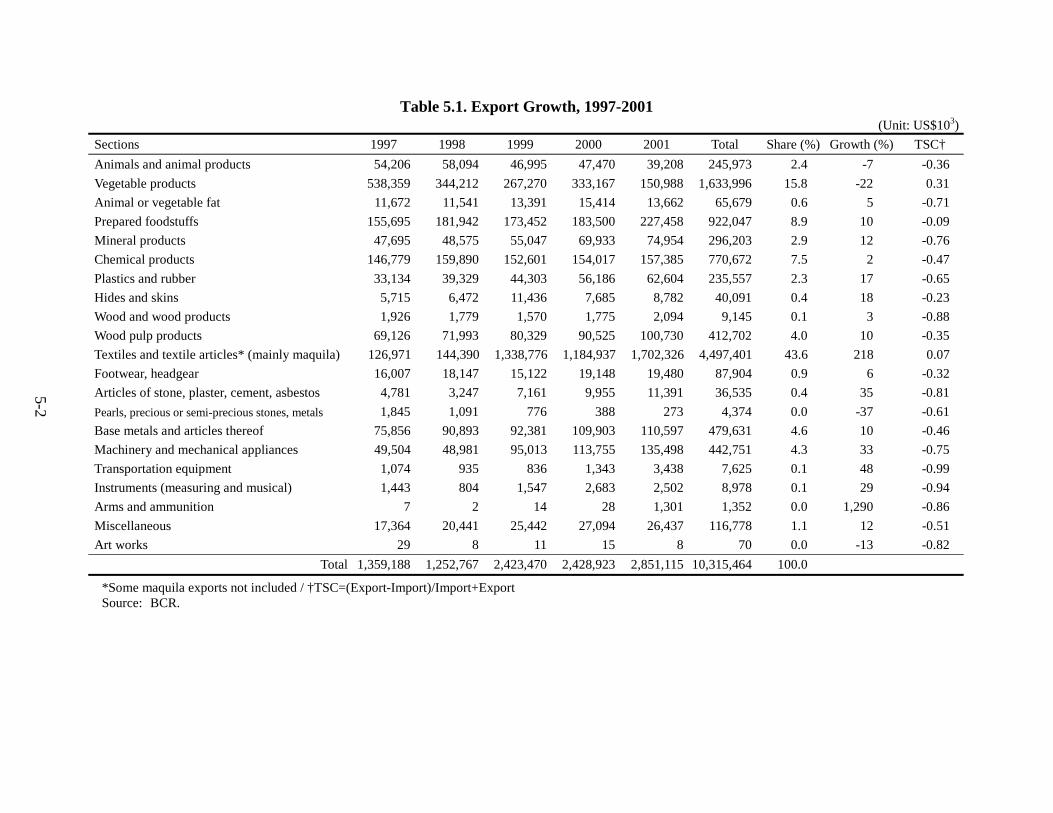
5-2
Table 5.1. Export Growth, 1997-2001 (Unit: US$103)
Sections 1997 1998 1999 2000 2001 Total Share (%) Growth (%) TSC† Animals and animal products 54,206 58,094 46,995 47,470 39,208 245,973 2.4 -7 -0.36 Vegetable products 538,359 344,212 267,270 333,167 150,988 1,633,996 15.8 -22 0.31 Animal or vegetable fat 11,672 11,541 13,391 15,414 13,662 65,679 0.6 5 -0.71 Prepared foodstuffs 155,695 181,942 173,452 183,500 227,458 922,047 8.9 10 -0.09 Mineral products 47,695 48,575 55,047 69,933 74,954 296,203 2.9 12 -0.76 Chemical products 146,779 159,890 152,601 154,017 157,385 770,672 7.5 2 -0.47 Plastics and rubber 33,134 39,329 44,303 56,186 62,604 235,557 2.3 17 -0.65 Hides and skins 5,715 6,472 11,436 7,685 8,782 40,091 0.4 18 -0.23 Wood and wood products 1,926 1,779 1,570 1,775 2,094 9,145 0.1 3 -0.88 Wood pulp products 69,126 71,993 80,329 90,525 100,730 412,702 4.0 10 -0.35 Textiles and textile articles* (mainly maquila) 126,971 144,390 1,338,776 1,184,937 1,702,326 4,497,401 43.6 218 0.07 Footwear, headgear 16,007 18,147 15,122 19,148 19,480 87,904 0.9 6 -0.32 Articles of stone, plaster, cement, asbestos 4,781 3,247 7,161 9,955 11,391 36,535 0.4 35 -0.81 Pearls, precious or semi-precious stones, metals 1,845 1,091 776 388 273 4,374 0.0 -37 -0.61 Base metals and articles thereof 75,856 90,893 92,381 109,903 110,597 479,631 4.6 10 -0.46 Machinery and mechanical appliances 49,504 48,981 95,013 113,755 135,498 442,751 4.3 33 -0.75 Transportation equipment 1,074 935 836 1,343 3,438 7,625 0.1 48 -0.99 Instruments (measuring and musical) 1,443 804 1,547 2,683 2,502 8,978 0.1 29 -0.94 Arms and ammunition 7 2 14 28 1,301 1,352 0.0 1,290 -0.86 Miscellaneous 17,364 20,441 25,442 27,094 26,437 116,778 1.1 12 -0.51 Art works 29 8 11 15 8 70 0.0 -13 -0.82
Total 1,359,188 1,252,767 2,423,470 2,428,923 2,851,115 10,315,464 100.0
*Some maquila exports not included / †TSC=(Export-Import)/Import+Export Source: BCR.
5-2
5-3
3) Prepared foodstuff, 4) Chemical products, 5) Hides and skins, 6) Wood pulp products, 7) Textiles and textile articles, 8) Footwear and headgears, 9) Base metals and their articles, and 10) Miscellaneous commodities.
Three commodity groups ranked high by both of the methods used above may have comparatively better prospects. These are prepared foodstuffs, wood pulp products, and base metals and their articles. In addition, textile articles derived mainly from maquila constitute another promising group.
Three commodity groups have very high rates of export growth although the TSCs of these groups are close to –1.0 reflecting the dominance of import. They are (i) articles of stone, plaster, cement, asbestos, etc., (ii) transportation equipment, and (iii) measuring and musical instruments. Only some specific commodities in these groups may be promising and subject to export promotion.
5.1.2 Identification of promising import/export industries
(1) Potential investors survey
The potential investors survey was conducted separately in Japan for Japanese firms/companies and in Central American countries. According to the survey in Japan, important factors for Japanese investors to make investments decisions in Central America are 1) public safety, 2) low country risk, 3) quality of labor, and 4) good infrastructure, while such factors as stable macro economy, friendly people (amiable nationality), government support and simple procedure of setting up a company are considered to be less important. Unfortunately, none of the Japanese firms that responded to the questionnaire (40 in total of 117 firms surveyed) has a plan to establish a factory or a sales office in El Salvador. The main reasons for this lack of interest are 1) limited knowledge of the Country, 2) small market, even including neighboring Central American countries, and 3) less attractive business environment compared to East Asian countries.
According to the survey in Central America, over 60% or 83 of 135 firms that responded to the questionnaire evaluate El Salvador as a good or excellent investment destination. Over 90% of the respondent firms already have business experiences in El Salvador. Important factors for them to make investment decisions in Central America are 1) low country risk, 2) good security, and 3) good access to markets, while such factors as amiable nationality, low labor cost, and
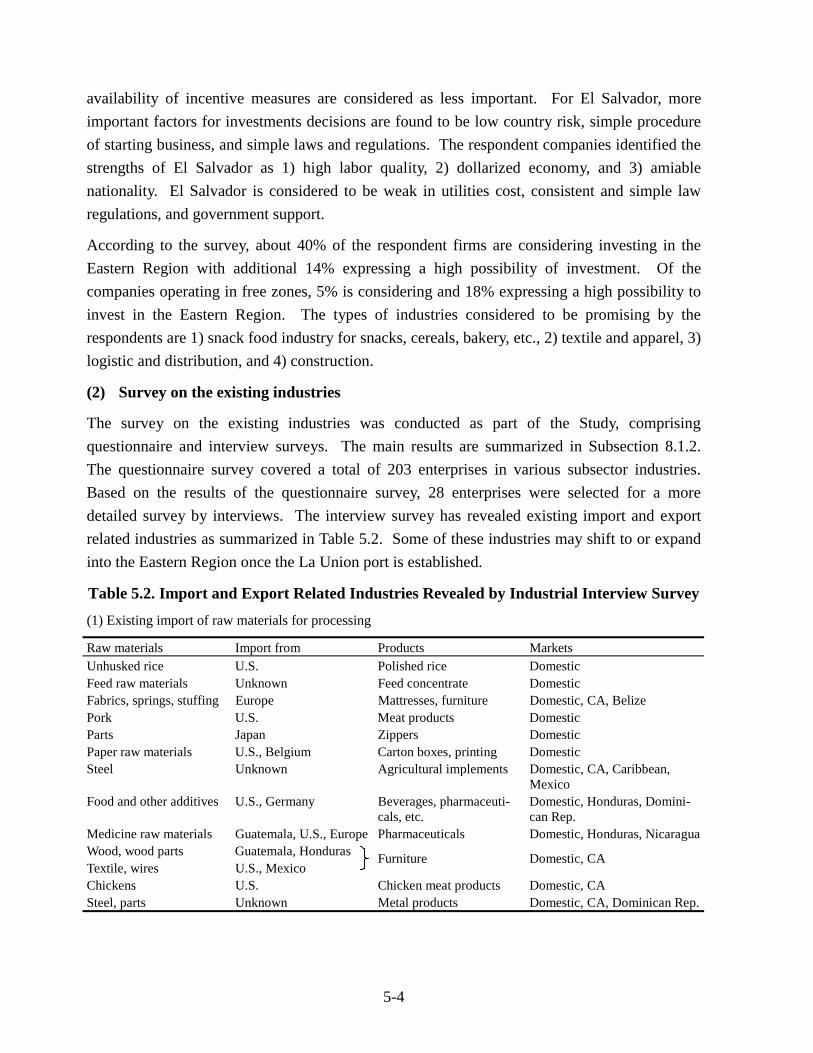
5-4
availability of incentive measures are considered as less important. For El Salvador, more important factors for investments decisions are found to be low country risk, simple procedure of starting business, and simple laws and regulations. The respondent companies identified the strengths of El Salvador as 1) high labor quality, 2) dollarized economy, and 3) amiable nationality. El Salvador is considered to be weak in utilities cost, consistent and simple law regulations, and government support.
According to the survey, about 40% of the respondent firms are considering investing in the Eastern Region with additional 14% expressing a high possibility of investment. Of the companies operating in free zones, 5% is considering and 18% expressing a high possibility to invest in the Eastern Region. The types of industries considered to be promising by the respondents are 1) snack food industry for snacks, cereals, bakery, etc., 2) textile and apparel, 3) logistic and distribution, and 4) construction.
(2) Survey on the existing industries
The survey on the existing industries was conducted as part of the Study, comprising questionnaire and interview surveys. The main results are summarized in Subsection 8.1.2. The questionnaire survey covered a total of 203 enterprises in various subsector industries. Based on the results of the questionnaire survey, 28 enterprises were selected for a more detailed survey by interviews. The interview survey has revealed existing import and export related industries as summarized in Table 5.2. Some of these industries may shift to or expand into the Eastern Region once the La Union port is established.
Table 5.2. Import and Export Related Industries Revealed by Industrial Interview Survey (1) Existing import of raw materials for processing
Raw materials Import from Products Markets Unhusked rice U.S. Polished rice Domestic Feed raw materials Unknown Feed concentrate Domestic Fabrics, springs, stuffing Europe Mattresses, furniture Domestic, CA, Belize Pork U.S. Meat products Domestic Parts Japan Zippers Domestic Paper raw materials U.S., Belgium Carton boxes, printing Domestic Steel Unknown Agricultural implements Domestic, CA, Caribbean,
Mexico Food and other additives U.S., Germany Beverages, pharmaceuti-
cals, etc. Domestic, Honduras, Domini-can Rep.
Medicine raw materials Guatemala, U.S., Europe Pharmaceuticals Domestic, Honduras, Nicaragua Wood, wood parts Guatemala, Honduras Textile, wires U.S., Mexico
Furniture Domestic, CA
Chickens U.S. Chicken meat products Domestic, CA Steel, parts Unknown Metal products Domestic, CA, Dominican Rep.
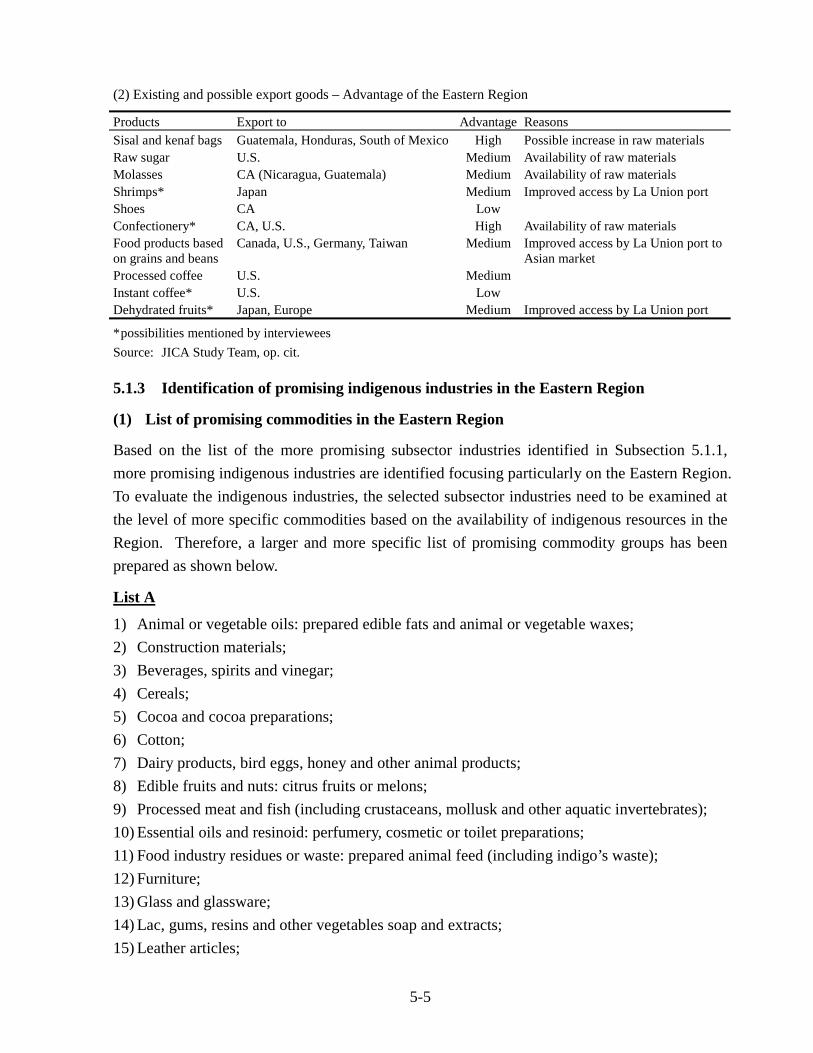
5-5
(2) Existing and possible export goods – Advantage of the Eastern Region
Products Export to Advantage Reasons Sisal and kenaf bags Guatemala, Honduras, South of Mexico High Possible increase in raw materials Raw sugar U.S. Medium Availability of raw materials Molasses CA (Nicaragua, Guatemala) Medium Availability of raw materials Shrimps* Japan Medium Improved access by La Union port Shoes CA Low Confectionery* CA, U.S. High Availability of raw materials Food products based on grains and beans
Canada, U.S., Germany, Taiwan Medium Improved access by La Union port to Asian market
Processed coffee U.S. Medium Instant coffee* U.S. Low Dehydrated fruits* Japan, Europe Medium Improved access by La Union port
* possibilities mentioned by interviewees Source: JICA Study Team, op. cit.
5.1.3 Identification of promising indigenous industries in the Eastern Region
(1) List of promising commodities in the Eastern Region
Based on the list of the more promising subsector industries identified in Subsection 5.1.1, more promising indigenous industries are identified focusing particularly on the Eastern Region. To evaluate the indigenous industries, the selected subsector industries need to be examined at the level of more specific commodities based on the availability of indigenous resources in the Region. Therefore, a larger and more specific list of promising commodity groups has been prepared as shown below.
List A
1) Animal or vegetable oils: prepared edible fats and animal or vegetable waxes; 2) Construction materials; 3) Beverages, spirits and vinegar; 4) Cereals; 5) Cocoa and cocoa preparations; 6) Cotton; 7) Dairy products, bird eggs, honey and other animal products; 8) Edible fruits and nuts: citrus fruits or melons; 9) Processed meat and fish (including crustaceans, mollusk and other aquatic invertebrates); 10) Essential oils and resinoid: perfumery, cosmetic or toilet preparations; 11) Food industry residues or waste: prepared animal feed (including indigo’s waste); 12) Furniture; 13) Glass and glassware; 14) Lac, gums, resins and other vegetables soap and extracts; 15) Leather articles;
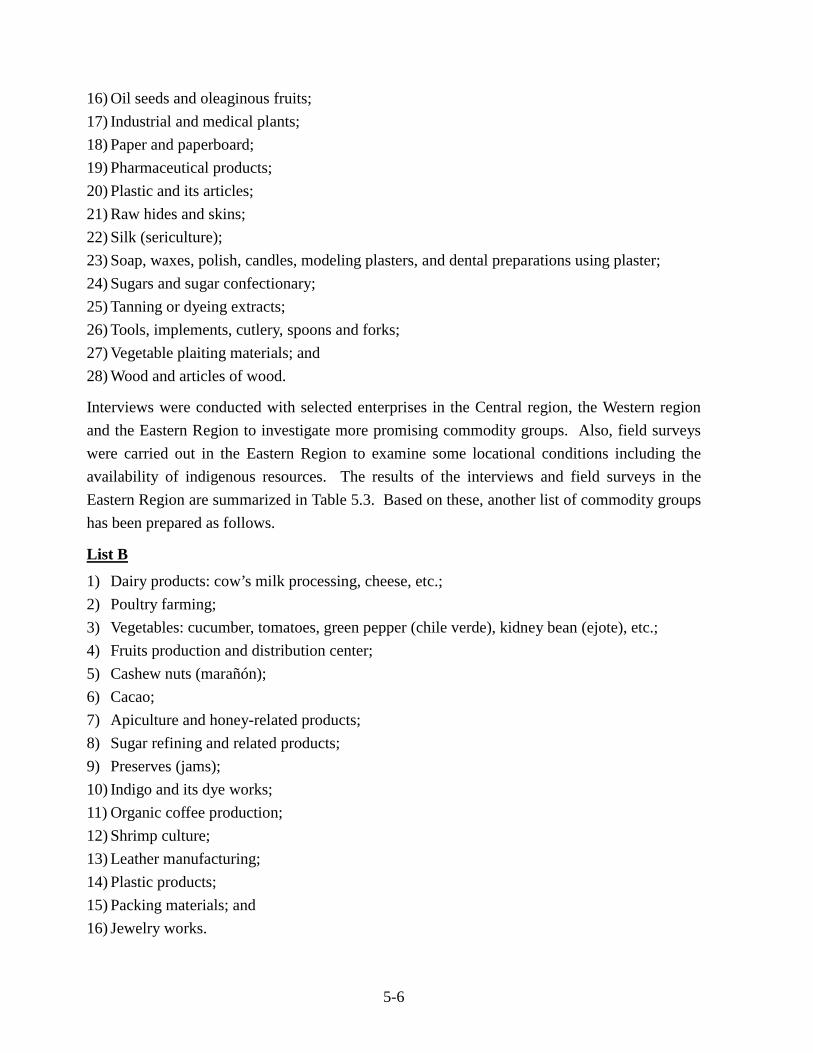
5-6
16) Oil seeds and oleaginous fruits; 17) Industrial and medical plants; 18) Paper and paperboard; 19) Pharmaceutical products; 20) Plastic and its articles; 21) Raw hides and skins; 22) Silk (sericulture); 23) Soap, waxes, polish, candles, modeling plasters, and dental preparations using plaster; 24) Sugars and sugar confectionary; 25) Tanning or dyeing extracts; 26) Tools, implements, cutlery, spoons and forks; 27) Vegetable plaiting materials; and 28) Wood and articles of wood.
Interviews were conducted with selected enterprises in the Central region, the Western region and the Eastern Region to investigate more promising commodity groups. Also, field surveys were carried out in the Eastern Region to examine some locational conditions including the availability of indigenous resources. The results of the interviews and field surveys in the Eastern Region are summarized in Table 5.3. Based on these, another list of commodity groups has been prepared as follows.
List B
1) Dairy products: cow’s milk processing, cheese, etc.; 2) Poultry farming; 3) Vegetables: cucumber, tomatoes, green pepper (chile verde), kidney bean (ejote), etc.; 4) Fruits production and distribution center; 5) Cashew nuts (marañón); 6) Cacao; 7) Apiculture and honey-related products; 8) Sugar refining and related products; 9) Preserves (jams); 10) Indigo and its dye works; 11) Organic coffee production; 12) Shrimp culture; 13) Leather manufacturing; 14) Plastic products; 15) Packing materials; and 16) Jewelry works.
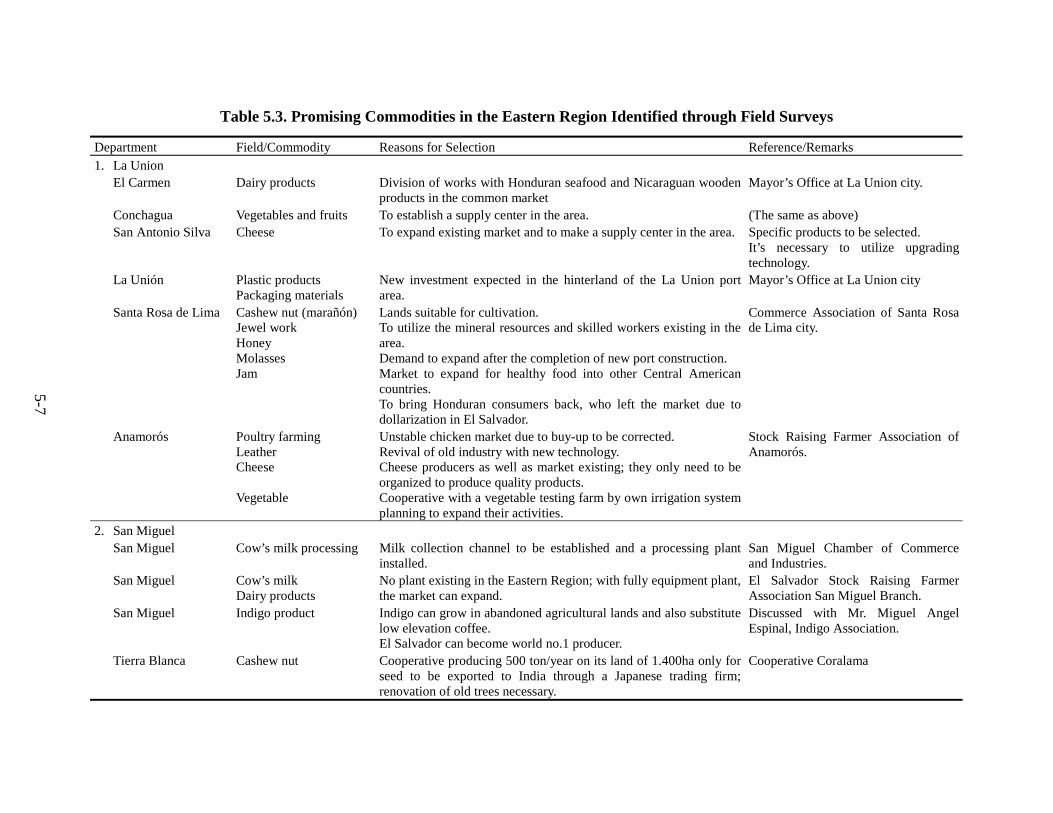
5-7
Table 5.3. Promising Commodities in the Eastern Region Identified through Field Surveys
Department Field/Commodity Reasons for Selection Reference/Remarks 1. La Union
El Carmen Dairy products Division of works with Honduran seafood and Nicaraguan wooden products in the common market
Mayor’s Office at La Union city.
Conchagua Vegetables and fruits To establish a supply center in the area. (The same as above) San Antonio Silva Cheese To expand existing market and to make a supply center in the area. Specific products to be selected.
It’s necessary to utilize upgrading technology.
La Unión Plastic products Packaging materials
New investment expected in the hinterland of the La Union port area.
Mayor’s Office at La Union city
Santa Rosa de Lima Cashew nut (marañón) Jewel work Honey Molasses Jam
Lands suitable for cultivation. To utilize the mineral resources and skilled workers existing in the area. Demand to expand after the completion of new port construction. Market to expand for healthy food into other Central American countries. To bring Honduran consumers back, who left the market due to dollarization in El Salvador.
Commerce Association of Santa Rosa de Lima city.
Anamorós Poultry farming Leather Cheese Vegetable
Unstable chicken market due to buy-up to be corrected. Revival of old industry with new technology. Cheese producers as well as market existing; they only need to be organized to produce quality products. Cooperative with a vegetable testing farm by own irrigation system planning to expand their activities.
Stock Raising Farmer Association of Anamorós.
2. San Miguel San Miguel Cow’s milk processing Milk collection channel to be established and a processing plant
installed. San Miguel Chamber of Commerce and Industries.
San Miguel Cow’s milk Dairy products
No plant existing in the Eastern Region; with fully equipment plant, the market can expand.
El Salvador Stock Raising Farmer Association San Miguel Branch.
San Miguel Indigo product Indigo can grow in abandoned agricultural lands and also substitute low elevation coffee. El Salvador can become world no.1 producer.
Discussed with Mr. Miguel Angel Espinal, Indigo Association.
Tierra Blanca Cashew nut Cooperative producing 500 ton/year on its land of 1.400ha only for seed to be exported to India through a Japanese trading firm; renovation of old trees necessary.
Cooperative Coralama
5-7
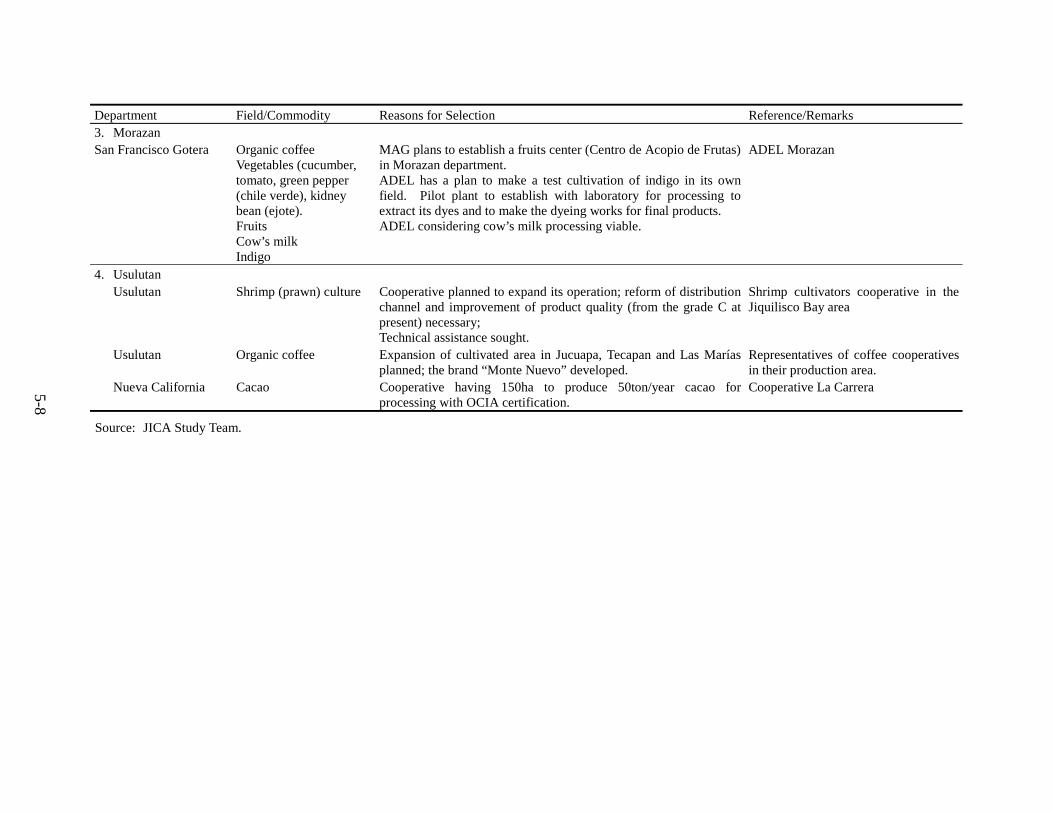
5-8
Department Field/Commodity Reasons for Selection Reference/Remarks 3. Morazan San Francisco Gotera Organic coffee
Vegetables (cucumber, tomato, green pepper (chile verde), kidney bean (ejote). Fruits Cow’s milk Indigo
MAG plans to establish a fruits center (Centro de Acopio de Frutas) in Morazan department. ADEL has a plan to make a test cultivation of indigo in its own field. Pilot plant to establish with laboratory for processing to extract its dyes and to make the dyeing works for final products. ADEL considering cow’s milk processing viable.
ADEL Morazan
4. Usulutan Usulutan Shrimp (prawn) culture Cooperative planned to expand its operation; reform of distribution
channel and improvement of product quality (from the grade C at present) necessary; Technical assistance sought.
Shrimp cultivators cooperative in the Jiquilisco Bay area
Usulutan Organic coffee Expansion of cultivated area in Jucuapa, Tecapan and Las Marías planned; the brand “Monte Nuevo” developed.
Representatives of coffee cooperatives in their production area.
Nueva California Cacao Cooperative having 150ha to produce 50ton/year cacao for processing with OCIA certification.
Cooperative La Carrera
Source: JICA Study Team.
5-8
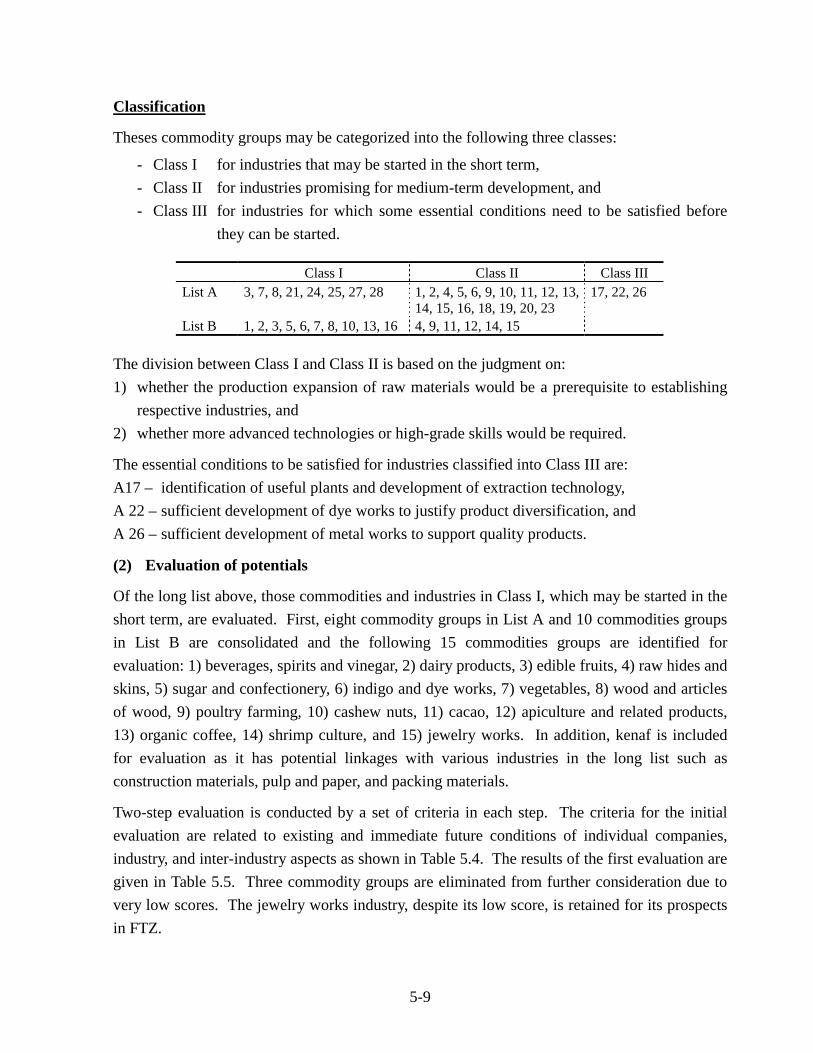
5-9
Classification
Theses commodity groups may be categorized into the following three classes:
- Class I for industries that may be started in the short term, - Class II for industries promising for medium-term development, and - Class III for industries for which some essential conditions need to be satisfied before
they can be started.
Class I Class II Class III List A 3, 7, 8, 21, 24, 25, 27, 28 1, 2, 4, 5, 6, 9, 10, 11, 12, 13,
14, 15, 16, 18, 19, 20, 23 17, 22, 26
List B 1, 2, 3, 5, 6, 7, 8, 10, 13, 16 4, 9, 11, 12, 14, 15
The division between Class I and Class II is based on the judgment on: 1) whether the production expansion of raw materials would be a prerequisite to establishing
respective industries, and 2) whether more advanced technologies or high-grade skills would be required.
The essential conditions to be satisfied for industries classified into Class III are: A17 – identification of useful plants and development of extraction technology, A 22 – sufficient development of dye works to justify product diversification, and A 26 – sufficient development of metal works to support quality products.
(2) Evaluation of potentials
Of the long list above, those commodities and industries in Class I, which may be started in the short term, are evaluated. First, eight commodity groups in List A and 10 commodities groups in List B are consolidated and the following 15 commodities groups are identified for evaluation: 1) beverages, spirits and vinegar, 2) dairy products, 3) edible fruits, 4) raw hides and skins, 5) sugar and confectionery, 6) indigo and dye works, 7) vegetables, 8) wood and articles of wood, 9) poultry farming, 10) cashew nuts, 11) cacao, 12) apiculture and related products, 13) organic coffee, 14) shrimp culture, and 15) jewelry works. In addition, kenaf is included for evaluation as it has potential linkages with various industries in the long list such as construction materials, pulp and paper, and packing materials.
Two-step evaluation is conducted by a set of criteria in each step. The criteria for the initial evaluation are related to existing and immediate future conditions of individual companies, industry, and inter-industry aspects as shown in Table 5.4. The results of the first evaluation are given in Table 5.5. Three commodity groups are eliminated from further consideration due to very low scores. The jewelry works industry, despite its low score, is retained for its prospects in FTZ.
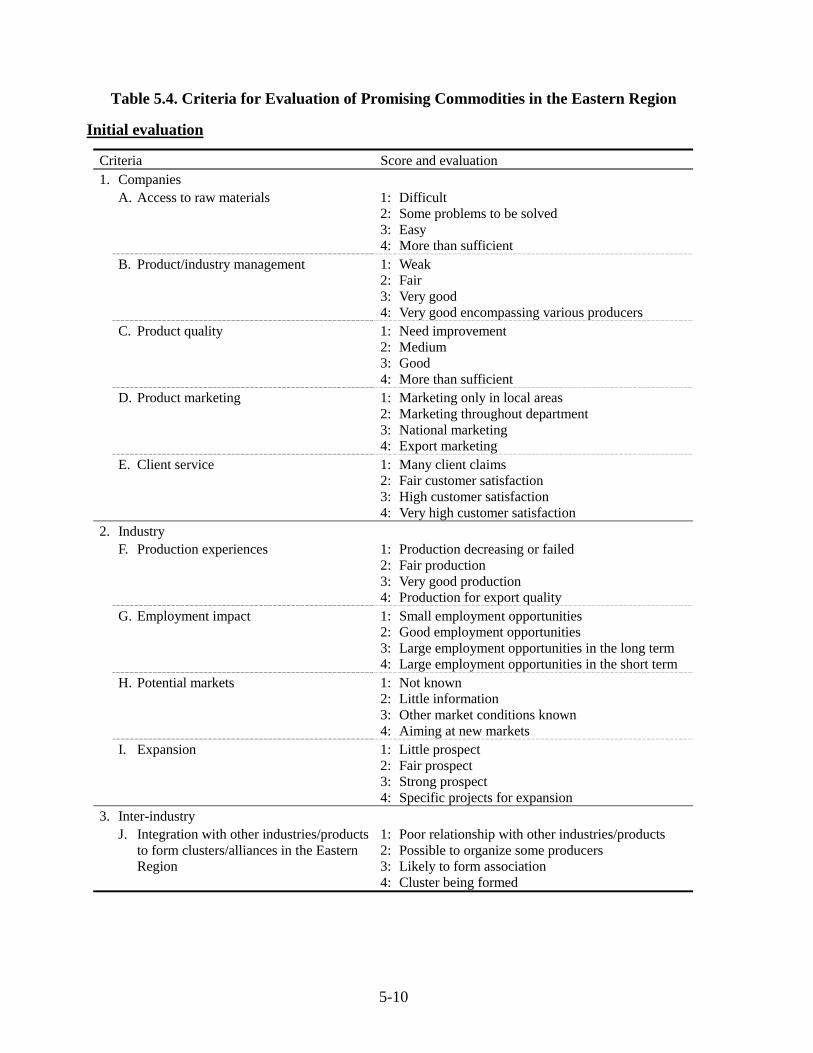
5-10
Table 5.4. Criteria for Evaluation of Promising Commodities in the Eastern Region
Initial evaluation
Criteria Score and evaluation 1. Companies A. Access to raw materials 1: Difficult
2: Some problems to be solved 3: Easy 4: More than sufficient
B. Product/industry management 1: Weak 2: Fair 3: Very good 4: Very good encompassing various producers
C. Product quality 1: Need improvement 2: Medium 3: Good 4: More than sufficient
D. Product marketing 1: Marketing only in local areas 2: Marketing throughout department 3: National marketing 4: Export marketing
E. Client service 1: Many client claims 2: Fair customer satisfaction 3: High customer satisfaction 4: Very high customer satisfaction
2. Industry F. Production experiences 1: Production decreasing or failed
2: Fair production 3: Very good production 4: Production for export quality
G. Employment impact 1: Small employment opportunities 2: Good employment opportunities 3: Large employment opportunities in the long term 4: Large employment opportunities in the short term
H. Potential markets 1: Not known 2: Little information 3: Other market conditions known 4: Aiming at new markets
I. Expansion 1: Little prospect 2: Fair prospect 3: Strong prospect 4: Specific projects for expansion
3. Inter-industry J. Integration with other industries/products
to form clusters/alliances in the Eastern Region
1: Poor relationship with other industries/products 2: Possible to organize some producers 3: Likely to form association 4: Cluster being formed
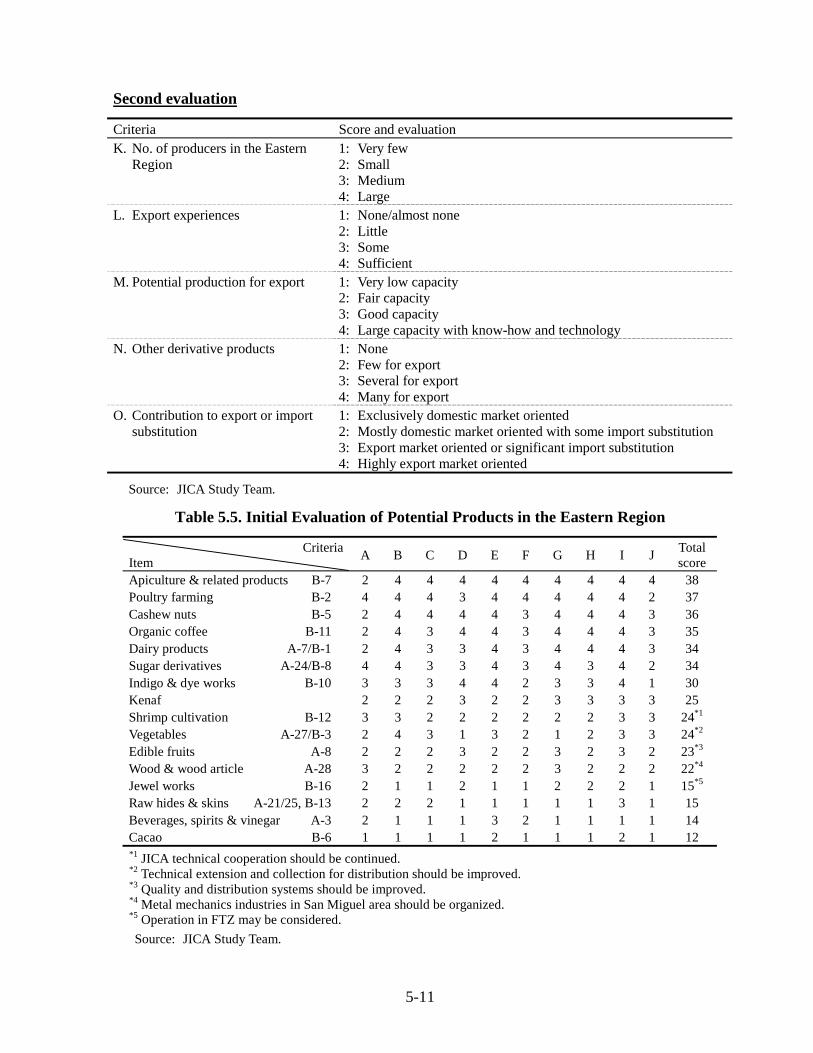
5-11
Second evaluation
Criteria Score and evaluation K. No. of producers in the Eastern
Region 1: Very few 2: Small 3: Medium 4: Large
L. Export experiences 1: None/almost none 2: Little 3: Some 4: Sufficient
M. Potential production for export 1: Very low capacity 2: Fair capacity 3: Good capacity 4: Large capacity with know-how and technology
N. Other derivative products 1: None 2: Few for export 3: Several for export 4: Many for export
O. Contribution to export or import substitution
1: Exclusively domestic market oriented 2: Mostly domestic market oriented with some import substitution 3: Export market oriented or significant import substitution 4: Highly export market oriented
Source: JICA Study Team.
Table 5.5. Initial Evaluation of Potential Products in the Eastern Region
Criteria Item A B C D E F G H I J Total
score Apiculture & related products B-7 2 4 4 4 4 4 4 4 4 4 38 Poultry farming B-2 4 4 4 3 4 4 4 4 4 2 37 Cashew nuts B-5 2 4 4 4 4 3 4 4 4 3 36 Organic coffee B-11 2 4 3 4 4 3 4 4 4 3 35 Dairy products A-7/B-1 2 4 3 3 4 3 4 4 4 3 34 Sugar derivatives A-24/B-8 4 4 3 3 4 3 4 3 4 2 34 Indigo & dye works B-10 3 3 3 4 4 2 3 3 4 1 30 Kenaf 2 2 2 3 2 2 3 3 3 3 25 Shrimp cultivation B-12 3 3 2 2 2 2 2 2 3 3 24*1 Vegetables A-27/B-3 2 4 3 1 3 2 1 2 3 3 24*2 Edible fruits A-8 2 2 2 3 2 2 3 2 3 2 23*3 Wood & wood article A-28 3 2 2 2 2 2 3 2 2 2 22*4 Jewel works B-16 2 1 1 2 1 1 2 2 2 1 15*5 Raw hides & skins A-21/25, B-13 2 2 2 1 1 1 1 1 3 1 15 Beverages, spirits & vinegar A-3 2 1 1 1 3 2 1 1 1 1 14 Cacao B-6 1 1 1 1 2 1 1 1 2 1 12 *1 JICA technical cooperation should be continued. *2 Technical extension and collection for distribution should be improved. *3 Quality and distribution systems should be improved. *4 Metal mechanics industries in San Miguel area should be organized. *5 Operation in FTZ may be considered. Source: JICA Study Team.
5-12
The remaining 13 commodity groups are subject to the second evaluation. The criteria for the second evaluation are related to the prospects for further and continued development of each industry as shown in Table 5.4. The results are given in Table 5.6. Three commodity groups are found to have very high potentials: apiculture and related products, cashew nuts, and poultry farming. Additional four commodity groups have high potentials: organic coffee, sugar derivatives, dairy products, and indigo and dye works.
Four commodity groups have medium-high potentials: kenaf, shrimp culture, vegetables, and edible fruits. In particular, development of edible fruits and vegetables is subject to quality improvement through technical extension and the improvement of distribution and marketing systems. Technical extension has been currently undertaken by MAG, and the improvement of distribution and marketing systems will be realized through the improvement of transport infrastructure particularly related to La Union port development. Therefore, these products are expected to develop as the population grows and income levels increase, for they are basically demand-driven. More strategic approaches will be required for other types of commodities.
Table 5.6. Second Evaluation of Potential Products in the Eastern Region
Criteria Item
Initial score K L M N O Grand
total Overall
potential Apiculture & related products B-7 38 2 4 4 4 4 56 Very high Cashew nuts B-5 36 3 3 3 4 4 53 Very high Dairy products A-7/B-1 34 4 3 4 4 3 52 Very high*1 Organic coffee B-11 35 2 3 3 2 4 49 High Sugar derivatives A-24/B-8 34 3 4 4 2 1 48 High Poultry farming B-2 37 3 1 2 2 1 46 High*2 Indigo & dye works B-10 30 2 2 2 3 4 43 High*2 Kenaf 25 2 3 2 3 3 38 Medium*1 Shrimp cultivation B-12 24 3 2 3 2 3 37 Medium*3 Vegetables A-27/B-3 24 2 1 3 2 3 35 Medium Edible fruits A-8 23 2 2 3 2 2 34 Medium Wood & wood article A-28 22 2 1 3 2 2 32 Low*1 Jewel works B-16 15 1 2 3 3 3 27 Low
*1 Supplement *2 Certain conditions should be met. *3 JICA technical cooperation should be continued. Source: JICA Study Team.
5.1.4 Promising import/export industries in the Eastern Region
Three models are conceived for promising industries in the Eastern Region, particularly those related to import and export, which may be induced as the La Union port is established. They are as follows.
Model 1: Procurement of raw materials by land from neighboring countries for processing in the Eastern Region and export from the La Union port,
5-13
Model 2: Import of raw materials and/or intermediate goods through the port to produce final products for domestic and international markets, and
Model 3: Processing of indigenous resources to produce export commodities.
Promising industries/commodities of Models 1 and 2 are identified below in reference to the results summarized above. The strategies to promote those most promising are presented in Section 5.2. In Section 5.3, promising industries/commodities of Model 3 are analyzed and the strategies to promote the most promising ones are presented.
Model 1 Raw materials Export goods
Wood and lumber from Honduras Plywood, fiberboard, furniture Fruits IQF or dehydrated fruits, jams, preserves, juice, etc. Vegetables IQF vegetables Milk Cheese and processed cheese products Meat Meat products
Model 2 Import materials & goods Final products
Waste paper, paper raw materials Toilet paper, carton boxes, etc. Iron and steel Steel products Cement, cement raw materials Cement products (blocks, slates, etc.) Machine parts Agricultural machinery Grains and other feed ingredients Mixed feed, feed concentrate Textile and fabrics Garments
Other industries would also develop in the Eastern Region, linked with those in the more advanced Central region. They include the following types: 1) sales and distribution functions of San Salvador-based firms, 2) subcontractors to process imported materials into intermediate goods to be supplied to San
Salvador-based firms, 3) retail outlets of large discount stores or supermarkets, 4) supply of goods for daily needs, consumption goods and office supplies, and 5) R&D services related to agriculture and the food industry.
5.2 Promotion Strategies for Import/Export Manufacturing
Strategies for promotion of manufacturing industries that may be established in the Eastern Region induced by the La Union port are established: Model 1 industries in Subsection 5.2.1 and Model 2 industries in Subsection 5.2.2. For industries identified as promising in Subsection 5.1.2, more specific products and markets to be targeted for promotion are clarified.
5-14
5.2.1 Strategies for promotion of Model 1 industries
(1) Existing conditions and prospects
Wood products
El Salvador imports lumber from Honduras. Its quantity is small (some 40,000ton) and the import duty is nil. A small wood plant exists in San Miguel processing pine and cedar lumber imported from Honduras and Nicaragua. Other semi-finished products are also imported such as wood doors. Manufacturing of furniture is limited.
In view of high prices of imported pine and cedar lumber, the wood products industry in the Eastern Region should aim at high quality products such as furniture and medium density fiberboard rather than plywood. For fiberboard manufacturing, technology as well as machinery needs to be introduced from an advanced country.
Processed fruits and vegetables
Production of export quality fruits and vegetables is quite limited in Honduras and Nicaragua except banana. Some fruits and vegetables produced in Honduras are marketed in the Eastern Region in small quantities. The Eastern Region does not produce any processed fruits or vegetables at present.
Processing industries for fruits and vegetables based on imported raw materials will not likely be established in the Eastern Region in the foreseeable future. IQF fruits and vegetables produced in Honduras and Nicaragua may be exported from the La Union port in the medium term future once the export process is simplified to allow direct shipment of consignments without additional inspection on the Salvadoran side.
Processed cheese products
Milk is currently imported from Honduras and Costa Rica in the form of processed and packed milk, and sold at prices 5-10% higher than domestic milk. Illegal import of milk and cheese is observed particularly in the Eastern Region. The establishment of milk and dairy plants is contemplated in the Eastern Region.
Meat products
Nicaragua exports beef in large quantities, 12,634 ton to fetch US$32 million in 2002. Slaughterhouses and meat processing plants for export to the U.S. satisfy sanitation requirements. El Salvador imports Nicaraguan beef at present. The establishment of the meat products industry in the Eastern Region for export would have to conform to high quality and sanitation requirements.
5-15
(2) Strategies
These resource-based industries commonly locate in areas of raw materials production. The establishment of such industries in the Eastern Region could be justified only under certain conditions. One possible condition is to establish a processing plant based on domestic resources and expand its operation with import resources. Another possibility is to import semi-finished products after primary processing in the neighboring countries and to further process then into final products for export. In this case, high quality/high value products need to be produced. The first possibility is effectively a case of indigenous industries. The second possibility should be further pursued.
The wood product industry in the Eastern Region should pursue fiberboard manufacturing with technology and machinery to be introduced from an advanced country. It would be ideal then that products are exported to the same country. Manufacturing of processed cheese products may be based on primary processing in the neighbouring countries, but a milk and dairy plant should be established in the Eastern Region based on domestic milk initially. According to the survey on Salvadorans in the U.S. conducted as part of the Study, cheese and other dairy products are most demanded nostalgic products, consumed by over 50% of the surveyed Salvadorans. This niche market is expected to respond to the supply of diversified high quality products.
5.2.2 Strategies for promotion of Model 2 industries
(1) Existing conditions and prospects
Paper products
El Salvador produces toilet paper, carton boxes and other paper products from domestic and imported raw materials. Some products are exported mainly to neighbouring countries. The annual export of toilet paper and carton boxes reaches 36,000 ton and 28,000 ton respectively. El Salvador imports these products in smaller quantities: 7,400 ton for toilet paper and 8,300 ton for carton boxes annually. The manufacturing industry and markets for paper products are well established in Central America with division of work for different products. There exist eight manufacturers of carton boxes in El Salvador, including the second and the third largest in Central America. They have excess production capacity and face severe price competition.
As many industries establish associated with the La Union port, the demand for carton boxes will probably expand beyond the existing production capacity. The demand for toilet paper will also expand as the population increase accelerates and the number of tourists increases. Since El Salvador does not produce paper pulp, waste paper, pulp and raw materials would have to be imported.
5-16
Steel products
In El Salvador, there are three manufacturers with electronic furnaces to produce ingots and steel bars for construction. Raw materials are partly reclaimed domestically but mainly imported. El Salvador also imports 24,500 ton of steel products annually. These products are transported by land and further processed into various uses locally. Once the La Union port is established, the steel products industry may establish in the Eastern Region to process import raw materials into final products to satisfy at least the regional demand.
Cement products
Cement supply in El Salvador is dominated by CESSA, which provides training and other supports to individual cement products manufacturers. Diversified cement products are produced from the domestic cement. Also, El Salvador imports various cement products totaling 22,000 ton annually.
The La Union port may induce the establishment of a cement plant based on import raw materials in the port hinterland, and the cement products industry may expand throughout the Eastern Region. The development of the cement products industry based on import cement is less likely as cement products manufacturers may be deprived of CESSA’s support.
Agricultural machinery
Use of agricultural machinery in El Salvador is very limited, reflecting the lack of incentive to increase agricultural productivity. According to the FAO statistics, there exist 3,430 tractors and 420 combine harvesters in El Salvador as of 2001.
As marketing opportunities expand along with the Eastern Region development, including export opportunities from the La Union port as well as expansion of urban markets for fresh fruits and vegetables, incentives to increase agricultural productivity will be enhanced. This would increase the demand for irrigation and agricultural machinery as well as other production input. Since the farm holding size has become smaller as a result of the agrarian reform, the demand would be higher for small agricultural machinery, mainly small tractors. In particular, the dominant soil type in the interior valley area of the Eastern Region demands adequate agricultural machinery for plowing and other operations. Also, the undulating terrains call for small agricultural machinery.
Mixed feed and feed concentrates
The livestock sector in El Salvador is supported mainly by domestic production of feed grains (e.g., maize and sorghum) as well as grazing land for cattle. El Salvador at present imports only 15,000 ton feed annually.
As the incentive to increase agricultural productivity enhances induced by the La Union port
5-17
and the Eastern Region development, more land would be converted from pasture and maize/sorghum cultivation to cultivation of high value crops partly under irrigation. Increased feed grains and other feed ingredients would need to be imported to compensate for reduced domestic feed supply.
Another possibility is the establishment of fishmeal plants by using currently unused fish wastes. Supply of fish wastes will increase as the ongoing and planned fish processing expands. Complementary development of poultry farming and fishmeal manufacturing is conceived.
Other industries
Various consumer goods will be imported increasingly through the La Union port for distribution in the Eastern Region and partly in other regions and possibly to some limited extent in neighboring countries as well. Some consumer goods, typically bulky ones or large volume-small value goods, may start to be produced in the Eastern Region with import raw materials or intermediate goods. An example is the manufacturing of common plastic products from synthetic resins to be imported. Also, some assembly operations of bulky durable goods may be established in the Region, based on import of parts through the La Union port. Examples include refrigerator, motorcycle and some industrial machinery that have a relatively small number of parts.
(2) Strategies
These industries import raw materials mainly from the La Union port and produce for both the domestic market and the regional market of neighbouring countries. Most of then are expected to locate close to the port area. The demand for these industries would be supported by accelerated population increase and urbanization. To support the development of these industries, logistic functions related to the La Union port should be fully developed, and related transport infrastructure improved to facilitate the distribution of their products.
These industries would not locate in free zones since their target markets are mainly domestic and partly regional. As they would benefit from logistic functions of the port, however, an industrial area should be established in the port hinterland to encourage the location of these industries.
Those industries suggested above under “other industries” would not need to locate near the port. It is easier to transport the raw materials and intermediate goods to be imported through the La Union port by land than their products. Therefore, they would locate closer to major demand centers. An inland industrial estate should be established at a nodal point of the transport network to facilitate their location.
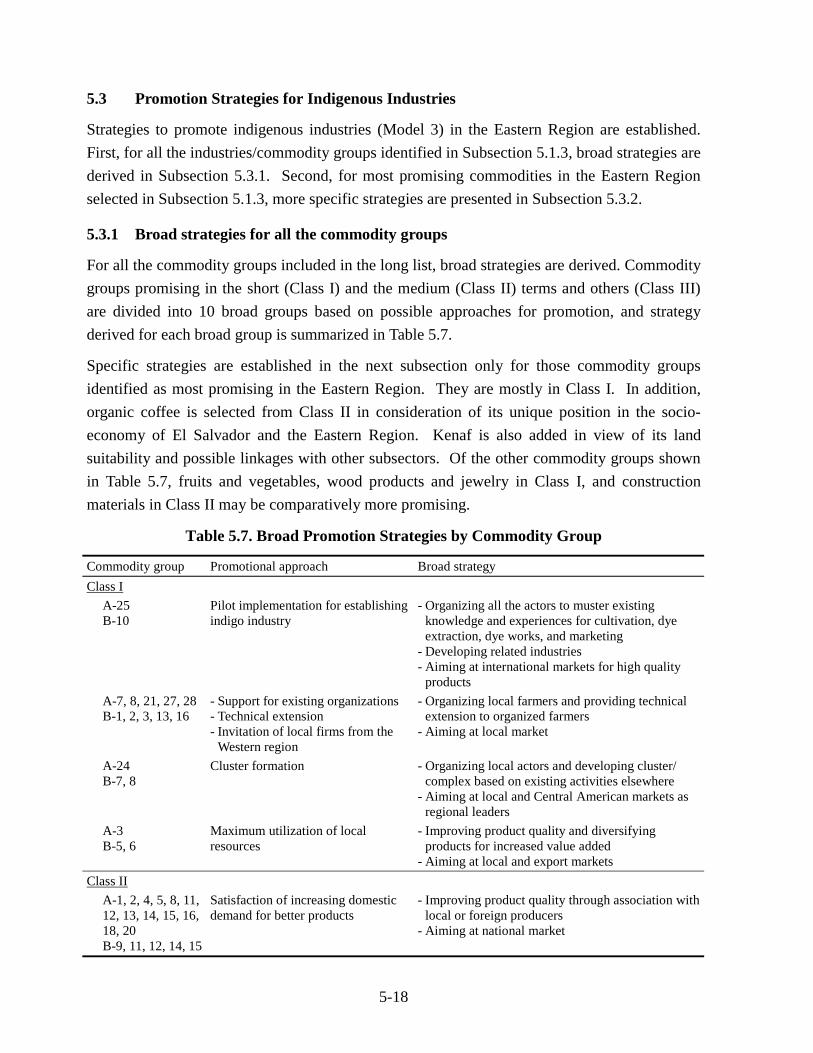
5-18
5.3 Promotion Strategies for Indigenous Industries
Strategies to promote indigenous industries (Model 3) in the Eastern Region are established. First, for all the industries/commodity groups identified in Subsection 5.1.3, broad strategies are derived in Subsection 5.3.1. Second, for most promising commodities in the Eastern Region selected in Subsection 5.1.3, more specific strategies are presented in Subsection 5.3.2.
5.3.1 Broad strategies for all the commodity groups
For all the commodity groups included in the long list, broad strategies are derived. Commodity groups promising in the short (Class I) and the medium (Class II) terms and others (Class III) are divided into 10 broad groups based on possible approaches for promotion, and strategy derived for each broad group is summarized in Table 5.7.
Specific strategies are established in the next subsection only for those commodity groups identified as most promising in the Eastern Region. They are mostly in Class I. In addition, organic coffee is selected from Class II in consideration of its unique position in the socio-economy of El Salvador and the Eastern Region. Kenaf is also added in view of its land suitability and possible linkages with other subsectors. Of the other commodity groups shown in Table 5.7, fruits and vegetables, wood products and jewelry in Class I, and construction materials in Class II may be comparatively more promising.
Table 5.7. Broad Promotion Strategies by Commodity Group
Commodity group Promotional approach Broad strategy Class I
A-25 B-10
Pilot implementation for establishing indigo industry
- Organizing all the actors to muster existing knowledge and experiences for cultivation, dye extraction, dye works, and marketing
- Developing related industries - Aiming at international markets for high quality
products A-7, 8, 21, 27, 28 B-1, 2, 3, 13, 16
- Support for existing organizations - Technical extension - Invitation of local firms from the
Western region
- Organizing local farmers and providing technical extension to organized farmers
- Aiming at local market
A-24 B-7, 8
Cluster formation - Organizing local actors and developing cluster/ complex based on existing activities elsewhere
- Aiming at local and Central American markets as regional leaders
A-3 B-5, 6
Maximum utilization of local resources
- Improving product quality and diversifying products for increased value added
- Aiming at local and export markets Class II
A-1, 2, 4, 5, 8, 11, 12, 13, 14, 15, 16, 18, 20 B-9, 11, 12, 14, 15
Satisfaction of increasing domestic demand for better products
- Improving product quality through association with local or foreign producers
- Aiming at national market
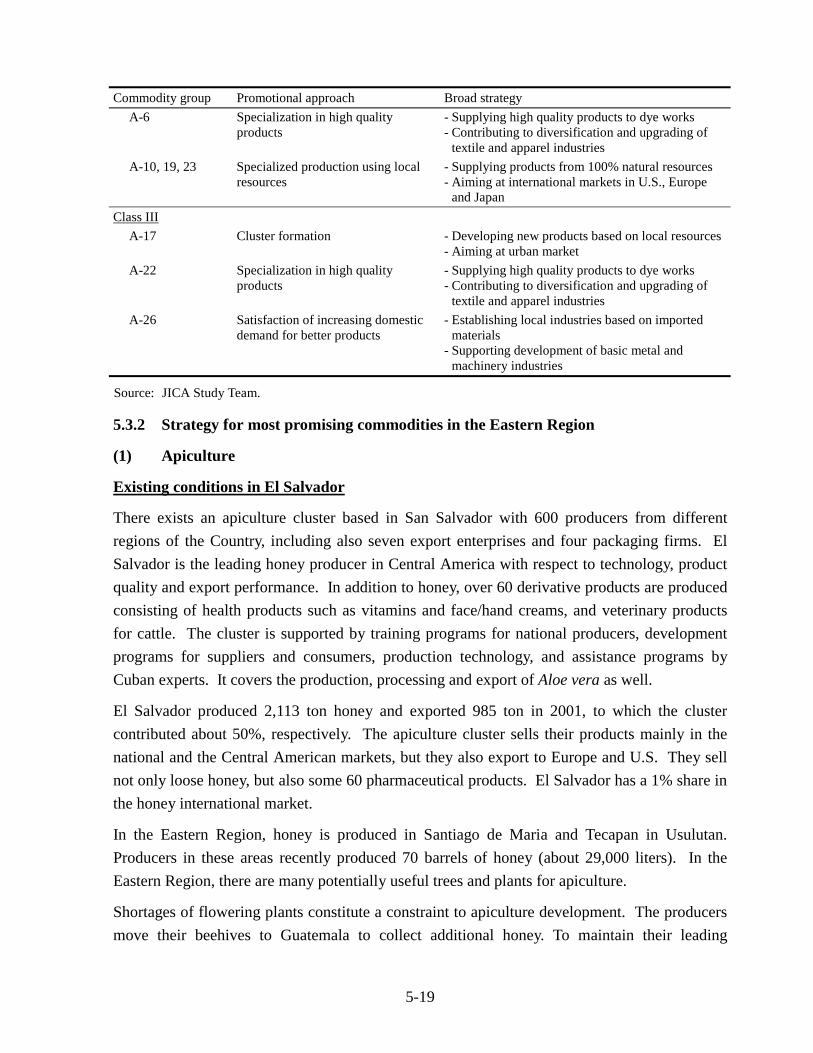
5-19
Commodity group Promotional approach Broad strategy A-6 Specialization in high quality
products - Supplying high quality products to dye works - Contributing to diversification and upgrading of
textile and apparel industries A-10, 19, 23 Specialized production using local
resources - Supplying products from 100% natural resources - Aiming at international markets in U.S., Europe
and Japan Class III
A-17 Cluster formation - Developing new products based on local resources - Aiming at urban market
A-22 Specialization in high quality products
- Supplying high quality products to dye works - Contributing to diversification and upgrading of
textile and apparel industries A-26 Satisfaction of increasing domestic
demand for better products - Establishing local industries based on imported
materials - Supporting development of basic metal and
machinery industries
Source: JICA Study Team.
5.3.2 Strategy for most promising commodities in the Eastern Region
(1) Apiculture
Existing conditions in El Salvador
There exists an apiculture cluster based in San Salvador with 600 producers from different regions of the Country, including also seven export enterprises and four packaging firms. El Salvador is the leading honey producer in Central America with respect to technology, product quality and export performance. In addition to honey, over 60 derivative products are produced consisting of health products such as vitamins and face/hand creams, and veterinary products for cattle. The cluster is supported by training programs for national producers, development programs for suppliers and consumers, production technology, and assistance programs by Cuban experts. It covers the production, processing and export of Aloe vera as well.
El Salvador produced 2,113 ton honey and exported 985 ton in 2001, to which the cluster contributed about 50%, respectively. The apiculture cluster sells their products mainly in the national and the Central American markets, but they also export to Europe and U.S. They sell not only loose honey, but also some 60 pharmaceutical products. El Salvador has a 1% share in the honey international market.
In the Eastern Region, honey is produced in Santiago de Maria and Tecapan in Usulutan. Producers in these areas recently produced 70 barrels of honey (about 29,000 liters). In the Eastern Region, there are many potentially useful trees and plants for apiculture.
Shortages of flowering plants constitute a constraint to apiculture development. The producers move their beehives to Guatemala to collect additional honey. To maintain their leading
5-20
position in Central America continued technological development is expected to ensure the quality and the variety of honey and derivative products. The cluster expects to develop export markets, particularly in Japan and Europe.
International market situations
The world honey production is increasing only slowly: 960,000 ton in 1991 to 1,263,000 ton in 2001 at the average annual rate of 2.8% (APISERVICES website). Large producers are China (156,000 ton in 2001), former USSR (125,000 ton), the U.S. (100,000 ton), EU (11,000 ton), Argentina (90,000 ton), Turkey (71,000 ton), and Mexico (56,000 ton). The world total export of honey was 375,000 ton in 2000 or 30% of the total production. The average export price has been consistently decreasing, from US$1,724 ton in 1996 to US$1,176/ton in 2000, reflecting increasing competition. The average export price is the lowest for China at US$845/ton and for Argentina at US$989/ton, followed by US$1,129/ton for Mexico.
Import and export prices of honey vary depending on seasons. Import prices for Germany, importing 80,000-90,000 ton honey annually in recent years, varied from US$0.49/lb (June) to 0.78/lb (December) in 2001. Import prices for the U.S., importing over 40,000 ton honey since 1991, varied from US$0.45/lb (February-April) to 0.62/lb (December) in 2001. Export price for China averaged US$0.46/lb in December 2002, and that for Mexico was US$0.54/lb in the first half and US$0.59/lb in the second half of 2001. CIF prices at European ports averaged US$1,200/ton or US$0.54/lb in 2000.
Position of El Salvador
Both production and export of honey in El Salvador has only small shares in the respective world total. El Salvador, however, has competitive advantage for honey production over the major producers in Latin America, Argentina and Mexico. The unit cost of production per beehive is reported to be US$26.5 in El Salvador, US$49.7 in Mexico, and US$51.3 in Argentina (CONAPIS). The average sales price of honey in El Salvador was US$1,160.5/ton or US$0.53/lb, comparable to the average export price in the international market. This means the profit margin is much larger for Salvadoran honey.
Strategy
1) Marketing strategy
Global competition is fierce in the honey industry. Though the Salvadoran honey industry might compete in the international market because of the quality of its products and the low production costs, it ought to pursue its own niche market. Argentina and Mexico, major competitors in Latin America, export their products in bulk mainly to the U.S., Germany and other remote markets. El Salvador should specialize in high quality products packaged for export to neighboring countries.
5-21
The world largest honey producer, China, exports its products all over the world. In Latin America, China exported 1,029 ton of honey to Mexico for the FOB price at US$0.36/lb and 20 ton of honey to Panama for the FOB price at US$0.37/lb in 2002. The FOB price for export to the U.S. was US$0.48/lb in 2002. At much higher production costs than El Salvador, Argentina can competitively export to the U.S. market. El Salvador could be more competitive than Argentina in the U.S. market, and even more so in neighboring countries.
Another strength of the Salvadoran honey industry is its ability to produce many derivative products. Neighboring countries currently importing these products from Germany, the U.S. and other advanced countries are large potential markets for Salvadoran honey derivatives, including propolis.
2) Promotion strategy for the Eastern Region
i) Organizing suppliers in the Eastern Region to receive training from the existing cluster;
ii) Developing local sales outlet for stable operation and adequate profits to allow expansion of production and diversification of products;
iii) Exchanging information with local farmers planning to expand horticultural and fruit production and establishing long-lasting relationships for complementary development; and
iv) Aiming at establishing full scale processing facilities in the Eastern Region to strengthen the cluster as the leader in Central America.
(2) Cashew
Existing conditions in El Salvador
At present, over 5,000mz is cultivated with cashew and its annual production at 55,000qq. Of this total area, some 1,500mz are devoted to organic cashew. SAMO (Agroindustrial System of Organic Cashew) in the low Lempa area of San Vicente is an NGO that has 300mz land cultivated with organic cashew. It has its own processing plant and it has been exporting shelled cashew to Europe for five years. Ex-factory prices average US$2.50/lb, while international market prices range in US$2.55-3.27/lb. Their organic cashew is certified every year by BCS of Germany. SAMO staff are trained also in processing cashew apple into juice, honey, vinegar, wine, etc.
In the Eastern Region, a cooperative of Coralama in La Union has 1,130mz cultivated with organic cashew. Due to financial difficulties, its production is low and processing machinery is in bad conditions. They sold 3,336 ton of unprocessed cashew nuts in 2002 at US$675/ton. FOB price at Acajutla was US$750/ton for export to India. There are other plantations in the Region such as Gualica (Delirio area), Chilanguera, Maquigue, San Carlos Lempa, Moncagua, Isla Tazajera, and San Juan del Gozo.
5-22
Non-organic cashew is cultivated in 3,500mz. The cashew producers’ cooperative society with five member cooperatives of San Ramón, Chilanguera, Maquigua, El Platanar and Gualnea and four companies own 1,100ha supported by Canada, and the rest is planted with Brazilian trees younger than two years. The society exports to Canada through an intermediary in Guatemala without processing. The total cashew export was 583MT in 2000 for US$755,502, of which 71% was shipped to India.
Most agricultural land in El Salvador is suited to cashew cultivation. Cashew can grow successfully even in slightly saline soil along the coast. SAMO has cultivated 100mz in the coastal area of Usulutan. They plan to sell small grafted cashew trees at US$1 per tree to promote the organic cashew cultivation throughout the Country. SAMO exported 12.5ton of cashew to Europe to gain US$100,148 in 2001, and 9.5ton to rake in US$82,280 in 2002. A Japanese trading company purchases unprocessed nuts from the Coralama cooperative for processing in India and marketing in Japan.
Cashew production technology with organic fertilizer application is well established in El Salvador. Technology for processing cashew apple is also available. SAMO staff have been trained for the production of 10 cashew apple derivatives.
International market situations
The world production of cashew nuts was 1.2 million ton in 1999, of which 324,000 ton or 27% was traded (MAG FRUTALES). Major importing countries are India, the U.S., Netherlands, U.K., Germany, Japan and France (Table 5.8). The average import prices are the highest in Spain (US$2.99/lb in 1999) and Japan (US$2.92/lb), followed by Israel, U.K., Netherlands and the U.S. They are generally lower in developing countries and the lowest in India (US$0.43/lb).
The largest cashew producer is India with a 36.6% share of the world production in 1999, followed by Nigeria (14.6%), Brazil (12.8%), Tanzania (8.9%), Indonesia (5.74%), and Vietnam (3.4%), as presented in Table 5.9. Yields vary widely among producing countries. Of the major producers, Nigeria at 0.63 ton/ha and India at 0.61 ton/ha have the highest yields, and yields are much lower in Brazil (0.26 ton/ha), Indonesia (0.29 ton/ha), and Vietnam (0.22 ton/ha).
Position of El Salvador
El Salvador exported 583,202 kg of cashew in 2000 to obtain US$755,502 at the average price of US$0.58/lb. India was the most important trade partner sharing 71% of the total export amount from El Salvador. The average export price to India, however, was only US$0.37/lb, much lower than the average export price of US$2.44/lb to the U.S., the second most important partner. The average yield of cashew is more or less 0.7 ton/ha in El Salvador.
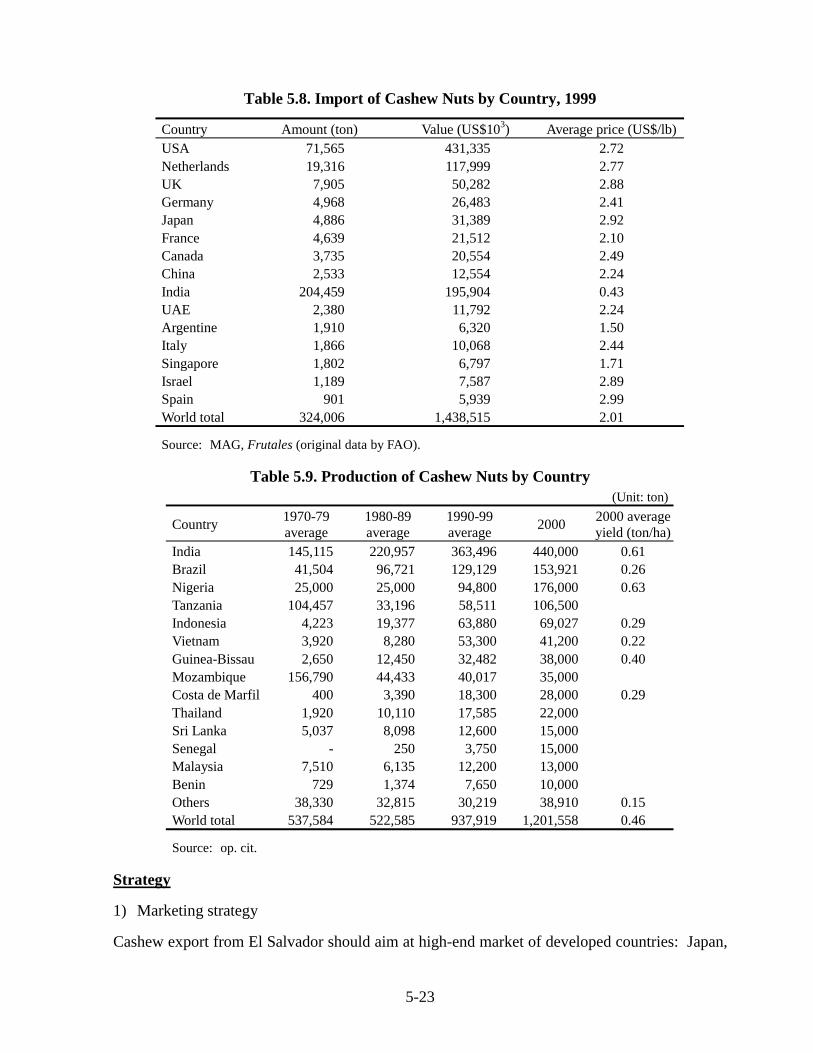
5-23
Table 5.8. Import of Cashew Nuts by Country, 1999
Country Amount (ton) Value (US$103) Average price (US$/lb) USA 71,565 431,335 2.72 Netherlands 19,316 117,999 2.77 UK 7,905 50,282 2.88 Germany 4,968 26,483 2.41 Japan 4,886 31,389 2.92 France 4,639 21,512 2.10 Canada 3,735 20,554 2.49 China 2,533 12,554 2.24 India 204,459 195,904 0.43 UAE 2,380 11,792 2.24 Argentine 1,910 6,320 1.50 Italy 1,866 10,068 2.44 Singapore 1,802 6,797 1.71 Israel 1,189 7,587 2.89 Spain 901 5,939 2.99 World total 324,006 1,438,515 2.01
Source: MAG, Frutales (original data by FAO).
Table 5.9. Production of Cashew Nuts by Country (Unit: ton)
Country 1970-79 average
1980-89 average
1990-99 average 2000 2000 average
yield (ton/ha) India 145,115 220,957 363,496 440,000 0.61 Brazil 41,504 96,721 129,129 153,921 0.26 Nigeria 25,000 25,000 94,800 176,000 0.63 Tanzania 104,457 33,196 58,511 106,500 Indonesia 4,223 19,377 63,880 69,027 0.29 Vietnam 3,920 8,280 53,300 41,200 0.22 Guinea-Bissau 2,650 12,450 32,482 38,000 0.40 Mozambique 156,790 44,433 40,017 35,000 Costa de Marfil 400 3,390 18,300 28,000 0.29 Thailand 1,920 10,110 17,585 22,000 Sri Lanka 5,037 8,098 12,600 15,000 Senegal - 250 3,750 15,000 Malaysia 7,510 6,135 12,200 13,000 Benin 729 1,374 7,650 10,000 Others 38,330 32,815 30,219 38,910 0.15 World total 537,584 522,585 937,919 1,201,558 0.46
Source: op. cit.
Strategy
1) Marketing strategy
Cashew export from El Salvador should aim at high-end market of developed countries: Japan,
5-24
the U.S. and E.U., in view of high quality cashew produced in El Salvador and the Eastern Region. Particularly, Japan is the most promising market. The per capita import of quality cashew in Japan is only one-eighth of that in the U.S. Major competitors are India, Indonesia and Vietnam, but El Salvador has an advantage of higher yields, and thus lower production costs, about three times as high as the yields in Indonesia and Vietnam. A good portion of cashew imported by Japan from India is cashew exported from El Salvador and processed in India. By producing high quality cashew, El Salvador can export directly to Japan.
In particular, organic cashew production should be pursued aiming at the Japanese market. At present, with 1,500 m2 devoted to organic cashew, some 700 ton can be produced. Expansion of area for organic cashew would be fully justified even for the export market to Japan alone.
2) Promotion strategy for the Eastern Region
i) Promoting organic cashew aiming at export market to take full advantage of high quality cashew produced in El Salvador and the Eastern Region;
ii) Supporting expansion of cashew planting and production through revival of old trees by grafting (for about 1,000mz), and producing and distributing saplings (at present for ¢1.00/tree) to farmers; and
iii) Expanding processing capacity through utilizing existing idle plant and investing in new facilities.
(3) Organic coffee
Existing conditions in El Salvador
Cooperatives of Las Marias, San Mauricio and UPREX in Usulutan produce organic coffee. They expect to produce 2,500-3,000qq in 2002-2003, and 5,000qq in 2003-2004. Their organic coffee is certified for international marketing by OCIA of the U.S. and BCS of Germany. ADEL Morazan has a financing system to support the cultivation of organic coffee. Organic coffee production is still a small industry in El Salvador. The Ciudad de Barrios cooperative also produced organic coffee in 2002/03 for 17,900qq out of the total coffee production of 89,500qq.
The cooperatives in Usulutan export their organic coffee to Germany, Japan and the U.S. through UCRAPROBEX. They have developed their own brand “Monte Nuevo.” They intend to expand their market both domestically and internationally for specialized and gourmet coffee. They have integrated their production, grinding, packaging, and marketing, but for exporting they depend on the intermediary. They may be vulnerable to competition with large producers that dominate the coffee market.
The total export value of coffee was US$119 million in 2001. International coffee prices declined from US$185/qq in 1997 to US$85/qq in 2000. Consequently, the unit price paid to
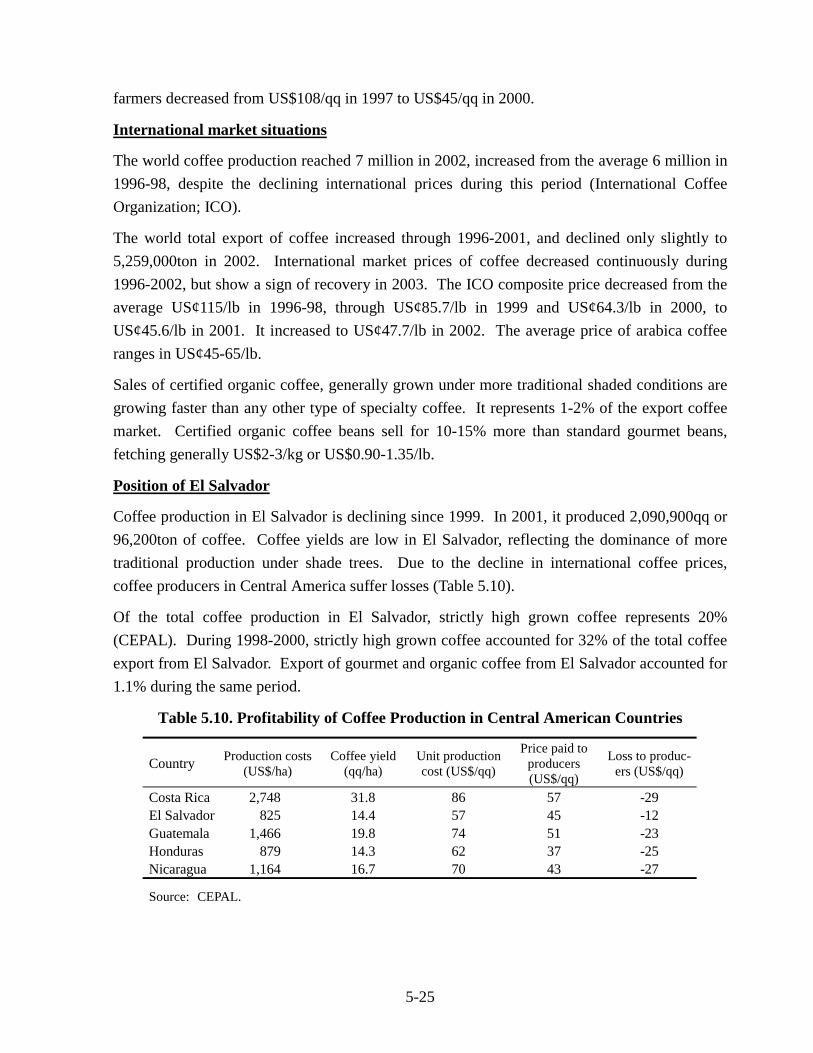
5-25
farmers decreased from US$108/qq in 1997 to US$45/qq in 2000.
International market situations
The world coffee production reached 7 million in 2002, increased from the average 6 million in 1996-98, despite the declining international prices during this period (International Coffee Organization; ICO).
The world total export of coffee increased through 1996-2001, and declined only slightly to 5,259,000ton in 2002. International market prices of coffee decreased continuously during 1996-2002, but show a sign of recovery in 2003. The ICO composite price decreased from the average US¢115/lb in 1996-98, through US¢85.7/lb in 1999 and US¢64.3/lb in 2000, to US¢45.6/lb in 2001. It increased to US¢47.7/lb in 2002. The average price of arabica coffee ranges in US¢45-65/lb.
Sales of certified organic coffee, generally grown under more traditional shaded conditions are growing faster than any other type of specialty coffee. It represents 1-2% of the export coffee market. Certified organic coffee beans sell for 10-15% more than standard gourmet beans, fetching generally US$2-3/kg or US$0.90-1.35/lb.
Position of El Salvador
Coffee production in El Salvador is declining since 1999. In 2001, it produced 2,090,900qq or 96,200ton of coffee. Coffee yields are low in El Salvador, reflecting the dominance of more traditional production under shade trees. Due to the decline in international coffee prices, coffee producers in Central America suffer losses (Table 5.10).
Of the total coffee production in El Salvador, strictly high grown coffee represents 20% (CEPAL). During 1998-2000, strictly high grown coffee accounted for 32% of the total coffee export from El Salvador. Export of gourmet and organic coffee from El Salvador accounted for 1.1% during the same period.
Table 5.10. Profitability of Coffee Production in Central American Countries
Country Production costs (US$/ha)
Coffee yield (qq/ha)
Unit production cost (US$/qq)
Price paid to producers (US$/qq)
Loss to produc-ers (US$/qq)
Costa Rica 2,748 31.8 86 57 -29 El Salvador 825 14.4 57 45 -12 Guatemala 1,466 19.8 74 51 -23 Honduras 879 14.3 62 37 -25 Nicaragua 1,164 16.7 70 43 -27
Source: CEPAL.
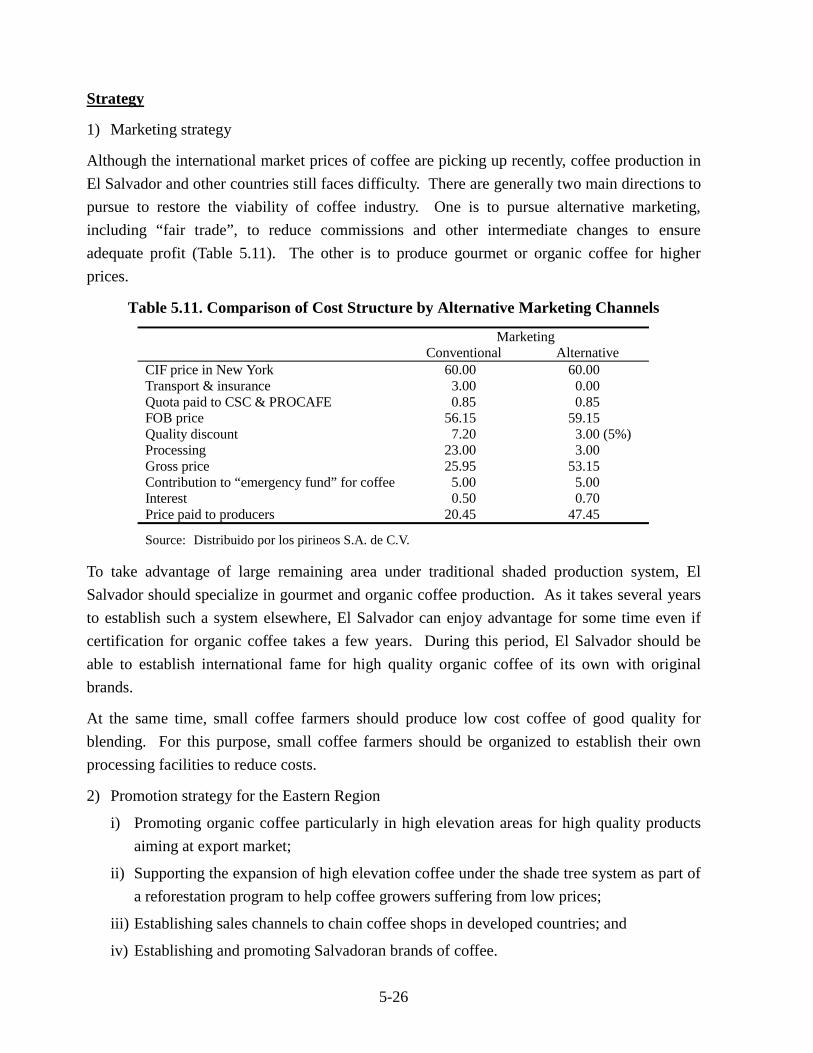
5-26
Strategy
1) Marketing strategy
Although the international market prices of coffee are picking up recently, coffee production in El Salvador and other countries still faces difficulty. There are generally two main directions to pursue to restore the viability of coffee industry. One is to pursue alternative marketing, including “fair trade”, to reduce commissions and other intermediate changes to ensure adequate profit (Table 5.11). The other is to produce gourmet or organic coffee for higher prices.
Table 5.11. Comparison of Cost Structure by Alternative Marketing Channels
Marketing Conventional Alternative CIF price in New York 60.00 60.00 Transport & insurance 3.00 0.00 Quota paid to CSC & PROCAFE 0.85 0.85 FOB price 56.15 59.15 Quality discount 7.20 3.00 (5%) Processing 23.00 3.00 Gross price 25.95 53.15 Contribution to “emergency fund” for coffee 5.00 5.00 Interest 0.50 0.70 Price paid to producers 20.45 47.45
Source: Distribuido por los pirineos S.A. de C.V.
To take advantage of large remaining area under traditional shaded production system, El Salvador should specialize in gourmet and organic coffee production. As it takes several years to establish such a system elsewhere, El Salvador can enjoy advantage for some time even if certification for organic coffee takes a few years. During this period, El Salvador should be able to establish international fame for high quality organic coffee of its own with original brands.
At the same time, small coffee farmers should produce low cost coffee of good quality for blending. For this purpose, small coffee farmers should be organized to establish their own processing facilities to reduce costs.
2) Promotion strategy for the Eastern Region
i) Promoting organic coffee particularly in high elevation areas for high quality products aiming at export market;
ii) Supporting the expansion of high elevation coffee under the shade tree system as part of a reforestation program to help coffee growers suffering from low prices;
iii) Establishing sales channels to chain coffee shops in developed countries; and
iv) Establishing and promoting Salvadoran brands of coffee.
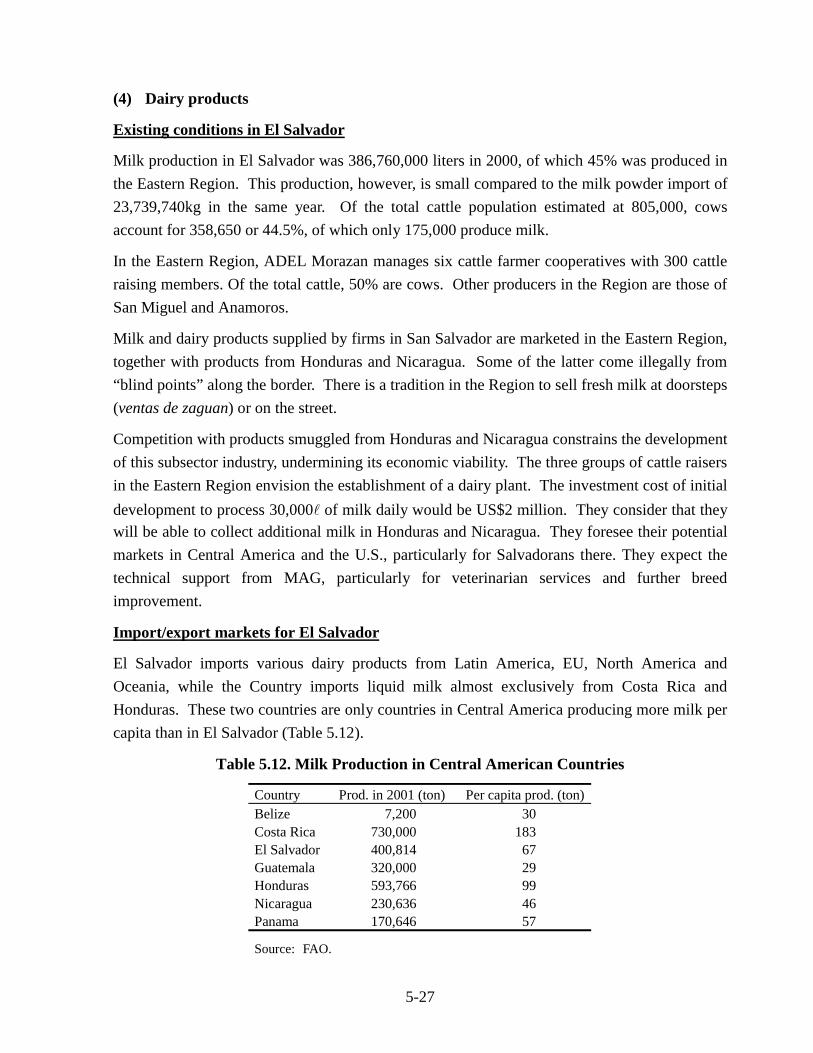
5-27
(4) Dairy products
Existing conditions in El Salvador
Milk production in El Salvador was 386,760,000 liters in 2000, of which 45% was produced in the Eastern Region. This production, however, is small compared to the milk powder import of 23,739,740kg in the same year. Of the total cattle population estimated at 805,000, cows account for 358,650 or 44.5%, of which only 175,000 produce milk.
In the Eastern Region, ADEL Morazan manages six cattle farmer cooperatives with 300 cattle raising members. Of the total cattle, 50% are cows. Other producers in the Region are those of San Miguel and Anamoros.
Milk and dairy products supplied by firms in San Salvador are marketed in the Eastern Region, together with products from Honduras and Nicaragua. Some of the latter come illegally from “blind points” along the border. There is a tradition in the Region to sell fresh milk at doorsteps (ventas de zaguan) or on the street.
Competition with products smuggled from Honduras and Nicaragua constrains the development of this subsector industry, undermining its economic viability. The three groups of cattle raisers in the Eastern Region envision the establishment of a dairy plant. The investment cost of initial development to process 30,000l of milk daily would be US$2 million. They consider that they will be able to collect additional milk in Honduras and Nicaragua. They foresee their potential markets in Central America and the U.S., particularly for Salvadorans there. They expect the technical support from MAG, particularly for veterinarian services and further breed improvement.
Import/export markets for El Salvador
El Salvador imports various dairy products from Latin America, EU, North America and Oceania, while the Country imports liquid milk almost exclusively from Costa Rica and Honduras. These two countries are only countries in Central America producing more milk per capita than in El Salvador (Table 5.12).
Table 5.12. Milk Production in Central American Countries
Country Prod. in 2001 (ton) Per capita prod. (ton) Belize 7,200 30 Costa Rica 730,000 183 El Salvador 400,814 67 Guatemala 320,000 29 Honduras 593,766 99 Nicaragua 230,636 46 Panama 170,646 57
Source: FAO.
5-28
El Salvador imported 8,058ton of cheese and its products in 2001, paying US$23.1 million, at the average import price of US$2.87/kg. The average import prices vary widely among supplier countries. It is by far the highest for Switzerland at US$7.07/kg, followed by Spain at US$5.85/kg and Denmark at US$4.91/kg. The average import prices from neighbouring countries range from US$3.49/kg for Panama and US$3.19/kg for Guatemala to US$1.97/kg for Costa Rica. Import prices from Honduras and Nicaragua, respectively US$2.52/kg and US$2.70/kg, are comparable to the average retail price in the domestic market.
Comparative prices of cheese and its products for import from Honduras and Nicaragua and in the domestic market indicate that the dairy industry in El Salvador under protection by high tariffs has price competitiveness against these countries in the domestic market. According to MAG, dairy farmers in El Salvador receive on the average US$0.25/l for their milk, the largest in Central America.
Strategy
1) Marketing strategy
The competitive advantage in the domestic market of the dairy industry in El Salvador has been undermined by dairy products imported illegally from Honduras and Nicaragua, and the Eastern Region, the main dairy region in the Country, suffers the most from this situation. As the import tariff would be reduced in line with the CAFTA, dairy production costs need to be reduced by enhancing productivity and reducing production costs, mainly of feed. At the same time, high quality products should be produced for export aiming at niche markets. In particular, overseas Salvadorans communities especially in the western coast of the U.S. constitute the most promising market. For processed cheese products, price variance could be very large as manifested by cheese import prices from different countries.
2) Promotion strategy for the Eastern Region
i) Organizing dairy framers and integrating them with other related farmers and organizations, including grains producers and importers, feed traders, veterinary services providers, disease control and insemination facilities;
ii) Establishing a dairy plant for cheese through a joint venture with foreign investor aiming at export market, including overseas Salvadorans; and
iii) Promoting milk supply to students with a government subsidy to improve nutrition, to give students an incentive to pursue education, and to boost dairy farming.
(5) Sugar and its derivatives
Existing conditions in El Salvador
El Salvador is the second largest producer of sugar in Central America although far behind the
5-29
top producer, Guatemala. El Salvador exports 22% of its sugar production mainly to the U.S. under the quota system, while Guatemala exports 40% of its production. The Salvadoran export declined significantly since its peak in 1982/83. The Salvadoran sugar export contributed to the income of US$44 million in 2002. Despite the recent decline, the sugar industry contributes to 1.4% of the total employment, including sugarcane producers and managers, employees in processing industries, and those involved in the transport of cane and sugar, and 2.7% of the total value-added in the Country.
In 2001/02, the total sugar production was 492,873 ton by 10 sugar plants, consisting of 60% raw sugar and 40% refined sugar. The total production of molasses was 153.9 million liters in 2001/02. Molasses is used to produce liquor (29.6 million liters) such as vodka and rums and also ethanol (25.8 million liters).
In the Eastern Region, there is only one sugar mill in San Miguel. A cooperative at La Carrera cultivates sugarcane for 1,730mz.
International market situations
The world sugar production is increasing only slowly: from 115 million ton in 1992 to 143 million ton in 2003 at the average annual rate of 2.2% (FAO). Production is becoming more concentrated among countries, and by 2001 the top 10 producers accounted for 70% of the total production. International trade in sugar and its products has contracted recently. This is due to increased production in countries where sugar export is heavily subsidized, discouraging other exporters. The proportion of production exported has also declined. Export value decreased from US$9.8 billion in 1980 to US$6.4 billion in 2001.
Sugar markets are significantly distorted due to government intervention of several producing and importing countries. Domestic market prices are higher than US$0.50/kg in EU and higher than US$0.40/kg in the U.S., while the international market price fluctuates around US$0.20/kg since 1990. As sugar trade distortions are reduced slowly under the free trade regime, only most efficient, low-cost sugarcane producers will increase their export such as Brazil, Guatemala and Colombia.
Position of El Salvador
Although El Salvador is the second largest producer of sugar in Central America, the production quantity and export are insignificant even in the Latin American context. Its sugar exports is mainly to the U.S. under the quota system, and no significant expansion is expected. As the distortions in sugar markets are reduced under free trade agreement, El Salvador can probably maintain its export market. Production of sugar byproducts would help to maintain the overall competitiveness of the sugar industry in El Salvador.
5-30
Strategy
1) Marketing strategy
Under the presently distorted and highly uncertain market conditions, the sugar industry in El Salvador needs to be made more robust to changing conditions. Together with the modernization of sugar manufacturing for more efficient, low-cost production, processing of molasses and bagasse should be further increased. Processed goods such as liquor and ethanol from molasses would be marketed domestically or at most in the Central American market. Bagasse may be supplied to domestic processors for power generation and possibly non-tree paper manufacturing in the future.
2) Promotion strategy for the Eastern Region
i) Modernizing the existing sugar factory in the Eastern Region to increase sugar yield and to improve the quality;
ii) Conducting a pre-feasibility study for complete cycle processing of sugarcane to fully utilize processing opportunities for sugar into confectionary, molasses into liquor and ethanol, and bagasse; and
iii) Developing confectionary products aiming at domestic and Central American markets.
(6) Poultry
Existing conditions in El Salvador
Of the poultry population in El Salvador, some 3.85 million are domestic birds (chicken, turkey, duck, hen, and cock) and 12.82 million commercial birds as of 1999 (MAG). Some 1,000 companies/producers participate in the aviculture association of El Salvador (AVES), of which over 85% are small and microproducers. Chicken meat production increased rapidly from 33,000 ton in 1990 to 48,000 ton in 1998 and 73,000 ton in 2001. The supply of eggs in El Salvador is abundant, and many are exported to Honduras. The domestic production of eggs was over 1.1 billion in 2001.
There are nine major commercial producers specialized in chicken, eggs, powder bred chicken, and sausages. A few of them have dominant market shares. Pasteurized eggs are distributed to the national market and also exported across Central America. Large producers have their own system of production, processing and sales and undertake sales directly using their trucks. They are also linked to major restaurant chains. The aviculture industry concentrates in the Western region for the ease of import feed transportation from Acajutla.
Import/export markets in Central America
According to FEDAVICAC, Central American countries, with the chicken population of 17.6 million, produced 338,000 ton of chicken meat and 4.9 million eggs in 1998 (Table 5.13). The
5-31
share of Central America in the world’s chicken meat production is less than 1%. Between 1996 and 1998, Central American countries imported processed products of chicken meat worth a total of US$51.7 million and eggs worth US$26.3 million (Table 5.14). Guatemala is the largest importer of chicken meat products, followed by Honduras. Honduras is also the largest importer of eggs, while El Salvador is a net exporter of eggs exporting mainly to Honduras. El Salvador also exports chicken meat products mainly to Guatemala and Honduras. The total export value of Salvadoran aviculture products fluctuates in recent years; it increased from US$9.9 million in 1996 to US$17.5 million in 1998, decreased in 1999, reached a peak of US$20.7 million in 2000, and decreased to US$11.4 million in 2001 (SIECA and MAG).
Table 5.13. Chicken Meat Production in Central America and Major Producers (Unit: 103ton) El Salvador Costa Rica Guatemala Honduras Nicaragua Panama Subtotal Mexico USA Brazil China
1990 33 43 67 28 7 25 203 750 8,667 2,356 2,583 Share (%) 0.1 0.1 0.2 0.1 0.0 0.1 0.6 2.1 24.5 6.7 7.3
1998 48 80 120 54 36 48 386 1,558 12,724 4,490 7,700 Share (%) 0.1 0.2 0.2 0.1 0.1 0.1 1.0 3.0 24.8 8.8 15.1
Sources: MAG, INCAE (Costa Rica) and FEDAVICAC.
Table 5.14. Import of Chicken Meat Products and Eggs by Central American Countries
(1) Chicken meat products (Unit: US$106) Products El Salvador Costa Rica Guatemala Honduras Nicaragua Total Meat entrails 1.9 0.4 22.8 9.7 2.8 37. 6 Frozen chicken 0.2 0.0 2.1 0.4 0.2 2.9 Chicken breast 0.1 - 1.5 0.0 - 1.6 Others 3.3 - 2.4 2.7 1.2 9.6
Total 5.5 0.4 28.8 12.8 4.2 51.7
(2) Eggs To
From El Salvador Costa Rica Guatemala Honduras Nicaragua Total
El Salvador - 0.3 0.3 20.7 0.6 21.9 Costa Rica 0.5 - 0.0 - 0.7 1.2 Guatemala 1.3 0.3 - 1.0 - 2.7 Honduras 0.1 - - - 0.2 0.3 Nicaragua - - - 0.2 - 0.2 USA 1.0 2.1 0.9 1.8 10.9 16.8
Total 3.7 3.1 1.5 24.3 14.5 47.0 Panama 0.7 0.3 0.0 0.5 1.9 3.5 Others 0.1 0.0 0.2 0.0 0.2 0.5
Sources: SIECA and MAG.
Cost performance of aviculture in El Salvador
The structure of production costs for aviculture is compared between El Salvador and main producing countries (Table 5.15). A very large share of feed cost characterizes the cost
5-32
structure of aviculture in El Salvador. Other costs in El Salvador are comparable to those in most efficient producers such as the U.S., Brazil and China. The total production cost is US¢47.5/lb in El Salvador, significantly higher than US¢23.0/lb in Brazil, US¢25.7/lb in the U.S., and US¢34.2/lb in China. The average retail price is US¢69.7/lb in El Salvador with much smaller profit margin than in these three countries.
Table 5.15. Comparison of Aviculture Production Costs (Units: US¢/lb)
Cost element USA Brazil China El Salvador Netherlands Japan Russia Feeds 16.0 13.6 26.2 38.2 30.3 43.0 58.6 Chicken starters 3.8 6.4 2.0 4.9 9.3 12.4 8.4 Manpower 3.6 2.0 1.0 2.4 4.1 4.3 3.3 Others 2.3 1.0 5.0 2.0 5.2 21.0 13.4 Total cost 25.7 23.0 34.2 47.5 48.9 80.7 83.7 Retail price 55.8 42.6 60.3 69.7 88.0 147.9 120.2
Source: MAG.
Strategy
1) Marketing strategy
The aviculture industry in El Salvador has competitive advantage in the Central American market as manifested by the export performance in recent years. It suffers, however, from high feed costs. In fact, if the feed costs become comparable to those in most efficient producers of the U.S. and Brazil, the Salvadoran aviculture may be competitive in the larger international market. With the CAFTA, the aviculture in El Salvador would face severe competition against import from the U.S., but feed costs would also be reduced. It would be most essential for the Salvadoran aviculture to maintain its competitive advantage in the Central American market. For this, the Eastern Region may hold a key as it will have advantages of importing feed from the La Union port and also proximity to Honduran and Nicaraguan markets.
2) Promotion strategy
i) Promoting feed import from Nicaragua, and also through the La Union port after 2007;
ii) Establishing fishmeal plants in the Eastern Region using currently wasted fish;
iii) Organizing small and micro producers; and
iv) Providing technical assistance through organized producers for breed improvement and adequate feeding.
(7) Indigo and dye works
Existing conditions in El Salvador
The Indigo Producers’ Association of El Salvador (AZULES), formed in 2000, is based in San Salvador. In the Eastern Region, ADEL Morazan manages a cooperative of indigo producers,
5-33
consisting of 32 members in Arambala, Jocoaitique and Rosario. The cooperative members cultivate indigo on their own land and process it, with the technical assistance of GTZ. They sold 600kg of indigo dye at $22/kg in 2002. In Usulutan, cooperatives of Las Marinas and San Mauricio are seeking technical support for indigo cultivation. The total production of crystallized indigo was about 1,000kg in 2003. The total cultivation area was 18,000mz but only a small portion of the area was used to extract indigo dye.
In 2003, MAG supported 200 indigo producers in nine municipalities of Cabañas. They expected to produce 80lbs/mz annually in two crops and to obtain a profit of $571.4/mz.
The Association has exported indigo dye to Switzerland, Germany and France. The Interamerican Institute for Agricultural Cooperation (IICA) controls the quality of indigo through its laboratory. Some indigo producers in the Central and the Western regions and ADEL Morazán produce textiles dyed with indigo in a small scale.
In addition to the three countries mentioned above, Japan, the U.S., and the Netherlands are potential markets. Indigo dye is priced at US$40/kg in the international market. At present, only indigo powder is exported, and no textile dyed with indigo. ADEL Morazan sold indigo at $22/kg to national wholesalers, who later export it to Europe. UCRAPROBEX is a national intermediary for export. As indigo production has started to revive only recently, production is still small and scattered. Producers are not linked with related business and markets yet.
Market situations
Comprehensive data on the production and export of indigo dye and dyed products are not available as they are still quite limited. While EU has recently introduced bans on synthetic dyes, the international market is still dominated by synthetic indigo and other dyes.
Typical prices of indigo dye in the domestic market in Japan, a major consumer of the product in the world, have been obtained from a dye shop. Synthetic indigo is sold at US$65/kg for a 500g package and US$125/kg for a 50g package. Natural Indian indigo is sold at US$27/kg for 1kg liquid, US$255/kg for 500g powder and US$273/kg for 100g powder.
Indigo dye is generally priced at US$40/kg in the international market for the standard quality product of 45% indigotin content. Usually, a premium of US$0.85/kg is added to each additional percentage point of indigotin content. Consequently, the export prices of indigo dye products range between US$40-53/kg.
Position of El Salvador
El Salvador has a long history of cultivating and processing indigo, and the indigo industry once played a very important role in the economic development of the Country. Indigo produced in El Salvador is known for its high quality due to the favorable climatic conditions. Indigo production in the Country has been expanding rapidly since the formation of AZULES.
5-34
It increased from 100kg in 2000 to 600kg in 2001, and the estimated production in 2002 was 1,800kg.
The export prices of Salvadoran indigo generally range from US$30/kg to US$50/kg. These are lower than even the domestic market prices of synthetic indigo in Japan. In 2002, El Salvador exported 600kg of indigo dye, of which 400kg were directed to Germany.
The indigo cultivation in the Eastern Region yields on the average 18kg/mz of indigo dye per harvest or 79kg/ha for two harvests per year. At the ongoing sales prices of US$22/kg, the gross production value is US$1,738/ha (ADEL-Morazan). With the data in Cabañas, the profit margin is calculated to be US$15.8/kg or US$1,253/ha.
Strategy
1) Marketing strategy
Indigo dye production appears to be quite profitable in terms of the profit rate as indicated above. This is due to the low production cost. On the other hand, the domestic sales price is quite low, compared to the export price. To ensure the export quality of the product, the production cost may increase. In view of inherent high quality of the raw material, indigo dye production in El Salvador should aim at the export quality product.
Production of indigo dye products is still very limited in El Salvador. The market for these products is rapidly expanding, however. Price data on some of these products have been obtained through the Internet as shown below.
Product Prices (US$/piece) Weight (g) Jeans 135-270* 700 T-shirt 36-54 180 Long-sleeve men’s shirt 72-81 n.a. Bandana 27 20 Shoulder bag 53 n.a.
* By specialty jeans manufacturers in Japan
To dye a T-shirt weighing 180g, 30g of indigo powder is required. The following simple calculation shows high profitability of indigo dyed T-shirts.
Sales per 1kg of indigo powder No. of T-shirts dyed: 33 Price of T-shirt: US$45 Total sales value: US$1,485 Production costs Indigo powder: US$40 Material: US$165 (US$5/shirt)
5-35
Labor: US$33 (US$30/day for 30 shirts) Transportation: US$165 (US$5/shirt) Overhead: US$81 (20% of the above) Profit before tax: US$1,001
The profit margin for indigo dyed products is much larger than that for indigo dye, by an order of magnitude on the unit indigo dye basis. Clearly, this represents a major opportunity for the indigo industry in El Salvador, especially in view of the established textile and clothing industry in the Country. A prerequisite, however, is to produce high quality indigo dye.
2) Promotion strategy in the Eastern Region
i) Expanding the pilot project through participation of all the actors, including farmers, dye producers, dye workers, designers, marketing agents, researchers, etc.;
ii) Establishing and promulgating the basic policy to promote Salvadoran indigo and indigo culture;
iii) Supporting products development for diversified products ranging from handicraft to high value clothing; and
iv) Undertaking vigorous marketing for both dye and indigo dyed products.
(8) Kenaf
Existing conditions in El Salvador
Kenaf cultivation in El Salvador has a long history, although it has never become a major industry. At present, kenaf cultivation area is estimated at some 1,500ha, situated mainly in the Eastern Region. In Chapeltique, at the elevation of 290m, kenaf is produced by some 800 farmers for 20,000-30,000qq/year and processed into gunny bags. Another factory in Moncagua is supplied from a 400ha farm. Both factories, however, import additional raw materials from Brazil. They would face difficulties once 50% duties on import gunny bags end in three years, and they are seeking to diversity their products into carpet and handicraft manufacturing. Export of kenaf fibers, on the other hand, faces severe competition with jute from Bangladesh.
A feasibility study was carried out for kenaf pulp manufacturing based on kenaf cultivation in 10,000ha and a pulp mill in Usulutan on the Lempa river (JETRO, 2002). It was found that with the initial investment cost of US$73million, the pulp mill would be only marginally profitable if the products were to be exported to Japan. It may become viable if the product is supplied to a paper mill nearby, preferably also in Usulutan, to reduce transportation and head office costs. Other possibilities include the use of other waste materials to mix with kenaf to reduce raw materials costs and the smaller capacity without sacrificing product quality while ensuring environmental standards.
5-36
Another study has examined the possibility of producing kenaf fibers for export (BEC, 2003). Investment costs for machinery are US$900,000 for crop cultivation in 1,000ha and US$1,150,000 for fiber extraction at 10ton/ha. Export prices are assumed to be US$500/ton for long fiber (bark) and US$170/ton for short fiber (cure) for an average of US$300/ton. Internal rate of return is calculated to be 30-36% for 10 years operation.
International market situations
In trade statistics, kenaf is usually treated together with other fibers, except cotton, as jute and allied fibers (JAF). The world production of JAF is generally declining in recent years from the peak production of 3.86 million ton in 1997/98 to 2.95 million ton in 2001/02. Kenaf and allied fibers production decreased also from 0.82 million ton in 1997/98 to 0.45 million ton in 2001/02. JAF production is dominated by jute produced in India and Bangladesh accounting for 91% of the world production in 2001/02 (83% in 1997/98). JAF production in Latin America is dominated by kenaf in Brazil, Cuba and Peru.
Of the world production of JAF, 1,032,000ton in 2000, about two-thirds, 678,400ton in 2000/01, are exported as products rather than fibers. Jute export is mostly by Bangladesh, Myanmar and Nepal. Kenaf and allied fibers are exported only by China and Thailand. Developed countries import some 60% of the total import of JAF products, and small portion (11-12% in 1997-2000) of the total import of raw JAF. JAF yields vary widely among producing countries. In 2001/02, the average kenaf yield was 2.72ton/ha in China and 1.60ton/ha in Thailand, and the average jute yield was 1.89ton/ha in Bangladesh and 0.90ton/ha in Myanmar. India and Nepal produced both jute and a much smaller amount of kenaf and allied fibers with the average yield of 1.84ton/ha and 1.24ton/ha, respectively.
JAF prices are generally declining in recent years. Particularly, jute export price (FOB Mogla) decreased from over US$500/ton in 1996 to the lowest of US$250/ton during 1998-99. It has recovered slightly thereafter.
Position of El Salvador
El Salvador imports small amount of JAF fibers, some 400,000ton annually in 1997-2000. Mainly kenaf is produced in El Salvador, and yields are generally high. The recent study for kenaf fiber export assumed the export price of kenaf fiber at US$300/ton, but the jute export price has been lower than US$300/ton most of the time since 1998.
Strategy
1) Marketing strategy
Although kenaf production in El Salvador is small, it has a long history and production technology is well established and yields are among the highest in the world. That is, El Salvador has competitive advantage for kenaf fiber production. While the export of kenaf
5-37
fibers faces severe competition with jute fiber from Bangladesh in general, the kenaf industry in El Salvador can survive even at much lower prices of fibers than the current export price of the Bangladesh jute, if processing is well established. The kenaf industry in El Salvador should be established aiming at promising future markets for kenaf reinforced composites, particleboard, geo-textile and other industrial products as well as non-tree pulp and paper
2) Promotion strategy for the Eastern Region
i) Undertaking kenaf fiber production initially aiming at export to the U.S. and Europe (e.g., Germany) where products development is more advanced;
ii) Diversifying kenaf products including not only carpet, handicraft, fiber mats and other domestic products but also light construction materials through R&D; and
iii) Seeking partnership with foreign investors for either pulp and paper mill or light construction materials, depending on market conditions that may evolve in the coming decade.
5.4 Promotion Strategies for Textile and Apparel Industries
This section is devoted to the most important industries in El Salvador: textiles and apparel. While they are well established, particularly in free zones as the maquila industry, they are at a transition phase in relation to CAFTA and WTO as described in Subsection 4.1.4. The existing conditions and prospects of these industries are examined in Subsection 5.4.1 and the strategies to promote them are presented in Subsection 5.4.2.
5.4.1 Existing conditions and prospects of textile and apparel industries
(1) Growth performance
The textile industry has been the most important subsector of the manufacturing industry in El Salvador since the 1950’s. Decreasing export tariffs and tax stimulated the cut and sew industry (apparel industry) directed to the U.S. market. The textile industry, however, did not grow much during the civil war and did not recover until the Peace Accord. After that, companies started to replace inefficient machinery and tools for better efficiency.
Since 1995, textile and apparel have grown as the maquila industry. They generated US$489 millions of income in 2001. The average growth of total maquila export reached 12% annually during 1995-2000, although the export decreased by 2.6% in 2001. The growth of the apparel export to the U.S. has been tapering off in recent years (Figure 5.1).
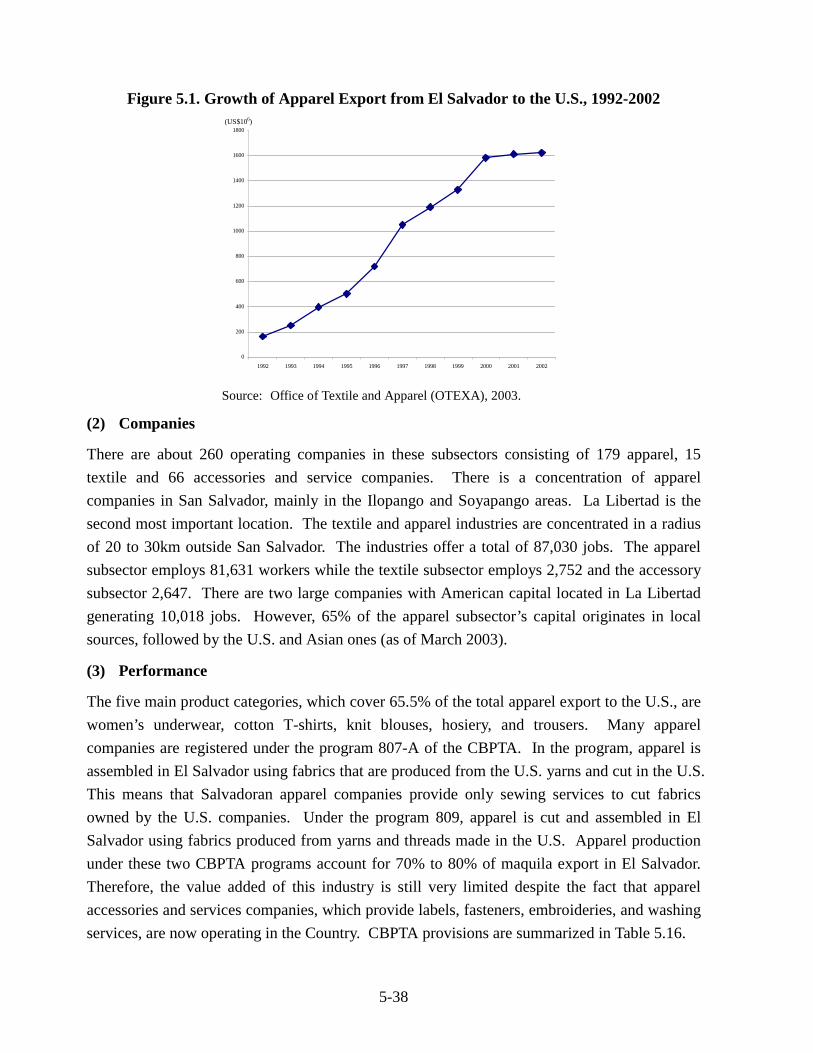
5-38
Figure 5.1. Growth of Apparel Export from El Salvador to the U.S., 1992-2002
0
200
400
600
800
1000
1200
1400
1600
1800
1992 1993 1994 1995 1996 1997 1998 1999 2000 2001 2002
(US$106)
Source: Office of Textile and Apparel (OTEXA), 2003.
(2) Companies
There are about 260 operating companies in these subsectors consisting of 179 apparel, 15 textile and 66 accessories and service companies. There is a concentration of apparel companies in San Salvador, mainly in the Ilopango and Soyapango areas. La Libertad is the second most important location. The textile and apparel industries are concentrated in a radius of 20 to 30km outside San Salvador. The industries offer a total of 87,030 jobs. The apparel subsector employs 81,631 workers while the textile subsector employs 2,752 and the accessory subsector 2,647. There are two large companies with American capital located in La Libertad generating 10,018 jobs. However, 65% of the apparel subsector’s capital originates in local sources, followed by the U.S. and Asian ones (as of March 2003).
(3) Performance
The five main product categories, which cover 65.5% of the total apparel export to the U.S., are women’s underwear, cotton T-shirts, knit blouses, hosiery, and trousers. Many apparel companies are registered under the program 807-A of the CBPTA. In the program, apparel is assembled in El Salvador using fabrics that are produced from the U.S. yarns and cut in the U.S. This means that Salvadoran apparel companies provide only sewing services to cut fabrics owned by the U.S. companies. Under the program 809, apparel is cut and assembled in El Salvador using fabrics produced from yarns and threads made in the U.S. Apparel production under these two CBPTA programs account for 70% to 80% of maquila export in El Salvador. Therefore, the value added of this industry is still very limited despite the fact that apparel accessories and services companies, which provide labels, fasteners, embroideries, and washing services, are now operating in the Country. CBPTA provisions are summarized in Table 5.16.
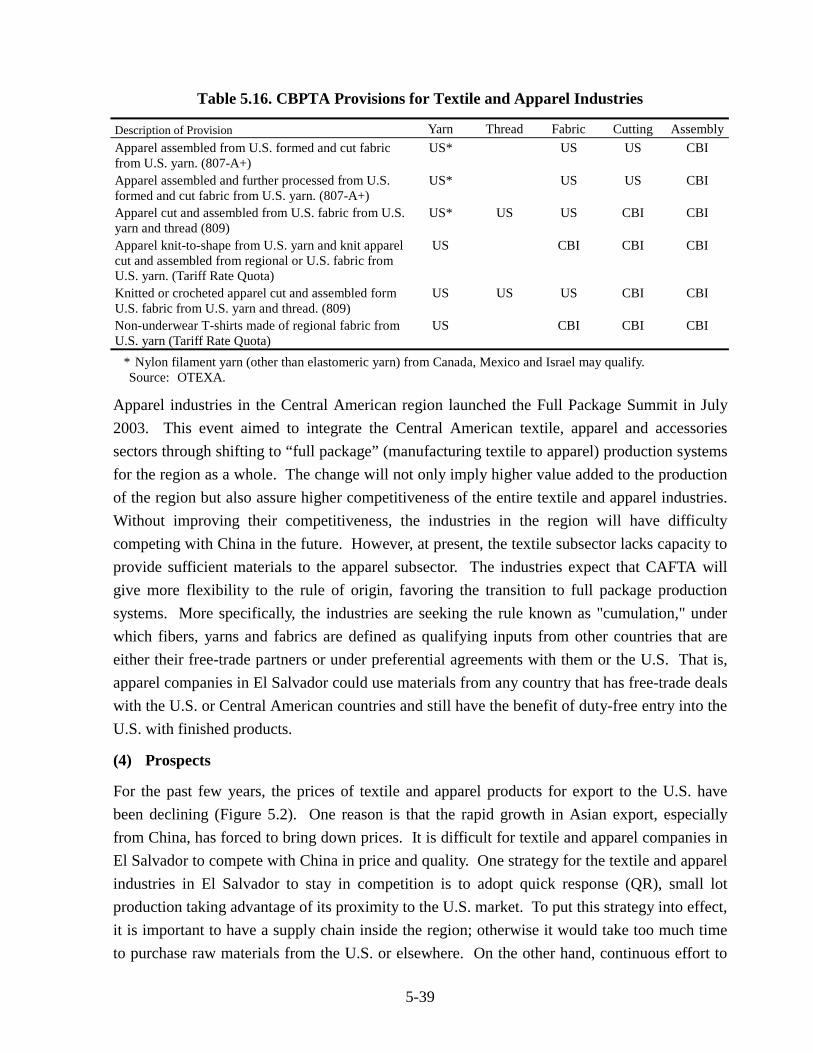
5-39
Table 5.16. CBPTA Provisions for Textile and Apparel Industries
Description of Provision Yarn Thread Fabric Cutting Assembly Apparel assembled from U.S. formed and cut fabric from U.S. yarn. (807-A+)
US* US US CBI
Apparel assembled and further processed from U.S. formed and cut fabric from U.S. yarn. (807-A+)
US* US US CBI
Apparel cut and assembled from U.S. fabric from U.S. yarn and thread (809)
US* US US CBI CBI
Apparel knit-to-shape from U.S. yarn and knit apparel cut and assembled from regional or U.S. fabric from U.S. yarn. (Tariff Rate Quota)
US CBI CBI CBI
Knitted or crocheted apparel cut and assembled form U.S. fabric from U.S. yarn and thread. (809)
US US US CBI CBI
Non-underwear T-shirts made of regional fabric from U.S. yarn (Tariff Rate Quota)
US CBI CBI CBI
* Nylon filament yarn (other than elastomeric yarn) from Canada, Mexico and Israel may qualify. Source: OTEXA.
Apparel industries in the Central American region launched the Full Package Summit in July 2003. This event aimed to integrate the Central American textile, apparel and accessories sectors through shifting to “full package” (manufacturing textile to apparel) production systems for the region as a whole. The change will not only imply higher value added to the production of the region but also assure higher competitiveness of the entire textile and apparel industries. Without improving their competitiveness, the industries in the region will have difficulty competing with China in the future. However, at present, the textile subsector lacks capacity to provide sufficient materials to the apparel subsector. The industries expect that CAFTA will give more flexibility to the rule of origin, favoring the transition to full package production systems. More specifically, the industries are seeking the rule known as "cumulation," under which fibers, yarns and fabrics are defined as qualifying inputs from other countries that are either their free-trade partners or under preferential agreements with them or the U.S. That is, apparel companies in El Salvador could use materials from any country that has free-trade deals with the U.S. or Central American countries and still have the benefit of duty-free entry into the U.S. with finished products.
(4) Prospects
For the past few years, the prices of textile and apparel products for export to the U.S. have been declining (Figure 5.2). One reason is that the rapid growth in Asian export, especially from China, has forced to bring down prices. It is difficult for textile and apparel companies in El Salvador to compete with China in price and quality. One strategy for the textile and apparel industries in El Salvador to stay in competition is to adopt quick response (QR), small lot production taking advantage of its proximity to the U.S. market. To put this strategy into effect, it is important to have a supply chain inside the region; otherwise it would take too much time to purchase raw materials from the U.S. or elsewhere. On the other hand, continuous effort to
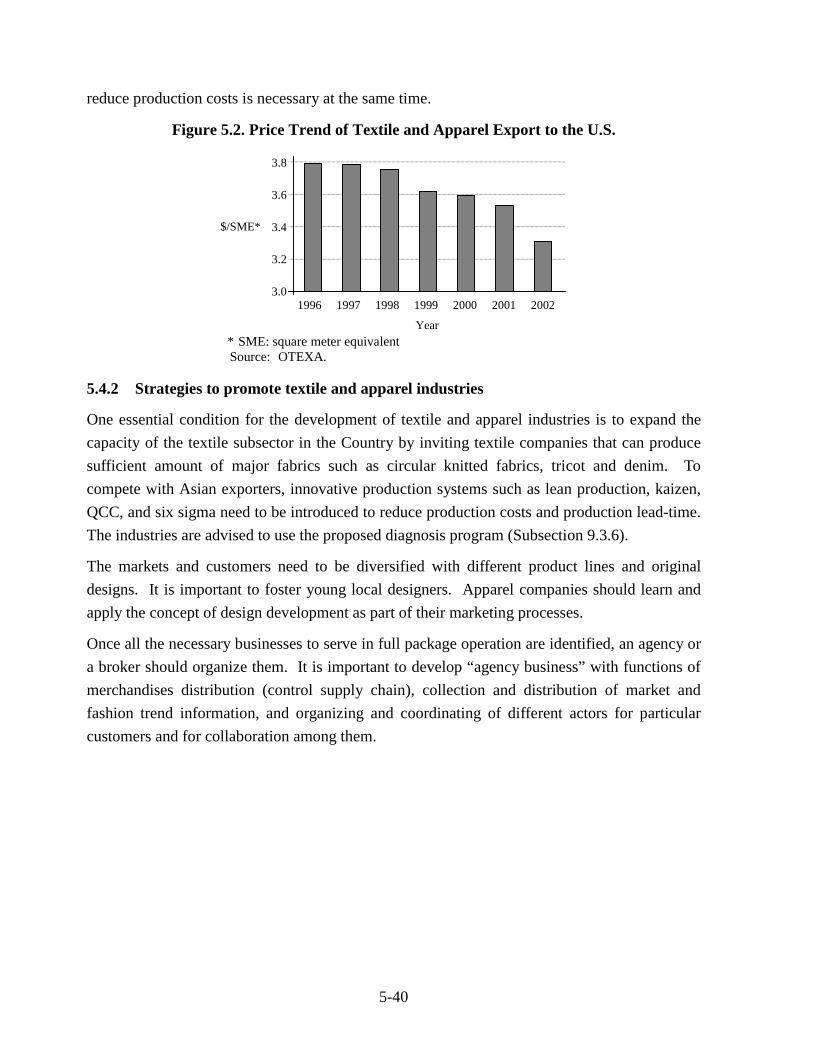
5-40
reduce production costs is necessary at the same time.
Figure 5.2. Price Trend of Textile and Apparel Export to the U.S.
* SME: square meter equivalent Source: OTEXA.
5.4.2 Strategies to promote textile and apparel industries
One essential condition for the development of textile and apparel industries is to expand the capacity of the textile subsector in the Country by inviting textile companies that can produce sufficient amount of major fabrics such as circular knitted fabrics, tricot and denim. To compete with Asian exporters, innovative production systems such as lean production, kaizen, QCC, and six sigma need to be introduced to reduce production costs and production lead-time. The industries are advised to use the proposed diagnosis program (Subsection 9.3.6).
The markets and customers need to be diversified with different product lines and original designs. It is important to foster young local designers. Apparel companies should learn and apply the concept of design development as part of their marketing processes.
Once all the necessary businesses to serve in full package operation are identified, an agency or a broker should organize them. It is important to develop “agency business” with functions of merchandises distribution (control supply chain), collection and distribution of market and fashion trend information, and organizing and coordinating of different actors for particular customers and for collaboration among them.
$/SME*
Year
3.8
3.6
3.4
3.2
3.0 1996 1998 1999 2000 2001 1997 2002
6-1
Chapter 6 DEVELOPMENT FRAMEWORKS FOR EL SALVADOR AND THE EASTERN REGION
6.1 Socioeconomic Framework for El Salvador and the Eastern Region Development
A socioeconomic framework for the Eastern Region development specifies the expected level of the development in the target year of 2019 by a set of socioeconomic indices projected in a mutually consistent way. As a prerequisite, the national context is clarified with respect to the economy and population based on existing works. As reliable macro data at department or regional level are limited, the socioeconomic framework for the Eastern Region development is worked out referring to the projected national framework. The base year is taken to be the year 2000, for which more consistent data are available.
6.1.1 National socioeconomic framework
(1) Existing conditions
Population and employment
The total national population was 6,272,353 at the 2000 census. The percentage of population in the age group 15-64 years or the labor force coefficient was 59%, and the labor participation ratio 75% to make the total labor force 2,780,000.
The industrial sector employed 658,000, including both formal and informal employment, or 24.6% of the total employment, 2,680,000. Employment in the other broad sectors is estimated at 1,247,000 or 46.5% in services and 775,000 or 28.9% in agriculture.
The population increased from 5,668,600 in 1995, at the average annual rate of 2.04% through 2000. The crude birth rate is reported to be 27.5 per 1,000, and the crude death rate 6.0 per 1,000 (DIGESTYC). Comparison with the observed population increase indicates net outmigration of over 6,000 people annually.
GDP and labor productivity
The gross domestic product of El Salvador was US$13,139 million in 2000. It consists of 10.1% agriculture, 30.2% industry and 59.6% services. The per capita GDP in 2000 is calculated at US$2,088. The value-added per employee or total factor labor productivity by sector is calculated to be approximately US$1,700 for agriculture, US$6,000 for industry and US$6,300 for services.
(2) Projections
Population
Both birth and death rates will decrease in coming decades. According to the PNODT study, the crude birth rate may decrease to 21 per 1,000 over two decades. The crude death rate may decrease at most to 5 per 1,000 in the same period. Assuming zero net outmigration to be
6-2
attained, the rate of population increase may become 1.6% per annum by 2019. The population in El Salvador may thus increase to some 8,500,000 by 2019 at the average annual rate of 1.7%. This rate is slightly higher than the rate adopted by the official projection, 1.55% per annum during 2000-2020 (DIGESTYC, Proyección de la Población en El Salvador 2025, 1995). The latter projected the population of 6,276,000 in 2000 to increase to 8,533,700 in 2020.
GDP
The PNODT study projected the GDP to increase from US$13,139 million in 2000 to US$22,413 million in 2015 at the average annual rate of 3.62%, accelerating from 2.82% per annum over 2000-05 to 3.89% per annum over 2010-15. The growth rate reaches 4.27% in the last year. Over the extended period up to the year 2019, the annual average growth may attain more or less 4.0% per annum. Thus the GDP in 2019 may be US$27,700 million. The per capita GDP in 2019 is calculated to be US$3,260, comparable to the present levels in Panama and Belize.
Consistency
To check the consistency of the population and the GDP projections, plausible sector-wise projections are worked out under a set of assumptions. The agricultural GDP may increase only at a modest rate, e.g., 1.8%, per annum during 2000-19. The labor productivity in agriculture is expected to increase at the same rate to attain higher production without increasing the rural population. The labor productivity in industry and services may increase at a higher rate, and 2.0% per annum is assumed.
A set of projections consistent with the GDP projection is shown in Table 6.1. As shown, the industry and the services GDP are projected to increase at 4.5% and 4.1% per annum, respectively to attain the overall GDP growth at 4.0% per annum as projected above. The economic structure will change with 6.5% for agriculture, 33.2% for industry and 60.3% for services in 2019.
Table 6.1. Projections of GDP and Employment by Sector, 2000-2019
GDP (US$106) Growth rate (% p.a.)
Labor productivity ($/cap)
Employment (103)
2000 2019 2000-19 2000 2019 2000 2019 Agriculture 1,300 1,800 1.8 1,700 2,400 775 750 Industry 4,000 9,200 4.5 6,000 8,700 658 1,060 Services 7,800 16,700 4.1 6,300 9,200 1,247 1,820 Total 13,100 27,700 4.0 - - 2,680 3,630
Source: JICA Study Team.
The total employment will be 3,630,000 in 2019, consisting of 20.7% agriculture, 29.2% industry, and 50.1% services. The labor force coefficient will increase as younger people enter
6-3
the labor market, and 65% is assumed, consistent with the official population projection. The labor participation ratio may increase or decrease depending on various factors. In general, however, it tends to decrease as urbanization proceeds and more people pursue higher education. Thus, 66% is assumed for the year 2019. By applying these ratios, the total employment is converted to the population of 8,500,00, more or less, consistent with the macro projection above.
6.1.2 Socioeconomic framework for the Eastern Region development
(1) Existing conditions
Population and employment
The population in the Eastern Region was 1,281,428 at the 2000 census. The labor force coefficient is smaller in the Region due to job seeking outmigration, and the labor participation ratio in the Region is assumed at the similar level as the national average. The total labor force may be about 520,000. The unemployment rate being 6.0%, the total employment is 490,000. Only data on the formal sector employment in industry and services have been obtained for the Eastern Region. These sectors in the Region engage comparatively more informal sector employment, and the total employment in these sectors is roughly estimated at 60,000 in industry and 190,000 in services. This leaves 240,000 as the employment in agriculture, accounting for 49.0% of the total.
The population in the Eastern Region increased at the average annual rate of 1.59% during 1992-2000. The crude birth and death rates in the Region are calculated at 29.1 and 6.4 per 1,000 respectively, based on data by department reported (DIGESTYC). This implies net outmigration of over 8,000 people annually.
GRDP
The GRDP data at department or regional level have not been obtained. The GRDP in the Eastern Region is derived by sector from the employment figures by assuming the labor productivity in the Region is 10% lower for all the three broad sectors than the national figures obtained above. The GRDP is thus calculated to be US$1,768 million, consisting of US$367 million or 20.8% in agriculture, US$324 million or 18.3% in industry, and US$1,077 million or 60.9% in services. The per capita GRDP is calculated at US$1,380 in the Eastern Region, corresponding to 66.1% of the per capita GDP of El Salvador.
(2) Macro projections
Population
It is assumed that both crude birth and death rates in the Eastern Region will become comparable to the respective national averages, and that outmigration will balance immigration.
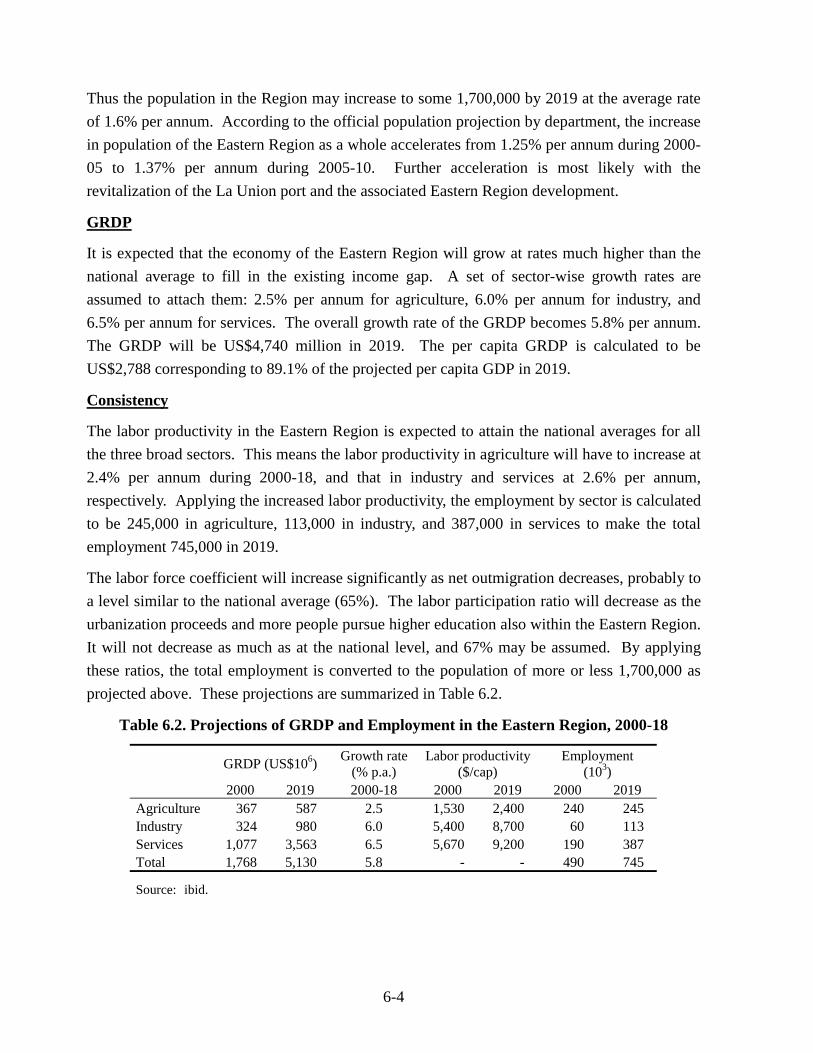
6-4
Thus the population in the Region may increase to some 1,700,000 by 2019 at the average rate of 1.6% per annum. According to the official population projection by department, the increase in population of the Eastern Region as a whole accelerates from 1.25% per annum during 2000-05 to 1.37% per annum during 2005-10. Further acceleration is most likely with the revitalization of the La Union port and the associated Eastern Region development.
GRDP
It is expected that the economy of the Eastern Region will grow at rates much higher than the national average to fill in the existing income gap. A set of sector-wise growth rates are assumed to attach them: 2.5% per annum for agriculture, 6.0% per annum for industry, and 6.5% per annum for services. The overall growth rate of the GRDP becomes 5.8% per annum. The GRDP will be US$4,740 million in 2019. The per capita GRDP is calculated to be US$2,788 corresponding to 89.1% of the projected per capita GDP in 2019.
Consistency
The labor productivity in the Eastern Region is expected to attain the national averages for all the three broad sectors. This means the labor productivity in agriculture will have to increase at 2.4% per annum during 2000-18, and that in industry and services at 2.6% per annum, respectively. Applying the increased labor productivity, the employment by sector is calculated to be 245,000 in agriculture, 113,000 in industry, and 387,000 in services to make the total employment 745,000 in 2019.
The labor force coefficient will increase significantly as net outmigration decreases, probably to a level similar to the national average (65%). The labor participation ratio will decrease as the urbanization proceeds and more people pursue higher education also within the Eastern Region. It will not decrease as much as at the national level, and 67% may be assumed. By applying these ratios, the total employment is converted to the population of more or less 1,700,000 as projected above. These projections are summarized in Table 6.2.
Table 6.2. Projections of GRDP and Employment in the Eastern Region, 2000-18
GRDP (US$106) Growth rate (% p.a.)
Labor productivity ($/cap)
Employment (103)
2000 2019 2000-18 2000 2019 2000 2019 Agriculture 367 587 2.5 1,530 2,400 240 245 Industry 324 980 6.0 5,400 8,700 60 113 Services 1,077 3,563 6.5 5,670 9,200 190 387 Total 1,768 5,130 5.8 - - 490 745
Source: ibid.
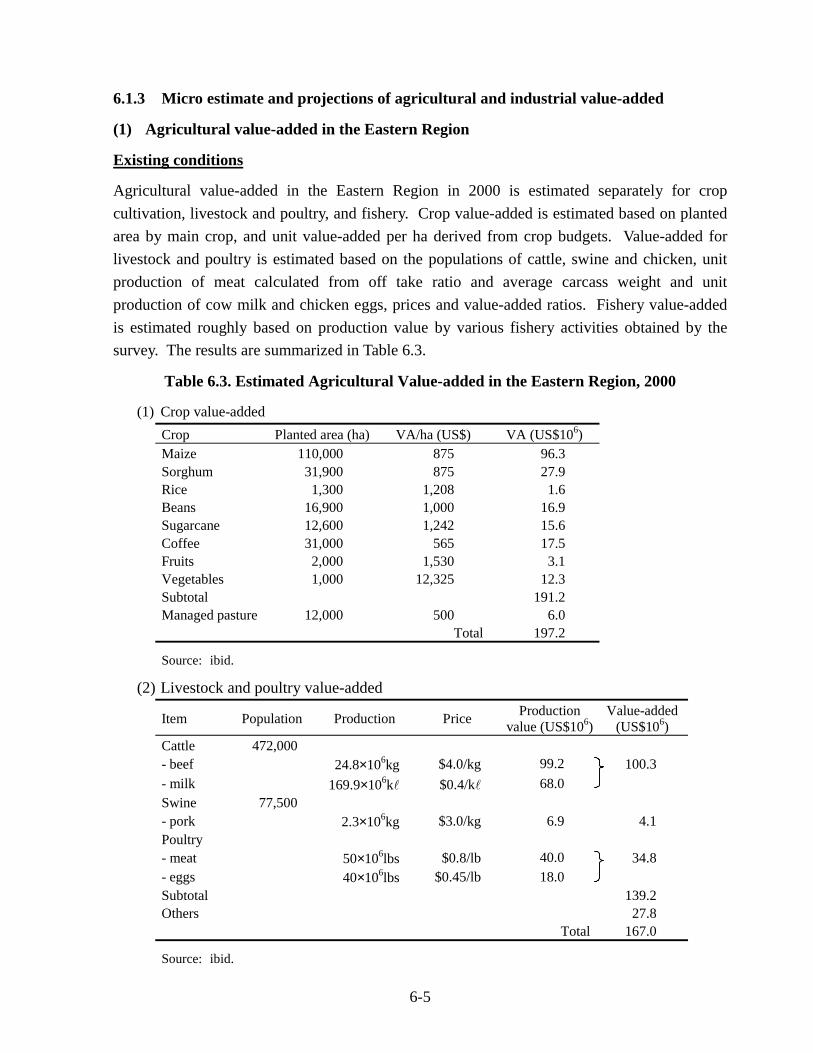
6-5
6.1.3 Micro estimate and projections of agricultural and industrial value-added
(1) Agricultural value-added in the Eastern Region
Existing conditions
Agricultural value-added in the Eastern Region in 2000 is estimated separately for crop cultivation, livestock and poultry, and fishery. Crop value-added is estimated based on planted area by main crop, and unit value-added per ha derived from crop budgets. Value-added for livestock and poultry is estimated based on the populations of cattle, swine and chicken, unit production of meat calculated from off take ratio and average carcass weight and unit production of cow milk and chicken eggs, prices and value-added ratios. Fishery value-added is estimated roughly based on production value by various fishery activities obtained by the survey. The results are summarized in Table 6.3.
Table 6.3. Estimated Agricultural Value-added in the Eastern Region, 2000
(1) Crop value-added Crop Planted area (ha) VA/ha (US$) VA (US$106) Maize 110,000 875 96.3 Sorghum 31,900 875 27.9 Rice 1,300 1,208 1.6 Beans 16,900 1,000 16.9 Sugarcane 12,600 1,242 15.6 Coffee 31,000 565 17.5 Fruits 2,000 1,530 3.1 Vegetables 1,000 12,325 12.3 Subtotal 191.2 Managed pasture 12,000 500 6.0 Total 197.2
Source: ibid.
(2) Livestock and poultry value-added
Item Population Production Price Production value (US$106)
Value-added (US$106)
Cattle 472,000 - beef 24.8×10⁶kg $4.0/kg 99.2 100.3 - milk 169.9×10⁶kl $0.4/kl 68.0 Swine 77,500 - pork 2.3×10⁶kg $3.0/kg 6.9 4.1 Poultry - meat 50×106lbs $0.8/lb 40.0 34.8 - eggs 40×106lbs $0.45/lb 18.0 Subtotal 139.2 Others 27.8 Total 167.0
Source: ibid.
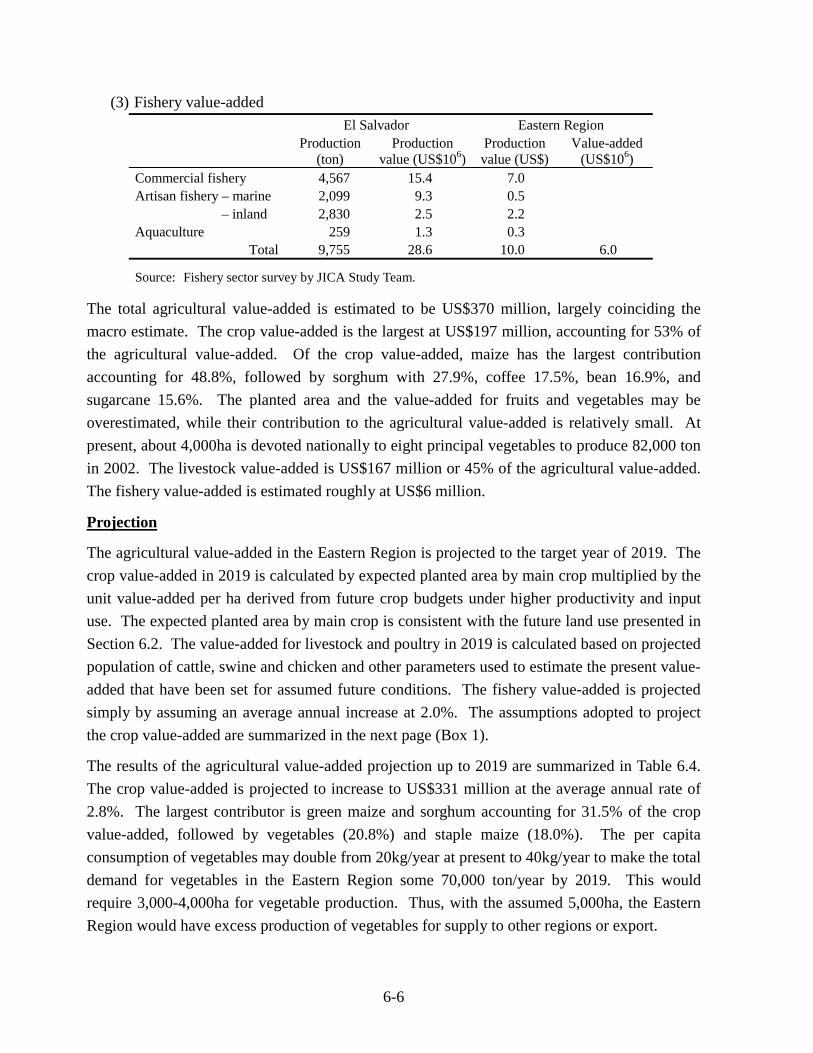
6-6
(3) Fishery value-added El Salvador Eastern Region
Production (ton)
Production value (US$106)
Production value (US$)
Value-added (US$106)
Commercial fishery 4,567 15.4 7.0 Artisan fishery – marine 2,099 9.3 0.5 Artisan fishery – inland 2,830 2.5 2.2 Aquaculture 259 1.3 0.3
Total 9,755 28.6 10.0 6.0
Source: Fishery sector survey by JICA Study Team.
The total agricultural value-added is estimated to be US$370 million, largely coinciding the macro estimate. The crop value-added is the largest at US$197 million, accounting for 53% of the agricultural value-added. Of the crop value-added, maize has the largest contribution accounting for 48.8%, followed by sorghum with 27.9%, coffee 17.5%, bean 16.9%, and sugarcane 15.6%. The planted area and the value-added for fruits and vegetables may be overestimated, while their contribution to the agricultural value-added is relatively small. At present, about 4,000ha is devoted nationally to eight principal vegetables to produce 82,000 ton in 2002. The livestock value-added is US$167 million or 45% of the agricultural value-added. The fishery value-added is estimated roughly at US$6 million.
Projection
The agricultural value-added in the Eastern Region is projected to the target year of 2019. The crop value-added in 2019 is calculated by expected planted area by main crop multiplied by the unit value-added per ha derived from future crop budgets under higher productivity and input use. The expected planted area by main crop is consistent with the future land use presented in Section 6.2. The value-added for livestock and poultry in 2019 is calculated based on projected population of cattle, swine and chicken and other parameters used to estimate the present value-added that have been set for assumed future conditions. The fishery value-added is projected simply by assuming an average annual increase at 2.0%. The assumptions adopted to project the crop value-added are summarized in the next page (Box 1).
The results of the agricultural value-added projection up to 2019 are summarized in Table 6.4. The crop value-added is projected to increase to US$331 million at the average annual rate of 2.8%. The largest contributor is green maize and sorghum accounting for 31.5% of the crop value-added, followed by vegetables (20.8%) and staple maize (18.0%). The per capita consumption of vegetables may double from 20kg/year at present to 40kg/year to make the total demand for vegetables in the Eastern Region some 70,000 ton/year by 2019. This would require 3,000-4,000ha for vegetable production. Thus, with the assumed 5,000ha, the Eastern Region would have excess production of vegetables for supply to other regions or export.
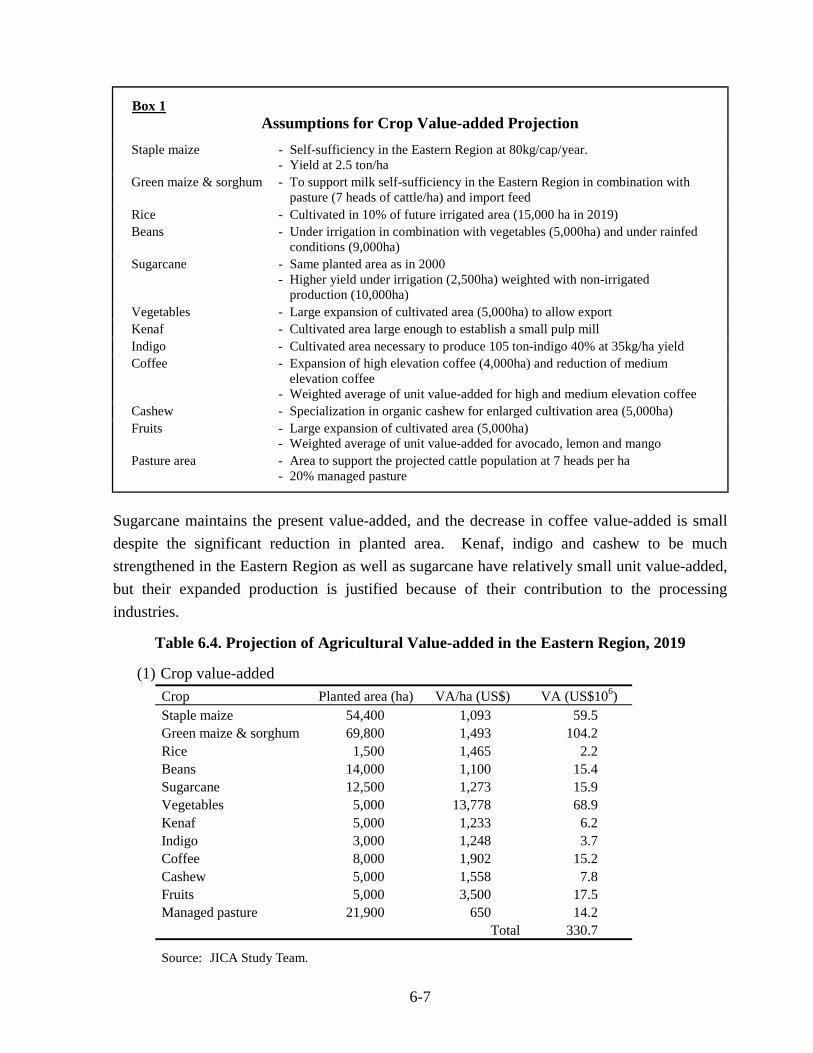
6-7
Box 1 Assumptions for Crop Value-added Projection
Staple maize - Self-sufficiency in the Eastern Region at 80kg/cap/year. - Yield at 2.5 ton/ha
Green maize & sorghum - To support milk self-sufficiency in the Eastern Region in combination with pasture (7 heads of cattle/ha) and import feed
Rice - Cultivated in 10% of future irrigated area (15,000 ha in 2019) Beans - Under irrigation in combination with vegetables (5,000ha) and under rainfed
conditions (9,000ha) Sugarcane - Same planted area as in 2000
- Higher yield under irrigation (2,500ha) weighted with non-irrigated production (10,000ha)
Vegetables - Large expansion of cultivated area (5,000ha) to allow export Kenaf - Cultivated area large enough to establish a small pulp mill Indigo - Cultivated area necessary to produce 105 ton-indigo 40% at 35kg/ha yield Coffee - Expansion of high elevation coffee (4,000ha) and reduction of medium
elevation coffee - Weighted average of unit value-added for high and medium elevation coffee
Cashew - Specialization in organic cashew for enlarged cultivation area (5,000ha) Fruits - Large expansion of cultivated area (5,000ha)
- Weighted average of unit value-added for avocado, lemon and mango Pasture area - Area to support the projected cattle population at 7 heads per ha
- 20% managed pasture
Sugarcane maintains the present value-added, and the decrease in coffee value-added is small despite the significant reduction in planted area. Kenaf, indigo and cashew to be much strengthened in the Eastern Region as well as sugarcane have relatively small unit value-added, but their expanded production is justified because of their contribution to the processing industries.
Table 6.4. Projection of Agricultural Value-added in the Eastern Region, 2019
(1) Crop value-added Crop Planted area (ha) VA/ha (US$) VA (US$106) Staple maize 54,400 1,093 59.5 Green maize & sorghum 69,800 1,493 104.2 Rice 1,500 1,465 2.2 Beans 14,000 1,100 15.4 Sugarcane 12,500 1,273 15.9 Vegetables 5,000 13,778 68.9 Kenaf 5,000 1,233 6.2 Indigo 3,000 1,248 3.7 Coffee 8,000 1,902 15.2 Cashew 5,000 1,558 7.8 Fruits 5,000 3,500 17.5 Managed pasture 21,900 650 14.2 Total 330.7
Source: JICA Study Team.
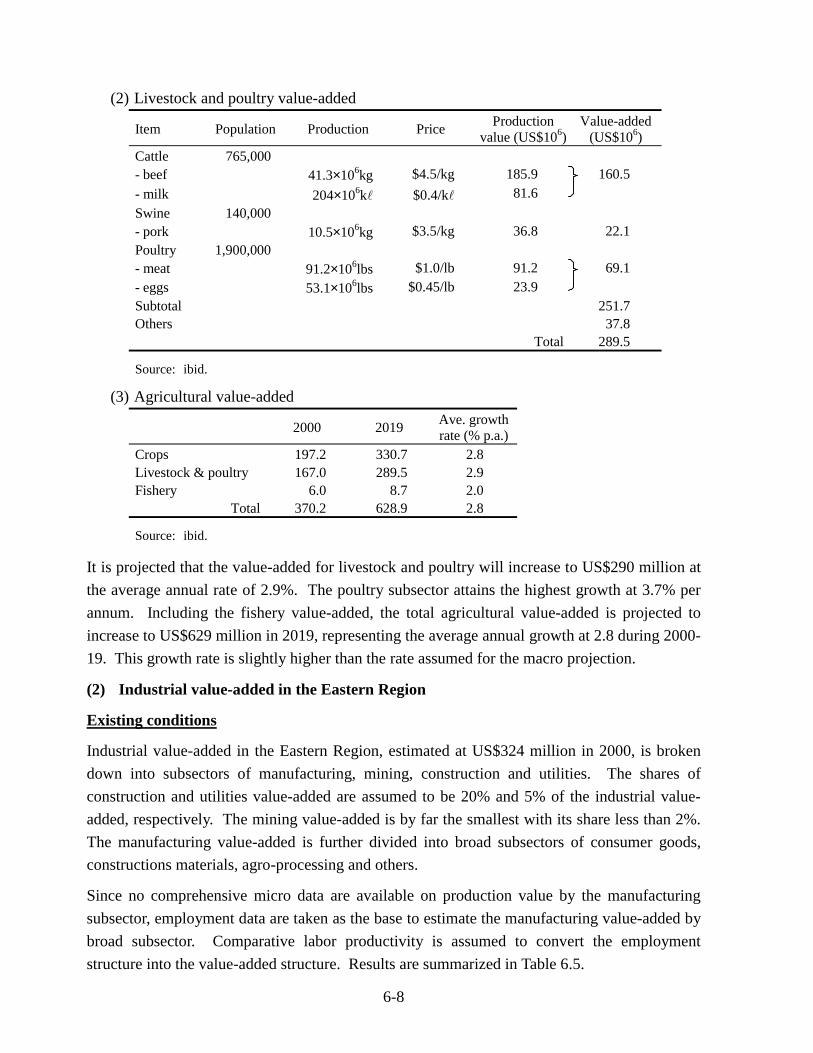
6-8
(2) Livestock and poultry value-added
Item Population Production Price Production value (US$106)
Value-added (US$106)
Cattle 765,000 - beef 41.3×10⁶kg $4.5/kg 185.9 160.5 - milk 204×106kl $0.4/kl 81.6 Swine 140,000 - pork 10.5×10⁶kg $3.5/kg 36.8 22.1 Poultry 1,900,000 - meat 91.2×10⁶lbs $1.0/lb 91.2 69.1 - eggs 53.1×10⁶lbs $0.45/lb 23.9 Subtotal 251.7 Others 37.8 Total 289.5
Source: ibid.
(3) Agricultural value-added
2000 2019 Ave. growth rate (% p.a.)
Crops 197.2 330.7 2.8 Livestock & poultry 167.0 289.5 2.9 Fishery 6.0 8.7 2.0
Total 370.2 628.9 2.8
Source: ibid.
It is projected that the value-added for livestock and poultry will increase to US$290 million at the average annual rate of 2.9%. The poultry subsector attains the highest growth at 3.7% per annum. Including the fishery value-added, the total agricultural value-added is projected to increase to US$629 million in 2019, representing the average annual growth at 2.8 during 2000-19. This growth rate is slightly higher than the rate assumed for the macro projection.
(2) Industrial value-added in the Eastern Region
Existing conditions
Industrial value-added in the Eastern Region, estimated at US$324 million in 2000, is broken down into subsectors of manufacturing, mining, construction and utilities. The shares of construction and utilities value-added are assumed to be 20% and 5% of the industrial value-added, respectively. The mining value-added is by far the smallest with its share less than 2%. The manufacturing value-added is further divided into broad subsectors of consumer goods, constructions materials, agro-processing and others.
Since no comprehensive micro data are available on production value by the manufacturing subsector, employment data are taken as the base to estimate the manufacturing value-added by broad subsector. Comparative labor productivity is assumed to convert the employment structure into the value-added structure. Results are summarized in Table 6.5.
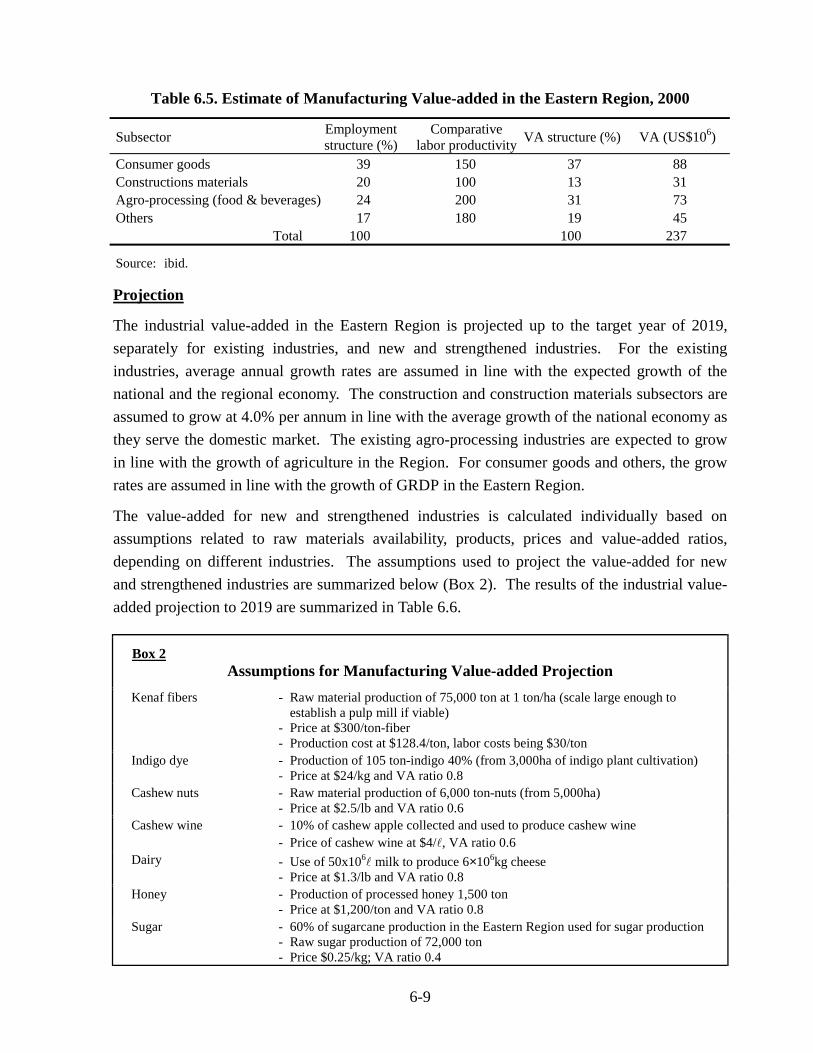
6-9
Table 6.5. Estimate of Manufacturing Value-added in the Eastern Region, 2000
Subsector Employment structure (%)
Comparative labor productivity VA structure (%) VA (US$106)
Consumer goods 39 150 37 88 Constructions materials 20 100 13 31 Agro-processing (food & beverages) 24 200 31 73 Others 17 180 19 45
Total 100 100 237
Source: ibid.
Projection
The industrial value-added in the Eastern Region is projected up to the target year of 2019, separately for existing industries, and new and strengthened industries. For the existing industries, average annual growth rates are assumed in line with the expected growth of the national and the regional economy. The construction and construction materials subsectors are assumed to grow at 4.0% per annum in line with the average growth of the national economy as they serve the domestic market. The existing agro-processing industries are expected to grow in line with the growth of agriculture in the Region. For consumer goods and others, the grow rates are assumed in line with the growth of GRDP in the Eastern Region.
The value-added for new and strengthened industries is calculated individually based on assumptions related to raw materials availability, products, prices and value-added ratios, depending on different industries. The assumptions used to project the value-added for new and strengthened industries are summarized below (Box 2). The results of the industrial value-added projection to 2019 are summarized in Table 6.6.
Box 2 Assumptions for Manufacturing Value-added Projection
Kenaf fibers - Raw material production of 75,000 ton at 1 ton/ha (scale large enough to establish a pulp mill if viable)
- Price at $300/ton-fiber - Production cost at $128.4/ton, labor costs being $30/ton
Indigo dye - Production of 105 ton-indigo 40% (from 3,000ha of indigo plant cultivation) - Price at $24/kg and VA ratio 0.8
Cashew nuts - Raw material production of 6,000 ton-nuts (from 5,000ha) - Price at $2.5/lb and VA ratio 0.6
Cashew wine - 10% of cashew apple collected and used to produce cashew wine - Price of cashew wine at $4/l, VA ratio 0.6
Dairy - Use of 50x106l milk to produce 6×10⁶kg cheese - Price at $1.3/lb and VA ratio 0.8
Honey - Production of processed honey 1,500 ton - Price at $1,200/ton and VA ratio 0.8
Sugar - 60% of sugarcane production in the Eastern Region used for sugar production - Raw sugar production of 72,000 ton - Price $0.25/kg; VA ratio 0.4
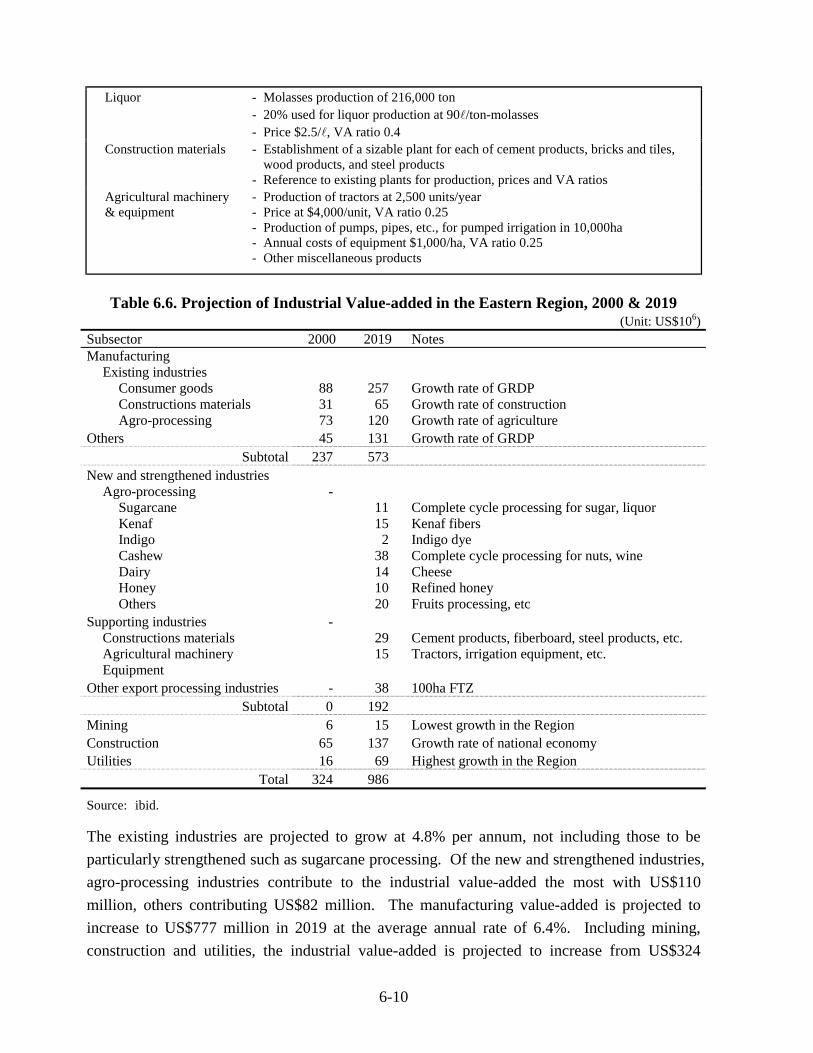
6-10
Liquor - Molasses production of 216,000 ton - 20% used for liquor production at 90l/ton-molasses - Price $2.5/l, VA ratio 0.4
Construction materials - Establishment of a sizable plant for each of cement products, bricks and tiles, wood products, and steel products
- Reference to existing plants for production, prices and VA ratios Agricultural machinery & equipment
- Production of tractors at 2,500 units/year - Price at $4,000/unit, VA ratio 0.25 - Production of pumps, pipes, etc., for pumped irrigation in 10,000ha - Annual costs of equipment $1,000/ha, VA ratio 0.25 - Other miscellaneous products
Table 6.6. Projection of Industrial Value-added in the Eastern Region, 2000 & 2019 (Unit: US$106)
Subsector 2000 2019 Notes Manufacturing
Existing industries Consumer goods 88 257 Growth rate of GRDP Constructions materials 31 65 Growth rate of construction Agro-processing 73 120 Growth rate of agriculture
Others 45 131 Growth rate of GRDP Subtotal 237 573
New and strengthened industries Agro-processing -
Sugarcane 11 Complete cycle processing for sugar, liquor Kenaf 15 Kenaf fibers Indigo 2 Indigo dye Cashew 38 Complete cycle processing for nuts, wine Dairy 14 Cheese Honey 10 Refined honey Others 20 Fruits processing, etc
Supporting industries - Constructions materials 29 Cement products, fiberboard, steel products, etc. Agricultural machinery 15 Tractors, irrigation equipment, etc. Equipment
Other export processing industries - 38 100ha FTZ Subtotal 0 192
Mining 6 15 Lowest growth in the Region Construction 65 137 Growth rate of national economy Utilities 16 69 Highest growth in the Region
Total 324 986
Source: ibid.
The existing industries are projected to grow at 4.8% per annum, not including those to be particularly strengthened such as sugarcane processing. Of the new and strengthened industries, agro-processing industries contribute to the industrial value-added the most with US$110 million, others contributing US$82 million. The manufacturing value-added is projected to increase to US$777 million in 2019 at the average annual rate of 6.4%. Including mining, construction and utilities, the industrial value-added is projected to increase from US$324
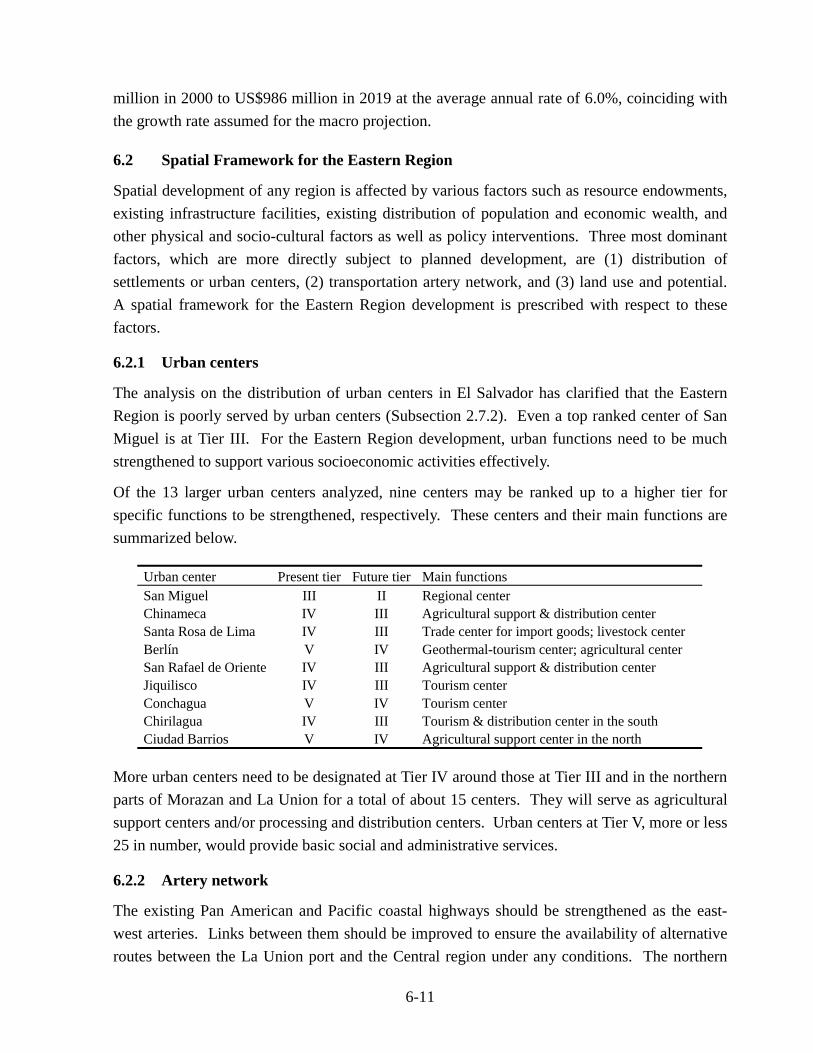
6-11
million in 2000 to US$986 million in 2019 at the average annual rate of 6.0%, coinciding with the growth rate assumed for the macro projection.
6.2 Spatial Framework for the Eastern Region
Spatial development of any region is affected by various factors such as resource endowments, existing infrastructure facilities, existing distribution of population and economic wealth, and other physical and socio-cultural factors as well as policy interventions. Three most dominant factors, which are more directly subject to planned development, are (1) distribution of settlements or urban centers, (2) transportation artery network, and (3) land use and potential. A spatial framework for the Eastern Region development is prescribed with respect to these factors.
6.2.1 Urban centers
The analysis on the distribution of urban centers in El Salvador has clarified that the Eastern Region is poorly served by urban centers (Subsection 2.7.2). Even a top ranked center of San Miguel is at Tier III. For the Eastern Region development, urban functions need to be much strengthened to support various socioeconomic activities effectively.
Of the 13 larger urban centers analyzed, nine centers may be ranked up to a higher tier for specific functions to be strengthened, respectively. These centers and their main functions are summarized below.
Urban center Present tier Future tier Main functions San Miguel III II Regional center Chinameca IV III Agricultural support & distribution center Santa Rosa de Lima IV III Trade center for import goods; livestock center Berlín V IV Geothermal-tourism center; agricultural center San Rafael de Oriente IV III Agricultural support & distribution center Jiquilisco IV III Tourism center Conchagua V IV Tourism center Chirilagua IV III Tourism & distribution center in the south Ciudad Barrios V IV Agricultural support center in the north
More urban centers need to be designated at Tier IV around those at Tier III and in the northern parts of Morazan and La Union for a total of about 15 centers. They will serve as agricultural support centers and/or processing and distribution centers. Urban centers at Tier V, more or less 25 in number, would provide basic social and administrative services.
6.2.2 Artery network
The existing Pan American and Pacific coastal highways should be strengthened as the east-west arteries. Links between them should be improved to ensure the availability of alternative routes between the La Union port and the Central region under any conditions. The northern
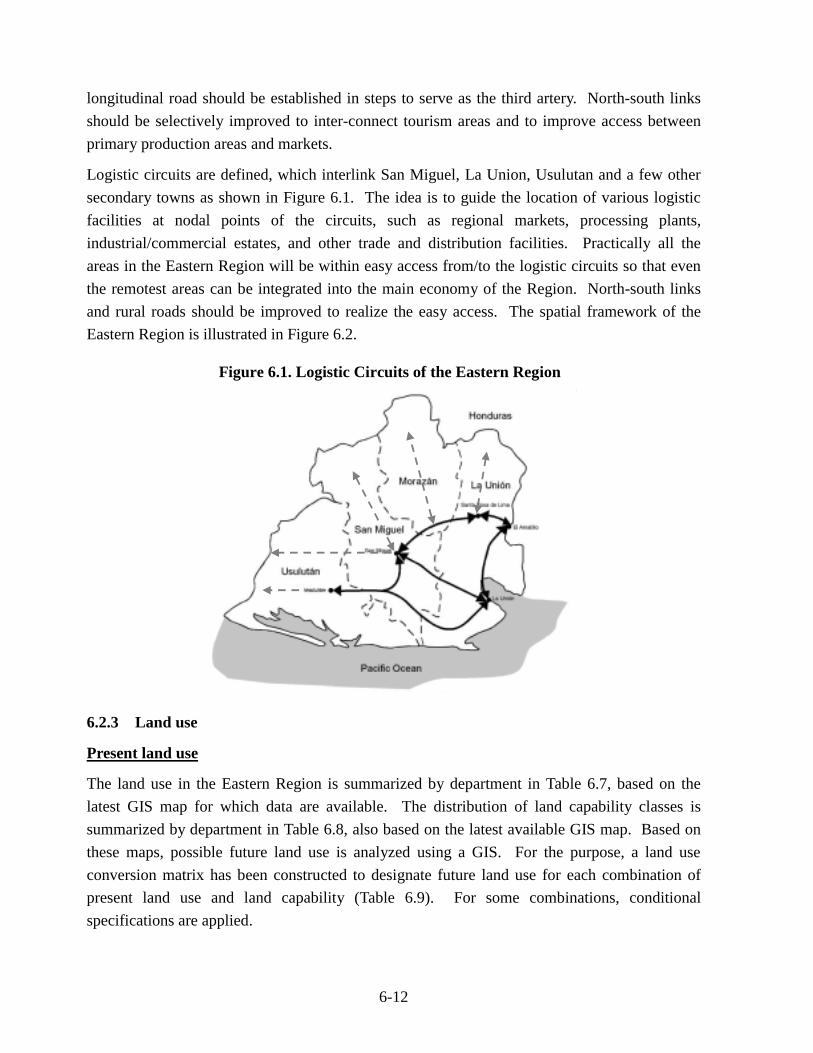
6-12
longitudinal road should be established in steps to serve as the third artery. North-south links should be selectively improved to inter-connect tourism areas and to improve access between primary production areas and markets.
Logistic circuits are defined, which interlink San Miguel, La Union, Usulutan and a few other secondary towns as shown in Figure 6.1. The idea is to guide the location of various logistic facilities at nodal points of the circuits, such as regional markets, processing plants, industrial/commercial estates, and other trade and distribution facilities. Practically all the areas in the Eastern Region will be within easy access from/to the logistic circuits so that even the remotest areas can be integrated into the main economy of the Region. North-south links and rural roads should be improved to realize the easy access. The spatial framework of the Eastern Region is illustrated in Figure 6.2.
6.2.3 Land use
Present land use
The land use in the Eastern Region is summarized by department in Table 6.7, based on the latest GIS map for which data are available. The distribution of land capability classes is summarized by department in Table 6.8, also based on the latest available GIS map. Based on these maps, possible future land use is analyzed using a GIS. For the purpose, a land use conversion matrix has been constructed to designate future land use for each combination of present land use and land capability (Table 6.9). For some combinations, conditional specifications are applied.
Figure 6.1. Logistic Circuits of the Eastern Region
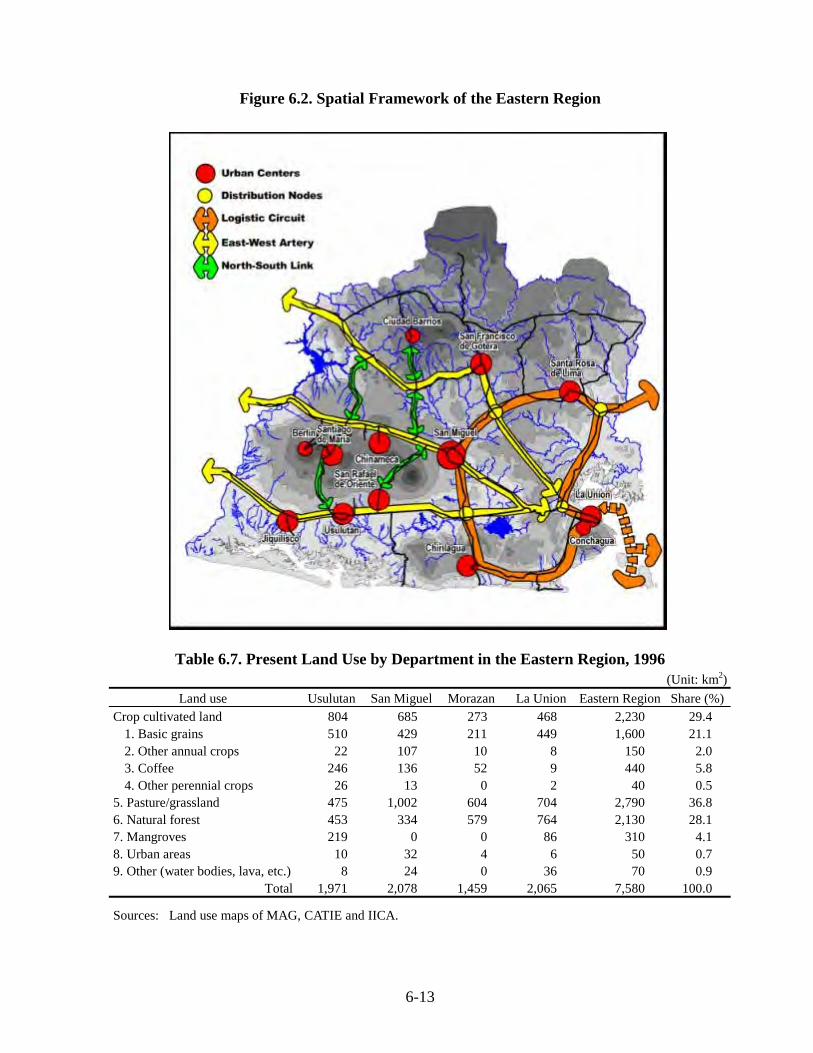
6-13
Figure 6.2. Spatial Framework of the Eastern Region
Table 6.7. Present Land Use by Department in the Eastern Region, 1996 (Unit: km2)
Land use Usulutan San Miguel Morazan La Union Eastern Region Share (%) Crop cultivated land 804 685 273 468 2,230 29.4
1. Basic grains 510 429 211 449 1,600 21.1 2. Other annual crops 22 107 10 8 150 2.0 3. Coffee 246 136 52 9 440 5.8 4. Other perennial crops 26 13 0 2 40 0.5
5. Pasture/grassland 475 1,002 604 704 2,790 36.8 6. Natural forest 453 334 579 764 2,130 28.1 7. Mangroves 219 0 0 86 310 4.1 8. Urban areas 10 32 4 6 50 0.7 9. Other (water bodies, lava, etc.) 8 24 0 36 70 0.9
Total 1,971 2,078 1,459 2,065 7,580 100.0
Sources: Land use maps of MAG, CATIE and IICA.
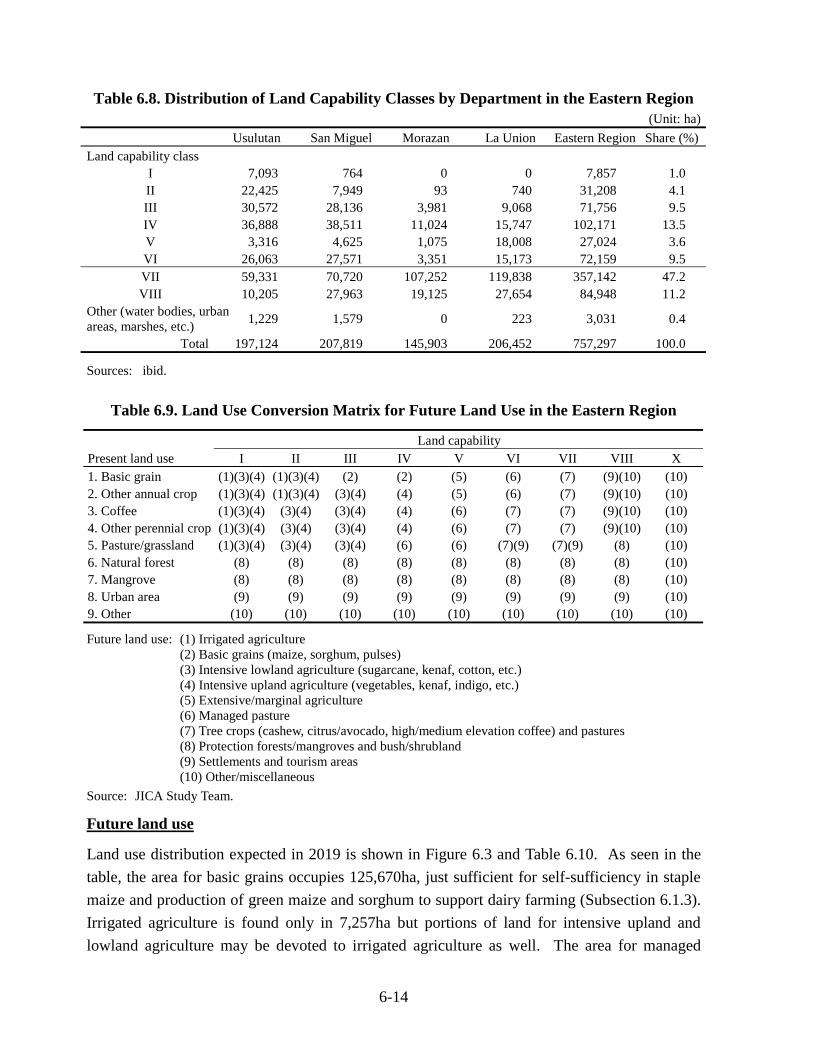
6-14
Table 6.8. Distribution of Land Capability Classes by Department in the Eastern Region (Unit: ha)
Usulutan San Miguel Morazan La Union Eastern Region Share (%) Land capability class
I 7,093 764 0 0 7,857 1.0 II 22,425 7,949 93 740 31,208 4.1 III 30,572 28,136 3,981 9,068 71,756 9.5 IV 36,888 38,511 11,024 15,747 102,171 13.5 V 3,316 4,625 1,075 18,008 27,024 3.6 VI 26,063 27,571 3,351 15,173 72,159 9.5 VII 59,331 70,720 107,252 119,838 357,142 47.2 VIII 10,205 27,963 19,125 27,654 84,948 11.2
Other (water bodies, urban areas, marshes, etc.) 1,229 1,579 0 223 3,031 0.4
Total 197,124 207,819 145,903 206,452 757,297 100.0
Sources: ibid.
Table 6.9. Land Use Conversion Matrix for Future Land Use in the Eastern Region
Land capability Present land use I II III IV V VI VII VIII X 1. Basic grain (1)(3)(4) (1)(3)(4) (2) (2) (5) (6) (7) (9)(10) (10) 2. Other annual crop (1)(3)(4) (1)(3)(4) (3)(4) (4) (5) (6) (7) (9)(10) (10) 3. Coffee (1)(3)(4) (3)(4) (3)(4) (4) (6) (7) (7) (9)(10) (10) 4. Other perennial crop (1)(3)(4) (3)(4) (3)(4) (4) (6) (7) (7) (9)(10) (10) 5. Pasture/grassland (1)(3)(4) (3)(4) (3)(4) (6) (6) (7)(9) (7)(9) (8) (10) 6. Natural forest (8) (8) (8) (8) (8) (8) (8) (8) (10) 7. Mangrove (8) (8) (8) (8) (8) (8) (8) (8) (10) 8. Urban area (9) (9) (9) (9) (9) (9) (9) (9) (10) 9. Other (10) (10) (10) (10) (10) (10) (10) (10) (10)
Future land use: (1) Irrigated agriculture (2) Basic grains (maize, sorghum, pulses) (3) Intensive lowland agriculture (sugarcane, kenaf, cotton, etc.) (4) Intensive upland agriculture (vegetables, kenaf, indigo, etc.) (5) Extensive/marginal agriculture (6) Managed pasture (7) Tree crops (cashew, citrus/avocado, high/medium elevation coffee) and pastures (8) Protection forests/mangroves and bush/shrubland (9) Settlements and tourism areas (10) Other/miscellaneous
Source: JICA Study Team.
Future land use
Land use distribution expected in 2019 is shown in Figure 6.3 and Table 6.10. As seen in the table, the area for basic grains occupies 125,670ha, just sufficient for self-sufficiency in staple maize and production of green maize and sorghum to support dairy farming (Subsection 6.1.3). Irrigated agriculture is found only in 7,257ha but portions of land for intensive upland and lowland agriculture may be devoted to irrigated agriculture as well. The area for managed
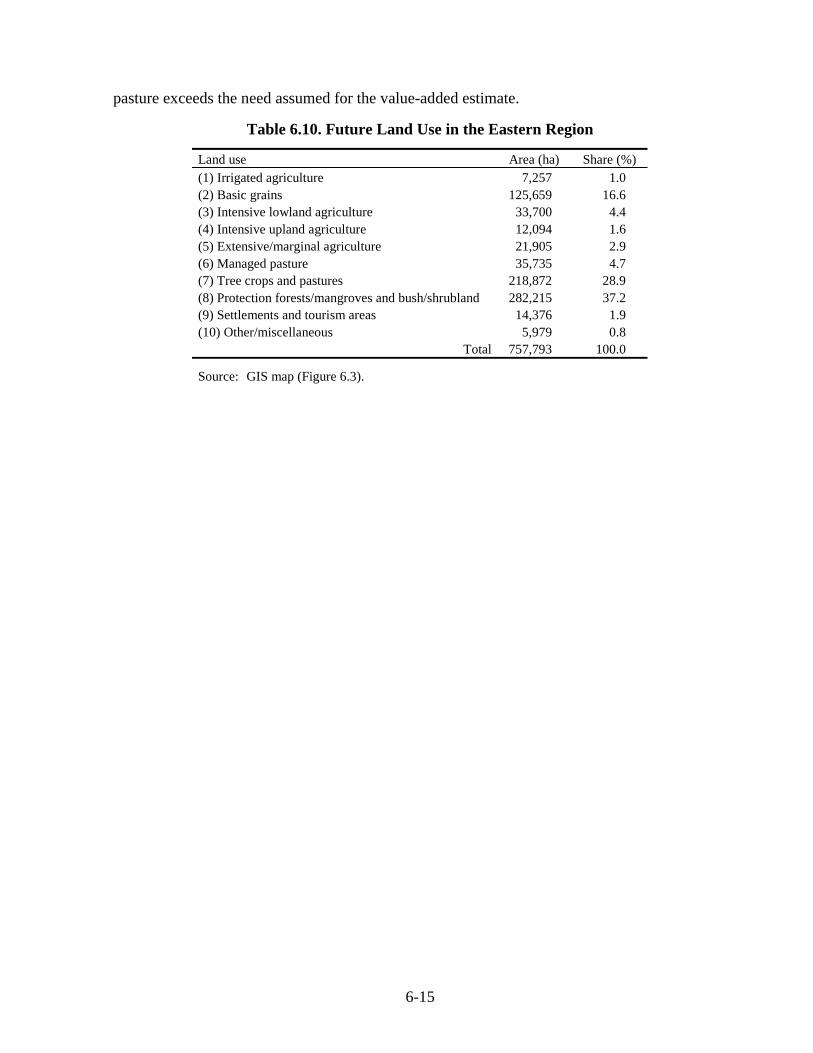
6-15
pasture exceeds the need assumed for the value-added estimate.
Table 6.10. Future Land Use in the Eastern Region
Land use Area (ha) Share (%) (1) Irrigated agriculture 7,257 1.0 (2) Basic grains 125,659 16.6 (3) Intensive lowland agriculture 33,700 4.4 (4) Intensive upland agriculture 12,094 1.6 (5) Extensive/marginal agriculture 21,905 2.9 (6) Managed pasture 35,735 4.7 (7) Tree crops and pastures 218,872 28.9 (8) Protection forests/mangroves and bush/shrubland 282,215 37.2 (9) Settlements and tourism areas 14,376 1.9 (10) Other/miscellaneous 5,979 0.8
Total 757,793 100.0
Source: GIS map (Figure 6.3).
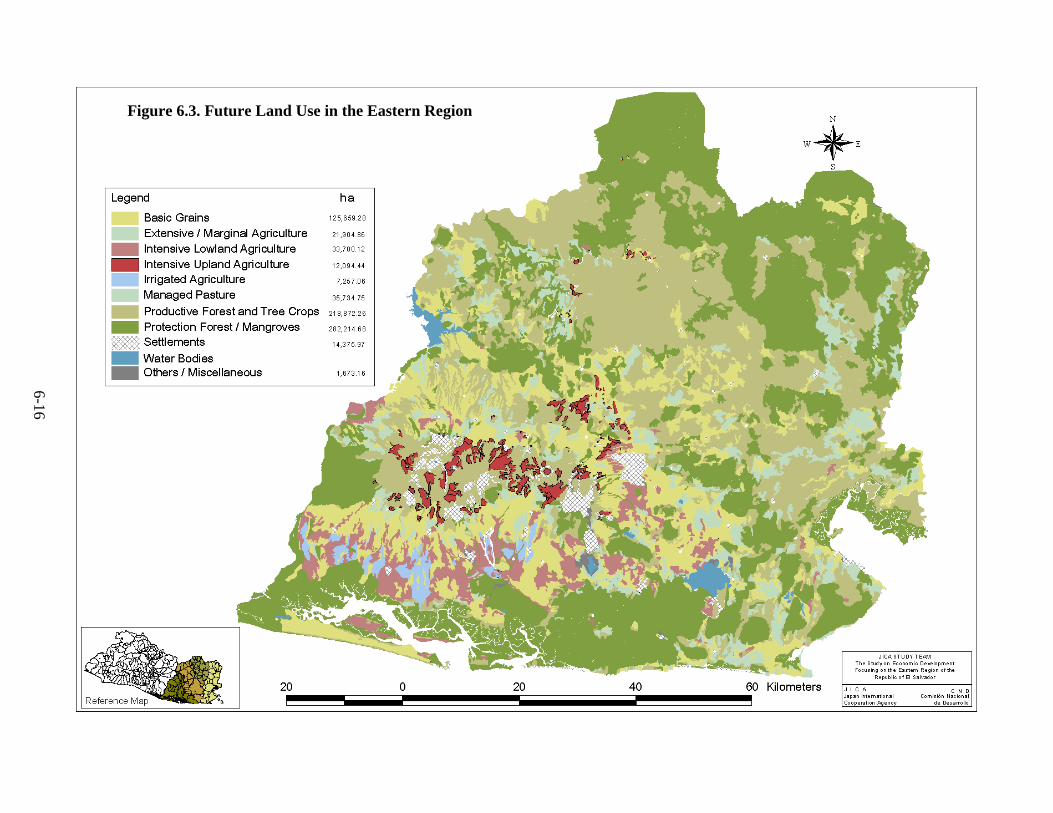
6-16
Figure 6.3. Future Land Use in the Eastern Region
6-16
7-1
Chapter 7 DEVELOPMENT SCENARIO FOR THE EASTERN REGION WITH LA UNION PORT
REVITALIZATION
7.1 Scenario for the La Union Port Revitalization
7.1.1 Development of traffic demand
The revitalization of the La Union port depends naturally on the development of demand for port utilization. Therefore, the existing traffic demand estimates are reviewed in relation to the economic development of El Salvador and the Eastern Region development. Future traffics for the La Union port consist of the traffic to be diverted from existing ports, the traffic to be newly generated as the result of the development of El Salvador and the Eastern Region, and the traffic to be induced by the upgraded port facilities. The traffic inducement depends particularly on comparative costs of transportation via the La Union port and other existing ports and transfer routes. Comparative analysis is conducted on freight costs to see the extent to which the La Union port may induce traffic.
(1) Review of existing traffic demand estimates
The detailed design of the La Union port revitalization project provides macro and micro analyses on the traffic demand. The macro analysis estimated import and export traffics by correlating the future volume of import and export with the future GDP of El Salvador and the observed GDP development of major trade partners of El Salvador, viz. the U.S., Central America and Germany. To forecast the GDP in the target years, an annual growth rate of 3.5% was assumed. This is slightly lower than the present GDP projection adopted for the Study (Section 6.1).
The main assumptions in allocating cargo transport through the La Union port are as follows.
1) The Salvadoran cargo transport through the Quetzal port in Guatemala, which is mostly containers, will be shifted to the La Union port. The usage of the Quetzal port for Salvadoran cargoes is attributed to the lack of competitiveness of the Acajutla port in handling containers. It is expected that the La Union port will attract not only cargoes for El Salvador but also part of traffic cargoes from Guatemala, Honduras and Nicaragua currently handled at Pacific ports of these countries.
2) A new pattern of sea borne transportation will emerge when the La Union port becomes operational. Panamax ships servicing from the east coast of the U.S. and Europe through the Panama canal to the west coast of the U.S. and Asia will call in the La Union port.
3) The total transport cost, comprising sea borne and land transport, between the east coast of the U.S. and San Salvador via the La Union port is lower than that via Caribbean ports in Guatemala and Honduras. Although the traffic demand for the La Union port with regard to cargo transport via Caribbean ports will probably remain low in the short run, it is
7-2
considered to be potential demand for the La Union port in the long term.
4) Population growth rates are assumed at 1.84% for 2001-2005 and 1.50% for 2005-2015, based on the historical trend and estimation by the U.N.
5) The share of Salvadoran ports in the total cargo traffic by all the transport modes is assumed to be 40% for import through the target years and 29% for export from 2005 through 2015 based on the historical trend.
Under these assumptions, the macro estimate of cargo volume through ports in El Salvador is estimated to be 3.7 million MT in 2005, 4.9 million MT in 2010, and 6.4 million MT in 2015.
The microanalysis projected import and export of each commodity by correlation analyses on the GDP, sector GDP and population. Import and export volumes in the target years were determined for each of the main trade commodities in general cargo, dry bulk and liquid bulk. The total overseas trade cargo volume through ports in El Salvador was forecast at 3.1 million MT in 2005, 3.8 million MT in 2010, and 4.6 million MT in 2015. In addition, the local container cargo volume handled at ports in El Salvador was estimated by the current cargo movement through the Quetzal port of Guatemala and the Acajutla port. It was forecast to be 547,000MT in 2005, 827,000MT in 2010, and 1,248,000MT in 2015. Thus, the total cargo volume through ports in El Salvador would be 3.7 million MT in 2005, 4.6 million MT in 2010, and 5.8 million MT in 2015. These micro estimates are considered to be consistent with the macro estimates, with a variance 10% or smaller throughout the forecast period.
The conventional cargo volume through ports in El Salvador was allocated to the Acajutla and the La Union ports based on comparative transport costs estimated for the main trade commodities. The allocation of cargoes at the Acajutla port was determined by cost advantages estimated on the basis of the current characteristics of vessels, origins/destinations of cargoes, cargo lot per vessel, and shipping routes. In the case of the La Union port, the assumptions were that Panamax bulkers could be received at the port and that current origins/destinations would be the same as those at the Acajutla port. In both cases, import destinations and export origins were set within San Salvador.
For container cargoes, the allocation to the La Union port was determined separately for local container cargoes and transit containers to be attracted to the La Union port. It was found that the La Union port could attract local containers from all over the Country despite its disadvantage of longer road distance to/from San Salvador as compared with the Acajutla port. This disadvantage would be largely compensated by the use of larger container ships and more efficient container handling operations even on the route to the U.S. west coast and much more on the route to Asia.
The new container terminal at the La Union port is expected to attract not only Salvadoran local containers but also transit containers destined to or originating from the neighboring countries.
7-3
The cost analysis by the DD indicates that on the trans-Pacific routes connecting Asia and America, the La Union port would have an advantage in the total inter-modal transport costs over the neighboring principal ports, viz., Quetzal in Guatemala and Corinto in Nicaragua. En route to the U.S. west coast, however, the La Union port would be at an advantage in transport costs only over the San Lorenzo port in Honduras. Finally, the cargo volume handled at the La Union port in the future up to 2015 is estimated as summarized in Table 7.1.
Table 7.1. Forecast Cargo Volume at La Union Port
Cargo type 2005 2010 2015 Import 555 657 771 Export 70 70 70
General cargo, dry bulk and liquid bulk (103MT)
Total 625 727 841 Containers (103TEUs) 121 185 275
Source: DD Report by JICA.
(2) Comparative cost analysis on transshipment
To assess the potential for the use of the La Union port for transshipment on the Pacific side, transport costs are analyzed comparatively for alternative transport routes. Both land and sea transport costs vary widely depending on transport conditions (e.g., road conditions and border crossing procedure for land transport, and vessel size, port facilities and operation, and contents and occupancy of containers for sea transport). Particularly, the total transport cost is very sensitive to inter-modal factors (e.g., operating conditions and time for loading and unloading at ports). For the comparative cost analysis here, net transport costs are compared based on the model conditions assumed for the representative vessel size and standard operations at different ports. The unit data for this model comparison of transport costs are provided in Table 7.2. Various other costs specific to different transport routes are not included in the net transport costs. Including, for instance, insurance, which may be more or less proportional to the value of cargo contents and the duration of transport (e.g., border crossing and anchorage of vessels), the total transport costs could be several times higher than the net transport costs.
Table 7.2. Unit Data for Model Comparison of Transport Costs
Cost element Unit/condition 1,270 TEU ship 4,800 TEU ship (1) Service charge at port* US$50,000/vessel US$39/TEU US$10/TEU (2) Cost at anchorage† per vessel US$14,877/day US$39,451/day (3) On/off loading costs* US$50/container US$30/TEU US$30/TEU (4) Cost at navigation† per vessel US$20,926/day US$66,494/day (5) Average navigational velocity* 9 knots 15 knots (6) Days at anchorage* high-grade ports
other ports 2 3
-- --
* based on CEPA estimates and JICA Study Team’s survey; † DD Report by JICA.
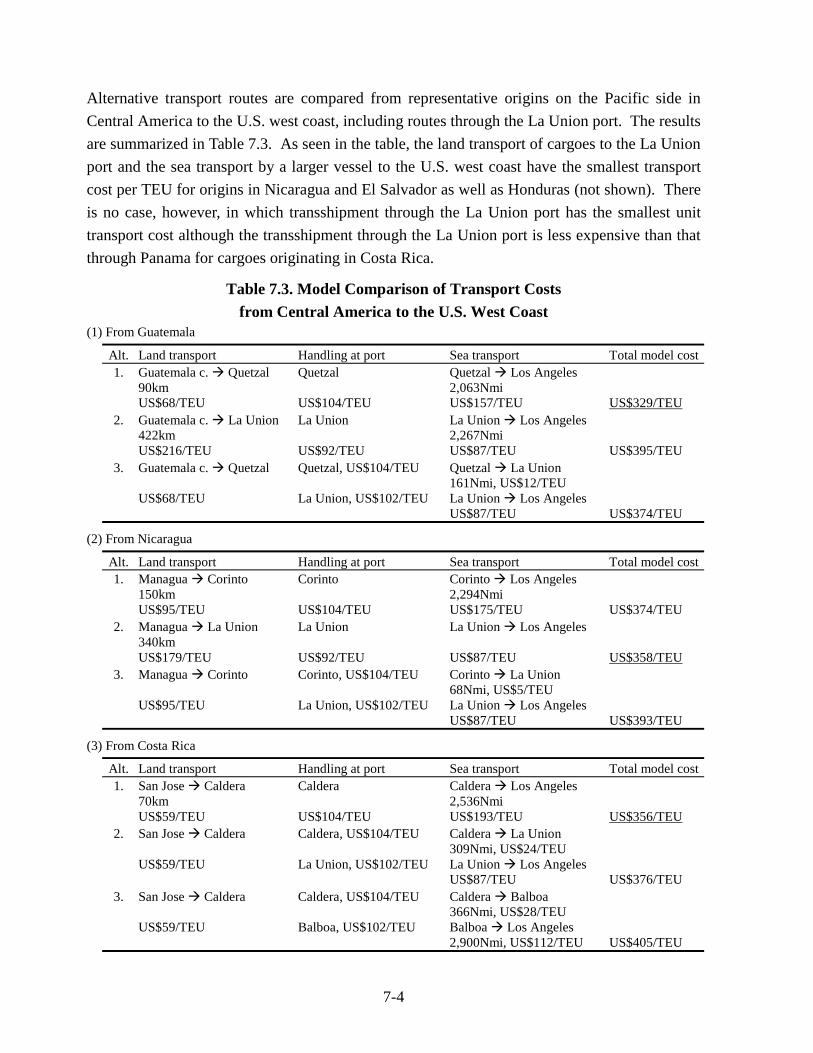
7-4
Alternative transport routes are compared from representative origins on the Pacific side in Central America to the U.S. west coast, including routes through the La Union port. The results are summarized in Table 7.3. As seen in the table, the land transport of cargoes to the La Union port and the sea transport by a larger vessel to the U.S. west coast have the smallest transport cost per TEU for origins in Nicaragua and El Salvador as well as Honduras (not shown). There is no case, however, in which transshipment through the La Union port has the smallest unit transport cost although the transshipment through the La Union port is less expensive than that through Panama for cargoes originating in Costa Rica.
Table 7.3. Model Comparison of Transport Costs from Central America to the U.S. West Coast
(1) From Guatemala
Alt. Land transport Handling at port Sea transport Total model cost 1. Guatemala c. Quetzal
90km US$68/TEU
Quetzal US$104/TEU
Quetzal Los Angeles 2,063Nmi US$157/TEU
US$329/TEU
2. Guatemala c. La Union 422km US$216/TEU
La Union US$92/TEU
La Union Los Angeles 2,267Nmi US$87/TEU
US$395/TEU
3. Guatemala c. Quetzal US$68/TEU
Quetzal, US$104/TEU La Union, US$102/TEU
Quetzal La Union 161Nmi, US$12/TEU La Union Los Angeles US$87/TEU
US$374/TEU
(2) From Nicaragua
Alt. Land transport Handling at port Sea transport Total model cost 1. Managua Corinto
150km US$95/TEU
Corinto US$104/TEU
Corinto Los Angeles 2,294Nmi US$175/TEU
US$374/TEU
2. Managua La Union 340km US$179/TEU
La Union US$92/TEU
La Union Los Angeles US$87/TEU
US$358/TEU
3. Managua Corinto US$95/TEU
Corinto, US$104/TEU La Union, US$102/TEU
Corinto La Union 68Nmi, US$5/TEU La Union Los Angeles US$87/TEU
US$393/TEU
(3) From Costa Rica
Alt. Land transport Handling at port Sea transport Total model cost 1. San Jose Caldera
70km US$59/TEU
Caldera US$104/TEU
Caldera Los Angeles 2,536Nmi US$193/TEU
US$356/TEU
2. San Jose Caldera US$59/TEU
Caldera, US$104/TEU La Union, US$102/TEU
Caldera La Union 309Nmi, US$24/TEU La Union Los Angeles US$87/TEU
US$376/TEU
3. San Jose Caldera US$59/TEU
Caldera, US$104/TEU Balboa, US$102/TEU
Caldera Balboa 366Nmi, US$28/TEU Balboa Los Angeles 2,900Nmi, US$112/TEU
US$405/TEU
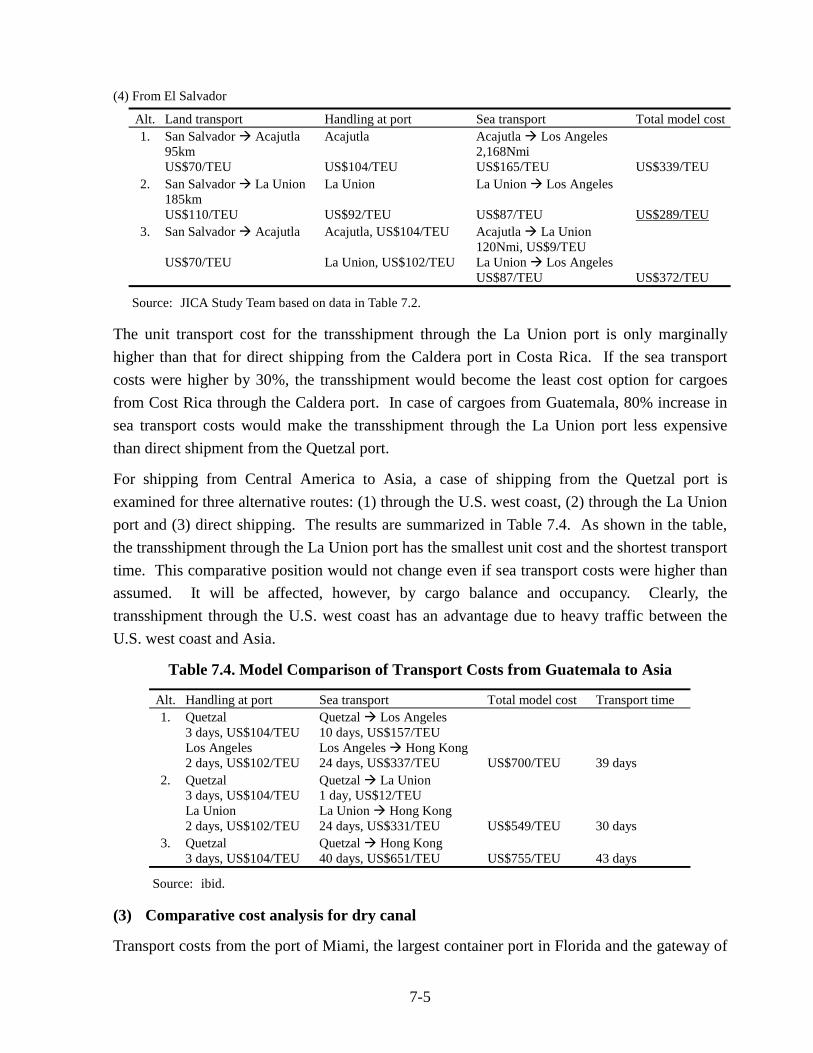
7-5
(4) From El Salvador
Alt. Land transport Handling at port Sea transport Total model cost 1. San Salvador Acajutla
95km US$70/TEU
Acajutla US$104/TEU
Acajutla Los Angeles 2,168Nmi US$165/TEU
US$339/TEU
2. San Salvador La Union 185km US$110/TEU
La Union US$92/TEU
La Union Los Angeles US$87/TEU
US$289/TEU
3. San Salvador Acajutla US$70/TEU
Acajutla, US$104/TEU La Union, US$102/TEU
Acajutla La Union 120Nmi, US$9/TEU La Union Los Angeles US$87/TEU
US$372/TEU
Source: JICA Study Team based on data in Table 7.2.
The unit transport cost for the transshipment through the La Union port is only marginally higher than that for direct shipping from the Caldera port in Costa Rica. If the sea transport costs were higher by 30%, the transshipment would become the least cost option for cargoes from Cost Rica through the Caldera port. In case of cargoes from Guatemala, 80% increase in sea transport costs would make the transshipment through the La Union port less expensive than direct shipment from the Quetzal port.
For shipping from Central America to Asia, a case of shipping from the Quetzal port is examined for three alternative routes: (1) through the U.S. west coast, (2) through the La Union port and (3) direct shipping. The results are summarized in Table 7.4. As shown in the table, the transshipment through the La Union port has the smallest unit cost and the shortest transport time. This comparative position would not change even if sea transport costs were higher than assumed. It will be affected, however, by cargo balance and occupancy. Clearly, the transshipment through the U.S. west coast has an advantage due to heavy traffic between the U.S. west coast and Asia.
Table 7.4. Model Comparison of Transport Costs from Guatemala to Asia
Alt. Handling at port Sea transport Total model cost Transport time 1. Quetzal
3 days, US$104/TEU Los Angeles 2 days, US$102/TEU
Quetzal Los Angeles 10 days, US$157/TEU Los Angeles Hong Kong 24 days, US$337/TEU
US$700/TEU
39 days
2. Quetzal 3 days, US$104/TEU La Union 2 days, US$102/TEU
Quetzal La Union 1 day, US$12/TEU La Union Hong Kong 24 days, US$331/TEU
US$549/TEU
30 days
3. Quetzal 3 days, US$104/TEU
Quetzal Hong Kong 40 days, US$651/TEU
US$755/TEU
43 days
Source: ibid.
(3) Comparative cost analysis for dry canal
Transport costs from the port of Miami, the largest container port in Florida and the gateway of
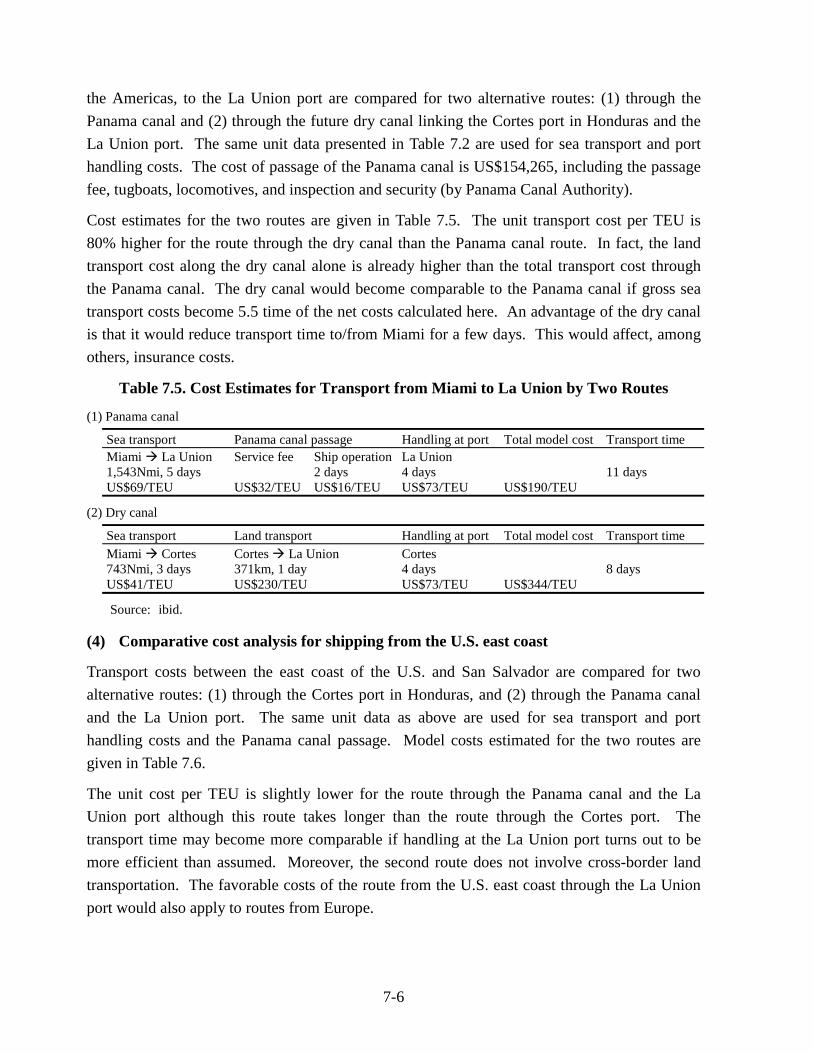
7-6
the Americas, to the La Union port are compared for two alternative routes: (1) through the Panama canal and (2) through the future dry canal linking the Cortes port in Honduras and the La Union port. The same unit data presented in Table 7.2 are used for sea transport and port handling costs. The cost of passage of the Panama canal is US$154,265, including the passage fee, tugboats, locomotives, and inspection and security (by Panama Canal Authority).
Cost estimates for the two routes are given in Table 7.5. The unit transport cost per TEU is 80% higher for the route through the dry canal than the Panama canal route. In fact, the land transport cost along the dry canal alone is already higher than the total transport cost through the Panama canal. The dry canal would become comparable to the Panama canal if gross sea transport costs become 5.5 time of the net costs calculated here. An advantage of the dry canal is that it would reduce transport time to/from Miami for a few days. This would affect, among others, insurance costs.
Table 7.5. Cost Estimates for Transport from Miami to La Union by Two Routes
(1) Panama canal
Sea transport Panama canal passage Handling at port Total model cost Transport time Miami La Union 1,543Nmi, 5 days US$69/TEU
Service fee US$32/TEU
Ship operation 2 days US$16/TEU
La Union 4 days US$73/TEU
US$190/TEU
11 days
(2) Dry canal
Sea transport Land transport Handling at port Total model cost Transport time Miami Cortes 743Nmi, 3 days US$41/TEU
Cortes La Union 371km, 1 day US$230/TEU
Cortes 4 days US$73/TEU
US$344/TEU
8 days
Source: ibid.
(4) Comparative cost analysis for shipping from the U.S. east coast
Transport costs between the east coast of the U.S. and San Salvador are compared for two alternative routes: (1) through the Cortes port in Honduras, and (2) through the Panama canal and the La Union port. The same unit data as above are used for sea transport and port handling costs and the Panama canal passage. Model costs estimated for the two routes are given in Table 7.6.
The unit cost per TEU is slightly lower for the route through the Panama canal and the La Union port although this route takes longer than the route through the Cortes port. The transport time may become more comparable if handling at the La Union port turns out to be more efficient than assumed. Moreover, the second route does not involve cross-border land transportation. The favorable costs of the route from the U.S. east coast through the La Union port would also apply to routes from Europe.
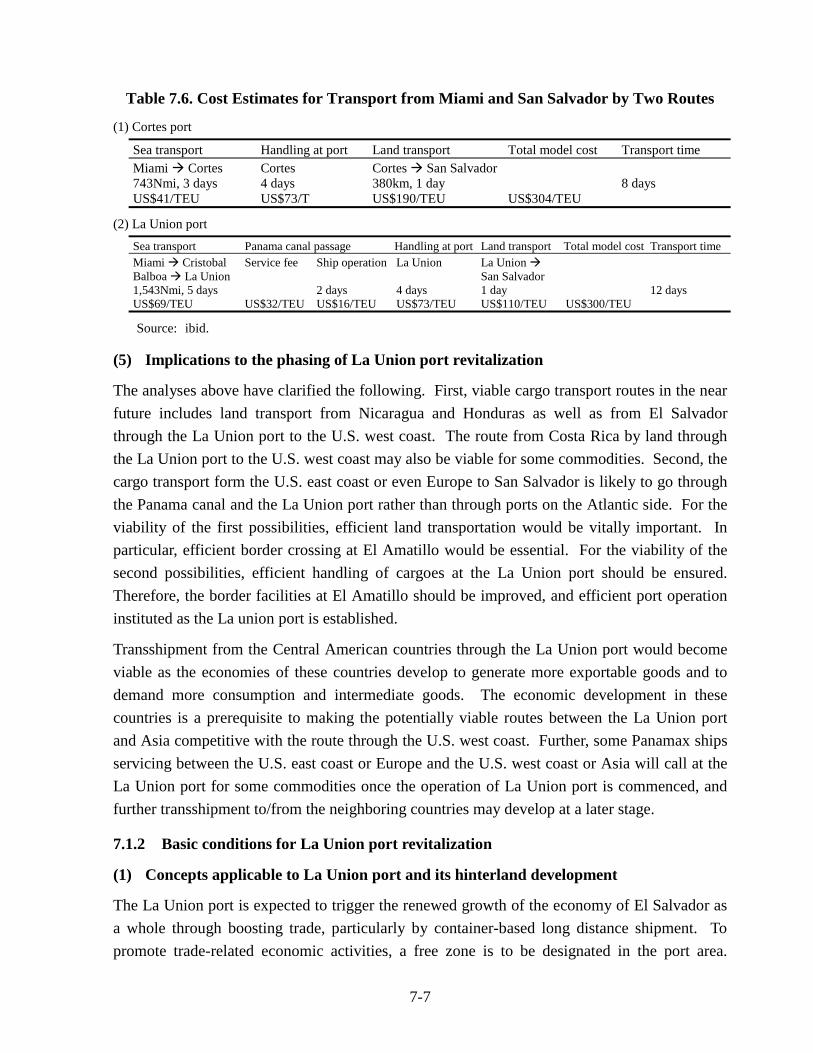
7-7
Table 7.6. Cost Estimates for Transport from Miami and San Salvador by Two Routes
(1) Cortes port
Sea transport Handling at port Land transport Total model cost Transport time Miami Cortes 743Nmi, 3 days US$41/TEU
Cortes 4 days US$73/T
Cortes San Salvador 380km, 1 day US$190/TEU
US$304/TEU
8 days
(2) La Union port
Sea transport Panama canal passage Handling at port Land transport Total model cost Transport time Miami Cristobal Balboa La Union 1,543Nmi, 5 days US$69/TEU
Service fee US$32/TEU
Ship operation 2 days US$16/TEU
La Union 4 days US$73/TEU
La Union San Salvador 1 day US$110/TEU
US$300/TEU
12 days
Source: ibid.
(5) Implications to the phasing of La Union port revitalization
The analyses above have clarified the following. First, viable cargo transport routes in the near future includes land transport from Nicaragua and Honduras as well as from El Salvador through the La Union port to the U.S. west coast. The route from Costa Rica by land through the La Union port to the U.S. west coast may also be viable for some commodities. Second, the cargo transport form the U.S. east coast or even Europe to San Salvador is likely to go through the Panama canal and the La Union port rather than through ports on the Atlantic side. For the viability of the first possibilities, efficient land transportation would be vitally important. In particular, efficient border crossing at El Amatillo would be essential. For the viability of the second possibilities, efficient handling of cargoes at the La Union port should be ensured. Therefore, the border facilities at El Amatillo should be improved, and efficient port operation instituted as the La union port is established.
Transshipment from the Central American countries through the La Union port would become viable as the economies of these countries develop to generate more exportable goods and to demand more consumption and intermediate goods. The economic development in these countries is a prerequisite to making the potentially viable routes between the La Union port and Asia competitive with the route through the U.S. west coast. Further, some Panamax ships servicing between the U.S. east coast or Europe and the U.S. west coast or Asia will call at the La Union port for some commodities once the operation of La Union port is commenced, and further transshipment to/from the neighboring countries may develop at a later stage.
7.1.2 Basic conditions for La Union port revitalization
(1) Concepts applicable to La Union port and its hinterland development
The La Union port is expected to trigger the renewed growth of the economy of El Salvador as a whole through boosting trade, particularly by container-based long distance shipment. To promote trade-related economic activities, a free zone is to be designated in the port area.
7-8
There are various types of free zones established in the world with different functions and area coverage as well as management organizations. A few viable concepts applicable to the La Union port area are first clarified.
First, the free zone should be established as a growth center with multiple functions rather than just a port for free trade near a small town. It should be equipped with urban functions and various facilities from an early stage of the development. To allow the location of various functions and facilities expected for a growth center, a large area needs to be designated for special purposes. The port area and the large hinterland area may be called the “free port and economic zone (FPEZ)”.
Second, a free zone (FZ) should be established in the immediate hinterland of the port. While the exemption of custom duties tends to become less attractive for investors to locate in an FZ as free trade agreements are promoted, introduction of value-added tax, local taxes and other measures to secure sufficient national revenue under free trade makes their exemption in the FZ still attractive. Also, the FZ allows free transaction and treatment of goods within its territory such as labeling, cleaning, re-packing, selection, repair and disposal. This is another advantage, not enjoyed for instance by bonded warehousing outside the FZ. Common service facilities provided by the FZ offer additional incentives for investors in the FZ. They include processing facilities, storage and distribution facilities such as warehouses and a truck yard, facilities for exhibition of goods and other functions, and an information center as well as a customs office. Moreover, as more industries locate in the FZ, they enjoy generally both the scale economy due to efficiency by large-scale operation and the scope economy through effective combination of goods and services.
Third, the FPEZ should serve increasingly as an international logistic center linked with free zones in other regions and countries, offering storage, transport and distribution, packing and re-packing, and processing functions for goods from many countries. As the international division of work proceeds, transport and distribution functions become increasingly more important part of manufacturing industry. Good and reliable logistic functions alone can attract some industries. The logistic center may be effectively established at an early stage for products from neighboring countries for export. Certification for products with quality control is an important function especially for agro-products.
In sum, the FPEZ is to be designated for a large area, encompassing the port area, the present and future urban areas, area to locate various facilities, and some conservation area to ensure the overall amenity of the FPEZ. The FZ is to be designated within the FPEZ in the immediate hinterland of the port with a standard set of functions and facilities as suggested above. Functions for the logistic center are to develop in steps, starting with products from neighboring countries. Facilities as the growth center include office district, commercial center, hotels and tourism facilities, and urban parks as well as housing, the FZ and other industrial areas.
7-9
(2) Success factors for free zones (FZs) and industrial estates
Success of free zones and industrial estates in attracting investments depends on various factors. They include (i) government support, (ii) global economic conditions, (iii) locational factors, (iv) target industries, and (v) operation and management (Box 3). In relation to the FPEZ in the La Union-Conchagua area, factors (i) and (ii) are strongly related to CAFTA and WTO, which affect also factors (iii) and (iv). Location of textile and apparel industries, most dominant in free zones in El Salvador, would not be much affected by CAFTA as analyzed in Subsection 5.1.4. Tax exemption after 2010 in accordance with WTO will apply to all the neighboring countries equally and thus will not affect the investment flow in any significant way. Location of other industries would depend dominantly by various locational conditions of the FPEZ.
Box 3
Free Zones Development in Asian Developing Countries
1. Eastern Seaboard Development, Thailand The Eastern Seaboard (ESB) Region of Thailand had favorable locational conditions such as the proximity to the Bangkok metropolitan area (BMA), favorable conditions for the construction of deep-sea ports, and lands suitable for industrial development. The Thai government prioritized the ESB development in its five-year socioeconomic development plan (1982-86). All the port facilities, industrial estates and related infrastructures completed by early 1990’s, and the ESB region is now the second largest economic zone next to the BMA. Success factors of the ESB development are the following. (1) Government initiative: The development was promoted under the government ownership in line
with the national plan. Investors were attracted by 1) incentive measures, 2) transport infrastructure, and 3) public utility services.
(2) Global economic conditions: Foreign investments, mainly by Japanese firms, expanded rapidly in 1980’s, which induced the development of local firms and capital. Investments by those local firms and subcontracting firms followed in 1990s.
(3) Locational conditions: Other than the conditions listed above, over-concentration of industries in the BMA induced the industrial location in the ESB.
(4) Target industries: Originally export-oriented light industries were targeted, but flexible invitation policy allowed the location of a wide range of assembly industries for automobiles, electric appliances and electronics.
(5) Operation and management – The industrial Estate Authority was established for exclusive operation and management. The land leasing system with relatively low rents, however, is undermining the financial condition of the Authority, resulting in unsatisfactory services.
2. FTZs in Malaysia The FTZ law was enacted in 1971 to attract FDIs in Malaysia, and eight FTZs were established in 1970s, where 28 Japanese and 26 U.S. firms located. During 1980’s, SMEs and subcontracting firms to supply parts and intermediate goods for large manufacturers located in industrial estates (IEs) next to FTZs, contributing to industrial agglomeration. These large enterprises and SMEs are labor-intensive and export-oriented, contributing to industrial development and employment generation. Linkages with local industries, however, are still limited. The successful industrialization with FTZs has resulted in labor shortages and land price escalation as well as widened inter-regional disparities. The Malaysian government has now shifted its industrialization policy with objectives to develop high-tech industries, and to cultivate SMEs. As a
7-10
measure to develop high-tech industries, high-tech parks have been constructed in major industrial areas to invite knowledge-intensive industries such as IT and biotechnology firms, and those to link with existing electronics industries. These high-tech parks are equipped with an incubation center, research and testing laboratory, urban facilities, housing and amenity facilities. Also, industrial estates to accommodate SMEs are developed to cultivate linkage industries. The Malaysia Industrial Estate Ltd., a State firm, is developing industrial estates for local SMEs. In addition to land development, construction of factory buildings for rent and low cost housing is also undertaken. To further promote the accumulation of SMEs and linkage industries, cooperation between the government, public institutes and the private sector has been pursued.
3. Direction of IE development in ASEAN countries Both the public and the private sectors have undertaken IE development in Asian developing countries. The development by the public sector has been under the clearly established industrialization policy of respective governments, and undertaken directly by the central government, local government or public corporation created exclusively for the purpose. The IE development by local or foreign firms provides not only land development and infrastructure provision but also various business services that located firms need. They include: 1) services related to the establishment of firms or construction of factories, 2) support for acquisition of labor permit, custom clearance etc., 3) agent services for accounting and tax declaration, 4) management, finance, personnel and training related services, and 5) insurance and leasing business. These services are not simply part of attracting investments, but business by itself after the land sales. That is, the IE development by the private sector is undertaken increasingly as IE management service business rather than sales of industrial lands.
References: 1. JBIC, Ex-Post Evaluation, “Eastern Seaboard Development Plan Impact Evaluation”, April 2000;
JICA/OECF Joint Evaluation, “Eastern Seaboard Development Program (Thailand)”, 2000. 2 & 3. M. Kawabata & M. Miyanaga, Dai-kyoso jidai no ‘mono zukuri’ kyoten (in Japanese), Ryukoku
Univ. Research Institute for Social Sciences, February 1998.
(3) Locational conditions
According to the Foreign Direct Investment Survey by MIGA, most important locational conditions for investors are: 1) market access, 2) stable social and political environment, 3) ease of doing business, 4) reliability and quality of infrastructure and utilities, and 5) ability to hire technical professionals (Table 7.7). For those to locate in the FPEZ, market access will improve by the La Union port and CAFTA, and social and political environment is relatively stable in the Eastern Region as in El Salvador. Relatively well-established institutions related to investment in El Salvador under open economy should apply to the Region as well for ease of doing business. To satisfy the last two conditions, infrastructure and utilities should be much improved for the FPEZ, and technical and management staff should be trained at existing and new institutions. The concern on crime and safety has increased among investors especially after the 9/11 incident, but security and safety in the Eastern Region as well as in El Salvador has been improving steadily in recent years as revealed by the survey conducted as part of the Study.
(4) Characterization of the FPEZ
The FPEZ is to be established to offer internationally first-class business environment to satisfy
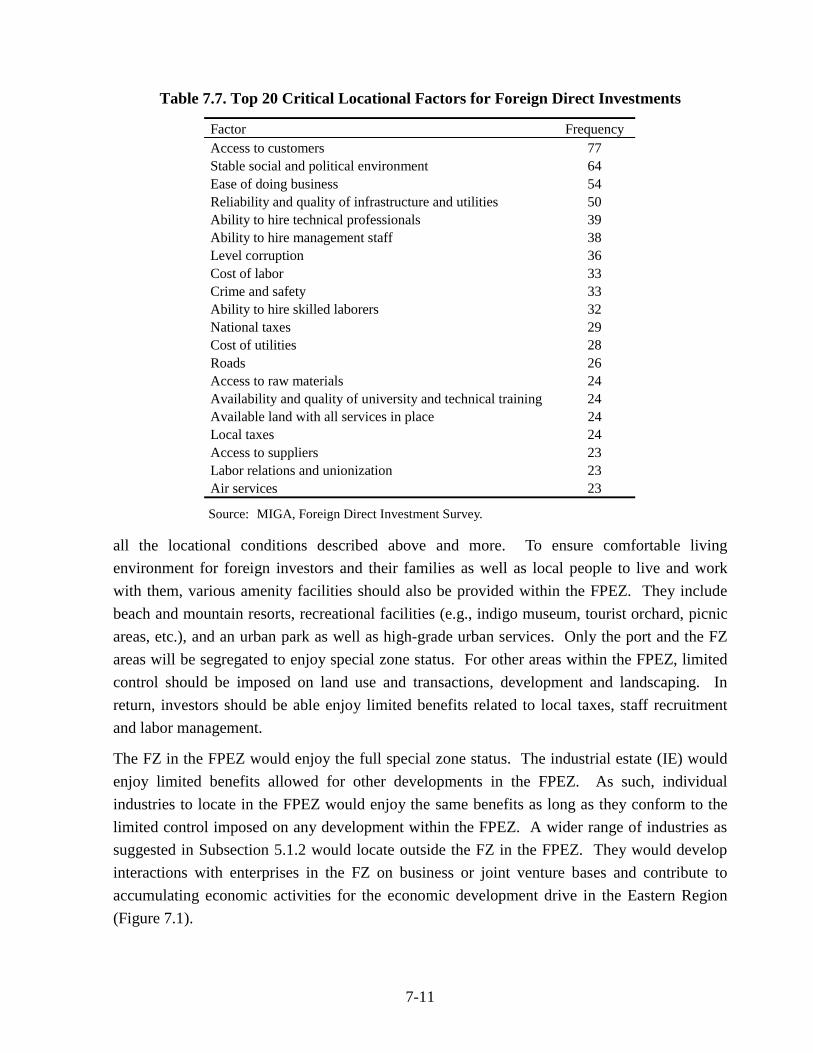
7-11
Table 7.7. Top 20 Critical Locational Factors for Foreign Direct Investments
Factor Frequency Access to customers 77 Stable social and political environment 64 Ease of doing business 54 Reliability and quality of infrastructure and utilities 50 Ability to hire technical professionals 39 Ability to hire management staff 38 Level corruption 36 Cost of labor 33 Crime and safety 33 Ability to hire skilled laborers 32 National taxes 29 Cost of utilities 28 Roads 26 Access to raw materials 24 Availability and quality of university and technical training 24 Available land with all services in place 24 Local taxes 24 Access to suppliers 23 Labor relations and unionization 23 Air services 23
Source: MIGA, Foreign Direct Investment Survey.
all the locational conditions described above and more. To ensure comfortable living environment for foreign investors and their families as well as local people to live and work with them, various amenity facilities should also be provided within the FPEZ. They include beach and mountain resorts, recreational facilities (e.g., indigo museum, tourist orchard, picnic areas, etc.), and an urban park as well as high-grade urban services. Only the port and the FZ areas will be segregated to enjoy special zone status. For other areas within the FPEZ, limited control should be imposed on land use and transactions, development and landscaping. In return, investors should be able enjoy limited benefits related to local taxes, staff recruitment and labor management.
The FZ in the FPEZ would enjoy the full special zone status. The industrial estate (IE) would enjoy limited benefits allowed for other developments in the FPEZ. As such, individual industries to locate in the FPEZ would enjoy the same benefits as long as they conform to the limited control imposed on any development within the FPEZ. A wider range of industries as suggested in Subsection 5.1.2 would locate outside the FZ in the FPEZ. They would develop interactions with enterprises in the FZ on business or joint venture bases and contribute to accumulating economic activities for the economic development drive in the Eastern Region (Figure 7.1).
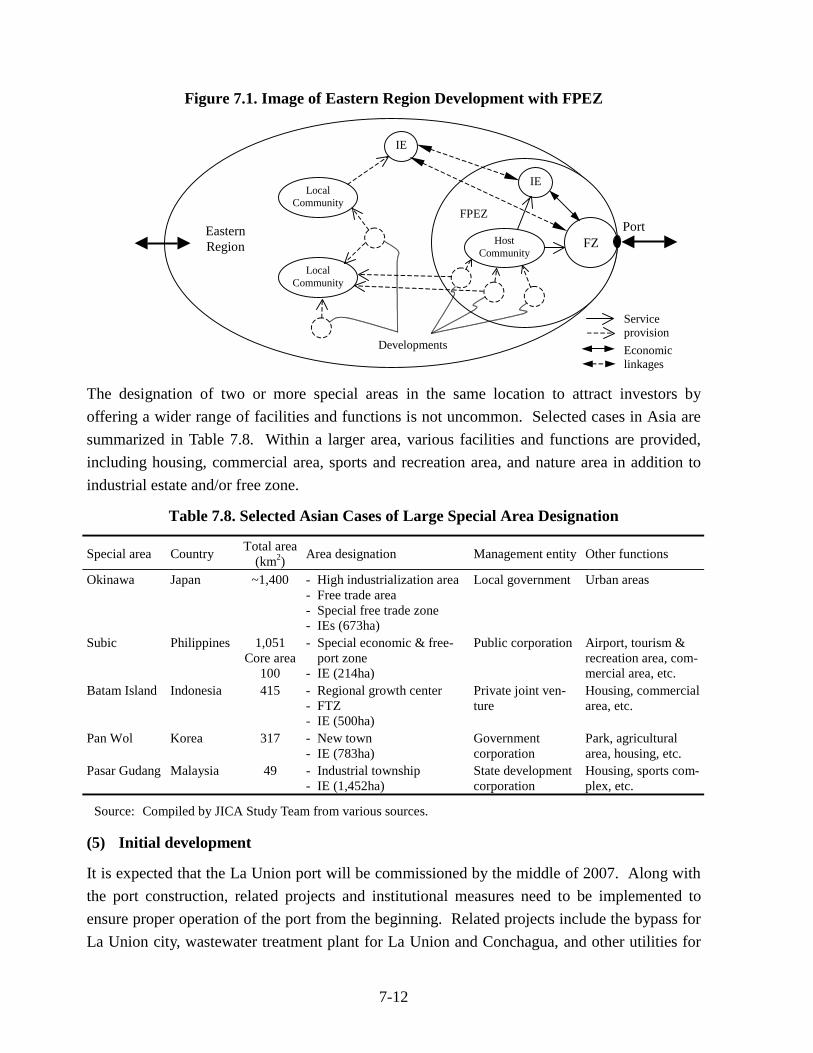
7-12
Figure 7.1. Image of Eastern Region Development with FPEZ
The designation of two or more special areas in the same location to attract investors by offering a wider range of facilities and functions is not uncommon. Selected cases in Asia are summarized in Table 7.8. Within a larger area, various facilities and functions are provided, including housing, commercial area, sports and recreation area, and nature area in addition to industrial estate and/or free zone.
Table 7.8. Selected Asian Cases of Large Special Area Designation
Special area Country Total area (km2) Area designation Management entity Other functions
Okinawa Japan ~1,400 - High industrialization area - Free trade area - Special free trade zone - IEs (673ha)
Local government Urban areas
Subic Philippines 1,051 Core area
100
- Special economic & free-port zone
- IE (214ha)
Public corporation Airport, tourism & recreation area, com-mercial area, etc.
Batam Island Indonesia 415 - Regional growth center - FTZ - IE (500ha)
Private joint ven-ture
Housing, commercial area, etc.
Pan Wol Korea 317 - New town - IE (783ha)
Government corporation
Park, agricultural area, housing, etc.
Pasar Gudang Malaysia 49 - Industrial township - IE (1,452ha)
State development corporation
Housing, sports com-plex, etc.
Source: Compiled by JICA Study Team from various sources.
(5) Initial development
It is expected that the La Union port will be commissioned by the middle of 2007. Along with the port construction, related projects and institutional measures need to be implemented to ensure proper operation of the port from the beginning. Related projects include the bypass for La Union city, wastewater treatment plant for La Union and Conchagua, and other utilities for
Service provision Economic linkages
FZ Host Community
IE
IE
Local Community
Local Community
Developments
Eastern Region
Port FPEZ
7-13
the port and its immediate vicinity. Border facilities at El Amatillo should be improved, starting with the relocation of the bridge. Improvement of living conditions in La Union city should also be initiated, including waterfront rehabilitation as currently planned by CND, improvement of solid waste management, establishment of a municipal market and slaughterhouse, and water supply expansion.
The comparative cost analyses in the previous subsection indicate that the transport cost by sea between La Union and Nicaragua is smaller than the land transport cost if full cargo load is ensured and port operation is efficient. These conditions may be realized for ferry operation between La Union and Nicaragua.
Establishment of a new management entity for the port itself is a matter of urgency in view of the implementation schedule of the La Union port. A new law has been passed to allow the Maritime Port Authority (AMP) to be established for the purpose but its specific mandates are to be worked out urgently. Such mandates should make provision for the establishment of a development corporation having areal jurisdiction. The FPEZ is to be designated, including a conservation area around the Fonseca gulf and the Conchagua volcano. The FZ is to be established in the port area in combination with a common IE in the vicinity.
A management plan for the Fonseca gulf-Conchagua conservation area should be prepared by the participation of local communities and people, including indigenous minority. Cooperative management of the Fonseca gulf with Honduras and Nicaragua should be institutionalized extending the Progolfo initiative.
7.1.3 La Union port revitalization by phase
The revitalization of the La Union port would be realized through sequence of activities to develop and events to take place after the new port facilities are established. Export and import would expand and diversify, and other port-related activities would develop in steps. To create a growth center as conceived above, the port city of La Union would develop rapidly with improved infrastructure and services including some high-grade services to establish in time. The La Union port revitalization would be supported by the Eastern Region development and vice versa, for which the strengthening of spatial structure is necessary as a component of the basic strategy presented above.
The main activities and events to be observed in these aspects are presented in Table 7.9 for the three phases: the second half of Phase 1 for 2007-09, Phase 2 for 2010-14, and Phase 3 for 2015-19. Export, import and other port-related activities are presented to indicate expected performance and characterization of the port revitalization in each phase rather than specific activities to be promoted with policy targeting.
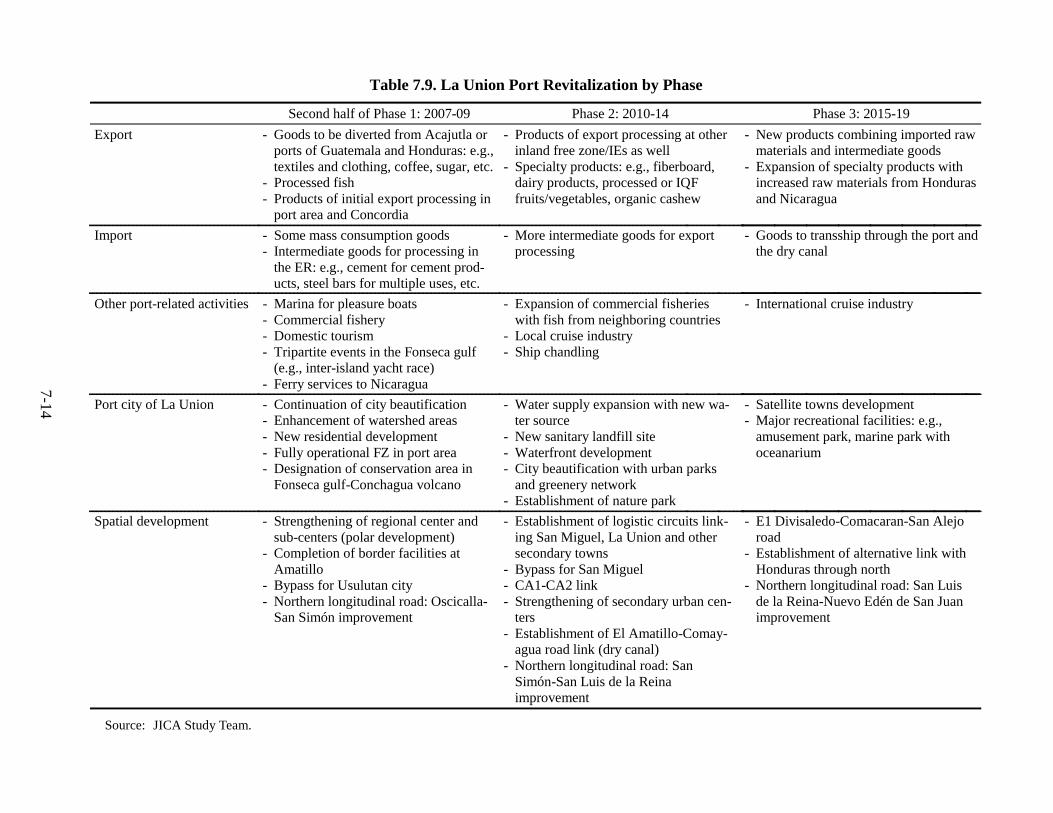
7-14
Table 7.9. La Union Port Revitalization by Phase
Second half of Phase 1: 2007-09 Phase 2: 2010-14 Phase 3: 2015-19 Export - Goods to be diverted from Acajutla or
ports of Guatemala and Honduras: e.g., textiles and clothing, coffee, sugar, etc.
- Processed fish - Products of initial export processing in
port area and Concordia
- Products of export processing at other inland free zone/IEs as well
- Specialty products: e.g., fiberboard, dairy products, processed or IQF fruits/vegetables, organic cashew
- New products combining imported raw materials and intermediate goods
- Expansion of specialty products with increased raw materials from Honduras and Nicaragua
Import - Some mass consumption goods - Intermediate goods for processing in
the ER: e.g., cement for cement prod-ucts, steel bars for multiple uses, etc.
- More intermediate goods for export processing
- Goods to transship through the port and the dry canal
Other port-related activities - Marina for pleasure boats - Commercial fishery - Domestic tourism - Tripartite events in the Fonseca gulf
(e.g., inter-island yacht race) - Ferry services to Nicaragua
- Expansion of commercial fisheries with fish from neighboring countries
- Local cruise industry - Ship chandling
- International cruise industry
Port city of La Union - Continuation of city beautification - Enhancement of watershed areas - New residential development - Fully operational FZ in port area - Designation of conservation area in
Fonseca gulf-Conchagua volcano
- Water supply expansion with new wa-ter source
- New sanitary landfill site - Waterfront development - City beautification with urban parks
and greenery network - Establishment of nature park
- Satellite towns development - Major recreational facilities: e.g.,
amusement park, marine park with oceanarium
Spatial development - Strengthening of regional center and sub-centers (polar development)
- Completion of border facilities at Amatillo
- Bypass for Usulutan city - Northern longitudinal road: Oscicalla-
San Simón improvement
- Establishment of logistic circuits link-ing San Miguel, La Union and other secondary towns
- Bypass for San Miguel - CA1-CA2 link - Strengthening of secondary urban cen-
ters - Establishment of El Amatillo-Comay-
agua road link (dry canal) - Northern longitudinal road: San
Simón-San Luis de la Reina improvement
- E1 Divisaledo-Comacaran-San Alejo road
- Establishment of alternative link with Honduras through north
- Northern longitudinal road: San Luis de la Reina-Nuevo Edén de San Juan improvement
Source: JICA Study Team.
7-14
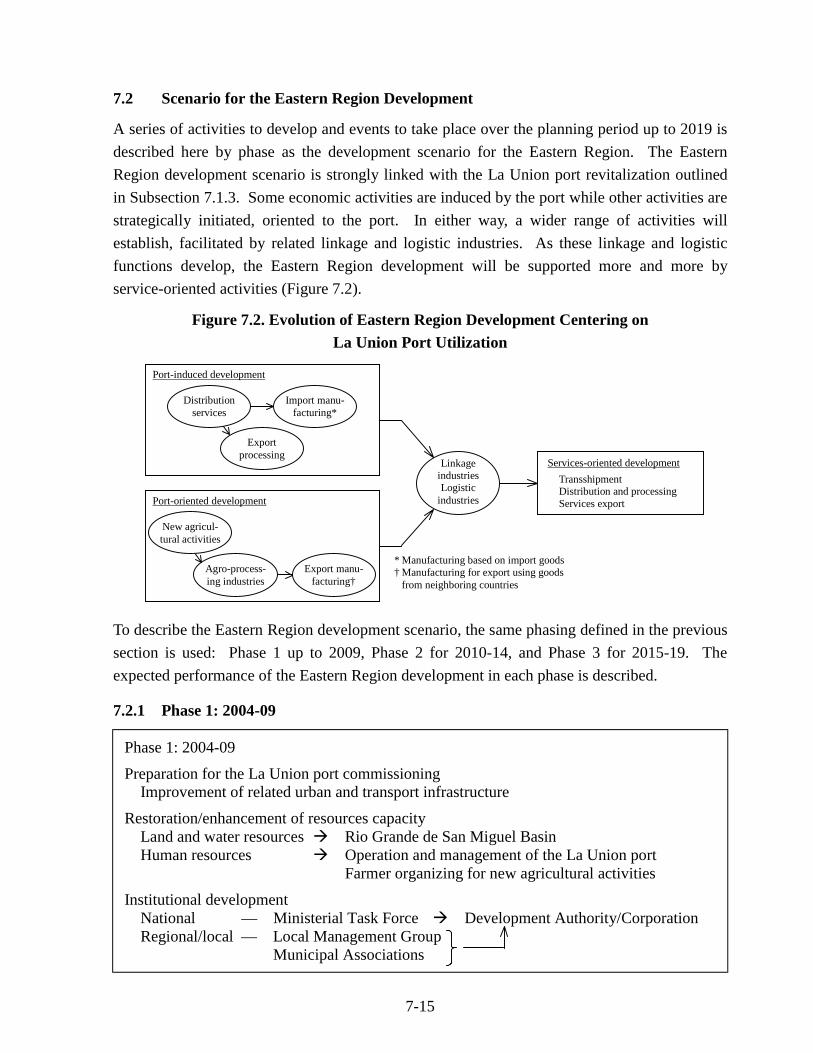
7-15
7.2 Scenario for the Eastern Region Development
A series of activities to develop and events to take place over the planning period up to 2019 is described here by phase as the development scenario for the Eastern Region. The Eastern Region development scenario is strongly linked with the La Union port revitalization outlined in Subsection 7.1.3. Some economic activities are induced by the port while other activities are strategically initiated, oriented to the port. In either way, a wider range of activities will establish, facilitated by related linkage and logistic industries. As these linkage and logistic functions develop, the Eastern Region development will be supported more and more by service-oriented activities (Figure 7.2).
Figure 7.2. Evolution of Eastern Region Development Centering on La Union Port Utilization
To describe the Eastern Region development scenario, the same phasing defined in the previous section is used: Phase 1 up to 2009, Phase 2 for 2010-14, and Phase 3 for 2015-19. The expected performance of the Eastern Region development in each phase is described.
7.2.1 Phase 1: 2004-09
Phase 1: 2004-09
Preparation for the La Union port commissioning Improvement of related urban and transport infrastructure
Restoration/enhancement of resources capacity Land and water resources Rio Grande de San Miguel Basin Human resources Operation and management of the La Union port Farmer organizing for new agricultural activities
Institutional development National — Ministerial Task Force Development Authority/Corporation Regional/local — Local Management Group Municipal Associations
Port-induced development
Distribution services
Import manu-facturing*
Export processing
Port-oriented development
New agricul-tural activities
Export manu-facturing†
Agro-process-ing industries
Linkage industries Logistic
industries
Services-oriented development Transshipment Distribution and processing Services export
* Manufacturing based on import goods † Manufacturing for export using goods
from neighboring countries
7-16
(1) Overview
This phase is characterized by restoration and enhancement of resources capacity as well as preparation for the commissioning of the La Union port in mid-2007. Human resources necessary for the operation and management of the port will be trained as a matter of urgency at existing institutes and a new technological institute to be established in La Union. Farmers will be organized to prepare for new agricultural activities to develop in response to increasing trade opportunities with the port. Land productivity will be enhanced through watershed management, particularly in the Rio Grande de San Miguel, including improvement of high elevation coffee under cover shade trees, small-scale irrigation with ponds, planting of cashew and other fruit trees (e.g., avocado, citrus and mango) in uplands, and adoption of better farming practices.
Institutional development also characterizes the Eastern Region development during this phase. An intermediate level of administration between the Central Government and municipalities currently discussed will be effectively institutionalized in the form of municipal associations, first for the Fonseca gulf and the Rio Grande de San Miguel. Administrative functions for agricultural extension and support to SMEs will be substantially transferred to this level as well as those for social services and environmental management. In response to this transfer, people’s participation will be enhanced and institutionalized as well. The FPEZ will be designated in the La Union-Conchagua area, and an FZ established in the port hinterland. A development corporation will be established by public-private partnership to take charge of the FPEZ. The operation and management of most port and related facilities will be entrusted to private operators.
(2) Socio-economy
After the decades of stagnation, the agricultural sector will start renewed growth during this phase. Fruits and vegetables will be selectively promoted, and new commercial crops introduced/strengthened, such as indigo, kenaf and cashew. Formation and strengthening of farmers’ associations are the prerequisite to these activities for joint procurement and marketing, and possible joint venture arrangements with foreign partners. The Eastern Region may join an existing cluster/complex for apiculture and sugar-related processing. A prerequisite would be enhancement of resources base for production increase as well as technical extension by the existing cluster and industries. The improvement of high elevation coffee under cover shade trees will be supported as part of a reforestation program.
Livestock development will pursue increasingly high input-high yield mode of production, particularly for dairy cattle. It will be supported by increasing production of green maize and sorghum for silage production and increasing import of feed grains and supplements.
New agro-processing industries will establish based on new and strengthened crops to be
7-17
produced, for instance, indigo dye and dyed products, kenaf fibers, organic cashew, and fruits preserves. For organic or gourmet coffee, original brands of the Eastern Region will be developed for export market. The initial export processing will establish as the port is commissioned, and the processing of imported intermediate goods will start for some consumer goods (e.g., plastic products from synthetic resins) and construction materials (e.g., cement and steel products).
Textile and apparel industries will establish steadily, partly shifting from the Capital region and La Libertad. The conclusion of the CAFTA with the U.S. with the provision for the use of domestic textiles will encourage investments in spinning and knitting industries as well in line with the “full package” strategy for the textile and apparel industries in Central America.
As the population increase, the demand for construction and construction materials industries will increase to justify the local production of cement products and other low cost construction materials. Similarly, food industries will develop for various snacks and breads to supply the increasing population.
Trucking and warehousing services will be improved through the restructuring of the industry organizing service operators. Various business services associated particularly with new and strengthened agricultural and processing activities will develop. Simple distribution processing related to port-based distribution functions will establish, including labeling, label making, quality control, and customers services. Business process outsourcing (BPO) services will develop rapidly, particularly front BPO services led by customer relationship management (CRM) including call centers. Tourism products will be developed mainly for the domestic market, including local recipes, dyed products and other handicrafts, tour circuits, and some artificial tourist attractions.
(3) Spatial development
Spatial development during this phase is basically polar development centering on a few larger urban centers, viz., San Miguel, La Union, Santa Rosa de Lima, and Usulutan. At the same time, major bottlenecks in inter-regional and international transportation should be removed. Following the construction of the La Union bypass, a bypass for Usulutan city will be completed. Border facilities at El Amatillo will be upgraded, starting with the establishment of a new bridge downstream of the existing one.
Rural roads will be improved steadily during this phase, which would allow expansion of areas for new commercial crops subsequently. Ongoing self-help efforts by rural communities will be strengthened, supported by skill training and provision of simple tools and equipment.
New residential development will take place in the La Union-Conchagua area to accommodate increasing flow of people from other regions and countries. The urban road system will be substantially strengthened, associated with the residential development as well as the new
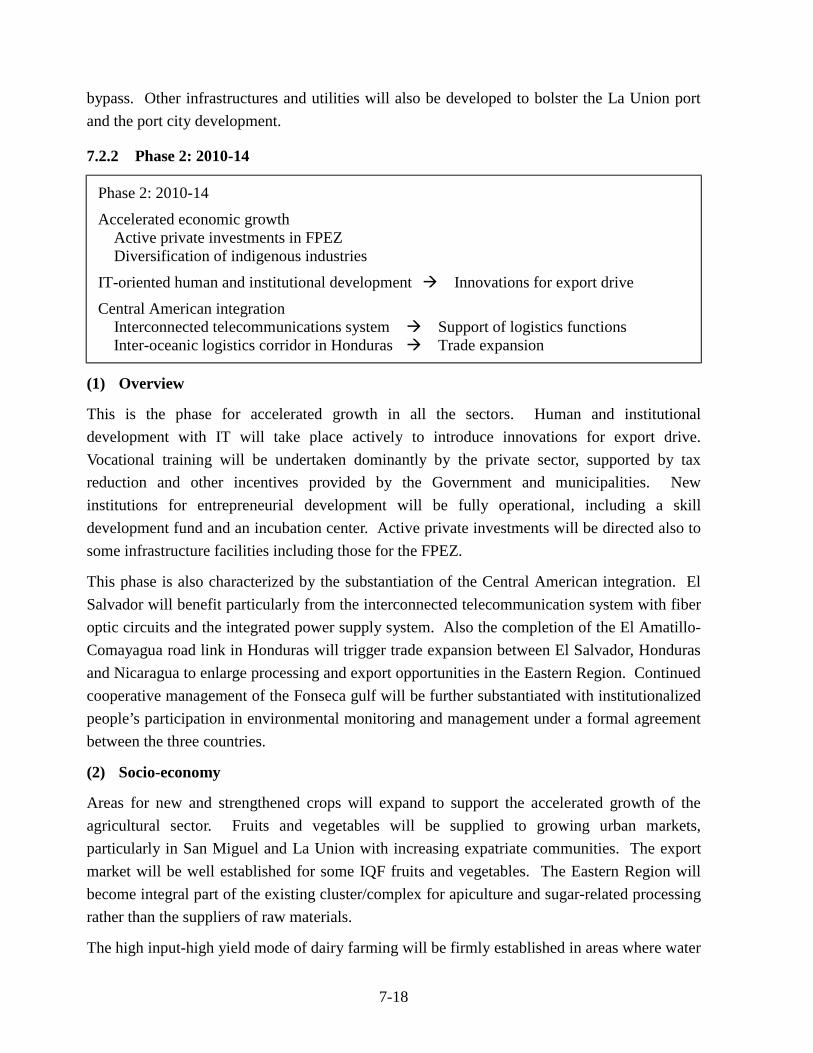
7-18
bypass. Other infrastructures and utilities will also be developed to bolster the La Union port and the port city development.
7.2.2 Phase 2: 2010-14
Phase 2: 2010-14
Accelerated economic growth Active private investments in FPEZ Diversification of indigenous industries
IT-oriented human and institutional development Innovations for export drive
Central American integration Interconnected telecommunications system Support of logistics functions Inter-oceanic logistics corridor in Honduras Trade expansion
(1) Overview
This is the phase for accelerated growth in all the sectors. Human and institutional development with IT will take place actively to introduce innovations for export drive. Vocational training will be undertaken dominantly by the private sector, supported by tax reduction and other incentives provided by the Government and municipalities. New institutions for entrepreneurial development will be fully operational, including a skill development fund and an incubation center. Active private investments will be directed also to some infrastructure facilities including those for the FPEZ.
This phase is also characterized by the substantiation of the Central American integration. El Salvador will benefit particularly from the interconnected telecommunication system with fiber optic circuits and the integrated power supply system. Also the completion of the El Amatillo-Comayagua road link in Honduras will trigger trade expansion between El Salvador, Honduras and Nicaragua to enlarge processing and export opportunities in the Eastern Region. Continued cooperative management of the Fonseca gulf will be further substantiated with institutionalized people’s participation in environmental monitoring and management under a formal agreement between the three countries.
(2) Socio-economy
Areas for new and strengthened crops will expand to support the accelerated growth of the agricultural sector. Fruits and vegetables will be supplied to growing urban markets, particularly in San Miguel and La Union with increasing expatriate communities. The export market will be well established for some IQF fruits and vegetables. The Eastern Region will become integral part of the existing cluster/complex for apiculture and sugar-related processing rather than the suppliers of raw materials.
The high input-high yield mode of dairy farming will be firmly established in areas where water
7-19
shortages are largely solved by early development efforts for watershed management. More green maize and sorghum will be produced for silage to support dairy farming in combination with managed pastures and import feed grains and supplements. Poultry farming will develop rapidly, partly shifting from the Western region and taking advantage of import grains through the La Union port. Commercial fisheries will expand with fish supply from neighboring countries as well. Fishmeal plants will be established, which will supply the poultry industry.
Not only apiculture and sugar with its derivatives, agro-processing will produce diversified products, such as light construction materials from kenaf, cashew apple wine and various processed cheeses. As the incentive for farmers to enhance agricultural productivity increases with expanding urban and export markets, irrigation and farm mechanization will proceed rapidly. This will lead to the establishment of the agricultural machinery and equipment industry. This may start with assembly operations at FZ and manufacturing of agricultural implements and equipment from intermediate goods to be imported. These agricultural and processing activities and supporting industries will form in totality what may be called an agro-industrial complex (AIC). The AIC would effectively extend the cluster strategy through broader and deeper opportunities for inter-industry linkages with indigenous and supporting industries (Box 4).
Export processing of the portside FZ will be fully developed. Additional export processing will start at another inland FZ. Export of specialty products will increase, benefiting from supply of additional raw materials from neighboring countries, such as fiberboard, dairy products, and processed or IQF fruits and vegetables.
An increasing number of industries based in other regions, depending on the import materials, will establish in the Eastern Region to capitalize on the La Union port, partly shifting from their original locations. They include the poultry industry; manufacturers of various construction materials based on imported steel, cement and other intermediate goods; some chemical products manufacturers; and maquila industries.
As agricultural production increases, excess production will be processed into frozen and other processed food products mainly for export to overseas Salvadorans. Other food industries based on import grains and pulses will also diversity. The development of various food industries will induce the establishment of the plastic products industry for PET bottles, packaging materials and sheets as well as small packaging industries.
The development of agriculture and the construction industry will generate needs for repair and parts for agricultural and construction machinery and irrigation equipment. This will lead to the establishment of machinery and equipment industries, initially for starting with assembly operation. Also, a maintenance center will establish near the port to support the development of logistic functions.
7-20
Box 4
Agro-Industrial Complex and Industrial Clusters Conceptual background of the agro-industrial complex
The agro-industrial complex (AIC) proposed here is a set of agro-based economic activities, which are interrelated directly or indirectly through chains of input-output relationships. This is similar to the more popular concept of industrial clusters popularized recently by Michael Porter. The cluster is now a technical term, while the complex is not. More promising economic activities are proposed in the form of the complex for three reasons:
(i) To increase and internalize value-added, while minimizing wastes and leakages, (ii) To allow the Government to take effective measures for agricultural development without
direct interventions in the sector, and (iii) To motivate local people to produce for larger markets including export markets by making
linkages visible.
The first reason is common to the cluster strategy as well. The second and the third reasons are pragmatic, representing the planning strategy.
Cluster strategy in the context of Eastern Region development
The concept of industrial clusters may facilitate the understanding of ideas built into the AIC, particularly in the context of the economic development of El Salvador focusing on the Eastern Region with the La Union port. The four key determinants of industry competitiveness identified by Michael Porter are: (1) factor conditions – availability and quality of production factors such as resources, infrastructure
and capital, (2) home demand conditions – existence of domestic market responsive to such high quality products
that may be demanded in the international market as well, and (3) related and supporting industries, and (4) industry strategy, structure and competitiveness.
The existing conditions of these determinants are not all favorable in El Salvador and even less so in the Eastern Region. The situation may change drastically with the establishment of the La Union port. The Eastern Region development may be seen as a process to cause favorable changes to these determinants to enhance competitiveness of the Salvadoran economy. Main changes expected in the Eastern Region with respect to each determinant are as follows.
Determinant of competitiveness Expected changes in the Eastern Region (1) Factor conditions Increased availability of raw materials and intermediate goods through
import; improved port and related infrastructure; inflow of investment capital and technology
(2) Home demand conditions Increased demand for high quality products linked through processing and services to export market; growing urban markets
(3) Related and supporting industries
Establishment of port-oriented industries in FZ; development of indigenous industries linked to FZ
(4) Industry strategy, structure and competitiveness
Coherent industry strategy across subsectors; “coopetition” among industries under the regional development strategy
The success of any industrial cluster depends on effective utilization of external economy due to the agglomeration of industries by means of some joint actions of inter-related industries in the competitive environment. For this to be possible, the cluster needs some depth to allow the division of works, accumulation of technologies, and intensive information flow between the industries. It is well known, however, that those industries to locate in FZ do not develop initially strong linkages with indigenous industries. This means that the determinant (3) above would not improve much with the establishment of the La Union port alone.
7-21
Applicability of cluster strategy
There are different ways to apply the cluster strategy to economic development in any country or region. A typical way is to take a primary good that has the competitive advantage and promote related economic activities with forward or backward linkages to internalize and increase value-added and strengthen the competitive advantage for a whole set of goods involved in the chain of economic activities. This may not be widely applicable to the economy of El Salvador having limited primary goods with the competitive advantage. Indigo and cashew may prove to be exceptions, but with these primary goods alone indigenous industries may not be fully developed to have sufficient impact on the Salvadoran economy as a whole.
The existing sugar industry in El Salvador, on the other hand, has established a sort of cluster based on sugarcane, a primary good having relatively low competitive advantage. Through a chain of processing activities to increase value-added, the industry has established comparative advantages for various processed goods including molasses, feed and liquor as well as brown and refined sugar. Some products are exported; hence, the comparative advantage. Maize is another primary good having relatively low competitive advantage, but is processed into feed to serve the livestock industry for much higher overall value-added. Competitive advantage of livestock products, typically cheese, however, is threatened by import from neighboring countries including smuggling.
Extensions of cluster strategy to the AIC
For effective utilization of external economy, some depth should be ensured to allow inter-industry interactions. As clarified above, the La Union port alone would not contribute much to increasing the depth. Therefore, the existing and potential indigenous industries would have to be utilized to internalize and increase value-added. There exist, however, only limited primary and processed goods in El Salvador and in the Eastern Region having the competitive advantage. To establish comparative advantages of those primary and processed goods having relatively low competitive advantage, a wider range of economic linkages should be effectively utilized. This would require extending the cluster strategy beyond a horizontal cluster of a single economic activity or a simple vertical cluster centering on a single primary good. A whole set of interrelated economic activities, existing and potential, defines the AIC, encompassing both horizontal and vertical clusters.
“If local industries are unproductive, they are going to bring down the export industries as well.” – Michael Porter
“Porter cautioned governments (of Latin American countries) against focusing on specific clusters, encouraging them instead to allow all clusters, in both traditional and nontraditional industries, to participate in the development process.”
References: 1. Website of the Institute for Strategy and Competitiveness, Harvard Business School accessed on
April 1, 2003. 2. JICA, Industrial Projects Follow-up Study, I. Cluster Analysis, draft report (in Japanese), Industrial
Development Studies Dept., July 22, 2002. 3. C. Quesada, “The Productivity Marathon,” IDB America, April 24, 2002, posted in IDB America
Online, December 2002.
Distribution and marketing services will be upgraded with IT. Both BPO back and front services will be further promoted. BPO back services will contribute to employment generation and skill training. For BPO front services, CRM services for Central America will further develop.
The local cruise industry will be fully established, supported by core tourism facilities in the La Union-Conchagua area. Tour itineraries will be developed jointly with tour operators in
7-22
Honduras and Nicaragua.
(3) Spatial development
Physical and economic linkages between larger urban centers for the polar development during Phase 1 will become stronger, and logistic circuits will be formed linking other secondary towns as well. A bypass for San Miguel and a new link between the highways CA1 and CA2 to shortcut the travel between La Union and Usulutan will be constructed. Continued improvement of rural roads and stepwise establishment of the northern longitudinal road will improve access from other parts of the Eastern Region to the logistic circuits.
A major breakthrough will be attained for the management of water and related land resources in the Rio Grande de San Miguel basin by the construction of a multipurpose dam, the first of the kind in El Salvador. This will change the land use pattern and spatial development as a whole as the dam provides better flood protection along the middle reach of the Rio Grande, combined with dykes and embankment.
7.2.3 Phase 3: 2015-19
Phase 3: 2015-19
Increasingly service-oriented development Sustainable growth Human resources equipped with IT High grade, human-oriented services Logistic center Transshipment of goods to/from neighboring countries Export processing Services export
Resources-based development during Phase 1 in combination with IT-oriented human resources development particularly associated with the La Union port development will induce the development of broad logistic functions through Phase 2. Through this process, capital and technical expertise will accumulate and markets expand. Based on these, sustainable growth will be attained during Phase 3 by increasingly service-oriented development.
Continual innovations will allow El Salvador and the Eastern Region to enjoy international fame for quality agro-products and other specialty products. Human resources equipped with IT will support high grade, human oriented services, such as BPO operations, higher education and training, and advanced medical services. Some of them will become export industries serving other countries in Central America as well.
As logistic functions become increasingly an integral part of manufacturing in the free trade regime, a logistic center will best characterize the Eastern Region with the La Union port. Transshipment of goods to/from neighboring countries by the port and the dry canal, export processing, and services export will eventually become main activities for sustainable growth of the Region.
7-23
7.3 Impact of La Union Port Revitalization on the Eastern Region and El Salvador
As the La Union port is revitalized in steps as envisioned in Section 7.1, the socioeconomic and the spatial development of El Salvador as well as the Eastern Region will change in various aspects. In this section, likely changes are described to indicate the nature, direction and magnitude of the impact of the La Union port revitalization. Impact on some areas or aspects is quantified in line with the development frameworks for the master plan. This impact assessment is meant to be neither a prediction nor even a projection but rather it represents rational reasoning to anticipate likely changes. Quantified impact, if such is given, is meant to facilitate the visualization of the likely changes. For each aspect of impact, likely changes in the Eastern Region are presented, and their implications to El Salvador as a whole are mentioned for some aspects.
(1) Image and status of the Eastern Region
The Eastern Region at present is a poverty-stricken outmigration region of the Country, relying most heavily on overseas remittance. There exists neither maquila industry nor any major economic activity to symbolize the Region. Moreover, the Eastern Region suffers from poor images of crime, delinquencies and violence. This situation will certainly change for better with the La Union port.
The establishment of the La Union port symbolizes the priority policy of the Government for the Eastern Region. It will bring the Region from a marginal position to the center, which would have serious political implications as well. More substantively, the La Union port area is expected to become a center in the free trade and globalizing economy, where El Salvador places itself. Specifically, El Salvador as well as the Eastern Region will enjoy international fame for quality agro-products and other specialty products and high-grade, human oriented services such as BPO services, higher education and training, and advanced medical services. The logistic functions in the Eastern Region will support El Salvador as a transshipment center in Central America.
(2) Commodity flow
Some of the export commodities currently transported via the Acajutla port and ports in Guatemala and Honduras, such as textiles and clothing, coffee and sugar, will be diverted to the La Union port. New commodity flow will be generated for export and also for the port city of La Union. As the port is established and increasing foreign and domestic investments locate around the port area, the population of the La Union city will expand. Also, foreign communities and the rich may demand more high-grade commodities. In particular, the demand for daily consumption goods will increase, including vegetables and fruits, dairy products, and beverages. Also, more diversified consumer goods may be imported for distribution in the Eastern Region and the neighboring countries near the border.
7-24
Additional products to be produced in the Eastern Region as envisioned will generate more export cargoes than projected by the previous studies. The export volume of these products in 2019 is roughly estimated below consistently with the value-added projection in Section 6.1.
Commodity Production (ton) Export ratio (%) Export volume (ton) Cheese 6,000 40 2,400 Vegetables 150,000 10 15,000 Kenaf fibers 75,000 60 45,000 Coffee 8,000 60 4,800 Fruits 150,000 20 30,000 Cashew 6,000 80 4,800 Honey 1,500 60 900 Sugar 72,000 50 36,000 Construction materials 20,000 Agricultural machinery & equipment 10,000
Total 168,900
Including other products of export processing, the total additional export could be some 250,000MT, mostly container cargoes except sugar.
Also, the comparative analysis on transport costs indicates that transshipment through the La Union port would be promising for long distance cargo transport for the U.S. west coast, particularly from Nicaragua and Honduras, and marginally from Guatemala and Costa Rica. Transshipment for Asia to/from all the major ports on the Pacific side of Central America on the net cost basis appears to be promising as long as full container loads are ensured. This potential may add some 100,000MT to the export cargo demand at the La Union port.
The volume of container cargoes is projected by the previous studies at some 930,000MT for import and 400,000MT for export in 2015. The additional export cargoes estimated above would improve the balance between import and export, and thus contribute to the reduction of freight costs. The additional import and export cargoes can be handled at the La Union port as the occupancy rate of the container berth is estimated at 43% even in 2015.
This change in commodity flow implies that the comparative positions of different regions for industrial location will change in El Salvador. For instance, the availability of import feed and feed gradients will be improved in the Eastern Region for cattle and poultry farming, and some poultry operations may shift from the Western region. Also, more construction material industries will establish in the Eastern Region to import intermediate goods for processing.
(3) Land traffic generation
According to the DD of the La Union port, an average of 355 container boxes will be handled over 12.1 hours per vessel in 2005, which is projected to increase to 812 boxes over 17.9 hours per vessel in 2015. This implies the traffic of container trucks at every two minutes on average
7-25
or 720 trucks/day in 2005, and 45 container trucks/hour or 1,080 trucks/day in 2015.
According to the OD survey, the traffic between San Miguel and La Union over 12 hours is about 3,500 vehicles. As the population increases rapidly in both cities, the intercity traffic may increase up to 14,000 vehicles. Including local traffics, the total number of vehicles on the highway between San Miguel and La Union would be 20,000 vehicles/day, more or less. This is comparable to the heaviest traffic currently observed on the primary roads around San Salvador (Figure 7.2).
(4) Investment distribution
The Eastern Region’s share in the public investment was 22.5% of the total in 1996-99 and 21% in 2000. The large allocation during 1996-99 is due to the geothermal development, and consequently Usulutan received a 14.2% of the total public investment during this period. San Salvador received 32.9% in 1996-99 and 31% in 2000. The Eastern Region contributed to only 3.3% of the value-added tax collected in 2000, reflecting the lack of major industries. The contribution is largest at 2.2% in San Miguel, but much smaller at 0.6% in Usulutan, 0.3% in La Union and 0.2% in Morazan. San Salvador contributed the most with a 23.5% share, followed by La Libertad with 16.0%. Investments in the La Union port and related infrastructure will increase the allocation of the public investment to the Eastern Region significantly.
Since the La Union port revitalization is a national project to contribute to the economic development of El Salvador as a whole, unprecedented levels of allocation will be justified. These levels are examined in the light of expected macroeconomic performance of El Salvador (Section 9.5).
Free trade zones (FZs) will be established in the port area and also in the inland. A total of 100ha may be developed, including 50ha allocated to the portside FZ where the land is relatively flat. The establishment of 150 industries is expected for the cumulative investment ofUS$380 million over a 15-year period more or less. Port-induced investments are expected in various services as well as some domestic industries. Moreover, demand-driven investments are expected, associated with the development of the La Union city with its urban market.
(5) Value-added and employment generation
Port-related activities and FZs
According to the current plan, the establishment of the La Union port will generate some 450 employment opportunities during the construction period, and additional 1,500 jobs will be created for port operation. Port-related activities may generate some 2,500 jobs, and employments to be generated in free zones may be up to 10,000. In total, some 15,000 employment opportunities may be generated in the port area and its immediate hinterland alone.
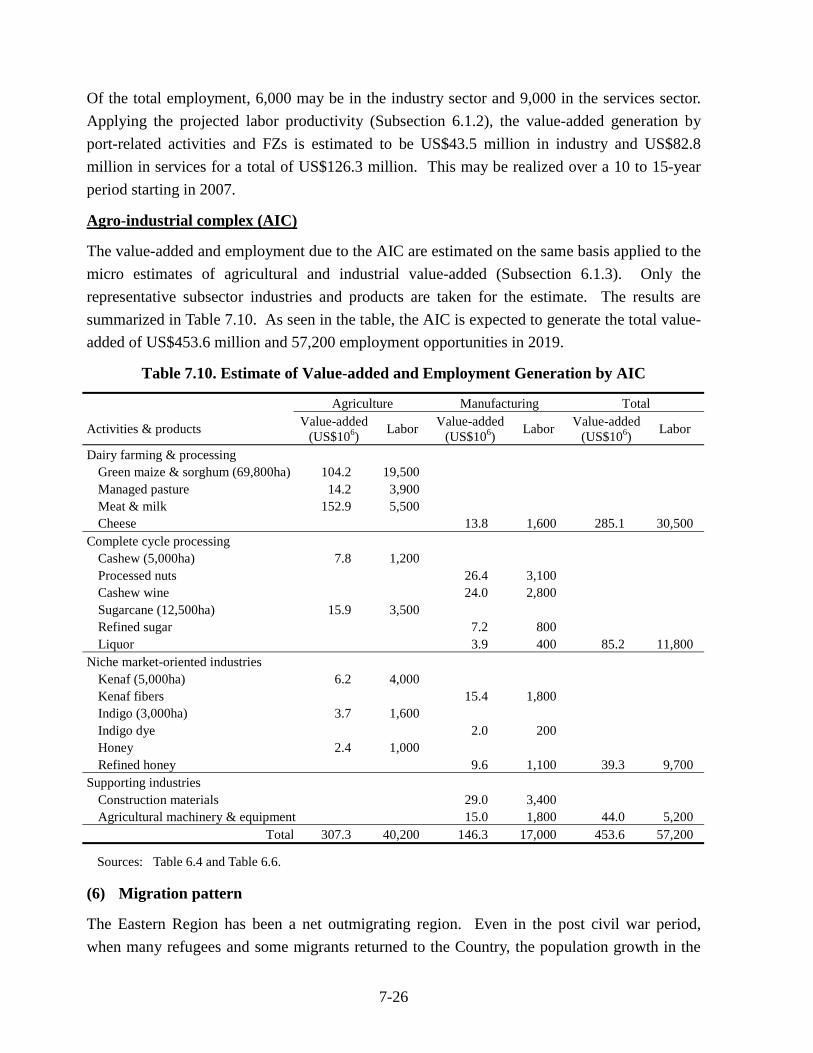
7-26
Of the total employment, 6,000 may be in the industry sector and 9,000 in the services sector. Applying the projected labor productivity (Subsection 6.1.2), the value-added generation by port-related activities and FZs is estimated to be US$43.5 million in industry and US$82.8 million in services for a total of US$126.3 million. This may be realized over a 10 to 15-year period starting in 2007.
Agro-industrial complex (AIC)
The value-added and employment due to the AIC are estimated on the same basis applied to the micro estimates of agricultural and industrial value-added (Subsection 6.1.3). Only the representative subsector industries and products are taken for the estimate. The results are summarized in Table 7.10. As seen in the table, the AIC is expected to generate the total value-added of US$453.6 million and 57,200 employment opportunities in 2019.
Table 7.10. Estimate of Value-added and Employment Generation by AIC
Agriculture Manufacturing Total
Activities & products Value-added (US$106) Labor Value-added
(US$106) Labor Value-added (US$106) Labor
Dairy farming & processing Green maize & sorghum (69,800ha) 104.2 19,500 Managed pasture 14.2 3,900 Meat & milk 152.9 5,500 Cheese 13.8 1,600 285.1 30,500
Complete cycle processing Cashew (5,000ha) 7.8 1,200 Processed nuts 26.4 3,100 Cashew wine 24.0 2,800 Sugarcane (12,500ha) 15.9 3,500 Refined sugar 7.2 800 Liquor 3.9 400 85.2 11,800
Niche market-oriented industries Kenaf (5,000ha) 6.2 4,000 Kenaf fibers 15.4 1,800 Indigo (3,000ha) 3.7 1,600 Indigo dye 2.0 200 Honey 2.4 1,000 Refined honey 9.6 1,100 39.3 9,700
Supporting industries Construction materials 29.0 3,400 Agricultural machinery & equipment 15.0 1,800 44.0 5,200
Total 307.3 40,200 146.3 17,000 453.6 57,200
Sources: Table 6.4 and Table 6.6.
(6) Migration pattern
The Eastern Region has been a net outmigrating region. Even in the post civil war period, when many refugees and some migrants returned to the Country, the population growth in the
7-27
Region was lower than the rate of natural increase. Although both death and birth rates have been reduced significantly, crude birth rates are still high in the four departments of the Eastern Region, ranging from 27.4 per 1,000 in Usulutan to 32.3 per 1,000 in Morazan in 1998. Consequently, the natural population increase in the Region is still high at 2.2% per annum. The natural population increase exceeds the overall population growth in three departments except San Miguel. For the Eastern Region as a whole, the difference between the natural population increase and actual growth is about 0.6%, indicating that some 8,000 people outmigrate annually at present.
The two kinds of new economic activities analyzed above will generate incremental value-added of US$580 million in total and incremental employment of 72,200 in 2019. The incremental employment corresponds to the population of 165,800 by applying the labor force coefficient and the labor participation ratio expected in 2019 (Subsection 6.1.3). That is, over 10,000 people will be attracted annually on average by the new economic activities alone. Thus, the Eastern Region is expected to turn into a net immigrating region in 15-year time.
(7) Economic structure
At present, the agricultural sector accounts for slightly over 20% of the gross regional domestic products (GRDP) of the Eastern Region, the industry sector including manufacturing, mining, utilities, and construction little less than 20%, and the services sector close to 60%. As the Eastern Region develops, the economic structure will change significantly.
Agriculture will realize renewed growth with increasing productivity to ensure self-sufficiency in basic grains and milk, enough raw materials supply for agro-processing, and quality feed for livestock. The agricultural growth, however, would be high enough at most to maintain the present rural population. Industry will provide the driving force for the Eastern Region development with export processing and indigenous (mostly agro-processing) industries. The services sector will attain the highest growth with diversification, including some higher-order services such as higher education and advanced health services. In the 15-year period, the share of the agriculture may be halved, that of industry may reach 20%, and services will have a dominant share over 65%. These are quantified in Subsection 6.1.2 as a socioeconomic framework for the Eastern Region development.
The contribution of the Eastern Region to the national economy in terms of GDP is currently 28.2% for agriculture, 8.1% for industry, and 13.8% for services. The GRDP of the Eastern Region was only 13.5% of the GDP in El Salvador. These contributions would increase significantly in the next 15 years. The existing gap between the per capita GDP and the per capita GRDP is expected to narrow to within the 10% range. These are quantified also in Subsection 6.1.2.
7-28
(8) Spatial structure
Urbanization will proceed in the Eastern Region. This is not only inevitable but in fact desirable to enhance the service functions of urban centers and also to support much higher productivity in the rural areas. At present, 40% of the Eastern Region is urban. The urban population will more or less double in 15 years to exceed 1.0 million while the rural population will stay at the present level or slightly decline to 750,000. As a result, the urbanization ratio will reach 58%, which is equivalent to the current urbanization ratio in the Country.
The population of La Union city will expand most rapidly as the city is expected to become a growth center with multiple functions. Together with San Miguel city some 40km away, the combined population will reach 500,000 more or less. Population and economic activities will concentrate in the area delineated by the highway CA-1 and the primary road linking San Miguel, Santa Rosa de Lima, El Amatillo, and Usulutan city. The combined population of the core area encompassing these cities may come close to 1.0 million. The planned northern longitudinal road and other north-south link roads would improve access to this core area from the La Union port. These links would expand both the market for some consumer goods to be imported via the La Union port and the resources base for the urban market and the processing industries in the core area.
The development of the Eastern Region, particularly with the La Union port and the creation of the development core having a population of one million, would improve the balance between the San Salvador Metropolitan Area and other regions. Also, it would contribute to physical and socioeconomic integration of El Salvador and the neighboring countries. In particular, the proposed inter-oceanic logistic corridor linking the La Union port and the port of Cortes in Honduras will induce much increased trade between El Salvador, Honduras and Nicaragua.