Embed Size (px)
Citation preview

Study on "EU-US High Level Working Group"
Final report
Client: Ministry of Economic Affairs, Agriculture and Innovation
Rotterdam, 22 October 2012


Study on "EU-US High Level Working Group"
Final report
Client: Ministry of Economic Affairs, Agriculture and Innovation
Nora Plaisier
Afke Mulder
Jurgen Vermeulen
Koen Berden
Rotterdam, 22 October 2012
2
NP/KK AC25228fin rep
About Ecorys
At Ecorys we aim to deliver real benefit to society through the work we do. We offer research,
consultancy and project management, specialising in economic, social and spatial development.
Focusing on complex market, policy and management issues we provide our clients in the public,
private and not-for-profit sectors worldwide with a unique perspective and high-value solutions.
Ecorys’ remarkable history spans more than 80 years. Our expertise covers economy and
competitiveness; regions, cities and real estate; energy and water; transport and mobility; social
policy, education, health and governance. We value our independence, integrity and partnerships.
Our staff are dedicated experts from academia and consultancy, who share best practices both
within our company and with our partners internationally.
Ecorys Netherlands has an active CSR policy and is ISO14001 certified (the international standard
for environmental management systems). Our sustainability goals translate into our company policy
and practical measures for people, planet and profit, such as using a 100% green electricity tariff,
purchasing carbon offsets for all our flights, incentivising staff to use public transport and printing on
FSC or PEFC certified paper. Our actions have reduced our carbon footprint by an estimated 80%
since 2007.
ECORYS Nederland BV
Watermanweg 44
3067 GG Rotterdam
P.O. Box 4175
3006 AD Rotterdam
The Netherlands
T +31 (0)10 453 88 00
F +31 (0)10 453 07 68
Registration no. 24316726
W www.ecorys.nl

Table of contents
3
Study on "EU-US High Level Working Group"
List of abbreviations 5
Executive Summary 9
1 Introduction and main objective of this study 13
1.1 Rationale and aim of this study 13
1.2 Structure of the study and methodology 14
1.2.1 Step 1: Quantitative determination of potential effects of EU-US FTA for NL 14
1.2.2 Step 2: Selection of top sectors for further analysis 15
1.2.3 Step 3: Identification of actionable trade barriers in EU-US context 16
1.2.4 Step 4: Policy recommendations 17
2 Context of EU-US trade relations 19
2.1 Decline in importance of tariffs and continuing rise of regional trade agreements 19
2.2 Shifting global economic balance of power 21
2.3 The economic relation between the EU and the US 24
2.3.1 Studies on the economic ties between the EU and the US 27
2.3.2 The current state of affairs between the EU and the US 28
3 Quantitative results of trade liberalisation for NL, EU26 and US 31
3.1 Effects of an EU-US FTA including tariff liberalisation 31
3.1.1 Specification of the study 31
3.1.2 Macro-economic effects 31
3.1.3 Sector specific effects 32
3.2 Effects of reducing Non Tariff Measures between the EU and the US 34
3.2.1 Specification of the study 34
3.2.2 Macro-economic effects 35
3.2.3 Sector specific effects 37
3.3 Summarising overview of macro-economic results from both studies 39
4 Selection of three “top sectors” in the Netherlands 41
4.1 Dutch policy on businesses and the top sector policy 41
4.2 Selection criteria 42
4.3 Criterion 1: Share of top sector exports in total NL exports 42
4.4 Criterion 2: Share of top sector value added total NL GDP 43
4.5 Criterion 3: The existence of trade barriers in a sector 44
4.6 Criterion 4: The potential benefits from aligning EU-US NTMs in a sector 45
4.7 Final top sector selection 46
5 Identification and prioritisation of trade barriers in the Agro-food & Horticulture sector 49
5.1 About the sector 49
5.1.1 Introduction 49
5.1.2 Trade and Investment relations between the Netherlands and the US in the sector49
5.2 Identification of trade barriers 50
5.2.1 Tariff barriers 50
5.2.2 Non-tariff barriers 51
4
Study on "EU-US High Level Working Group"
5.3 Prioritisation of trade barriers: Dutch interests 53
5.4 Conclusions on priority barriers: linking Dutch priorities to the EU negotiation position 57
6 Identification and prioritisation of trade barriers in the High-tech Systems & Materials sector 61
6.1 About the sector 61
6.2 Identification of trade barriers 62
6.3 Prioritisation of trade barriers 66
6.4 Conclusions on priority barriers: linking Dutch priorities to the EU negotiation position 72
7 Identification and prioritisation of trade barriers in the Chemicals sector 75
7.1 About the Chemical sector 75
7.1.1 Introduction 75
7.1.2 Trade and Investment relations between the Netherlands and the US in the sector75
7.2 Identification of trade barriers 76
7.2.1 Tariff barriers 76
7.2.2 Non-tariff barriers 77
7.3 Prioritisation of trade barriers 78
7.4 Conclusions on priority barriers 81
8 Policy recommendations 83
Annex A – Detailed CGE results 87
Annex B – Details on data classifications used 105
Annex C – Trade data 119
Annex D – Details on NTMs from MADB and Ecorys NTM study 122
Annex E – Interviews 139
5
Study on "EU-US High Level Working Group"
List of abbreviations
ACC American Chemistry Council
ACRE Average Crop Revenue Election programme
AEO Authorised Economic Operator
AF&H Agrofood and horticulture
APR Additional permissive reexports
ARRA American Recovery and Reinvestment Act
ATSC Advanced Television Systems Committee
AVE Ad Valorem Equivalent
BAA Buy American Act
BRIC Brazil, Russian, India, China
BSE Bovine Spongiform Encephalopathy
CAFE Corporate Average Fuel Economy
CBS Central Bureau of Statistics
CCF Capital Constructions Fund
CDSOA Continued Dumping and Subsidy Offset Act
Cefic European Chemical Industry Council
CFIUS Committee on Foreign Investment in the United States
CGE Computable General Equilibrium model
CRF Construction Reserve Fund
CSI Container Security Initiative
CTHA Chemical Tariff Harmonisation Agreement
C-TPAT US Customs-Trade Partnership against Terrorism
DoD United States Department of Defense
DS Dispute Settlement
DSB Dispute Settlement Body
DSU Dispute Settlement Understanding
DVB-T Digital Video Broadcasting
EAA Export Administration Act
EADS European Aeronautic Defence and Space Company
EAR United States Export Administration Regulation
EC European Commission
ECIPE European Centre for International Political Economy
EPCA European Petrochemical Association/ Energy Policy and Conservation
Act
EU European Union
EU MC European Union Military Committee
EURATOM European Atomic Energy Community
EZ Economic Affairs (economische Zaken)
FAR Federal Acquisition Regulation
FAS Foreign Agricultural Service
FCC Federal Communications Commission
FCT Foreign comparative tests
FDA Food and Drug Administration
FDI Foreign Direct Investment
FINSA Foreign Investment and National Security Act
FMSR Foreign Military Sales Regulation
FMVSS Federal Motor Vehicle Safety Standards

6
Study on "EU-US High Level Working Group"
FSC Financial Services Commission
FTA Free Trade Agreement
FY Fiscal Year
GATT General Agreement on Tariffs and Trade
GDP Gross Domestic Product
GI Geographical indications
GSM General Sales Manager
GTAP Global Trade Analysis Project
GTP General Preferential Tariff
HLWG High Level Working Group on Jobs and Growth
HTSM High Tech Systems & Materials
IATTC Inter-American Tropical Tuna Commission
ILSA Iran and Libya Sanctions Act
INPA Iran Non-Proliferation Act
IPR Intellectual Property Rights
IRS Internal Revenue Service
ITAR International Traffic in Arms Regulations
ITC International Trade Centre
LCA Large Civil Aircraft
MAcMAP Market Access Map
MADB Market Access Database
MARAD Maritime Administration
MEP Member of European Parliament
EA&I (Ministry of) Economic Affairs, Agriculture and Innovation
MNE Multinational Enterprise
MTN Multilateral Trade Negotiation
NAFTA North American Free Trade Agreement
NASA National Aeronautics and Space Administration
NL Netherlands
NRTL Nationally Recognised Testing laboratory
NTM Non-Tariff Measure
ODS Operating Differential Subsidy
OECD Organisation for Economic Co-operation and Development
OIE World Organization for Animal Health
OSHA Occupational Safety and Health Administration
PRA Product-Risk Assessment
R&D Research and Development
REACH Registration, Evaluation, Authorisation and Restriction of Chemical
substances
ROW Rest of the World
RTA Regional Trade Agreements
SBA Small Business Administration
SBI Dutch Standaard Bedrijfsindeling (Dutch Industrial Classification of
Standards?)
SCGP Supplier Credit Guarantee Program
SCM Agreement on Subsidies and Countervailing Measures
SDoC Suppliers’ Declaration of Conformity
SME Small and Medium Enterprise
SPS Sanitary and phytosanitary measures
TABD Transatlantic Business Dialogue
TANFTA Transatlantic NTM FTA

7
Study on "EU-US High Level Working Group"
TAP Trans Atlantic Partnership
TBT Technical Barriers to Trade
TCE Trade Cost Equivalent
TEC Transatlantic Economic Council
TKI Top Consortium for Knowledge and Innovation
ToR Terms of References
TPN Transatlantic Policy Network
U.S.C. United States Code
UN COMTRADE United Nations Commodity Trade Statistics Database
UNECE United Nations Economic Commission for Europe
US United States of America
USAF United States Air Force
USDA United States Department of Agriculture
USTR United States Trade Representative
WTO World Trade Organisation


9
Study on "EU-US High Level Working Group"
Executive Summary
Background and objective of the study
The European Union (EU) and the United States (US) have a long-standing relationship on several
levels (economic, political, etc.), and their economies are strongly intertwined with large bilateral
trade and investment flows. During the last EU-US Summit in November 2011, the Transatlantic
Economic Council (TEC) was requested to create a High Level Working Group on Jobs and Growth
(HLWG), to identify and assess policies and measures to further increase EU-US trade and
investment. The HLWG will report its findings and recommendations to both US and European
leaders by the end of 2012. This study aims to contribute to the HLWG discussions by presenting a
clear overview of trade measures that can be aligned and the economic consequences for both the
Netherlands and the EU of an FTA between the EU and US. By doing so, the study aims to provide
the Dutch Government with relevant inputs for the HLWG discussions on further cooperation
between the EU and the US.
Approach
The approach and methodology of the study are based on the following four steps:
1. Step 1: Assessment of the effects of a potential EU-US FTA for the Netherlands, both at a
macro and sectoral level, on the basis of two previous Ecorys studies and additional analyses;
2. Step 2: Selection of top sectors for further focus, on the basis of four selection criteria;
3. Step 3: Identification of most important US trade barriers for Dutch (and EU) business, through
desk study and stakeholder consultation;
4. Step 4: Formulation of policy recommendations, based on the conclusions from step 1 to 3.
Economic effects of an EU-US FTA
The effects of an EU-US FTA are based on two recent studies that use different assumptions and
liberalisation scenarios. The EU-US FTA study (2009) looks at liberalisation in the area of tariffs,
barriers to services trade and NTMs, but does not model specific effects of individual NTMs. The
EU-US NTM study (2010) specifically addresses the effects of NTM liberalisation, but does not
model tariff or services barrier reductions. As this latter study only looked at the effects for the EU
and US, additional analysis has been conducted to identify the effects for the Netherlands.
Both studies predict significant positive results at macro-level for the US, EU and the Netherlands.
For the Netherlands, the expected annual increase of national income ranges from €1.4 billion to
€4.1 billion. The following table shows the results from the two studies for a selection of macro-
indicators.

10
Study on "EU-US High Level Working Group"
Table 1.1 Macro-effects of EU-US trade liberalisation, selected indicators
Comparison of outcomes EU-US NTM study (DG Trade),
including new results
EU-US FTA study
(EZ)
Ambitious NTM
reduction, Long
run
Limited NTM
reduction, Long
run
Long run R
eal
inco
me,
b
n E
uro
European Union - 26 117.4 51.7 34.9
The Netherlands 4.1 1.8 1.4
United States 40.8 18.3 24.1
Val
ue
of
exp
ort
s,
%
chan
ge
European Union - 26 2.03 0.88 1.6
The Netherlands 1.69 0.76 1.3
United States 6.06 2.68 5.7
Val
ue
of
imp
ort
s,
%
chan
ge
European Union - 26 2.01 0.88 1.6
The Netherlands 1.83 0.8 1.4
United States 3.93 1.74 3.7
Ter
ms
of
trad
e, %
ch
ang
e European Union - 26 0.07 0.03 -0.2
The Netherlands 0.07 0.03 0.0
United States -0.23 -0.10 0.1
Note: EU26 is the EU minus the Netherlands.
The results at sectoral level are not fully comparable, as the two studies use a different aggregation
of sectors. In the EU-US FTA study, Dutch sectors that are expected to gain most in terms of
percentage output increase are iron and steel (5.6%), dairy products (2.5%), beverages and
tobacco (2.1%) and petro- chemicals (1.7%). Other transport equipment (- 3.6%), meats -except
beef- (-2.4%) and motor vehicles (-2.9%) are the sectors expected to contract most. In the EU-US
NTM study, motor vehicles (5.7%), chemicals (2.2%) and insurance are expected to experience the
largest increase in percentage terms, while electrical and other machinery (respectively -5.5% and -
1.9%) are expected to contract most.
Selection of top sectors for further focus
Four criteria were used to select three top sectors for which a detailed assessment of main barriers
to the US market would be made. These four criteria were: a) the share of the top sector’s exports
in total Dutch exports, b) the share of the top sector value added in total Dutch GDP; c) the
existence of EU-US trade barriers in the topsector; and d) the benefits from aligning EU-US non
tariff measures (NTMs) in the top sector. On the basis of these criteria, the following sectors were
selected: 1) Agrofood and Horticulture; 2) High Tech Systems and Materials; and 3) Chemicals.
Trade barriers and priorities for selected top sectors
For each of the selected top sectors, the main barriers to the US markets were identified and
prioritised, based on the importance attached to the barriers by the stakeholders and the relevance
of the barrier for the sector (i.e. whether it is affecting the whole sector or only part of the sector).
Below we present the main barriers and priorities for each of the selected top sectors.

11
Study on "EU-US High Level Working Group"
For Agrofood and Horticulture (AF&H), most barriers relate to the broader areas of customs and
tariffs and health & safety requirements. The latter primarily relate to SPS measures which clearly
constitute the main non-tariff barrier for trade with the US.1 Mutual recognition or harmonisation of
standards would therefore help to increase market access to the US. However, this will not be easy
to achieve. Some barriers, like the ban on beef due to BSE, are unlikely to be removed, also given
the EU measures in the sector. It will be important to be aware of the EU barriers to US products in
order to assess what could be offered to the US in return for removing certain barriers. Although
this applies to all sectors, it is especially relevant for the AF&H sector, given the support and
protection this sector gets in the EU (notably through the Common Agricultural Policy).
For High Tech Systems & Materials (HTSM), a large part of the relevant barriers (including
restrictions and prohibitions) are taken on the grounds of national security. As there are many dual
use products in the sector, these barriers have a significant effect. It will be very difficult if not
impossible to remove these barriers, rather the focus should be on facilitating procedures, and
increasing transparency and exchange of information. For a number of products in the sector, US
standards also differ from EU or even international standards. Here too, it would be good to come
to harmonisation or mutual recognition of standards. Increase in access to the market for
government procurement is also relevant for the HTSM sector.
For Chemicals, tariffs constitute a barrier especially given the large amount of intra-industry trade
in the sector. In addition, technical and health and safety requirements are important, and mutual
recognition or equivalence of measures would greatly benefit the sector. It is also worth mentioning
that stakeholders have pointed to an unequal playing field between the EU and the US due to EU
policies, like the sugar quota which drive up sugar prices (sugar is an important input for the
chemical industry) and the relatively more strict rules in the EU for state aid compared to the US.
Policy recommendations
The above already contains some sector-specific policy recommendations. If we look at the policy
recommendations at a more general level, the following two general barriers appear to be most
important to the top sectors: 1) differences in regulations and standards (whether they relate to
health and safety or technical measures); and 2) import duties. With respect to the first barrier, the
problem is usually not that the standards are difficult to meet (many indicate that EU standards are
even higher), but that there are differences between EU and US standards, which cause additional
costs and prevent economies of scale, and/or that efforts are needed to prove compliance with the
US standards and requirements. The lack of transparency on the requirements itself or the process
to get approval for exports or investment to the US also causes uncertainty and extra costs for
Dutch companies. It should be stressed that many of the barriers have a long history and/or are
part of the culture in the US, and they are unlikely to be eliminated completely. Rather, the goal
should be to increase transparency, simplify procedures and reduce the time needed for approval
processes, etc.
Tariffs are also identified as priority barriers, notably for AF&H and Chemicals. Although in general
they are already low, for some specific products they can be higher and especially in subsectors
where margins are small, tariff elimination can still be important.
1 Differences in EU-US SPS measures are not given the highest priority, but medium priority, which can be explained by the
fact that that there are also other, more specific SPS related barriers included in the table.

13
Study on "EU-US High Level Working Group"
1 Introduction and main objective of this study
1.1 Rationale and aim of this study
The European Union (EU) and the United States of America (US) continue to be large economic
powers in the global economy. Thanks to a long-standing relationship at several levels (economic,
political, etc.), the EU and the US economies are nowadays strongly intertwined and account for
large bilateral trade and investment flows. The Netherlands, being very open and an important
trading country within the EU economy, is strongly affected by the relationships with the US. An
open and favourable trade and investment climate and strong mutual relationships between the EU
and the US are thus critically important not just for the US and EU as a whole, but for the
Netherlands in particular.
The global trade and investment environment has changed significantly since the 1990s. Firstly,
Regional Trade Agreements (RTA) have become increasingly important. Secondly, in line with the
overall decrease of ‘conventional’ tariffs (ad valorem tariffs), focus has increasingly shifted to the
tackling of Non-Tariff Measures (NTMs) to trade and investment flows. This is especially the case
for economies with a similar level of development and a trade relationship with a strong focus on
trade in services and FDI.
Due to the enormous potential of intensified relations between the EU and the US in this changing
environment, US President Obama and the European Commission and European Council
Presidents Barroso and Von Rumpuy have instructed the Transatlantic Economic Council (TEC) to
create a High Level Working Group on Jobs and Growth (HLWG). These two bodies have been
created with the aim to identify policies and measures to increase EU-US trade and investment.
The HLWG will report its findings and recommendations to both US and European leaders by the
end of 2012. The Netherlands is in the position to support the HLWG both politically and in terms of
content. In addition to identifying and assessing options with high potential for strengthening the
EU-US trade and investment relationship to create economic growth and employment in general,
the Netherlands also specifically has ample opportunities to benefit from the developments and
opportunities discussed in the working group.
One of these promising opportunities lies in the possibility of an EU-US Free Trade Agreement
(FTA), from which the Netherlands with its relatively open economy could gain significantly. In order
to assess the economic impacts resulting from such an FTA for the Netherlands, but also in order to
get a complete picture of the interests for the EU and the US, Ecorys has already conducted a
study2 that identifies potential effects of a ‘standard’ FTA. However, due to the increased
importance of non tariff measures and the concomitant decline in significance of tariffs in
international trade, this study has potentially underestimated the likely effects of an FTA. A second
Ecorys study3 on the effects of aligning non-tariff measures in EU-US trade fills this void, but does
not specifically outline separate results for the Netherlands and the rest of the European Union.
The present study combines both approaches by reporting the effects for the Netherlands of an EU-
US FTA as per the Ecorys (2009) study, and by re-estimating the economic impacts of non-tariff
measure removal for the Netherlands specifically, based on the results of EU-US alignment
exercise of the Ecorys (2010) study. In this way, the study aims to contribute to the HLWG
2 Ecorys Nederland B.V. (2009): The impact of Free Trade Agreements in the OECD. The impact of an EU-US FTA, EU-
Japan FTA and EU-Australia/New Zealand FTA. 3 Ecorys Nederland B.V. - NEI (2010): Non Tariff Measures in EU-US Trade and Investment. An Economic Analysis.

14
Study on "EU-US High Level Working Group"
discussions by presenting a clear overview of trade measures that can be aligned and the
economic consequences for both the Netherlands and the EU of an FTA between the EU and US.
By doing so, the study aims to provide the Dutch Government with relevant inputs for the HLWG
discussions on further cooperation between the EU and the US.
In order to obtain a comprehensive picture of the potential gains of trade liberalisation in the sectors
that are most important for the Dutch economy, the results will also be translated into sector-
specific impacts. This will be done to the extent possible for the nine Dutch ‘top sectors’ that are
defined in the sector policy of the Dutch government as economic clusters with internationally
recognised strengths.
1.2 Structure of the study and methodology
The approach and methodology of this study is based on the following four steps:
1. Step 1: Determine effects of a potential EU-US FTA for the Netherlands
In Step 1, we look at the effects for the Netherlands of a potential EU-US FTA at both
macroeconomic and sector level, which is relevant for Dutch businesses. The emphasis in this
exercise should lie on the aspects and model specifications that are currently used by the
European Commission (DG Trade) in its assessment of trade policy impacts. As such the
Ministry of EA&I will stay close to the negotiation position and information that DG Trade uses,
which allows the Dutch government to adequately contribute to the discussions on non-tariff
measures. The methodology used for this part of the study is further elaborated below;
2. Step 2: Selection of top sectors for further focus
In Step 2, three relevant top sectors in the Netherlands which are expected to be especially
affected by a potential intensification of the trade relationship between the EU and the US are
selected for further analysis in step 3;
3. Step 3: Identification of Dutch (and EU) trade barriers that could be removed through an EU-US
FTA
In Step 3, we aim to gather comprehensive information on non-tariff measures that affect the
profitability, competitiveness and employment of Dutch businesses within the selected top
sectors;
4. Step 4: Policy recommendations
Step 4 builds on the conclusions from Step 1 to 3 and presents policy recommendations that
follow from these steps.
The remainder of this section elaborates on the approach we take in each of the four steps.
1.2.1 Step 1: Quantitative determination of potential effects of EU-US FTA for NL
The quantitative-economic approach that we employ in the first step builds on the two Ecorys
studies mentioned earlier (Ecorys, 20094; Ecorys, 20105) that assess the effects of an EU-US FTA
and of NTM liberalisation, respectively. It aims to generate quantitative results that are relevant for
the Dutch macroeconomic environment and Dutch businesses at sector-level and can inform the
adoption and implementation of an NTM-oriented approach in the trade negotiations between the
EU and the US.
4 Ecorys Nederland B.V. (2009): The impact of Free Trade Agreements in the OECD. The impact of an EU-US FTA, EU-
Japan FTA and EU-Australia/New Zealand FTA. 5 Ecorys Nederland B.V. - NEI (2010): Non Tariff Measures in EU-US Trade and Investment. An Economic Analysis.

15
Study on "EU-US High Level Working Group"
The first study (Ecorys 2009), commissioned by the then Ministry of Economic Affairs, has modelled
a general tariff-services-NTM reduction strategy and presented its resulting effects. The second
study (Ecorys 2010), commissioned by DG Trade, looked into a more ambitious NTM reduction
strategy between the EU and US.
There are pros and cons of the methodological approaches of the two studies with respect to this
present study. The most logical outcome at this time is that an FTA takes into account tariffs (as
done in the Ecorys (2009) EU-US FTA study for EZ, but not in the Ecorys (2010) NTM study), but
that the emphasis of the FTA is on addressing NTMs (as the NTM study has done in detail,
whereas the EU-US FTA study has only done so in a more general sense). Furthermore, it is highly
likely that the EC will use the Ecorys (2010) NTM study as an economic base for all further studies
and analyses for policy formulation purposes. We believe that both previous studies have added
value and should be used as a basis for our methodology in this study. In addition to interpreting
the results of both previous studies for the Dutch context, additional quantitative analysis is done in
order to break down the NTM study into the specific effects for the Netherlands and EU26 (EU
minus the Netherlands).
In this additional quantitative assessment, the same two scenarios are assumed as in the original
Ecorys (2010) NTM study. Both scenarios rely on the assumption that only 50 percent of total
NTMs in a sector are actionable, i.e. can potentially be removed. The two scenarios are:
1. Ambitious scenario. All actionable NTMs are aligned (= 50 percent of total NTMs) – modelled
both for the short and the long run;
2. Limited scenario. 50 percent of actionable NTMs are aligned (= 25 percent of total NTMs) –
again both short and long run effects are modelled.
The country specification used contains the Netherlands, EU26, US and the Rest of the World
(ROW).
The sectors for which results are reported are based on GTAP classification, provided the general
equilibrium model has made use of GTAP 7.0 data. The original 57 GTAP sectors have been re-
arranged and grouped for the purpose of the study into 20 aggregate sectors. Annex B presents
these aggregated sectors and the original sectors that are grouped under each. In a later stage, the
general equilibrium results for these 20 aggregated sectors are then ‘matched’ to the extent
possible to the selected Dutch top sectors.
Results
In step 1 a summary of the quantitative results of the EU-US FTA study for the Ministry of Economic
Affairs will be presented for the Netherlands, the US and the EU26. Moreover, the results of the
adjusted Ecorys (2010) NTM study will be presented for the Netherlands, the EU27 and the US.
This is done in Chapter 3.
1.2.2 Step 2: Selection of top sectors for further analysis
To the extent possible, the analysis in this study will be tailored to the nine top sectors that the
Dutch government has selected as internationally competitive clusters on which it will focus its
domestic industrial policy. Given the short time frame for this study, the ToR proposes to focus
specifically on three out of these nine top sectors.

16
Study on "EU-US High Level Working Group"
In Step 2 of the study we select these three sectors, which are going to be investigated further in
the remainder of the study. This is done in close consultation with the client and by using the
following four criteria:
1. Share of the top sector exports in total Dutch exports;
2. Share of the top sector value added in total Dutch GDP;
3. The existence of trade barriers in a sector;
4. The benefits from aligning EU-US NTMs in a sector.
In applying these objective criteria, there are two limitations that should be mentioned. Firstly, data
on the Dutch top sectors are not readily available and the statistic specification of these sectors by
Dutch government services is still on-going. This implies that matching the existing trade data that
serve as input to this study to the top sectors is difficult. Secondly and in addition, trade data often
deal with goods sectors only or specifically distinguish goods and services sectors. The Dutch top
sectors, however, contain both goods and related services as sub-categories. As a result of these
two limitations, it is difficult to directly present reliable figures for the four selection criteria at the
level of top sectors.
Therefore, the results under the four criteria are presented in relative scores that rank the
performance of the top sectors on each criterion. A top sector receives a “+” when it performs
relatively well compared to other top sectors, a “+/-“when it scores average and a “-“when it
performs poorly with respect to the other sectors. In order to arrive at these ratings, we use
information from a variety of sources including trade data from GTAP and/or UN COMTRADE, the
top sector information bulletins, CBS data and consultations with the Ministry. The third and the
fourth criterion will be estimated based on the two Ecorys studies that form the basis of this report.
Results
Step 2 provides a relative score for all top sectors on the four proposed criteria as well as a final
selection of the three top sectors that are investigated in more detail.
1.2.3 Step 3: Identification of actionable trade barriers in EU-US context
Step 3 identifies trade barriers that can actually be reduced through an EU-US FTA. As Ecorys has
experienced in its previous studies, consultations with the sector itself are imperative in the
determination of trade barriers. Businesses have the best overview of which issues prevent them
from exporting, investing or importing. Step 3 therefore involves the following four tasks:
Task 1: Initial overview of trade barriers
First of all, a literature review identifies and provides an overview of the most important trade
barriers. The European Commission (EC)Market Access Database (MADB) will constitute an
important source of information for this. Additionally, the Ecorys (2010) NTM study on which the
quantitative estimates are based is used as a source of information.
Task 2: Interviews with stakeholders
Based on the preliminary overview obtained during the first task, interviews are conducted with
important stakeholders. The aim of the interviews is to complement the list of trade barriers. The
interviewees will also be asked to indicate the most restrictive barriers and the potential gains.
Representatives of the top sectors are approached, as well as large traders with the US and sector
organisations in which the key stakeholders are organised.

17
Study on "EU-US High Level Working Group"
Task 3: Consolidating interviews and qualitative results
The information from the various interviews are combined and used to compile a final list of trade
barriers per top sector. These barriers are ranked in order of importance and priority.
Task 4: Validation of prioritised barriers in concluding sectoral workshops
Finally, workshops with 10 to 15 key stakeholders are organised per top sector. The main goal of
these workshops is to validate and cross-check the obtained results and identified trade barriers.
Additionally, the prioritised trade barriers receive special attention by considering the questions of
what the probability is that these barriers can be removed is and how they can be removed/reduced
in the discussions.
Results
The results of this third step include an overview of the main barriers to address by the Dutch
Government for the three selected top sectors.
1.2.4 Step 4: Policy recommendations
The quantitative and qualitative analyses in steps 1, 2 and 3 result in a solid understanding of
potential effects of an EU-US FTA for the EU and for the Netherlands (specifically for top sectors),
and the trade barriers that should be overcome. Step 4 summarises these and presents main
conclusions.
Based on these conclusion the policy recommendations focus on the identification of significant
trade barriers that are suitable and sufficiently important to address in an EU-US FTA - in other
words on those barriers that the Netherlands and the EU should specifically include in the
negotiations. These policy recommendations are aimed at enabling the Ministry of EA&I to provide
informed inputs and recommendations to the HLWG of the TEC.

19
Study on "EU-US High Level Working Group"
2 Context of EU-US trade relations
Since this study aims to address the impacts of a potential FTA between the European Union and
the United States and distinguishes between the effects for the Netherlands, the EU and the US, it
is imperative to understand the context in which any potential negotiations take place. This chapter
provides an overview of the recent developments in the trade and investment environment of the
EU and the US. It does so by discussing the changes in the latest trade policies (section 2.1), the
global economic shift of power (section 2.2), and the current economic relation between the EU and
the US (section 2.3).
2.1 Decline in importance of tariffs and continuing rise of regional trade agreements
Ever since World War II and the signing of the GATT in particular, there has been a rapid decline in
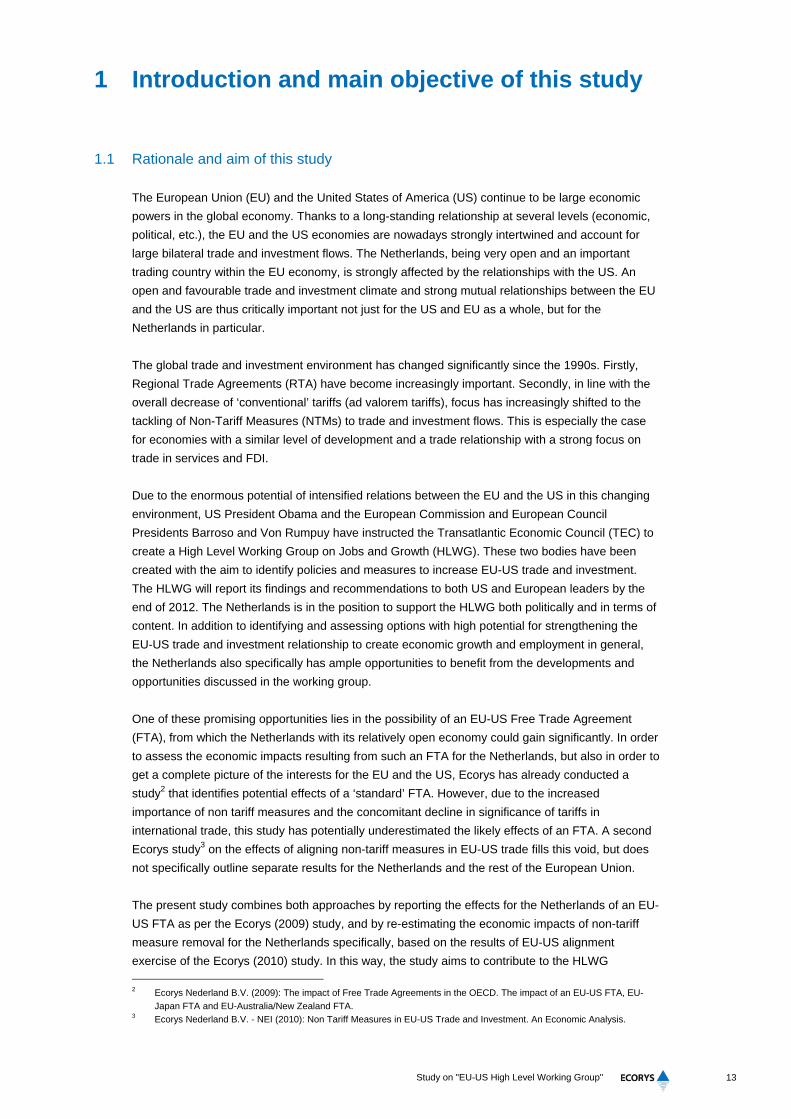
tariff rates applied in the world. Figure 2.1 illustrates that global average tariff rates (right scale)
have decreased from 13 percent in 1947 (signing of the GATT) to just over 4 percent in 2007. Apart
from specific sensitive products and product categories, many general applied tariffs have been
eliminated. Policymakers working in the current global trade environment should acknowledge that,
relatively speaking, tariff rates are much less important than other (non-tariff) trade measures. Prior
to advancing to the topic of (non-tariff) trade barriers, another clear trend that shapes the context of
current trade environment should be outlined. Figure 2.1 also shows the various multilateral trade
negotiations (MTNs) that have taken place and are still taking place. The grey bars indicate the rise
of regional trade agreements (RTAs) since the mid-1990s, a trend that has gone hand in hand with
the establishment of the World Trade Organisation (WTO) in 1995.
Figure 2.1 Tariff liberalisation from 1947: RTAs, MTNs and unilateralism
Sources: RTAs: WTO online database and Hufbauer-Schott RTA database; Tariffs: Clarkson and Williamson (2004) until 1988,
after that World DataBank (weighted tariffs – all products).

20
Study on "EU-US High Level Working Group"
Figure 2.2 shows which countries still apply regular tariffs (ad valorem tariffs – AVEs). The EU and
the US still apply high tariffs on certain products, for example bio fuels in the case of the EU and the
US and electric cars in the EU.
Figure 2.2 Applied tariffs on end products in selected countries (AVE)
Source: WTO World Trade Report, 2011.
Figure 2.3 Cumulative amount of effectuated FTAs, 1950-2010
Source: WTO World Trade Report, 2011.
Figure 2.3 shows an equally interesting trend that shapes the environment of current international
trade, i.e. the rise in RTAs since the establishment of the WTO in the mid-1990s. While the EU has
effectuated several FTAs on behalf of its Member States and as such has contributed to the
increase of RTAs, the largest share of new FTAs since the 1990s stem from the link with
developing countries. However, this way of presenting a rise in FTAs foregoes two important
issues:

21
Study on "EU-US High Level Working Group"
1. The depth of each FTA;
2. The absolute impact of each FTA.
When these two criteria are considered, combined with the current trends, the importance of the
FTAs that the EU will sign is clearly recognizable. Especially the relation with the US and the
potential for an EU-US FTA would be the most important regional development in the trade field,
considering the fact that such an FTA would potentially have an enormous absolute impact and
would be one of the deepest in recent decennia. And while the countries around the Pacific Ocean
are currently negotiating a similar agreement, this agreement would never match the depth of a
Trans Atlantic Partnership (TAP).
2.2 Shifting global economic balance of power
Next to the trends of the rise of regional trade agreements and the decline in the relative
importance of tariffs in comparison to non tariff barriers, the world has experienced another
important trend: the shift of economic power from the West to the East in general, and to China
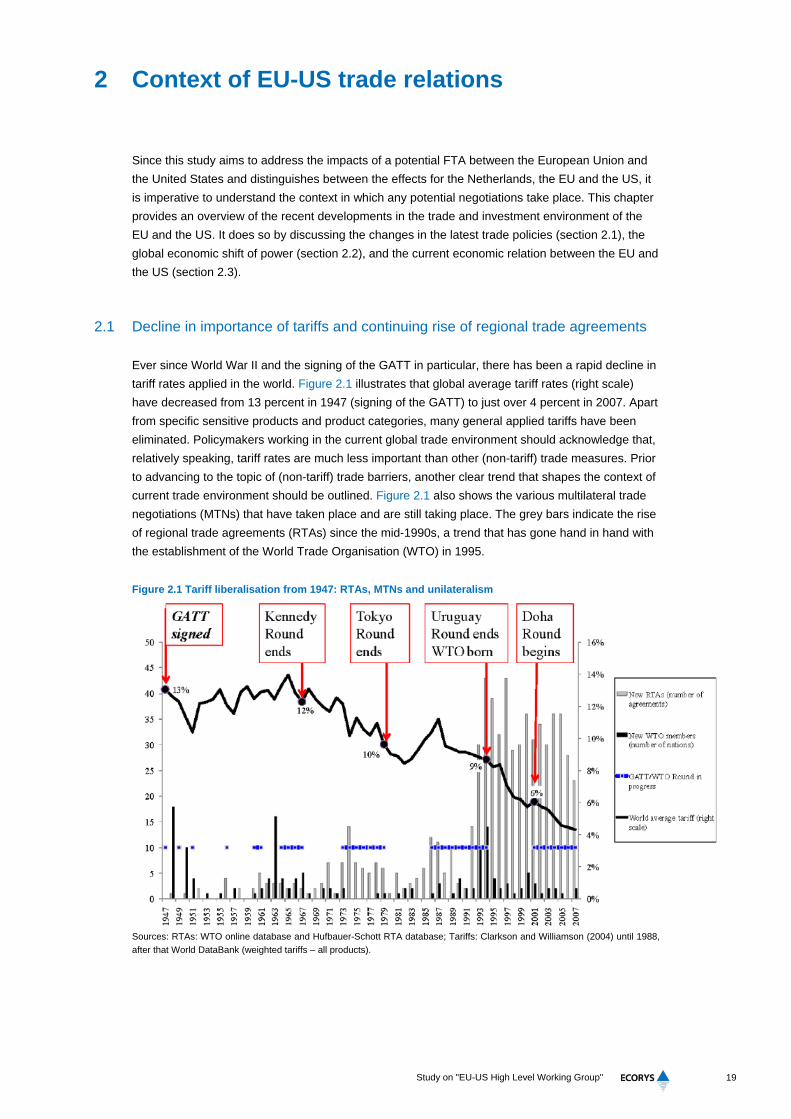
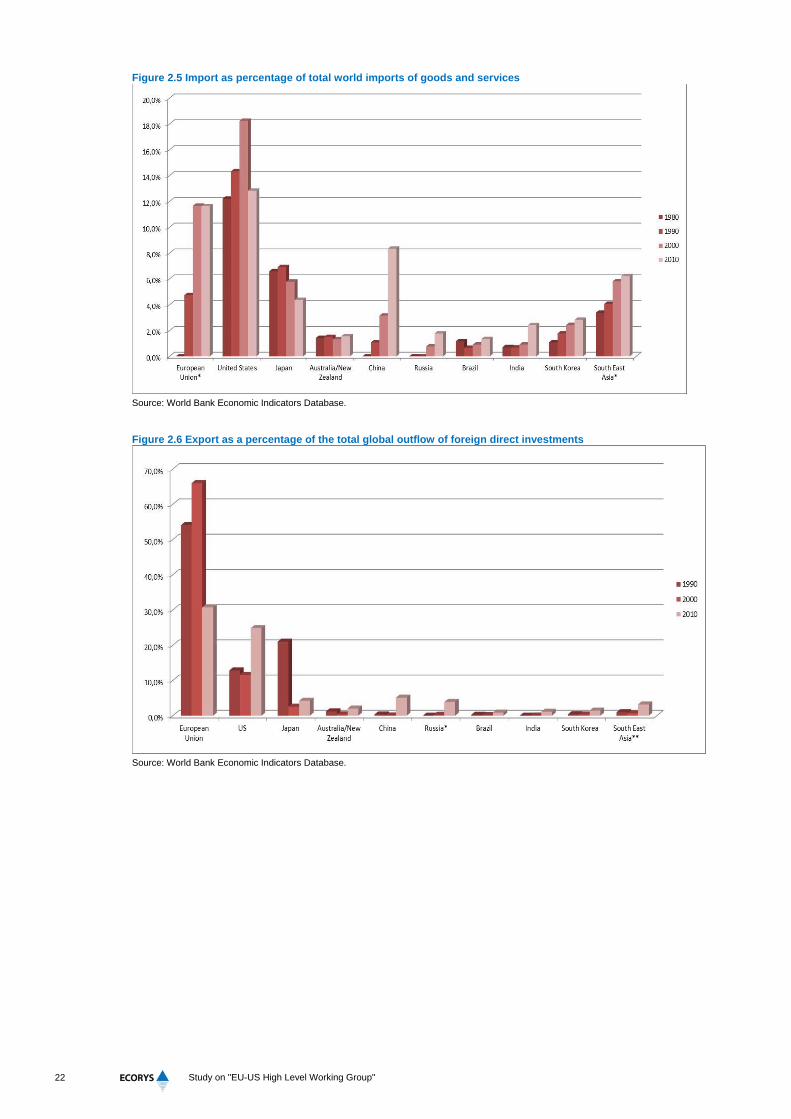
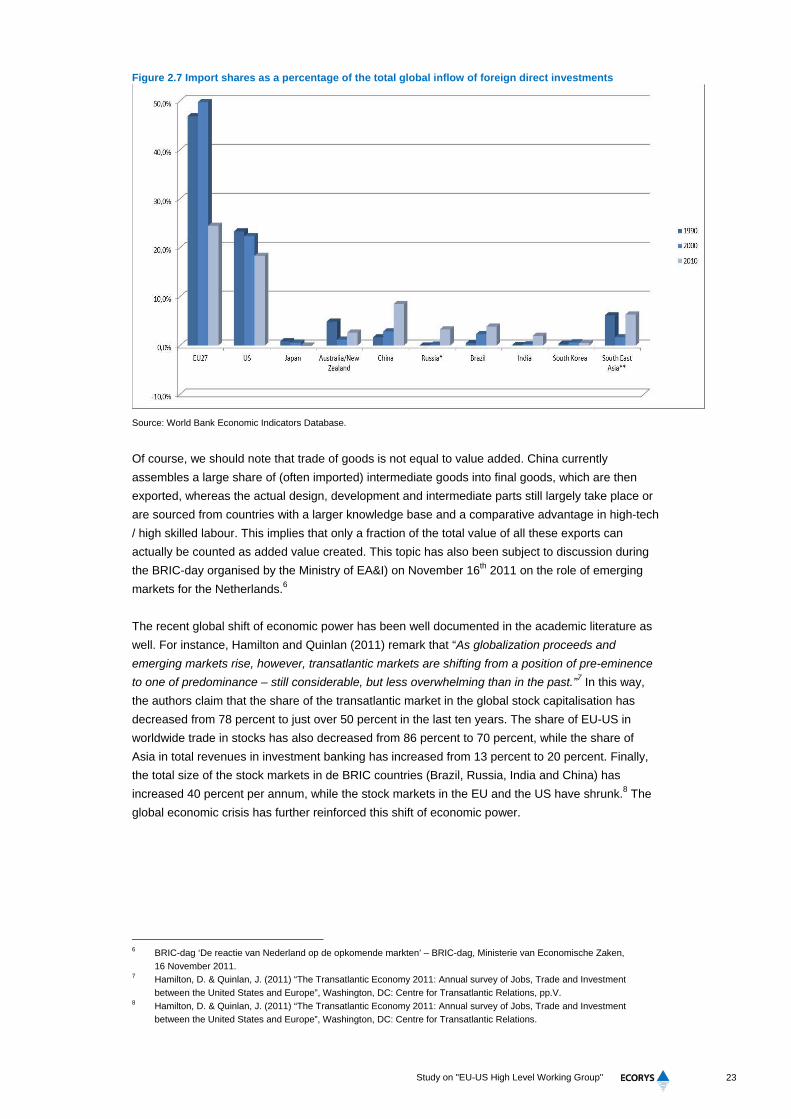
specifically. Figure 2.4 to Figure 2.7 demonstrate this trend for the relative import and export shares
of goods and foreign investments. The margin that the EU and the US currently have in the
international economic environment is declining rapidly, especially in goods trade.
The figures illustrate that Asia’s share in global exports and imports has increased rapidly in the
past 20 years, while at the same time the share of European and American trade and investments
has been declining. The dominance of the Western countries in the investment field is still much
more profound compared to the goods trade, but also in this field both economies are losing ground
(especially the EU). Recently, China has been increasing its investments overseas in order to grow
its domestic business.
Figure 2.4 Export shares as percentage of total world goods and services exports
Source: World Bank Economic Indicators Database.
22
Study on "EU-US High Level Working Group"
Figure 2.5 Import as percentage of total world imports of goods and services
Source: World Bank Economic Indicators Database.
Figure 2.6 Export as a percentage of the total global outflow of foreign direct investments
Source: World Bank Economic Indicators Database.
23
Study on "EU-US High Level Working Group"
Figure 2.7 Import shares as a percentage of the total global inflow of foreign direct investments
Source: World Bank Economic Indicators Database.
Of course, we should note that trade of goods is not equal to value added. China currently
assembles a large share of (often imported) intermediate goods into final goods, which are then
exported, whereas the actual design, development and intermediate parts still largely take place or
are sourced from countries with a larger knowledge base and a comparative advantage in high-tech
/ high skilled labour. This implies that only a fraction of the total value of all these exports can
actually be counted as added value created. This topic has also been subject to discussion during
the BRIC-day organised by the Ministry of EA&I) on November 16th 2011 on the role of emerging
markets for the Netherlands.6
The recent global shift of economic power has been well documented in the academic literature as
well. For instance, Hamilton and Quinlan (2011) remark that “As globalization proceeds and
emerging markets rise, however, transatlantic markets are shifting from a position of pre-eminence
to one of predominance – still considerable, but less overwhelming than in the past.”7 In this way,
the authors claim that the share of the transatlantic market in the global stock capitalisation has
decreased from 78 percent to just over 50 percent in the last ten years. The share of EU-US in
worldwide trade in stocks has also decreased from 86 percent to 70 percent, while the share of
Asia in total revenues in investment banking has increased from 13 percent to 20 percent. Finally,
the total size of the stock markets in de BRIC countries (Brazil, Russia, India and China) has
increased 40 percent per annum, while the stock markets in the EU and the US have shrunk.8 The
global economic crisis has further reinforced this shift of economic power.
6 BRIC-dag ‘De reactie van Nederland op de opkomende markten’ – BRIC-dag, Ministerie van Economische Zaken,
16 November 2011. 7 Hamilton, D. & Quinlan, J. (2011) “The Transatlantic Economy 2011: Annual survey of Jobs, Trade and Investment
between the United States and Europe”, Washington, DC: Centre for Transatlantic Relations, pp.V. 8 Hamilton, D. & Quinlan, J. (2011) “The Transatlantic Economy 2011: Annual survey of Jobs, Trade and Investment
between the United States and Europe”, Washington, DC: Centre for Transatlantic Relations.

24
Study on "EU-US High Level Working Group"
2.3 The economic relation between the EU and the US
On the 16th of February 2012, Robert Hormats had to testify in front of the Banking Commission of
the Senate about the Euro zone crisis: “When then-candidate Barack Obama spoke in Berlin in July
2008, he stated that one of the priorities of his presidency would be to re-establish strong trans-
Atlantic relations. Citing the daunting political, security and economic challenges of the 21st
century, he stressed then that America has no better partner than Europe. In the more than three
years since, and despite discussion in the media about where Europe fits in the United States’
global framework and speculation that Europe is turning inward as it deals with its domestic issues,
the reality that President Obama articulated in Berlin has not changed. Europe is - and remains -
America’s partner of first resort and its staunchest ally. The strategic alignment between the United
States and Europe, rooted in shared history and values, has never been closer in addressing both
international threats and internal challenges” (Hormats, 2012).9
Apart from the emphasis that Hormats places on the strong partnership between the EU and the
US, the fact that the Under Secretary of State for Economic, Business and Agricultural Affairs has
to testify in front of the Senate illustrates the huge importance of the transatlantic relationship
(Hamilton en Quinlan, 2011)10. Table 2.1 below provides an example that underlines the
interdependence of the EU and US economies.
Table 2.1 Banks in various countries: international risks ($)
Exposure
to (end
June
2010)
French
Banks
German
Banks
Greek
Banks
Irish
Banks
Italian
Banks
Portugu
ese
Banks
Spanish
Banks
UK
Banks
Belgian
Banks
U.S
Banks
France 196.8bn 1.9bn 18.1bn 31.6bn 8.2bn 26.3bn 257.1bn 29.7bn 161.5bn
Germany 255.0bn 5.7bn 32.1bn 254.4bn 3.9bn 39.1bn 172.2bn 20.9bn 152.1bn
Greece 53.5bn 36.8bn 7.8bn 5.3bn 10.0bn 925.0m 12.0bn 2.0bn 7.5bn
Ireland 50.1bn 138.6bn 461.0m 15.3bn 19.4bn 14.0bn 148.5bn 54.0bn 68.7bn
Italy 418.9bn 153.7bn 485.0m 40.9bn 3.4bn 32.6bn 66.8bn 24.6 32.5bn
Portugal 41.9bn 37.2bn 101.0m 5.1bn 4.7bn 78.3bn 22.4bn 2.6bn 3.2bn
Spain 162.4bn 181.6bn 673.0m 25.3bn 25.6bn 23.1bn 110.8bn 18.8bn 47.1bn
UK 327.7bn 462.1bn 19.7bn 209bn 44.9bn 7.7bn 386.4bn 43.1bn 572.7bn
Belgium 253.1bn 35.1bn 5.7bn 90.5bn 3.7bn 400.0m 5.7bn 172.2bn 40.0bn Source: Bank of International Settlements, Financial Times. Data for Foreign claims by nationality of reporting banks, immediate
borrower basis.
The relation between the EU and the US is – according to Marc Vanheukelen11 – good: “Despite
the economic and financial crisis and the rise of major emerging economies, the EU-US commercial
relationship is still by far the biggest commercial artery in the global economy, worth around €3
trillion in terms of annual trade flows and investment. 15 million jobs are related to the transatlantic
economy. The most distinctive feature of the EU-US link is the colossal mutual foreign direct
investment with over €2 trillion mutual investment stocks, which sets it apart from any other link in
the world. US firms are investing more in Belgium than in either Brazil, China or India, and EU
investments in the US represent more than 2/3 of the overall investment inflows. Given the strong
9 Hormats, R. (2012) “Testimony of under secretary Robert D. Hormats to the Senate Banking Committee February 16,
2012 on the examining the European Debt Crisis and its implications. 10 Hamilton, D. & Quinlan, J. (2011) “The Transatlantic Economy 2011: Annual survey of Jobs, Trade and Investment
between the United States and Europe”, Washington, DC: Centre for Transatlantic Relations. 11 Marc Vanheukelen is Chef du Cabinet of Commissioner of DG Trade, De Gucht. The commissioner of Trade is the co-
president of the TEC, the Transatlantic Economic Council, and also co-chair of the High Level Working Group on Growth
and Jobs.

25
Study on "EU-US High Level Working Group"
integration of our economies it is not surprising that we sometimes also get involved in trade
disputes, which make it to the headlines such as Boeing/Airbus or REACH. But the disputes need
to be put into perspective: they affect less than two percent of our trade.”12
The deep and strong ties that characterise the relations between the EU and the US can be
corroborated by several (economic) statistical indicators. The EU and the US have strong economic
relationships on several levels. Despite the recession, both countries still constitute each other's
main commercial markets. The total value of the transatlantic economy in terms of commercial
sales is estimated at $5 trillion and together these markets create about 15 million jobs in both the
US and the EU (Hamilton & Quinlan, 2011)13. Especially in foreign investment, portfolio investment,
bank claims, trade and trade in goods and services of affiliates, and sales of knowledge-intensive
services, the ties are strong. Figure 2.8 shows the main international economic relations of the US
international trade in goods and services are slightly higher between the US and Asia / Pacific ($1.3
trillion) than between the US and the EU ($1.2 trillion). However, if we look at total sales of affiliates
in the Transatlantic market (in other words, the depth of commercial presence in each other's
economies), it appears that the Transatlantic artery is three times as big compared to the Trans-
Pacific artery with Asia / Pacific. Commercial presence is what Hamilton en Quinlan (2010)14 call
the sleeping giant of the Trans Atlantic market.
Figure 2.9 confirms this view. It shows that the income of European affiliates of US owned
companies exceeds $200 billion in 2010; vice versa income for European affiliates in the US
amounted to $100 billion. This enormous interdependence and mutual dependence of two large
economic powers is unique in our contemporary world.
Figure 2.8 The United States’ most important commercial ties (trillion $US)
Source: Bureau of Economic Analysis. Foreign Affiliate Sales: Data for 2008; Total trade: Data goods and services, 2008.
12 Vanheukelen, M. (2012) “Transatlantic voices – Transatlantic economic relations” in: “Transatlantic Business Dialogue
Newsletter February 2012”, available at:
http://www.tabd.com/images/stories/Documents/newsletter/TABD_NEWSLETTER_February_2012.pdf, pp.1. 13 Hamilton, D. & Quinlan, J. (2011) “The Transatlantic Economy 2011: Annual survey of Jobs, Trade and Investment
between the United States and Europe”, Washington, DC: Centre for Transatlantic Relations. 14 Hamilton, D. & Quinlan, J. (2010) “The Transatlantic Economy 2010: Annual survey of Jobs, Trade and Investment
between the United States and Europe”, Washington, DC: Centre for Transatlantic Relations.

26
Study on "EU-US High Level Working Group"
Figure 2.9 Profits of EU/US affiliates in US/EU
Source: Bureau of Economic Analysis; * Data tot en met Q32010. Vervolgens geannualiseerd voor jaarschatting.
Another way of looking at the depth of the commercial relationship between the EU and the US is
by studying the share of trade between related parties in countries, i.e. between different units of a
multinational enterprise. The larger this share is, the larger the commercial presence of EU
multinationals is in the US and vice versa. Table 2.2 illustrates the share of related party trade as a
percentage of total trade and indicates that, for example, almost 65 percent of total exports from the
Netherlands to the US is between different entities of multinationals (imagine ING exports services
to one of its sister companies in the US). The share of total exports that is between related parties
from the US to selected European countries is lower, which is an indication that there are relatively
more US owned subsidiaries in Europe than the other way around.
Table 2.2 Intra-multinational trade as percentage of total trade
US Imports: “Related Party
Trade” as % of total
US Exports: “Related Party
Trade” as % of total
European Union 60.7 30.6
Germany 64.5 29.6
France 55.9 27.7
Ireland 84.7 30.4
Netherlands 64.4 54.1
United Kingdom 59.4 23.6 Source: Bureau of Economic Analysis. Foreign Affiliate Sales: Data for 2008; Total trade: Data goods and services, 2008.
The transatlantic economy is the largest and richest market in the world and responsible for 54
percent of the value of world gross domestic product (2010) and 40 percent when adjusted for
purchasing power (Hamiltion & Quinlan, 2011). Even after the financial crisis, the EU and US
financial markets own more than two thirds of global bank assets, three-quarters of all global
financial services and 77 percent of all equity linked derivatives. In addition, the market also owned
93 percent of all global foreign currency in US Dollars (62 percent), Euros (27 percent) and Pounds
(4.2 percent) in 2010.

27
Study on "EU-US High Level Working Group"
Finally, looking at the number of jobs generated in the US by subsidiaries of EU parent companies
and vice versa, we observe that this appears to be an impressive 15 million. In comparison, the
number of jobs generated by US firms in China is approximately 500,000. A company like Airbus
alone is responsible for 180,000 jobs in the US and buys more than $10 billion in goods and
services from the USA annually15.
Table 2.3 The US-Europe employment balance (‘000 employees, 2008)
Country European Affiliates1 of
U.S. companies
U.S. Affiliates2 of
European companies
Employment balance
Austria 44.0 14.4 -29.6
Belgium 129.0 179.3 +50.3
Denmark 38.9 26.8 -12.1
Finland 23.8 31.5 +7.7
France 604.4 550.2 -54.2
Germany 621.3 614.2 -7.1
Ireland 89.0 66.2 -22.8
Italy 232.9 86.5 -146.4
Luxembourg 13.6 35.5 +21.9
Netherlands 228.8 371.5 +142.7
Norway 33.7 8.0 -25.7
Spain 188.1 66.8 -121.3
Switzerland 81.5 394.4 +312.9
United Kingdom 1,174.2 957.4 -216.8
Europe 3,503.2 3,402.7 -100.5 Source: Bureau of Economic Analysis; Note: A positive employment balance (“+”) is defined as a net advantage for the US; 1
Majority stake in non-bank affiliates; 2 Majority stake in banks en non-bank affiliates.
In conclusion, the Transatlantic market is characterised by strong ties between the EU and US, of
which the services and commercial presence in each other's economies and the concomitant job
creation form the deepest links. The transatlantic economy is by far the largest in the world in terms
of gross domestic product. We can draw two important policy lessons from these findings. Firstly,
the EU and US are highly interdependent, but in an equal manner (compare this with the US-China
relationship: Chinese exporters are highly dependent on the purchasing power of American
consumers, but the ties are not nearly as deep). Secondly, even if further integration or alignment of
NTMs would lead to a small percentage increase in economic growth or job growth, this would still -
given the absolute size of the transatlantic economy - mean a lot in absolute terms. In other words,
NTM harmonization could lead to a multi-billion dollar increase of gross domestic product and
employment.
2.3.1 Studies on the economic ties between the EU and the US
In recent years, many different studies have been conducted on the effects of a potential
intensification of the collaboration between the EU and the US. All expect positive impacts, but the
estimated size of the effects differs. The lobby organisation ECIPE has calculated that an EU-US
zero-tariff FTA (for certain goods) would increase GDP for the EU with 0.48 percent on an annual
basis and GDP of the US with 1.48 percent, which would lead to an increase in welfare of $89
billion for the EU and a welfare gain of $87 billion for the US. Exports from the EU to the US would
15 McArtor, A. (2011) “Sustaining competitiveness by continuing to set the standards” in: “Transatlantic Business Dialogue
Newsletter October 2011”, available at: http://www.tabd.com/images/stories/tabd_newsletter_october_2011.pdf.

28
Study on "EU-US High Level Working Group"
rise by 18 percent and exports from the US to the EU would increase by 17 percent16. However, the
NTM study from Ecorys (2010) 17 concludes that abolishing tariffs on goods and services trade
between the transatlantic partners leads to a smaller combined welfare gain (see below). The
Ecorys (2009) study on the FTA between the EU-US estimates that a 75 percent reduction in tariff
cost equivalent trade barriers could lead to an increase in welfare of €13.9 billion for the EU and
€5.6 for the US18.
Existing studies do indeed show that ‘regular’ tariffs can already be considered low and that the
most important obstacles for a truly integrated transatlantic market depends on the successful
reduction of non-tariff measures19. This implies that issues such as sanitary and phyto sanitary
(SPS) measures, technical barriers to trade (TBT), safety guidelines, REACH, the Buy American
Act and related measures constitute a much larger barrier than remaining tariffs. The OECD
(2007)20 estimates that reforms tackling tariffs as well as non tariff barriers would increase GDP per
capita by 3.5 percent. To put this in perspective, such a GDP increase would be equivalent to
handing over an extra yearly salary to every citizen in the EU and the US over his or her entire
working life.
The Ecorys NTM study (2010) is more conservative than the study from the OECD and concludes
that reducing 50 percent of existing NTMs between the EU and the US would increase the GDP of
the EU by 0.7 percent (€122 billion annually) and that of the US by 0.4 percent (€54 billion
annually)21.
2.3.2 The current state of affairs between the EU and the US
The previous sections have outlined in detail the (great) importance of the relation between the EU
the US in economic terms. However, for a complete picture of the context that the current HLWG
has been set up in, we need to look at the progress in the field of NTM alignment, institutions that
have been set up to bring the EU and the US closer together and stories of success and failure that
both parties have experienced in the past when trying to integrate markets.
As outlined in section 2.3, leaders on both the EU (de Gucht and Vanheukelen) and US (Hormats)
side are positive about the bonds between the EU and the US. Next, a few institutions and opinions
are reviewed that characterise the current environment.
The Transatlantic Economic Council
The Transatlantic Economic Council (TEC) is an institutionalised political collaboration agreement,
which aims to speed up the cooperation between the governments of the EU and the US in order to
realise economic integration between the two country blocs. In 2007 the EU and the US agreed,
during a bilateral summit, on a framework (working plan) for a deepening of the Trans Atlantic
economies. The TEC executes this (continuously changing) working plan. Since 2009, the EU
Commissioner for Trade, Karel de Gucht, chairs the meetings. The chairman on the US side is the
interim national security advisor for international-economic relations, Michael Froman.
16 Erixon, F. and Bauer, M “A Transatlantic Zero Agreement: Estimating the Gains from Transatlantic Free Trade in Goods,”
ECIPE occasional Paper No. 4/2010 (Brussels: ECIPE, 2010). 17 Berden, K. et. al, Non- Tariff Measures in EU- US Trade and Investment: An Economic Analysis (Rotterdam: Ecorys, 2009). 18 Berden, K. et. al, The Impact of Free Trade Agreements in the OECD: The Impact of an EU- US FTA, EU-Japan FTA and
EU- Australia/New Zealand FTA (Rotterdam, Ecorys, 2010). 19 Berden, K. et. al, Non- Tariff Measures in EU- US Trade and Investment: An Economic Analysis (Rotterdam: Ecorys, 2010). 20 OECD (2007), International Investment Perspectives 2007: Freedom of Investment in a Changing World, OECD Publishing. 21 See footnote 13.

29
Study on "EU-US High Level Working Group"
Related to the TEC are the High Level Regulatory Cooperation Forum (with the specific mission of
addressing discrepancies in the regulatory environments and reporting these to the TEC) and the
Energy Platform (to target energy-specific aspects).
The recent achievements of the TEC are an indication of the state of affairs in the current EU-US
environment. Aligning NTMs between both partners is not easy, but still the TEC has succeeded in
reducing some important barriers, not least the barriers on secure trade and electrical cars. In both
areas, the TEC has achieved convergence between the two trading partners in their way of viewing
and assessing trade in products and services. Next to its general efforts in reducing regulatory
differences, the TEC also works on safety on the road, testing of cosmetics and the prevention of
new NTMs arising.
Despite these successes of the TEC, critics argue that the body lacks concrete achievements and
results since it often get stuck on working on the details of certain issues.
The High Level Working Group on Growth and Jobs
During the high level summit of European and US leaders in November 2011, EC President
Barroso and US President Obama asked the TEC to create the HLWG on Growth and Jobs. The
HLWG is specifically tasked with analysing which NTMs (once they are aligned) could create the
most growth and employment in the short term for the EU and the US. The HLWG is co-chaired by
EU Commissioner of Trade, Karel de Gucht, and US Trade Representative Ron Kirk and is
supposed to publish results twice in 2012: an interim report in June and a final report in November.
Successful completion of the work of the HLWG is very welcome on both sides of the Atlantic:
Higher economic growth would increase tax collections and reduce national debts in Europe and in
the US could lead to much needed employment growth. The deadlines for the HLWG are hence
tight and both the EU and the US are pressing for results in the short term.
Opinions on the EU-US relation – the TABD Newsletter
The opinions of several key figures in the EU-US economical and political field will also give a good
impression of how the current relationship can be described and is experienced. These key figures
have a solid understanding of the potential impact and the way forward of the intensified
relationships. A variety of opinions – as recorded in the Trans Atlantic Business Dialogue (TADB)
Newsletter - is considered here, from: Philippe Meyer (Head of Unit of EU-US relations for DG
Trade), James Elles (Member of European Parliament (MEP) and chairman of the Transatlantic
Policy Network (TPN)), Koen Berden (Partner Ecorys) and Mark Vanheukelen (Chef du Cabinet of
EU Commissioner de Gucht).
Philippe Meyer (Head of Unit of EU-US relations within DG Trade)
Philippe Meyer wrote the keynote of the December 2010 edition of the TABD Newsletter. In this
article, he claims that the new ‘administrations’ are ready for talks on far-reaching collaboration
between the EU and the US through the TEC and through the High Level Regulatory Cooperation
Council. He writes that the advantages of cooperation are clear and that most of the players are
ready to implement changes. On the other hand, he acknowledges that even after more than 15
years of work on the transatlantic relations, there are still many challenges that need to be
overcome in order to put steps forward. Particularly troublesome topics are e-health, electric cars,
and secure trade.

30
Study on "EU-US High Level Working Group"
James Elles (MEP, chairman TPN)
James Elles, wrote the keynote for the October 2011 edition of the TABD Newsletter. He clearly
states that the goal of increased cooperation should be strongly tailored towards a ‘growth and jobs’
approach, so as to also ‘find solutions for domestic problems’: “A comprehensive push to remove
non-tariff barriers and create a truly liberated transatlantic market could form the core of such a
‘Transatlantic Growth and Job Initiative’ (TABD, October 2011)22. Such a solution would also be the
best response to the shift of economic power to Asia.
Koen Berden (Partner Ecorys)
Dr. Koen Berden wrote the keynote for the January 2012 edition of the TABD Newsletter. As the
first to write after the EU-US Top and TEC, he emphasises the urgency to come to an agreement of
a Transatlantic NTM FTA – TANFTA. Completely in line with the focus applied by James Elles, he
believes that the TANFTA should create jobs and economic growth. He brings forward five key
points that the TANFTA should include: 1) the creation of a tariff-free transatlantic market; 2)
addressing existing NTMs with large potential economic benefits; 3) Cooperation to ensure that
potential new NTMs are tackled before they emerge; 4) Strengthening the institutional transatlantic
environment to implement and enforce TANFTA and 5) Engaging other (emerging) economies in
TANFTA.
Marc Vanheukelen (Chef du Cabinet van Karel de Gucht)
Marc vanheukelen wrote the keynote for the February 2012 edition of the TABD Newsletter.
According to Vanheukelen it is clear that: “our [US and EU] economies are already so integrated
that it is easy to become complacent. But the biggest challenge still remains to be tackled, i.e. how
to exploit the full potential of the transatlantic relationship to remain competitive on a global scale.
To achieve that, we need to strengthen regulatory coherence and develop common policy
approaches, which we promote internationally to give businesses a level playing field in the
transatlantic market and beyond. And we need to identify and assess options for strengthening the
EU-US trade and investment relationship, especially in those areas with the highest potential to
support jobs and growth.”
22 Elles, J. (2011) “Transatlantic voices – EU-US cooperation: Time for a transatlantic growth and jobs initiative” in:
“Transatlantic Business Dialogue Newsletter October 2011”, available at:
http://www.tabd.com/images/stories/tabd_newsletter_october_2011.pdf, pp.2.

31
Study on "EU-US High Level Working Group"
3 Quantitative results of trade liberalisation for NL, EU26 and US
This chapter analyses the quantitative impacts of a trade liberalisation process under a bilateral
FTA between the EU and the US. It summarises the findings of the Ecorys (2009) EU-US FTA
study and calculates and spells out the specific outcomes for the Netherlands (in addition to
summarizing the EU and US results) of the Ecorys NTM study (2010).
3.1 Effects of an EU-US FTA including tariff liberalisation
3.1.1 Specification of the study
The Ecorys (2009) study, conducted for the Ministry of Economic Affairs, employs a standard multi-
regional computable general equilibrium (CGE) model, which is based on the original Francois, van
Meijl and Van Tongeren model (FMT, 2005). This CGE model uses GTAP 7.0 data benchmarked to
2004, which provided the most recent available data on production, consumption and trade at the
time. The model takes into account taxes at various levels, trade policy instruments, international
trade costs and important industry competition features. The results of the CGE exercise are split
into macro-economic effects and sector-specific effects and into short run and long run effects
(taking into account capital accumulation and convergence to a steady (equilibrium) state). These
effects are summarised in the next two subsections. It is important to keep in mind that the impacts
in this study are assessed with the assumption (baseline scenario) that no Doha-agreement will be
concluded in the WTO. Lastly, NTMs are modelled using Ad Valorem Equivalents (AVEs) of border
protection across the world. Modelling of the specific effects of individual NTMs has not been
conducted in this study. Hence, the extent to which NTMs are taken into account in this study can
be considered limited and generic (same level of reduction across all sectors).
Based on GTAP 7, the sector specification was obtained from the original 57 GTAP sectors and
aggregated into 33 economic sectors. Since the original study also studied the effects of a potential
FTA between the EU and Japan and EU-Australia/New Zealand, the country specification includes
The Netherlands, EU26, the US, Japan, Australia/New Zealand, China/Brazil/Russia/India and the
Rest of the World.
The study has modelled an ambitious level of liberalisations in the areas of tariffs, barriers to
services trade and NTMs. Specifically, trade in goods is liberalised completely (100 percent),
barriers in services trade are reduced by 75 percent and NTBs are reduced by 2.5 percent
compared to the baseline scenario.
3.1.2 Macro-economic effects
The long run macro-economic effects for the Netherlands, the US, and the EU26 are presented in
Table 3.1 and analysed in terms of national income, relative changes in value of exports and
imports and relative changes in real wages for skilled and unskilled workers. The long run effects
take into account that capital is mobile, flows into sectors with comparative advantages and thus
brings about distributional changes between economic sectors.

32
Study on "EU-US High Level Working Group"
Table 3.1 Macroeconomic changes according to Ecorys (2009) EU – US FTA study
NL EU26 US JAP AUS/NZ BRIC ROW
Short run, changes
National income, million € 245.5 15,260.6 17,959.1 -929.9 -84.3 -1,307.0 -3,426.9
Value of exports, % 1.1 1.4 5.6 -0.4 -0.1 -0.3 -0.2
Value of imports, % 1.1 1.4 3.6 -0.4 -0.1 -0.3 -0.2
Real wages, %, unskilled
workers 0.2 0.3 0.2 -0.0 0.0 -0.0 -0.0
Real wages, %, skilled
workers 0.2 0.3 0.2 -0.0 0.0 -0.0 -0.0
Long run, changes
National income, million € 1,375.2 34,927.4 24,061.7 -1,889.0 -115.9 -4,402.6 -8,806.5
Value of exports, % 1.3 1.6 5.7 -0.4 -0.1 -0.3 -0.2
Value of imports, % 1.4 1.6 3.7 -0.4 -0.1 -0.3 -0.3
Real wages, %, unskilled
workers 0.5 0.5 0.3 -0.1 -0.0 -0.1 -0.1
Real wages, %, skilled
workers 0.5 0.5 0.3 -0.1 0.0 -0.1 -0.1
The results show that a potential EU-US FTA – modelled as specified above – would yield positive
results in terms of welfare in all three country-blocs (EU, US and NL). The yearly change in national
income in the Netherlands is estimated to be €1.38 billion, compared to almost €35 billion for the
rest of the EU and €24 billion for the US in the long run.
As a result of the modelled FTA, both import and export in value terms of the EU, US and
Netherlands will increase. Relatively, US exporters and importers are expected to experience the
biggest impact, with value of exports and imports increasing by 5.7 and 3.7 percent, respectively, in
the long run. For the US, the value of exports is expected to grow relatively more than the value of
imports; for the Netherlands this pattern of change is similar. The increased trade flows between
the EU and US will have a slight trade diversion effect with respect to the rest of the world,
manifested by small decreases of all indicators for Japan and the BRICs.
As a result of the increased economic activity due to higher trade flows, wage effects are also
expected to be positive for all three, with similar (small) percentage increases. Dutch, EU and US
wage effects are slightly positive both for unskilled and for skilled workers.
When decomposing the national income effects into the various components modelled, it becomes
clear that 60 percent of total estimated trade liberalisation gains for the Netherlands stem from the
reductions of NTMs modelled. For the EU26 and US these percentages are 50 and 52 percent,
respectively. This implies that NTM reduction is relatively more important for the Netherlands than
for the EU as a whole, where tariff reductions have relatively more impact.
3.1.3 Sector specific effects
The study further disaggregates the effects of an EU-US FTA for the 33 sectors specified in the
model in terms of changes in output, exports, producer prices and employment. Table 3.2 lists the
effects in terms of output and exports, which gives a representative overview of which sectors gain
and which sectors lose. Since the figures represent long run changes, thus taking into account the
shift of resources across sectors, production factors will shift to sectors with comparative

33
Study on "EU-US High Level Working Group"
advantages and move out of less competitive sectors, which in turn results in differences between
sectors.
Table 3.2 Sector-specific effects, Long run, percentage changes
Sector
Output, % change Exports, % change
NL EU26 US NL EU26 US
Chemicals, rubber, and plastics 0.2 0.2 0.1 1.6 1.5 7.6
Other machinery and equipment 0.1 0.7 -1.1 1.7 2.4 4.6
Petro-chemicals 1.7 0.5 -0.2 3.1 2.7 3.1
Electrical machinery and equipment -0.1 -1.3 6.3 -0.1 -0.8 11.1
Processed foods, n.e.c. -0.1 0.2 0.2 1.2 1.4 9.4
Iron and steel 5.6 0.2 -0.8 6.1 0.5 -0.2
Motor vehicles -2.9 1.2 1.2 -3.3 2.5 8.6
Crops, n.e.c. (except grains) -1.3 -1.5 3.4 2.6 7.3 53.9
Vegetables and fruits 1.1 -0.1 -0.3 0.9 -0.1 0.5
Fabricated metals 0.7 0.4 -0.2 1.9 2.1 5.7
Beverages and tobacco 2.1 0.2 0.0 2.7 1.0 7.0
Non-ferrous metals 0.2 -0.1 0.6 0.3 0.9 7.5
Vegetables oils 0.7 0.3 -0.6 0.9 1.6 2.2
Paper, pulp, and publishing 0.4 0.2 -0.1 0.9 0.5 1.0
Textiles 1.1 1.1 0.1 3.1 3.0 6.2
Dairy products 2.5 1.6 -3.6 6.5 11.5 45.3
Manufactures, n.e.c. -0.6 0.6 0.1 0.2 4.5 9.3
Meats, except beef -2.4 -3.8 4.0 -2.5 -2.8 35.5
Other transport equipment -3.6 -3.1 3.3 -2.7 -1.3 12.5
Clothing 0.2 0.1 16.7 0.9 1.3 31.4
Oil, gas, and coal 0.0 0.0 0.0 -0.2 3.7 5.3
Wood products 0.4 0.4 -0.3 1.1 1.2 2.4
Other goods 0.3 0.2 -0.6 0.9 1.3 1.3
Utilities 0.4 0.2 0.2 0.6 -0.1 -0.8
Construction 0.5 0.4 0.3 0.4 0.0 1.0
Retail and wholesale trade and warehousing 0.2 0.3 0.2 0.3 0.1 1.5
Transport services 0.7 0.3 0.1 0.9 0.7 1.3
Communications 0.3 0.1 0.2 0.6 0.4 7.3
Other financial services 0.4 0.5 -0.1 2.5 5.9 10.1
Insurance 0.3 1.7 -1.4 1.7 7.6 2.7
Other business services 0.4 0.1 0.2 0.9 0.7 7.4
Recreational and consumer services 0.4 0.1 0.2 0.6 0.1 1.7
Other services (public health, education, residential) 0.1 0.1 0.1 0.2 -0.4 -0.9
For the Netherlands, the largest positive output effects (in percentage changes) of the FTA are
found in the iron and steel (+5.6 percent), dairy products (+2.5 percent) and beverages and tobacco
(+2.1 percent) sectors, whereas the most negatively affected sectors are the other transport
equipment (-3.6 percent), motor vehicles (-2.9 percent) and meats (-2.4 percent) sectors. When
interpreting the percentage changes against the initial importance of each sector in the Dutch
economy (baseline value), the study finds that other business services (+0.4 percent) and the
construction sector (+0.5 percent) are expected to show the largest absolute changes. In terms of
exports, the iron and steel and dairy products are also the strongest growers in percentage terms,
together with petro-chemicals (+3.1 percent) and textiles (+3.1 percent).

34
Study on "EU-US High Level Working Group"
In the EU26 the most significant output changes accrue to the insurance (1.7 percent) and the dairy
products (+1.6 percent) sectors, whereas the meats (-3.9 percent) and other transport equipment (-
3.5 percent) sectors will see production factors move away and output decline most strongly.
The profound relative changes in trade flows on the macro-economic level in the US are also
reflected at a sectoral level in terms of export values. Sectors that stand to gain strongly from an
FTA in terms of export growth are mostly the primary sectors crops (+53.9 percent), dairy products
(+45.3) and meats (+35.5 percent). In terms of output, the dairy products sector is actually the worst
affected at least in percentage terms (-3.6 percent), whereas meats and crops are amongst the
sectors with the highest positive changes in output. The largest output expansion due to the FTA is
seen in the clothing (+16.7 percent) sector and the electrical machinery and equipment (6.3
percent) sector.
3.2 Effects of reducing Non Tariff Measures between the EU and the US
3.2.1 Specification of the study
Non-Tariff Measures (NTMs) are identified as the largest source of potential trade liberalisation
gains by several studies, including in the EU-US FTA study discussed in the previous section23.
The Ecorys NTM study, conducted for DG Trade, goes beyond the previous study by specifically
looking into the effects that NTM liberalisations between the EU and US can have on trade and
investment flows. Provided that DG Trade will use the outcomes of this NTM study in the
negotiation processes and in the High Level Working Group, the exact specifications of this NTM
study are used in specifying further the impacts for the Netherlands and the EU26.
The study bases its estimates of the NTMs and regulatory divergences on several sources of
information, of which a large business survey (5,500 responses) constitutes an important part.
Responses in the survey are given in the form of a bilateral (both from the EU to the US and vice
versa) NTM index: with 0 representing no existing barriers in the sector and 100 representing the
presence of totally prohibitive barriers. Gravity analyses, sector expert views and literature
complete the information basis for the final estimation of the NTMs in a sector. This information is
then used as one of the factors to explain trade at sector level. For example, in pharmaceuticals,
NTMs constitute a 15.3 percent Trade Cost Equivalent (TCE) trade barrier from the US to the EU.
Alignment of NTMs then implies that these trade cost equivalents are reduced. The CGE model, in
turn, links these trade liberalisation effects between all sectors in an economy and calculates the
effects on several indicators such as welfare, trade and wages.
The study does not model tariff reductions or service barrier reductions (whereas the previous study
did), but does model an ambitious level of NTM reductions only. The scenarios that are used in the
model are thus considered to be less ambitious overall, but more realistic provided the strong
emphasis on NTM reductions at a sector-specific level.
It is assumed that half of the total present NTMs in a sector are actionable, i.e. could be reduced.
Of this 50 percent that is actionable, reductions are defined in an ambitious and a limited scenario:
1. Ambitious scenario. All actionable NTMs are aligned (= 50 percent of total NTMs) – modelled
both for the short run and the long run;
2. Limited scenario. 50 percent of actionable NTMs are aligned (= 25 percent of total NTMs) –
again both short run and long run effects are modelled.
23 60% of total trade liberalization gains (in terms of national income) for the Netherlands, 50% for the EU26 and 52% for the
US.

35
Study on "EU-US High Level Working Group"
Further specifications have been provided in 1.2.1. The results of specifying results for the
Netherlands are presented below.
3.2.2 Macro-economic effects
The results at the macroeconomic level for the Netherlands, the EU26 and the United States are
presented in Table 3.3. The table presents the long run (when capital is allowed to move across
countries and sectors) and short run (when capital is fixed) changes in the case of full reduction of
actionable NTMs (50 percent of total NTMs can be reduced) and partial reduction of actionable
NTMs (25 percent).
The results show both significant short run and long run changes in national income for both the
transatlantic country blocs, as well as the Netherlands. In the long run, the additional gains over the
baseline scenario constitute some €4 billion for the Netherlands, €117 billion for the EU26 and €41
billion for the United States. In relative terms, this implies that the gains for the EU26 and for the
Netherlands are slightly higher (+0.73 and +0.72 percent) than for the US (+0.28 percent).
The terms of trade for the Netherlands and for the EU26 will slightly improve, in contrast to those for
the US. It is however not possible to identify whether this decrease for the US is attributable to a
decrease in the price of exports and/or increase in price of imports. Both the Netherlands and the
EU26 will see an increase in their total trade flows. The EU26 will see its exports and imports
increase with approximately the same percentage, whereas for the Netherlands the percentage
change in value of imports will be slightly higher than the percentage change in exports.

36
Study on "EU-US High Level Working Group"
Table 3.3 Macroeconomic effects according to Ecorys (2010) NTMs study and NL split-out
Actionable set of NTMs reduced Macroeconomic
effects
Full liberalisation of
actionable NTMs, SR
Full liberalisation of
actionable NTMs, LR
Partial liberalisation of
actionable NTMs, SR
Partial liberalisation of
actionable NTMs, LR
Real income change, million €
United States 18,992 40,781 7,817 18,343
Netherlands 1,411 4,076 610 1,811
EU26 44,437 117,413 18,738 51,744
Real income change, %
United States 0.13 0.28 0.05 0.13
Netherlands 0.25 0.72 0.11 0.32
EU26 0.25 0.73 0.16 0.32
Terms of trade, % change
United States -0.15 -0.23 -0.06 -0.10
Netherlands 0.12 0.07 0.05 0.03
EU26 0.11 0.07 0.05 0.03
Change in value added, %
Netherlands -0.02 0.41 -0.01 0.18
EU26 -0.02 0.42 -0.01 0.19
Change in value of exports, %
Netherlands 1.41 1.69 0.63 0.76
EU26 1.64 2.03 0.72 0.88
Change in value of imports, %
Netherlands 1.45 1.83 0.64 0.80
EU26 1.64 2.01 0.72 0.88

37
Study on "EU-US High Level Working Group"
3.2.3 Sector specific effects
This section presents an interpretation of the most significant impacts at sector level (top-5 sectors
most positive and most negative impacts) for the indicators output, value of exports and value of
imports. The text reports long run changes for the full liberalisation scenario. The full results at
sector-level are presented in Annex A. These tables present all sectoral changes in output, exports
and imports and are an addition to the original Ecorys NTM study (2010).
Output
Table 3.4 shows the sectors that are expected to gain and lose most significantly in terms of
relative changes in output in the Netherlands. After a full liberalisation of all actionable NTMs in all
sectors, the motor vehicles sector (+5.7 percent), together with the chemicals sector (+2.2 percent)
is expected to experience the largest increase in production output in the long term. In the
Netherlands, the chemicals sector has a 2.2 percent share in total value added and the motor
vehicles sector a 0.5 percent share. Hence, the increases in output accrue to relatively small
sectors in the economy. The 0.8 percent increase in output in the construction sector (constituting
10.2 percent of the Dutch economy) in that sense gives rise to larger absolute gains, attracting
capital and labour from less competitive sectors of the economy. The Dutch electrical machinery
sector is expected to lose most in relative terms from trade barrier alignment between the EU and
US (-5.5 percent). This finding is in line with the Ecorys NTM study (2010), which finds that the
electrical machinery sector gains the most in the US in terms of output and loses the most in the
EU. This shows that in the long term, comparative advantages will be properly exploited. For the
Netherlands, this sector has a relatively small share in the Dutch economy (0.4 percent), hence the
absolute losses will be relatively small.
Table 3.4 Percentage change in output, the Netherlands
Top-5 (positive) Full liberalisation,
LR
Top-5 (negative) Full liberalisation,
LR NL NL
Motor vehicles 5.7% Electrical machinery -5.5%
Chemicals 2.2% Other machinery -1.9%
Insurance 1.2% Other transport equipment -0.9%
Processed foods 0.9% Metals and metal products -0.5%
Construction 0.8% Personal services -0.1%
Exports and imports
Table 3.5 presents the relative changes (in percentages) in the value of exports for the
Netherlands. For most of the sectors, we observe a strong link between growth (or decline) in
output and growth (or decline) in exports. Only other transport equipment (+4.2 percent) was not in
the top-5 of output changes. Together with the rise in output (+0.9 percent), the processed foods
sector (+5.4 percent) will have an important impact on the Dutch economy due to its important initial
share in total exports (12.2 percent). Also the chemicals sector will be increasingly competitive
(+6.2 percent) and has an important impact on the international trading position of the Netherlands
since it is the largest export sector (16.3 percent). The strong growth of the motor vehicles sector
can be seen as a strong increase in intra-industry trade as the Netherlands does not have a very
developed automotive industry (anymore). Thus, the increases in output and exports should relate
to an increase in production and trade of intermediate parts that are used abroad for assembling
cars. Electrical machinery again loses export share (-4.6 percent) and also other machinery (-2.6
percent) will be negatively affected. The loss in exports of the other machinery sector and the
agriculture, forestry and fisheries (-0.9 percent) sectors will have the largest absolute impacts due
to their relative importance in Dutch international trade (7.3 percent and 10.1 percent respectively).

38
Study on "EU-US High Level Working Group"
Table 3.5 Percentage change in value of exports, the Netherlands
Top-5 (positive) Full liberalisation,
LR
Top-5 (negative) Full liberalisation,
LR NL NL
Motor vehicles 10.7% Electrical machinery -4.6%
Chemicals 6.2% Other machinery -2.6%
Insurance 5.9% Agr, forestry, fisheries -0.9%
Processed foods 5.4% Personal services -0.8%
Other transport equipment 4.2% Other manufactures -0.4%
Table 3.6 and Table 3.7 exhibit absolute changes in the value of exports and the value of imports,
respectively, for both the Netherlands and the EU26. The export values correspond to the export
changes in percentage terms reported for the Netherlands above, but give an additional sense of
magnitude of effects.
In terms of export value, it is clear that chemicals and processed foods are sectors that are
expected to become stronger both in the Netherlands and in the rest of the EU. The motor vehicles
sector will gain most significantly in the EU26 (+ €70 billion) and the Netherlands is likely to gain
proportionally from intra industry trade. The Dutch chemicals sector (+ €3.8 billion) is likely to gain
relatively more from a reduction in trade barriers due to the larger share that the chemicals sector
constitutes in the Dutch economy. The other machinery sector will see investments disappear in the
long run all over the EU26 and experience a decline in exports of approximately €21bilion.
Table 3.6 Change in value of exports, million €, the Netherlands and EU26
Top-5 (positive) Full liberalisation, LR Top-5 (negative) Full liberalisation,
LR NL NL
Chemicals 3,855 Other machinery -697
Processed foods 2,755 Agr, forestry, fisheries -524
Motor vehicles 1,243 Electrical machinery -268
Metals and metal products 382 Other manufactures -267
Business services 243 Personal services -30
Top-5 (positive) Full liberalisation, LR Top-5 (negative) Full liberalisation,
LR EU26 EU26
Motor vehicles 69,898 Other machinery -20,560
Chemicals 51,583 Electrical machinery -7,072
Processed foods 18,961 Other manufactures -3,152
Other transport equipment 7,098 Agr, forestry, fisheries -2,654
Metals and metal products 6,459 Personal services -875

39
Study on "EU-US High Level Working Group"
Table 3.7 Change in value of total imports, million €, the Netherlands and EU26
Top-5 (positive) Full liberalisation, LR Top-5 (negative) Full liberalisation,
LR NL NL
Chemicals 762 Water transport 19
Metals and metal products 754 Air transport 38
Business services 606 Insurance 39
Other machinery 548 Construction 45
Other services 529 Finance 62
Top-5 (positive) Full liberalisation, LR Top-5 (negative) Full liberalisation,
LR EU26 EU26
Other machinery 19,817 Water transport 531
Chemicals 17,828 Construction 913
Metals and metal products 15,535 Insurance 977
Electrical machinery 12,272 Air transport 1,188
Motor vehicles 10,056 Communications 1,493
With respect to the changes in the value of imports for the EU26 and the Netherlands from the
world, it is remarkable that there is not a single sector that will see total imports falling as a result of
the EU-US FTA. The right column of the table should therefore be interpreted as the sectors with
the smallest absolute increases in imports.
Compared to the baseline scenario, a full liberalisation of actionable NTMs in all sectors will lead to
a strong increase in total imports in the chemicals (+ €0.8 billion), metals (+ €0.8 billion) and
business services (+ €0.6 billion) sectors in the Netherlands. The other machinery (+ €0.5 billion)
sector results show that economic activity will move away from the EU (both the Netherlands and
the EU26) since exports decline and imports increase strongly (in EU26 other machinery is the
strongest growing import sector with + €20 billion), implying that the US has a relative comparative
advantage there. The combined result that the chemicals sector starts both importing and exporting
more in the EU26 and the Netherlands could be a sign that NTMs currently constitute a significant
barrier to trade and removing them would increase bilateral trade flows significantly. A similar
intuition can be applied to the motor vehicles (+ €10 billion in the EU26) sector, which is likely to
see intra industry trade in motor vehicles parts increase strongly.
3.3 Summarising overview of macro-economic results from both studies
For comparison, the macro-economic results from both the NTM study (including the additional
specification for the Netherlands presented above) and the EU-US FTA study are reported
alongside in Table 3.8.
The results show that an ambitious alignment of NTMs yields more gains for all countries in the
long run than an ambitious modelling of tariff and service level reductions For example, national
income for the Netherlands is expected to increase by €4.1 billion due to an ambitious alignment of
NTMs, versus €1.4 billion due to the generic FTA including tariff reductions. The value of exports
and imports will increase in all cases both for the Netherlands and for the EU. Both the NTM study
and the EU-US FTA study indicate that the US will increase its value of exports relatively more than
its value of imports.

40
Study on "EU-US High Level Working Group"
Table 3.8 Comparison of macroeconomic effects of the two different simulations24.
Comparison of outcomes EU-US NTM study (DG Trade),
including new results
EU-US FTA study
(EZ)
Ambitious, LR Limited, LR Long run
Rea
l
inco
me,
bn
Eu
ro European Union - 26 117.4 51.7 34.9
The Netherlands 4.1 1.8 1.4
United States 40.8 18.3 24.1
Rea
l
inco
me,
%
chan
ge
European Union - 26 0.73 0.32
The Netherlands 0.72 0.32
United States 0.28 0.13
Rea
l wag
es,
% c
ha
ng
e
(un
ski
lled
)
European Union - 26 0.5
The Netherlands 0.5
United States 0.35 0.16 0.3
Rea
l wag
es,
% c
ha
ng
e
(ski
lled
wo
rker
s) European Union - 26 0.5
The Netherlands 0.5
United States 0.38 0.17 0.3
Val
ue
of
exp
ort
s, %
chan
ge
European Union - 26 2.03 0.88 1.6
The Netherlands 1.69 0.76 1.3
United States 6.06 2.68 5.7
Val
ue
of
imp
ort
s, %
chan
ge
European Union - 26 2.01 0.88 1.6
The Netherlands 1.83 0.8 1.4
United States 3.93 1.74 3.7
Ter
ms
of
trad
e, %
chan
ge
European Union - 26 0.07 0.03 -0.2
The Netherlands 0.07 0.03 0.0
United States -0.23 -0.10 0.1
Whereas the impacts of the two simulations (a generic FTA versus ambitious NTM reduction) are
similar at macro-economic level, this is not always the case at sector level. It might be that for
certain sectors, tariff reductions might lead to decreases in output and export, whereas NTM
reductions lead to increases and vice-versa. Such effects are explored for the selected top sectors
in chapters 5, 6 and 7.
24 Empty cells indicate that a result is not available for that indicator since it has not been modelled in the respective study.

41
Study on "EU-US High Level Working Group"
4 Selection of three “top sectors” in the Netherlands
In order to focus the results and recommendations of this study, three out of the nine Dutch top
sectors are selected for further analysis. For these three sectors the potential expected effects of an
FTA between the EU and US are further analysed and elaborated in the following chapters.
4.1 Dutch policy on businesses and the top sector policy
In the coalition agreement of the recently resigned Cabinet-Rutte, the coalition partners have
announced a new policy on the support of Dutch enterprises, which has gradually been applied
throughout 2011. A key element in this new policy is the sectoral approach to the policy for the
support of Dutch enterprises. An important reason for the sectoral focus is that both opportunities
and barriers for growth of Dutch businesses are often sector specific and that both opportunities
and barriers often touch upon several elements of government policies. The focus on sectors hence
enables a more integrated approach to private sector development.
Within this policy focused on sectors, the Dutch government has identified several so-called ‘top
sectors’, which are internationally competitive and have been selected on the basis of four criteria:
1. The sectors are knowledge-intensive and are characterised by a strong cooperation between
entrepreneurs and knowledge institutes;
2. The sectors are export oriented and have a strong (world) market position;
3. The sectors are strongly regulated and have many specific laws;
4. The sectors have the potential to contribute to solving nationwide societal issues.
Based on these four criteria, Dutch policy is centred on the following nine top sectors:
Agro-food;
Horticulture and plant propogation
materials;
High-tech systems and materials;
Logistics;
Creative industry;
Water;
Life sciences and health;
Chemicals;
Energy.
Across sectors, the Netherlands as a location for international headquarters has also been
recognised as an important cross cutting topic, due to the fact that headquarters can deliver a
positive contribution to skill intensive employment and the economic image of the Netherlands.
In the past years, the nine top sectors (+ headquarters) have been thoroughly investigated by ‘top
teams’, consisting of representatives from businesses, knowledge institutes and the government.
These top teams have advised the government on how to proceed with the nine top sectors in the
coming years. The scope of the policy and strategies are primarily focussed on increasing the
knowledge intensity in the sectors. Furthermore, every top sector has specifically looked into
measures or initiatives to improve the economic efficiency and effectiveness of the respective top
sector. For example, certain sectors (creative industry, high-tech systems and materials, agro-food,
horticulture and base materials and water) have made concrete plans for improving their
competitive position on the world market.

42
Study on "EU-US High Level Working Group"
The overall policy of the government for Dutch businesses will be improved further, using the plans
in every top sector as a guidance. Collaboration between Dutch businesses, knowledge institutes
and the government (the so-called Golden Triangle) will constitute a very important element in the
formation of new policies.
4.2 Selection criteria
The following selection criteria are applied to select the three top sectors for further focus:
1. The share of the top sector in total exports of the Netherlands. This criterion serves to select
sectors that are important export sectors for the Netherlands, and assumingly equally important
in bilateral trade between the Netherlands and US (due to lack of matching data, total exports of
the Netherlands have been used rather than Dutch exports to the US only);
2. The share of the top sector value added in Dutch total GDP. This criterion serves to select
sectors that are important for the Dutch economy;
3. The existence of trade barriers in a top sector. This criterion assesses the current levels of
restrictiveness in a top sector;
4. The estimated benefits from aligning EU-US NTMs in a top sector. This criterion serves to select
sectors that will potentially gain significantly from removing barriers.
As mentioned in section 1.2, severe data limitations exist especially due to lack of statistical
classification of the top sectors. Therefore, a “matching” exercise has been performed for the
purposes of this study based on most recent information available and to the best of our knowledge
at present. In order to ensure traceability of the outcomes in the face of the limitations, data sources
and classifications used are clearly specified. Annex B provides an overviews of data sources and
classifications used.
4.3 Criterion 1: Share of top sector exports in total NL exports
Due to the indicated data limitation especially regarding statistically matching existing sector
classifications to the top sectors, data on exports of the top sectors to the world – rather than to the
US specifically – are used under this criterion.
Dutch export shares to the world (%) based on GTAP classification have been used. The 20 GTAP
sectors for which this data is available have been matched to the top sectors by Ecorys, based
partly on Dialogic (2011) and CBS (preliminary, 2012). See Annex B for details.
The resulting numbers are presented in Table 4.1. Based on these proxies, the top sectors are
ranked (relative score) for the purposes of selection.
Table 4.1 Export share of top sectors in total Dutch exports
Top sector GTAP-20 % of GTAP
sector
relevant for
top sector
NLD export
share, %
Adjusted
total export
share top
sector, %
Relative
score
Agro-Food
Agr, forestry, fisheries 60% 10.1%
10.2% + Processed foods 30% 12.2%
Other services 10% 5.0%
Horticulture Agr, forestry, fisheries 20% 10.1%
4.4% +/- Processed foods 20% 12.2%

43
Study on "EU-US High Level Working Group"
Top sector GTAP-20 % of GTAP
sector
relevant for
top sector
NLD export
share, %
Adjusted
total export
share top
sector, %
Relative
score
High tech
systems &
materials
Metals and metal products 60% 5.4%
10.9% +
Electrical machinery 60% 1.3%
Motor vehicles 60% 2.9%
Other machinery 60% 7.3%
Other transport equipment 60% 1.2%
Energy Other primary sectors 90% 3.9%
4.5% +/- Other services 20% 5.0%
Logistics &
transport
Air transport 100% 2.2%
6.1% +/- Water transport 100% 0.9%
Other business services 20% 10.1%
Other services 20% 5.0%
Creative
industries
Communications 50% 1.2%
1.3% - Personal services 25% 0.8%
Other services 10% 5.0%
Life sciences&
health
Chemicals 10% 16.3%
2.6% - Other manufactures 5% 15.3%
Other services 5% 5.0%
Chemicals Chemicals 60% 16.3%
10.0% + Other services 5% 5.0%
Water
Construction 50% 0.9%
1.2% - Other transport equipment 20% 1.2%
Other services 10% 5.0% Source: Ecorys own elaborations based on GTAP 8.0 data.
4.4 Criterion 2: Share of top sector value added total NL GDP
For criterion 2, the figures on the share of each top sector in total Dutch GDP are taken directly
from Dialogic (2011). The resulting relative score and ranking are presented in Table 4.2.
Table 4.2 Contribution of top sectors in total Dutch GDP
Top sector % of NL GDP Relative score
Agro-Food 4.4 +
Horticulture 1.4 -
High tech systems & materials 6.7 +
Energy 3.4 +/-
Logistics & transport 3.4 +/-
Creative industries 1.6 -
Life sciences& health 3.7 +
Chemicals 2.2 -
Water 0.4 - Source: Dialogic (2011), Nederlandse clusters in kaart gebracht; Landbouw Economisch Instituut, Het Nederlandse
Agrocomplex.

44
Study on "EU-US High Level Working Group"
4.5 Criterion 3: The existence of trade barriers in a sector
For this criterion, the sectoral levels of restrictiveness estimated in the EU-US NTM study are used.
Restrictiveness levels are expressed in trade cost equivalents (TCEs, %) – they indicate the
estimated percentage cost increases to trade and investments across the Atlantic (in this case for
trade flows from the EU to the US) stemming from regulatory divergence and NTMs.
The 23 GTAP sectors from the EU-US study have again been matched to the top sectors through
weighted averages by Ecorys – see Annex B.
Table 4.3 Restrictiveness levels due to NTMs from EU to US
Top sector GTAP-20 GTAP-23 (NTM) Restrictive-
ness level
NTMs
(TCE)
% of
GTAP-20
sector
relevant
for top
sector
Restrictive-
ness level
NTMs top
sector
(TCE)
Relative
score
Agro-Food
Agr, forestry,
fisheries
- - 60%
73.3% + Processed foods Food &
Beverages 73.3% 30%
Other services - - 10%
Horticulture
Agr, forestry,
fisheries
- - 20%
73.3%
(together
with agro-
food) Processed foods Food &
Beverages 73.3% 20%
High tech
systems &
materials
Metals and
metal products
Metals 17.0% 60%
16,8% +
Electrical
machinery
Electronics 6.5% 60%
Motor vehicles Automotives 26.8% 60%
Other machinery Machinery 60%
Other transport
equipment
Machinery 60%
Energy
Other primary
sectors
- 90%
?
Other services - 20%
Logistics &
transport
Air transport Transport (air) 2.0% 100%
5.0% +/-
Water transport Transport
(water) 8.0% 100%
Other business
services
Other business
services - 20%
Other services - 20%
Creative
industries
Communications Communications 1.7% 50%
2.2% -
Personal
services
Personal,
cultural &
recreational
services
2.5% 25%
Other services Other business
services 3.9% 10%

45
Study on "EU-US High Level Working Group"
Top sector GTAP-20 GTAP-23 (NTM) Restrictive-
ness level
NTMs
(TCE)
% of
GTAP-20
sector
relevant
for top
sector
Restrictive-
ness level
NTMs top
sector
(TCE)
Relative
score
Life
sciences&
health
Chemicals Pharmaceuticals 9.5% 10%
9.5% +/- Other
manufactures
- - 5%
Other services - 5%
Chemicals Chemicals Chemicals 21.0% 60%
21.0% + Other services - - 5%
Water
Construction Construction 2.5% 50%
2.5% - Other transport
equipment
Machinery - 20%
Other services - - 10% Source: Ecorys own elaborations based on GTAP 8.0 data and Ecorys (2010) NTM study.
4.6 Criterion 4: The potential benefits from aligning EU-US NTMs in a sector
Criterion 4 scores the top sectors based on the potential benefits from aligning NTMs, as estimated
by the EU-US NTM study. The expected change in export values at sector level are taken as a
basis for this. The GTAP classification is again matched through weighted averages to the nine top
sectors. The results are presented in Table 4.4.
Table 4.4 Change in export value due to EU-US NTM alignment
Top sector GTAP-sector % of GTAP-
sector
relevant for
top sector
Change in
value of
exports, NL,
€m
Weighed
total
change in
export
value top
sector, €m
Relative
score
Agro-Food
Agr, forestry,
fisheries 60% -523,7
512,3 + Processed foods 30% 2755,4
Other services 10% -1,1
Horticulture
Agr, forestry,
fisheries 20% -523,7
446,3 +/-
Processed foods 20% 2755,4
High tech systems &
materials
Metals and metal
products 60% 381,7
532,5 +
Electrical
machinery 60% -268,1
Motor vehicles 60% 1243,2
Other machinery 60% -697,3
Other transport
equipment 60% 228,0
Energy Other primary
sectors 90% -16,5 -15,0 -

46
Study on "EU-US High Level Working Group"
Top sector GTAP-sector % of GTAP-
sector
relevant for
top sector
Change in
value of
exports, NL,
€m
Weighed
total
change in
export
value top
sector, €m
Relative
score
Other services 20% -1,1
Logistics & transport
Air transport 100% 50,8
129,5 +/-
Water transport 100% 30,2
Other business
services 20% 243,3
Other services 20% -1,1
Creative industries
Communications 50% 11,6
-1,7 - Personal services 25% -29,7
Other services 10% -1,1
Life sciences& health
Chemicals 10% 3855,5
372,2 +/- Other
manufactures 5% -266,6
Other services 5% -1,1
Chemicals Chemicals 60% 3855,5
2313,2 + Other services 5% -1,1
Water
Construction 50% 4,9
48,0 - Other transport
equipment 20% 228,0
Other services 10% -1,1 Source: Ecorys own elaborations and Ecorys (2010) NTM study.
4.7 Final top sector selection
The resulting rankings of the nine top sectors on each of the four criteria assessed above have
been summarised in Table 4.5.
Table 4.5 Summary table of selection criteria
Sector Cr 1 Exports Cr 2
GDP
Cr 3
Restrictiveness
Cr 4
CGE
Total
Agro-Food + + + + +
Horticulture +/- - (together with
agro-food)+/- +/-
High tech systems &
materials + + + + +
Energy +/- +/- ? - -
Logistics & transport +/- +/- +/- +/- +/-
Creative industries - - - - -
Life-sciences & health - + +/- +/- +/-
Chemicals + +/- + + +
Water - - - - -

47
Study on "EU-US High Level Working Group"
Based on these rankings and in close consultation with the Ministry of EA&I, the following top
sectors have been selected for further analysis:
1. Agro-food / Horticulture (combined);
2. High-tech systems & materials;
3. Chemicals.
The remainder of this study focuses on these top sectors.


49
Study on "EU-US High Level Working Group"
5 Identification and prioritisation of trade barriers in the Agro-food & Horticulture sector
5.1 About the sector
5.1.1 Introduction
The agro-food (AF) and horticulture top sectors are two separate top sectors, but for this study they
are combined (AF&H sector) as there are clear linkages between them and they partly face the
same challenges when entering the US market.
The AF&H sector is qualified by Dialogic (2011)25 as including:
1. Agriculture (including flowers) and fishery;
2. Processing industry (food, beverages and tobacco);
3. Activities related to (1) (production of fertilisers & chemicals, auctions);
4. Activities related to (2) (machinery and trade negotiation).
Both top sector teams share a focus for the future on durability, health, international market
leadership and higher added value. Because of their similarities close collaboration exists
throughout the chain of production. This has also resulted in a joint approach to contribute to the
issue of food security.26 At the same time, it is important to stress the variety of products and
services covered by both top sectors: ranging from new plant varieties to live animals, from cut
flowers to processed food, as well as the associated wholesale and retail trade. Obviously the
different types of products each face their own challenges in international trade and investment.
According to the AF top sector team, this sector is exporting a little over €49 billion, accounting for
7.5% of worldwide AF exports, second only to the United States.27 Horticulture is also a large
exporting sector, the Netherlands being the third exporter in the world, after Spain and the United
States.28
5.1.2 Trade and Investment relations between the Netherlands and the US in the sector
As shown in the previous chapter (table 4.1), the AF&H sector accounts for a significant share of
total Dutch exports (over 14 percent). Various AF&H products are among the top Dutch export
products to the US, notably beer, but also products like vegetable seeds and flower bulbs. The US
is also an important supplier of AF&H products to the Netherlands, e.g.in tobacco, soya beans and
almonds (See Annex C for an overview)29. Despite these trade relations, the interviews revealed
that in relative terms, the US is generally not considered a key export market, accounting for less
than two percent of total exports of most subsectors (e.g. the dairy sector, fruits & vegetables
sector, cut flowers). Only the flower bulbs and plants association Anthos refers to a larger share of
exports to the US, although this relative share is becoming less with the increasing importance of
emerging countries in South-East Asia.
25 Dialogic (2011) “Nederlandse clusters in kaart gebracht”. 26 Topsector team Agro&food (2012), “Internationaliseringsinitiatief topsector Agro&food”. 27 Topsector team Agro&food (2012), “Internationaliseringsinitiatief topsector Agro&food”. 28 Topsector team Horticulture (2011) “Bron voor groene eonomie”. 29 The information on trade in this chapter is based on Comtrade data, which only cover trade in goods, not services. Annex
C only presents the data at HS2 level.

50
Study on "EU-US High Level Working Group"
With respect to investment relations, the US has approximately €20.5 billion (FDI stocks) invested
in the Dutch Agro-food/Horticulture sector based on 2011 data from De Nederlandse Bank30,
whereas the Netherlands has a little over €3 billion (FDI stocks) invested in the American Agro-
food/Horticulture sector.
5.2 Identification of trade barriers
We identified the relevant barriers for the sector on the basis of the following sources: 1) the market
access database (MADB) of the EU; 2) the Ecorys EU-US NTM study; 3) other literature31; and 4)
interviews with stakeholders in the sector. All relevant information of the first two sources is
included in Annex D.
5.2.1 Tariff barriers
Overall tariffs between the EU and US are generally low. Tariffs in the sector are often specific (e.g.
related to specific quantity, not only % (ad valorem) duties). Wen looking at the tariff, we therefore
look at the Ad Valorem Equivalents (AVE).32 The weighted average tariff33 for the AF&H sector
amounts to 2.1 percent (1.8 percent for Agro-food and 3.4 percent for horticulture products).
Nevertheless, the sector still has the highest tariffs for some specific products. This is reflected in
the two tables below. Table 5.1 indicates the products that pay the highest tariffs in absolute terms,
whereas table 5.2 shows the products with the highest AVEs.
Table 5.1 AF&H: Top 10 absolute tariffs paid per productgroup (HS6)
Sector Product AVE34 AVE * Trade value, US dollars
A Cheese nes*. 17.8% 9,324,605.83
H Vegetables, fresh or chilled nes*. 11.6% 3,757,076.32
A Food preparations, n.e.s.*. 10.7% 3,702,720.2
H
Fresh cut flowers and buds, of a kind suitable
for bouquets or for ornamental purposes
(excl. roses, carnations, orchids,
chrysanthemums and gladioli).
6.4% 3,636,349.95
A
Sugars in solid form, incl. invert sugar and
chemically pure maltose, and sugar and
sugar syrup blends containing in the dry state
50% by weight of fructose, not flavoured or
coloured, artificial honey, whether or not
mixed with natural honey and caramel (excl.
cane or beet sugar, chemically pure sucrose,
lactose, maple sugar, glucose, fructose, and
syrups thereof).
16.7% 3,350,546.55
30 http://www.statistics.dnb.nl/index.cgi?lang=nl&todo=Balans Table 12.6.1 / 12.6.2. 31 Various documents were studied, but additional barriers were only taken from FoodDrinkEurope, European Food and
Drink industry recommendations for the EU-US high-level group on growth and jobs, position paper, 23 April 2012. 32 For the definition of AVEs by the International Trade Center see:
http://www.trademap.org/stGlossary.aspx
http://www.macmap.org/SupportMaterials/Methodology.aspx 33 Calculated using data on HS6 level from the following:
Tariff data: Data source: ITC tariff data (MAcMap); year 2011; AVE estimation methodology: AVE World Tariff Profile
Trade data: Data source: Comtrade; year 2010; valuation: in Dollars, FOB; Query [reporter: 528; partner; 842; period:
2010; classification: as reported]
Tariff paid HS6 = trade value HS6 * AVE HS6
Weighted average(sector) = sum(all tariffs paid in the sector)/sum(all value of trade in sector) 34 AVE based on World Tariff Profile

51
Study on "EU-US High Level Working Group"
Sector Product AVE34 AVE * Trade value, US dollars
A Sugar confectionery not containing cocoa,
incl. white chocolate (excl. chewing gum). 11.8% 2,210,790.42
A Live horses, asses, mules and hinnies (excl.
pure-bred for breeding). 2.8% 2,200,466.44
A Smoking tobacco, whether or not containing
tobacco substitutes in any proportion. 120.9% 1,635,583.56
H
Bulbs, tubers, tuberous roots, corms, crowns
and rhizomes, dormant (excl. those used for
human consumption and chicory plants and
roots).
1% 1,550,514.19
H Peppers of the genus Capsicum or of the
genus Pimenta, fresh or chilled. 2% 1,268,115.40
*: nes= not elsewhere specified.
Source: Macmap and Tradecom.
Table 5.2 AF&H: Top 10 absolute tariffs paid per productgroup (HS6)
Nr. Product AVE35 AVE * Trade value, US dollars
1 Smoking tobacco, whether or not containing
tobacco substitutes in any proportion. 120.9% 1,635,583.56
2 Ground-nuts, prepared or preserved (excl.
preserved with sugar). 66.8% 28,351.26
3 Tobacco, unmanufactured, partly or wholly
stemmed or stripped. 66.2% 70,241.51
4 Tobacco refuse. 50.0% 177,726
5 Fructose&fructose syrup nes, cntg in dry state
>50% by wght of fructose. 30.9% 211,472.80
6 Prep of cereals, flour, starch/milk f infant use,
put up f retail sale. 26.8% 28,080.77
7 Onions dried but not further prepared. 25.6% 6,790.66
8 Fresh cheese, i.e. unripened or uncured cheese,
incl. whey cheese, and curd. 25.1% 414,466.51
9 Milk and cream powder unsweetened exceeding
1.5% fat. 24.2% 633,911.74
10
Yogurt, whether or not flavoured or containing
added sugar or other sweetening matter, fruits,
nuts or cocoa.
24.2% 5,135.48
Source: Macmap and Tradecom.
5.2.2 Non-tariff barriers
As for most products, tariffs are already relatively low, and non tariff measures have become much
more important for the sector. The following tables provides an overview of the relevant non tariff
barriers identified in this study, divided into sector-specific and cross-cutting barriers. It should be
noted that these barriers come from different sources (as indicated in the last column) and that
there is some overlap between them. We have only removed the most obvious duplications and the
ones where we have information that they are no longer relevant.
35 AVE based on World Tariff Profile.

52
Study on "EU-US High Level Working Group"
Annex D contains the information on the NTMs as found in the relevant sources. For the ones from
the MADB, there is a description of what the NTM entails. Some of the NTMs of FoodDrinkEurope
have a forward-looking character (risk of becoming an NTM).
Table 5.3 Identified barriers for the Agrofood and Horticulture sector
Nr. Barrier Source
Sector specific non-tariff measures
1 Agricultural export subsidies and promotion MADB
2 Export Credit Guarantee Program MADB
3 Farm bill MADB
4 IPR: inadequate protection of GIs MADB
5 Marine Mammal Protection Act MADB
6 (Requirements for) Pasturised Milk Products-Grade A MADB
7 Rules for import of dairy products into USA MADB
8 Sanitary measures applied by USA for imports of live bivalve molluscs MADB
9 Slow procedures on applications to allow import of new types of plant
products MADB
10 United States- Bovine animals and products MADB
11 US Wine tax discrimination with rebates only available to small US
producers MADB
12 Wine Distribution- no direct sales to retailers in some states MADB
13 Custom surcharges Ecorys NTM study
14 Direct and indirect government support by means of subsidies,
protective legislation and tax policies to US farmers Ecorys NTM study
15 US product standards which differ from international standards Ecorys NTM study
16
US prohibition to register/renew a trademark or a trade name which is
identical or similar to a trademark or a trade name used in connection
with a confiscated business
Ecorys NTM study
17 Implementation of Food Safety Modernisation Act: re-inspection fees FoodDrinkEurope
18 Food Safety Modernization Act- foreign supplier verification program FoodDrinkEurope
19 Dairy import assessment (levy) and its potential impact on composite
products
FoodDrinkEurope
20 Requirements for eggs and risk for more stringent requirements for
Import of products containing eggs
FoodDrinkEurope
21 Import restrictions of uncooked meat products FoodDrinkEurope
22 Tariff quotas on Milk Protein Concentrates and casein/caseinates FoodDrinkEurope
23 Stringent requirements for approval of meat-processing facilities FoodDrinkEurope
24 Lack of harmonisation within the US FoodDrinkEurope
Horizontal non tariff measures
25 Classification and labelling differences between the EU and US Ecorys NTM study
26 Diverging technical standards Ecorys NTM study
27 Environmental regulations (e.g. EU Emission Trading Scheme) Ecorys NTM study
28 Intellectual property rights differences between the EU and US Ecorys NTM study
29 Restrictions in Government procurement (e.g. the Buy American Act,
ARRA and SBA) Ecorys NTM study
30 Anti-dumping measures: practice of zeroing MADB
31 Berry Amendment to the 1941 Defence Appropriations Act MADB
32 Byrd Amendment (Continued Dumping and Subsidy Offset Act) MADB
33 Container Security Initiative (CSI) MADB

53
Study on "EU-US High Level Working Group"
Nr. Barrier Source
34 FDI limitations imposed by the CFIUS / FINSA framework MADB
35 Helms-Burton Act MADB
36 Hormones Dispute (Continued Suspension of Obligations) MADB
37 Lacey Act - Scope and implementation of the US legislation to combat
illegal logging MADB
38 Principle of First-to-Invent MADB
39 Procurement: Buy American Act MADB
40 Section 407 of the Trade and Development Act (Carousel Law) MADB
41 Small Business Act MADB
42 U.S. Customs Refusal of EU Origin ("Made in EU") MADB
5.3 Prioritisation of trade barriers: Dutch interests
The list of barriers that are potentially important for the AF&H Sector is very long. In order to get an
idea of which barriers or areas of negotiations to focus on, we have carried out a prioritisation
exercise the results of which are presented in Table 5.4 below (please note that this table is ranked
alphabetically by broader area, not in order of priority). This exercise includes the following steps:
1. We have only included those barriers in the list that are mentioned as important by at least one
of the interviewees (column 3)36;
2. For the barriers that are included in the table, we indicated the priority, based on the NTM
business survey and the interviewees responses. We use a three point-scale for this, High (H) =
listed by more than one source AND indicated as priority for at least one source, OR indicated
at least once as top priority (ranked first).; Medium (M) = listed by more than one source OR
indicated as priority (but not the highest) by one source; Low (L) = listed by one source but not
as priority (column 6);
3. As the barriers are often not relevant for the entire sector, but only for a number of specific
products, we indicate for which part of the top sector the barrier is relevant (column 4);
4. We also looked at the relative importance of these specific products / sub-sectors in total Dutch
exports of the AF&H top sector to the US.37 As the exports of beer dominate Dutch exports, we
exclude the food and beverages when looking at the shares of different products in total
exports. We use a four point scale, where 1 means that the products accounts for less than 5
percent of the AF&H exports, excluding food and beverages, 2 between 5 and 10%, 3 between
10 and 50% and 4 between 50 and 100% (column 7).
36 Also the earlier mentioned position paper of FoodDrinkEurope was used for this. 37 As before, Comtrade data are used to look at trade flows, which only capture the goods part of the top sector, not services
trade.

54
Study on "EU-US High Level Working Group"
Table 5.4 Prioritisation of barriers
No. Broader area Barrier Subsectors for
which the barrier is
relevant
Effect of the barrier Priority for relevant
Interviewees.
H=high, M=medium,
L= low
Importance
product in NL-US
trade (1= lowest, 4
= highest)
1 Customs and
border measures. Import duties.
Cross-cutting
measure, although
affecting different
subsectors to various
extents.
Direct cost effect, making Dutch products
relatively expense vis-à-vis domestic or
NAFTA products.
H 4
2
Customs surcharge for
imported dairy products, used
for dairy sales promotion,
research and education.
Dairy products. Foreign companies can hardly participate
in the initiatives funded by the levy. M 2
3 Tariff rate quota. Dairy, food products
(sugar-related).
Direct cost effect and quantity restricting
effects. M 2
4 Custom border procedures. Cross-cutting
measure.
Extensive administrative requirements,
long waiting times. H 4
5 Limited points of entry. Dairy, flowers and
plants.
Higher transport costs as most efficient
routes are not always possible. M 2
6 Import licenses. Import licenses. Cross-cutting
measure.
Administrative requirements, not difficult to
comply with. H 4
7 Intellectual Property
Rights (IPR).
Lack of IPR
protection/geographical
indications.
Processed food. Loose of competitive advantage due to
reduced exclusivity. M 1
8 Health and Safety
standards.
Slow processing of Product-
Risk Assessment (PRA)
application.
New plant products. Long waiting times. H 2
9 Lack of transparent
quarantine list.
Living organisms,
notably plants and
flowers.
Uncertainty and risk of gassing exports. M 2-3
10 Pre-shipment inspections. Cross-cutting
measure. Additional. M 4

55
Study on "EU-US High Level Working Group"
No. Broader area Barrier Subsectors for
which the barrier is
relevant
Effect of the barrier Priority for relevant
Interviewees.
H=high, M=medium,
L= low
Importance
product in NL-US
trade (1= lowest, 4
= highest)
11 SPS: greenhouse
requirements. Fruits & vegetables.
Stringent requirement on greenhouses to
prevent certain risk (e.g. African fly on
paprika), limiting the export amount
significantly.
M 3
12 SPS: Grade A. Dairy. Very complex and lengthy procedures
making it practically impossible to export. H 2
13 SPS: sand and soil. Trees and pot plants.
Trees and pot plants cannot enter the US
because of risk for diseases possibly
present in sand or soil- prohibitive effect.
M 3
14 Differences in EU-US (SPS)
rules. Various subsectors. Additional administrative requirements. M 4
15 Differences in rules and
regulations between States. Various subsectors.
Additional state-level requirements, loose
of scale economies due to different
requirements, administrative requirements.
H 4
16 SPS: bovine meat (BSE). Beef. Products are not allowed to enter US
because of risk for BSE- prohibitive effect. H 1
17 SPS: Avian influenza. Poultry. Limits quantity of exports, can be
prohibitive. M 1
18 Import restrictions on
uncooked meat. Meat. Limits quantity of exports. L 1
19
Stringent requirements in
approval for meat processing
facilities from the US
veterinary services.
Meat. Requires investments in time and money
from the complete food chain. L 1
20 State Aid. State Aid. Various subsectors. Domestic products in higher quantities
and/or lower prices. M 4
21
Technical
regulations,
standards and
Transport and packaging
requirements. Processed foods.
Loose of scale economies due to different
requirements, administrative requirements. L 2-3

56
Study on "EU-US High Level Working Group"
No. Broader area Barrier Subsectors for
which the barrier is
relevant
Effect of the barrier Priority for relevant
Interviewees.
H=high, M=medium,
L= low
Importance
product in NL-US
trade (1= lowest, 4
= highest)
certification.
22 Technical regulations:
consumer information. Processed foods.
Loose of scale economies due to different
requirements, administrative requirements. L 2-3
23 Country of origin labelling. Processed foods.
Not an issue yet but could become one in
the future, as it makes it easier to for
companies to refuse goods not produced in
the US.
L 2-3

57
Study on "EU-US High Level Working Group"
As can be seen from the table, most barriers for the AF&H sector relate to the two broader areas of
customs & border measures and health & safety requirements. The latter primarily relate to SPS
measures which clearly constitute the main non-tariff barrier for trade with the US.38
When looking one level deeper, at the specific barriers, the ones that are most important to the
interviewees (priority=H) and affect a large part of the sector’s total exports to the US (importance
of product in AF&H exports to the US=4):
Import duties;
Custom border procedures;
Import licenses;
Differences in regulations in US States.
Not surprisingly, these are barriers that affect almost the entire sector and are of a horizontal
nature. A number of observations and considerations have to be kept in mind with respect to these
specific barriers. With respect to import duties, there is large variation in the height of tariffs
depending on the product, but the trade-restricting effects of a tariff also depends on the
competitive situation for a certain sub sector: if the margins are low, even a relatively low tariff can
make a difference. The slow border procedures and associated requirements are a widely shared
concern, and the lack of qualified staff has also been mentioned as a problem hindering exports.
Import licenses are obligatory and while their elimination would reduce the administrative
requirements associated with exporting, the interviewees also indicated that they are relatively easy
to comply with. Finally, there are clear differences in regulations between States, and States can
have their own additional requirements.
There is also a group of barriers that are considered a high priority, but affect a much smaller part
of the current trade, often because they are sector-specific barriers. We consider it important to
take these into account as well, because the current trade flows are partly determined by the height
of the barriers (the so-called endogeneity problem). This is relevant for the stringent requirements
for pasteurised milk products (grade A), the slow processing of Product-Risk Assessment (PRA)
applications for new plant varieties and the ban of beef due to BSE.
5.4 Conclusions on priority barriers: linking Dutch priorities to the EU negotiation position
In the previous section we identified the main Dutch priority barriers in the AF&H sector to address
in a possible EU-US FTA. These are:
Import duties, especially for subsectors where they matter most (highest tariffs and/or small
margins);
Dairy Grade A;
Ban on beef (BSE);
Slow processing of Product-Risk Assessment (PRA) applications for new plant varieties;
Differences in regulations between States;
Custom border procedures;
Import licenses.
38 Differences in EU-US SPS measures are not given the highest priority, but medium priority, which can be explained by the
fact that that there are also other, more specific SPS related barriers included in the table.

58
Study on "EU-US High Level Working Group"
Some considerations for effectively tackling the priority barriers
Some of the priority barriers will be more easy to tackle than others in an FTA. The chance to tackle
the issue will depend on two main factors: 1) the support in the EU to get the issue high on the
negotiating agenda; 2) the political will in the US to address the issue.
It goes beyond the scope of this study to make a detailed assessment of these factors, as this
would require consultations also with players outside the Netherlands. Nevertheless, there are
some things that we can say about it on the basis of existing studies and the interviews.
With respect to EU support to get the issue on the agenda, we observe that none of the barriers
identified are only applicable to the Netherlands - other EU member states will also face these
barriers when exporting to the US. The relevance of the barrier for other EU countries thus mainly
depends on the economic importance of the products that are affected by the barrier. In that
respect, the horticulture sector (especially plant propagation material) expressed concerns over
their priority barriers as the sector is not as important in other EU countries as it is in the
Netherlands.
It is also important to realise that some of the barriers did not get priority of the stakeholders, as
they knew these would already be defended by other countries. An example in this respect is the
lack of protection of products with geographical indications (relevant for example for Gouda Holland
cheese), which is likely to be actively pursued by Southern EU member states like Italy and France.
With respect to the political will in the US, it will be very difficult to remove the ban on beef related to
their concerns over BSE given the lack of progress on this issue but also given the EU barriers to
certain meat products from the US (like the ban on chlorine-washed chicken). More generally, it will
be important to take into account the EU barriers to US products to assess what could be offered to
the US in return for removing certain barriers. This is especially relevant for the AF&H sector, given
the support and protection this sector gets in the EU (notably through the Common Agricultural
Policy).
The EU-US NTM study considered the action ability of differences in regulations between states
with respect to food safety to be very limited.
Linking Dutch priorities to the FTA
In practice, it will be difficult to focus only on individual barriers. We therefore link the identified
priority barriers to the likely elements of an FTA as formulated in the Interim Report of the High-
Level Working Group to put them in a broader perspective. This is presented in Table 5.5 below.
Taking into account the above considerations on the possibility of effectively removing certain
barriers, we put the barriers that seem to be more difficult in italics.
Table 5.5 only includes the priority barriers to ensure focus. It is nevertheless good to be aware of
the other relevant barriers listed in Table 5.4, when the broader issues are discussed in EU context.
Especially the SPS chapter is important for the AF&H sector, and mutual recognition or equivalence
of SPS measures would greatly benefit the sector.
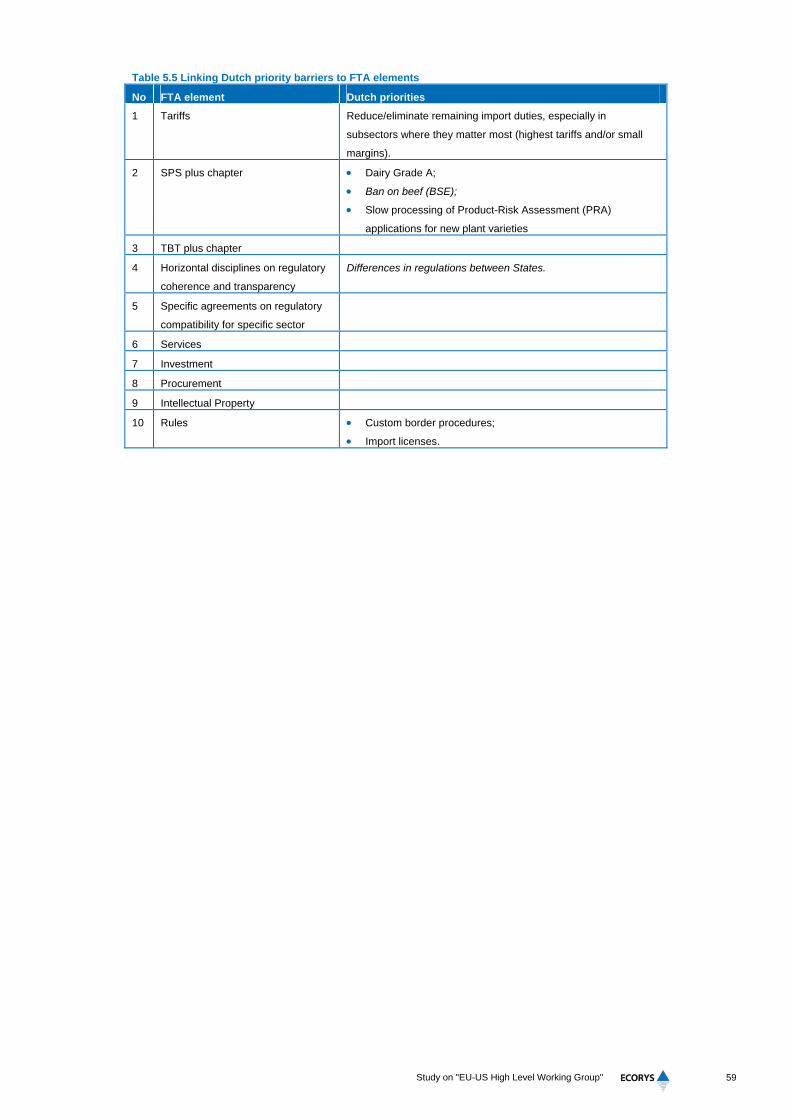
59
Study on "EU-US High Level Working Group"
Table 5.5 Linking Dutch priority barriers to FTA elements
No FTA element Dutch priorities
1 Tariffs Reduce/eliminate remaining import duties, especially in
subsectors where they matter most (highest tariffs and/or small
margins).
2 SPS plus chapter Dairy Grade A;
Ban on beef (BSE);
Slow processing of Product-Risk Assessment (PRA)
applications for new plant varieties
3 TBT plus chapter
4 Horizontal disciplines on regulatory
coherence and transparency
Differences in regulations between States.
5 Specific agreements on regulatory
compatibility for specific sector
6 Services
7 Investment
8 Procurement
9 Intellectual Property
10 Rules Custom border procedures;
Import licenses.


61
Study on "EU-US High Level Working Group"
6 Identification and prioritisation of trade barriers in the High-tech Systems & Materials sector
6.1 About the sector
The High Tech Systems & Materials (HTSM) sector consists of companies that focus on the
research and development of new materials and systems as well as their production. According to
the cluster specification of Dialogic39 the sector is made up of three parts, including:
1. Materials (in primary form);
2. Systems (metal products, computers, machinery, etc.);
3. Related activities (trade, design, testing, etc.).
This is clearly a very broad sector with many sub-sectors. It includes e.g. glass and ceramics, steel
and non-ferrous metals, but also aerospace, automotives and other transport product industries,
electro technical industries and electronic and communication equipment industries, defence and
security industries, medical equipment and instruments – even high-tech textiles could be grouped
under this sector and likewise high-tech segments of other industries may face fairly similar
problems and issues.
According to the HTSM top-team reports, the HTSM sector had an added value of €26 billion in
2008 and €23 billion in 2009, however, the Dialogic study puts this number at more than €40 billion.
The sector is estimated to employ between 390,000 (HTSM top team) and 520,000 (Dialogic)
people. According to Comtrade data the sector’s exports (goods only) to the US amounted to €8.8
billion in 2010, and accounted for approximately 40% of all Dutch goods exports to the US.
The larger high-tech companies usually offer integrated solutions, providing both the specifications
for products as well as the actual product. SMEs are mostly suppliers to this process. Most of the
sector’s markets lie abroad, the US being one of the main export destinations.40
According to the HTSM top-team, the HTSM sector is also the largest with regards to R&D
investment – accounting for an estimated 50% of all Dutch R&D. Most high tech companies are
characterised by high R&D expenditures of up to 20% of business revenues. Despite economies of
scale these costs will probably increase, since the increasing complexity of new high-tech
increasingly also requires suppliers to invest and engage in R&D and innovation. The total amount
of R&D investments for the sector will thus increase, despite efficiency gains through scale
economies. The Dutch HTSM sector co-operates closely with knowledge institutes. All three of the
Dutch technical universities are ranked in the global top 10 of universities that collaborate most
effectively with industry.41
The Netherlands is competitive on the world market of high-tech in several niches. For example
Philips is leader in lighting and medical equipment, Fokker an international supplier for the
construction and maintenance of airplanes and NXP is one of the leading companies in the
production of chips.42
39 Dialogic (2011) “Nederlandse clusters in kaart.” 40 Holland High Tech. Advise Top Team High Tech Sysemen en Materialen (2011). 41 Ibid. 42 Adviesrapport High Tech.

62
Study on "EU-US High Level Working Group"
Using data 2011 from De Nederlandse Bank43, the US has approximately €2.2 billion (FDI stocks)
invested in the Dutch High-Tech sector, whereas the Netherlands has close to€4.4 billion (FDI
stocks) invested in the American High-Tech sector. According to the US Congressional Research
Service, the Netherlands was the third biggest investor in the manufacturing industry.44
Sector strategy
The HTSM top-team has strong growth ambitions, particularly in international markets and has
recently launched an internationalisation strategy, which includes the international ambitions of
companies, research institutes and governments active in this sector. The ambition of the HTSM
sector is to grow exports from its 2009 level of €32 billion to €77 billion in 2020. It sees on the one
hand the profiling of the Netherlands as ‘the place to be’ for high-tech activities (business, research,
studies, etc.) and on the other hands the benefitting from opportunities in emerging economies as
important components of its strategy.
As part of this internationalisation strategy the Topsector HTSM has taken the initiative to develop a
specific Holland High Tech branding strategy, with the aim of positioning the Netherlands as a
global player in the high tech sector. The focus of this strategy is on a selected number (5) of target
countries, including the US, in which the HTSM will aim to develop international R&D cooperation,
trade and skills and engage in acquisition of businesses.
This branding strategy should be supplemented with a combined approach by the ‘Golden
Triangle’. Not only should knowledge institutes and the government carry out High Tech Holland
internationally but they should also stimulate the development of domestic human capital, attract
foreign human capital and increase research efforts by redistributing resources to fundamental and
applied technological research.45
Addressing tariff and especially non-tariff barriers to trade and investments is thus both an integral
part of this strategy for the sector and to an extent a condition for its success.
6.2 Identification of trade barriers
We Identified the relevant barriers to trade with the US for the sector on the basis of the following
sources: 1) the market access database (MADB) of the EU; 2) the EU-US NTM study; 3) other
literature / documents (e.g. industry position paper); and 4) interviews.
Tariff barriers
Overall tariffs between the EU and US are generally low. Tariffs in the sector are sometimes
specific (e.g. related to specific quantity, not only % (ad valorem) duties). Wen looking at the tariff,
we therefore look at the Ad Valorem Equivalents (AVE).46 The weighted average tariff47 for the
HTSM sector is 2.6 percent, although some product groups have substantially higher tariffs. Table
43 http://www.statistics.dnb.nl/index.cgi?lang=nl&todo=Balans Table 12.6.1 / 12.6.2. 44 Jackson.J.K. (2012) Foreign Direct Investment in the United States: An Economic Analysis. 45 Internationaliseringsoffensief (2011). 46 For the definition of AVEs by the International Trade Center see:
http://www.trademap.org/stGlossary.aspx;
http://www.macmap.org/SupportMaterials/Methodology.aspx. 47 Calculated using data on HS6 level from the following:
Tariff data: Data source: ITC tariff data (MAcMap); year 2011; AVE estimation methodology: AVE World Tariff Profile;
Trade data: Data source: Comtrade; year 2010; valuation: in Dollars, FOB; Query [reporter: 528; partner; 842; period:
2010; classification: as reported];
Tariff paid HS6 = trade value HS6 * AVE HS6;
Weighted average(sector) = sum(all tariffs paid in the sector)/sum(all value of trade in sector).

63
Study on "EU-US High Level Working Group"
6.1 indicates the products that pay the highest tariffs in absolute terms, whereas table 6.2 shows
the products with the highest AVEs.
Table 6.1 High Tech: Top 10 absolute tariffs paid per product group (HS6) weighted average 2.6396%
Nr. Product AVE48 AVE * Trade value
in USD f.o.b.
1 Tools for drilling, other than for rock drilling. 5.4% 1,105,756
2 Parts and accessories for microscopes other than optical
microscopes. 4.9% 988,943.5
3 Plates, tips & the like for tools of sintered metal carbides or
cermets. 4.6% 4,111,555
4 Microscopes other than optical microscopes and diffraction
apparatus. 3.5% 1,843,053
5 Machinery for the preparation of meat or poultry. 2.8% 1,043,395
6 Machinery and apparatus for isotopic separation and parts
thereof, n.e.s. [Euratom]. 2.6% 3,729,945
7 Ferro-silicon, containing by weight more than 55% of silicon. 2.6% 2,244,747
8 Ferro-chromium, nes. 2.5% 1,501,354
9 Engines, diesel, for the vehicles of Chapter 87. 1.3% 988,557.6
10
X-ray generators other than X-ray tubes, high tension
generators, control panels and desks, screens, examination
or treatment tables, chairs and the like, and general parts
and accessories for apparatus of heading 9022, n.e.s.
0.9% 1,082,801
Table 6.2 High Tech: Top 10 highest AVEs per product group (HS6) weighted average 13.757%
Nr. Product AVE AVE * Trade Value
($ f.o.b.)
1
Glassware of glass-ceramics, of a kind used for table,
kitchen, toilet, office, indoor decoration or similar purposes
(excl. goods of heading 7018, cooking hobs, leaded lights
and the like, lighting fittings and parts thereof, atomisers for
perfume and the like).
16.5% 10,066.65
2
Glassware of a kind used for toilet, office, indoor decoration
or similar purposes (excl. glassware of lead crystal or of a
kind used for table or kitchen purposes, articles of heading
7018, mirrors, leaded lights and the like, lighting fittings and
parts thereof, atomisers for perfume and the like).
15.2% 124,991.9
3 Unwrought titanium; titanium powders. 15.0% 61,474.65
4 Roofing tiles, ceramic. 13.5% 3,043.845
5
Glassware for table or kitchen purposes of glass having a
linear coefficient of expansion <= 5 x 10 -6 per kelvin within
a temperature range of 0°C to 300°C (excl. glassware of
glass ceramics or lead crystal, articles of heading 7018,
drinking glasses, glass preserving jars sterilising jars",
vacuum flasks and other vacuum vessels)".
13.4% 1,599.558
6 Drinking glasses, stemware (excl. of glass ceramics or of
lead crystal). 13.2% 346,470.4
7 Drinking glasses (excl. glasses of glass ceramics or of lead
crystal and stemware). 13.2% 37,115.63
48 AVE based on World Tariff Profile.

64
Study on "EU-US High Level Working Group"
Nr. Product AVE AVE * Trade Value
($ f.o.b.)
8
Tableware and kitchenware, of porcelain or china (excl.
ornamental articles, pots, jars, carboys and similar
receptacles for the conveyance or packing of goods, and
coffee grinders and spice mills with receptacles made of
ceramics and working parts of metal).
12.9% 29,770.49
9
Glassware for table or kitchen purposes (excl. glass having a
linear coefficient of expansion <= 5 x 10 -6 per kelvin within
a temperature range of 0°C to 300°C, glassware of glass
ceramics or lead crystal, articles of heading 7018, drinking
glasses, glass preserving jars sterilising jars", vacuum flasks
and other vacuum vessels)".
12.6% 2,673.846
10
Glassware, of lead crystal, of a kind used for toilet, office,
indoor decoration or similar purposes (excl. glassware of a
kind used for table or kitchen purposes, glassware of glass-
ceramics or lead crystal, articles of heading 7018, mirrors,
leaded lights and the like, lighting fittings and parts thereof,
atomisers for perfume and the like).
12.6% 1,336.986
Non-tariff barriers
As for most products, tariffs are already relatively low for HTSM products and non tariff measures
(NTMs) have become much more important for the sector. The following table provides an overview
of the relevant non tariff measures identified in this study, divided into sector-specific and cross-
cutting barriers. It should be noted that these barriers come from different sources (as indicated in
the last column) and that there is some overlap between them. We have only removed the most
obvious duplications.
Table 6.3 Identified barriers for the HTSM sector
Barrier Source
Sector specific NTMs
International Traffic in Arms Regulations (ITAR) Ecorys NTM study
Encryption Control Policy not in line with the Wassenaar arrangement (related to
ITAR)
Ecorys NTM study
Dual-Use Export Controls MADB
Memoranda of Understanding (Defence Acquisitions) MADB
Safety of electrical and electronics products non-harmonised standards Ecorys NTM study
Standards developed by different bodies (OSHA, National Electric Code and
Industry safety standards)
Ecorys NTM study
Non-transparency of standards Ecorys NTM study
State-wise certification according to Underwriters Laboratories Ecorys NTM study
US product standards which differ from international standards Ecorys NTM study
US state level safety certifications requirements Ecorys NTM study
Conformity assessment procedures Ecorys NTM study
Third party testing for import products with EU declarations of conformity Ecorys NTM study
Medical Device User Fee Ecorys NTM study
On-board equipment and instruments: Safety standards for Flight Guidance
Systems and Proposed Revisions to "Automatic Pilot Systems Approval"
Ecorys NTM study
Restrictions on foreign launching services Ecorys NTM study
Energy conservation Program for Commercial and Industrial Equipment (EPCA) Ecorys NTM study
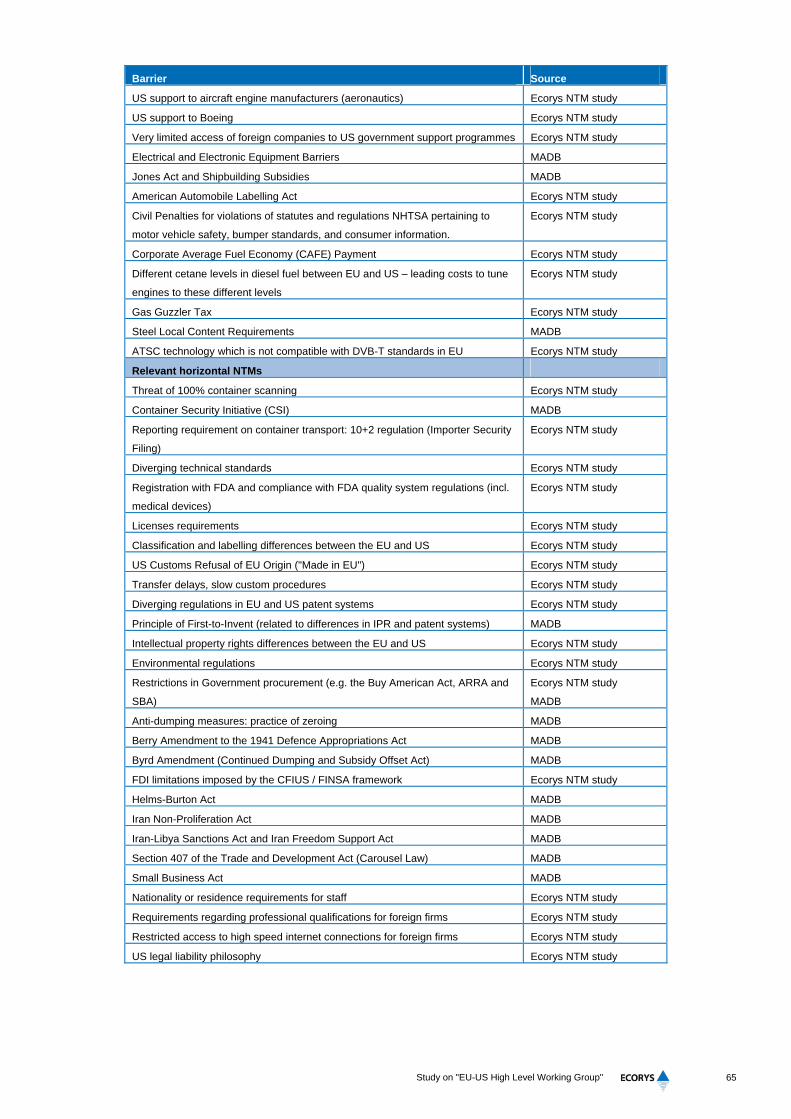
65
Study on "EU-US High Level Working Group"
Barrier Source
US support to aircraft engine manufacturers (aeronautics) Ecorys NTM study
US support to Boeing Ecorys NTM study
Very limited access of foreign companies to US government support programmes Ecorys NTM study
Electrical and Electronic Equipment Barriers MADB
Jones Act and Shipbuilding Subsidies MADB
American Automobile Labelling Act Ecorys NTM study
Civil Penalties for violations of statutes and regulations NHTSA pertaining to
motor vehicle safety, bumper standards, and consumer information.
Ecorys NTM study
Corporate Average Fuel Economy (CAFE) Payment Ecorys NTM study
Different cetane levels in diesel fuel between EU and US – leading costs to tune
engines to these different levels
Ecorys NTM study
Gas Guzzler Tax Ecorys NTM study
Steel Local Content Requirements MADB
ATSC technology which is not compatible with DVB-T standards in EU Ecorys NTM study
Relevant horizontal NTMs
Threat of 100% container scanning Ecorys NTM study
Container Security Initiative (CSI) MADB
Reporting requirement on container transport: 10+2 regulation (Importer Security
Filing)
Ecorys NTM study
Diverging technical standards Ecorys NTM study
Registration with FDA and compliance with FDA quality system regulations (incl.
medical devices)
Ecorys NTM study
Licenses requirements Ecorys NTM study
Classification and labelling differences between the EU and US Ecorys NTM study
US Customs Refusal of EU Origin ("Made in EU") Ecorys NTM study
Transfer delays, slow custom procedures Ecorys NTM study
Diverging regulations in EU and US patent systems Ecorys NTM study
Principle of First-to-Invent (related to differences in IPR and patent systems) MADB
Intellectual property rights differences between the EU and US Ecorys NTM study
Environmental regulations Ecorys NTM study
Restrictions in Government procurement (e.g. the Buy American Act, ARRA and
SBA)
Ecorys NTM study
MADB
Anti-dumping measures: practice of zeroing MADB
Berry Amendment to the 1941 Defence Appropriations Act MADB
Byrd Amendment (Continued Dumping and Subsidy Offset Act) MADB
FDI limitations imposed by the CFIUS / FINSA framework Ecorys NTM study
Helms-Burton Act MADB
Iran Non-Proliferation Act MADB
Iran-Libya Sanctions Act and Iran Freedom Support Act MADB
Section 407 of the Trade and Development Act (Carousel Law) MADB
Small Business Act MADB
Nationality or residence requirements for staff Ecorys NTM study
Requirements regarding professional qualifications for foreign firms Ecorys NTM study
Restricted access to high speed internet connections for foreign firms Ecorys NTM study
US legal liability philosophy Ecorys NTM study

66
Study on "EU-US High Level Working Group"
6.3 Prioritisation of trade barriers
The list of barriers that are potentially important for the HTSM sector is obviously very long. In order
to get an idea of which barriers or areas of negotiations to focus on, we have carried out a
prioritisation exercise the results of which are presented in Table 6.4 below (please note that this
table is ranked alphabetically by broader area, not in order of priority). This exercise includes the
following steps:
1. Under a number of broader themes / areas (column 2), we have only included those barriers in
the list that are mentioned as important by at least one of the interviewees (column 3);
2. To account for the fact that we have not been able to speak to all relevant stakeholders, we
have also included those barriers from the Ecorys EU-US NTM study which were considered as
most pressing by the companies that participated in the business survey for this study (column
3);
3. As the barriers are often not relevant for the entire sector, but for a number of specific products /
sub-sectors, we have indicated for which products / sub-sectors the specific barrier is most
relevant (column 4) and we have given a brief description of the general effect of the barrier
(column 5);
4. For the barriers that are included in the table, we indicated the priority, based on the NTM
business survey (those barriers identified in the survey as of the highest priority) and the
interviews, as well as on the outcomes of a survey by an industry association. We use a three
point-scale for this, High (H) = listed by more than one source AND indicated as priority for at
least one source, OR indicated at least once as top priority (ranked first).; Medium (M): listed by
more than 1 source OR indicated as priority (but not the highest) by one source; Low (L) = listed
by one source but not as priority (column 6);
5. Finally, we looked at the relative importance of these products in total Dutch exports of the
HTSM top sector to the US.49 While we have looked initially at HS 2-digit data, for the most
dominant and broadest sub-sector (nuclear reactors, boilers and machinery, accounting for 46%
of exports) we have also taken a closer look at HS 4-digit data to be able to be more precise.
We use a four point scale, where 1 means that the products accounts for less than 5% of the
HTSM US exports, 2 between 5 and 10%, 3 between 10 and 50% and 4 between 50 and 100%
(column 7).
49 As indicated before, Comtrade data are used to look at trade flows, which only capture the goods part of the top sector, not
services related activities.
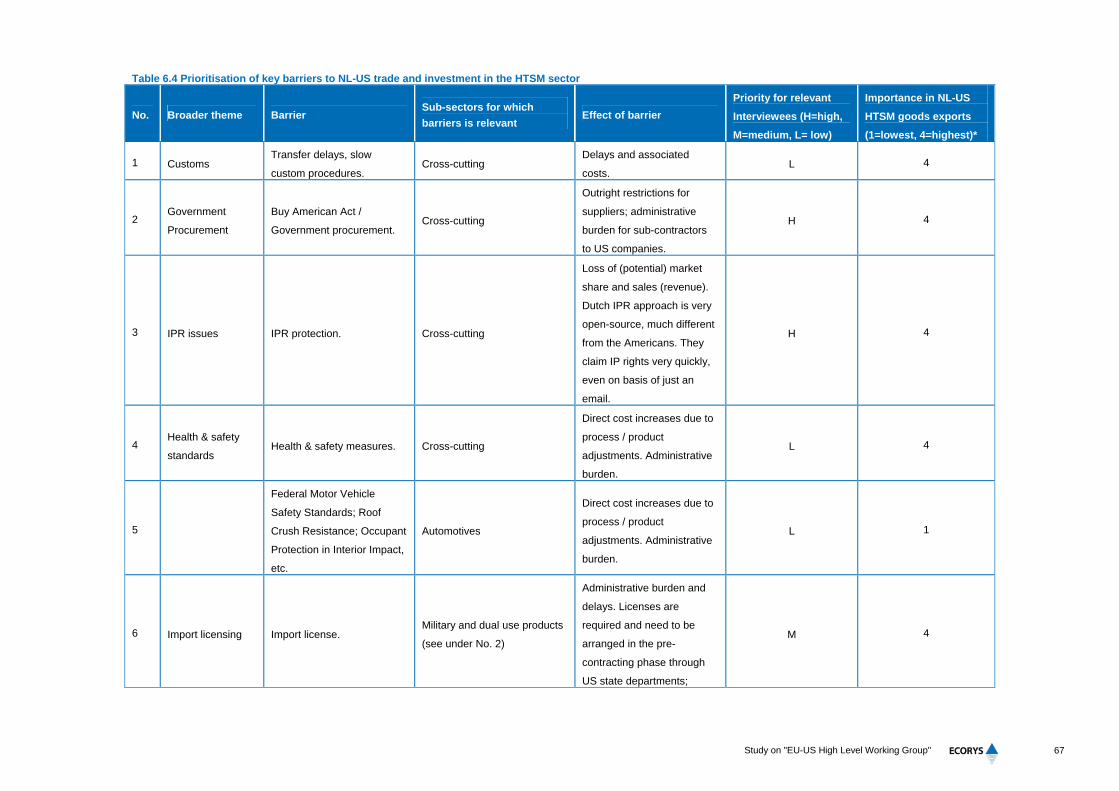
67
Study on "EU-US High Level Working Group"
Table 6.4 Prioritisation of key barriers to NL-US trade and investment in the HTSM sector
No. Broader theme Barrier Sub-sectors for which
barriers is relevant Effect of barrier
Priority for relevant
Interviewees (H=high,
M=medium, L= low)
Importance in NL-US
HTSM goods exports
(1=lowest, 4=highest)*
1 Customs Transfer delays, slow
custom procedures. Cross-cutting
Delays and associated
costs. L 4
2 Government
Procurement
Buy American Act /
Government procurement. Cross-cutting
Outright restrictions for
suppliers; administrative
burden for sub-contractors
to US companies.
H 4
3 IPR issues IPR protection. Cross-cutting
Loss of (potential) market
share and sales (revenue).
Dutch IPR approach is very
open-source, much different
from the Americans. They
claim IP rights very quickly,
even on basis of just an
email.
H 4
4 Health & safety
standards Health & safety measures. Cross-cutting
Direct cost increases due to
process / product
adjustments. Administrative
burden.
L 4
5
Federal Motor Vehicle
Safety Standards; Roof
Crush Resistance; Occupant
Protection in Interior Impact,
etc.
Automotives
Direct cost increases due to
process / product
adjustments. Administrative
burden.
L 1
6 Import licensing Import license. Military and dual use products
(see under No. 2)
Administrative burden and
delays. Licenses are
required and need to be
arranged in the pre-
contracting phase through
US state departments;
M 4

68
Study on "EU-US High Level Working Group"
No. Broader theme Barrier Sub-sectors for which
barriers is relevant Effect of barrier
Priority for relevant
Interviewees (H=high,
M=medium, L= low)
Importance in NL-US
HTSM goods exports
(1=lowest, 4=highest)*
procedure is unpredictable
and can cost months.
7
FCC technical specifications
have to be met in order to
get approval of the customs
authority to import radio
frequency devices.
Communication equipment
(dual use products, see under
No.2).
Administrative burden and
compliance costs. L 2
8
Restrictions and
prohibitions to
trade and
investment on
grounds of
national security
International Traffic in Arms
Regulations (ITAR).
Aerospace, aeronautics and
military products; some dual
use products (see next).
Administrative burden and
associated cost. Very costly
and very complex process.
Large barrier to trade. EU
and US have similar rules,
but not harmonised. So US
regulations do not always fit
into Dutch and EU
regulation. Compliance is
difficult.
H 3
9 Dual-Use Export Controls50.
The relevant dual use
products / sectors, including:
nucleaire goods; materials and
materials processing,
electronics, computers,
telecommunications and
information security goods,
sensors and lasers, navigation
and aviation electronics,
maritime systems and vessels,
aerospace and aeronautics.
Administrative burden and
associated cost. Outright
restrictions.
M 4
50 ‘dual-use items’ includes software and technology, which can be used for both civil and military purposes, and concerns all goods which can be used for both non-explosive uses and assisting in any way
in the manufacture of nuclear weapons or other nuclear explosive devices (COUNCIL REGULATION (EC) No 428/2009).

69
Study on "EU-US High Level Working Group"
No. Broader theme Barrier Sub-sectors for which
barriers is relevant Effect of barrier
Priority for relevant
Interviewees (H=high,
M=medium, L= low)
Importance in NL-US
HTSM goods exports
(1=lowest, 4=highest)*
10
Prohibitions (security,
sensitive products, political)
to trade and investments.
Idem above. Idem above. M 4
11
Prior authorisation for
sensitive product
categories.
Idem above. Administrative burden. L 4
12 Foreign Investment and
National Security Act51.
Telecommunications, energy
technologies (NB this relates
to investments only, not trade).
Administrative burden, long
delays and possibly no
market access at all.
L N.R.
13 Rules of origin Rules of origin; “EU origin”
not accepted.
Cross-cutting (most relevant
for products made from
components from different EU
MS).
Administrative burden. L #
14 State Aid and
Subsidies
Very limited access of
foreign companies to US
government support
programmes / State aid, incl.
subsidies and tax benefits.
Cross-cutting for all high-tech
(NB access to US support
programmes only really
relevant for investments).
Relative cost disadvantage. M 4
15 US Support to Boeing.
Most relevant to aerospace
and airplane builders, less to
component suppliers (which all
Dutch companies in this sector
are).
Relative cost disadvantage. L 2
16
Technical
regulations,
measures and
standards
US product standards which
differ from international
standards.
Aerospace, automotives,
electronics and electrical
equipment,
telecommunications.
FARs and DEFARs are
regulations and
administrative requirements
not equivalent to EU
H 4
51 Transactions that involve foreign governments, a threat to national security, or control of critical infrastructure must be subject to a 45-day formal investigation, except that exceptions are possible for
foreign government transactions if the Secretary or Deputy Secretary of Treasury and the lead agency certify that there is no national security threat. Critical infrastructure includes energy assets and
critical technologies.

70
Study on "EU-US High Level Working Group"
No. Broader theme Barrier Sub-sectors for which
barriers is relevant Effect of barrier
Priority for relevant
Interviewees (H=high,
M=medium, L= low)
Importance in NL-US
HTSM goods exports
(1=lowest, 4=highest)*
standards. Very implicit
requirements that are
sometimes easier to fulfil for
US companies. E.g. for
automotive: US product
standards (FMVSS) which
differ from the international
standards (UNECE).
17
Technical
regulations,
measures and
standards
Technical regulations and
measures; differences in
standards; Different
technical regulations on
products and means of
production.
Communication, office
equipment, machinery,
electronics.
Direct cost increases due to
process / product
adjustments. Administrative
burden.
M 4
18
Technical & safety
standards and
certification
Non-functioning of system
for safety standards
(Underwriters Laboratories) /
malfunctioning of the US
certification market.
Electronics, tele-
communications and office
equipment - component
manufacturers in particular.
UL are sole authorised
organisations for certification
and control prices and
processing, which is seen to
lead to high costs and long
processes.
M-H 3
19
Adjusting products to meet
US certification
requirements.
Electronics, component
manufacturers.
Direct cost increases due to
process / product
adjustments.
L 3
20 Trade in services
Cumbersome procedures
and long process to dispatch
technical staff (maintenance
engineers) for services in
US.
Machinery, equipment and
systems suppliers
(installations).
Delays, cost increases /
reputation damage. L #
21 Other Differences in regulations
between States within the Cross-cutting.
Administrative burden and
compliance costs. L-M 4

71
Study on "EU-US High Level Working Group"
No. Broader theme Barrier Sub-sectors for which
barriers is relevant Effect of barrier
Priority for relevant
Interviewees (H=high,
M=medium, L= low)
Importance in NL-US
HTSM goods exports
(1=lowest, 4=highest)*
US; US state level safety
certifications.
22 SME Act. Cross-cutting.
Act that calls for the
involvement of US SMEs
into production. If you do not
bargain this clause out, it will
be in definitely and causes
extra costs for trade.
L 4
* N.R. = Not relevant (e.g. because barrier relates to investments) # = Could not be determined, e.g. because it involves services trade or product characteristics not obvious from trade data (e.g. origin of
content).

72
Study on "EU-US High Level Working Group"
As many of the barriers affect large parts of the sector, there appear to be a large number of
priorities. However, grouping them under main themes, the picture emerges of only a few real key
barriers. The following barriers are the highest priorities and affect a large part of the sector’s trade:
Restrictions and prohibitions to trade and investment on grounds of national security (especially
ITAR, followed by dual use export controls and prohibitions);
Technical regulations, measures and standards including certification issues (US standards that
differ from international standards, non-functioning of system for safety standards);
Government procurement (Buy- American Act);
IPR issues (first-to-invent principle).
With respect to restrictions and prohibitions to trade on grounds of national security, it is important
to highlight that there are many products of dual use in the HTSM sector that are affected by these
measures.
The issue of limited access to government procurement due to the Buy American Act is relatively
important in this sector, as the government is an important buyer of HTSM products.
6.4 Conclusions on priority barriers: linking Dutch priorities to the EU negotiation position
In the previous section we identified the main Dutch priority barriers in the HTSM sector to address
in a possible EU-US FTA. These are:
Restrictions and prohibitions to trade and investment on grounds of national security (especially
ITAR, followed by dual use export controls and prohibitions);
Technical regulations, measures and standards including certification issues (US standards that
differ from international standards, non-functioning of system for safety standards);
Government procurement (Buy- American Act);
IPR issues (first-to-invent principle).
Some considerations for effectively tackling the priority barriers
Some of the priority barriers will be more easy to tackle than others in an FTA. The chance to tackle
the issue will depend on two main factors: 1) the support in the EU to get the issue high on the
negotiating agenda; 2) the political will in the US to address the issue.
It goes beyond the scope of this study to make a detailed assessment of these factors, as this
would require consultations also with players outside the Netherlands. Nevertheless, there are
some things that we can say about it on the basis of existing studies and the interviews.
With respect to EU support to get the issue on the agenda, we observe that none of the barriers
identified in Table 6.4 are only applicable to the Netherlands - other EU member states will also
face these barriers when exporting to the US. The relevance of the barrier for other EU countries
thus mainly depends on the economic importance of the products that are affected by the barrier. It
should be noted that the stakeholder consultations revealed that the Dutch are relatively strong in
complying to the US requirements, which gives them a competitive advantage over companies of
other EU countries.
With respect to the political will, we note that prohibitions to trade and investment on grounds of
national security have become an increasingly poignant issue since the events of September 11,
2001 (“9-11”). These barriers concern a highly sensitive issue (national security), and are therefore
extremely hard to tackle as nations tend to place national security above all else. Also the

73
Study on "EU-US High Level Working Group"
differences in dealing with intellectual property rights will be difficult to reconcile with the EU
system. With respect to government procurement there is more scope for success, although in the
current economic circumstances, it may also not be very easy to remove.
Linking the priority barriers to the FTA
In practice, it will be difficult to focus only on individual, very specific barriers. We therefore link the
identified priority barriers to the likely elements of an FTA as formulated in the Interim Report of the
High-Level Working Group to put them in a broader perspective. This is presented in the Table 6.5
below. Taking into account the above considerations on the possibility of effectively removing
certain barriers, we put the barriers that seem to be more difficult in italics. As mentioned above,
addressing the security-related barriers will be very difficult and would therefore involve more taking
off the sharpest edges, finding ways to cooperate and exchange information in a timely manner,
rather than eliminating them altogether. However, a great number of the HTSM sector’s products
can be categorised as dual use products and thus are faced with these barriers. So trying to at least
reduce the barriers as much as possible is important for the Dutch HTSM sector as it would reduce
compliance cost. If the US would request a security exception, it would be important to limit the
scope of this exception, especially for these dual use products.
While some of the other barriers listed in table 6.4 could be included in table 6.5 as well, we have
opted to only present the top priority barriers so as to ensure focus. It is nevertheless good to be
aware of the long list of barriers as presented in table 6.4, when the broader issues are discussed
in EU context.
Table 6.5 Linking Dutch priorities to the EU-US trade negotiations agenda
No FTA element Dutch priorities
Tariffs
SPS plus chapter
TBT plus chapter
Horizontal disciplines on regulatory
coherence and transparency
Certification system. Harmonisation, mutual recognition and
transparency improvement of system for control of trade
and investments in sensitive goods and services (including
licensing).
Specific agreements on regulatory
compatibility for specific sector
Dual use products & export controls;
Harmonisation / mutual recognition of technical standards.
Services
Investment Improve transparency of process of approval.
Procurement Increase access to US government contracts.
Intellectual Property Harmonisation and transparency improvement of system.
Rules


75
Study on "EU-US High Level Working Group"
7 Identification and prioritisation of trade barriers in the Chemicals sector
7.1 About the Chemical sector
7.1.1 Introduction
The Chemicals sector consists of companies that focus on the production of organic and inorganic
chemicals as well as fuels and pharmaceuticals. According to the cluster specification of Dialogic
(2011)52 the sector is made up of four parts, including:
1. Chemical products;
2. Rubber and plastic products;
3. Refinement of petroleum;
4. Medical/pharmaceutical R&D.
The chemicals sector is a traditionally strong export sector. It provides 63,000 jobs (excluding
pharmaceuticals) 53 and is characterised by close collaboration between large MNEs such as Akzo
Nobel, DSM, Shell and Royal ten Cate, and SMEs, which play a vital role in the sector’s
innovation.54 Another source of innovation in the Chemicals sector is the “Golden Triangle.” This
link between the government, knowledge institutes and the private sector has resulted in a
multitude of long-lasting public-private partnerships.55
To better focus its efforts to stimulate the diverse sector, the top sector team has divided the sector
into four different “Top Consortia for Knowledge and Innovation” (TKIs): (1) Smart Polymeric
Materials, (2) Process technology, (3) Bio-based Economy and (4) Nursery for New Chemical
Innovations. These TKIs cover the entire chain, from scientific research to valorisation. Like the
HTSM sector, Chemicals also wishes to pursue the Holland branding strategy.56 It also has a clear
focus on durability/sustainability in its strategy, reflected in the emphasis on the bio-based fuels and
increasing yields of chemical processes.57
7.1.2 Trade and Investment relations between the Netherlands and the US in the sector
According to the industry association VNCI the value of exports of the chemicals sector (including
pharmaceuticals) equalled 71 billion Euros in 2011, or 17.5% of total Dutch exports, 8% of which
was destined for the United States.
According to data for 2011 from De Nederlandse Bank,58 the US has approximately €11.4 billion
(FDI stocks) invested in the Dutch Chemicals sector, whereas the Netherlands has a little over
€19.5 billion (FDI stocks) invested in the American Chemicals sector. In 2010, “the Netherlands and
the United Kingdom accounted for the bulk of foreign investments in the U.S. petroleum sector.”59
52 Dialogic (2011) “Nederlandse clusters in kaart”. 53 VNCI website, http://www.vnci.nl/feiten/chemie-in-nederland.aspx last checked 3-9-2012. 54 Adviesrapport Chemie. 55 Adviesrapport Chemie. 56 Agenda Internationalisering Topsector Chemie – maart 2012. 57 Adviesrapport. 58 http://www.statistics.dnb.nl/index.cgi?lang=nl&todo=Balans Table 12.6.1 / 12.6.2. 59 Foreign Direct Investment in the United States: An Economic Analysis - James K. Jackson, May 10 2012.

76
Study on "EU-US High Level Working Group"
The role of FDI is also reflected in the trade flows. According to a joint statement of the American
Chemistry Council (ACC) and the European Chemical Industry Council, Cefic,60 some 35 to 40
percent of total EU-US bilateral trade flows of chemicals concern intra-company trade.
7.2 Identification of trade barriers
We identified the relevant barriers for the sector on the basis of the following sources: 1) the market
access database (MADB) of the EU; 2) the Ecorys EU-US NTM study; 3) other literature; and 4)
interviews with stakeholders in the sector. All relevant information of the first two sources is
included in Annex D.
7.2.1 Tariff barriers
Overall tariffs between the EU and US are generally low. This has been agreed in Chemical Tariff
Harmonisation Agreement (CTHA), which has been signed by some 50 WTO members including
the EU and US. The CTHA provides for the reduction of chemicals tariffs to 0%, 5.5% or 6.5% of
the Harmonised System Chapters 28 to 39 and includes inorganic and organic chemicals, fertilisers
and plant protection chemicals, soaps and cosmetics, other chemicals and plastics. Wen looking at
the tariff, we take the Ad Valorem Equivalents (AVE).61 The weighted average tariff62 for the
Chemicals sector amounts to 1.5 percent. The top tariff (AVE) for the sector is 6.5 percent, applied
to some 30 products (HS6 level). Table 5.1 indicates the products that pay the highest tariffs in
absolute terms.
Table 7.1 Chemicals: Top 10 absolute tariffs paid per product group (HS6) weighted average 6.5%
Nr. Product AVE63 AVE * Trade value, US dollars
1 Prepared additives for mineral oils or for other similar
liquids, nes. 6.5% 2,238,022
2
Plates, sheets, film, foil and strip, of plastics,
reinforced, laminated, supported or similarly combined
with other materials, unworked or merely surface-
worked or merely cut into squares or rectangles.
6.5% 1,447,300
3 Orthophthalic acid esters, nes. 6.5% 1,094,700
4
Carboxylic acids with additional oxygen function and
their anhydrides, halides, peroxides and peroxyacids;
their halogenated, sulphonated, nitrated or nitrosated
derivatives.
6.5% 747,185.70
5 Polymers of propylene or of other olefins, in primary
forms. 6.5% 729,426.30
6 Polytetrafluoroethylene, in primary forms. 6.5% 700,287.20
7 Polymers of styrene nes, in primary forms. 6.5% 487,606.10
60 Joint ACC-Cefic Statement on European Commission public consultation on EU-US High-Level Working Group on jobs
and growth, 23 April 2012. 61 For the definition of AVEs by the International Trade Center see:
http://www.trademap.org/stGlossary.aspx;
http://www.macmap.org/SupportMaterials/Methodology.aspx. 62 Calculated using data on HS6 level from the following:
Tariff data: Data source: ITC tariff data (MAcMap); year 2011; AVE estimation methodology: AVE World Tariff Profile;
Trade data: Data source: Comtrade; year 2010; valuation: in Dollars, FOB; Query [reporter: 528; partner; 842; period:
2010; classification: as reported];
Tariff paid HS6 = trade value HS6 * AVE HS6;
Weighted average(sector) = sum (all tariffs paid in the sector)/sum(all value of trade in sector). 63 AVE based on World Tariff Profile.

77
Study on "EU-US High Level Working Group"
Nr. Product AVE63 AVE * Trade value, US dollars
8 Organo-sulphur compounds, nes. 6.5% 325,099.50
9 Dinonyl or didecyl orthophthalates. 6.5% 305,184.90
10 Polyethylene terephthalate, in primary forms. 6.5% 289,408.30
7.2.2 Non-tariff barriers
As for most products, tariffs are already relatively low for Chemical products and non tariff
measures (NTMs) have become relatively more important for the sector. The following table
provides an overview of the relevant non tariff measures identified in this study, divided into sector-
specific and cross-cutting (horizontal) barriers. It should be noted that these barriers come from
different sources (as indicated in the last column) and that there is some overlap between them. We
have only removed the most obvious duplications, or the ones for which we have information that
they are no longer relevant. It is striking that the EC’s MADB has no sector-specific barriers for the
chemical exports to the US, suggesting that these barriers are relatively low. Also the limited
number of interviews revealed no major sector-specific barriers. In comparison to the other two top-
sectors, there is relatively more focus on investment barriers, probably as many of the players in
the sector are multinational companies with branches in the US.
Table 7.2 Identified barriers for the Chemicals sector
Nr. Barrier Source
Sector-specific barriers
1 Classification and labelling requirements for chemical products Ecorys NTM study
2 Different local governments (below state level) implementing chemical
security regulations
Ecorys NTM study
3 Different state level chemical security regulations Ecorys NTM study
4 Double certification need caused by the European Union's Authorised
Economic Operator program and the US Customs-Trade Partnership
against terrorism
Ecorys NTM study
5 Drug precursor legislation Ecorys NTM study
6 Evaluation and notification of new significant new uses Ecorys NTM study
7 FDA New Drug Approval Process Ecorys NTM study
8 Indirect effects from food safety legislation – packaging in contact with food Ecorys NTM study
9 Pesticide/biocide testing and evaluation for licensing Ecorys NTM study
10 Prior authorization for sensitive product categories Ecorys NTM study
11 Restrictions or bans on use of specific chemicals Ecorys NTM study
12 Threat of 100% container scanning Ecorys NTM study
13 US state level safety certifications requirements Ecorys NTM study
14 Foreign Investment and National Security Act (FINSA), which can create
excess costs for FDI Ecorys NTM study
15 Long/difficult authorisation and registration procedures Ecorys NTM study
16 Very limited access of foreign companies to US government subsidy
programmes (e.g. Technology Innovation Programme) Ecorys NTM study
17 Foreign Investment and National Security Act (FINSA), which can create
excess costs for FDI Ecorys NTM study
18 Long/difficult authorisation and registration procedures Ecorys NTM study
19 Very limited access of foreign companies to US government subsidy
programmes (e.g. Technology Innovation Programme)
Ecorys NTM study

78
Study on "EU-US High Level Working Group"
Nr. Barrier Source
Horizontal barriers
20 Classification and labelling differences between the EU and US Ecorys NTM study
21 Diverging regulations in EU and US patent systems Ecorys NTM study
22 Diverging technical standards Ecorys NTM study
23 Environmental regulations (e.g. EU Emission Trading Scheme) Ecorys NTM study
24 Intellectual property rights differences between the EU and US Ecorys NTM study
25 Restrictions in Government procurement (e.g. the Buy American Act,
ARRA and SBA)
Ecorys NTM study
26 Anti-dumping measures: practice of zeroing MADB
27 Berry Amendment to the 1941 Defence Appropriations Act MADB
28 Byrd Amendment (Continued Dumping and Subsidy Offset Act) MADB
29 Container Security Initiative (CSI) MADB
30 FDI limitations imposed by the CFIUS / FINSA framework MADB
31 Helms-Burton Act MADB
32 Hormones Dispute (Continued Suspension of Obligations) MADB
33 Iran Non-Proliferation Act MADB
34 Iran-Libya Sanctions Act and Iran Freedom Support Act MADB
35 Lacey Act - Scope and implementation of the US legislation to combat
illegal logging
MADB
36 Memoranda of Understanding (Defence Acquisitions) MADB
37 Principle of First-to-Invent MADB
38 Procurement: Buy American Act MADB
39 Section 407 of the Trade and Development Act (Carousel Law) MADB
40 Small Business Act MADB
41 U.S. Customs Refusal of EU Origin ("Made in EU") MADB
42 US Dual-Use Export Controls MADB
7.3 Prioritisation of trade barriers
The list of barriers that are potentially important for the Chemicals Sector is very long. In order to
get an idea of which barriers or areas of negotiations to focus on, we have carried out a
prioritisation exercise the results of which are presented in Table 7.3 below (please note that this
table is ranked alphabetically by broader area, not in order of priority). This exercise includes the
following steps:
1. We have only included those barriers in the list that are mentioned as important by at least one
of the interviewees (column 3);64
2. To account for the fact that we have not been able to speak to all relevant stakeholders, we
have also included the barriers of the Ecorys EU-US NTM study which were considered the
most pressing barriers in by the companies that participated in the business survey for this
study (column 3);
3. For these barriers that are included in the table, we indicated the priority, based on the NTM
business survey and the interviewees. We use a three point-scale for this, High (H) = listed by
more than one source AND indicated as priority for at least one source, OR indicated at least
once as top priority (ranked first); Medium (M) = listed by more than one source OR indicated as
priority by one source; Low (L) = listed by one source but not as priority (column 6);
64 Also the earlier mentioned joint statement of ACC and Cefic was used for this.

79
Study on "EU-US High Level Working Group"
4. As the barriers are often not relevant for the entire sector, but only for a number of specific
products, we indicate for which part of the top sector the barrier is relevant (column 4);
5. We also looked at the relative importance of these products in total Dutch exports of the
Chemicals top sector to the US.65 We use a four point scale, where 1 means that the product
accounts for less than 5 percent of the Chemicals exports, 2 between 5 and 10%, 3 between 10
and 50% and 4 between 50 and 100% (column 7).
65 As before, Comtrade data are used to look at trade flows, which only capture the goods part of the top sector, not.

80
Study on "EU-US High Level Working Group"
Table 7.3 Prioritisation of barriers
No Broader area Barrier Subsectors for
which the barrier is
relevant
Effect of the barrier Priority for
relevant
Interviewees
(H=high,
M=medium, L=
low)
Importance
product in NL-
US trade (1 =
lowest, 4 =
highest)
1 Customs and
border measures
Customs valuation. Various products. Some products may be categorised as a different product
facing higher tariff barriers. M #*
2 Slow custom procedures. Cross-cutting. Longer waiting times, significant impact for perishable
products. L 4
3 Tariffs. All goods for which
there are still tariffs.
Direct cost-increasing effect, but also EU tariffs increase
costs for Dutch firms in the US that export from the US to
NL. High EU tariffs on bio-ethanol have been mentioned
specifically in relation to barrier no. 9).
H 3-4
4 Sugar quota. All good which use
sugar as ingredient.
The quota limit the amount of sugar available to chemical
producers and/or increase prices of these inputs. M #*
5 Health and Safety
standards
Some differences in
standards.
Cross-cutting. Direct cost increases due to process / product adjustments.
Administrative burden. L 2-3
6 Laws and regulations with
respect to nutritional
chemicals.
Nutritional chemicals. Especially throughput times for approval are long.
M 1-2
7 Restrictions on use of
certain chemicals.
Not specified. Limits market access for certain products. H 1-2
8 IPR Lack of IPR protection with
respect to cross border data.
Cross-cutting. Possible loss of trade secrets to competitors, hence loosing
the possibility to reap benefits of R&D investments. M #*
9 State aid US subsidies for bio ethanol. Bio ethanol. Gives US chemical producers an advantage as bio-ethanol
may become important input for the chemical industry. H 1
10 Technical
regulations,
standards and
certification
Differences in regulatory
systems, lack of
transparency.
Cross-cutting. Direct cost increases due to process / product adjustments.
Administrative burden and uncertainty. M 4
Note: * # means that it is impossible to look at the importance for trade flows based on trade statistics or a realistic estimation.

81
Study on "EU-US High Level Working Group"
As can be seen from the table, most barriers for the chemicals sector relate to the two broader
areas of customs and border measures, and health and safety standards. In addition, it can be
observed that stakeholders have also pointed to an unequal playing field between the EU and the
US due to EU policies, like the high sugar prices (sugar is an important input for the chemical
industry) due to especially sugar import quota and the relatively more strict rules in the EU for state
aid compared to the US.
The only barrier that is considered a priority and that affects a large part of the sector concerns
tariffs. Although tariffs are not very high, given the large intra-company trade share in total bilateral
trade flows between the two partners, this is still an important concern to the industry. An overall
reduction or elimination of tariffs would also reduce the problem of customs valuation (although this
is not listed as a priority barrier and only affects a much smaller part of the sector).
Then there is a group of barriers that are considered a high priority, but affect a much smaller part
of the current trade. We consider it important to take these into account as well, because the
current trade flows are partly determined by the height of the barriers (the so-called endogeneity
problem). This is relevant for the US bio-ethanol subsidies which may give US chemical producers
an advantage, and the restrictions on use of certain chemicals.
7.4 Conclusions on priority barriers
In the previous section we identified the main Dutch priority barriers in the Chemicals sector to
address in a possible EU-US FTA. These are:
reduction/removal of tariffs;
restrictions on the use of certain chemicals;
US bio-ethanol subsidies.
With respect to the latter the industry does not want to tackle this in an FTA, as the sector benefits
from these subsidies, which have a price-reducing effect on inputs for the chemical industry.66 We
will therefore not take it into account as priority barrier for the FTA negotiations.
Some considerations for effectively tackling the priority barriers
Some of the priority barriers will be more easy to tackle than others in an FTA. The chance to tackle
the issue will depend on two main factors: 1) the support in the EU to get the issue high on the
negotiating agenda; 2) the political will in the US to address the issue.
It goes beyond the scope of this study to make a detailed assessment of these factors, as this
would require consultations also with players outside the Netherlands. Nevertheless, there are
some things that we can say about it on the basis of existing studies and the interviews.
With respect to EU support to get the issue on the agenda, we observe that none of the barriers
identified in Table 7.3 are only applicable to the Netherlands – other EU member states will also
face these barriers when exporting to the US. The relevance of the barrier for other EU countries
thus mainly depends on the economic importance of the products that are affected by the barrier.
Based on the analysis for this study, there are no clear barriers or products for which the NL
interests appear substantially different than the EU interests.
66 Although the subsidy is thus positive for the chemicals sector, the input for the negotiations should balance it with possible
effects for the bio-ethanol sector in the Netherlands.
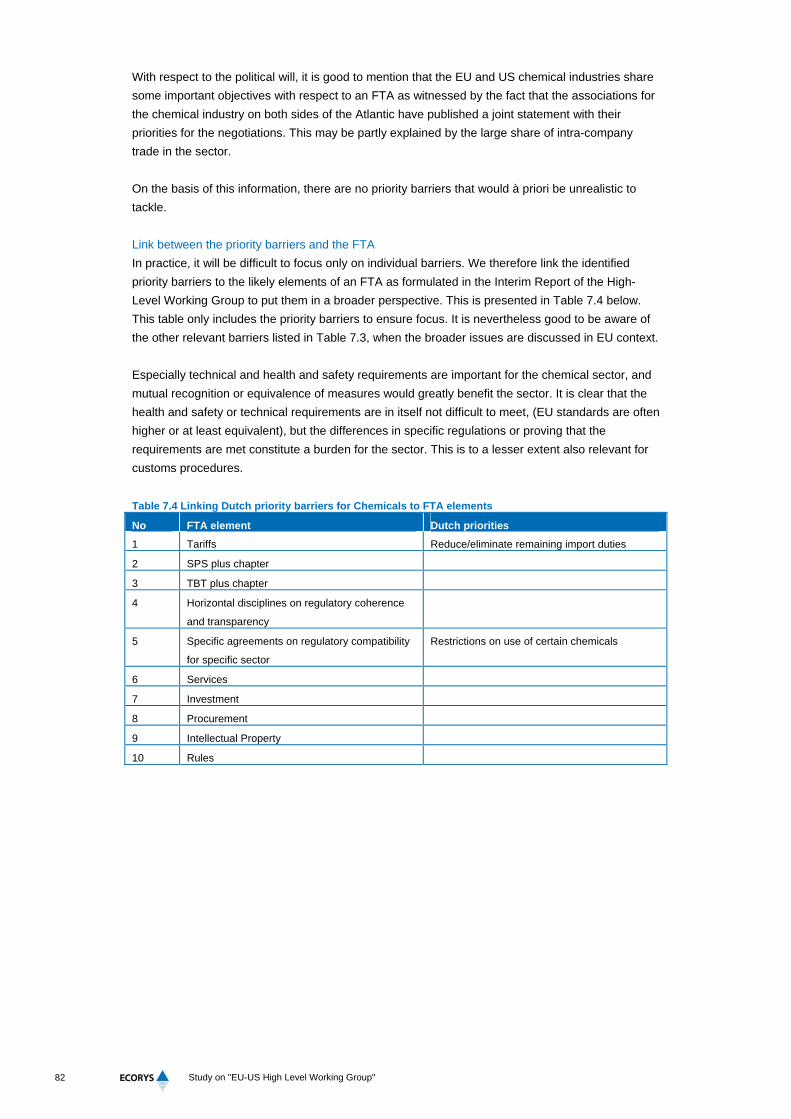
82
Study on "EU-US High Level Working Group"
With respect to the political will, it is good to mention that the EU and US chemical industries share
some important objectives with respect to an FTA as witnessed by the fact that the associations for
the chemical industry on both sides of the Atlantic have published a joint statement with their
priorities for the negotiations. This may be partly explained by the large share of intra-company
trade in the sector.
On the basis of this information, there are no priority barriers that would à priori be unrealistic to
tackle.
Link between the priority barriers and the FTA
In practice, it will be difficult to focus only on individual barriers. We therefore link the identified
priority barriers to the likely elements of an FTA as formulated in the Interim Report of the High-
Level Working Group to put them in a broader perspective. This is presented in Table 7.4 below.
This table only includes the priority barriers to ensure focus. It is nevertheless good to be aware of
the other relevant barriers listed in Table 7.3, when the broader issues are discussed in EU context.
Especially technical and health and safety requirements are important for the chemical sector, and
mutual recognition or equivalence of measures would greatly benefit the sector. It is clear that the
health and safety or technical requirements are in itself not difficult to meet, (EU standards are often
higher or at least equivalent), but the differences in specific regulations or proving that the
requirements are met constitute a burden for the sector. This is to a lesser extent also relevant for
customs procedures.
Table 7.4 Linking Dutch priority barriers for Chemicals to FTA elements
No FTA element Dutch priorities
1 Tariffs Reduce/eliminate remaining import duties
2 SPS plus chapter
3 TBT plus chapter
4 Horizontal disciplines on regulatory coherence
and transparency
5 Specific agreements on regulatory compatibility
for specific sector
Restrictions on use of certain chemicals
6 Services
7 Investment
8 Procurement
9 Intellectual Property
10 Rules

83
Study on "EU-US High Level Working Group"
8 Policy recommendations
This study has first assessed the expected impact of an EU-US FTA for the Netherlands. All
sources consulted clearly indicate that a potential EU-US FTA would yield positive results in terms
of welfare in all three country-blocs (EU, US and NL). For the Netherlands the yearly change in
national income is estimated to be in the range of 1.4 to 4 billion Euros in the long run, depending
on the model used and liberalisation scenario assumed as explained in chapter 3. Trade is also
expected to be impacted positively by such an agreement. The results of the study therefore
confirm the economic incentive to enter into negotiations for an EU-US FTA for the Netherlands.
On the basis of a number of selection criteria, three top sectors were selected for more detailed
analysis and prioritisation of the prevailing trade barriers: Agrofood & Horticulture(AF&H), High tech
systems and materials (HTSM), and Chemicals. Although it is clear that all of these sectors have
their own specificities and therefore their own relevant trade barriers, there are also a number of
common characteristics with respect to the trade barriers.
What has become clear from the interviews and desk study is that the differences in regulations
and standards (whether they relate to health and safety or technical measures) pose a major
burden to Dutch exporters. The problem is usually not that the standards are difficult to meet (many
indicate that EU standards are even higher or at least equal), but that there are differences between
EU and US standards, which cause additional costs and prevent economies of scale, and/or that
efforts are needed to prove compliance with the US standards and requirements. The lack of
transparency on the requirements itself (e.g. the quarantaine list relevant for a.o. plant propogation
material) or the process to get approval for certain exports or investment to the US (Product Risk
Assessments, licenses for certain chemicals) also causes uncertainty and extra costs for Dutch
companies.
It should be stressed that many of the barriers have a long history and/or are part of the culture in
the US, and they are unlikely to be eliminated completely. Rather, the goal should be to increase
transparency, simplify procedures and reduce the time needed for approval processes, etc. In this
respect, it should be noted that the issue of newly arising or potential future barriers may be more
pertinent. These may be easier to address if done so in a timely manner.
In addition to these NTMs, tariffs are also identified as priority barriers for AF&H and Chemicals
sectors. Although in general they are already low, for some specific products they can be higher
and especially in subsectors where margins are small, tariff elimination can still be important. For
the Chemicals sector the issue is especially important from the perspective of intra-company trade.
Before going into the sector-specific recommendations we note that while the EU-US negotiations
form an important platform for addressing the existing and potential trade barriers, other forms of
trade diplomacy should be practiced in parallel to these negotiations. Such trade diplomacy should
particularly involve local stakeholders (EU and Dutch industry associations, Netherlands Embassy,
EU Delegation, locally operative companies, etc.), as they tend to have a better insight into behind
the border issues, particularly as regards potential new barriers.
In this regard, and given that this study has focused on stakeholder in the Netherlands, it would
also be worthwhile to consult relevant US stakeholders, to get a better understanding of the areas
where progress could be made.

84
Study on "EU-US High Level Working Group"
Sector-specific barriers
Next to the barriers mentioned above, we identified other barriers that are more sector-specific or
considered less of a general priority. The following comments can be made for the three sectors.
For Agrofood and horticulture (AF&H), most barriers relate to the broader areas of customs and
border measures (tariffs) and health & safety requirements. The latter primarily relate to SPS
measures which clearly constitute the main non-tariff barrier for trade with the US.67 Mutual
recognition or harmonisation of standards would therefore help to increase market access to the
US. However, this will not be easy to achieve. Some barriers, like the ban on beef due to BSE, are
unlikely to be removed, also given the EU measures in the sector. It will be important to be aware of
the EU barriers to US products in order to assess what could be offered to the US in return for
removing certain barriers. Although this applies to all sectors, it is especially relevant for the AF&H
sector, given the support and protection this sector gets in the EU (notably through the Common
Agricultural Policy).
For High Tech Systems & Materials (HTSM), a large part of the relevant barriers (including
restrictions and prohibitions) are taken on the grounds of national security. As there are many dual
use products in the sector, these barriers have a significant effect. It will be very difficult if not
impossible to remove these barriers, rather the focus should be on facilitating procedures, and
increasing transparency and exchange of information. For a number of products in the sector, US
standards also differ from EU or even international standards. Also here it would be good to come
to harmonisation or mutual recognition of standards. Increase in access to the market for
government procurement is also relevant for the HTSM sector.
For Chemicals, next to tariffs, technical and health and safety requirements are important, and
mutual recognition or equivalence of measures would greatly benefit the sector. It is also worth
mentioning that stakeholders have pointed to an unequal playing field between the EU and the US
due to EU policies, like the sugar quota which drive up sugar prices (sugar is an important input for
the chemical industry) and the relatively more strict rules in the EU for state aid compared to the
US.
The top priority elements for the three top sectors as explained in the respective chapters (5-7) and
their links to the elements for negotiations according the High-Level Working Group Interim Report
are summarised in the table below. It should be noted that there are other relevant barriers that
could be solved through an FTA, but this table only contains the top priorities in order to ensure
focus. The ones that will be extremely difficult to tackle are presented in Italics.
Table 7.5 Linking Dutch priority barriers for the selected top sectors to FTA elements
FTA element Dutch priorities
Tariffs Reduce/eliminate remaining import duties (AF&H, Chemicals), especially in
subsectors where they matter most (highest tariffs and/or small margins)
(AF&H).
SPS plus chapter Overall: Harmonisation / mutual recognition of technical standards. Specific:
Dairy Grade A (AF&H);
Ban on beef (BSE) (AF&H).
TBT plus chapter
Horizontal disciplines on
regulatory coherence and
transparency
Certification system (HTMS);
Harmonisation, mutual recognition and transparency (HTMS);
Improvement of system for control of trade and investments in sensitive
67 Differences in EU-US SPS measures are not given the highest priority, but medium priority, which can be explained by the
fact that that there are also other, more specific SPS related barriers included in the table.

85
Study on "EU-US High Level Working Group"
FTA element Dutch priorities
goods and services (including licensing) (HTMS);
Differences in regulations between States (AF&H).
Specific agreements on
regulatory compatibility for
specific sector
Dual use products & export controls (HTMS);
Restrictions on use of certain chemicals (Chemicals);
Harmonisation / mutual recognition of technical standards (HTMS).
Services
Investment Improve transparency of process of approval (HTMS).
Procurement Increase access to US government contracts (HTMS).
Intellectual Property Harmonisation and transparency improvement of system (HTMS).
Rules Custom & border procedures (AF&H);
Import licenses (AF&H, HTSM).
It should be noted that these are important barriers with or without an FTA. For a number of issues,
there are already initiatives to reduce some of these barrier for EU and Dutch companies (e.g. in
the TransAtlantic Economic Council (TEC)) and it is important to support these initiatives next to the
possible FTA negotiations.


87
Study on "EU-US High Level Working Group"
Annex A – Detailed CGE results
A.1 CGE results from Ecorys (2009) “The impact of FTAs in the OECD”
The tables below present the CGE modelling results of the impact of an EU – US FTA. The indicators that are used in the study include changes in output,
changes in exports, changes in producer prices, changes in skilled labour employment and changes in unskilled labour employment.
Table A.1 Output effects of EU-US FTA on all industries, % change
Sectors
NL EU26 US JP AUS/NZ BRIC ROW
SR LR SR LR SR LR SR LR SR LR SR LR SR LR
1 Chemicals, rubber, and plastics 0.0 0.2 0.0 0.2 0.0 0.1 -0.1 -0.1 -0.1 -0.1 -0.1 -0.1 -0.1 -0.2
2 Other machinery and equipment -0.5 0.1 0.4 0.7 -1.3 -1.1 0.5 0.5 0.0 0.1 0.0 0.0 0.0 -0.2
3 Petro-chemicals 1.6 1.7 0.4 0.5 -0.3 -0.2 0.0 0.0 0.0 0.0 0.0 -0.1 0.0 -0.1
4 Electrical machinery and equipment -2.1 -0.1 -2.4 -1.3 4.8 6.3 0.4 0.5 -0.5 0.0 -0.3 -0.7 -0.6 -0.7
5 Processed foods, n.e.c. -0.3 -0.1 0.0 0.2 0.2 0.2 0.0 0.0 -0.1 -0.1 0.0 0.0 0.0 0.0
6 Iron and steel 4.2 5.6 -0.1 0.2 -1.1 -0.8 -0.1 -0.1 0.2 0.3 0.1 0.0 0.1 -0.1
7 Motor vehicles -4.0 -2.9 0.9 1.2 0.9 1.2 -2.0 -2.2 1.2 1.4 0.2 0.1 -1.0 -1.3
8 Crops, n.e.c. (except grains) -1.3 -1.3 -1.5 -1.5 3.3 3.4 0.1 0.0 -0.4 -0.4 -0.2 -0.1 -0.2 -0.2
9 Vegetables and fruits 1.2 1.1 -0.1 -0.1 -0.2 -0.3 0.0 0.0 0.0 -0.1 0.0 0.0 0.0 0.0
10 Fabricated metals 0.3 0.7 0.1 0.4 -0.4 -0.2 0.1 0.1 0.0 0.0 0.1 0.1 0.2 0.1
11 Beverages and tobacco 1.7 2.1 0.1 0.2 -0.1 0.0 0.0 0.0 -0.1 -0.1 0.0 0.0 0.0 -0.1
12 Non-ferrous metals -0.2 0.2 -0.4 -0.1 0.4 0.6 0.0 0.0 -0.2 -0.2 0.0 0.0 0.0 0.0
13 Vegetables oils 0.5 0.7 0.1 0.3 -0.6 -0.6 0.0 0.0 0.0 0.0 0.0 0.1 0.0 0.0
14 Paper, pulp, and publishing 0.2 0.4 -0.1 0.2 -0.2 -0.1 0.1 0.1 0.0 0.0 0.1 0.0 0.2 0.2
15 Textiles 0.7 1.1 0.8 1.1 0.0 0.1 0.4 0.3 -0.4 -0.5 -0.2 -0.1 -0.2 -0.4
16 Dairy products 2.2 2.5 1.5 1.6 -3.7 -3.6 0.1 0.0 -0.2 -0.2 0.0 0.0 0.0 0.0
17 Manufactures, n.e.c. -0.6 -0.6 0.3 0.6 0.2 0.1 0.1 0.0 -0.1 -0.1 -0.1 -0.1 -0.1 -0.2
18 Meats, except beef -2.6 -2.4 -3.9 -3.8 4.0 4.0 0.2 0.2 -0.1 -0.1 0.1 0.1 0.2 0.2
19 Other transport equipment -4.1 -3.6 -3.5 -3.1 3.2 3.3 -0.2 -0.1 0.2 0.2 0.1 0.1 -0.7 -0.9
20 Clothing -0.2 0.2 -0.2 0.1 17.5 16.7 0.2 0.1 -0.2 -0.3 -0.4 -0.3 -0.1 -0.3

88
Study on "EU-US High Level Working Group"
Sectors
NL EU26 US JP AUS/NZ BRIC ROW
SR LR SR LR SR LR SR LR SR LR SR LR SR LR
21 Oil, gas, and coal 0.0 0.0 0.0 0.0 0.0 0.0 0.0 0.0 0.0 0.0 0.0 0.0 0.0 0.0
22 Wood products 0.1 0.4 0.1 0.4 -0.5 -0.3 0.2 0.2 0.0 0.0 0.2 0.2 0.3 0.3
23 Other goods 0.1 0.3 0.1 0.2 -0.7 -0.6 0.1 0.0 -0.1 -0.1 0.1 0.1 0.1 0.0
24 Utilities 0.1 0.4 0.0 0.2 0.1 0.2 0.0 0.0 0.0 0.0 0.0 0.0 0.0 -0.1
25 Construction 0.0 0.5 0.0 0.4 0.1 0.3 0.0 0.0 0.0 0.0 0.0 -0.1 0.0 -0.1
26 Retail and wholesale trade and warehousing -0.1 0.2 0.0 0.3 0.1 0.2 0.0 0.0 0.0 0.0 0.0 -0.1 0.0 -0.1
27 Transport services 0.6 0.7 0.1 0.3 0.0 0.1 0.2 0.1 0.0 0.0 0.1 0.0 0.2 0.2
28 Communications 0.0 0.3 -0.1 0.1 0.1 0.2 0.0 0.0 0.0 0.0 0.0 0.0 0.1 0.0
29 Other financial services 0.1 0.4 0.3 0.5 -0.2 -0.1 0.0 0.0 0.0 0.0 0.0 -0.1 0.0 0.0
30 Insurance 0.1 0.3 1.6 1.7 -1.5 -1.4 0.0 0.0 0.0 0.0 0.1 0.1 0.1 0.0
31 Other business services 0.1 0.4 -0.1 0.1 0.1 0.2 0.1 0.0 0.0 0.0 0.1 0.0 0.1 0.1
32 Recreational and consumer services 0.0 0.4 -0.1 0.1 0.2 0.2 0.0 0.0 0.0 0.0 0.0 0.0 0.1 0.0
33 Other services (public health, education, residential) 0.0 0.1 0.0 0.1 0.0 0.1 0.0 0.0 0.0 0.0 0.0 0.0 0.0 -0.1

89
Study on "EU-US High Level Working Group"
Table A.2 Export Effects of an EU-US FTA on all Industries, % change
Sectors
NL EU26 US JP AUS/NZ BRIC ROW
SR LR SR LR SR LR SR LR SR LR SR LR SR LR
1 Chemicals, rubber, and plastics 1.4 1.6 1.3 1.5 7.5 7.6 -0.3 -0.3 -0.6 -0.6 -0.5 -0.5 -0.5 -0.5
2 Other machinery and equipment 1.0 1.7 2.1 2.4 4.4 4.6 0.6 0.6 -0.4 -0.3 -0.1 -0.1 -0.2 -0.4
3 Petro-chemicals 2.9 3.1 2.6 2.7 3.0 3.1 -0.2 -0.2 -0.1 -0.1 -0.2 -0.1 -0.2 -0.2
4 Electrical machinery and equipment -2.0 -0.1 -1.9 -0.8 9.5 11.1 0.6 0.7 -0.8 -0.4 -0.6 -1.1 -0.7 -0.7
5 Processed foods, n.e.c. 1.0 1.2 1.3 1.4 9.4 9.4 0.1 0.0 -0.2 -0.3 -0.1 0.0 0.0 -0.1
6 Iron and steel 4.8 6.1 0.2 0.5 -0.4 -0.2 -0.1 0.0 -0.1 0.1 0.1 0.2 0.2 0.0
7 Motor vehicles -4.4 -3.3 2.1 2.5 8.3 8.6 -3.7 -4.1 1.1 1.2 0.2 0.2 -1.8 -2.1
8 Crops, n.e.c. (except grains) 2.7 2.6 7.5 7.3 53.7 53.9 -1.3 -1.3 -1.3 -1.3 -1.3 -1.2 -1.5 -1.4
9 Vegetables and fruits 0.9 0.9 -0.1 -0.1 0.6 0.5 0.0 -0.1 -0.2 -0.2 -0.1 -0.1 -0.1 -0.1
10 Fabricated metals 1.6 1.9 1.9 2.1 5.8 5.7 0.5 0.6 -0.1 0.1 0.4 0.6 0.4 0.5
11 Beverages and tobacco 2.3 2.7 0.9 1.0 7.0 7.0 -0.1 -0.1 -0.3 -0.4 -0.1 -0.2 -0.2 -0.2
12 Non-ferrous metals 0.0 0.3 0.6 0.9 7.5 7.5 0.1 0.1 -0.4 -0.4 -0.2 -0.1 -0.1 -0.1
13 Vegetables oils 0.8 0.9 1.5 1.6 2.3 2.2 -0.6 -0.5 -0.3 -0.3 0.0 0.1 -0.1 -0.1
14 Paper, pulp, and publishing 0.8 0.9 0.3 0.5 1.0 1.0 0.4 0.4 0.0 0.0 0.5 0.5 0.4 0.5
15 Textiles 2.6 3.1 2.7 3.0 6.2 6.2 0.4 0.3 -0.8 -0.8 -0.4 -0.2 -0.4 -0.6
16 Dairy products 6.3 6.5 11.4 11.5 45.2 45.3 * * -0.6 -0.6 -0.5 -0.5 -0.4 -0.4
17 Manufactures, n.e.c. 0.5 0.2 4.1 4.5 9.5 9.3 0.0 0.0 -0.6 -0.6 -0.5 -0.4 -0.6 -0.7
18 Meats, except beef -2.7 -2.5 -2.9 -2.8 35.8 35.5 -1.8 -1.8 -1.4 -1.4 -0.4 -0.3 0.0 0.0
19 Other transport equipment -3.2 -2.7 -1.7 -1.3 12.5 12.5 -0.6 -0.4 -0.8 -0.6 -0.4 -0.3 -1.5 -1.5
20 Clothing 0.5 0.9 1.0 1.3 32.3 31.4 0.5 0.4 -0.4 -0.4 -0.7 -0.6 0.1 -0.2
21 Oil, gas, and coal -0.3 -0.2 3.7 3.7 5.3 5.3 * * -0.1 0.0 0.1 0.4 -0.1 0.0
22 Wood products 0.9 1.1 1.0 1.2 2.5 2.4 0.4 0.5 -0.1 -0.1 0.4 0.7 0.4 0.6
23 Other goods 0.8 0.9 1.3 1.3 1.4 1.3 0.1 0.0 -0.1 -0.2 -0.1 -0.1 -0.1 -0.1
24 Utilities 0.3 0.6 -0.3 -0.1 -1.0 -0.8 0.4 0.4 0.1 0.1 0.5 0.4 0.3 0.3
25 Construction 0.3 0.4 -0.1 0.0 1.1 1.0 0.3 0.4 -0.2 -0.2 0.2 0.4 0.2 0.3
26 Retail and wholesale trade and warehousing 0.2 0.3 0.0 0.1 1.5 1.5 0.4 0.5 0.1 0.1 0.4 0.5 0.3 0.3
27 Transport services 0.8 0.9 0.6 0.7 1.3 1.3 0.7 0.7 0.2 0.3 0.5 0.6 0.5 0.6
28 Communications 0.4 0.6 0.3 0.4 7.1 7.3 0.4 0.4 0.1 0.1 0.5 0.5 0.5 0.5
29 Other financial services 2.5 2.5 5.8 5.9 10.1 10.1 0.5 0.7 0.1 0.2 0.3 0.5 0.4 0.5

90
Study on "EU-US High Level Working Group"
Sectors
NL EU26 US JP AUS/NZ BRIC ROW
SR LR SR LR SR LR SR LR SR LR SR LR SR LR
30 Insurance 1.6 1.7 7.5 7.6 2.8 2.7 -0.1 0.0 -0.6 -0.5 -0.1 0.0 -0.4 -0.3
31 Other business services 0.8 0.9 0.5 0.7 7.6 7.4 0.6 0.6 0.1 0.2 0.4 0.5 0.4 0.4
32 Recreational and consumer services 0.4 0.6 0.0 0.1 1.7 1.7 0.4 0.3 0.1 0.1 0.3 0.4 0.3 0.4
33 Other services (public health, education, residential) 0.3 0.2 -0.3 -0.4 -0.9 -0.9 0.6 0.6 0.1 0.2 0.5 0.6 0.5 0.6

91
Study on "EU-US High Level Working Group"
Table A.3 Producer Price Effects of an EU-US FTA on all Industries, % change
Sectors
NL EU26 US JP AUS/NZ BRIC ROW
SR LR SR LR SR LR SR LR SR LR SR LR SR LR
1 Chemicals, rubber, and plastics -0.2 -0.2 0.0 0.0 0.0 0.0 -0.1 -0.1 0.0 0.0 -0.1 -0.1 -0.1 -0.1
2 Other machinery and equipment 0.0 -0.1 0.0 0.0 0.3 0.3 -0.2 -0.2 0.0 0.0 -0.1 -0.1 -0.1 0.0
3 Petro-chemicals -0.2 -0.2 -0.1 0.0 -0.1 -0.1 -0.1 0.0 -0.1 0.0 -0.1 0.0 -0.1 0.0
4 Electrical machinery and equipment 0.2 0.0 0.3 0.2 -0.5 -0.7 -0.2 -0.2 0.0 0.0 0.0 0.1 0.0 0.0
5 Processed foods, n.e.c. -0.1 -0.2 0.0 0.0 0.1 0.1 -0.1 -0.1 0.0 0.0 -0.1 -0.1 -0.1 -0.1
6 Iron and steel -0.9 -1.2 0.1 0.0 0.3 0.3 -0.1 -0.1 -0.1 -0.1 -0.1 -0.1 -0.1 0.0
7 Motor vehicles 0.8 0.6 -0.2 -0.3 -0.1 -0.2 0.4 0.5 -0.3 -0.3 -0.1 -0.1 0.2 0.3
8 Crops, n.e.c. (except grains) -1.0 -0.9 -0.5 -0.5 1.6 1.7 -0.1 -0.1 -0.2 -0.2 -0.2 -0.2 -0.2 -0.2
9 Vegetables and fruits -0.5 -0.5 -0.2 -0.1 0.4 0.4 -0.1 -0.1 -0.1 -0.1 -0.1 -0.1 -0.1 -0.1
10 Fabricated metals -0.1 -0.1 0.1 0.1 0.2 0.2 -0.1 -0.1 0.0 0.0 -0.1 -0.1 -0.1 -0.1
11 Beverages and tobacco -1.6 -1.9 -0.1 -0.2 0.2 0.2 -0.1 -0.1 0.0 0.1 -0.1 -0.1 -0.1 0.0
12 Non-ferrous metals -0.1 0.0 0.0 0.0 0.1 0.1 -0.1 -0.1 0.0 0.0 -0.1 -0.1 -0.1 -0.1
13 Vegetables oils -0.1 -0.1 0.0 0.1 0.1 0.1 -0.1 -0.1 0.0 0.0 -0.1 -0.1 -0.1 -0.1
14 Paper, pulp, and publishing 0.0 0.0 0.1 0.1 0.2 0.2 -0.1 -0.1 0.0 0.0 -0.1 -0.1 -0.1 -0.1
15 Textiles -0.2 -0.3 -0.1 -0.1 0.1 0.1 -0.2 -0.2 0.0 0.0 -0.1 -0.1 -0.1 0.0
16 Dairy products -0.1 -0.1 0.1 0.1 -0.2 -0.2 -0.1 -0.1 0.0 0.0 -0.1 -0.1 -0.1 -0.1
17 Manufactures, n.e.c. 0.0 0.1 0.0 0.0 0.1 0.2 -0.1 -0.1 0.0 0.0 -0.1 -0.1 -0.1 0.0
18 Meats, except beef -0.2 -0.2 0.0 0.0 0.3 0.3 -0.1 -0.1 0.0 0.0 -0.1 -0.1 -0.1 -0.1
19 Other transport equipment 0.4 0.4 0.4 0.4 -0.2 -0.1 -0.1 -0.1 0.0 0.0 -0.1 -0.1 0.0 0.1
20 Clothing 0.0 0.0 0.1 0.1 -2.0 -1.9 -0.2 -0.1 0.0 0.0 0.0 0.0 -0.1 0.0
21 Oil, gas, and coal 0.0 0.1 0.1 0.2 -0.1 0.0 -0.1 0.0 -0.1 0.0 -0.1 0.0 -0.1 0.0
22 Wood products 0.0 0.0 0.1 0.1 0.1 0.2 -0.1 -0.1 0.0 0.0 -0.1 -0.1 -0.1 -0.1
23 Other goods -0.2 -0.1 0.0 0.1 0.1 0.1 -0.1 -0.1 -0.1 -0.1 -0.1 -0.1 -0.1 -0.1
24 Utilities 0.0 -0.1 0.1 0.1 0.2 0.1 -0.1 -0.1 0.0 0.0 -0.1 -0.1 -0.1 -0.1
25 Construction -0.1 0.0 0.1 0.1 0.2 0.3 -0.1 -0.1 0.0 0.0 -0.1 -0.1 -0.1 -0.1
26 Retail and wholesale trade and warehousing 0.0 0.0 0.1 0.1 0.3 0.3 -0.1 -0.1 0.0 0.0 -0.1 -0.1 -0.1 -0.1
27 Transport services -0.1 -0.1 0.1 0.1 0.1 0.1 -0.1 -0.1 0.0 0.0 -0.1 -0.1 -0.1 -0.1
28 Communications 0.1 0.0 0.2 0.2 0.3 0.2 -0.1 -0.1 0.0 0.0 -0.1 -0.1 -0.1 -0.1
29 Other financial services 0.0 0.1 0.1 0.2 0.2 0.3 -0.1 -0.1 0.0 0.0 -0.1 -0.1 -0.1 -0.1

92
Study on "EU-US High Level Working Group"
Sectors
NL EU26 US JP AUS/NZ BRIC ROW
SR LR SR LR SR LR SR LR SR LR SR LR SR LR
30 Insurance 0.1 0.1 0.2 0.2 0.1 0.2 -0.1 -0.1 0.0 0.0 -0.1 -0.1 -0.1 -0.1
31 Other business services 0.1 0.0 0.2 0.1 0.3 0.3 -0.1 -0.1 0.0 0.0 -0.1 -0.1 -0.1 -0.1
32 Recreational and consumer services 0.0 0.0 0.1 0.1 0.2 0.2 -0.1 -0.1 0.0 0.0 -0.1 -0.1 -0.1 -0.1
33 Other services (public health, education, residential) 0.0 0.1 0.2 0.3 0.3 0.3 -0.1 -0.1 0.0 0.0 -0.1 -0.1 -0.1 -0.1

93
Study on "EU-US High Level Working Group"
Table A.4 Skilled labour employment, % change
Sectors
NL EU26 US JP AUS/NZ BRIC ROW
SR LR SR LR SR LR SR LR SR LR SR LR SR LR
1 Chemicals, rubber, and plastics 0.0 -0.1 -0.1 -0.1 0.1 0.1 0.0 -0.1 -0.1 -0.1 -0.1 -0.1 -0.1 -0.1
2 Other machinery and equipment -0.5 -0.2 0.4 0.5 -1.2 -1.1 0.5 0.5 0.0 0.1 0.0 0.0 0.1 -0.1
3 Petro-chemicals 1.4 1.1 0.3 0.1 -0.2 -0.3 0.0 0.1 0.0 0.0 0.0 0.0 0.0 0.0
4 Electrical machinery and equipment -2.1 -0.4 -2.2 -1.4 4.3 5.6 0.4 0.5 -0.5 -0.1 -0.2 -0.5 -0.5 -0.6
5 Processed foods, n.e.c. -0.3 -0.3 0.0 -0.1 0.2 0.1 0.0 0.0 -0.1 -0.1 0.0 0.0 0.0 0.0
6 Iron and steel 3.9 5.0 -0.1 0.0 -1.0 -0.8 -0.1 -0.1 0.1 0.2 0.0 0.1 0.1 0.0
7 Motor vehicles -3.8 -3.0 0.8 1.0 0.9 1.1 -1.9 -2.0 1.1 1.3 0.1 0.1 -0.9 -1.1
8 Crops, n.e.c. (except grains) -1.6 -1.7 -1.8 -1.8 3.9 3.9 0.1 0.1 -0.5 -0.4 -0.2 -0.1 -0.3 -0.2
9 Vegetables and fruits 1.1 0.9 -0.2 -0.3 -0.2 -0.3 0.1 0.0 -0.1 -0.1 0.0 0.0 0.0 0.0
10 Fabricated metals 0.3 0.5 0.1 0.2 -0.3 -0.2 0.1 0.1 0.0 0.0 0.1 0.1 0.1 0.1
11 Beverages and tobacco 1.6 1.5 0.1 -0.1 0.0 -0.2 0.0 0.0 -0.1 -0.1 0.0 0.0 0.0 0.0
12 Non-ferrous metals -0.2 -0.1 -0.4 -0.3 0.4 0.5 0.0 0.0 -0.2 -0.2 0.0 0.0 0.0 0.0
13 Vegetables oils 0.5 0.4 0.1 0.1 -0.6 -0.7 0.0 0.0 0.0 0.0 0.0 0.1 0.0 0.0
14 Paper, pulp, and publishing 0.2 0.1 -0.1 -0.1 -0.2 -0.2 0.1 0.1 0.0 0.0 0.1 0.1 0.2 0.2
15 Textiles 0.6 0.7 0.7 0.8 0.9 0.8 0.5 0.4 -0.4 -0.4 -0.2 -0.1 -0.3 -0.4
16 Dairy products 2.2 2.1 1.4 1.4 -3.6 -3.7 0.1 0.1 -0.2 -0.2 0.0 0.0 0.0 0.0
17 Manufactures, n.e.c. -0.6 -0.8 0.2 0.3 0.3 0.3 0.1 0.1 -0.1 -0.1 -0.1 -0.1 -0.1 -0.2
18 Meats, except beef -2.2 -2.3 -3.4 -3.5 3.7 3.6 0.2 0.2 -0.1 -0.1 0.1 0.1 0.2 0.2
19 Other transport equipment -3.8 -3.5 -3.3 -3.1 3.1 3.1 -0.2 -0.1 0.1 0.2 0.1 0.1 -0.7 -0.8
20 Clothing -0.2 -0.1 -0.3 -0.2 20.7 19.7 0.2 0.2 -0.1 -0.2 -0.6 -0.5 -0.3 -0.4
21 Oil, gas, and coal 0.0 0.0 0.0 0.0 -0.1 -0.1 0.0 0.0 0.0 0.0 0.0 0.0 0.0 0.0
22 Wood products 0.1 0.2 0.1 0.1 -0.5 -0.4 0.2 0.2 0.0 0.0 0.1 0.2 0.2 0.4
23 Other goods 0.0 0.1 0.0 0.1 -0.7 -0.7 0.1 0.1 -0.1 -0.1 0.1 0.1 0.1 0.1
24 Utilities 0.1 -0.1 0.0 -0.1 0.1 -0.1 0.0 0.1 0.0 0.0 0.0 0.0 0.0 0.0
25 Construction 0.0 0.2 0.0 0.1 0.1 0.3 0.0 0.0 0.0 0.0 0.0 0.0 -0.1 -0.1
26 Retail and wholesale trade and warehousing -0.1 -0.2 0.0 -0.1 0.2 0.2 0.0 0.0 0.0 0.0 0.0 0.0 0.0 0.0
27 Transport services 0.5 0.3 0.1 -0.1 0.1 0.0 0.1 0.2 0.0 0.0 0.0 0.1 0.2 0.2
28 Communications 0.1 0.0 -0.1 -0.2 0.2 0.0 0.0 0.0 0.0 0.0 0.0 0.0 0.1 0.1
29 Other financial services 0.1 0.2 0.3 0.3 -0.2 -0.2 0.1 0.1 0.0 0.0 0.0 0.0 0.0 0.0

94
Study on "EU-US High Level Working Group"
Sectors
NL EU26 US JP AUS/NZ BRIC ROW
SR LR SR LR SR LR SR LR SR LR SR LR SR LR
30 Insurance 0.1 0.0 1.5 1.5 -1.4 -1.4 0.0 0.0 0.0 0.0 0.1 0.1 0.1 0.1
31 Other business services 0.1 0.1 -0.2 -0.2 0.1 0.2 0.1 0.1 0.0 0.0 0.0 0.0 0.1 0.1
32 Recreational and consumer services 0.0 0.0 -0.1 -0.2 0.2 0.1 0.0 0.0 0.0 0.0 0.0 0.0 0.1 0.1
33 Other services (public health, education, residential) 0.0 0.0 0.0 0.0 0.1 0.0 0.0 0.0 0.0 0.0 0.0 0.0 0.0 0.0

95
Study on "EU-US High Level Working Group"
Table A.5 Unskilled labour employment, % change
Sectors
NL EU26 US JP AUS/NZ BRIC ROW
SR LR SR LR SR LR SR LR SR LR SR LR SR LR
1 Chemicals, rubber, and plastics 0.1 -0.1 0.0 -0.1 0.0 0.0 -0.1 -0.1 -0.1 -0.1 -0.1 -0.1 -0.1 -0.1
2 Other machinery and equipment -0.5 -0.1 0.4 0.5 -1.3 -1.2 0.5 0.5 0.0 0.1 0.0 0.0 0.1 -0.1
3 Petro-chemicals 1.5 1.2 0.3 0.2 -0.2 -0.4 0.0 0.1 0.0 0.0 0.0 0.0 0.0 0.1
4 Electrical machinery and equipment -2.1 -0.4 -2.2 -1.4 4.2 5.5 0.4 0.5 -0.5 -0.1 -0.2 -0.5 -0.5 -0.6
5 Processed foods, n.e.c. -0.2 -0.3 0.0 -0.1 0.1 0.0 0.0 0.0 -0.1 -0.1 0.0 0.0 0.0 0.0
6 Iron and steel 4.0 5.0 -0.1 0.0 -1.1 -0.9 -0.1 -0.1 0.1 0.2 0.1 0.1 0.1 0.0
7 Motor vehicles -3.7 -3.0 0.9 1.0 0.8 1.0 -1.9 -2.0 1.1 1.3 0.1 0.1 -0.9 -1.1
8 Crops, n.e.c. (except grains) -1.6 -1.7 -1.8 -1.8 3.8 3.9 0.1 0.1 -0.5 -0.4 -0.2 -0.1 -0.3 -0.2
9 Vegetables and fruits 1.1 0.9 -0.2 -0.3 -0.2 -0.3 0.0 0.0 0.0 -0.1 0.0 0.0 0.0 0.0
10 Fabricated metals 0.3 0.5 0.1 0.2 -0.4 -0.3 0.1 0.1 0.0 0.1 0.1 0.1 0.1 0.1
11 Beverages and tobacco 1.6 1.5 0.1 -0.1 -0.1 -0.2 0.0 0.0 -0.1 -0.1 0.0 0.0 0.0 0.0
12 Non-ferrous metals -0.2 -0.1 -0.4 -0.3 0.4 0.4 0.0 0.0 -0.2 -0.2 0.0 0.0 0.0 0.0
13 Vegetables oils 0.5 0.4 0.1 0.1 -0.7 -0.8 0.0 0.0 0.0 0.0 0.0 0.1 0.0 0.1
14 Paper, pulp, and publishing 0.2 0.2 -0.1 -0.1 -0.2 -0.3 0.1 0.1 0.0 0.1 0.1 0.1 0.2 0.2
15 Textiles 0.6 0.8 0.7 0.8 0.9 0.8 0.5 0.4 -0.4 -0.4 -0.2 -0.1 -0.3 -0.4
16 Dairy products 2.2 2.1 1.4 1.4 -3.6 -3.7 0.1 0.1 -0.1 -0.1 0.0 0.0 0.0 0.0
17 Manufactures, n.e.c. -0.5 -0.7 0.2 0.3 0.3 0.2 0.1 0.1 -0.1 -0.1 -0.1 -0.1 -0.1 -0.1
18 Meats, except beef -2.1 -2.2 -3.4 -3.5 3.6 3.6 0.2 0.2 -0.1 -0.1 0.1 0.1 0.2 0.2
19 Other transport equipment -3.8 -3.5 -3.3 -3.1 3.1 3.0 -0.2 -0.1 0.1 0.2 0.1 0.1 -0.6 -0.7
20 Clothing -0.1 -0.1 -0.2 -0.2 20.6 19.6 0.2 0.2 -0.1 -0.2 -0.6 -0.5 -0.3 -0.4
21 Oil, gas, and coal 0.0 0.0 0.0 0.0 -0.1 -0.1 0.0 0.0 0.0 0.0 0.0 0.0 0.0 0.0
22 Wood products 0.2 0.2 0.1 0.1 -0.5 -0.4 0.2 0.2 0.0 0.0 0.1 0.2 0.3 0.4
23 Other goods 0.0 0.1 0.0 0.1 -0.7 -0.8 0.1 0.1 -0.1 -0.1 0.1 0.1 0.1 0.1
24 Utilities 0.2 0.0 0.0 -0.1 0.0 -0.1 0.0 0.0 0.0 0.0 0.0 0.0 0.0 0.0
25 Construction 0.1 0.3 0.0 0.1 0.0 0.2 0.0 0.0 0.0 0.0 0.0 0.0 0.0 0.0
26 Retail and wholesale trade and warehousing -0.1 -0.1 0.0 -0.1 0.1 0.1 0.0 0.0 0.0 0.0 0.0 0.0 0.0 0.0
27 Transport services 0.6 0.3 0.1 0.0 0.0 -0.1 0.1 0.1 0.0 0.1 0.0 0.1 0.2 0.2
28 Communications 0.1 0.0 -0.1 -0.2 0.1 0.0 0.0 0.0 0.0 0.0 0.0 0.0 0.1 0.1
29 Other financial services 0.2 0.2 0.3 0.4 -0.2 -0.2 0.0 0.1 0.0 0.0 0.0 0.0 0.0 0.0

96
Study on "EU-US High Level Working Group"
Sectors
NL EU26 US JP AUS/NZ BRIC ROW
SR LR SR LR SR LR SR LR SR LR SR LR SR LR
30 Insurance 0.1 0.0 1.5 1.5 -1.5 -1.5 0.0 0.0 0.0 0.0 0.1 0.1 0.1 0.1
31 Other business services 0.2 0.1 -0.1 -0.2 0.1 0.1 0.0 0.1 0.0 0.0 0.0 0.0 0.1 0.1
32 Recreational and consumer services 0.1 0.1 -0.1 -0.2 0.1 0.1 0.0 0.0 0.0 0.0 0.0 0.0 0.1 0.1
33 Other services (public health, education, residential) 0.0 0.0 0.0 0.0 0.0 -0.1 0.0 0.0 0.0 0.0 0.0 0.0 0.0 0.0

97
Study on "EU-US High Level Working Group"
A.2 Additional CGE results, based on Ecorys (2010) NTM study specification
Table A.6 Actionable set of NTM’s reduced – Macroeconomic effects
Full
liberalization of
all actionable
NTMs, short
run
Full
liberalization of
all actionable
NTMs, long run
Partial
liberalization of
all actionable
NTMs, short
run
Partial
liberalization of
all actionable
NTMs, long run
Real income, million €
United States 18.992 40.781 7.817 18.343
Netherlands 1.411 4.076 610 1.811
EU26 44.437 117.413 18.738 51.744
Real income, %
United States 0.13 0.28 0.05 0.13
Netherlands 0.25 0.72 0.11 0.32
EU26 0.25 0.73 0.16 0.32
Terms of trade, %
United States -0.15 -0.23 -0.06 -0.10
Netherlands 0.12 0.07 0.05 0.03
EU26 0.11 0.07 0.05 0.03
Change in value added, %
Netherlands -0.02 0.41 -0.01 0.18
EU26 -0.02 0.42 -0.01 0.19
Change in value of exports, %
Netherlands 1.41 1.69 0.63 0.76
EU26 1.64 2.03 0.72 0.88
Change in value of imports, %
Netherlands 1.45 1.83 0.64 0.80
EU26 1.64 2.01 0.72 0.88

98
Study on "EU-US High Level Working Group"
Table A.7 Actionable set of NTM’s reduced – Percentage change in output
NLD value added
share, %
E26 value added
share, %
Full liberalization of
all actionable NTMs
Short run
Full liberalization of
all actionable NTMs
Long run
Partial liberalization
of all actionable
NTMs Short run
Partial liberalization
of all actionable
NTMs Long run
Agr, forestry, fisheries 2.6 2.1 0.0 -0.1 0.0 0.0
Other primary sectors 1.7 0.7 0.0 0.0 0.0 0.0
Processed foods 3.6 3.0 0.6 0.9 0.3 0.4
Chemicals 2.2 3.1 1.6 2.2 0.7 1.0
Electrical machinery 0.4 0.4 -7.5 -5.5 -3.0 -2.1
Motor vehicles 0.5 1.7 5.1 5.7 2.0 2.3
Other transport equipment 0.7 0.6 -1.1 -0.9 -0.5 -0.4
Other machinery 1.8 4.1 -2.3 -1.9 -1.0 -0.8
Metals and metal products 1.8 2.3 -1.0 -0.5 -0.4 -0.2
Wood and paper products 2.7 2.4 -0.4 0.0 -0.2 0.0
Other manufactures 2.4 3.3 -0.4 0.1 -0.2 0.1
Water transport 0.6 0.4 0.3 0.5 0.1 0.2
Air transport 0.5 0.4 -0.1 0.3 0.0 0.1
Finance 2.5 3.4 0.0 0.4 0.0 0.2
Insurance 1.5 0.9 0.9 1.2 0.4 0.6
Business services 26.8 23.6 0.0 0.5 0.0 0.2
Communications 2.7 2.4 -0.3 0.2 -0.1 0.1
Construction 10.2 8.1 0.3 0.8 0.1 0.4
Personal services 3.5 3.5 -0.6 -0.1 -0.2 0.0
Other services 31.2 33.7 0.0 0.4 0.0 0.2
Total NLD 100.0 0.0 0.4 0.0 0.2
Total E26 100.0 0.0 0.4 0.0 0.2
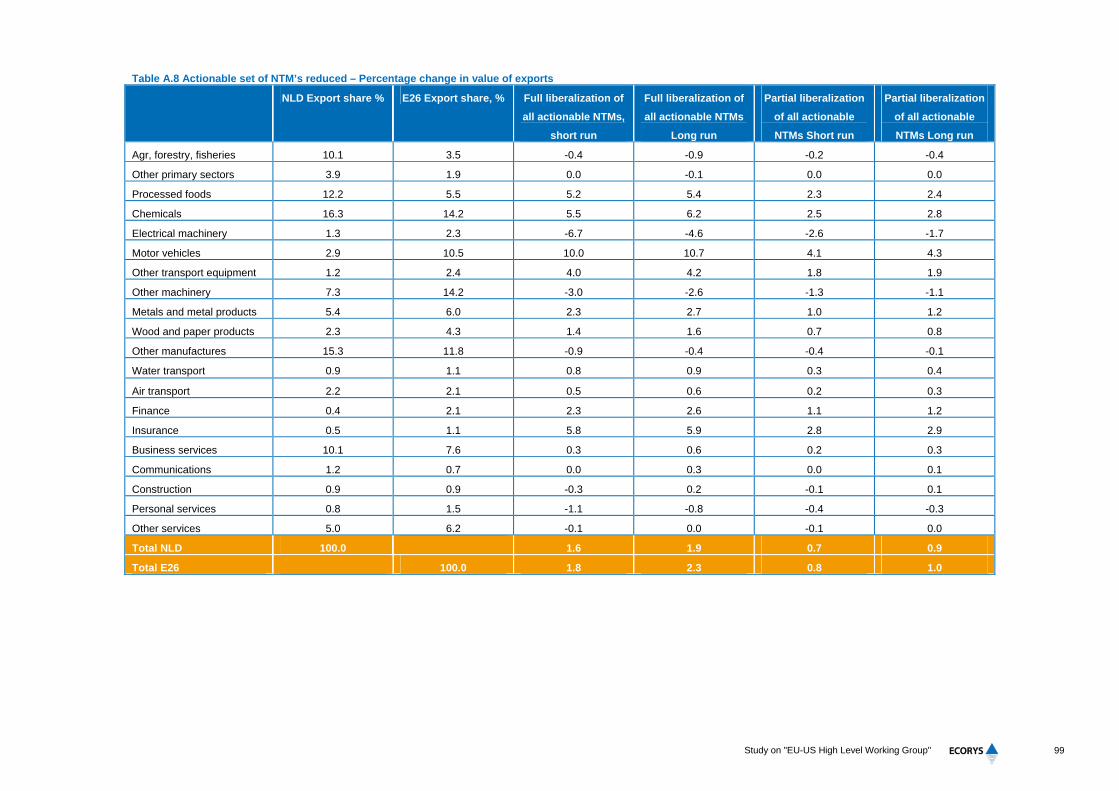
99
Study on "EU-US High Level Working Group"
Table A.8 Actionable set of NTM’s reduced – Percentage change in value of exports
NLD Export share % E26 Export share, % Full liberalization of
all actionable NTMs,
short run
Full liberalization of
all actionable NTMs
Long run
Partial liberalization
of all actionable
NTMs Short run
Partial liberalization
of all actionable
NTMs Long run
Agr, forestry, fisheries 10.1 3.5 -0.4 -0.9 -0.2 -0.4
Other primary sectors 3.9 1.9 0.0 -0.1 0.0 0.0
Processed foods 12.2 5.5 5.2 5.4 2.3 2.4
Chemicals 16.3 14.2 5.5 6.2 2.5 2.8
Electrical machinery 1.3 2.3 -6.7 -4.6 -2.6 -1.7
Motor vehicles 2.9 10.5 10.0 10.7 4.1 4.3
Other transport equipment 1.2 2.4 4.0 4.2 1.8 1.9
Other machinery 7.3 14.2 -3.0 -2.6 -1.3 -1.1
Metals and metal products 5.4 6.0 2.3 2.7 1.0 1.2
Wood and paper products 2.3 4.3 1.4 1.6 0.7 0.8
Other manufactures 15.3 11.8 -0.9 -0.4 -0.4 -0.1
Water transport 0.9 1.1 0.8 0.9 0.3 0.4
Air transport 2.2 2.1 0.5 0.6 0.2 0.3
Finance 0.4 2.1 2.3 2.6 1.1 1.2
Insurance 0.5 1.1 5.8 5.9 2.8 2.9
Business services 10.1 7.6 0.3 0.6 0.2 0.3
Communications 1.2 0.7 0.0 0.3 0.0 0.1
Construction 0.9 0.9 -0.3 0.2 -0.1 0.1
Personal services 0.8 1.5 -1.1 -0.8 -0.4 -0.3
Other services 5.0 6.2 -0.1 0.0 -0.1 0.0
Total NLD 100.0 1.6 1.9 0.7 0.9
Total E26 100.0 1.8 2.3 0.8 1.0

100
Study on "EU-US High Level Working Group"
Table A.9 Actionable set of NTM’s reduced - Change in value of exports, million €, EU 26
Full
liberalization of
all actionable
NTMs, short run
Full
liberalization of
all actionable
NTMs, long run
Partial
liberalization of
all actionable
NTMs, short run
Partial
liberalization of
all actionable
NTMs, long run
Agr, forestry, fisheries -1.257 -2.654 -536 -1.171
Other primary sectors 17 -132 5 -54
Processed foods 18.200 18.961 8.052 8.388
Chemicals 46.108 51.583 20.722 23.053
Electrical machinery -10.341 -7.072 -4.035 -2.585
Motor vehicles 65.544 69.898 26.639 28.319
Other transport equipment 6.735 7.098 3.055 3.221
Other machinery -23.982 -20.560 -10.339 -8.848
Metals and metal products 5.477 6.459 2.273 2.713
Wood and paper products 3.797 4.519 1.879 2.194
Other manufactures -7.532 -3.152 -3.200 -1.220
Water transport 507 557 221 243
Air transport 526 739 268 363
Finance 2.116 2.338 1.017 1.114
Insurance 4.371 4.487 2.124 2.173
Business services 1.389 2.805 740 1.361
Communications 17 119 12 57
Construction -138 83 -56 43
Personal services -1.150 -875 -460 -339
Other services -472 -21 -207 -10
Total 109.932 135.179 48.174 59.018

101
Study on "EU-US High Level Working Group"
Table A.10 Actionable set of NTM’s reduced - Change in value of exports, million €, Netherlands
Full
liberalization of
all actionable
NTMs, short run
Full
liberalization of
all actionable
NTMs, long run
Partial
liberalization of
all actionable
NTMs, short run
Partial
liberalization of
all actionable
NTMs, long run
Agr, forestry, fisheries -248 -524 -106 -231
Other primary sectors 2 -16 1 -7
Processed foods 2.645 2.755 1.170 1.219
Chemicals 3.446 3.855 1.549 1.723
Electrical machinery -392 -268 -153 -98
Motor vehicles 1.166 1.243 474 504
Other transport equipment 216 228 98 103
Other machinery -813 -697 -351 -300
Metals and metal products 324 382 134 160
Wood and paper products 135 160 67 78
Other manufactures -637 -267 -271 -103
Water transport 28 30 12 13
Air transport 36 51 18 25
Finance 24 26 11 12
Insurance 108 111 53 54
Business services 120 243 64 118
Communications 2 12 1 6
Construction -8 5 -3 3
Personal services -39 -30 -16 -11
Other services -25 -1 -11 -1
Total 6.088 7.299 2.742 3.267
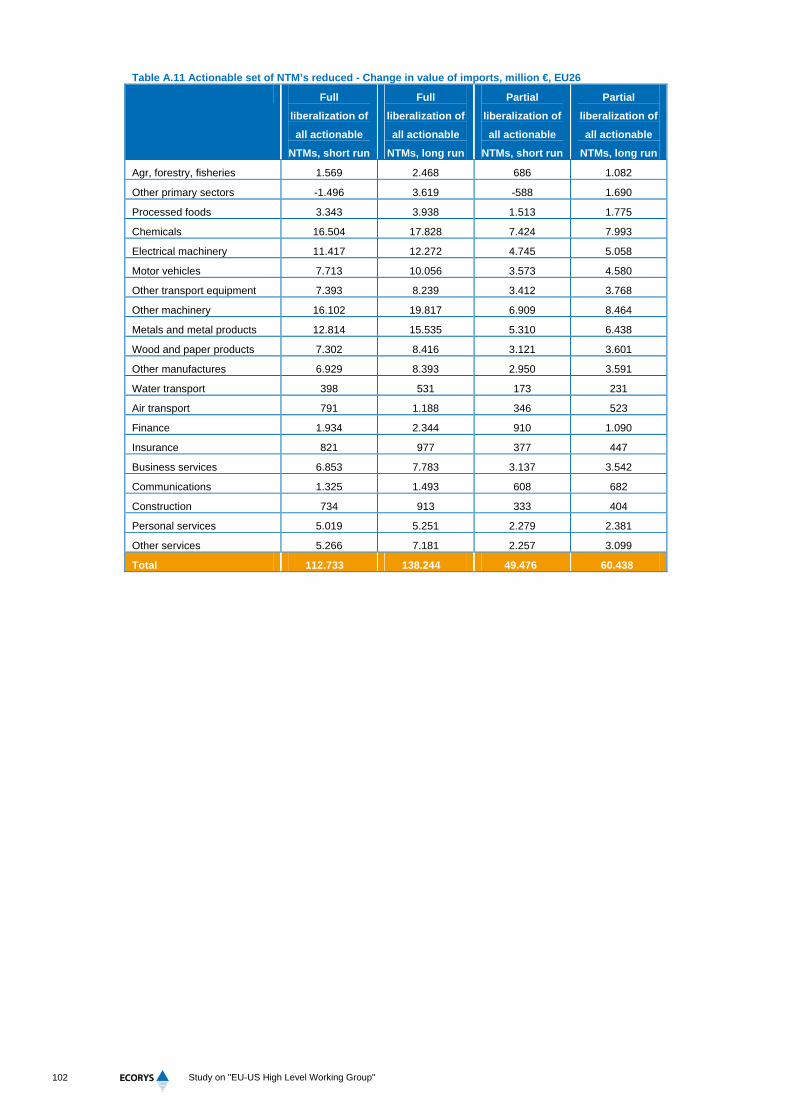
102
Study on "EU-US High Level Working Group"
Table A.11 Actionable set of NTM’s reduced - Change in value of imports, million €, EU26
Full
liberalization of
all actionable
NTMs, short run
Full
liberalization of
all actionable
NTMs, long run
Partial
liberalization of
all actionable
NTMs, short run
Partial
liberalization of
all actionable
NTMs, long run
Agr, forestry, fisheries 1.569 2.468 686 1.082
Other primary sectors -1.496 3.619 -588 1.690
Processed foods 3.343 3.938 1.513 1.775
Chemicals 16.504 17.828 7.424 7.993
Electrical machinery 11.417 12.272 4.745 5.058
Motor vehicles 7.713 10.056 3.573 4.580
Other transport equipment 7.393 8.239 3.412 3.768
Other machinery 16.102 19.817 6.909 8.464
Metals and metal products 12.814 15.535 5.310 6.438
Wood and paper products 7.302 8.416 3.121 3.601
Other manufactures 6.929 8.393 2.950 3.591
Water transport 398 531 173 231
Air transport 791 1.188 346 523
Finance 1.934 2.344 910 1.090
Insurance 821 977 377 447
Business services 6.853 7.783 3.137 3.542
Communications 1.325 1.493 608 682
Construction 734 913 333 404
Personal services 5.019 5.251 2.279 2.381
Other services 5.266 7.181 2.257 3.099
Total 112.733 138.244 49.476 60.438

103
Study on "EU-US High Level Working Group"
Table A.12 Actionable set of NTM’s reduced - Change in value of imports, million €, The Netherlands
Full
liberalization of
all actionable
NTMs, short run
Full
liberalization of
all actionable
NTMs, long run
Partial
liberalization of
all actionable
NTMs, short run
Partial
liberalization of
all actionable
NTMs, long run
Agr, forestry, fisheries 149 234 65 103
Other primary sectors -105 254 -41 119
Processed foods 215 254 97 114
Chemicals 705 762 317 342
Electrical machinery 427 458 177 189
Motor vehicles 263 342 122 156
Other transport equipment 126 140 58 64
Other machinery 445 548 191 234
Metals and metal products 622 754 258 313
Wood and paper products 298 344 128 147
Other manufactures 409 495 174 212
Water transport 14 19 6 8
Air transport 26 38 11 17
Finance 51 62 24 29
Insurance 33 39 15 18
Business services 534 606 244 276
Communications 117 132 54 60
Construction 36 45 16 20
Personal services 265 278 120 126
Other services 388 529 166 228
Total 5.017 6.333 2.203 2.773


105
Study on "EU-US High Level Working Group"
Annex B – Details on data classifications used
B.1 GTAP classification and aggregation applied in EU-US NTM study
In the Ecorys (2010) NTMs in EU – US Trade and Investment study, the original 58 sectors from
the GTAP 7.0 database have been aggregated into 20 sectors that are used in modelling and
reporting. The original study results for the EU and US, as well as the split-out of these results for
the Netherlands (see section 3.2), make use of this classification into 20 sectors.
Aggregated sector in EU-US
NTM study Original GTAP-58 sectors
Agr, forestry, fisheries
Paddy rice Crops n.e.c.
Wheat Cattle, sheep, goats, horses
Cereal grains n.e.c. Animal products n.e.c.
Vegetables, fruit, nuts Raw milk
Oil seeds Wool, silk-worm cocoons
Sugar cane, sugar beet Forestry
Plant-based fibres Fishing
Other primary sectors
Coal Minerals n.e.c.
Oil Meat: cattle, sheep, goats, horse
Gas
Processed foods
Meat products n.e.c. Sugar
Vegetable oils and fats Food products n.e.c.
Dairy products Beverages and tobacco products
Processed rice
Chemicals Chemical, rubber, plastic prods
Electrical machinery Electronic equipment
Motor vehicles Motor vehicles and parts
Other transport equipment Transport equipment n.e.c.
Other machinery Machinery and equipment n.e.c.
Metals and metal products Ferrous metals Metal products
Metals n.e.c.
Wood and paper products Wood products
Paper products, publishing
Other manufactures
Textiles Petroleum, coal products
Wearing apparel Mineral products n.e.c.
Leather products Manufactures n.e.c.
Water transport Sea transport
Air transport Air transport
Finance Financial services n.e.c.
Insurance Insurance
Business services Business services n.e.c.
Communications Communication
Construction Construction
Personal services Recreation and other services

106
Study on "EU-US High Level Working Group"
Aggregated sector in EU-US
NTM study Original GTAP-58 sectors
Other services
Electricity Transport n.e.c.
Gas manufacture, distribution Public Admin / Defence / Health /
Education
Water Dwellings
Trade

107
Study on "EU-US High Level Working Group"
B.2 GTAP classification and aggregation applied in OECD liberalisation EU-US study
The Ecorys (2009) study on an FTA between the EU and other OECD countries (including the US)
employed the GTAP 7.0 dataset. This version of the GTAP database employs 57 sectors, but the
study has rearranged and grouped the original sectors into 33 sectors that are used in the study.
The table below shows which GTAP sectors belong to which grouped sectors.
Aggregated sector in EU-US
FTA study Original GTAP-57 sectors
Vegetables and fruits GTAP 4 Vegetables and fruits
Other crops GTAP 8 Crops, n.e.c. (except grains)
Oil, gas and coal GTAP 15 Coal GTAP 17 Gas
GTAP 16 Oil
Meats (except beef) GTP 20 Meats, except beef
Vegetable oils GTP 21 vegetables oils
Dairy products GTP 22 dairy products
Processed foods GTP 25 processed foods, n.e.c.
Beverages and tobacco GTP 26 beverages and tobacco
Textiles GTP 27 textiles
Clothing GTP 28 clothing
Wood products GTP 30 wood products
Paper, pulp and publishing GTP 31 paper, pulp, and publishing
Petro-Chemicals GTP 32 petro-chemicals
Chemicals GTP 33 chemicals, rubber, and plastics
Iron and steel GTP 35 iron and steel
Non-ferrous metals GTP 36 non-ferrous metals
Fabricated metals GTP 37 fabricated metals
Motor vehicles GTP 38 motor vehicles
Other transport equipment GTP 39 other transport equipment
Electrical machinery and
equipment GTP 40 electrical machinery and equipment
Other machinery and
equipment GTP 41 other machinery and equipment
Manufactures GTP 42 manufactures, n.e.c.
Utilities GTAP 43 Electricity GTAP 45 Water
GTAP 44 Gas distribution
Construction GTP 46 construction
Retails and wholesale trade GTP 47 retail and wholesale trade and warehousing
Transport services GTAP 48 Other transport GTAP 50 Air transport
GTAP 49 Water transport
Communications GTP 51 communications
Other financial services GTP 52 other financial services
Insurance GTP 53 insurance
Other business services GTP 54 other business services
Recreational and consumer
services GTP 55 recreational and consumer services
Other services GTAP 56 Other services
(government) GTA 57 Dwellings

108
Study on "EU-US High Level Working Group"
Aggregated sector in EU-US
FTA study Original GTAP-57 sectors
Other goods
GTAP 1 Paddy rice GTAP 12 Wool
GTAP 2 Wheat GTAP 13 Forestry
GTAP 3 Other grains GTAP 14 Fishing
GTAP 5 Oil seeds GTAP 18 Other mining
GTAP 6 Cane & Beet GTAP 19 Cattle meat
GTAP 7 Plant fibres GTAP 23 Processed rice
GTAP 9 Cattle GTAP 24 Sugar
GTAP 10 Other animal products GTAP 29 Leather
GTAP 11 Raw Milk GTAP 34 Non-metallic minerals

109
Study on "EU-US High Level Working Group"
B.3 Top Sector classification used in “Clusterkaarten” by Dialogic
In 2010, the Ministry of Economic Affairs commissioned Dialogic to map and carefully define
selected economic clusters. In their publication on these clusters (called ‘cluster maps’), Dialogic
mapped the most important players, policy initiatives and international positioning of the most
important economic sectors in the Netherlands. The resulting overview (2011) presents the sectors
by means of a data classification (SBI) and a qualitative description of the sector.
Since the Dutch Government has used (some of) the sector classifications presented by Dialogic in
the formulation of the top sector policy, this study uses the information about the sectors to narrow
down and frame the top sectors, mostly in terms of data. Hence, this classification is used as
primary source for defining the top sectors statistically. The data from these sources have also
been used directly for criterion 2 in the top sector selection (see section 4.3).
The table below presents an overview of the data sectors included in the various clusters studied by
dialogic. The used data classification is the SBI 5-digit classification, on basis of the SBI-93
classification.
Sector
Food, nutrition and
flowers
SBI code SBI sector description
Landbouw en visserij
0111 Akkerbouw
01121 Teelt van groenten, bloemen en champignons
0113 Fruitteelt
0121 Fokken en houden van rundvee
0122 Fokken en houden van overige graasdieren
0123 Fokken en houden van varkens
0124 Fokken en houden van pluimvee
013 Akker- en/of tuinbouw in combinatie met het fokken en houden van
01412 Dienstverlening voor de akker- en tuinbouw
05 Visserij, kweken van vis en schaaldieren
Verwerkende industrie
15 Vervaardiging van voedingsmiddelen en dranken
16 Verwerking van tabak
Gerelateerde activiteiten -
Landbouw en visserij
2415 Vervaardiging van meststoffen en daarmee samenhangende
stikstofverbindingen
Landbouw en visserij
242 Vervaardiging van landbouwchemicaliën
293 Vervaardiging van landbouwmachines en –werktuigen
5111 Handelsbemiddeling in landbouwproducten, levende dieren,
textielgrondstoffen en –halffabrikaten en grondstoffen voor de
voedings- en genotmiddelenindustrie
7131 Verhuur van landbouw- en bosbouwmachines en -werktuigen
73101 Speur- en ontwikkelingswerk op het gebied van landbouw en visserij

110
Study on "EU-US High Level Working Group"
Sector
74301 Keuring en controle van agrarische producten en voedingsmiddelen
74873 Veilingen van landbouw-, tuinbouw- en visserijproducten
852 Veterinaire diensten
Gerelateerde activiteiten -
Verwerkende industrie
2953 Vervaardiging van machines en apparaten voor de productie van
voedings- en genotmiddelen
5117 Handelsbemiddeling in voedings- en genotmiddelen
High tech systems &
materials
SBI code SBI sector description
Materialen
26 Vervaardiging van glas, aardewerk, cement-, kalk- en gipsproducten
27 Vervaardiging van metalen in primaire vorm
Systemen
28 Vervaardiging van producten van metaal (geen machines en
transportmiddelen)
29 Vervaardiging van machines en apparaten
30 Vervaardiging van kantoormachines en computers
31 Vervaardiging van overige elektrische machines, apparaten en
benodigdheden
32 Vervaardiging van audio-, video- en telecommunicatieapparaten en -
benodigdheden
33 Vervaardiging van medische apparaten en instrumenten,
orthopedische artikelen e.d., precisie- en optische instrumenten en
34 Vervaardiging van auto's, aanhangwagens en opleggers
352 Vervaardiging van rollend spoor- en tramwegmaterieel
353 Vervaardiging van vlieg- en ruimtevaartuigen
355 Vervaardiging van overige transportmiddelen n.e.g.
Gerelateerde activiteiten
5112 Handelsbemiddeling in brandstoffen, ertsen, metalen en chemische
prod.
5114 Handelsbemiddeling in machines, technische benodigdheden,
schepen
721 Hardware consultancy
73102 Technisch speur- en ontwikkelingswerk
73104 Overig natuurwetenschappelijk speur- en ontwikkelingswerk
74115 Octrooibureaus
74204 Technisch ontwerp en advies voor elektro-, installatietechniek en
telematica
74205 Technisch ontwerp en advies voor werktuig-, machine- en
apparatenbouw
74206 Technisch ontwerp en advies voor de procestechniek
74207 Technisch ontwerp en advies niet gespecialiseerd
74208 Overig technisch ontwerp en advies
74302 Keuring en controle van machines, apparaten en materialen

111
Study on "EU-US High Level Working Group"
Sector
Life sciences SBI code SBI sector description
Farmaceutische industrie
1588 Vervaardiging van gehomogeniseerde preparaten en dieetvoeding
244 Vervaardiging van farmaceutische producten
51461 Groothandel in farmaceutische producten
73103 Medisch en farmacologisch speur- en ontwikkelingswerk
Medische systemen en
apparaten
331 Vervaardiging van medische apparaten en instrumenten en
orthopedische en protheseartikelen
51462 Groothandel in medische en tandheelkundige instrumenten,
verpleeg- en orthopedische artikelen en laboratoriumbenodigdheden
Gezondheidszorg
85111 Academische ziekenhuizen
85152 Oncologische en radiotherapeutische instituten
85171 Medische laboratoria, bloedbanken en overige instellingen voor
behandelingondersteunend onderzoek
Mainports & logistics SBI code SBI sector description
Transport en logistiek
6010 vervoer van personen en goederen per spoor
60242 goederenvervoer over de weg (excl. verhuisvervoer)
6030 goederenvervoer via pijpleidingen
611 zeevaart
61201 goederenvervoer met de binnenvaart: vrachtvaart
61202 goederenvervoer met de binnenvaart: tankvaart
61203 goederenvervoer met de binnenvaart: duwen en slepen
6200 Vervoer van personen en goederen door de lucht
6311 Laad- los- en overslagactiviteiten (zeeschepen en andere
vervoermiddelen
6312 Opslag (in tanks, koelhuizen en andere voorzieningen
632 Overige dienstverlening voor het vervoer n.e.g.
634 Expediteurs, cargadoors en bevrachters; weging & meting
Mainport Rotterdam
Transport en logistieke
deelcluster
611 zeevaart en protheseartikelen
63111 Laad- los- en overslagactiviteiten voor zeeschepen orthopedische
artikelen en
63112 Laad- los- en overslagactiviteiten niet voor zeeschepen
63121 Opslag in tanks
63122 Opslag in koelhuizen
63123 Opslag niet in tanks noch in koelhuizen
6321 Overige dienstverlening voor het vervoer over land n.e.g.

112
Study on "EU-US High Level Working Group"
Sector
6322 overige dienstverlening voor het vervoer over water n.e.g.
63401 Expediteurs, cargadoors en bevrachters
63402 Weging & meting
60100 Vervoer per spoor
60242 Weggoederenvervoer (excl. verhuisvervoer)
61201 binnenvaart/vrachtvaart
61202 binnenvaart/tankvaart
61203 binnenvaart/duwen en slepen
6030 pijpleidingen
51912 groothandel scheepsbenodigdheden
51390 Groothandel in voedings- en genotmiddelen algemeen assortiment
518 Groothandel in machines, apparaten en toebehoren
51913 groothandel in emballage
51311 Groothandel in groenten en fruit
51211 Groothandel in granen onderzoek
71210 Verhuur van transportmiddelen voor vervoer over land (geen
personenauto's)
71342 Verhuur van machines en werktuigen n.e.g.
71405 Verhuur van overige roerende goederen n.e.g.
74702 Reiniging van transportmiddelen en overige reiniging
74600 Beveiliging en opsporing
7222 Ontwikkelen en produceren van maatwerk software; software
consultancy
Petrochemisch en energie
deelcluster
232 aardolieverwerking (raffinage e.a. verwerking)
2411 Vervaardiging van industriële gassen
2412 Vervaardiging van kleur- en verfstoffen
2413 Vervaardiging van overige anorganische basischemicaliën
2414 vervaardiging van petrochemische producten en overige organische
basischemicaliën
2416 vervaardiging van kunststof in primaire vorm
5151 groothandel in brandstoffen en andere minerale olieproducten
5155 groothandel in chemische producten
74701 Reiniging van gebouwen

113
Study on "EU-US High Level Working Group"
Sector
74201 Architecten- en technische ontwerp- en adviesbureaus voor
burgerlijke en utiliteitsbouw
73102 Technisch speur- en ontwikkelingswerk
Metaal
2811 Vervaardiging van metalen constructiewerken
28510 oppervlakte behandeling
28520 overige metaalbewerking
29240 vervaardiging van gereedschap o.m. voor de metaalbewerking
Recycling
5157 Groothandel in afval en schroot
37 Voorbereiding tot recycling
900 milieudienstverlening
Deltatechnologie
3511 Nieuwbouw/reparatie van schepen (geen sport/recreatievaartuigen),
baggermaterieel, booreilanden e.d.
4524 Natte waterbouw
Mainport Schiphol
Transport en logistieke
deelcluster
6323 Luchthavens en overige dienstverlening voor het vervoer door de
lucht n.e.g.
6200 Vervoer door de lucht
63401 Expediteurs, cargadoors en bevrachters
Gerelateerde diensten
7415 Concerndiensten en holdings (geen financiële holdings)
67 Financiële beurzen, effectenmakelaars, assurantietussenpersonen,
administratiekantoren voor aandelen, waarborgfondsen e.d.
Water SBI code SBI sector description
Watertechnologie
41 Winning en distributie van water
9001 Afvalwaterinzameling en behandeling
Deltatechnologie
3511 Nieuwbouw en reparatie van schepen (geen sport- en
recreatievaartuigen), baggermaterieel, booreilanden e.d.
4524 Natte waterbouw
74203 Technisch ontwerp en advies voor grond-, water- en wegenbouw
Chemicals SBI code SBI sector description
Chemie
24 Vervaardiging van chemische producten
25 Vervaardiging van producten van rubber en kunststof
Gerelateerde activiteiten
232 Aardolieverwerking
5112 Handelsbemiddeling in brandstoffen, ertsen, metalen en chemische
producten
73103 Medisch en farmacologisch speur- en ontwikkelingswerk

114
Study on "EU-US High Level Working Group"
Sector
Creative industries SBI code SBI sector description
Kunsten
9231 Beoefening van kunst
92321 Theaters, schouwburgen en concertgebouwen
92323 Dienstverlening voor kunstbeoefening en organisatie van culturele
evenementen
92521 Kunstgalerieën en expositieruimten
92522 Musea
Media en entertainment
221 Uitgeverijen
74811 Fotografie
9211 Productie van (video)films
9213 Vertoning van films
9220 Radio en televisie
92343 Overig amusement n.e.g.
9240 Pers- en nieuwsbureaus; journalisten
Creatieve zakelijke
dienstverlening
74201 Architecten- en technische ontwerp- en adviesbureaus voor
burgerlijke en utiliteitsbouw
74202 Technisch ontwerp en advies voor stedenbouw-, verkeers-, tuin- en
landschapskunde, ruimtelijke ordening
74401 Reclame-, reclameontwerp- en adviesbureaus
74402 Overige reclamediensten
74875 Interieur-, modeontwerpers e.d.
Energy SBI code SBI sector description
Aardolie, aardgas en
steenkool
10 Turfwinning
11 Aardolie- en aardgaswinning en dienstverlening voor de aardolie- en
aardgaswinning
23 Aardolie- en steenkool verwerkende industrie; bewerking van splijt-
en kweekstoffen
231 Vervaardiging van cokesovenproducten
232 Aardolieverwerking
40001 Productie van elektriciteit en warm water door thermische, kern- en
warmtekrachtcentrales
Duurzame energie
233 Bewerking van splijt- en kweekstoffen
40002 Productie van elektriciteit door windenergie
40003 Productie van elektriciteit en warm water door zonn.e.c.ellen,
warmtepompen en waterkracht

115
Study on "EU-US High Level Working Group"
Sector
Gerelateerde diensten
40004 Exploitatie van transportnetten voor elektriciteit, aardgas en warm
40005 Handel in en distributie van elektriciteit, aardgas en warm water
5112 Handelsbemiddeling in brandstoffen, ertsen, metalen en chemische
producten
Business and financial
services
SBI code SBI sector description
Financiële diensten
65 Financiële instellingen (uitgezonderd verzekeringswezen en
pensioenfondsen)
66 Verzekeringswezen en pensioenfondsen (geen verplichte sociale
verzekeringen)
67 Financiële beurzen, effectenmakelaars, assurantietussenpersonen,
administratiekantoren voor aandelen, waarborgfondsen e.d.
Overige zakelijke
diensten
72 Computerservice en informatietechnologie
73 Speur- en ontwikkelingswerk
741 Rechtskundige dienstverlening, accountants, boekhoudbureaus,
belastingconsulenten, markt- en opinieonderzoekbureaus,
economische adviesbureaus en holdings
744 Reclamebureaus e.d.
74871 Kredietinformatie- en incassobureaus
74872 Organiseren van beurzen, tentoonstellingen, braderieën e.d.
Broadband and ICT SBI code SBI sector description
Content
221 Uitgeverijen
744 Reclamebureaus e.d.
74811 Fotografie
74875 Interieur-, modeontwerpers e.d.
921 Activiteiten op het gebied van film en video
922 Radio en televisie
92343 Overig amusement n.e.g.
924 Pers- en nieuwsbureaus; journalisten
Diensten
2221 Drukkerijen van dagbladen
2222 Drukkerijen (geen dagbladen)
223 Reproductie van opgenomen media
642 Telecommunicatie
7133 Verhuur van computers en kantoormachines
72 Computerservice en informatietechnologie
Hardware 3002 Vervaardiging van computers

116
Study on "EU-US High Level Working Group"
Sector
313 Vervaardiging van geïsoleerde kabel en draad
3162 Vervaardiging van overige elektrische benodigdheden n.e.g.
32 Vervaardiging van audio-, video- en telecommunicatieapparaten en
benodigdheden
332 Vervaardiging van meet-, regel- en controleapparaten (niet voor de
bewaking van industriële processen)
333 Vervaardiging van apparaten voor de bewaking van industriële
processen
73102 Technisch speur- en ontwikkelingswerk
74204 Technisch ontwerp en advies voor elektro-, installatietechniek en
telematica
74208 Overig technisch ontwerp en advies

117
Study on "EU-US High Level Working Group"
B.4 CBS preliminary data for baseline measurement of top sectors – work in progress
In order to statistically track the performance of the top sectors, the Dutch governmental statistical
bureau CBS has recently initiated a process of defining the top sectors statistically, such that
statistical measures and indicators can be linked to the top sectors. In the first stage, top sectors
are defined on basis of the SBI classification. Four of the nine top sectors appeared to be able to be
classified according to the SBI classification. For these sectors, an overview of the baseline
scenario for different types of indicators is presented (work in progress by CBS, 2012). In the
second stage, CBS aims to present a complete classification of the top sectors according to SBI
and after meetings with the top teams. These other sectors require further study since not all goods
and services can be easily classified.
The four sectors that have been classified in the first stage, with their respective corresponding SBI
codes, are presented in the table below. This study has benefited from both the initial measures of
the indicators presented by the CBS exercise and from the sector classifications.
68 The limited definition includes only “primaire productie” and “verwerkende levensmiddelenindustrie”.
Top sector SBI codes
Agro-food68
Primare productie 0111 0113 0140 0150 0161 0162
0163 0170 03
Verwekende
levensmiddelenindustrie 10 11
Groot- en detailhandel 4611 4621 4623 4624 463 4661
46682 4711 472 4781 56
Overig 2015 2020 2830 2893 72111 72191
Life science &
health
Farmacie 2110 2120
Medische instrumenten 2660 3250
Onderzoek 72112 72193
High tech
systems &
materials
Metaalindustrie 24 252 253 254 255 256
2573 2591 2593 2594 2599 3311
Vervaardiging van machines
en apparaten
26 27 28 3250 3312 3313
3314 3319 332
Vervaardiging van
transportmiddelen 2211 2229 2910 29201 2931 2932
302 303 304 309 3316 3317
Overig 6201 72192 7112 71202
Chemicals
Aardolieverwerking 1910 19201 19202
Chemische industrie 2011 2012 2013 20141 20149 2015
2016 2017 2020 2030 2041 2042
2051 2052 2053 2059 2060
Rubber- en kunstofindustrie 2211 2219 2221 2222 2223 2229

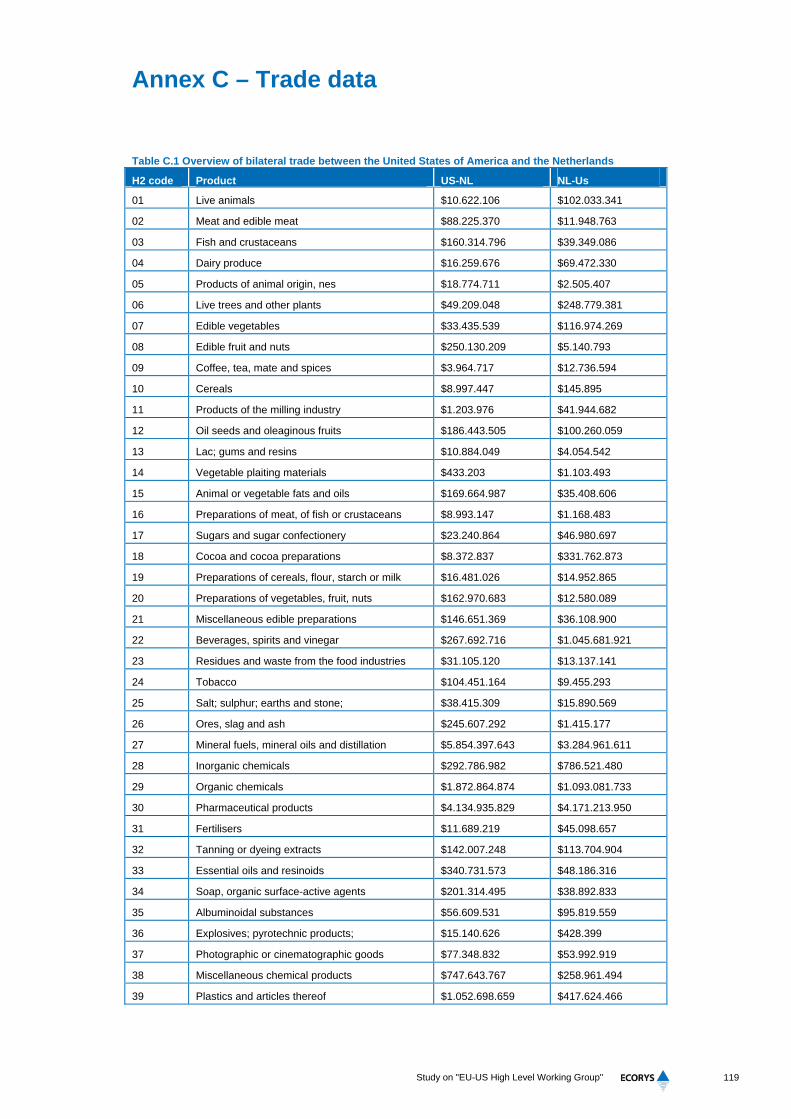
119
Study on "EU-US High Level Working Group"
Annex C – Trade data
Table C.1 Overview of bilateral trade between the United States of America and the Netherlands
H2 code Product US-NL NL-Us
01 Live animals $10.622.106 $102.033.341
02 Meat and edible meat $88.225.370 $11.948.763
03 Fish and crustaceans $160.314.796 $39.349.086
04 Dairy produce $16.259.676 $69.472.330
05 Products of animal origin, nes $18.774.711 $2.505.407
06 Live trees and other plants $49.209.048 $248.779.381
07 Edible vegetables $33.435.539 $116.974.269
08 Edible fruit and nuts $250.130.209 $5.140.793
09 Coffee, tea, mate and spices $3.964.717 $12.736.594
10 Cereals $8.997.447 $145.895
11 Products of the milling industry $1.203.976 $41.944.682
12 Oil seeds and oleaginous fruits $186.443.505 $100.260.059
13 Lac; gums and resins $10.884.049 $4.054.542
14 Vegetable plaiting materials $433.203 $1.103.493
15 Animal or vegetable fats and oils $169.664.987 $35.408.606
16 Preparations of meat, of fish or crustaceans $8.993.147 $1.168.483
17 Sugars and sugar confectionery $23.240.864 $46.980.697
18 Cocoa and cocoa preparations $8.372.837 $331.762.873
19 Preparations of cereals, flour, starch or milk $16.481.026 $14.952.865
20 Preparations of vegetables, fruit, nuts $162.970.683 $12.580.089
21 Miscellaneous edible preparations $146.651.369 $36.108.900
22 Beverages, spirits and vinegar $267.692.716 $1.045.681.921
23 Residues and waste from the food industries $31.105.120 $13.137.141
24 Tobacco $104.451.164 $9.455.293
25 Salt; sulphur; earths and stone; $38.415.309 $15.890.569
26 Ores, slag and ash $245.607.292 $1.415.177
27 Mineral fuels, mineral oils and distillation $5.854.397.643 $3.284.961.611
28 Inorganic chemicals $292.786.982 $786.521.480
29 Organic chemicals $1.872.864.874 $1.093.081.733
30 Pharmaceutical products $4.134.935.829 $4.171.213.950
31 Fertilisers $11.689.219 $45.098.657
32 Tanning or dyeing extracts $142.007.248 $113.704.904
33 Essential oils and resinoids $340.731.573 $48.186.316
34 Soap, organic surface-active agents $201.314.495 $38.892.833
35 Albuminoidal substances $56.609.531 $95.819.559
36 Explosives; pyrotechnic products; $15.140.626 $428.399
37 Photographic or cinematographic goods $77.348.832 $53.992.919
38 Miscellaneous chemical products $747.643.767 $258.961.494
39 Plastics and articles thereof $1.052.698.659 $417.624.466

120
Study on "EU-US High Level Working Group"
H2 code Product US-NL NL-Us
40 Rubber and articles thereof $217.784.396 $87.068.539
41 Raw hides and skins and leather $11.443.040 $5.525.424
42 Articles of leather $10.562.890 $3.790.606
43 Furskins and artificial fur $75.091 $13.724.698
44 Wood and articles of wood $72.439.389 $13.671.645
45 Cork and articles of cork $85.969 $187.010
46 Manufactures of straw $64.286 $147.221
47 Pulp of wood $193.823.146 $913.830
48 Paper and paperboard $250.805.411 $109.532.320
49 Printed books, newspapers $91.653.015 $15.791.095
50 Silk $60.339 $110.084
51 Wool, fine or coarse animal hair $215.716 $253.326
52 Cotton $9.448.325 $878.020
53 Other vegetable textile fibres $6.175 $592.862
54 Man-made filaments $54.556.447 $120.896.179
55 Man-made staple fibres $28.511.838 $27.786.280
56 Wadding, felt and nonwovens $18.904.553 $32.801.073
57 Carpets and other textile floor coverings $7.406.506 $68.407.300
58 Special woven fabrics $3.461.979 $8.870.388
59 Impregnated, coated, or laminated textile $16.203.088 $42.396.955
60 Knitted or crocheted fabrics $6.930.059 $173.747
61 Articles of apparel and clothing (knit) $25.896.475 $3.445.764
62 Articles of apparel and clothing (not knitted) $29.202.222 $7.839.842
63 Other made up textile articles $43.434.416 $4.969.699
64 Footwear, gaiters $15.371.989 $7.617.022
65 Headgear and parts thereof $4.953.173 $672.441
66 Umbrellas, sun umbrellas, walking-sticks $704.284 $27.853
67 Prepared feathers $659.361 $194.968
68 Articles of stone, plaster, cement, asbestos $31.776.478 $13.411.688
69 Ceramic products $20.177.270 $11.854.595
70 Glass and glassware $29.862.844 $38.603.697
71 Natural or cultured pearls, stones $345.526.380 $15.602.759
72 Iron and steel $78.927.915 $888.102.547
73 Articles of iron or steel $122.702.281 $83.475.554
74 Copper and articles thereof $55.325.668 $59.493.143
75 Nickel and articles thereof $19.950.923 $36.394.058
76 Aluminium and articles thereof $31.224.245 $41.278.872
78 Lead and articles thereof $509.422 $565.010
79 Zinc and articles thereof $3.723.141 $54.379
80 Tin and articles thereof $467.886 $5.906.077
81 Other base metals; cermets $15.616.878 $18.374.755
82 Tools, implements, cutlery $97.977.822 $175.361.266
83 Miscellaneous articles of base metal $37.160.144 $27.619.164
84 Nuclear reactors, boilers, machinery $4.050.339.957 $4.046.617.355

121
Study on "EU-US High Level Working Group"
H2 code Product US-NL NL-Us
85 Electrical machinery and equipment $3.331.806.606 $1.231.818.162
86 Railway or tramway locomotives $8.279.026 $10.379.734
87 Vehicles other than railway or tramway $489.959.350 $104.223.085
88 Aircraft, spacecraft, and parts thereof $1.510.715.640 $480.150.890
89 Ships, boats and floating structures $44.629.754 $63.518.507
90 Optical, photographic, measuring instruments $5.232.387.900 $1.457.063.426
91 Clocks and watches and parts thereof $5.193.572 $6.998.959
92 Musical instruments $89.664.368 $8.701.947
93 Arms and ammunition $32.878.171 $8.347.821
94 Furniture $54.464.262 $59.046.176
95 Toys, games and sports requisites $161.771.019 $17.564.377
96 Miscellaneous manufactured articles $30.744.942 $4.039.953
97 Works of art, collectors' pieces and antiques $123.037.985 $40.098.453
99 (Reserved for special uses) $962.425.109 $58.543.503
Source: Comtrade database (Query: Reporter: {528; 842}; Partner: {842; 528}; Period: “2010”; Classification: “HS2007”;
Commodities: “??”).

122
Study on "EU-US High Level Working Group"
Annex D – Details on NTMs from MADB and Ecorys NTM study
NTMs identified in the Ecorys NTM Study
Table D.1 NTMs for EU-US trade and investment as found in the Ecorys NTM Study
Source Sector Name Type of
NTM
Subsector
Ecorys NTM
study
Agrofood &
Horticulture
Container Security Initiative (CSI). Cross-
cutting
Ecorys NTM
study
Agrofood &
Horticulture
Custom surcharges. Sector-
specific
Ecorys NTM
study
Agrofood &
Horticulture
US product standards which differ from
international standards.
Sector-
specific
Ecorys NTM
study
Agrofood &
Horticulture
Direct and indirect government support by
means of subsidies, protective legislation
and tax policies to US farmers.
Sector-
specific
Ecorys NTM
study
Agrofood &
Horticulture
US Customs Refusal of EU Origin ("Made
in EU").
Cross-
cutting
Ecorys NTM
study
Agrofood &
Horticulture
US prohibition to register/renew a
trademark or a trade name which is
identical or similar to a trademark or a
trade name used in connection with a
confiscated business.
Sector-
specific
Pharma;
Chemicals
Ecorys NTM
study
Chemicals Classification and labelling requirements
for chemical products.
Sector-
specific
Chemicals
Ecorys NTM
study
Chemicals Different local governments (below state
level) implementing chemical security
regulations.
Sector-
specific
Chemicals
Ecorys NTM
study
Chemicals Different state level chemical security
regulations.
Sector-
specific
Pharma
Ecorys NTM
study
Chemicals Drug precursor legislation. Cross-
cutting
Chemicals
Ecorys NTM
study
Chemicals Evaluation and notification of new
significant new uses.
Cross-
cutting
Pharma
Ecorys NTM
study
Chemicals FDA New Drug Approval Process. Cross-
cutting
Pharma
Ecorys NTM
study
Chemicals Foreign Investment and National Security
Act (FINSA), which can create excess
costs for FDI.
Sector-
specific
Chemicals
Ecorys NTM
study
Chemicals Indirect effects from food safety legislation
– packaging in contact with food.
Cross-
cutting
Pharma
Ecorys NTM
study
Chemicals Long/difficult authorisation and registration
procedures.
Sector-
specific
Pharma
Ecorys NTM
study
Chemicals US state-level safety certifications
requirements.
Chemicals
Ecorys NTM Chemicals Pesticide/biocide testing and evaluation for Cross- Pharma

123
Study on "EU-US High Level Working Group"
Source Sector Name Type of
NTM
Subsector
study licensing. cutting
Ecorys NTM
study
Chemicals Prior authorization for sensitive product
categories.
Cross-
cutting
Chemicals;
Pharma
Ecorys NTM
study
Chemicals Restrictions or bans on use of specific
chemicals.
Sector-
specific
Chemicals;
Pharma
Ecorys NTM
study
Chemicals Very limited access of foreign companies
to US government subsidy programmes
(e.g. Technology Innovation Programme).
Sector-
specific
Electronics
Ecorys NTM
study
High Tech 3rd party testing for import products with
EU declarations of conformity.
Sector-
specific
Automotive
Ecorys NTM
study
High Tech American Automobile Labelling Act. Cross-
cutting
Automotive
Ecorys NTM
study
High Tech Civil Penalties for violations of statutes and
regulations NHTSA pertaining to motor
vehicle safety, bumper standards, and
consumer information.
Sector-
specific
Office, information
& communication
equipment
Ecorys NTM
study
High Tech Conformity assessment procedures. Sector-
specific
Automotive
Ecorys NTM
study
High Tech Different cetane levels in diesel fuel
between EU and US – leading costs to
tune engines to these different levels.
Sector-
specific
Electronics
Ecorys NTM
study
High Tech Encryption Control Policy not in line with
the Wassenaar arrangement.
Electronics; Office,
information &
communication
equipment
Ecorys NTM
study
High Tech Energy conservation Program for
Commercial and Industrial Equipment
(EPCA).
Cross-
cutting
Automotive
Ecorys NTM
study
High Tech Gas Guzzler Tax. Cross-
cutting
Aerospace
Ecorys NTM
study
High Tech International Traffic in Arms Regulations
(ITAR) (space sector).
Cross-
cutting
Communication
services
Ecorys NTM
study
High Tech Licenses. Cross-
cutting
Communication
services
Ecorys NTM
study
High Tech Limits imposed by CFIUS on the
number/share of (foreign) firms.
Cross-
cutting
Medical, Measuring
and testing
appliances
Ecorys NTM
study
High Tech Medical Device User Fee. Cross-
cutting
Electronics; Office,
information &
communication
equipment
Ecorys NTM
study
High Tech Nationality or residence requirements for
staff.
Sector-
specific
Aerospace
Ecorys NTM
study
High Tech On-board equipment and instruments:
Safety standards for Flight Guidance
Systems and Proposed Revisions to
"Automatic Pilot Systems Approval".
Sector-
specific
Medical, Measuring
and testing
appliances

124
Study on "EU-US High Level Working Group"
Source Sector Name Type of
NTM
Subsector
Ecorys NTM
study
High Tech Registration with FDA and compliance with
FDA quality system regulations.
Cross-
cutting
Automotive
Ecorys NTM
study
High Tech Reporting requirement on container
transport: 10+2 regulation (Importer
Security Filing).
Communication
services
Ecorys NTM
study
High Tech Requirements regarding professional
qualifications for foreign firms.
Communication
services
Ecorys NTM
study
High Tech Restricted access to high speed internet
connections for foreign firms.
Aerospace
Ecorys NTM
study
High Tech Restrictions on foreign launching services. Communication
services
Ecorys NTM
study
High Tech ATSC technology which is not compatible
with DVB-T standards in EU.
Electronics; Office,
information &
communication
equipment
Ecorys NTM
study
High Tech Non-transparency of standards. Electronics; Office,
information &
communication
equipment
Ecorys NTM
study
High Tech Safety of electrical and electronics
products, non-harmonised standards,
different from state to state.
Electronics
Ecorys NTM
study
High Tech Standards developed by different bodies
(OSHA, National Electric Code and
Industry safety standards).
Automotive
Ecorys NTM
study
High Tech Taxation of cars with high fuel
consumption (CAFE = Corporate Average
Fuel Economy).
Medical, Measuring
and testing
appliances
Ecorys NTM
study
High Tech State-wise certification according to
Underwriters Laboratories.
Cross-
cutting
Communication
services
Ecorys NTM
study
High Tech Transfer delays, slow custom procedures
(postal).
Sector-
specific
Communication
services
Ecorys NTM
study
High Tech US Customs Refusal of EU Origin ("Made
in EU").
Sector-
specific
Electronics; Office,
information &
communication
equipment
Ecorys NTM
study
High Tech US legal liability philosophy. Sector-
specific
Office, information
& communication
equipment
Ecorys NTM
study
High Tech Third party testing for import products with
EU declarations of conformity.
Cross-
cutting
Aerospace;
Automotive;
Communication
services;
Electronics; Office,
information &
communication
equipment

125
Study on "EU-US High Level Working Group"
Source Sector Name Type of
NTM
Subsector
Ecorys NTM
study
High Tech US product standards which differ from
international standards.
Sector-
specific
Electronics; Office,
information &
communication
equipment
Ecorys NTM
study
High Tech US state-level safety and power supply
certifications.
Sector-
specific
Aerospace
Ecorys NTM
study
High Tech US support to aircraft engine
manufacturers (aeronotics).
Sector-
specific
Aerospace
Ecorys NTM
study
High Tech US support to Boeing. Sector-
specific
Aerospace;
Automotive;
Electronics;
Communication
services
Ecorys NTM
study
High Tech Very limited access of foreign companies
to US government support programmes.
Cross-
cutting
Ecorys NTM
study
Horizontal Classification and labelling differences
between the EU and US.
Cross-
cutting
Ecorys NTM
study
Horizontal Diverging regulations in EU and US patent
systems.
Cross-
cutting
Ecorys NTM
study
Horizontal Double certification need caused by The
European Union’s Authorized Economic
Operator (AEO) program and the US
Customs-Trade Partnership against
Terrorism (C-TPAT).
Sector-
specific
Ecorys NTM
study
Horizontal Environmental regulations (e.g. EU
Emission Trading Scheme).
Cross-
cutting
Ecorys NTM
study
Horizontal Intellectual property rights differences
between the EU and US.
Sector-
specific
Ecorys NTM
study
Horizontal Restrictions in Government procurement
(e.g. the Buy American Act, ARRA and
SBA).
Ecorys NTM
study
Horizontal Threat of 100% container scanning. Cross-
cutting
Ecorys NTM
study
Horizontal Diverging technical standards. Cross-
cutting

126
Study on "EU-US High Level Working Group"
NTMs identified in the EC’s Market Acces Database
Table D.2 NTMs for EU-US trade as found in the MADB
Source Sector Name Description
MADB Agrofood &
Horticulture
Agricultural export
subsidies and
promotion
Less than before, but still present, e.g. the dairy export
incentive programme. Also market access programme and
export credit guarantee.
MADB Agrofood &
Horticulture
Export Credit
Guarantee
Program
The Export Credit Guarantee Programme which is managed
by USDA/FAS has had a major impact on a number of key
agricultural markets. Under this programme, the US
government used to guarantee credits up to 98 % of the
export value on a short-term to long term basis varying from
up to 180 days under the Supplier Credit Guarantee
Program SCGP, 3 years under the General Sales Manager
(GSM) 102 and up to 10 years under GSM-103. Reforms
after losing WTO dispute have not significantly changed the
situation.
MADB Agrofood &
Horticulture
Farm bill A key feature of the 2008 Farm Act was the introduction of a
new support scheme for arable crops known as the Average
Crop Revenue Election programme (ACRE). Also some
higher reference prices, permanent disaster funds,
subsidies for renewable energy production.
MADB Agrofood &
Horticulture
IPR: inadequate
protection of GIs
EU GI stakeholders have complained that the protection of
GIs in the US trademark system suffers deficiencies. Also
issues related to wine (labels before 2006).
MADB Agrofood &
Horticulture
Marine Mammal
Protection Act
Tuna catch and dolphins- Spain was refused membership of
Inter-American Tropical Tuna Commission (IATTC), making
exports to US difficult.
MADB Agrofood &
Horticulture
Pasturised Milk
Products
According to an FDA notice published in January 2000 there
are three options for firms interested in exporting Grade A
dairy products to the US, the exporting company must sign
a contract with a State, which must accept to treat it as if it
were within its own jurisdiction (including the inspection and
the control of the observance of the US regulation by
inspectors of the State several times per annum);or the
region/country of the exporting firm must adopt and comply
with the US rules, in order to become a member of the
Conference; or the programme and the regulations in the
exporting country are recognised equivalent to the US
programme by the FDA.
MADB Agrofood &
Horticulture
Rules for import of
dairy products into
USA
Similar to "Pasturised Milk Products".
MADB Agrofood &
Horticulture
Sanitary measures
applied by USA for
imports of live
bivalve molluscs
The USA requires the testing of the water in which bivalve
molluscs (e.g. oysters) are reared for coliforms, whereas the
European Union requires testing of the flesh of the bivalve
molluscs for Escherichia coli. Should be considered
equivalent.
MADB Agrofood &
Horticulture
Slow procedures
on applications to
New types of plants and plant products cannot be imported
into USA before the phytosanitary requirements are decided
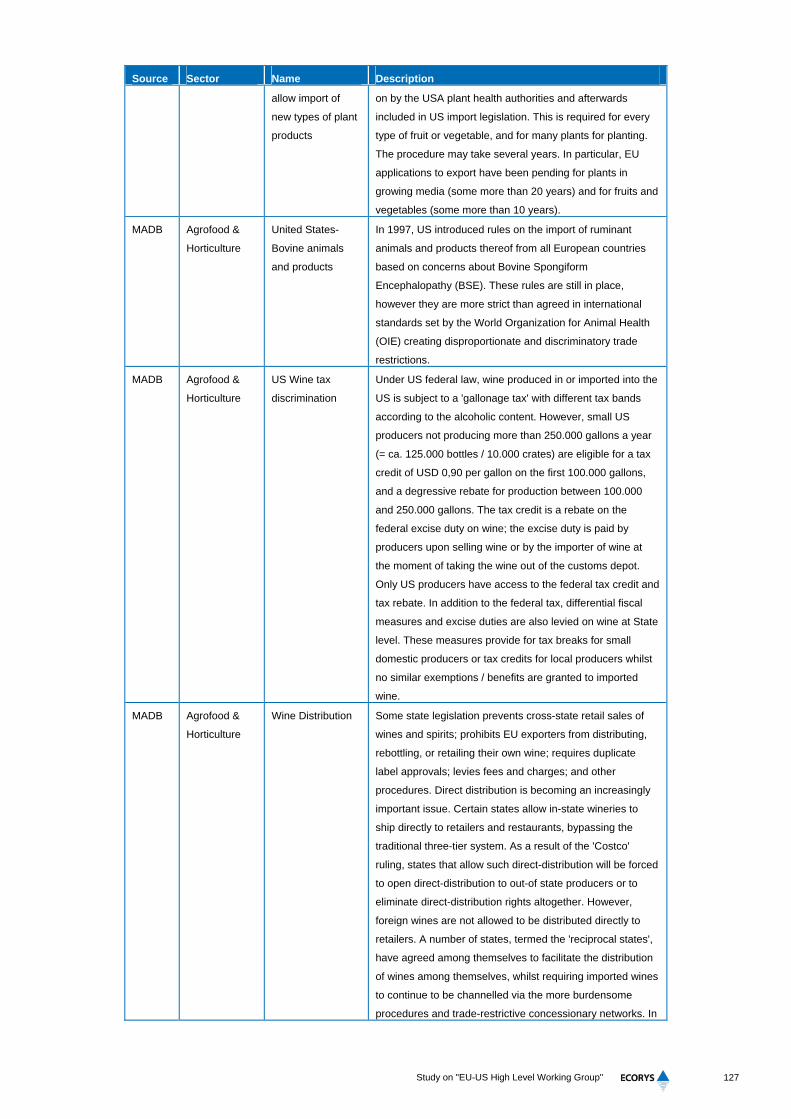
127
Study on "EU-US High Level Working Group"
Source Sector Name Description
allow import of
new types of plant
products
on by the USA plant health authorities and afterwards
included in US import legislation. This is required for every
type of fruit or vegetable, and for many plants for planting.
The procedure may take several years. In particular, EU
applications to export have been pending for plants in
growing media (some more than 20 years) and for fruits and
vegetables (some more than 10 years).
MADB Agrofood &
Horticulture
United States-
Bovine animals
and products
In 1997, US introduced rules on the import of ruminant
animals and products thereof from all European countries
based on concerns about Bovine Spongiform
Encephalopathy (BSE). These rules are still in place,
however they are more strict than agreed in international
standards set by the World Organization for Animal Health
(OIE) creating disproportionate and discriminatory trade
restrictions.
MADB Agrofood &
Horticulture
US Wine tax
discrimination
Under US federal law, wine produced in or imported into the
US is subject to a 'gallonage tax' with different tax bands
according to the alcoholic content. However, small US
producers not producing more than 250.000 gallons a year
(= ca. 125.000 bottles / 10.000 crates) are eligible for a tax
credit of USD 0,90 per gallon on the first 100.000 gallons,
and a degressive rebate for production between 100.000
and 250.000 gallons. The tax credit is a rebate on the
federal excise duty on wine; the excise duty is paid by
producers upon selling wine or by the importer of wine at
the moment of taking the wine out of the customs depot.
Only US producers have access to the federal tax credit and
tax rebate. In addition to the federal tax, differential fiscal
measures and excise duties are also levied on wine at State
level. These measures provide for tax breaks for small
domestic producers or tax credits for local producers whilst
no similar exemptions / benefits are granted to imported
wine.
MADB Agrofood &
Horticulture
Wine Distribution Some state legislation prevents cross-state retail sales of
wines and spirits; prohibits EU exporters from distributing,
rebottling, or retailing their own wine; requires duplicate
label approvals; levies fees and charges; and other
procedures. Direct distribution is becoming an increasingly
important issue. Certain states allow in-state wineries to
ship directly to retailers and restaurants, bypassing the
traditional three-tier system. As a result of the 'Costco'
ruling, states that allow such direct-distribution will be forced
to open direct-distribution to out-of state producers or to
eliminate direct-distribution rights altogether. However,
foreign wines are not allowed to be distributed directly to
retailers. A number of states, termed the 'reciprocal states',
have agreed among themselves to facilitate the distribution
of wines among themselves, whilst requiring imported wines
to continue to be channelled via the more burdensome
procedures and trade-restrictive concessionary networks. In

128
Study on "EU-US High Level Working Group"
Source Sector Name Description
addition some state regulations on direct-to-consumer
shipment are changing due to the US Supreme Court's
Granholm ruling. As a result certain states are now allowing
shipments of wine directly to consumers, if the winery
obtains a permit from the state they wish to ship to.
However, in most cases only domestic wineries are eligible
to obtain the permit. In both cases, direct to consumers'
shipment and direct distribution, state legislators do not take
imported products into account when establishing
regulations and appear to discriminate against foreign
wines.
MADB High Tech Corporate
Average Fuel
Economy (CAFE)
Payment
Since 1992 direct and indirect government support to the
aircraft industry in the United States and the European
Union has been regulated by the bilateral EU-US
Agreement on Trade in Large Civil Aircraft. The US
purported to unilaterally withdraw from the 1992 bilateral
EC-US Agreement on Trade in Large Civil Aircraft in
October 2004(a move that the EU continues to consider
invalid as it did not respect the required conditions), and, on
6 October 2004, requested consultations regarding alleged
support to Airbus by the EU and certain of its Member
States (DS 316). The EU responded immediately by
initiating WTO dispute settlement proceedings regarding a
number of US measures, including federal state and local
subsidies
MADB High Tech Electrical and
Electronic
Equipment
Barriers
The Corporate Average Fuel Economy (CAFE) payment is a
civil penalty payment levied on a manufacturer or importer
whose range of models has an average fuel efficiency
below a certain level, currently 27.5 miles per gallon
(approx. 10.3 litres per 100km). CAFE favours large
integrated automakers or producers of small cars rather
than those who concentrate on the top end of the car
market, such as importers of European cars. According to
the latest estimates available, European-based auto makers
with a total market share in the US of only 9%, bear almost
100% of the CAFE penalties. S According to the National
Highway Traffic Safety Administration, most European
manufacturers regularly pay CAFE civil penalties ranging
from less than $1m to more than $20m annually.
MADB High Tech Jones Act and
Shipbuilding
Subsidies
Most electrical products in the EU go through a product
approval process called "internal production control", which
in international discussions often is referred to as Suppliers’
Declaration of Conformity (SDoC). The European
Commission requested that the US Occupational Safety &
Health Administration (OSHA) deregulates its current
procedures that require products to go through nationally
recognised testing laboratories, ideally by a move towards
SDoC. Nationally Recognised Testing laboratories (NRTLs)
are third-party laboratories that have met OSHA
requirements for performing safety testing and certification

129
Study on "EU-US High Level Working Group"
Source Sector Name Description
of electrical and other products used in the workplace.
NRTLs test and certify these products to determine whether
they conform to appropriate U.S. product-safety testing
standards. SDoC, applicable for most electrical products
placed on the European Union market, obliges
manufacturers to adhere to strict safety requirements and
obliges them to be able to document compliance at all
times. It leaves however the detailed modalities for the proof
of compliance to the manufacturer and does not require him
to use a locally recognised test laboratory. They therefore
are free to use the services of any competent (e.g.
accredited) test laboratory or use in-house competence.
MADB High Tech Steel Local
Content
Requirements
The Merchant Marine Act of 1920 "Jones Act", as amended
in 1936, provides for various shipbuilding subsidies and tax
deferments for projects meeting domestic built
requirements. These are provided via the Operating
Differential Subsidy (ODS), the Capital Constructions Fund
(CCF) and the Construction Reserve Fund (CRF).Pursuant
to this act, the United States prohibits the use, sale or lease
of foreign built or foreign reconstructed vessels in
commercial application between points in national waters or
the waters of an exclusive economic zone. Despite the
discriminatory nature of this US regulation, the United
States is permitted to continue to apply the Jones Act under
paragraph 3 of the GATT 1994. Pursuant to this article, the
United States may prohibit the use, sale or lease of foreign
built or foreign reconstructed vessels in commercial
application between points in national waters or the waters
of an exclusive economic zone. Even if there is strictly
speaking no prohibition of import, we can see that this
prohibition of use is a de facto prohibition on imports.
Moreover, the definition of vessels has been interpreted by
the US Administration to cover hovercraft and inflatable
rafts. These limitations on rebuilding act as another
discrimination against foreign materials the rebuilding of a
vessel of over 500 gross tonnes (gt) must be carried out
within the US if it is to engage in coastwise trade. A smaller
vessel (under 500 gt) may lose its existing coastwise rights
if the rebuilding abroad or in the US with foreign materials is
extensive (46 U.S.C. 83, amendments of 1956 and
1960).The Merchant Marine Act also established under Title
XI, the Guaranteed Loan Program to assist in the
development of the US merchant marine by guaranteeing
construction loans and mortgages on US flag vessels built
in the US. In 1993, this was extended to cover vessels for
export. In December 1994, the OECD Shipbuilding
Agreement was signed. It aims at the elimination of all direct
and indirect support in the shipbuilding sector and was
expected to have an impact on the US subsidy programme.
The EU, South Korea and Norway deposited their

130
Study on "EU-US High Level Working Group"
Source Sector Name Description
instruments of ratification for the Agreement in December
1995 with Japan following in June 1996. Opposition in the
Congress originating from the naval industry prevented the
US from ratifying the Agreement. Subsequent bills
attempting to implement the ratification failed and the US
did not enter the Agreement in 2001. During FY2000, the
Maritime Administration (MARAD) approved US$886 million
worth of Title XI guaranteed loan applications for 15 vessels
and barges and 2 cruise ships. From FY2001-2004 MARAD
has approved over US$1258 million in loan guarantees. For
Fiscal Year 2004, the Maritime Administration (MARAD)
approved $152 million in loan guarantees. For Fiscal Year
2005, MARAD approved $140 million in loan guarantees.
This measure is subject to a substantive review in the WTO
according to Article III of the GATT.
MADB High Tech Boeing Subsidies Since 1992 direct and indirect government support to the
aircraft industry in the United States and the European
Union has been regulated by the bilateral EU-US
Agreement on Trade in Large Civil Aircraft. The US
purported to unilaterally withdraw from the 1992 bilateral
EC-US Agreement on Trade in Large Civil Aircraft in
October 2004(a move that the EU continues to consider
invalid as it did not respect the required conditions), and, on
6 October 2004, requested consultations regarding alleged
support to Airbus by the EU and certain of its Member
States (DS 316). The EU responded immediately by
initiating WTO dispute settlement proceedings regarding a
number of US measures, including federal state and local
subsidies (DS 317).For its part, the EU is challenging
various US State subsidies benefiting Boeing. These
subsidies amount to billions of USD for Boeing. Illustrative
examples include a USD 4 billion package in the State of
Washington (combining tax breaks, tax exemptions or tax
credits and infrastructure projects for the exclusive benefit of
Boeing) and a USD 900 million package in the State of
Kansas in the form of tax breaks and subsidised bonds. As
regards US federal measures, the EU has successfully
challenged the tax breaks -- in theory repealed in 2006 by
US legislation -- offered to Boeing under the Foreign Sales
Corporation successor legislation, the American Jobs
Creation Act. These tax benefits, which the EU estimates at
a value to Boeing of USD 2.1 billion over the period 1989-
2006, were supposed to end on 1 January 2007. However,
a recent official IRS Memorandum allows US exporters,
including Boeing, to continue to benefit from the illegal tax
breaks even after the end of 2006 which should have
marked the end of all benefits under the FSC and successor
legislation. The EU is challenging these continued subsidies
to Boeing, which could amount to USD tens/hundreds of
millions. In addition to the federal tax breaks, the EU is

131
Study on "EU-US High Level Working Group"
Source Sector Name Description
challenging the US system under which: federal R&D
contracts ultimately benefit Boeing's LCA division and
Boeing's aircraft models;- Boeing sees its own R&D
expenses reimbursed;- Boeing benefits from extensive
cooperation with NASA and DOD engineers at no cost;-
Boeing is able to use testing facilities and equipment also at
no cost. In addition, under this system, a large number of
patents and other technologies are put at the disposal of
Boeing free of charge, including through the transfer of
patents held by US federal agencies (and resulting from US
government funded research) to Boeing. The EU estimates
the total benefits of federal research programs to Boeing at
around USD 16.6 billion. The EU considers that the above
mentioned subsidies are in violation of Articles 3, 5, and 6 of
the SCM Agreement and Article III of the GATT 1994.The
EU intends to demonstrate before the WTO panel that the
above subsidies benefiting Boeing have allowed the
company to engage in aggressive pricing of its aircraft
which has caused lost sales for and injury to Airbus.
Consultations were held in Geneva on 5 November 2004.
On 12 January 2005, the EU and the US agreed to suspend
WTO action for 3 months pending discussions towards the
conclusion of a new bilateral agreement on subsidies for
Large Civil Aircraft. However, both sides did not reach an
agreement and in the following, the US requested the
establishment of a panel on 31 May 2005; the EU submitted
a similar request the same day. During the DSB meeting on
13 June 2005, the US argued that a number of the
measures referred to in the EU panel request of 31 May
2005 were not listed in the consultation request of October
2004. For reasons of absolute legal certainty, the EU on 27
June 2005 filed a second consultation request which
explicitly lists all the measures in question. The US has
accepted the request for consultations, which were held in
Geneva on 3 August 2005.The Panel was established on 20
July 2005 and composed on 17 October 2005. The first
phase of the fact-gathering (Annex V) procedure was
completed by 22 December 2005 with the submission of
replies by the parties to follow-up questions posed on
information submitted on 18 November. The Facilitator
submitted his report on the above procedure to the Panel on
24 February 2006.During the Annex V procedure the US
refused to provide information, inter alia, on 13 programmes
not explicitly listed in the initial consultation request of the
EU. Unlike the EU, which filed a request for preliminary
rulings in DS316 on 26 October 2005 requesting the Panel
to clarify the scope of the proceeding, the US refused to do
so in DS317. In view of this, on 23 November 2005 the EU
requested the Panel to invite the US to make a preliminary
ruling request before the completion of the Annex V

132
Study on "EU-US High Level Working Group"
Source Sector Name Description
process, or take any other decision with equivalent effect.
The Panel did not issue such a decision. The final working
procedures only require the US to make a preliminary ruling
request at the latest at the time of their first submission. This
situation of procedural limbo needed to be resolved quickly,
since the US non-cooperation deprived the EU of access to
documents falling within the scope of the dispute, in
particular regarding NASA and Department of Defence
subsidies. Consequently, the EU on 20 January 2006 filed a
request for the establishment of a (second) panel based on
its second request for consultations of 27 June 2005. The
(second) panel (for DS317) was established on 17 February
2006. Subsequently, the US submitted a second
consultation request in DS316 on 31 January 2006 (now DS
347), which has largely the same purpose as the EU
request, i.e. to explicitly list measures which were contained
in the US panel request, but not in the consultation request.
The US repeatedly blocked the initiation of an Annex V
process during DSB meetings. On 23 May 2006 the EU
transmitted Annex V questions for the US to the Facilitator.
The questions were substantially identical to the questions
submitted in the previous Annex V procedure, but some
new questions had been added. This was followed by a
meeting between the parties, the Facilitator and the WTO
Secretariat to resolve the blockage of the Annex V
procedure, to no avail. The Facilitator then informed parties
on 6 June 2006 that his views were that the initiation of an
Annex V procedure requires positive consensus -- the EU
objected, providing its own understanding of WTO law. The
EU requested the WTO Director General to compose the
panel in DS317 bis (second offensive EU case) on 17
November 2006. The Panel was composed on 23
November 2006, with Mr. Crawford Falconer as Chairman,
and Mssrs. Franciso Orrego Vicuna and Varachai Plasai as
Members. On 4 December 2006 the WTO Secretariat
renamed DS317 bis, which became DS353.Pursuant to the
composition of the Panel, the EU filed a request for
preliminary ruling to the Panel on 24 November 2006,
asking the Panel to:- either rule that the Annex V
information-gathering procedure had been initiated at the
EU"s request in April/May 2006, and that the US was under
an obligation to answer the questions that have been put to
them on 23 May 2006- or, alternatively, to use its fact-
seeking powers under Article 13 DSU to request the US to
provide relevant information that would be identified by the
EU. The Panel rejected the EU's requests, and responded
that it would not use its Article 13 DSU prerogatives before
the parties have filed their first written submissions.
Subsequently, following the first meeting of the Panel with
the parties, the Panel posed questions to the Parties,

133
Study on "EU-US High Level Working Group"
Source Sector Name Description
including a number of questions to the US that related to the
EU's earlier request. The EU filed its first written submission
on 22 March 2007. The US for its part filed its first written
submission on 6 July 2007. Third Parties filed their first
written submissions on 1 October 2007.The first meeting of
the Panel with the parties took place on 26 and 27
September 2007. The Parties had also agreed that parts of
the hearing should be open to the public. As a result, a
public screening of the open parts of the hearings was
scheduled to take place at the WTO on 28 September
2007.The Parties filed their rebuttal submissions on 19
November 2007 (instead of 6 November 2007 as initially
scheduled), and filed their responses to the Panel's
questions, on 5 December 2007. The first meeting of the
Panel with the Third Parties will take place on 15 January
2008, followed by the second meeting of the Panel with the
Parties on 16-17 January 2008. According to the current
timetable, the issuance of the final Panel report is due on 16
June 2008.In addition to the WTO case, the EU has also
expressed its concern over legislation (Fiscal Year 2002
Defence Appropriations Act) that would have allowed 100
tanker aircraft to be ordered by the US Air Force (USAF)
from Boeing (KC-767A tanker program) without allowing
real competition from EADS/Airbus, which would have
resulted in procurement at a price substantially above the
market value of the aircraft. This legislation may also have
contributed to a procurement scandal within the Air Force
leading to several criminal, legislative, and administrative
investigations of both government and Boeing officials, and
to the cancellation of the contract awarded to Boeing under
the KC-767A tanker program. In the wake of these
investigations, the Fiscal Year 2005 Defence Authorization
Act, which would seem to allow for competition, and the
pledge by DoD (following a report of the DoD Inspector
General on this matter) to seek such competition should the
Air Force decide it needs new aircraft, chances for true
competition appear much better. The Request for
Information from USAF included language that would in
effect have prevented EADS and its partner Northrop-
Grumman to bid in the new competition. This language was
subsequently removed from the Request for Proposal. The
European Commission will continue to monitor the situation.
MADB Horizontal Anti-dumping
measures:
practice of zeroing
Zeroing is a calculation device used by the United States for
increasing, often substantially, the exporter's margin of
dumping and thus the amount of anti-dumping duty paid.
Zeroing has two main effects on EU exporters. Firstly, it
increases the amount of duty paid on those goods exported
to the US, thus reducing their competitiveness. Secondly, by
increasing the rate of anti-dumping duty, it deters many
exporters from exporting to the US at all. It is important to

134
Study on "EU-US High Level Working Group"
Source Sector Name Description
note that in reviews, the US can either increase or decrease
the level of anti-dumping duty. This contrasts with the EC
system, in which anti-dumping duties can only be refunded
to importers if the dumping margin goes down, not
increased if it goes up. In addition, while the EC compares
average prices in such cases, the US uses zeroing (i.e. it
disregards the non-dumped transactions). Hence, zeroing in
reviews in the US system (with its ability to increase the
duty rate) can be said to give the US a "structural
advantage" over the EC and other WTO Members.
MADB Horizontal Berry Amendment
to the 1941
Defence
Appropriations Act
The concept of national security was originally used in the
1941 Defence Appropriation Act to restrict procurement by
the DoD to US sourcing. Now known as the Berry
Amendment, its scope has been extended to secure
protection for a wide range of products only tangentially
related to national security concerns -- for example, the
1992 General Accounting Office ruling that the purchase of
fuel cells for helicopters is subject to the Berry Amendment
fabric provisions, and the withdrawal of a contract to supply
oil containment booms to the US Navy because of the same
textile restrictions.
MADB Horizontal Byrd Amendment
(Continued
Dumping and
Subsidy Offset
Act)
The Continued Dumping and Subsidy Offset Act (CDSOA or
the so-called Byrd Amendment) signed into law in October
2000, provides that proceeds from anti-dumping and
countervailing duties shall be paid to the US companies
responsible for bringing the cases. Following the
condemnation of the Byrd Amendment in the WTO in
January 2003, the United States finally repealed the Byrd
Amendment on 8 February 2006, but allowed for a transition
period. The repeal will not affect the distribution of the anti-
dumping and countervailing duties collected on imports
made before 1 October 2007. Since in the US, these duties
are usually collected several years after the import, this
means, in turn, that distribution under the Byrd Amendment
may continue for several years after 1 October 2007. The
Congressional Budget Office foresees that the repeal of the
Byrd Amendment will not produce effects before 1 October
2009.
MADB Horizontal Container Security
Initiative (CSI)
The US launched the Container Security Initiative (CSI) in
2002 so as to counter potential terrorist threats to the
international maritime container trade system. The CSI
consists of 4 elements: security criteria to identify high-risk
containers; pre-screening containers before they arrive to
US ports; using technology to pre-screen high-risk
containers and developing and using smart and secure
containers. The CSI screening and related additional US
customs routines are allegedly causing significant additional
costs and delays to shipments of EU machinery and
electrical equipment to the US. This burden is so severe
that a number of small European engineering companies

135
Study on "EU-US High Level Working Group"
Source Sector Name Description
have decided not to export to the US any longer because of
CSI. There is also competitive distortion in this fiercely
competitive engineering market between EU and US
engineering companies since up to now there is, de facto,
no reciprocity between the EU and the US.
MADB Horizontal FDI limitations
imposed by the
CFIUS / FINSA
framework
The Foreign Investment and National Security Act of 2007
("FINSA") amends the so-called Exon-Florio amendment of
the Defence Production Act of 1950, which authorises the
US President to investigate foreign acquisitions, mergers,
and takeovers of, or investments in, US companies from a
national security perspective.
MADB Horizontal Helms-Burton Act The Helms-Burton Act among others (a) allows US citizens
to file lawsuits for damages against foreign companies
investing in confiscated US (including Cuban-American)
property in Cuba (Title III of the Act) and (b) requires the US
Administration to refuse entry to the US of the key
executives and shareholders of such companies (Title IV of
the Act). The EU is of the view that these measures are
contrary to US obligations under the WTO Agreements, in
particular the GATT and GATS. In that respect, the EC
initiated a WTO dispute settlement procedure on 3 May
1996.
MADB Horizontal Hormones Dispute
(Continued
Suspension of
Obligations)
In 1989 the EU banned imports of hormone treated meat.
The US and Canada responded by imposing retaliatory
measures, suspending their obligations and imposing import
duties in excess of bound rates on imports from the EU, and
by initiating a WTO dispute settlement proceeding. The EU
based its new Hormones Directive of 22 July 2003 on a full
scientific risk assessment. Despite compliance with WTO
rules the US (and Canada) to this date continue to apply
their retaliatory measures.
MADB Horizontal Iran Non-
Proliferation Act
On 14 March 2000, the Iran Non-Proliferation Act (INPA)
was signed into law. It provides for discretionary sanctions
against foreign companies transferring to Iran goods,
services and technology listed under the international export
control regimes, as well as any other item prohibited for
export to Iran under US export control regulations, as
potentially contributing to the development of weapons of
mass destruction.
MADB Horizontal Iran-Libya
Sanctions Act and
Iran Freedom
Support Act
The Iran and Libya Sanctions Act (ILSA), signed into law on
5 August 1996, provided for mandatory sanctions against
foreign companies that made an investment above US$20
million contributing directly and significantly to the
development of petroleum or natural gas in Iran or Libya. In
addition, mandatory sanctions were also applicable against
companies that violated the UN Security Council trade
sanctions against Libya.
MADB Horizontal Lacey Act - Scope
and
implementation of
The Lacey Act serves as an anti-trafficking law protecting a
broad range of wildlife and wild plants. In May 2008, the
Lacey Act was amended to extend its scope to all plants,

136
Study on "EU-US High Level Working Group"
Source Sector Name Description
the US legislation
to combat illegal
logging
including timber or associated wood products with the
objective to combat illegal logging. The amendment added a
new requirement for an import declaration, which will oblige
importers of covered plants and plant products to list
shipment information along with information such as plant
scientific name and country of harvest to prove compliance
with the Lacey Act requirements. Domestic products are not
subject to similar reporting requirements.
MADB Horizontal Memoranda of
Understanding
(Defence
Acquisitions)
There has been a trend towards making the DoD's other
domestic preferences, apart from the Buy American Act
preferences, less restrictive by expanding the preference to
qualifying countries. These are countries that maintain
reciprocal memoranda of understanding (MoU) with the US.
The following examples illustrate the large variety of
obstacles facing EU exporters to the US:
- Specific requirements to produce goods on US soil;
- There is no grant-back given for changes made to
products by the licensee;
- Foreign comparative tests (FCT) are carried out to assess
the best product for goods not produced in the US;
- Barriers arising from the use of the Foreign Military Sales
Regulation (FMSR);
- Technical data / Technology export control requirements;
- US subsidiaries;
- Lack of access to bidder conferences/security clearance
considerations.
MADB Horizontal Principle of First-
to-Invent
The US patent system applies the principle of "first-to-
invent", while the rest of the world follows the principle of
"first-to-file", fixing thereby a clearly defined moment when
the priority right to a patent is established. The first-to-invent
principle creates several obstacles for EU and US
companies trying to obtain a patent right in the US, namely
because it has a considerable economic impact on the
potential right holder.
MADB Horizontal Procurement: Buy
American Act
The Buy American Act (BAA), initially enacted in 1933, is
the core domestic preference statute governing US
procurement. It covers a number of discriminatory
measures, generally termed Buy American restrictions,
which apply to government-funded purchases. The
Executive Order 10582 of 1954, as amended, expanded the
scope of the BAA in order to allow procuring entities to set
aside procurement for small businesses and firms in labour
surplus areas, and to reject foreign bids either for national
interest or national security reasons.
MADB Horizontal Section 407 of the
Trade and
Development Act
(Carousel Law)
Section 407 of the Trade and Development Act enables the
U.S. Trade Representative (USTR) to periodically revise the
list of products subject to retaliation when, according to the
U.S., another country fails to implement a WTO dispute
decision. The periodic revision of the law has become
known as "carousel retaliation." The law provides for a

137
Study on "EU-US High Level Working Group"
Source Sector Name Description
mandatory and unilateral revision of the list of products
subject to suspension of GATT concessions 120 days after
the application of the first suspension and then every 180
days thereafter.
MADB Horizontal Small Business
Act
The Small Business Act of 1953 (SBA), as amended,
requires executive agencies to place a fair proportion of
their purchases with small businesses. Under the SBA, any
contract for the purchase of goods or services with an
estimated award value greater than US$3,000 but not
exceeding US$100,000 will be automatically set-aside for
(US) small business unless fewer than two small
businesses submit competitive bids for that procurement.
Small business set-asides can occur in procurements above
US$100,000 on a discretionary basis. In addition to meeting
certain size criteria, a business is eligible for small business
status, for procurement purposes, only if it maintains a place
of business in the US and makes a significant contribution
to the US economy through payment of taxes and/or use of
US products, materials, and/or labour.
MADB Horizontal US Customs
Refusal of EU
Origin ("Made in
EU")
US Customs does not recognise the EU as a country of
origin, nor does it accept EU certificates of origin. In order to
justify EU country of origin status, EU firms are required to
furnish supplementary documentation and follow further
procedures, which can be a source of additional costs.
MADB Horizontal US Dual-Use
Export Controls
A comprehensive system of export controls was established
under the Export Administration Act of 1979 (EAA) and the
US Export Administration Regulation (EAR) to prevent trade
to unauthorised destinations. This system, among other
things, requires companies, incorporated and operating in
EU Member States, to comply with US re-export controls.
License Exception APR (Additional permissive reexports)
allows the reexports from Country Group A:1 and
cooperating countries, but that does not include Bulgaria,
Cyprus, Czech Republic, Estonia, Hungary, Latvia,
Lithuania, Malta, Poland, Romania, Slovakia and Slovenia.
This includes compliance with US prohibitions on re-exports
for reasons of US national security and foreign policy.


139
Study on "EU-US High Level Working Group"
Annex E – Interviews
Table E.1 List of people consulted for this project
Nr Sector Naam Branche of Bedrijf
1 Agro& Food Murk Boerstra Top team
2 Agro&Food Frans van Dongen Branche
3 Agro&Food Hans Leersen Branche
4 Agro&Food Wim Kloosterboer Bedrijf
5 Agro&Food Jan Maarten Vrij Branche
6 Agro&Food Willlem-Jan Laan Branche + bedrijf
7 Horticulutre Rubert Konijn Top team
8 Horticulture Henk Westerhof Branche
9 Horticulture Inge Ribbens Branche
10 Horticulture Marian de Beuze Branche
11 Horticulture Paul van der Zweep Branche
12 High-tech Marc Hendrikse Top team
13 High Tech Arjan Vergouw Bedrijf
15 High Tech Aart Jan Smits Bedrijf
16 High Tech Bettina Tammes Bedrijf
17 High Tech Gert Demmink Bedrijf
18 Chemicals Rob Hartman Bedrijf
19 High Tech Jaap Decarpentier Wolf Bedrijf
20 High Tech Micha van Lin Branche
21 Chemicals Cees Maagdenberg Branche/ top team
22 Chemicals Rein Coster Branche
23 Chemicals Sabine van Gastel Bedrijf
24 Chemicals Jeroen Jochems Bedrijf

Sound analysis, inspiring ideas
BELGIUM – BULGARIA – HUNGARY – INDIA – THE NETHERLANDS – POLAND – RUSSIAN FEDERATION – SOUTH AFRICA – SPAIN – TURKEY – UNITED KINGDOM
P.O. Box 4175
3006 AD Rotterdam
The Netherlands
Watermanweg 44
3067 GG Rotterdam
The Netherlands
T +31 (0)10 453 88 00
F +31 (0)10 453 07 68
W www.ecorys.nl