Embed Size (px)
Citation preview

MORPHOLOGICAL STABILITY OF A DREDGED CHANNEL FOR RIVER
TRAINING: A CASE STUDY ALONG THE BRAIDED JAMUNA RIVER
MD. MOSIUR RAHMAN
INSTITUTE OF WATER AND FLOOD MANAGEMENT
BANGLADESH UNIVERSITY OF ENGINEERING AND TECHNOLOGY
NOVEMBER 2013

Morphological Stability of a Dredged Channel for River Training: A Case Study
along the Braided Jamuna River
by
Md. Mosiur Rahman
In partial fulfillment of the requirement for the degree of
MASTER OF SCIENCE IN WATER RESOURCES DEVELOPMENT
INSTITUTE OF WATER AND FLOOD MANAGEMENT
BANGLADESH UNIVERSITY OF ENGINEERING AND TECHNOLOGY
November 2013

BANGLADESH UNIVERSITY OF ENGINEERING AND TECHNOLOGY
INSTITUTE OF WATER AND FLOOD MANAGEMENT
The thesis titled ‘Morphological stability of a dredged channel for river training: A
case study along the braided Jamuna River’ submitted by Md. Mosiur Rahman, Roll
No. 1009282006, Session: October 2009, has been accepted as satisfactory in partial
fulfillment of the requirements for the degree of M.Sc. in Water Resources
Development on 18th
November, 2013.
BOARD OF EXAMINERS
........................................... Chairman
Dr. Md. Munsur Rahman (Supervisor)
Professor
Institute of Water and Flood Management
Bangladesh University of Engineering and Technology, Dhaka
........................................... Member
Dr. Md. Munsur Rahman (Ex-Officio)
Professor and Director
Institute of Water and Flood Management
Bangladesh University of Engineering and Technology, Dhaka
…………………………….. Member
Dr. Mashfiqus Salehin
Professor
Institute of Water and Flood Management
Bangladesh University of Engineering and Technology, Dhaka
………………………………… Member
Dr. Anisul Haque
Professor
Institute of Water and Flood Management
Bangladesh University of Engineering and Technology, Dhaka
………………………………… Member (External)
Professor Dr. Monowar Hossain
Executive Director, IWM
House 496, Road 32, New DOHS, Mohakhali
Dhaka-1206

CANDIDATE’S DECLARATION
It is hereby declared that this thesis or any part of it has not been submitted elsewhere
for the award of any degree.
……………………..
Md. Mosiur Rahman
Roll No. 1009282006
Session: October 2009

Dedicated to My Family

1
CHAPTER ONE
INTRODUCTION
1.1 Background and present state of the problem
Bangladesh is a delta formed by the alluvial deposits of the three major rivers: the Ganges,
the Brahmaputra and the Meghna. There are 311 rivers in Bangladesh of which 53 rivers
come from India and other 4 rivers come from Myanmar. The Ganges, the Brahmaputra
and the Meghna of these three major river systems drain around 1,350 billion cubic meter
of discharge annually from a total catchment area around 1.72 million sq.km through
Bangladesh into the Bay of Bengal. Therefore the role of 311 rivers are mainly bring flow
season for various purposes. The major rivers of Bangladesh also carry huge sediment
load from the large catchments a resulting to about 1.0 to 1.1 billion tons annually. The
Jamuna is one of the largest braided rivers in the world. The changing planform of banks
and sandbar of the river not only cause suffering to the people living along its course but
also cause national losses damaging cultivated land, settlements, commercial centers and
infrastructures. Therefore, the better understanding of the behavior of the river would be
useful to mitigate losses by river erosion.
For a scientific and rational approach to different river problems and proper planning and
design of water resources projects as well as understanding of the morphology and
behavior of the river is a pre-requisite. Morphology of river is a field of science which
deals with the change of river plan form and cross-sections due to sedimentation and
erosion. In this field, dynamics of flow and sediment transport are the principal elements.
The morphological studies play an important role in planning, designing and maintaining
river engineering structures. Due to carrying huge sediment loads with low gradient,
riverbed aggradations is most pronounced for the major rivers of Bangladesh. The
morphology of the major rivers is very dynamic in nature and frequent human
interventions caused the rapid declining the behavior of river morphology. These
metamorphoses have been changing the flood regimes, agricultural practices, floodplain
ecosystem and navigation. The Old Brahmaputra River was navigable for steamers only
about 60 years ago, but presently it is an abandoned channel. This picture is true for many
other distributaries of the Ganges and Meghna Rivers. Human interventions without

2
considering the river morphology often caused the aggradations and reduced navigability
as well as the water carrying capacity of rivers.
A comprehensive study of capital dredging and sustainable river management in
Bangladesh has been formulated in water sectors to cope with the challenges of bank
erosion, sediment transport, flood control and navigation etc. (BWDB-IWM, 2013). The
main objectives of these studies was to advise a management plan of major rivers,
tributaries and distributaries for mitigation of flood and erosion management, to improve
navigability and to argument dry season flow in the distributaries considering capital
dredging and river training works and other interventions. This strategy and action plan
will identify the conceptual framework of capital dredging for flood and erosion
management, explore financial options and formulate options for implementation. The
study will be composed of capital dredging, river training works, sustainable maintenance
dredging module, spoil management, channelization of the main rivers, afforestation,
navigation, land development, fisheries development, environmental management plan
and monitoring etc.
The erosion and shifting of river courses, loss of land, especially along the Jamuna river
have long been recognized as a natural problem that affects a sizable population in
Bangladesh. The overall width of the river exhibits an increasing trend, especially at the
upstream part of the Jamuna River. To mitigate the river bank erosion, government has
taken a decision to immediately implement capital dredging in the Jamuna River in a pilot
basis. Total length of the pilot dredging is about 20 km from upstream of Sirajgonj hard
point to downstream of Banghabandhu Bridge near Dhaleswari Offtake. The main purpose
of this pilot capital dredging is to divert the flow from the west channel into a mid channel
to reduce the risk of failure of Sirajganj Hard Point and to guide the flow along the middle
of the existing char through the Bangabandhu Bridge to near Dhaleswari Offtake. It is
expected to reduce the risk of riverbed scour along the Sirajganj Hard Point and also
reduce the erosion of west guide bund of Bangabandhu Bridge. To achieve the above
target through pilot dredging, the analysis of sustainability of due dredged channel is very
important.

3
Figure 1.1: River systems of Bangladesh. (Source: BWDB, 2010)
1.2 Objectives with specific aims and possible outcome
This study is intended to assess the morphological stability of the 20 km dredged channel
along the braided Jamuna River. The main objective of the study is to assess the erosion
processes and its management plan with respect to flow regime. The specific objectives
are as follows:

4
(i) To assess the historical trend of channel shifting based on secondary data.
(ii) To assess the physical response within the dredged channel under changing flow
regime.
(iii) To clarify the causes of changes of hydraulic parameters and the sustainability of the
dredged channel.
1.3 Rationale of the study
This study would be useful to assess the role of capital dredging in comprehensive river
management plan along the braided Jamuna river of Bangladesh. In particular cases:
It may also serve as a guideline for further studies relevant to this topics;
It can be helpful for decision making regarding this problems;
This study finds out some measures that can be used for the fixation of future
planning;
It would provide guideline to undertake similar type of work in other rivers of
Bangladesh;
1.4 Scope of work of this study
This study would be helpful to investigate the rate of siltation and stability of an artificial
dredged channel along the sand bed braided Jamuna River. The scopes of works of this
study are as follows:
Primary and secondary data collection of the Jamuna River from available sources;
Satellite image analysis to assess the historical change of channel shifting;
Assessment of backfilling rate of the dredging;
Preparation of future dredging plan for braided river using morphological model at
the end of the pilot dredging;
1.5 Limitations of the study
Major limitations of this study are summarized below:
(i) The hydro-morphological characteristics of a natural river depends on a number of
variables such as water level, flow velocity or discharge, channel planform, bed
5
topography, bankline shifting, bar dynamics, sediment transport etc. It was not
possible to collect all primary data for this study;
(ii) To clarify the causes of changes of hydraulic flow regime, measurement of all
parameters for this study is difficult and quite impossible. The findings are case
specific and extrapolation of the result to other areas should be extended with
careful judgment;
1.6 Structures of the thesis
Chapter two mainly focuses on the literature review; chapter three prevails study area,
while chapter four elaborates methodology of the study. Chapter’s five summarizes results
and prevails discussion. Finally, in chapter six focuses on conclusion and
recommendations.

6
CHAPTER TWO
LITERATURE REVIEW
2.1 Brahmaputra-Jamuna River system
Bangladesh is the lower riparian of Brahmaputra-Jamuna River system. The river is
originated in the glacier of Jimayanzhong at the north foot of the Himalayas Mountain in
south Tibet of China. Then the river sharply turns southward thus forming the famous
yalutsangpojiang great bend. When the river passing through Bacuca enters to India, it is
called the Brahmaputra River. The river basin of Brahmaputra-Jamuna includes parts of
China, Bhutan, India and Bangladesh. Total catchment area is 560,000 sq.km out of which
42,000 sq.km is lying in Bangladesh. The tributaries of the river are Dudhkuma, Dharla,
Teesta, Karotoa and Atrai. The distributaries are Old Brahmaputra, Jhenai, Bangshi and
Dhaleswari. The river basin represents a higher rainfall area with an annual average
rainfall of around 1900 mm; the water yield per square kilometer of the drainage basin is
around 0.03 m3/s. The major river then rolls down the Assam valley from east to west for a
distance of about 720 km and thereafter the river swings round the spurs of the Garo hills
and enters Bangladesh. At the Indo-Bangladesh boarder, the river again turns south and
continues as Jamuna to its confluence with the Ganges near Aricha. After meeting Ganges
River and Meghna River near Chandpur, the combined flow of the three rivers further
southwards under the name of river lower Meghna and consequently empty into Bay of
Bengal. The river is approximately 2,900 km long, out of which 240 km from Noonkhawa
to Aricha is lying in Bangladesh. In response to the rainfall distribution, the river stage
varies by about 6m.
The characteristic feature of the hydrograph of the Jamuna is the existence of the broad
peak between July-September. The river drains an estimated 620x109 m3 of water
annually to the Bay of Bengal. The discharge varies from minimum of 8,000 m3/s to
maximum of about 100,000 m3/s while the dominant discharge of the river is 38,000 m
3/s
and bank full discharge is 48,000 m3/s. It has an average surface water slope of around 7
cm/km. The valley slope in Bangladesh decreases gradually from 0.10 m/km to 0.06
m/km. During monsoon, the average width of Jamuna River is 12.5 km with average
velocity 2 m/s. The average depth of the main channel of Jamuna is about 8 m and average
water depth above the chars is 1m to 2m during flood. Consequently, the Jamuna River

7
carries a heavy sediment load, estimated to be over 500 million tons annually. Most of this
is in the silt size class (suspended load) but around 15 to 25 percent is sand (bed load).
This sand is deposited along the course of the river and the clay fraction is transported to
the delta region. The composition of the bank materials is remarkably uniform and
consists of fine sand (FAP 1, 1994). The sand size sediment is relatively uniformly graded.
The range of d50 values of the Jamuna varies between 0.21mm to 0.14mm. The angle of
internal friction is approximately 30° for the Jamuna River. The river is connected with the
Padma River near Aricha and the combined flow rolls to Bay of Bengal through
Chandpur.
2.2 Geomorphological classifications of river
Rivers are found in different forms and geometries. Geomorphological classifications of
channel type have established qualitative links between channel process, form and
stability. Leopold and Wolman (1957) classified rivers as straight, meandering and
braided. They separated meandering and braided rivers depending on bankfull discharge
and slope of the channel. From the laboratory study, (Schumm and Khan, 1972) represent
straight, meandering and braided in terms of sinuosity versus valley slope.
Figure 2.1: Channel classification based on sediment load and system stability. (Source:
Schumm, 1977)

8
Types 1 and 2 are the straight and slightly sinuous channel, resulting from fine sediment
transport in suspension having highly erosion-resistant boundary material. Such channels
are confined by their bank boundary and display very slow rates of lateral bank shifting
and channel evolution. This planform is very rare in the natural rivers. Types 3 and 4 are
the meandering planform. Mixed-load stream with relatively mobile bed material and
greater sediment supply, resistant but somewhat erodible bank, generally follows
meandering courses. These channels migrate freely across the flood plain through bank
erosion and point bar growth. Type 5 is a braided planform. Rivers with sufficiently high
energy to transport relatively coarse sediment as significant bed load and with weak bank
material tend to have multithreaded and braided pattern. Braided channels are very
unstable; they wander across their flood plains unpredictably through a combination of
rapid localized bank erosion and frequent anabranch avulsion.
2.3 Characteristics of a braided river
The detailed formation processes of a braided river are still poorly understood and the
hydraulic parameters of a braided stream are extremely complex (Coleman, 1969). Leopold
and Wolman (1964) described the development process of a braided bar in a laboratory flume
as shown in Figure 2.2. The uncommented sandy flume channel was straight initially. A
small deposit of grains in Figure 2.1 “A” of coarser sediment was introduced by lag deposit
of the coarser fraction, which could not be carried by the flow. The probable reason for this
initial deposition given by Leopold and Wolman was that the turbulent flow creates the
fluctuation of instantaneous velocity, which causes a brief decrease in intensity allowing
some particles to rest. Once initiation of the bar has occurred it accretes vertically (shown in
“B” and “C”) as well as in downstream direction. The presence of a bar reduces the flow area
and diverts the flow towards the bank (shown in “D”), initiating bank erosion thus increasing
the flow area.
The velocity distribution over a mid-channel growing bar reduces after accreting the bar to a
certain level shown in “E” (Ashworth, 1995). This forces the flow further towards the bank
attributing the further widening of the channel. Widening of the channel increases the flow
area and drops the water level, which results in the bar emerging (“F”) for constant
discharge. These are the mechanisms of the mid-channel bar initiation as based on
(Leopold and Wolman, 1957). Migration of channels within the braid belt is mainly related

9
to the erosion of their outer bends which results from the curvilinear flow or from the
lateral or downstream expansion of sand bars, pushing the channels outward (EGIS, 2001).
Legend:
Deposit more sand than original sand
Island or area out of water
Figure 2.2: Steps in the development of a braiding process (Leopold and Wolman, 1957).
Figure 2.3: Channel classification in the Jamuna River (Bristow, 1987).
In a braided river third orders of channels are present (Williams and Rust, 1969). The
order of channels depends upon total discharge and fluctuation of discharge. The first
order comprises the whole river. Second order is the dominant channels within the river
whilst third order channels are primarily low stage features which modify the bars
deposited by the second order channels shown in Figure 2.3. According to Leopold and
Wolman (1964), there is a close relation between braiding and meandering. Braided channels

10
may exhibit curves that have a characteristic relation of radius to channel width and the river
has at least some reaches that would be called meandering. Also it is found from the study
on a large scale sand bed braided river that the flow structure in a bend of an anabranch
channel (i.e. second order channel) of a braided river is similar to a meander bend of
single thread rivers (FAP 24, 1996).
2.4 Channel formation and shifting process
In a braided river, there exist a number of channels within the braided belt. Leopold and
Wolman (1960) derived empirical relations for meandering rivers, which are as follows:
01.19.10 B (2.1)
1.17.2 BA (2.2)
98.07.4 R (2.3)
In which λ = meander length, A = amplitude and R = radius of curvature. The
definition diagram of these parameters is shown in Figure 2.5.
Figure 2.4: Diagram of meandering wave length, amplitude and radius of curvature.
Relating the second order braided channel with the meander formation Klaassen and
Vermeer (1988) found some deviations. They derived a relation at a station of the
Jamuna River based on Lacey’s regime relation, considering different levels in the cross-
sections for different discharges and corresponding water surface width and average
depth which they estimated from the BWDB measured cross-section. The discharge in an
individual channel was estimated as indicated in the regime relations. On average, the
flow depth and width relations with discharge are expressed as below:
23.056.0 Qh (2.4)
51.09.18 QB (2.5)

11
These relations indicate that the channels of the Jamuna River are quickly responding to
adjust their depth and width with the variation of discharges. However, no channel in the
Jamuna River is in regime condition and continuous change of channel development and
abandonment is a common phenomenon. Due to the periodic formation and decay of large
chars and sandbars in the Brahmaputra-Jamuna River, constantly changing river currents
attack its banks and cause erosion at apparently random locations. Such bank erosion may
initially reach rates of several hundred meters per year and create and embayment in the
bank several kilometers long as the river channel seeks to readjust its channel capacity to
accommodate a growing char. Historical developments of rivers of Bangladesh are shown
in Figure 2.4.
Figure 2.5: Historical development of rivers in Bangladesh.

12
2.5 Effects on channel stabilization
Channelization involves changing one or more of the interdependent hydraulic variables of
slope, width, depth, roughness or size of the sediment load. Channelization has a great
impact on a river because it disrupts the existing physical equilibrium of the watercourse.
To compensate for the alteration in one or more of the hydraulic variables and to establish
a new, stable equilibrium, other parameters will change. The gradient and the velocity of
flow determine the erosion and transport of material. The gradient and velocity of flow are
increased by channelization and as a consequence the equilibrium is brought out of
balance. The watercourse will attempt to regain its state of equilibrium as a result, the
increased waterpower can cause bank erosion and the channel may suffer serious scour
and ultimately failure, which is if no protective revetment is installed. River
channelization often leads to a significant legacy in terms of maintenance and
bank/channel stabilization.
The cumulative effects of long-term watershed development and river works have had
extensive adverse impacts on our rivers. Direct disturbance to channels by straightening,
lining, draining, raising, lowering, clearing, dredging in the name of flood control,
navigation and other single-purpose objectives have taken a serious toll on the physical
and biological functions of our rivers. The flow field and bed morphology around the bank
protection structures either intrusive or nonintrusive, very specially and temporally but
maintain certain common features depending on the type of the structures. The strong
vortex system in front of and return currents behind the upstream termination of the
Sirajganj Hardpoint are the major engines for the morphological variations and are also the
main causes of structural failure. Moreover, the intensity of flow around the termination is
closely related to the evolution is nearby sandbars (Rahman, 2011).
The applicability of (Ikeda, 1981; Hasegawa, 1984) formulae for bend development is
tested to the meandering channels existing in the Jamuna Bridge site. It is found that these
formulae are applicable for the braided rivers. Another criterion of (Jaeggi, 1984) is
applied to test whether the sand bar in the study reach had obtained its equilibrium height
or not. The main channel of the Jamuna River has been shifting from west (right bank) to
east (left bank) direction. From 1985 to 1992 at 4 km upstream of the bridge, the shifting
of the left bank of the main channel was 1.43 km and in 1996-97 it was 0.65 km described

13
by (Alam, 2004). However during the period from 1997 to 1999, at 4 km upstream of the
bridge, the shifting of the left bank of the main channel was 5.04 km.
Channelization has immediate and direct effects on stream processes because it involves
direct modification of the river channel. Reasons for modifying river channels include
flood control, speedier storm water conveyance and drainage of adjacent lands, navigation,
bank stabilization, erosion control and protection of highways (Keller 1976). Most of the
early studies on the effects of channelization concentrated on the physical effects and
changes that occurred to the stream channel. Later, biological effects also began to be
noted and evaluated. In 1978, a Task Committee of the Hydraulics Division of the
American Society of Civil Engineers did a general overview on the environmental effects
of various hydraulic structures (Task Committee, 1978). The combined effect of the
physical and biological changes are benthic macro-invertebrates, fish and aquatic/riparian
vegetation from algae and macro-phytes to riparian shrubs and trees, as well as terrestrial
animals such as amphibians, reptiles, birds and mammals.
2.6 Erosion problem in the Jamuna River
River bank erosion is one of the major natural disasters of Bangladesh. It has caused
untold miseries to thousands of people every year living along the banks of rivers in
Bangladesh. To date, erosion alone has rendered millions homeless and has become a
major social hazard. Most of the slum dwellers in large urban and metropolitan towns and
cities are victims or riverbank erosion. In 2008 the Jamuna, the Ganges and the Padma
rivers eroded about 3,230 ha of land, 425 ha of settlement, 290 m of embankment, 1,840m
of district road, 590m of upazila road and 3,635m of rural road, during the same period the
Jamuna and the Padma eroded 19 educational institutions, 7 hat/bazaars and 2 government
offices (CEGIS, 2010). On the other hand, a prediction study by CEGIS based on satellite
image for the year 2009 indicates that around 2,180 ha of land, 420ha of settlement, 535m
of active embankment, 605m of district road, 900m of Upazila road and 4,320m of rural
road are vulnerable to erosion along the Jamuna, the Ganges and Padma. Moreover, 23
educational institutions, 4 hat/bazaars, 2 government offices and 2 health centers are
vulnerable to erosion along the Jamuna and the Padma rivers. Satellite image analysis
reveals that Brahmaputra-Jamuna river is migrating towards west/right bank floodplain.
From literature review, analysis of historic maps and satellite images indicates that the

14
Brahmaputra-Jamuna centerline has moved and average of 4.30 km west since 1830, with
a maximum westward movement of 13 km at its northern end. Analysis of a series of
recent images shows that this river is migrating westward at an average rate 75 m per year
(CEGIS, 2010). The centerline of Brahmaputra-Jamuna is moving and also has been
widening. The effects of bankline erosion and widening of the river channel have been
great.
Sirajganj is an old established town in Bangladesh. The urban and peri-urban development
has been expanded close to the river bank. It is reported that one kilometer of right bank
has already shifted in the westward direction since 1830 (Halcrow, 1994). The increased
river flow is attacking the bank directly at Kalia-Haripur bend. Local people informed that
some of them had to shift their homesteads from the bank four to six times and many of
them lost their agricultural lands into the river. At Char Malshapara, a school and a
madrasa went into the river. Char Malshapara mosque shifted three times. Potential
erosion at downstream of Hardpoint brought the bank line near BRE. The people of these
areas have become landless as well as poor. According to the information of the Union
Parishad member and the common people of Char Malshapara and Mara Gram, 40% of
the total people being landless and shifted from the villages. Bank erosion has made their
life miserable.
The unique natural setting of Bangladesh in the South Asian Sub-Continent and the
characteristics of tropical monsoon are greatly responsible for flood, sedimentation,
riverbank erosion and population displacement in Bangladesh. River bank erosion is
closely related to the magnitude of flood and bank materials of alluvial character. Rivers
flowing through these loose alluvial soils carry most of the eroded materials as sediment
on their way to the Bay of Bengal (Elahi, 1991; Islam, 1985). It is a frequent natural
disaster in Bangladesh. CEGIS annually estimate the amount of erosion and accretion
along the three main rivers: (the Jamuna, the Ganges and the Padma) of Bangladesh
(CEGIS, 2010). From the study it was found that Jamuna River is widening and both
banks are migrating outwards at a high rate for the last few decades. During the last three
and half decades (1973 to 2010), the net erosion along the 220 km long Jamuna River was
about 71,068 ha. The highest erosion was in Sirajganj district (20,967 ha). The annual
erosion along the Jamuna varies from one year to the other and also from one reach to the
other reach (CEGIS, 2010).

15
2.7 Erosion management and river training works
The rate of erosion along the right bank of the Jamuna River is higher than the left bank.
The Brahmaputra Right Embankment (BRE) was built during the late 1950s and mid-
1960s to protect the flood plain against flooding. The component was formulated to study
on short term and long term protection along the right bank of the Jamuna River (FAP1,
1994). Out of 10 locations, 6 priority vulnerable locations were selected for bank
protection measures. Under this component, construction of Hardpoint was suggested to
stabilize the boundaries of the braided belt. During 1998, hard points were built at
Sirajgang, Sariakandi and Mathurapara. The construction costs of the Hardpoint were very
high. About 30 river training structures were constructed along BRE mostly during the last
decade.
Bangladesh Water Development Board (BWDB) has mixed experiences of both failures
and successes of such projects for the protection of BRE (Uddin, 2007). During the period
of 1999-2002, fifteen RCC spurs have been constructed at different locations of BRE with
variable length and spacing. Out of these, five were damaged (Uddin, 2007). The primary
causes of failures of different bank protection structures are flow slide, oblique flow
towards bankline or structure and generated excessive local scour around bank protection
structures (BWDB, 2008; BWDB, 2006; BWDB, 1999). Repair and maintenance works
are very important for the river training works even around very expensive structures such
as the Hardpoint (BWDB, 1999).
Figure 2.6: Modes of failure of Sirajganj Hardpoint at 2009.

16
2.8 Environmental and social impacts of dredging
Dredging of the river is likely to have both positive and negative impacts on the
environmental and social components. Positive impacts of river dredging would include
increase in carrying capacity of the rivers leading to reduce the erosion. In addition to
increased navigation facilities, access to availability of surface water for domestic and
industrial use will improve. Definite improvements in flooding and drainage can be
expected owing to increased conveyance capacity of the rivers. Increased availability of
surface water would lead to increase in irrigated area which in turn will have very positive
impact on agricultural crop production. Dredging would make the rivers more stable
thereby reducing river erosion which is one of the major causes of increasing landlessness.
Reduced river erosion would ultimately contribute to poverty alleviation.
Most negative impacts of dredging are associated with the way the dredged spoil is
disposed. Common environmental and social components are likely to be negatively
impacted by dredging may include disturbance created for aquatic flora and fauna in the
water body, contamination of water due to leakage of oil and lubricants from the dredger,
land degradation due to disposal of the dredged material, contamination at the dredged
spoil disposal site, displacement of communities from the dredged spoil disposal site, etc.
However, it is possible to minimize the effect of the negative impacts through mitigation
measures developed as a part of the environmental and social impact assessment
(EIA/SIA) studies. In fact, proper operation and maintenance of dredgers would check
spillage of oil and lubricants thereby averting contamination of water while properly
planned and implemented disposal of dredged materials will take care of most negative
impacts.
2.9 Hydrometric information from Pilot Capital Dredging
The hydrometric data (cross section, water level, discharge, sediment concentration etc)
within study area would be collected from Institute of Water Modelling and Bangladesh
Water Development Board. Analysis of collected hydraulic data would be made to find
out the variation in the depth of flow resulting from sedimentation or scouring.

17
2.9.1 Sediment concentration and properties of river bed sample
Properties of a single sediment particle that is important in the study of sediment transport.
The sediment properties are size, shape, density, specific gravity, specific weight and fall
velocity. Size is the basic and most readily measurable property of sediment. Shape also
affects the transport of sediment, but there is no direct quantitative way to measure shape
and its effects. The shape factor is 1.0 for a sphere. Most natural sand particle have SF =
0.70.
The suspended sediment samples were collected from Jamuna River at Sirajganj Hard
Point to Dhaleswari offtake during 2011-2012. The sediment concentration measurement
corresponding to the relative depths was done as mentioned before. Sediment sample had
been collected at 2 verticals (maximum and minimum depth) during discharge
measurement. The location and time of sampling was related with the discharge
measurement timing and location. The following observations are given below:
The average sediment concentration in the Jamuna River within the study area was
found 419.80, mg/l, 446.83 mg/l, 444.15 mg/l, 376.52 mg/l, 409.41 mg/l in June,
July, August, September and October 2011 respectively.
The average sediment concentration in the Jamuna River from Sirajganj Hard Point
to Dhaleswari Offtake was found 402.56mg/l and 417.53mg/l in May & June 2012
respectively. The summary of sediment concentration is given in Table 2.1.
Table 2.1: Sediment concentration in the Jamuna River at different locations
Date Location Average sediment
concentration (mg/l)
22/05/2012
Sirajganj Hard Point 453.29
Dredged Channel 425.07
Right channel at D/S of Bangabandhu Bridge 278.57
Left channel at D/S of Bangabandhu Bridge 453.34
05/06/2012
Sirajganj Hard Point 252.56
Dredged Channel 161.08
Right channel at D/S of Bangabandhu Bridge 208.75
Left channel at D/S of Bangabandhu Bridge 216.24
16/06/2012 Sirajganj Hard Point 352.79
Dredged Channel 350.85

18
Date Location Average sediment
concentration (mg/l)
Right channel at D/S of Bangabandhu Bridge 432.11
Left channel at D/S of Bangabandhu Bridge 469.84
20/06/2012
Sirajganj Hard Point 418.48
Dredged Channel 460.82
Right channel at D/S of Bangabandhu Bridge 533.78
Left channel at D/S of Bangabandhu Bridge 486.51
26/06/2012 Sirajganj Hard Point 353.60
27/06/2012
Left Channel adjacent to dredged channel 523.12
Right channel at D/S of Bangabandhu Bridge 574.24
Left channel at D/S of Bangabandhu Bridge 885.71
26/06/2011 Right channel at D/S of Bangabandhu Bridge 271.63
Left channel at D/S of Bangabandhu Bridge 419.10
03/07/2011
Sirajganj Hard Point 489.89
Right channel at D/S of Bangabandhu Bridge 546.51
Left channel at D/S of Bangabandhu Bridge 516.64
09/07/2011
Sirajganj Hard Point 350.85
Right channel at D/S of Bangabandhu Bridge 572.26
Left channel at D/S of Bangabandhu Bridge 539.17
12/08/2011 Right channel at D/S of Bangabandhu Bridge 574.24
Left channel at D/S of Bangabandhu Bridge 243.89
22/08/2011 Right channel at D/S of Bangabandhu Bridge 581.81
Left channel at D/S of Bangabandhu Bridge 364.99
10/09/2011 Right channel at D/S of Bangabandhu Bridge 426.34
Left channel at D/S of Bangabandhu Bridge 326.71
02/10/2011 Right channel at D/S of Bangabandhu Bridge 250.53
Left channel at D/S of Bangabandhu Bridge 370.67
2.9.2 Siltation of the dredge channel
Sediment load is predominant for development of river bed and bank formation as well as
accretion of Jamuna River. The river regime is frequently reshaping its section due to sand
bar movement and it accelerates with the magnitude of flood. It is seen that the dredged
area is gradually silted up but increasing the conveyance area by eroding the char both side
of the dredged channel. The backfill measurement was carried out during dredging period
on the dredged channel and the backfill rate was found around 35-40 percent. The
observed siltations in the dredged area in different dates are listed in Table 2.2.

19
Table 2.2: The observed siltation in the dredged area in different dates
2.10 Summary on literature review
Human manipulation that changes the shape of a river’s natural flow patterns can affect
the river morphology. The literature review discussed the river pattern, classified on the
basis of appearance in a plan view as braided, straight and meandering river. These review
also emphasis mainly on the characteristics of the Jamuna River, flow process at bends
Chainage
Actual
Dredge
Volume
(lakh cum)
Observed Siltation in dredged
area
Remarks
Date
Backfil
volume
(lakh cum)
% of
dredge
volume
Km 0.0- km 3.0 19.90 13.09.13 12.33 62
1st year
maintenance
dredging-
2013
Km 10.0- km 12.50 55.09 14.09.13 41.11 75
Km 13.50- km14.00 5.63 14.09.13 5.62 99.87
Km 0.0- km 3.0 19.90 30.07.13 12.06 61
Km 10.0- km 12.50 55.09 31.07.13 45.32 82
Km 13.50- km14.00 5.63 31.07.13 5.33 95
Km 0.0- km 3.0 19.90 24.06.13 12.32 62
Km 10.0- km 12.50 55.09 25.06.13 21.26 39
Km 13.50- km14.00 5.63 25.06.13 4.12 73
Km 0.00 - km 14.00 118.86
07.06.12 43.47 37
Capital
pilot
dredging,
2012
16.06.12 50.17 42
26.06.12 45.97 39
Km 0.45- Km 14.00 99.96 08.07.12 49.96 50
Km 0.55- Km 14.00 93.12 16.07.12 53.44 57
Km 0.45-Km 14.00 99.96
23.07.12 50.88 51
03.08.12 49.79 50
24.08.12 46.28 46
12.09.12 49.48 49
9.10.12 57.29 57
22.10.12 59.31 60
Km 16.0- km 22.0 48.73
08.06.12 7.20 15
15.06.12 6.21 13
27.06.12 13.76 28
11.07.12 13.91 29
18.07.12 17.70 36
25.07.12 17.78 36
03.08.12 20.29 42
25.08.12 22.29 46
12.09.12 12.64 26
10.10.12 16.02 33
23.10.12 17.15 35

20
and bar migration through bends with limited emphasis on bank erosion and associated
impacts in Bangladesh. Development and abandonment of channels within a year is a very
common phenomenon in the river, which makes the river difficult for navigation.
Widening of the river also aggravated the problems. The potential impacts of
sedimentation in the Jamuna Rivers of Bangladesh are causing more floods, bank erosion,
char formation, channel shifting etc. All of which have severe implications on agriculture
production and livelihood of people. A pilot capital dredging is formulated to reduce the
erosion and maintain the navigability of the river. It is important to formulate a project
where dredging limits satisfy the requirements, dredging footprint and potential
environmental impacts. But before launching of any dredging work, it is important to
conducting of hydrographic survey, preparation of route plan; dredging methodology and
the disposal of the dredged materials are important activities for the sustainability of the
dredging channel. Recently, CEGIS observed and predicted that during the last three and
half decades (1973 to 2010) the net erosion along the Jamuna River was about 71,068
hectares of which 16,122 hectares in Sirajganj district. CEGIS also identified the most
vulnerable location of the reach is Kalia-Haripur area in between two important structures,
Sirajganj Hardpoint and right guide bund of Bangabandhu Bridge. So a complete study is
necessary for the understanding of overall situation. The present study will be useful for
conducting future development action and policy formulation related to bank erosion.

21
CHAPTER THREE
STUDY AREA
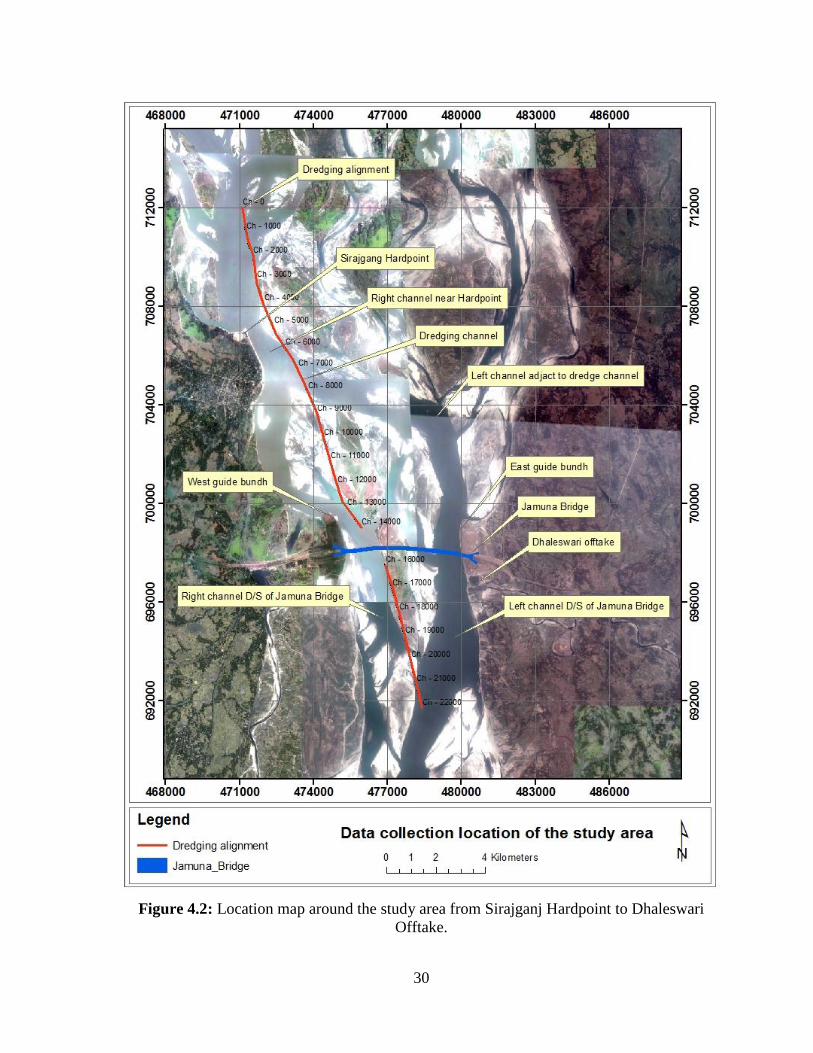
3.1 Study area
The study area is located from upstream of the Sirajganj Hardpoint to downstream of
the Bangabandhu Bridge near Dhaleswari offtake as shown in Figure 3.1. The total
length of the study area is around 20km, split by two segments. The upper segment is
14 km, starting from upstream of Sirajgonj hard point as KM-0, which end at KM-14.
The lower segment is 6 km, starting from KM-16, which end at KM-22. The centerline
co-ordinate of the 1st segment KM-0 is (24°31'28'', 89°42'43'') and KM-14 is
(24°24'25'', 89°45'35''). The centerline co-ordinate of the 2nd
segment KM-16 is
(24°23'36'', 89°46'10'') and KM-22 is (24°20'27'', 89°47'3''). The design section has
considered for dredging as 120m bed width, 1:3 side slope and 7 cm/km longitudinal
slope. The channel upstream bed level at KM-0 was 3.00 mPWD and downstream bed
level at KM-14 was -2.40 mPWD but a drop of bed level from 2.42 mPWD to -2.00
mPWD was done at KM-8.25 to KM-8.50. The bed level at KM-16 was 0.00 mPWD
and at KM-22 was -0.42 mPWD.
Table 3.1: Centerline coordinates of dredging alignment from Ch-0.0 m to Ch-22,000
m
Sl.
No
Chainage
(m) Latitude Longitude
Sl.
No
Chainage
(m) Latitude Longitude
1 0 24°31'27"N 89°42'43"E 12 11000 24°25'52"N 89°44'50"E
2 1000 24°30'55"N 89°42'48"E 13 12000 24°25'21"N 89°45'00"E
3 2000 24°30'24"N 89°42'57"E 14 13000 24°24'51"N 89°45'14"E
4 3000 24°29'52"N 89°43'03"E 15 14000 24°24'25"N 89°45'03"E
5 4000 24°29'21"N 89°43'14"E 16 16000 24°23'36"N 89°46'09"E
6 5000 24°28'51"N 89°43'28"E 17 17000 24°23'05"N 89°46'20"E
7 6000 24°28'22"N 89°43'44"E 18 18000 24°22'33"N 89°46'29"E
8 7000 24°27'54"N 89°44'03"E 19 19000 24°22'02"N 89°46'38"E
9 8000 24°27'25"N 89°44'17"E 20 20000 24°21'30"N 89°46'46"E
10 9000 24°26'55"N 89°44'30"E 21 21000 24°20'59"N 89°46'54"E
11 10000 24°26'23"N 89°44'41"E 22 22000 24°20'27"N 89°47'02"E

22
Figure 3.1: The study area showing from Sirajganj Hard Point to Dhaleswari offtake.

23
3.2 Physical features of the study reach
River bank erosion is a big problem of Bangladesh, especially along the braided Jamuna
River. Thousand hectares of land are eroded each year by the mighty Jamuna River.
Social and economic problems are created in consequence of erosion.
3.2.1 Topography
The area is a low lying flood plain area. Char Malshapara Gram and Mara Gram
villages are located at 400m to 650m inside from Brahmaputra Right Embankment
(BRE) respectively. Homesteads are located in a scattered way where lands are
relatively high and trees are found to give them privacy and shade. Due to consecutive
river bank erosion, people have to shift their houses several times and they take shelter
near Brahmaputra Right Embankment (BRE). The crest level of Sirajganj Hardpoint is
(+) 16.75 mPWD, whereas approximate ground level is (+) 13.00 mPWD (Uddin,
2010).
3.2.2 Demography
The study area is located in Sirajganj Sadar Upazila. The demographic characteristics of
the Upazila are reflected here. Sirajganj Sadar Upazila with an area of 325.77 sq.
kilometer has a population of 389160. Among them, the number of male is 51.54%,
female 48.46%; Muslim 95.16%, Hindu 4.80% and others 0.04%. Average literacy of
the area is 29.8% amongst which male literacy is 35.6% and female is 23.5%. The
significant educational institutions are BL High School (1869), Gyandayini High
School (1884), Islamia College (1887), and Sirajganj Government University College
(1940). Main occupations are agriculture 25.17%, agricultural labourer 15.76%, wage
labourer 4.37%, commerce 16.09%, service 12.55%, weaving 4.10%, transport 3.53%,
industrial labourer 4.12%, and others 14.31%. Total cultivable land is 23872.93
hectares, fallow land 772.16 hectares, single crop 21.44%, double crop 47.54%, and
triple crop land 31.02%; and cultivable land under irrigation is 42.38%. Among the
peasants, 7.53% are landless, 10.12% are marginal, 61.99% are small, 17.81% are
intermediate and 2.55% are rich.

24
3.2.3 Hydro-Morphology
The Brahmaputra-Jamuna River originates in Tibet on the northern slope of the
Himalayas and drains snowmelt and rainfall from China, Bhutan, India and
Bangladesh. Before it meets with the Ganges River at Aricha in Bangladesh, the river
travels a length of 2,740 km. Its total catchment area is 570,000 km2, of which only 7%
is within Bangladesh. Annual average precipitation in the catchment is 1,900 mm, of
which more than 80% precipitation occurs during the 5 months of the monsoon. The
water level starts rising in March/April due to snowmelt in the Himalayas and may
attain its peak between the beginning of July and mid-September. The annual average
flow is 20,000 m3/s as measured at Bahadurabad and the maximum estimated discharge
is 1,00,000 m3/s in 1998 (EGIS, 2000). Minimum flow in the river generally occurs at
the end of February or the beginning of March. The recorded low flow was 2,860 m3/s
in 1971 (FAP 24, 1996).
In the study reach, BWDB have no permanent discharge measurement station. IWM
measures discharge at three selected locations (Sirajganj Hard Point, upstream and
downstream of the Jamuna Bridge) at 15 days interval from April to October, 2012. The
average water level slope of the Jamuna River is 7.5 cm/km, varying from 8.5 cm/km in
the upstream part to 6.5 cm/km at the downstream end of the river (EGIS, 2000). The
Jamuna River is a braided river with a braiding index that varies spatially and
temporally. The range of variation is 2 to 5 (Klaassen and Vermeer, 1988). The overall
width of the river is also varied spatially and temporally, from 6 to 14 km (FAP 24,
1996). Generally, the braiding index and the overall width are larger at the upstream part
than farther downstream, probably due to the effects of higher slope and grain sizes
(Klaassen and Vermeer, 1988). The overall width of the river shows an increasing trend
towards westwards, especially at the upstream part of the river within Bangladesh
(Halcrow, 1993).
3.2.4 Sediment Transport
The bed material size of the Jamuna River was decreased from upstream towards
downstream and their range varies from 0.22 mm to 0.16 mm. The average annual
sediment discharge of the river is 590 million tons, which is consisted of 200 million
tons of sand (diameter above 0.06 mm), and the remained are silt and clay. Bank
25
material of the Jamuna River consists of loosely packed silt and fine sand, highly
susceptible to erosion. The average concentration of sand fraction varies between 300
mg/l to 500 mg/l (FAP 24, 1996).
3.2.5 Infrastructures
The bend of the study area is a flood plain with cluster homestead, cultivable and fallow
land. The study area is surrounded by Sirajganj Hardpoint at North, Bangabandhu right
guide bund at South, Brahmaputra Right Embankment (BRE) at West and the Jamuna
River at East. There were few schools, mosques, madrasa, bazar which had to shift
several times and gradually being lost due to erosion. Inside the study area there is no
regulator and drainage channel. To protect Sirajganj town a massive Sirajganj
Hardpoint was constructed in 1998 under (FAP 1, 1994). High Flood Level (HFL) and
Low Water Level (LWL) are considered (+) 15.75 m, PWD and (+) 6.80 m, PWD
respectively and design flow velocity is 3.7 m/s. The crest level is (+) 16.75 mPWD,
whereas approximate ground level is (+) 13.00 mPWD. The side slope of the Hardpoint
is 1V: 3.5H. The Sirajganj Hard Point faced the high flood in the history of the Jamuna
in 1998 just after its construction. The Brahmaputra Right Embankment (BRE) was
built during the late 1950s and mid of 1960s to protect the flood plain against flooding.
3.3 Bank erosion of the study reach
River bank erosion is an annual phenomenon in Bangladesh and the country is located
in a large floodplain delta complex of three major river system (the Ganges, the
Brahmaputra and the Meghna). Due to river bank erosion, the people are displaced and
it creates social and economic problem in Bangladesh. The literature review is primarily
directed to an overview of the history of erosion and its present status. Bangladesh
Water Development Board (MPO, 1986) has estimated that about 1200km of river
banks in Bangladesh are under active erosion of which more than 500km face severe
erosion problems. The river bank erosion differs from river to river and reach to reach.
Bangladesh is a country of more than 120 million people with 90 percent dependent on
agriculture (BBS, 2001). In a typical year, one fifth of the total 147,570 km2 of land in
the country is severely flooded; and about 2400 km of bankline annually experience
major erosion (Islam, 1985).

26
The urban and peri-urban development has been expanded close to the river bank, such
as Sirajganj town in Bangladesh. It is reported that one kilometer of right bank has
already shifted in the westward direction since 1830. The increased river flow is
attacking the bank directly at Kalia-Haripur bend. Local people informed that some of
them had to shift their homesteads from the bank four to six times and many of them
lost their agricultural lands into the river. Potential erosion at downstream of hardpoint
brought the bank line near Brahmaputra Right Embankment (BRE). The people of these
areas have become landless as well as poor. Bank erosion has made their life miserable.

27
CHAPTER FOUR
METHODOLOGY
This chapter describes the methodology and planning of different activities of this study
such as data collection, analysis and reporting etc. In fact, this chapter is a mirror of this
study. The overall methodology of this study is representing through a schematic diagram
shown in Figure 4.1:
Figure 4.1: Methodological flow chart of the study.
4.1 Reconnaissance Survey
Reconnaissance survey is essential for conducting a research. An understanding is needed to
realize the magnitude of river bank erosion and its impacts on river morphology. It is also
Primary Data Secondary data
Linking of Primary
and Secondary data
Data
Data Collection
Reconnaissance Survey
Selection of the Study Area
Research objectives
Problem Identification
Results and Discussion
Data Analysis Model Development
Literature Review
Satellite Image Analysis
Cross-Section Comparison
28
essential for setting an outline for the overall study. The objective of the reconnaissance
survey was to quickly obtain the basic information and developing the overall understanding
about the study area. It has been done by-
Concepts about the study are developed from the previous relevant studies.
The several articles from newspaper, journals, seminars and also web document
influence to conduct the study.
Knowledgeable people around the study area during reconnaissance survey also
helped me to formulate the concept.
4.2 Data Collection
The analysis of this study is based on secondary data. Primary data was also used to clarify
the hydraulic parameters under changing flow regime. Following data were used for these
studies:
(i) Water level, discharge and sediment data;
(ii) Bathymetric data, velocity profiles and water surface slopes;
(iii) Grain size distribution of the suspended sediment;
(iv) Satellite images, which covering the flood plain and showing important features like
point bars, alternate bars, middle bars, palaeo channels etc.;
4.2.1 Primary data collection
Most of the bathymetric and discharge data in this study were collected from pilot capital
dredging project and used as a primary data in this study which is formally permitted from
Project Director, Bangladesh Water Development Board. The discharge measurement has
been conducted using Acoustic Doppler Current Profiler (ADCP). The sediment
concentration of Jamuna River has been measured in several places at the time of discharge
measurement period. The sediment samples were collected at 0.20, 0.60 and 0.80 depth. The
analysis of the samples is done in the IWM laboratory at Dhaka. The water level data were
collection from Bangladesh Water Development Board (BWDB) and IWM.
29
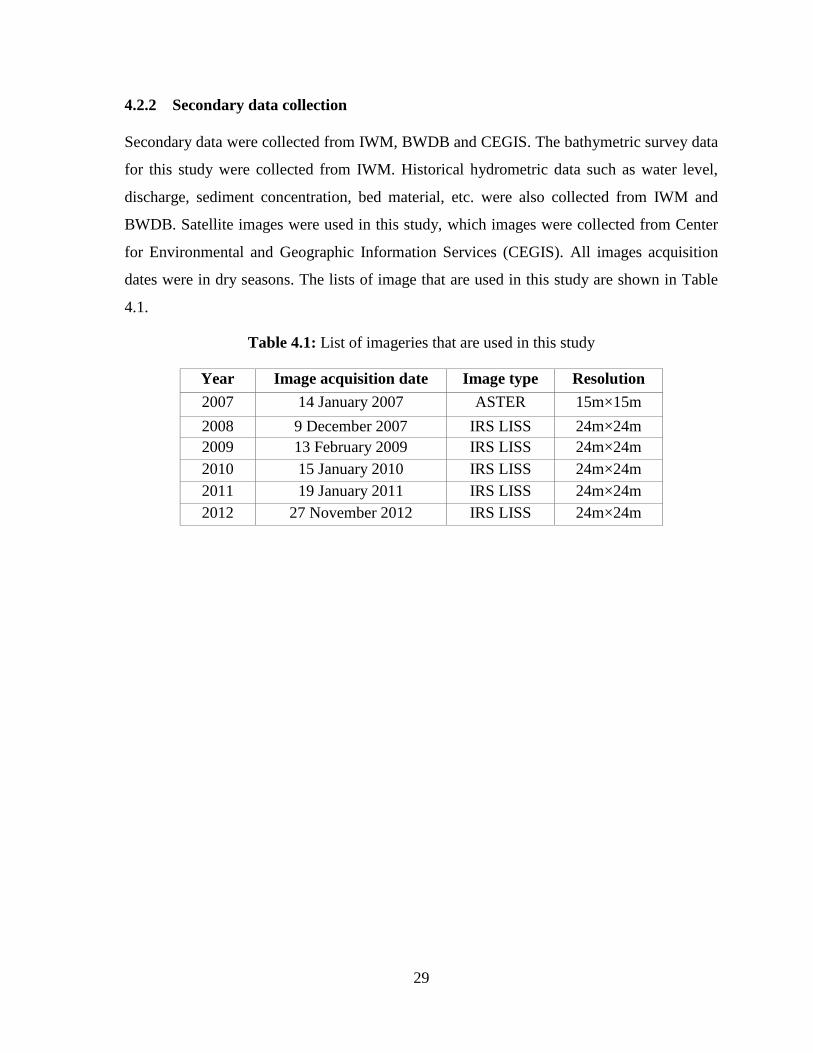
4.2.2 Secondary data collection
Secondary data were collected from IWM, BWDB and CEGIS. The bathymetric survey data
for this study were collected from IWM. Historical hydrometric data such as water level,
discharge, sediment concentration, bed material, etc. were also collected from IWM and
BWDB. Satellite images were used in this study, which images were collected from Center
for Environmental and Geographic Information Services (CEGIS). All images acquisition
dates were in dry seasons. The lists of image that are used in this study are shown in Table
4.1.
Table 4.1: List of imageries that are used in this study
Year Image acquisition date Image type Resolution
2007 14 January 2007 ASTER 15m×15m
2008 9 December 2007 IRS LISS 24m×24m
2009 13 February 2009 IRS LISS 24m×24m
2010 15 January 2010 IRS LISS 24m×24m
2011 19 January 2011 IRS LISS 24m×24m
2012 27 November 2012 IRS LISS 24m×24m
30
Figure 4.2: Location map around the study area from Sirajganj Hardpoint to Dhaleswari
Offtake.
31
4.3 Data analysis
The sustainability of the dredged channel would be assessed by analyzing the data so far
available on bathymetric data, sediment concentration, time-series satellite images, water
level and discharges data around two important river training structures (Sirajganj Hardpoint
and Right Guide Bundh of the Bangabandhu Bridge) along the Jamuna River.
4.3.1 Satellite image analysis
GIS techniques were used to analyze the satellite images. Time series satellites images were
used to understand the flow and erosion processes of a developing bend. The time-series
geo-referenced satellite images were superimposed to assess the historical trend of channel
shifting of the river courses. Findings of the previous analysis were compared with the result
obtained by analyzing the recent available data on flow and sediment transport. Geo-
referenced images were used to delineate the large-scale bed-forms such as sandbars
movement. The delineated sand bars were superimposed in GIS environment to assess the
shifting pattern and to assess their translation process.
4.3.2 Cross-section comparison
The bathymetric data were plotted from 2010 to 2013 at four locations within the study
reach. These data were plotted with and without dredging condition under changing flow
regime to determine the dynamics of the river, trend of channel shifting, channel planform
and river bank erosion processes. In this analysis sediment concentration and discharge also
relate with the cross-sections data. The rate of river bank erosion and changing planform of
a river course is also related to the rate of sediment concentration and discharges.
4.3.3 Analyses of sediment concentration and depth average velocity
Sediment load is predominant for development of river bed and bank formation as well as
accretion of Jamuna River. The suspended sediment data would be collected from IWM at
Sirajganj Hard Point to Dhaleswari offtake as available on “Capital Pilot Dredging” project.
The erosion and deposition processes on the river bed can be described by the two
dimensional continuity equation changes in sediment concentration, as it was observed that

32
the adaptation of the suspended sediment transport plays an important role in changing the
bed topography. To predict the location of erosion and deposition on the river bed a number
of measurements during the year 2012 survey is used for estimating the depth average
velocity, water depth and concentration of suspended sediment. In this study two prediction
methods are used for estimating the erosion and deposition processes on river bed. These
methods are classified as Method-I (depth-velocity relationship) and Method-II (depth-
velocity and sediment concentration relationship).

33
CHAPTER FIVE
RESULTS AND DISCUSSION
5.1 Physical observation and analysis
River bank erosion is a severe problem in Bangladesh especially along the braided
Jamuna River considering both the scale and intensity of erosion. Thousand hectares of
floodplain are eroded each year and many people homeless with damaging
infrastructures. Because of the dynamic nature, it causes the sufferings to the people
along with damages to public and natural resources. To prevent bank erosion, different
types of protective structures have been constructed at the erosion prone areas. The
structural measures are sometimes ineffective due to changes of the river morphology.
The data analyses for this study are as follows:
Satellite image analysis
Cross-section comparison
Analyses of sediment concentration and depth average velocity
5.1.1 Satellite image analysis
The main channel of the Jamuna River is flowing parallel to the Sirajganj Hardpoint
along the western side and then bifurcated at the downstream of the Hardpoint. From the
dry season ASTER (2007) and IRS LISS (2008, 2009, 2010, 2011 and 2012) images
represent that many sandbars are present at the upstream and beside the study bend. These
sandbars are different size and shape and bars are translating both laterally and
longitudinally at different rate. Their translation processes are described in the following
sections.
5.1.2 Sand bar translation
Bar dynamics relate to the morphologic behavior of rivers and in particular to the bank
erosion processes. To understand the dynamics of the morphology such as large scale
sand bars, a time series satellite image analysis has been conducted. Six geo-referenced
ASTERS, IRS LISS images of 2007 to 2012 have been superimposed to assess the
channel shifting and sand bar movements over the years. The sand bars at the upstream
and adjacent to the study area are referred as sandbar-1 and sandbar-2 (Figure 5.1,

34
Figure 5.2 and Figure 5.3) respectively. In these analyses, lateral translation in each year
was measured from the centerline of the 2007 bar towards the western direction.
entually, longitudinal translation was measured from the head end of sand bar of 2007
towards the downward direction.
Figure 5.1: The sandbar movements of Jamuna River from 2007 to 2010.

35
Figure 5.2: The sandbar movement of Jamuna River from 2011 to 2012.
Figure 5.3: Schematic diagrams of lateral and longitudinal translation of bars. (Source:
Fazana Mahmud, M.Sc thesis, 2011)
Lateral Translation of Sandbars Longitudinal Translation of Sandbars
2007
2008
2010
Flow
Centerline of 2007 bar
Bankline N
2009
2011
2012
2010
Bar
2010
2007
2008
2009
Centerline of 2007 bar
Flow
Bankline
N
2011
2012

36
5.1.3 Lateral translation
During 2007 to 2009 both sandbars extended gradually along western side but after that,
the extension was reduced 2010 to 2012 listed in Table 5.1 and shown in Figure 5.4. The
reason for the variation of lateral extension was differ for bar-1 and bar-2. In case of
sandbar-1, the western side revetment structure (Sirajganj Hardpoint) made obstruction
to extend the bar and divert the flow to erode the west part of sandbar-1. And for
sandbar-2, due to upstream revetment the bar could not manage enough sediment to
extend at that section. Rather it washed away and deposited sediment downstream of the
sandbar-2. Also the rate of extension of sandbar-1 was higher than sandbar-2, resulting
sandbar-1 had got upstream sediment but Sirajganj Hardpoint constrained the bank
erosion and sediment availability of sandbar-2.
The maximum lateral translation of sandbar-1 was occurred during 2007 and 2008 which
was just upstream of the upstream termination of Sirajganj Hardpoint. In 2009 and 2010
bar was translated downstream from the upstream termination which caused damages of
the hardpoint downstream from the termination. The west ward translation of the
sandbar-1 diverted the flow towards the Hardpoint structure and caused undermining and
damages during different years. Due to the position of sandbar-2 in 2007 a very narrow
channel (100 to 150m) was flowing through between Sirajganj Hardpoint to
Bangabandhu Bridge Guide Bundh. Due to lateral translation, flow was diverted by the
sandbar-2 extreme west point towards the bank and by eroding the bank, the bend
consequently developed.
Table 5.1: Changes in lateral translation of the sandbars
Year Sandbar-1 in (m) Sandbar-2 in (m)
2007 1540 730
2008 1690 910
2009 1870 1060
2010 1360 560
2011 1100 720
2012 800 680

37
Figure 5.4: Lateral translation of the sandbar-1 and sandbar-2.
5.1.4 Longitudinal translation
Sandbars are also moving towards longitudinal direction. Longitudinal movement is
measured as a distance travelled by the upstream end of the bar towards the downstream
direction in the consecutive years. The longitudinal translation of sandbar-1 and sandbar-
2 during 2007-2012 is listed in Table 5.2 and shown in Figure 5.5. During 2007 to 2012,
sandbar-1 translated 150 to 600 meter per year and sandbar-2 moved 300 to 1400 meter
per year. The rate of movement of sandbar-2 is higher than that of sandbar-1 because
sandbar-1 was obstructed by the revetment structure as well sandbar-2 could move
downstream without facing any obstacle. In 2010 and 2012, sandbar-2 diverted flow
towards downstream bend and caused huge erosion at the downstream part of the bend.
As a whole, due to the translation of sandbars along downstream, flows were diverted
towards the bank and caused bank erosion.
Table 5.2: Changes in longitudinal translation of the sandbars
Year Longitudinal translation of
sandbar-1 in (m)
Longitudinal translation of
sandbar-2 in (m)
2007 0 0
2008 650 1400
2009 800 1800
2010 1300 2200
2011 1950 2500
2012 2100 3500

38
Figure 5.5: Longitudinal translation of the sandbar-1 and sandbar-2.
Summary results from satellite image analysis: Satellite image analysis, Figure 5.1
and Figure 5.2 indicates that the flow processes and the location of active bank erosion
significantly changes due to changes in the large scale sand bar movement (both laterally
and longitudinally). Bar dynamics are related to the morphological behavior of rivers. In
particular cases bar dynamics are also related to the bank erosion processes and the
prevailing trends of flow processes of rivers. The magnitude and direction of near bank
flow at bends accelerate the erosion processes. The near bank flow process is governed
by the dry season and to some extent at the beginning of the rising stage. The large scale
bed features such as sand bars are the major flow guiding factor towards bank line and
channel shifting. Due to translation of sandbars along downstream, Figure 5.3, Figure 5.4
and Figure 5.5 indicates, flow was diverted towards the bank and caused bank erosion.
The channel is developing very fast along the western bank of the Jamuna River.
5.2 Cross sections comparison
Most of the rivers of Bangladesh demonstrate a high and a low water period
synchronizing with the monsoon and the dry seasons respectively. Streams are very
broadly classified as meandering, straight/transitional and braided. Braided and
meandering patterns represent extremes in a continuum of channel patterns. The
planform geometry of a stream is determined by the interaction of numerous variables
and one should anticipate observing a complete range of channel patterns in most river
systems. Bathymetric data were collected from BWDB in connection with Pilot Capital
39
Dredging Project within 2010 to 2013. The location map around the study area is shown
in (Figure 3.1). The bathymetric data were plotted 6 (six) locations within the study
reach to see the changing pattern of bed level elevation. The cross-section comparisons
around the study area are shown in (Figure 5.6 to Figure 5.11).
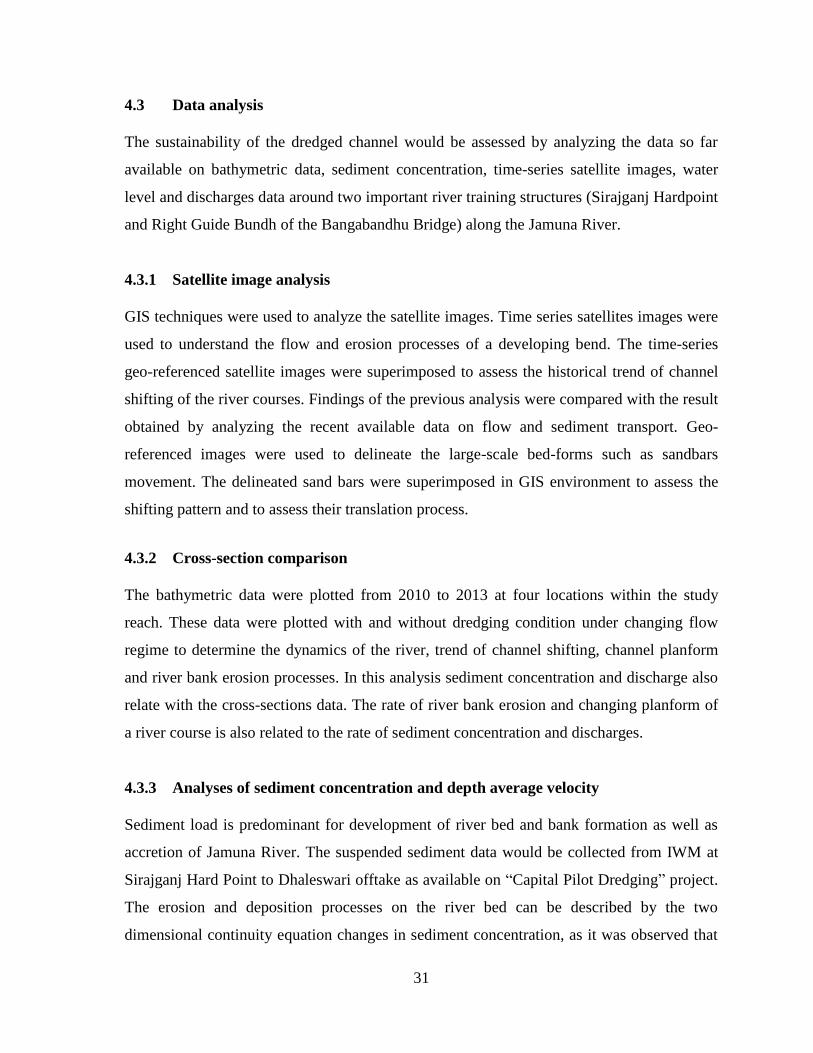
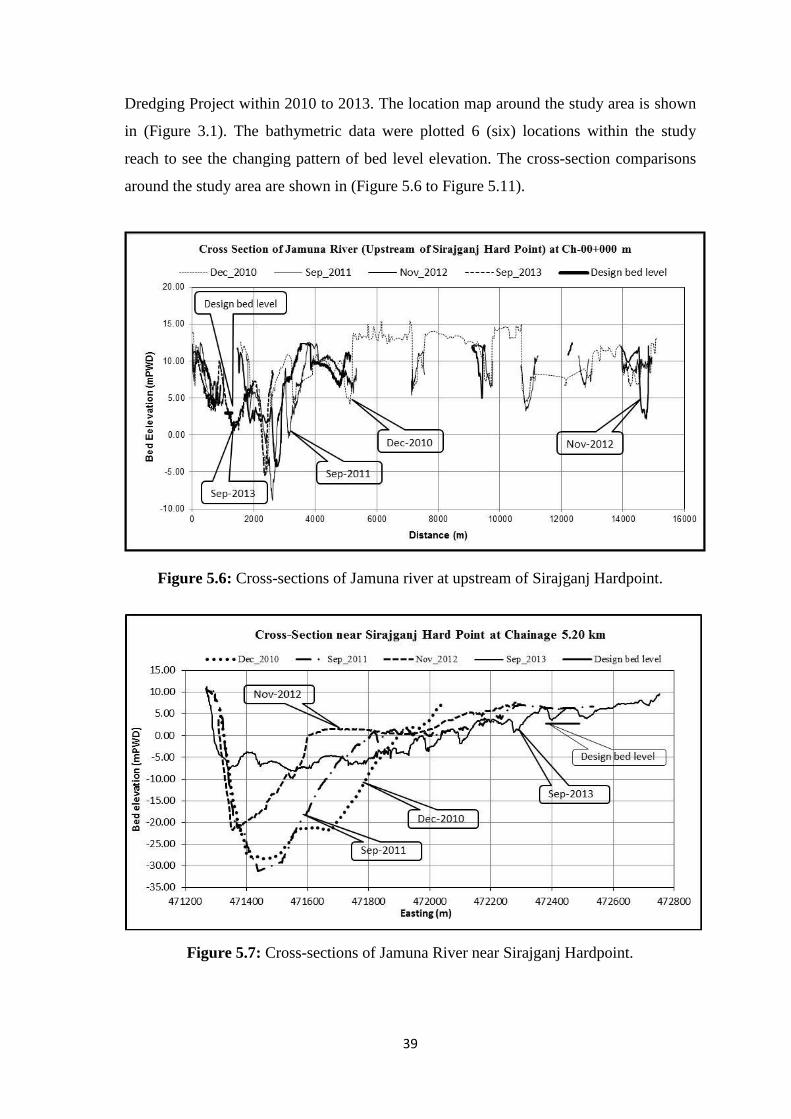
Figure 5.6: Cross-sections of Jamuna river at upstream of Sirajganj Hardpoint.
Figure 5.7: Cross-sections of Jamuna River near Sirajganj Hardpoint.

40
Figure 5.8: Cross-sections of Jamuna River along dredge channel.
Figure 5.9: Cross-sections of Jamuna River neat East guide bundhh.

41
Figure 5.10: Cross-sections of Jamuna River neat West guide bundhh.
Figure 5.11: Cross-sections of Jamuna River near downstream of Bangabandhu Bridge.
42
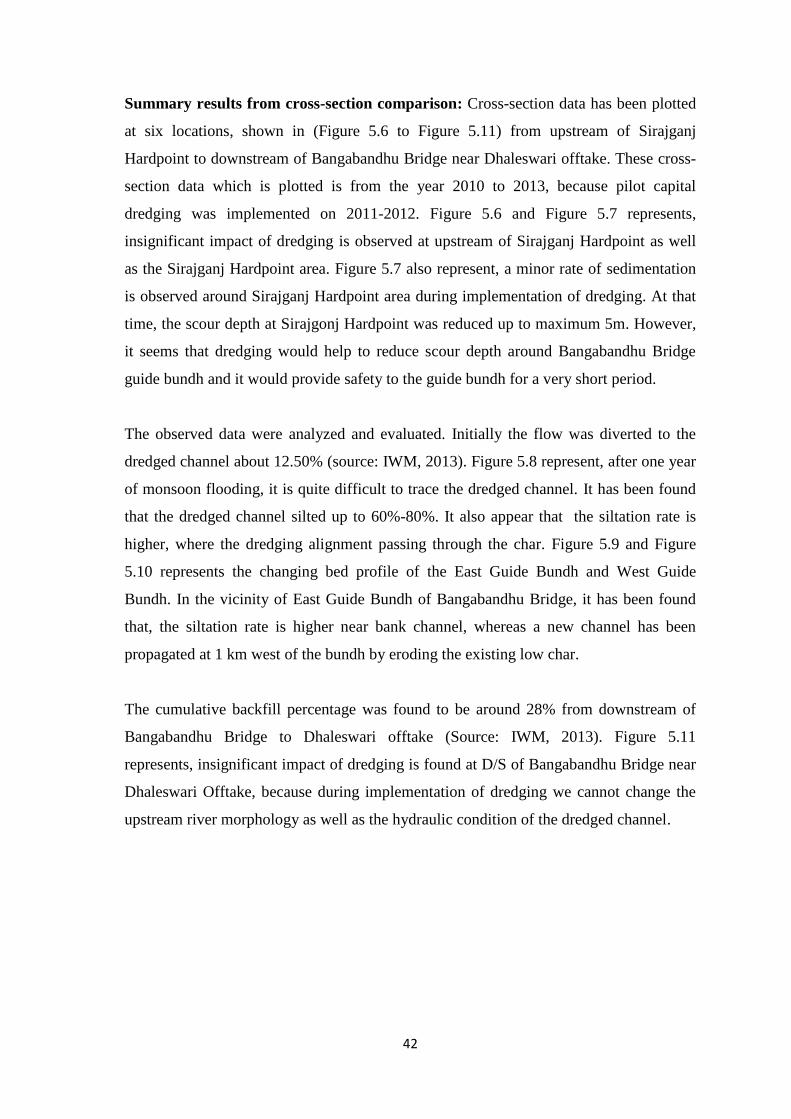
Summary results from cross-section comparison: Cross-section data has been plotted
at six locations, shown in (Figure 5.6 to Figure 5.11) from upstream of Sirajganj
Hardpoint to downstream of Bangabandhu Bridge near Dhaleswari offtake. These cross-
section data which is plotted is from the year 2010 to 2013, because pilot capital
dredging was implemented on 2011-2012. Figure 5.6 and Figure 5.7 represents,
insignificant impact of dredging is observed at upstream of Sirajganj Hardpoint as well
as the Sirajganj Hardpoint area. Figure 5.7 also represent, a minor rate of sedimentation
is observed around Sirajganj Hardpoint area during implementation of dredging. At that
time, the scour depth at Sirajgonj Hardpoint was reduced up to maximum 5m. However,
it seems that dredging would help to reduce scour depth around Bangabandhu Bridge
guide bundh and it would provide safety to the guide bundh for a very short period.
The observed data were analyzed and evaluated. Initially the flow was diverted to the
dredged channel about 12.50% (source: IWM, 2013). Figure 5.8 represent, after one year
of monsoon flooding, it is quite difficult to trace the dredged channel. It has been found
that the dredged channel silted up to 60%-80%. It also appear that the siltation rate is
higher, where the dredging alignment passing through the char. Figure 5.9 and Figure
5.10 represents the changing bed profile of the East Guide Bundh and West Guide
Bundh. In the vicinity of East Guide Bundh of Bangabandhu Bridge, it has been found
that, the siltation rate is higher near bank channel, whereas a new channel has been
propagated at 1 km west of the bundh by eroding the existing low char.
The cumulative backfill percentage was found to be around 28% from downstream of
Bangabandhu Bridge to Dhaleswari offtake (Source: IWM, 2013). Figure 5.11
represents, insignificant impact of dredging is found at D/S of Bangabandhu Bridge near
Dhaleswari Offtake, because during implementation of dredging we cannot change the
upstream river morphology as well as the hydraulic condition of the dredged channel.

43
5.3 Analyses of sediment concentration and depth average velocity
5.3.1 Background of the analysis
Braided rivers are strongly influenced by high sediment delivery from nearby sources
coupled with lower sediment transport capacity due to hydraulic conditions (primarily
gentle slopes). They are sensitive to changes in their flood regime or sediment influx and
can completely modify their geometry over a few decades (Ferguson, 1993). Common
braided river adjustments to changing environmental conditions typically include both
narrowing and widening. Moreover, rivers can shift from other planforms to a braided
pattern when human activities accelerate sediment delivery processes. At the same time,
climatic conditions and human influences that reduce sediment production can have the
opposite effect with braiding slowly diminishing through time. Thus the dynamic nature
of braided rivers makes it difficult for societies to both predict the direction of their
evolution and maintain nearby and associated infrastructure. Braided channels are rarely
in a steady state and are indicative of a valley bottom still actively undergoing
construction. In undeveloped floodplain areas, braided rivers are considered part of the
natural environment and are typically preserved because of their associated ecological
richness. However, when permanent infrastructure is built in such active floodplains
many problems can occur.
Riverbank erosion is one of the most unpredictable and critical type of disasters that
takes into account the quantity of rainfall, soil structure, river morphology, topography of
river and adjacent areas and floods. The dynamic character of the braided channeled
river and the failure of structural measures, the sufferings of the people continue. Long-
term policies and strategies should be taken to cope up with bank erosion taking into
account the social and institutional adjustment measures. Spatial variation of sediment
transport in an alluvial sand-bed river bend needs to be understood with its influencing
factors such as bank erosion, secondary current formation, land spur and bed-material
characteristics. In this study, detailed hydrographic surveys with Acoustic Doppler
Current Profiler (ADCP) were conducted at 9 (nine) locations to measure suspended
load, velocity, bathymetric profile and characteristics of the bed material. Using the
above parameters, the spatial and temporal variation of erosion or deposition processes
has been assessed. With due end of discussed below (FAP 24, 1996).

44
A number of prediction methods are available for predicting the changes of the various
morphological conditions. In this study two prediction methods are using for estimating
the erosion and deposition processes on river bed. These methods are classified by:
5.3.2 Method-I (depth-velocity relationship)
The erosion and deposition processes on the river bed can be described by the two
dimensional continuity equation changes in sediment concentration, as it was observed
that the adaptation of the suspended sediment transport plays an important role in
changing the bed topography. To predict the location of erosion and deposition on the
river bed a number of measurements during the year 2012 survey are used for estimating
the depth average velocity and water depth (FAP 24, 1996). During 2012 survey ADCP
was used for number of river reaches hence both parameters are available. Instead of a
linear relation between the water depth and the velocity, for the Jamuna River the
relation between velocity and square root of the depth yields a good demarcation line
between the erosion deposition areas.
The observed erosion and deposition in relation to depth and velocity is the result of a
combination of different processes and is in principle based on physical laws. One
probable explanation for getting this type of relation is that the involved process is an
adaptation process. The bed topography (cross-section) is relating behind the flow
pattern. It is trying to adjust to changing conditions flow by eroding and depositing on
riverbed. The prediction method for erosion and deposition represented by the following
equations:
Erosion: - - - - - - - - - - - - - - - - - - - - - - - - - - - - - - - - - - - (5.1)
Transition: - - - - - -- - - - - - - - - - - - - - - - - - - (5.2)
Deposition: - - - - - - - - - - - - - - - - - - - - - - - - - - - - - - - - - - - (5.3)
Where, h = water depth in meter and u = depth average velocity in m/sec. Transition is
defined as erosion/deposition < 1.0 m.
This short term prediction method can be applied for assisting in the maintaining the
dredging alignment in the Jamuna River, as it can give indications where dredging might
be effective. The short term prediction can be useful for estimating the requirement of
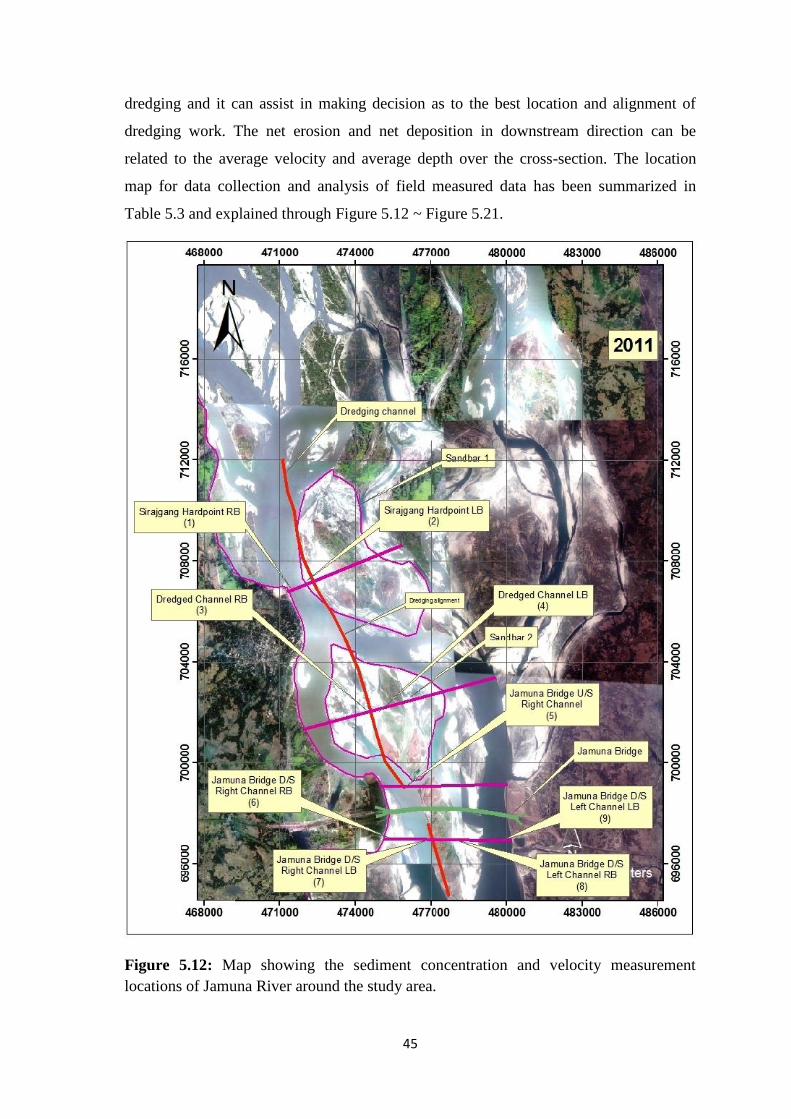
45
dredging and it can assist in making decision as to the best location and alignment of
dredging work. The net erosion and net deposition in downstream direction can be
related to the average velocity and average depth over the cross-section. The location
map for data collection and analysis of field measured data has been summarized in
Table 5.3 and explained through Figure 5.12 ~ Figure 5.21.
Figure 5.12: Map showing the sediment concentration and velocity measurement
locations of Jamuna River around the study area.

46
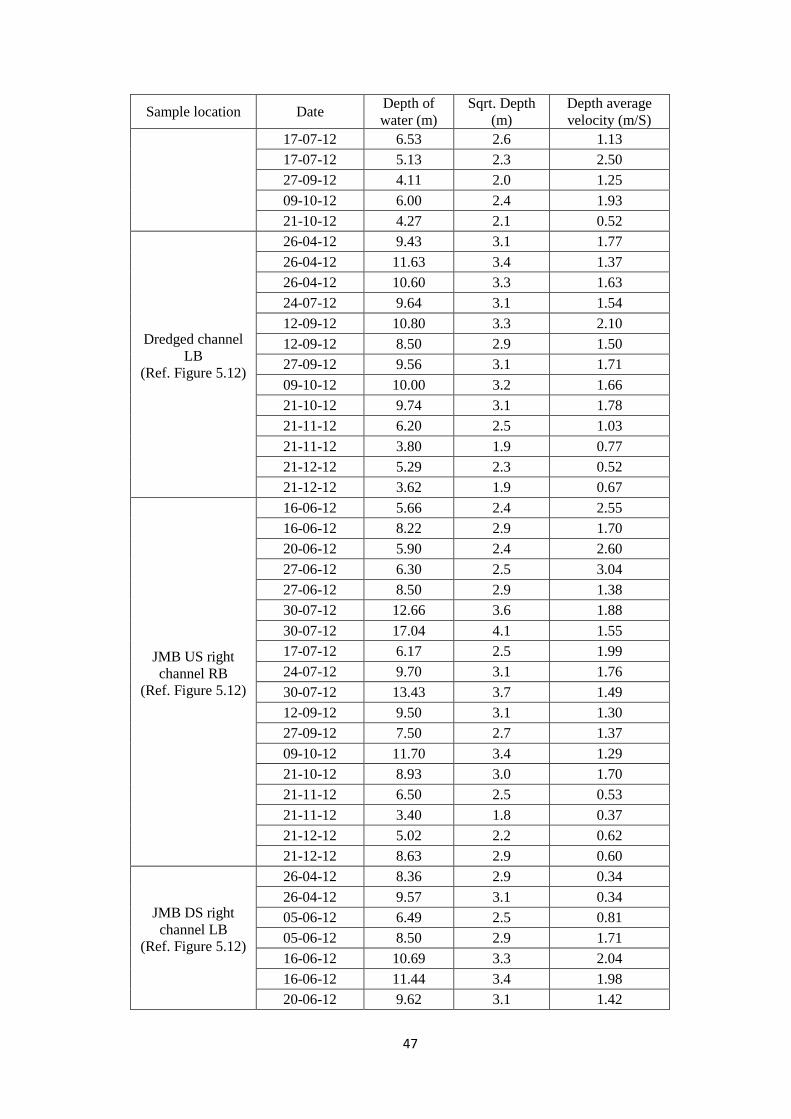
Table 5.3: Depth of water and depth average velocity at different dates around the study
area.
Sample location Date Depth of
water (m)
Sqrt. Depth
(m)
Depth average
velocity (m/S)
Sirajganj
Hardpoint RB
(Ref. Figure 5.12)
26-Apr-12 12.17 3.5 1.15
5-Jun-12 16.35 4.0 1.26
16-Jun-12 18.50 4.3 2.10
20-Jun-12 17.56 4.2 2.27
26-Jun-12 16.75 4.1 2.31
9-Jul-12 18.80 4.3 2.40
30-Jul-12 20.93 4.6 1.53
12-Sep-12 12.00 3.5 1.13
27-Sep-12 14.30 3.8 1.78
9-Oct-12 12.50 3.5 1.89
9-Oct-12 7.50 2.7 2.28
9-Oct-12 11.34 3.4 2.25
21-Oct-12 13.00 3.6 0.54
21-Nov-12 9.50 3.1 0.79
21-Dec-12 15.63 4.0 0.31
Sirajganj
Hardpoint LB
(Ref. Figure 5.12)
26-Apr-12 5.87 2.4 0.19
5-Jun-12 5.29 2.3 1.23
16-Jun-12 5.00 2.2 1.44
20-Jun-12 4.56 2.1 1.87
26-Jun-12 5.80 2.4 1.96
9-Jul-12 7.00 2.6 1.51
9-Jul-12 9.50 3.1 1.89
17-Jul-12 7.66 2.8 1.68
17-Jul-12 10.15 3.2 1.35
24-Jul-12 12.86 3.6 1.85
30-Jul-12 11.80 3.4 1.42
12-Sep-12 8.50 2.9 1.29
27-Sep-12 10.20 3.2 1.83
9-Oct-12 7.50 2.7 2.28
21-Oct-12 7.56 2.7 1.53
21-Nov-12 4.00 2.0 0.55
21-Dec-12 3.70 1.9 1.26
21-Dec-12 4.79 2.2 0.61
Dredged channel
RB
(Ref. Figure 5.12)
05-06-12 5.96 2.4 2.78
16-06-12 4.50 2.1 2.52
16-06-12 5.30 2.3 2.39
20-06-12 6.00 2.4 2.86
20-06-12 6.50 2.5 2.61
27-06-12 10.00 3.2 2.25
27-06-12 7.50 2.7 2.77
09-07-12 5.50 2.3 1.66
47
Sample location Date Depth of
water (m)
Sqrt. Depth
(m)
Depth average
velocity (m/S)
17-07-12 6.53 2.6 1.13
17-07-12 5.13 2.3 2.50
27-09-12 4.11 2.0 1.25
09-10-12 6.00 2.4 1.93
21-10-12 4.27 2.1 0.52
Dredged channel
LB
(Ref. Figure 5.12)
26-04-12 9.43 3.1 1.77
26-04-12 11.63 3.4 1.37
26-04-12 10.60 3.3 1.63
24-07-12 9.64 3.1 1.54
12-09-12 10.80 3.3 2.10
12-09-12 8.50 2.9 1.50
27-09-12 9.56 3.1 1.71
09-10-12 10.00 3.2 1.66
21-10-12 9.74 3.1 1.78
21-11-12 6.20 2.5 1.03
21-11-12 3.80 1.9 0.77
21-12-12 5.29 2.3 0.52
21-12-12 3.62 1.9 0.67
JMB US right
channel RB
(Ref. Figure 5.12)
16-06-12 5.66 2.4 2.55
16-06-12 8.22 2.9 1.70
20-06-12 5.90 2.4 2.60
27-06-12 6.30 2.5 3.04
27-06-12 8.50 2.9 1.38
30-07-12 12.66 3.6 1.88
30-07-12 17.04 4.1 1.55
17-07-12 6.17 2.5 1.99
24-07-12 9.70 3.1 1.76
30-07-12 13.43 3.7 1.49
12-09-12 9.50 3.1 1.30
27-09-12 7.50 2.7 1.37
09-10-12 11.70 3.4 1.29
21-10-12 8.93 3.0 1.70
21-11-12 6.50 2.5 0.53
21-11-12 3.40 1.8 0.37
21-12-12 5.02 2.2 0.62
21-12-12 8.63 2.9 0.60
JMB DS right
channel LB
(Ref. Figure 5.12)
26-04-12 8.36 2.9 0.34
26-04-12 9.57 3.1 0.34
05-06-12 6.49 2.5 0.81
05-06-12 8.50 2.9 1.71
16-06-12 10.69 3.3 2.04
16-06-12 11.44 3.4 1.98
20-06-12 9.62 3.1 1.42

48
Sample location Date Depth of
water (m)
Sqrt. Depth
(m)
Depth average
velocity (m/S)
20-06-12 10.06 3.2 2.55
27-06-12 6.80 2.6 2.45
27-06-12 7.70 2.8 2.12
27-06-12 5.00 2.2 2.65
09-07-12 7.00 2.6 2.87
09-07-12 10.00 3.2 2.54
17-07-12 11.59 3.4 1.90
24-07-12 14.58 3.8 1.88
30-07-12 12.90 3.6 0.71
12-09-12 4.00 2.0 0.72
27-09-12 13.20 3.6 2.01
09-10-12 4.00 2.0 1.42
21-10-12 3.26 1.8 0.80
JMB DS left
channel RB
(Ref. Figure 5.12)
05-06-12 7.30 2.7 1.71
16-06-12 4.50 2.1 1.73
20-06-12 8.00 2.8 1.61
28-06-12 7.50 2.7 2.62
28-06-12 9.30 3.0 2.24
09-07-12 8.54 2.9 1.98
17-07-12 8.77 3.0 2.81
24-07-12 12.50 3.5 2.87
30-07-12 8.00 2.8 0.89
12-09-12 14.00 3.7 1.49
27-09-12 16.00 4.0 1.62
09-10-12 15.20 3.9 1.70
21-10-12 14.71 3.8 1.29
21-12-12 4.62 2.1 0.36
JMB DS left
channel LB
(Ref. Figure 5.12)
26-04-12 11.36 3.4 1.81
05-06-12 11.60 3.4 1.76
05-06-12 9.00 3.0 1.22
16-06-12 9.53 3.1 1.13
20-06-12 13.80 3.7 2.20
28-06-12 5.90 2.4 1.30
09-07-12 10.12 3.2 2.26
17-07-12 4.86 2.2 1.36
24-07-12 8.51 2.9 2.93
30-07-12 8.00 2.8 1.83
12-09-12 3.40 1.8 0.08
27-09-12 3.20 1.8 1.53
09-10-12 4.60 2.1 1.55
21-10-12 7.35 2.7 0.87
21-11-12 8.40 2.9 0.30
21-12-12 7.94 2.8 0.40

49
Figure 5.13: Erosion and deposition on the riverbed at Sirajganj Hardpoint right bank of
Jamuna in period April, 2012 to January, 2013.
Figure 5.14: Erosion and deposition on the riverbed at Sirajganj Hardpoint left bank of
Jamuna River in period April, 2012 to January, 2013.

50
Figure 5.15: Erosion and deposition on the riverbed at dredged channel right bank of
Jamuna River in period May to November, 2012.
Figure 5.16: Erosion and deposition on the riverbed at dredged channel left bank of
Jamuna River in period April, 2012 to January, 2013.

51
Figure 5.17: Erosion and deposition on the riverbed at Bangabandhu Bridge right
channel center of Jamuna River in period June-August, 2012.
Figure 5.18: Erosion and deposition on the riverbed at Bangabandhu Bridge D/S right
channel right bank of Jamuna River in period June, 2012 to January, 2013.

52
Figure 5.19: Erosion and deposition on the riverbed at Bangabandhu Bridge D/S right
channel left bank of Jamuna River in period April-November, 2012.
Figure 5.20: Erosion and deposition on the riverbed at Bangabandhu Bridge D/S left
channel right bank of Jamuna River in period May, 2012 to January, 2013.

53
Figure 5.21: Erosion and deposition on the riverbed at Bangabandhu Bridge D/S left
channel left bank of Jamuna River in period April, 2012 to January, 2013.
Observation form method I (depth-velocity relationship) represented by:
Figure 5.13 and Figure 5.14 shows the erosion and deposition on Sirajganj
Hardpoint right bank and left bank of Jamuna River. Figure 5.13 represents that the
right bank of Sirajganj Hardpoint is favorable for sedimentation on the same time
Figure 5.14 represents that the left bank is favorable for erosion. It is happening due
to the position of sandbars at upstream of Sirajganj Hardpoint.
Figure 5.15 indicates the erosion at the dredged channel right bank, on the same
time Figure 5.16 indicates; there is no change at dredged channel left bank. It is
happening, because the dredging alignment passing through the high char at that
location.
Figure 5.17 indicates erosion at the right channel of the upstream of Bangabandhu
Bridge in the monsoon but in dry season it indicates deposition. It is happening,
because at the upstream of Bangabandhu Bridge the main flow of Jamuna River
passing through this channel in monsoon.

54
Figure 5.18 represents, most of the time the Bangabandhu Bridge D/S right channel
right bank indicates deposition, on the same time Figure 5.19 represents, most of the
time the Bangabandhu Bridge D/S right channel left bank indicates erosion. At the
downstream of Bangabandhu Bridge the river is bifurcating by right channel and left
channel. It is happening due to presence of high char at left side of the right channel.
Figure 5.20 represents, most of the time the Bangabandhu Bridge D/S left channel
right bank indicates erosion in monsoon and deposition in dry season, on the same
time Figure 5.21 represents, most of the time the Bangabandhu Bridge D/S left
channel left bank indicates erosion but few time its indicates deposition. It is
happening because the maximum discharge in monsoon passing through this
channel and sandbar presence at the right side of left channel at the downstream of
Bangabandhu Bridge.
5.3.3 Method-II (Depth-velocity & sediment concentration relationship)
To better understand the sediment transport processes in the river, nine points are
selected at four locations in the Jamuna River from Sirajganj Hardpoint to downstream
of Bangabandhu Bridge near Dhaleswari Offtake. The predicted concentration
corresponds to the sediment transport capacity using a sediment transport predictor
specially developed for the Jamuna River. In estimating the sediment concentration
instead of using the parameter θ, the depth average velocity is replaced by using Chezy’s
relation and the modified relation reads as:
- - - - - - - - - - - - - - - - - - (5.4)
Where, c = depth-average concentration, Assuming ∆ = 1.65, C = 70 m½
/s and D50 = 0.2
mm. The following equation can be expressed as:
- - - - - - - - - - - - - - - - - - - - - - - - -- - - - - - - - - - - - - - - - - - (5.5)
In which c is expressed as mg/l.
It is mentioned here that the roughness height for bed form not only depends on the
bedforms height, but also very much depends on the shape of the bedform. This

55
observation contradicts with the observation Lukanda et al (1992) and Klaassen et al
(1988). To estimate the average roughness and sediment transport, the effect of the
bedform during the high flow may not be relevant, but for particular locations it might
have some influence in contributing the local roughness as well as to the sediment
transport. Here it should be mentioned that apart from the high sediment concentration,
there are some location where the bedform are also prominent. More detailed
information on the shape, height and length of the dune and also about the flow may
enable to elucidate the influence of bedforms on the sediment transport. The location
map for data collection and analysis of field measured data has been summarized in
Table 5.4 and shown in Figure 5.12, Figure 5.22 ~ Figure 5.30 respectively.
Table 5.4: Depth of water, actual sediment concentration and predicted sediment
concentration at different dates around the study area
Sample location Date Depth
(m)
Actual sediment
concentration (mg/l)
Predicted sediment
concentration (mg/l)
Sirajgonj Hard
Point RB
(Ref. Figure 5.12)
26-Apr-12 12.17 518 121
5-Jun-12 16.35 206 113
16-Jun-12 18.50 219 382
20-Jun-12 17.56 533 489
26-Jun-12 16.75 258 540
9-Jul-12 18.80 578 531
30-Jul-12 20.93 797 148
12-Sep-12 12.00 408 117
27-Sep-12 14.30 1114 322
9-Oct-12 12.50 549 428
21-Oct-12 11.34 520 739
21-Nov-12 13.00 30 16
21-Dec-12 15.63 98 3
Sirajgonj Hard
Point LB
(Ref. Figure 5.12)
26-Apr-12 5.87 192 2
5-Jun-12 5.29 255 329
16-Jun-12 5.00 463 529
20-Jun-12 4.56 287 1146
26-Jun-12 5.80 378 1014
9-Jul-12 7.00 527 427
9-Jul-12 9.50 532 565
17-Jul-12 7.66 909 512
17-Jul-12 10.15 931 220
24-Jul-12 12.86 308 393
30-Jul-12 11.80 615 215
12-Sep-12 8.50 404 233
27-Sep-12 10.20 923 480

56
Sample location Date Depth
(m)
Actual sediment
concentration (mg/l)
Predicted sediment
concentration (mg/l)
9-Oct-12 7.50 476 1166
21-Oct-12 7.56 592 408
21-Nov-12 4.00 103 54
21-Dec-12 4.79 69 60
Dredged Channel
RB
(Ref. Figure 5.12)
05-06-12 5.96 166 2452
16-06-12 4.50 373 2524
16-06-12 5.30 413 1859
20-06-12 6.50 540 1906
27-06-12 10.00 439 839
27-06-12 7.50 403 1932
09-07-12 5.50 503 690
17-07-12 6.53 799 217
17-07-12 5.13 863 2171
27-09-12 4.11 1267 444
09-10-12 6.00 749 943
21-10-12 4.27 631 44
Dredged
Channel LB
(Ref. Figure 5.12)
26-04-12 11.63 491 200
24-07-12 9.64 467 324
12-09-12 10.80 347 655
27-09-12 9.56 1366 435
09-10-12 10.00 797 382
21-10-12 9.74 589 467
21-11-12 6.20 117 179
21-12-12 5.29 106 36
Jamuna U/S
Right channel
center
(Ref. Figure 5.12)
16-06-12 5.66 457 2061
16-06-12 8.22 281 492
20-06-12 5.90 500 2079
27-06-12 6.30 501 2930
27-06-12 8.50 266 277
30-07-12 12.66 671 419
30-07-12 17.04 401 189
Jamuna D/S
Right Channel
RB
(Ref. Figure 5.12)
17-07-12 6.17 892 996
24-07-12 9.70 719 460
30-07-12 13.43 717 216
12-09-12 9.50 251 212
27-09-12 7.50 1062 311
09-10-12 11.70 442 170
21-10-12 8.93 276 456
21-11-12 6.50 76 30
21-11-12 3.40 123 23
21-12-12 5.02 68 59
21-12-12 8.63 92 32
Jamuna D/S 26-04-12 9.57 373 6

57
Sample location Date Depth
(m)
Actual sediment
concentration (mg/l)
Predicted sediment
concentration (mg/l)
Right Channel
LB
(Ref. Figure 5.12)
05-06-12 6.49 142 92
05-06-12 8.50 260 488
16-06-12 10.69 442 609
16-06-12 11.44 340 527
20-06-12 9.62 599 265
20-06-12 10.06 667 1156
27-06-12 6.80 636 1554
27-06-12 5.00 575 2573
09-07-12 7.00 518 2276
09-07-12 10.00 456 1159
17-07-12 11.59 1114 470
24-07-12 14.58 398 364
30-07-12 12.90 294 33
12-09-12 4.00 357 108
27-09-12 13.20 1455 477
09-10-12 4.00 578 634
21-10-12 3.26 433 174
Jamuna D/S Left
Channel RB
(Ref. Figure 5.12)
05-06-12 7.30 136 568
16-06-12 4.50 647 942
20-06-12 8.00 613 441
28-06-12 7.50 735 1675
28-06-12 9.30 974 894
09-07-12 8.54 550 711
17-07-12 8.77 951 1712
24-07-12 12.50 1076 1264
30-07-12 8.00 679 96
12-09-12 14.00 362 205
27-09-12 16.00 816 225
09-10-12 15.20 242 268
21-10-12 14.71 474 134
21-12-12 4.62 19 15
Jamuna D/S Left
Channel LB
(Ref. Figure 5.12)
26-04-12 11.36 728 419
05-06-12 11.60 343 383
05-06-12 9.00 164 192
16-06-12 9.53 256 146
20-06-12 13.80 302 578
28-06-12 5.90 1141 341
09-07-12 10.12 661 842
17-07-12 4.86 1552 465
24-07-12 8.51 519 1976
30-07-12 8.00 907 620
12-09-12 3.40 498 0
27-09-12 3.20 1704 973

58
Sample location Date Depth
(m)
Actual sediment
concentration (mg/l)
Predicted sediment
concentration (mg/l)
09-10-12 4.60 1041 696
21-10-12 7.35 675 98
21-11-12 8.40 44 5
21-12-12 7.94 40 12
Figure 5.22: Depth, predicted and actual sediment concentration at Sirajganj Hardpoint
Right Bank of Jamuna River in period April, 2012 to January, 2013.

59
Figure 5.23: Water depth, predicted and actual sediment concentration at Sirajganj
Hardpoint left bank of Jamuna River in period April, 2012 to January, 2013.
Figure 5.24: Depth, predicted and actual sediment concentration at dredged channel
right bank of Jamuna River in period May to November, 2012.
Figure 5.25: Depth, predicted and actual sediment concentration at dredged channel left
bank of Jamuna River in period April, 2012 to January, 2013.

60
Figure 5.26: Depth, predicted and actual sediment concentration at Bangabandhu Bridge
U/S right channel center of Jamuna River in period June-August, 2012.
Figure 5.27: Depth, predicted and actual sediment concentration at Bangabandhu Bridge
D/S right channel right bank of Jamuna River in period June, 2012 to January, 2013.

61
Figure 5.28: Depth, predicted and actual sediment concentration at Bangabandhu Bridge
D/S right channel left bank of Jamuna River in period April-November, 2012.
Figure 5.29: Depth, predicted and actual sediment concentration at Bangabandhu Bridge
D/S left channel right bank of Jamuna River in period May, 2012 to January, 2013.

62
Figure 5.30: Depth, predicted and actual sediment concentration at Bangabandhu Bridge
D/S left channel left bank of Jamuna River in period April, 2012 to January, 2013.
Observation from Method-II (Depth-velocity & sediment concentration
relationship) represented by:
Figure 5.22 and Figure 5.23 shows that the depth of water and sedimentation
concentration on Sirajganj Hardpoint right bank and left bank of Jamuna River. Both
of the figures represents that the rate of actual sediment concentration is higher than
the predicted sediment concentration during the analyzing period. But in the month
of June-July and October-November, 2012, the rate of predicted sediment
concentration is higher than the actual sediment concentration. This scenario has
been compared with the measured cross-section shown in Figure 5.7. It indicates that,
the sedimentation occurs round the year at both bank, but during rising and falling
water level condition river bed or bank erosion may happen.
Figure 5.24 shows, the rate of actual sediment concentration is higher than the
predicted sediment concentration and Figure 5.25 shows, the actual sediment
concentration is higher than the predicted sediment concentration on dredged channel
right bank and left bank of Jamuna River. In this location the dredging alignment
passing through the high char. It was happing due to loose soil material at the char,
when flow was passing through the dredged channel. The right bank of the dredged

63
channel was eroded due high flow velocity and left bank was silted up due to slope
failure of the bank. Due to this condition the size of the dredged channel was
widening but the depth of the channel were decreased which is compared with the
measured cross section shown in Figure 5.8.
Figure 5.26 shows; the rate of actual sediment concentration is higher than the
predicted sediment concentration on Bangabandhu Bridge U/S (center of the right
channel) in the period of June, 2012. Because the maximum flow were passing
through the channel in monsoon. It indicates that the channel was eroded in the
monsoon and in the dry and pre-monsoon and post-monsoon the channel was silted
up at that location, which is compared with the measured cross-section representing
in Figure 5.10.
At the downstream of Bangabandhu Bridge the major flow passing through the left
channel. During monsoon it is quite difficult to divide it as left or right channel.
Figure 5.27 and Figure 5.28 shows that most of the time the rate of actual sediment
concentration is higher than the predicted sediment concentration on Bangabandhu
Bridge D/S right channel both right and left bank. But in Figure 5.28 represents the
predicted sediment concentration is higher in the period of June, 2012. Both of the
figures indicate that both bank of the right channel were silted up round the year.
They also indicate that the left bank of the right channel may erode only in monsoon,
this scenarios is compared with the measured cross-section represented in Figure
5.11.
Figure 5.29 and Figure 5.30 shows that most of the time the rate of actual sediment
concentration is higher than the predicted sediment concentration on Bangabandhu
Bridge D/S left channel right and left bank, except in the monsoon. Both of the
figures indicate that both bank of the left channel were silted up round the year. They
also indicate that the both bank of the left channel may erode only in monsoon, this
scenarios is compared with the measured cross-section represented in Figure 5.11.
Summary results from sediment concentration and depth average velocity analysis:
The morphological change of the sand-bed braided river like the Jamuna River is a great
challenge for the structural stability of river training works. This study investigates the
unsteady pattern of river flow as well as variations of river bed elevation and sediment
transport due to the period of 2012. It can be observed that most of the overloading area

64
is deposited in the period of dry season, 2012. In most of the figure are only shown the
observed suspended sediment concentration which is higher than the predicted
concentrations. In natural rivers there are always some uncertainties in estimating the
relevant parameters due to their variation in space. It is observed that the flow in the
Jamuna River, especially during the high flow is not in equilibrium with the riverbed
topography, but rather is governed by upstream conditions and the momentum of the
flow. The results from data analysis are summarized in Table 5.5:
Table 5.5: Erosion and deposition matrix at nine locations around the study area using
Method-I and Method-II
Sample
location
Date of
observation
Method-I Method-II
Remarks
from field
observation
Ero
sio
n
(%)
Dep
osi
tio
n
(%)
No
ero
sio
n/
dep
osi
tio
n
Ero
sio
n
(%)
Dep
osi
tio
n
(%)
No
ero
sio
n/
dep
osi
tio
n
Sirajganj
Hardpoint RB
April, 2012 to
January, 2013 7 79 14 20 60 20 Deposition
Sirajganj
Hardpoint LB
April, 2012 to
January, 2013 56 26 18 16 56 28 Deposition
Dredged
channel RB
May to
November, 2012 84 0 16 69 23 8 Erosion
Dredged
channel LB
April, 2012 to
January, 2013 23 15 62 8 75 17 Erosion
Bangabandhu
Bridge U/S
right channel
Center
June-August,
2012 58 14 28 44 14 42 Erosion
Bangabandhu
Bridge D/S
right channel
RB
June, 2012 to
January, 2013 10 45 45 9 55 36 Deposition
Bangabandhu
Bridge D/S
right channel
LB
April-November,
2012 48 26 26 40 35 25 Erosion
Bangabandhu
Bridge D/S left
channel RB
May, 2012 to
January, 2013 57 43 0 25 63 12 Erosion
Bangabandhu
Bridge D/S left
channel LB
April, 2012 to
January, 2013 44 38 18 19 56 25 Deposition
From the above Table 5.5 out of 9 sites, the observation and prediction of erosion or
deposition are matching well at 7 sites, while two sites (Dredged channel LB and
Bangabandhu Bridge D/S right channel LB) are not matching. It happens, because local
hydro morphological parameters (depth, velocity and sediment concentration etc.) are
very influenced by the upstream morph-dynamic processes (sandbar formation,
65
translation). Further, the equations used in the above analysis are one dimensional in
nature, while the local morpho-dynamic processes that is very much dependent on the
morphology is three dimensional in nature (Uddin, 2010). To explain the above issues
with confidence further three dimensional analysis are required.
66
CHAPTER SIX
CONCLUSION AND RECOMMENDATIONS
6.1 Conclusion
River channels tend to a dynamic equilibrium driven by the dynamics of discharge of
water and sediment transport. Different river training works, upstream interventions
increasingly change the natural drivers of the channel morphology. The major findings
of this study are:
Due to translation of sandbars along downstream, flow were diverted towards the
bank and caused bank erosion. The channel is developing very fast along the
western bank of the Jamuna River and erode the river bank.
Satellite image analysis indicates that the flow processes and the location of active
bank erosion changes significantly due to changes in large scale sand bar movement
(both laterally and longitudinally).
Cross-section comparison indicates that the channel near Sirajganj Hardpoint shift
towards East. The existing channel near Sirajganj Hardpoint is silted up within very
few days after dredging. It is also observed that after 1 year of monsoon flooding
the impact of dredging is very minor around the study area.
Analysis of observed data indicates that, during May-September, 2012 the depth
average velocity near the Sirajganj Hardpoint area exceeds 1.75 m/s and
consequently during the above period sedimention did not occurred.
There is no significant impact of dredging has observed near Hardpoint as well as
the downstream of Banghabhandhu Bridge. It is also observed that the rate of
siltation is higher, where the dredging alignment passing through the existing char.
It was happening, because we cannot change the hydraulic condition around the
dredged area as well as upstream river morphology. It seems that the dredge channel
may silt up within a very short period.
From the analysis of sediment concentration and depth average velocity, it is
observed that sediment concentration plays an important role in the erosion or
deposition processes from upstream of Sirajganj Hardpoint to downstream of
Jamuna Bridge near Dhaleswari Offtake.

67
The major finding of this study is that the dredging of a braided river would not be a
sustainable solution wihout changing upstream river morphology as well as
hydraulic conditions. It is also observed that, if the dredging alignment passes
through the existing channel not over the char area, the dredged channel would be
more sustainable.
In this study, one dimensional morphological equations has been used to predict
erosion/deposition process. In natural rivers there are always some uncertainties in
estimating the relevant parameters due to their variation in space/time using one
dimentional equations. Three dimensional analysis may provide better
understanding on the above issues.
6.2 Recommendations
The rivers of Bangladesh facing large flow fluctuations between the high water period
in the June-October period and low water period during the rest of the year. The
analysis of this study has been done for a very short period. It is recommended that
further study is needed considering:
The flow pattern changes with changing flow regime which may vary from
location to location. Therefore, long term monitoring on the behavior of the
erosion and sedimentation processes at the study bend need to be explored for
future development.
Bar dynamics are related to the morphologic behavior as bank erosion and flow
processes of the rivers. To understand the dynamics of the upstream river
morphology such as movement of large scale sand bars, a time series satellite
image based analysis is essential.
To assess the morphological behavior of a river, two dimentional
morphological model is mendatory. It is also suggested that, in comprehensive
river management plan, further research is required for future dredging
requirement of the country.

68
REFERENCES:
[1] Abdelazim, M.N., Tarek, A., Mohamed, N., and Ismail, F. (2010), “predication of life
time span of high Aswan dam reservoir using cche2d simulation model” Fourteenth
International Water Technology Conference, IWTC 14 2010, Cairo, Egypt.
[2] Alam M.M. 2004. "Recent morphological trend in the Jamuna bridge sites: a remote
sensing and gis analysis", Proceedings of the 7th Panhellenic Geographical
Conference of the Hellenic Geographical Society (7PGC/HGS), Mytilene, Greece, 1-
8, 2004.
[3] Ashworth, P. J. (1995), “Mid channel bar growth and its relationship to local flow
strength and direction,” selected for Earth Surface Processes and landforms.
[4] Bangladesh Bureau of Statistic 2001: Dhaka, Bangladesh.
[5] BWDB (1999). River bank protection project, Evaluation of the performance of hard
points, Review of damage during 1999 flood season, and recommended remedial
works.
[6] BWDB (2006). Review of failure of spurs in Betil and Enayetpur Emergence Flood
Damage Rehabilitation Project.
[7] BWDB (2008). Guidelines for River Bank Protection, Jamuna-Meghna River Erosion
Mitigation Project (JMREMP).
[8] BWDB and IWM. (2013), “Quality control, Monitoring and Impact Assessment of
Pilot Dredging of Jamuna River at 2 locations from Sirajganj Hardpoint to
Dhaleswari Offtake (20 Km) and Near the Nalin Bazar (2 Km),” Final Report.
[9] Bristow, C.S. (1987), “Brahmaputra River: Channel migration and deposition, Proc.
Conference on Fluvial Sedimentology”.
[10] CEGIS (2010), “Prediction of River Bank Erosion along the Jamuna, the Ganges
and the Padma Rivers in 2010,” prepared for Jamuna-Meghna River Erosion
Mitigation Project, Bangladesh Water Development Board, Dhaka.
[11] Coleman, J.M. (1969), “Brahmaputra River: Channel processes and sedimentation,”
Sedimentary geology, Vol.3, pp. 129-239.
[12] Elahi, K.M., Ahmed, K.S. and Mafizuddin, M. (eds) (1991), “Riverbank Erosion,
Flood and Population Displacement in Bangladesh,” Dhaka: REIS-JU, Bangladesh.
69
[13] EGIS (Environmental and GIS Support Project for Water Sector Planning) 2000;
“Riverine Chars in Bangladesh-environmental dynamics and management issues,”
The University Press Limited, Dhaka.
[14] EGIS (Environmental and GIS Support Project for Water Sector Planning) 2001;
“Developing and updating empirical methods for predicting morphological changes
of the Jamuna River”, Dhaka, Bangladesh.
[15] FAP 1 (1994). “River training studies of the Brahmaputra river,” Master Plan
Report, Annex 4, Design and Construction, BWDB.
[16] FAP 24 (1996), “Morphological Processes in the Jamuna River,” Special Report
N0.24: River Survey Project, Water Resources Planning Organization, Ministry of
Water Resources, Bangladesh.
[17] Ferguson, R.I (1993), “Understanding braided processes in gravel-bed streams:
progress and unresolved problems,” in Best, J.L and Bristow, C.S. (Eds.), braided
Rivers, special Publication of Geological Society of London, 75, 73-87.
[18] Halcrow et al. (FAP1). “River training studies of the Brahmaputra river,”
Morphology, Annex 2, Technical annex, Draft Final Report. Dhaka: Halcrow, 1993.
[19] Hasegawa, K and Yamaoka, I. 1984, the effect of plane and bed forms of channels
upon the meander development. Proceedings of JSCE, No. 296, pp. 143 – 152.
Meandering Proc. Of Jsce, Vol. 255, pp. 63 –73 (in Japanese).
[20] Ikeda, S., Parker, G. and Sawai, K. 1981, Bend theory of river meanders, part 1-
linear development. Journal of Fluid Mechanics, Vol. 157, pp. 363-377.
[21] IWFM (2011), Hydraulic profiling of important fish habitats of the Jamuna River
Draft final report. IWFM, BUET.
[22] Islam, A. M. Z. (1985), “Regional Surface Water Availability during Dry and
Monsoon Seasons in Bangladesh,” J. of Irrigation Engineering and rural Planning,
No. 26, the Japanese Society of Irrigation, Drainage and Reclamation Engineering,
Tokyo, Japan, pp. 2-3.
[23] Jaeggi, 1984 (mentioned in Rahman M.M., M.A. Haque & M.M. Hoque 2002),
Application of the bend development theory in natural alluvial river. International
Journal of Sediment Research, Vol. 17, No. 3, 2002, pp. 210-218.

70
[24] Keller, E. A. 1976. Channelization: Environmental, geomorphic and engineering
aspects. Pages 115-140 in D. R. Coates, editor. Geomorphology and Engineering.
George Allen and Unwin, London.
[25] Klassen, G.J., Vermeer, k., and Uddin, N. (1988), “Sedimentological processes in
the Jamuna (Lower Brahmaputra) River, Bangladesh, Proc. Intern. Conf. on Fluvial
Hydraulics, Budapest, Hungary, pp.381-394.
[26] Leopold, L.B. and Wolman, M.G. (1957), “River channel patterns, braided,
meandering and straight,” U.S., Geol Survey, Profess papers, 282-B: 39-85.
[27] Leopold, L.B., Wolman, M.G., and Miller, G.P. (1964), “Fluvial Processes in
Geomorphology,” Freeman, San Francisco, Calif., pp. 522.
[28] Rahman, M.M., Uddin, M.N., Zhang, H., Nakagawa, H., Baba, Y. and Kawaike, K.
(2011), “Hydraulic and Morphological Consequence of Bank Protection Measures
along the Jamuna River, Bangladesh”, Annuals of Disas. Prev. Res. Inst., Kyoto
Univ., No 54 B, 2011.
[29] Schumm, S.A., and Khan, H.R., “Experimental study of channel patterns,” Bull.
Geol. Soc. Am., Vol. 83, 1755-1770, 1972.
[30] Schumm, S.A., (1977). “The Fluvial System,” Wiley, New York, 338 pp.
[31] Task Committee. 1978. Environmental effects of hydraulic structures. Journal of
Hydraulics Division, American Society of Civil Engineers 104: 203-221.
[32] Uddin, M. J., “RCC Spur in Bangladesh: Review of Design, Construction and
Performance, Unpublished M.Sc. Thesis, UNESCO-IHE, the Netherlands, 2007.
[33] Uddin, M.N. and Rahman, M.M. (2009), “Flow pattern visualization and erosion
estimation at a bend along the braided Jamuna River,” River, Coastal and Estuarine
Morphodynamics: RCEM 2009 – Vionnet et al. (eds), pp.1063-1070.
[34] Uddin, M.N. (2010), “Flow and Erosion Processes at Bends and around River
Training works in a Sand Bed Braided River,” PhD thesis, IWFM, BUET.
[35] Williams, P. F. and Rust, B. R. (1969), “The Sedimentology of a braided river,”
Journal of Sedimentary Research, Vol. 39, No. 2, pp. 649-679.

i
ACKNOWLEDGEMENT
At first, I would like to thank the Almighty Allah for giving me the ability to
complete this research work.
I am heartily thankful to my supervisor, Dr. Md. Munsur Rahman, Professor, Institute
of Water and Flood Management, Bangladesh University of Engineering and Technology,
Dhaka, whose encouragement, constant guidance and valuable support from the initial to the
final level enabled me to carry out this research. It is an honor for me to work with him. I
gratefully acknowledge to “The Project Director, Capital (Pilot) Dredging of River System of
Bangladesh, Bangladesh Water Development Board (BWDB)” and Institute of Water
Modelling (IWM) to allow me using capital dredging project data and necessary support. I
also acknowledge the support and cooperation needed from Md. Amirul Islam, Director,
Survey and Data Division, IWM and Abu Saleh Khan, Deputy Executive Director, IWM.
I express my profound respect and deepest sense of gratitude to all of my respected
teachers of IWFM, BUET for their fruitful advices in different time and valuable teaching
under different courses that have helped me to reach at this stage. The author acknowledges
Library Assistant and other staffs of IWFM for their kind cooperation.
My special thanks to Mr. Md. Tofail Islam, IWM, Dhaka and Dr. Mohammad Nazim
Uddin, Professor, Dhaka University of Engineering and Technology and Mr. Mohammad
Arifur Rahman and Mr. Md. Mahmud Hasan Tuhin and Rashed Jalal Graduate Students at
IWFM, BUET, who helped me and provided constant support in different stages of my
research work.
Finally, I would like to express a very special indebtedness to my parents, my in-laws
and my wife whose encouragement and support was a continuous source of inspiration for
this work.
Md. Mosiur Rahman
November 2013

ii
ABSTRACT
The erosion and shifting of river courses, loss of land, especially along the Jamuna river have
long been recognized as a national problem that affects a sizable population in Bangladesh.
To mitigate the river bank erosion BWDB has initiated a 20 km capital dredging on the River
Jamuna as pilot basis in order to guide the flow to reduce the risk of failure of Sirajganj Hard
Point and right guide bundh of the Bangabandhu Bridge. This study would be useful to assess
the role of capital dredging in comprehensive river management plan as well as the
morphological stability of an artificial dredged channel along the braided Jamuna river of
Bangladesh. The sustainability of the dredged channel was assessed by analyzing the time-
series satellite images, cross-section comparison, sediment concentration and depth average
velocity. Geo-referenced satellite image of ASTER and IRS LISS from 2007 to 2012 has
been superimposed to assess the sand bar movement. During 2007 to 2012, lateral movement
of Sandbar-1 (upstream of Sirajganj Hardpoint) ranges from 800m to 1870m whereas for
Sanbar-2 (downstream of Sirajganj Hardpoint) ranges from 560m to 1060m. At the same
time, the longitudinal movement of Sandbar-1 ranges from 150m to 600m whereas for
Sandbar-2 ranges from 300m to 1400m. It is observed that, the channel is developing very
fast along the western bank through deviation of flow towards the river bank. It’s is also
observed that the rate of bar translation is high and it may cause the siltation of the dredged
channel. Comparison of cross-section indicates that there is no significant positive impact of
dredging has observed near Sirajganj Hardpoint area as well as the downstream of
Banghabhandhu Bridge. It is also observed that the rate of siltation is higher, where the
dredging alignment passes through the existing char. It was happening, because the hydraulic
condition around the dredged area as well as upstream river morphology remain favorable for
the siltation on the existing char. Analysis of observed data indicates that, more than 1.75 m/s
flow velocity persists during the peaks which covering the entire Sirajganj Hardpoint area
and it persists from mid of May to September. Analysis of sediment concentration and depth
average velocity indicates that sediment concentration at particular depth and velocity plays
an important role in the erosion or deposition process along the study reach. It is found that at
a particular point under or over sediment concentration with respect to the sediment transport
capacity cause either erosion or deposition. The major finding of this study is that the
dredging of a braided river would not be a sustainable solution without changing upstream
river morphology as well as hydraulic conditions. It is also observed that, if the dredging
alignment passes through the existing channel not over the char area, the dredged channel
would be more sustainable.

iii
ABBREVIATIONS
ADCP Acoustic Doppler Current Profiler
BBA Bangladesh Bridge Authority
BBS Bangladesh Bureau Statistics
BRE Brahmaputra Right Embankment
BI Braiding Index
BM Bench Mark
BUET Bangladesh University of Engineering and Technology
BWDB Bangladesh Water Development Board
CEGIS Center for Environmental and Geographic Information Services
DGPS Differential Global Positioning System
DHI Delft Hydraulic Institute
EC Eastern Channel
EGB East Guide bank
FAP Flood Action Plan
G&D Gauge and Discharge
GPS Global Positioning System
GCPs Ground Control Points
GIS Geographic Information System
HFL High Flood Level
IWFM Institute of Water and Flood Management
IWM Institute of Water Modelling
KII Key Informant Interview
PRA Participatory Rural Appraisal
PWD Public Works Datum
RTW River Training Works
SHP Sirajganj Hard Point
TBM Temporary Bench Mark
WC Western Channel
WGB West Guide Bank

iv
TABLE OF CONTENTS
Page No.
ACKNOWLEDGEMENT i
ABSTRACT ii
ABBREVIATION iii
TABLE OF CONTENTS iv
LIST OF TABLES vi
LIST OF FIGURES vii
CHAPTER ONE: INTRODUCTION 1-5
1.1 Background and present state of the problem 1
1.2 Objectives with specific aims and possible outcome 3
1.3 Rationale of the study 4
1.4 Scope of works of this study 4
1.5 Limitations of the study 5
1.6 Structure of the thesis 5
CHAPTER TWO: LITERATURE REVIEW 6-20
2.1 Brahmaputra-Jamuna River system 6
2.2 Geomorphological classifications of river 7
2.3 Characteristics of a braided river 8
2.4 Channel formation and shifting process 10
2.5 Effects on channel stabilization 12
2.6 Erosion problem in the Jamuna River 13
2.7 Erosion management and river training works 15
2.8 Environmental and social impacts of dredging 16
2.9 Hydrometric information from Pilot Capital Dredging 16
2.9.1 Sediment concentration and properties of river bed sample 17
2.9.2 Siltation of the dredge channel 18
2.10 Summary on literature review 19
CHAPTER THREE: STUDY AREA 21-26
3.1 Study area 21
3.2 Physical features of the study reach 23
3.2.1 Topography 23
3.2.2 Demography 23
3.2.3 Hydro-Morphology 24
3.2.4 Sediment Transport 24
3.2.5 Infrastructures 25
3.3 Bank erosion of the study reach 25

v
CHAPTER FOUR: METHODOLGY 27-32
4.1 Reconnaissance Survey 27
4.2 Data collection 28
4.2.1 Primary data collection 28
4.2.2 Secondary data collection 29
4.3 Data analysis 31
4.3.1 Satellite image analysis 31
4.3.2 Cross-section comparison 31
4.3.3 Analyses of sediment concentration and depth average velocity 31
CHAPTER FIVE: RESULTS AND DISCUSSION 33-65
5.1 Physical observation and analysis 33
5.1.1 Satellite image analysis 33
5.1.2 Sand bar translation 33
5.1.3 Lateral translation 36
5.1.4 Longitudinal translation 37
5.2 Cross sections comparison 38
5.3 Analyses of sediment concentration and depth average velocity 43
5.3.1 Background of the analysis 43
5.3.2 Method-I (depth-velocity relationship) 44
5.3.3 Method-II (depth-velocity & sediment concentration relationship) 54
CHAPTER SIX: CONCLUSION AND RECOMMENDATIONS
66-67
6.1 Conclusion 66
6.2 Recommendations 67
REFERENCES 68-70

vi
LIST OF TABLES
Table No. Title Page No.
Table 2.1 Sediment concentration in the Jamuna River at different locations 17
Table 2.2 The observed siltation in the dredged area in different dates 19
Table 3.1 Centerline coordinates of dredging alignment from 21
Ch-0 m to Ch-22000 m
Table 4.1 List of imageries that are used in the analysis 29
Table 5.1 Changes in lateral translation of the sandbars 36
Table 5.2 Changes in longitudinal translation of the sandbars 37
Table 5.3 Depth of water and depth average velocity at different dates 46
around the study area
Table 5.4 Depth of water, actual sediment concentration and predicted 55
sediment concentration at different dates around the study area

vii
LIST OF FIGURES
Figure No. Title Page No.
Figure 1.1 River systems of Bangladesh. (Source: BWDB, 2010) 3
Figure 2.1 Channel classification based on sediment load and system 7
stability (Source: Schumm, 1977)
Figure 2.2 Steps in the development of a braiding process 9
(Leopold and Wolman, 1957)
Figure 2.3 Channel classification in the Jamuna River (Bristow, 1987) 9
Figure 2.4 Diagram of meandering wave length, amplitude and 10
radius of curvature
Figure 2.5 Historical development of rivers in Bangladesh 11
Figure 2.6 Modes of failure of Sirajganj Hardpoint at 2009 15
Figure 3.1 The study area showing from Sirajganj Hard Point to 22
Dhaleswari offtake
Figure 4.1 Methodological flow chart of the study 27
Figure 4.2 Location map around the study area from Sirajganj Hardpoint to 30
Dhaleswari Offtake
Figure 5.1 The sandbar movements of Jamuna River from 2007 to 2010 34
Figure 5.2 The sandbar movement of Jamuna River from 2011 to 2012 35
Figure 5.3 Schematic diagrams of lateral and longitudinal translation of bars 35
(Source: Fazana Mahmud, M.Sc thesis, 2011)
Figure 5.4 Lateral translation of the sandbar-1 and sandbar-2 37
Figure 5.5 Longitudinal translation of the sandbar-1 and sandbar-2 38
Figure 5.6 Cross-sections of Jamuna river at upstream of Hardpoint 39
Figure 5.7 Cross-sections of Jamuna River near Sirajganj Hardpoint 39
Figure 5.8 Cross-sections of Jamuna River along dredge channel 40
Figure 5.9 Cross-sections of Jamuna River near East guide bundh 40
Figure 5.10 Cross-sections of Jamuna River near West guide bundh 41
Figure 5.11 Cross-sections of Jamuna River near downstream of 41
Jamuna Bridge
Figure 5.12 Map showing the sediment concentration and velocity 45
measurement locations of Jamuna River around the study area
Figure 5.13 Erosion and deposition on the riverbed at Sirajganj Hardpoint 49
right bank of Jamuna in period April, 2012 to January, 2013
Figure 5.14 Erosion and deposition on the riverbed at Sirajganj Hardpoint left 49
bank of Jamuna River in period April, 2012 to January, 2013
Figure 5.15 Erosion and deposition on the riverbed at dredged channel right 50
bank of Jamuna River in period May to November, 2012

viii
Figure 5.16 Erosion and deposition on the riverbed at dredged channel left 50
bank of Jamuna River in period April, 2012 to January, 2013
Figure 5.17 Erosion and deposition on the riverbed at Bangabandhu Bridge 51
right channel center of Jamuna River in period June-August, 2012
Figure 5.18 Erosion and deposition on the riverbed at Bangabandhu Bridge 51
D/S right channel right bank of Jamuna River in period June, 2012
to January, 2013
Figure 5.19 Erosion and deposition on the riverbed at Bangabandhu Bridge 52
D/S right channel left bank of Jamuna River in period
April-November, 2012
Figure 5.20 Erosion and deposition on the riverbed at Bangabandhu Bridge 52
D/S left channel right bank of Jamuna River in period May, 2012
to January, 2013
Figure 5.21 Erosion and deposition on the riverbed at Bangabandhu Bridge 53
D/S left channel left bank of Jamuna River in period April, 2012
to January, 2013
Figure 5.22 Depth, predicted and actual sediment concentration at Sirajganj 58
Hardpoint Right Bank of Jamuna River in period April, 2012
to January, 2013
Figure 5.23 Water depth, predicted and actual sediment concentration at 58
Sirajganj Hardpoint left bank of Jamuna River in period
April, 2012 to January, 2013
Figure 5.24 Depth, predicted and actual sediment concentration at dredged 59
channel right bank of Jamuna River in period May to
November, 2012
Figure 5.25 Depth, predicted and actual sediment concentration at dredged 59
channel left bank of Jamuna River in period April, 2012 to
January, 2013
Figure 5.26 Depth, predicted and actual sediment concentration at 60
Bangabandhu Bridge U/S right channel center of Jamuna River
in period June-August, 2012
Figure 5.27 Depth, predicted and actual sediment concentration at 60
Bangabandhu Bridge D/S right channel right bank of Jamuna
River in period June, 2012 to January, 2013
Figure 5.28 Depth, predicted and actual sediment concentration at 61
Bangabandhu Bridge D/S right channel left bank of Jamuna
River in period April-November, 2012
Figure 5.29 Depth, predicted and actual sediment concentration at 61
Bangabandhu Bridge D/S left channel right bank of Jamuna
River in period May, 2012 to January, 2013
Figure 5.30 Depth, predicted and actual sediment concentration at 62
Bangabandhu Bridge D/S left channel left bank of Jamuna
River in period April, 2012 to January, 2013