Embed Size (px)
Citation preview

Study on neuroendocrine cell lines andileocaecal neuroendocrine primary tumors andmetastases. Antibodies againstparaneoplastic/onconeural antigen Ma2 inpatient blood: Clinical significance.
Tao Cui
Degree project in applied biotechnology, Master of Science (2 years), 2009Examensarbete i tillämpad bioteknik 45 hp till masterexamen, 2009Biology Education Centre and Faculty of Medical Sciences, Department of Endocrine Oncology,University Hospital, Uppsala UniversitySupervisor: Valeria Giandomenico (Ph.D.)
1
Abstract
Gastrointestinal Neuroendocrine Tumors are rare and slow growing tumors originated from the cells of the diffuse neuroendocrine system. The increased incidence of this disease and the late diagnosis require in-depth understanding of mechanisms behind tumor progression, and development of early diagnostic tools. In this project, we evaluated a variety of neuroendocrine makers including somatostatin receptors on different neuroendocrine tumor cell lines by using reverse transcription polymerase chain reaction, quantitative realtime polymerase chain reaction and western blot. These analyses may establish the best cell lines to further in vitro study. Furthermore, we tried to develop novel potential neuroendocrine diagnostic markers. Protein Z-dependent protease inhibitor precursor Serpin A10 and paraneoplastic/onconeural antigen Ma2 were recently identified as potential markers. We therefore tried to set up novel enzyme-linked immunosorbant assays to measure Serpin A10 and anti-Ma2 antibodies on plasma from NETs patients.
2
Abbreviations
bFGF: basic fibroblast growth factor
BSA: bovine serum albumin
CHGA (GgA): chromogranin A
CHGB (CgB): chromogranin B
D-MEM/F12 medium: Eagle's minimal essential
medium/F12 medium
EC cells: enterochromaffin cells
ELISA: enzyme-linked immunosorbent assay
ENETS: the European Neuroendocrine Tumor Society
FBS: fetal bovine serum
GEP-NET: gastroenteropancreatic neuroendocrine tumor
GH: growth factor
GHRH: Growth hormone-releasing hormone
GI: gastrointestinal tract
GPCR: G-protein coupled receptor
HEPES:4-(2-hydroxyethyl)-1-piperazineethanesulfonic
acid
IA2: islet antigen 2
IGF: insulin-like growth factor
IHC: immunohistochemistry
LDCV: large dense-core vesicle
2-ME: 2-mercaptoethanol
NCI: the US National Cancer Institute
NEAA: non-essential amino acid
NEC: neuroendocrine carcinoma
NESP55: neuroendocrine secretory protein 55
NET: neuroendocrine tumor
NIH: the US congressional committee for the National
Institutes of Health
NSE: neuron-specific enolase
octreotide LAR: octreotide long-acting release
PBS: phosphate buffer saline
PDGF: platelet-derived growth factors
PEST: penicillin-streptomycin
PGP9.5: protein gene product 9.5
PNMA2: paraneoplastic antigen Ma2
PNS: paraneoplastic neurological syndromes
PZI: Protein Z-dependent protease inhibitor
Q-RT-PCR: quantitative realtime PCR
RPMI medium: the Roswell Park Memorial
Institute medium
RT-PCR: reverse transcription PCR
SCG3: secretogranin 3
SDS-PAGE: sodium dodecyl sulfate polyacrylamide
gel electrophoresis
SEER Program: the US Surveillance Epidemiology
and End Results Program
Serpin A1: a-1-antitrypsin
SERPINA10: protein Z-dependent protease
inhibitor Precursor Serpin A10
SS (SST): somatostatin
SSA: somatostatin analogue
SSTR: somatostatin receptor
SYN: synaptophysin
TBS: Tris-bufferred saline
TNM: Tumor-Node-Metastasis
TPH1: tryptophan hydroxylase 1
VEGF: vascular endothelial growth factors
VGF: a neuropeptide
VMAT-1: vesicular monoamine transporter-1
VMAT-2: vesicular monoamine transporter-2
3
Introduction
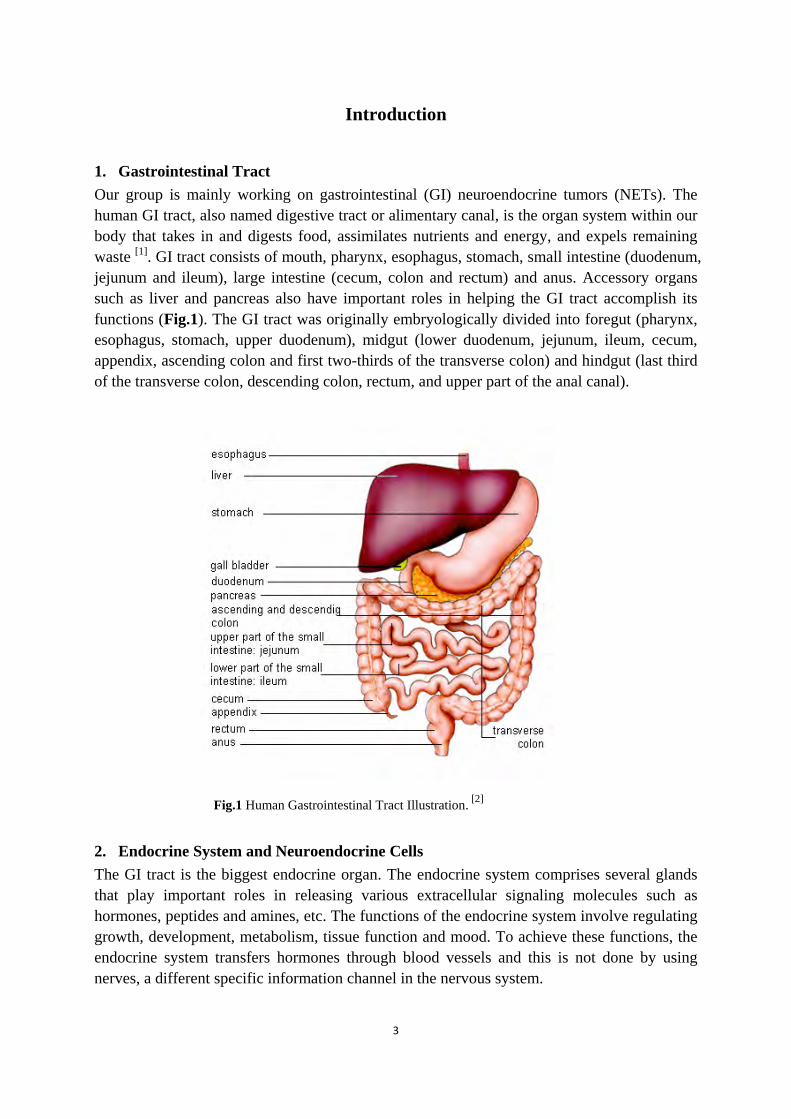
1. Gastrointestinal Tract Our group is mainly working on gastrointestinal (GI) neuroendocrine tumors (NETs). The human GI tract, also named digestive tract or alimentary canal, is the organ system within our body that takes in and digests food, assimilates nutrients and energy, and expels remaining waste [1]. GI tract consists of mouth, pharynx, esophagus, stomach, small intestine (duodenum, jejunum and ileum), large intestine (cecum, colon and rectum) and anus. Accessory organs such as liver and pancreas also have important roles in helping the GI tract accomplish its functions (Fig.1). The GI tract was originally embryologically divided into foregut (pharynx, esophagus, stomach, upper duodenum), midgut (lower duodenum, jejunum, ileum, cecum, appendix, ascending colon and first two-thirds of the transverse colon) and hindgut (last third of the transverse colon, descending colon, rectum, and upper part of the anal canal).
Fig.1 Human Gastrointestinal Tract Illustration. [2]
2. Endocrine System and Neuroendocrine Cells The GI tract is the biggest endocrine organ. The endocrine system comprises several glands that play important roles in releasing various extracellular signaling molecules such as hormones, peptides and amines, etc. The functions of the endocrine system involve regulating growth, development, metabolism, tissue function and mood. To achieve these functions, the endocrine system transfers hormones through blood vessels and this is not done by using nerves, a different specific information channel in the nervous system.

4
There are a variety of endocrine glands in our body, secreting specific types of hormones involved in many different regulation pathways, such as pituitary gland, hypothalamus, thyroid, adrenal gland, etc. An example of glands can be illustrated by hypothalamus, which links the endocrine system to our nervous system via the pituitary gland, and secretes important hormones like the Growth hormone-releasing hormone (GHRH) and Somatostatin (SS, SST), etc. Hormone secretion disorders are caused by a variety of reasons including genetic variations, upregulation or/and downregulation, etc., and play an important role in cancer pathogenesis. The neuroendocrine cells are endocrine cells with neuro-phenotype, which bridge the nervous system to the endocrine system. Throughout the GI tract, at least 14 types of gastrointestinal neuroendocrine cells are categorized and characterized according to their localizations and generated bioactive products, factors that regulate secretion of their products have also been summarized [3] (Table 1). Table 1 Types of gastrointestinal neuroendocrine cells and factors that regulate their secretion [3]
Cell type Localisation Products Factors that regulate secretion
D Gastrointestinal tract
Somatostatin Hormones, neural factors, and acid
Enterochromaffin
Gastrointestinal tract
Serotonin, substance P, guanylin, and melatonin
Luminal factors, hormones, and neural factors
Enterochromaffin-like
Stomach Histamine Hormones, gastrin, and neural factors
G Stomach and duodenum
Gastrin Amino acids, neural factors, and acid
Gr Gastrointestinal tract
Gastrin Luminal factors and hormones
I Duodenum Cholecystokinin, gastrin, etc Lipids and neural factors
K Duodenum and jejunum
Gastric inhibitory polypeptide
Nutrients and hormones
L Small intestine Glucagon-like peptide, peptide YY, and neuropeptide Y
Glucose and hormones
Motilin Duodenum Motilin Neural factors and luminal factors
N Small intestine Neurotensin Lipids
S Duodenum Secretin Acid
VIP Gastrointestinal tract
Vasoactive intestinal peptide Neural
X Stomach Amylin Not defined

5
An important example of these types of neuroendocrine cells can be illustrated by the enterochromaffin cells (EC cells). In the gastrointestinal tract, a group of specialized neuroendocrine cells are called EC cells, owing to their “entero” (meaning related to the gut) localization, and their “chromaffin cells” reality, sharing a chromium salt relation with chromaffin cells that are commonly found in the adrenal medulla. EC cells are mainly located in the small intestine, secreting protein and peptide hormones such of serotonin, substance P, etc. A common feature to distinguish EC cells from other gastrointestinal neuroendocrine cells is that they usually contain and produce the majority of serotonin (5-hydroxytryptamine, or 5-HT). Serotonin is a hormone amine which responds to luminal mechanical, pathological or chemical stimuli, activating secretory and peristaltic reflexes. 3. Gastroentropancreatic Neuroendocrine Tumors (GEP-NET) Epidemiology and Classification Gastroentropancreatic neuroendocrine tumors (GEP-NETs) are tumors originated from the cells of the diffuse neuroendocrine system. They clinically comprise about 2% of malignant gastrointestinal and pancreatic tumors. GEP-NETs are rare diseases with an incidence of 1-5 per 100,000 people. Despite its rarity during the last 3 decades, the incidence of this disease has substantially raised as suggested by the US Surveillance Epidemiology and End Results (SEER) Program of the US National Cancer Institute (NCI). The lack of knowledge of neuroendocrine tumor biology has been delaying improvement of their management. Currently, neuroendocrine tumors have been elevated to the second place after autism in the priority of funding by the NCI and the United States congressional committee for the National Institutes of Health (NIH). Identification of new targets, development of early diagnosis strategies, as well as novel effective treatments are highly requested as suggested by the last NCI summit conference, held in 2007 [4]. Gastrointestinal neuroendocrine tumors are rare and slow growing. However, they are always late diagnosed and are generally detected at the stage of metastasis, when they are incurable. Some of the GEP-NETs are functioning, and thus they can be clinically characterized by hormone-related symptoms. However, some of the gastrointestinal and pancreatic neuroendocrine tumors are nonfunctioning without any hormone-related symptom, which creates a higher difficulty for diagnosis and treatment establishment [5]. Various differences in the clinical manifestations, genetic behaviors, pathological behaviors, lack of diagnostic and prognostic markers of these NETs have been creating difficulties in their correct classifications. The WHO classification established in 2000, is still widely employed all over the world and especially in the USA. This novel classification had abandoned the old type of classification which only categorizes GI-NETs embryologically to foregut, midgut, and hindgut neuroendocrine (carcinoids) tumors. The WHO classification therefore overtook previous confusions of nomenclature, histopathological, molecular and clinical features recognition and divided these tumors into 3 different categories: well differentiated neuroendocrine tumors (with benign or uncertain behaviors), well differentiated neuroendocrine carcinomas (refers with low-grade malignant behaviors) as well as poorly

6
differentiated neuroendocrine carcinomas (with highly malignant behaviors) [6]. Prognosis describes about 5-year survival for ileal, appendiceal, and rectal neuroendocrine tumors with significant variability. The medical environment therefore still requires a more accurate classification. The European Neuroendocrine Tumor Society (ENETS) recently discussed, wrote and published guidelines for the management of patients with GEP-NETs. The scientific committee proposed TNM (Tumor-Node-Metastasis) classification on foregut NETs and midgut/hindgut NETs in two different papers. The midgut NETs, previously named midgut carcinoid, of the lower jejunum and ileum, were specifically classified according to disease stage as well as grading system (Table 2, 3, 4). They always display intense and diffuse expression of two most important immunohistochemical neuroendocrine markers: chromogranin A and synaptophysin. G1 and G2 stages indicate well-differentiated neuroendocrine tumors that are rarely associated with a mitotic proliferation Ki67 index higher than 20%, as shown in Table 4. G3 stage indicates poorly-differentiated neuroendocrine carcinoma with rather high Ki-67 index and mitotic counts, remarkably reduced staining for chromogranin A and intense staining for synaptophysin. Furthemore, ENETS and WHO share the grading system [7]. Table 2 Proposal for a TNM classification for neuroendocrine tumors of lower jejunum and ileum [7]
TNM (Tumor Node Metastasis) T-primary tumor N-regional lymph nodes
T0 No evidence of primary tumor TX Primary tumor cannot be assessed T1 Tumor invades mucosa or submucosa and size ≤1 cm T2 Tumor invades muscularis propria or size >1 cm T3 Tumor invades subserosa T4 Tumor invades peritoneum/other organs *For any T add (m) for multiple tumors
NX Regional lymph nodes cannot be assessed N0 No regional lymph node metastasis N1 Regional lymph node metastasis
M-Distant metastasis MX Distant metastasis cannot be assessed M0 No distant metastases M1a Distant metastasis
a: M1 specific sites defined according to Sobin LH, Wittekind C [8]. Table 3 Disease stages for neuroendocrine tumors of lower jejunum and ileum [7]
Disease stages T-primary tumor N-regional nodes M-distant metastasis Stage I T1 N0 M0
Stage IIA T2 N0 M0 Stage IIB T3 N0 M0 Stage IIIA T4 N0 M0 Stage IIIB Any T N1 M0 Stage IV Any T Any N M1

7
Table 4 Grading proposal for neuroendocrine tumors of ileum, appendix, colon and rectum [7] Grade Mitotic count (10HPF)* Ki-67 index (%)** G1 <2 ≤2 G2 2–20 3–20 G3 >20 >20 * 10 HPF (High Power Field) = 2 mm2, at least 40 fields (at 40× magnification) evaluated in areas of highest mitotic density;** MIB1 antibody; % of 2000 tumor cells in areas of highest nuclear labeling[7]. Cell biology Most GI-NETs, previously named “carcinoids”, are usually sporadic tumors originated from EC cells within gastrointestinal tract [9]. Though neuroendocrine cells in the GI tract are clearly derived from local multipotent gastrointestinal stem cells, the differentiation of these cells within the diffuse neuroendocrine system is still poorly understood. Secretion of bioactive amines and peptides is regulated by G-protein-coupled receptors, which are tyrosine-kinase or ion-gated active receptors. Hormones and their precursors are usually packed into large dense-core secretory granules that bud from the tran-Golgi network and highly regulated by chromogranin A (GgA, CHGA). Calcium-dependent pathway leads actin reorganization inducing secretagogue-evoked stimulation, and allows further trafficking of granule membrane and release of bioactive peptides and amines. Furthermore, secreted hormones and peptides by the enterochromaffin cells (EC cells) lead toward activating intracellular pathways such as adenylyl cyclase pathway. However, some other hormones or bioactive molecules like somatostatin, acetylcholine and γ-aminobutyric acid lead inhibiting effect on EC cell hormone secretion, via different types of receptors such as somatostatin receptor 2 [4]. Somatostatin and Somatostatin Receptors Somatostatin (SST) is a small polypeptide hormone with either 14 or 28 amino acids released from the pituitary gland, acting as growth factor (GH) inhibitors. The inhibitory role results in a wide range of functions including inhibition of cell proliferation, cell survival, angiogenesis, endocrine secretion as well as exocrine secretion. The biological effect of somatostatin is mediated by somatostatin receptors (SSTRs), which are G-protein coupled receptors (GPCRs) with high sequence similarity (39%-57%). There are five difference subtypes of SSTRs (SSTR1-5), transducing messages induced by agonists into different intracellular signaling pathways in different cell types and under a variety of conditions. Specific subtypes of SSTRs are associated with cell-specific expression and different signaling coupling specificities. However, mechanisms behind SSTR-related cell signaling are far more complex than our current knowledge, considering receptor endocytosis and trafficking, as well as frequent preorganizations resulted from interactions with many intracellular proteins other than G-protein. Furthermore, SSTRs form homo-and/or hetero-oligomeric complexes, different heterodimers such as SSTR2-SSTR3 and SSTR1-SSTR5 have been found, with altered functional and/or pharmacological properties, by physical interactions. Heterodimerization can even occur with other cell surface receptors

8
such as opioid or dopamine receptors [9, 10]. Heterodimerization creates more versatile signaling to control a bigger number of cellular functions. SST has a dual inhibitory function acting both against hormone secretion and cell growth, and has therefore been used as an ideal model of drug candidate for a long time. However, their short half life induced the development of many artificially synthesized somatostatin analogues (SSAs). Some of them are today clinically approved drugs for the treatment of neuroendocrine tumors and several different neoplasms. Different SSAs have very specific affinities for different SSTRs. Octreotide is one of the most commonly administered short acting drug, and usually the administration needs to be several times subcutaneously per day. Other drugs include octreotide long-acting release (octreotide LAR) and lanreotide autogel that require only monthly administrations. Newly developed drugs such as pasireotide (SOM230, Novartis) act as a stable universal pan-receptor somatostatin analogue, with high affinity for (somatostatin receptor subtype SSTR2, 3, 5 and moderate affinity for SSTR1, is under phase clinical trials with promising prospect [11]. Distributions of different somatostatin receptors vary in various tissues including: pancreas, gut, pituitary, thyroid, lung, kidney, immune system and the central nervous system [12]. They are specifically expressed on different neuroendocrine cells, and even in different patients suffering from the same kind of tumor. GEP-NETs express SSTR2 at a highest level, followed by SSTR1, SSTR5 and SSTR3, while only a few tumors express SSTR4 [13, 14]. Evidences have shown that well-differentiated GEP-NETs express SSTRs in higher density than undifferentiated tumors, and some somatostatin analogues (SSAs) such as octreotide and lanreotide are effective against GEP-NETs, performing their inhibitory activities as well as anti-secretory effect mainly mediated through SSTR2, SSTR5 and SSTR1 [14]. Furthermore, SSAs can also inhibit the function and release some angiogenic factors, such as platelet-derived growth factors (PDGFs), insulin-like growth factors (IGFs), vascular endothelial growth factors (VEGFs) and basic fibroblast growth factors (bFGFs). Somatostatin can also exert an effect on apoptosis, which is mainly mediated through SSTR2 and SSTR3 via a down-regulation of Bcl-2 or an up-regulation of Bax and p53 [15].
Human Neuroendocrine Cell Lines The sparsity of human neuroendocrine tumor cell lines that specifically mimic different phenotypes of different types of NETs have hampered molecular and clinical research. Currently, the most widely used NET cell line is BON, which was derived from a young male with a lymph node metastatic pancreatic tumor [16]. QGP1 is another available pancreatic neuroendocrine cell line. Both BON and QGP1 are cell lines with neuroendocrine characteristics in terms of neuroendocrine markers and cell morphology. However, both of them were established from pancreatic tumors and are therefore not ideal cell lines to study ileocaecal neuroendocrine tumors. During the last five years, a few midgut neuroendocrine cell lines have been established, such as CNDT2.5 and HC45. CNDT2.5 was established from malignant hepatic cells from a

9
middle age woman with an ileal primary tumor (carcinoid) as well as liver metastasis. This cell line grows fast with a doubling time of approximately 20h [17], compared to another ileal neuroendocrine tumor cell line, HC45, which is growing in a less proper manner [18]. Furthermore, KRJ1 is an ileal NET cell line established from a multifocal metastatic ileal NET, and was proved to share similar transcriptome with native human EC cells [19]. Before using different neuroendocrine cell lines for research purpose, expression of NET markers or EC cell markers needs to be verified. This is because cell lines can easily lose essential neuroendocrine markers after a long culturing time in various labs by using different culture reagents and procedures to keep cells in a good status. Neuroendocrine markers Biomarkers are biochemical features that can be used to measure the progress of disease or the effects of treatment. Neuroendocrine markers include: chromogranin A (CHGA, CgA), chromogranin B (CHGB, CgB), vesicular monoamine transporter-1 (VMAT-1), vesicular monoamine transporter-2 (VMAT-2), VGF (a neuropeptide), neuroendocrine secretory protein 55 (NESP55), synaptophysin (SYN), neuron-specific enolase (NSE), protein gene product 9,5 (PGP9.5) and somatostatin receptors (SSTRs) [20]. These markers can also be grouped as plasma/serum markers and tissue markers according to different diagnostic methods. Chromogranin A is a tumor-volume-dependent soluble glycoprotein colocalized with peptides and amines in the large dense-core vesicles (LDCVs) of neuroendocrine cells, and it is the most frequently used general plasma and tissue marker for neuroendocrine tumors especially for non-functioning tumors, with well established highly specific plasma assay kits commercially available [4, 21]. Other serum markers for NETs comprise neuron-specific enolase (NSE), pancreatic polypeptide with intermediate specificity and choriogonadotropin α and β, which may suggest a more malignant phenotype [4]. For specific duodenum serum markers, somatostatin and gastrin are highlighted, compared to the highly specific marker serotonin in the ileum. Besides, neurokinin A, neuropeptide K and substance P are used as markers for ileal NETs as well with intermediate specificity. On the other hand, diagnostic and prognostic NET tissue markers include markers that are used to identify neuroendocrine neoplasia such as chormogranin A, synaptophysin and NSE, markers to assess cell proliferation such as Ki-67 index, and markers as hormone receptors for assessment of receptor-specific treatment such as SSTRs, tachykinin, vasoactive intestinal peptide, dopamine receptors, serotonin receptors, etc [9]. Recently, microarray analysis on primary ileocaecal neuroendocrine tumors and their liver metastases, and validation by using reverse transcription PCR (RT-PCR), quantitative realtime PCR (Q-RT-PCR) and immunohistochemistry (IHC) on midgut neuroendocrine carcinoma cells (NEC cells) compared to EC cells and normal epithelial cells have revealed several novel NEC markers including serpin A10 (SERPINA10), paraneoplastic antigen Ma2 (PNMA2), glutamate receptor ionotropic AMPA2 (GRIA2), testican-1 precursor (SPOCK1), olfactory receptor family 51 subfamily E member 1 (OR51E1) and G-protein coupled receptor (SPOCK1), etc [22]. SERPINA10 and PNMA2 were first chosen for further investigations.
10
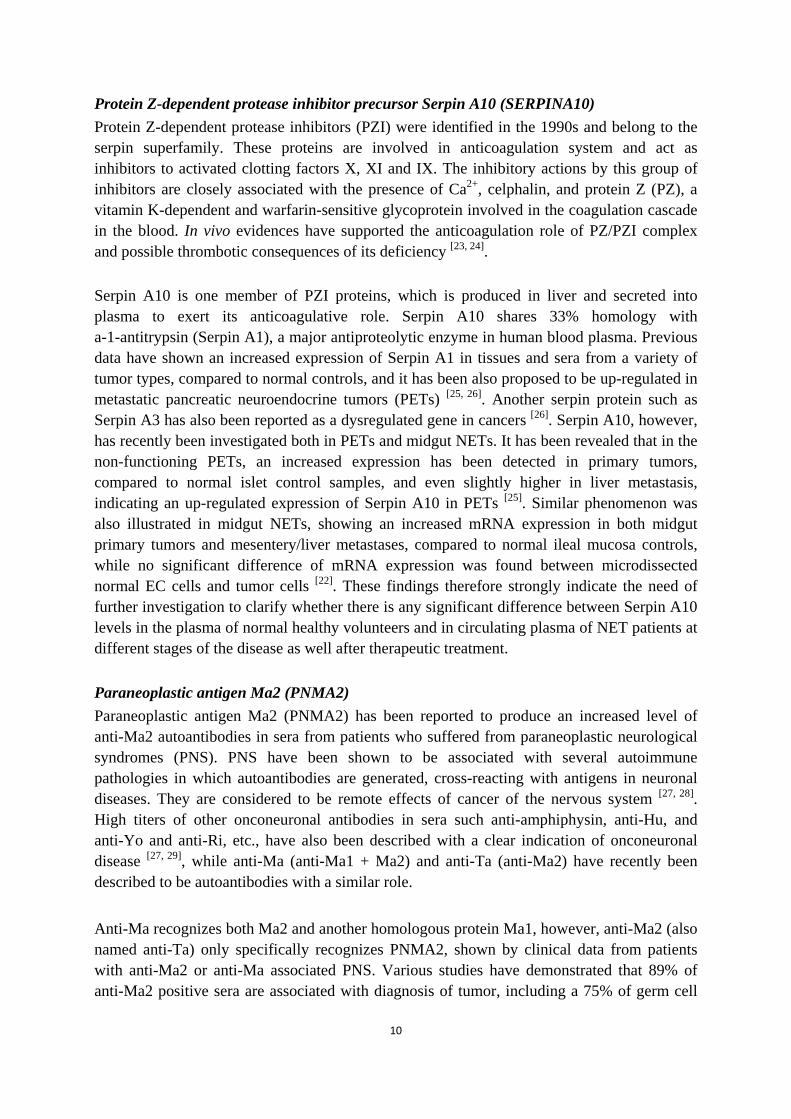
Protein Z-dependent protease inhibitor precursor Serpin A10 (SERPINA10) Protein Z-dependent protease inhibitors (PZI) were identified in the 1990s and belong to the serpin superfamily. These proteins are involved in anticoagulation system and act as inhibitors to activated clotting factors X, XI and IX. The inhibitory actions by this group of inhibitors are closely associated with the presence of Ca2+, celphalin, and protein Z (PZ), a vitamin K-dependent and warfarin-sensitive glycoprotein involved in the coagulation cascade in the blood. In vivo evidences have supported the anticoagulation role of PZ/PZI complex and possible thrombotic consequences of its deficiency [23, 24]. Serpin A10 is one member of PZI proteins, which is produced in liver and secreted into plasma to exert its anticoagulative role. Serpin A10 shares 33% homology with a-1-antitrypsin (Serpin A1), a major antiproteolytic enzyme in human blood plasma. Previous data have shown an increased expression of Serpin A1 in tissues and sera from a variety of tumor types, compared to normal controls, and it has been also proposed to be up-regulated in metastatic pancreatic neuroendocrine tumors (PETs) [25, 26]. Another serpin protein such as Serpin A3 has also been reported as a dysregulated gene in cancers [26]. Serpin A10, however, has recently been investigated both in PETs and midgut NETs. It has been revealed that in the non-functioning PETs, an increased expression has been detected in primary tumors, compared to normal islet control samples, and even slightly higher in liver metastasis, indicating an up-regulated expression of Serpin A10 in PETs [25]. Similar phenomenon was also illustrated in midgut NETs, showing an increased mRNA expression in both midgut primary tumors and mesentery/liver metastases, compared to normal ileal mucosa controls, while no significant difference of mRNA expression was found between microdissected normal EC cells and tumor cells [22]. These findings therefore strongly indicate the need of further investigation to clarify whether there is any significant difference between Serpin A10 levels in the plasma of normal healthy volunteers and in circulating plasma of NET patients at different stages of the disease as well after therapeutic treatment. Paraneoplastic antigen Ma2 (PNMA2) Paraneoplastic antigen Ma2 (PNMA2) has been reported to produce an increased level of anti-Ma2 autoantibodies in sera from patients who suffered from paraneoplastic neurological syndromes (PNS). PNS have been shown to be associated with several autoimmune pathologies in which autoantibodies are generated, cross-reacting with antigens in neuronal diseases. They are considered to be remote effects of cancer of the nervous system [27, 28]. High titers of other onconeuronal antibodies in sera such anti-amphiphysin, anti-Hu, and anti-Yo and anti-Ri, etc., have also been described with a clear indication of onconeuronal disease [27, 29], while anti-Ma (anti-Ma1 + Ma2) and anti-Ta (anti-Ma2) have recently been described to be autoantibodies with a similar role. Anti-Ma recognizes both Ma2 and another homologous protein Ma1, however, anti-Ma2 (also named anti-Ta) only specifically recognizes PNMA2, shown by clinical data from patients with anti-Ma2 or anti-Ma associated PNS. Various studies have demonstrated that 89% of anti-Ma2 positive sera are associated with diagnosis of tumor, including a 75% of germ cell

11
tumor, 9% of lung tumor, 9% of breast tumor, and a minority of ovary tumor, where most of the patients showed paraneoplastic syndromes before tumor diagnosis [30]. PNMA2 has been studied by using quantitative realtime PCR (Q-RT-PCR) and is more expressed in the primary midgut NETs and liver/mesentery metastases, compared to normal ileal mucosa. Slight higher expression in tumor cells compared to microdissected normal enterochromaffin cells (EC cells) has also been revealed. Furthermore, immunohistochemistry (IHC) studies also revealed moderate staining in primary tumors and corresponding metastases, compared to normal ileal tissue [22]. It is therefore of crucial importance to screen sera from ileocaecal NET patients and normal healthy donors to see whether there is any significant difference in terms of anti-PNMA2 autoantibodies titers. 4. Aims In this project work, we aimed to perform screening of neuroendocrine markers and SSTRs on midgut NET cell lines CNDT2.5, HC45, CNDT2.5 and pancreatic NET cell lines BON, QGP1; to set up a sandwich ELISA or alternative method to investigate SERPINA10 levels in the plasma from patients suffering from midgut NETs at different stages of the disease, and normal healthy controls and to set up an indirect ELISA or alternative method to investigate PNMA2 autoantibody levels in the sera from patients suffering from midgut NETs at different stages of the disease, and normal healthy controls.
Materials and Methods
Cell culture The human ileal neuroendocrine tumor cell line CNDT2.5 was grown in a humidified 37°C incubator in 5% CO2 and cultured in D-MEM/F12 (Eagle's minimal essential medium/F12) 1:1 medium (Invitrogen, USA) supplemented with 10% fetal bovine serum (FBS), 1% penicillin-streptomycin (PEST), 1% 4-(2-hydroxyethyl)-1-piperazineethanesulfonic acid (HEPES), 1% sodium pyruvate, 1% vitamins, 1% L-glutamine, and 1% non-essential amino acid (NEAA) according to references [17]. The human ileal neuroendocrine tumor cell line HC45 was cultured in RPMI (Roswell Park Memorial Institute) medium 1640 (Invitrogen, USA) supplemented with 10% BSA, 5% horse serum, 1ug/ml insulin, and 1% PEST at 37°C in condition of 5% CO2 according to references [18]. The human ileal neuroendocrine tumor cell line KRJ1 was cultured in Ham’s F12 medium (Gibco, USA) as floating aggregates at 37°C in atmosphere of 5% CO2 and the medium was supplemented with 10% FBS, 1% PEST [19, 31]. The human pancreatic neuroendocrine tumor cell line BON was cultured in DMEM/F12 Kaighn modification medium (Giboco, USA) at 37°C with 5% CO2, and the medium was supplemented with 10% FBS, 1% PEST and 1% sodium pyruvate. The human pancreatic neuroendocrine tumor cell line QGP1 was cultured in RPMI medium 1640 supplemented with 10% FBS and 1% PEST at 37°C with 5% CO2
[32].
12
RNA isolation Total RNA from CNDT2.5, HC45, BON and QGP1 cell lines was extracted by using PARIS Kit (Applied Biosystems/Ambion, USA) according to the manufacture’s instruction. Total RNA from KRJ1 cell line was prepared by using RNeasy Mini Kit (QIAGEN) according to the manufacture’s instruction. All concentrations of total RNA was quantified by using Nanodrop 1000 (Thermo Scientific) and was further treated with DNase I (QIAGEN), incubating the samples at 37°C for 30min, and then at 65°C for 5min to inactivate the enzyme. Total RNA was aliquoted to 225ng/µl, and all of the samples were stored at -80°C.
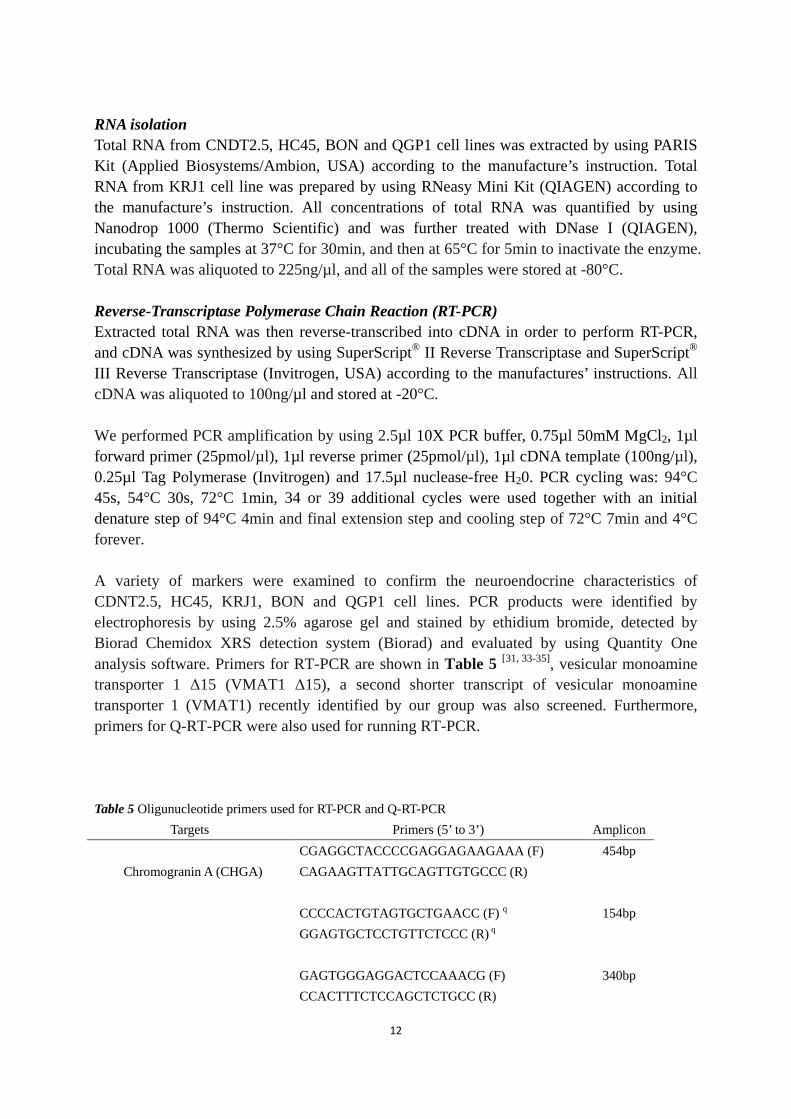
Reverse-Transcriptase Polymerase Chain Reaction (RT-PCR) Extracted total RNA was then reverse-transcribed into cDNA in order to perform RT-PCR, and cDNA was synthesized by using SuperScript® II Reverse Transcriptase and SuperScript® III Reverse Transcriptase (Invitrogen, USA) according to the manufactures’ instructions. All cDNA was aliquoted to 100ng/µl and stored at -20°C. We performed PCR amplification by using 2.5µl 10X PCR buffer, 0.75µl 50mM MgCl2, 1µl forward primer (25pmol/µl), 1µl reverse primer (25pmol/µl), 1µl cDNA template (100ng/µl), 0.25µl Tag Polymerase (Invitrogen) and 17.5µl nuclease-free H20. PCR cycling was: 94°C 45s, 54°C 30s, 72°C 1min, 34 or 39 additional cycles were used together with an initial denature step of 94°C 4min and final extension step and cooling step of 72°C 7min and 4°C forever. A variety of markers were examined to confirm the neuroendocrine characteristics of CDNT2.5, HC45, KRJ1, BON and QGP1 cell lines. PCR products were identified by electrophoresis by using 2.5% agarose gel and stained by ethidium bromide, detected by Biorad Chemidox XRS detection system (Biorad) and evaluated by using Quantity One analysis software. Primers for RT-PCR are shown in Table 5 [31, 33-35], vesicular monoamine transporter 1 Δ15 (VMAT1 Δ15), a second shorter transcript of vesicular monoamine transporter 1 (VMAT1) recently identified by our group was also screened. Furthermore, primers for Q-RT-PCR were also used for running RT-PCR. Table 5 Oligunucleotide primers used for RT-PCR and Q-RT-PCR
Targets Primers (5’ to 3’) Amplicon
Chromogranin A (CHGA) CGAGGCTACCCCGAGGAGAAGAAA (F) CAGAAGTTATTGCAGTTGTGCCC (R)
454bp
CCCCACTGTAGTGCTGAACC (F) q GGAGTGCTCCTGTTCTCCC (R) q
154bp
GAGTGGGAGGACTCCAAACG (F) CCACTTTCTCCAGCTCTGCC (R)
340bp

13
Tryptophan hydroxylase 1 (TPH1) TGCACTTTCTGGACATGCCAAAGTA (F) ATACTCGGCTTCCTGCTGACCTTA (R)
303bp
GAAGATGCAAAGGAGAAGATG (F) GACCTTAGCAAGGGCATCAC (R)
175bp
Synaptophysin (SYN) CAGGCTGCACCAAGTGTACTTTGAT (F) GAACACAGCCGTGGCCAGAAAGTC (R)
224bp
Islet antigen 2 (IA2) GAGCTTCTACCTGAAGAACGTGCA (F) ACTGGGGCAGGGCCTTGAGGATG (R)
382bp
Vesicular monoamine transporter 1 (VMAT1)
TATGCTCCACTCTGCTACTACCTGC (F) TGCGGCACCAAGGCATAGAGGAAGA (R)
372bp
GGTGGATTCTTCTATGATGCC (F) GTGGATGGACCTATAGCAAAGC (R)
127bp
Vesicular monoamine transporter 1 Δ15 (VMAT1 Δ15)
GGTGGATTCTTCTATGATGCC (F) CTCAGAATAGCCTATAGCAAAGC (R)
126bp
Vesicular monoamine transporter 2 (VMAT2)
TCCTTCTGCTGGTGGTGCTATTGCA (F) GGGATGGATGGTATGACTAAGACAG (R)
337bp
Caudal-type homeobox protein 2 (CDX2)
AGTGAAAACCAGGACGAAAGACAAA (F) CACTGAGGCTTGCAGGGAAGACAC (R)
337bp
Protein gene product 9.5 (PGP9.5) CTATGAACTTGATGGACGAATGCC (F) TACAGACAGAAACCAAAGTAGCCA (R)
443bp
Apoptosis inhibitor 4 (Survivin) AACCCTTGGTGAATTTTTGAAACTG (F) AAGCAGCCACTGTTACCAGCAGCA (R)
363bp
Somatostatin receptor 1 (SSTR1) q AGTTGGTCTGCGCGAAGATC (F) q CGCGTCAGCAGCAAAGTG (R) q
105bp
Somatostatin receptor 2 (SSTR2) q TCAACGTTTCTTCCGTCTCCAT (F) q GAGGACCACCACAAAGTCAAACA (R) q
77bp
Somatostatin receptor 3 (SSTR3) q TCTACGTGCTCAACATCGTCAA (F) q TGGCACAGCTGTTGGCATAG (R) q
108bp
Somatostatin receptor 5 (SSTR5) q CATCCTCTCCTACGCCAACAG (F) q TGGAAGCTCTGGCGGAAGT (R) q
78bp
β-actin q CGAGAAGATGACCCAGATCATG (F) q ACAGCCTGGATAGCAACGTACA (R) q
66bp
q: oligonucleotide primers used for SYBR Green Q-RT-PCR F: forward primer; R: reverse primer
14
Quantitative Real-time Polymerase Chain Reaction (Q-RT-PCR) We performed Q-RT-PCR by using Bio-Rad iCycler & iQ Real-Time PCR Systems (Biorad) to investigate somatostatin receptor 1, 2, 3, 5 expression on CNDT2.5, HC45, BON and QGP1 cells. The PCR reactions were carried out as triplicate experimental samples by using iQ SYBR Green Supermix (Biorad) for 40 cycles according to the manufactures’ instructions. Primers were used as described in Table 5. We used 100ng of cDNA for all the samples. Quantitative values were obtained from the threshold cycle number (Ct) and analyzed by using the iCycler analysis software (Biorad). Furthermore, the expression of CHGA was also analyzed on CNDT2.5, KRJ1 and BON by Q-RT-PCR by using Applied Biosystems 7500 Real-Time PCR Systems (Applied Biosystems) for 50 cycles of amplification, and primers are described in Table 5. Power SYBR Green Supermix was used and Ct values were obtained and evaluated by using SDS v1.3 Software (Applied Biosystem). All expression fold changes were calculated and plotted in relation to average expression of the normalization gene β-actin in corresponding cell lines by using the 2-ΔΔCt method [36]. Protein Extraction and Quantification Proteins from each cell line were extracted by using RIPA cell lysis buffer (10mM Tris-HCl, pH 7.5, 150 mM NaCl, 1mM EDTA, 1% Triton X-100, 0.5% Deoxycholic acid, 0.1% SDS, 1mM Pefabloc SC (Roche) and 1 complete mini tablet (Roche) ). Cells were allowed to grow up to 1x10⁷ in a 10 cm culture dish (approximately 80-90% confluent). After washing cells with phosphate buffer saline (PBS, PH7.2), 500μl or 1ml RIPA buffer was added on the culture dish on ice for 10 minutes. Next, disrupted cells in RIPA buffer were collected into eppendorf tubes by using cell scrapers and incubated on an end-over-end for about 30 minutes at 4°C. Cell lysates were transferred to a fresh tube after spinning at 13000 rpm and 4°C for 10 minutes and stored at -20°C. Furthermore, we performed quantification of protein concentrations by Bradford assay by using Eppendorf Spectrophotometer (Eppendorf), and bovine serum albumin (BSA) was used to generate standard curves to calculate protein concentration. Western blot analysis We performed western blot analysis to analyze expressions of SSTR1, 2, 3, 5, and several neuroendocrine markers: VMAT1, CHGA, PNMA2 and secretogranin 3 (SCG3) on human NET cell lines. Protein lysates were mixed with appropriate amount of 4x SDS sample buffer with 2-mercaptoethanol (2-ME) and denatured at 95°C for 5 minutes. 25μg of proteins and protein ladders (Invitrogen and Biorad) were then loaded on 10% or 8% Tris-HCl sodium dodecyl sulfate polyacrylamide gel electrophoresis (SDS-PAGE) gels, and gels were run in 1x Tris-HCl running buffer at 100V. SDS-PAGE separated the proteins which were transferred onto 0.45μm nitrocellulose membranes (Biorad) in 1x blotting buffer containing fresh methanol, at 4°C, 100V for 2 hours. Transferred proteins on membranes were verified by Ponceau S rapid staining solution, washed with neutral Tris-bufferred saline (TBS) and blocked with TBS containing BM blocking buffer (Roche) at 4°C O.N. Primary antibodies were diluted in TBS with BM (blocking reagent) and sodium azide as follows, rabbit polyclonal anti-SSTR1 1: 2000 (Santa Cruz), rabbit polyclonal anti-SSTR2 1:2000 (affinity bioreagents), rabbit polyclonal anti-SSTR3 1:2000 and rabbit anti-SSTR5 1:1000 (generous
15
gifts from Dr. Frank Leu, Verto Institute LLC, Neuroendocrine Tumor Research, The Cancer Institute of New Jersey), rabbit polyclonal anti-VMAT1 1:500 (Santacruz), mouse monoclonal anti-CHGA 1:20000 (Dako, Denmark), rabbit polyclonal anti-PNMA2 1:500 and rabbit polyclonal anti-SCG3 1:500 (Atlas Antibodies, Stockholm, Sweden). The membranes were incubated either at R.T. for 1-3h or at 4°C over night, followed by 4 times of washing by using TBS containing 0.1% Tween-20. Then the secondary antibody (1:10000, POD labeled anti-mouse/anti-rabbit, Roche) diluted in TBS with BM were added and incubated at R.T for 30 minutes. Then after washing 4 times again, membranes were either incubated by using BM Chemiluminescence Blotting Substrate (Roche) and detected by using film developing systems in the darkroom, or incubated with Lumi-Light Western Blotting Substrate (Roche) and detected by Biorad Chemidox XRS detection system (Biorad) and evaluated by using Quantity One analysis software. Furthermore, goat polyclonal β-actin antibody (1:1000, Santa Cruz) was used to verify equal protein loading of the samples, and HRP-conjugated donkey anti-goat polyclonal antibody (1:5000, Santa cruz) was used as secondary antibody. We also performed western blot analysis to check the quality of anti-SERPINA10 antibodies, to confirm the presence of SERPINA10 in plasma, and to check eventual difference between Serpin A10 concentratioon of plasma from NET patients and normal healthy donors. We used the protocol described above, and we used 50μg/well of non-diluted plasma. Rabbit polyclonal anti-SERPINA10 (1:1000, Proteintech Group, USA) was used as primary antibody. Blood Samples Plasma and sera were collected at the Biobank in Akademiska Sjukhuset, Uppsala, as blood samples of 56 patients suffering from midgut neuroendocrine tumors at different stages of disease. Furthermore, normal blood plasma from 2 healthy donors and normal blood sera from 23 healthy donors were also collected. The collection of samples was approved by the Swedish national ethical committee. Three groups of patients’ samples were taken into account: 1) blood samples from Group I, patients who had primary tumor at the time of blood collection, and also samples after 6 months from radical surgery; 2) samples from Group II, patients who had lymph node metastasis at the time of blood collection, and also samples after 6 months of treatment; 3) samples from Group III, patients who had liver metastasis at the time of blood collection, and also samples after 6 months of treatment. Collected plasma samples were prepared for quantification of SERPINA10 antigen, while collected sera samples were prepared for quantification of PNMA2 autoantibody. Sandwich ELISA We aimed at establishing a sandwich ELISA to screen SERPINA10 antigen in plasma of midgut NET patients. 8-well Maxisorp strips used for optimization and establishment of sandwich ELISA were purchased from Nunc, Denmark. SERPINA10 recombinant protein and mouse anti-SERPINA10 monoclonal antibody were purchased from Abnova, Taiwan. Rabbit and Goat anti-SERPINA10 polyclonal antibody was purchased from Proteintech Group, USA and Novus Biologicals, USA, respectively. Absorbance was read by Multiskan RC microplates photometer (Thermo Scienticfic) by using Deltasoft (Deltasoft Inc., USA).
16
Indirect ELISA An indirect ELISA was set up to screen PNMA2 autoantibody levels in sera from midgut NET patients and normal healthy donors. Briefly, Maxisorp strips (Nunc, Denmark) were coated with 50μl/well 1μg/ml PNMA2 recombinant protein (Abnova, Taiwan) diluted in the coating buffer (15 mM Na2CO3, 35 mM NaHCO3, PH 9.6) at 4°C O.N. Unbound antigens were washed 3 times with washing buffer (PBS, PH 7.2, containing 0.05% Tween-20) at R.T. and blocked with 150μl/well blocking buffer (PBS, PH 7.2, containing 0.05% Tween-20 and 5%BSA) at R.T. for 2 hours. Then all plasma samples were diluted 1:200 in the dilution buffer (PBS, PH 7.2, containing 0.05% Tween-20 and 1%BSA) and were added 50μl/well into appropriate wells. Serial dilution (1:50, 1:100, 1:200, 1:400, 1:800, 1:1600, 1:3200) of We also used No.4 sera from Group I patients as PNMA2 autoantibody positive reference sera to construct a standard curve. All samples and standards were performed in duplicate, and after incubation of sera at R.T. for 2 hours, unbound antibodies and other components in diluted sera solutions were washed away 6 times with washing buffer. HRP-conjugated rabbit anti human IgG (1:1000, Dako) was then added 50μl/well to all wells, incubated at R.T. for 1 hour and strips was washed 8X by washing buffer again. TMB substrate was added 100μl/well to each well and incubated at R.T. for 30 minutes, after which reaction was stopped by using 1M H2SO4, 100μl/well. Absorbance was then read by Multiskan RC microplates photometer (Thermo Scienticfic) by using Deltasoft (Deltasoft Inc., USA) and Multiskan Ascent software (Thermo Scienticfic). No.4 sera from Group I patients was arbitrarily evaluated as 3200 arbitrary units (AU), standard curve was plotted, blank absorbance was subtracted and all absorbance read from other sera samples was calculated according standard curve.
Results
1. Profiling of Neuroendocrine Markers and Somatostatin Receptors in Several Neuroendocrine Cell lines
Screening neuroendocrine tumor markers helped us to understand the correct neuroendocrine genotype and phenotype of the four available human cell lines in our lab. Data in Table 6 illustrate that established human pancreatic cell lines BON and QGP1 express a larger number of neuroendocrine tumor markers than the current available human midgut NET cell lines CNDT2.5, HC45 and KRJ1. The main distinction is on the most used NET marker chromogranin A. Q-RT-PCR and western blot analysis were performed to verify the presence of chromogranin A. Q-RT-PCR analysis shows that expression of CHGA is much higher on BON, but far less on CNDT2.5 and even less on KRJ1 (Fig.2). Western blot analysis detected CHGA protein on BON, but only faint bands on CNDT2.5 and KRJ1, indicating either nonspecific detection, or far less CHGA protein on CNDT2.5 and KRJ1 (Fig.3). Differences in expression were also found for other NET markers as reported in Table 6. Lower expression of IA2 was found on CNDT2.5, compared to BON and QGP1; far less
17
expression of VMAT1 was detected on CNDT2.5, HC45 and KRJ1; neither PGP9.5 nor VMAT2 were detectable on CNDT2.5 and HC45 by RT-PCR, compared to KRJ1, BON and QGP1. VMAT1Δ15 was also detected on ileal NET cell lines, and it was more expressed compared to VMAT1. The expression of VMAT and VMAT1Δ15 were differently regulated on BON and QGP1 where VMAT1 was more expressed than VMAT1Δ15. Pivotal markers such as synaptophysin (SYN) and Tryptophan hydroxylase 1 (TPH1) are clearly expressed in all ileal NET cell lines. However, BON and QGP1 show higher expression of these markers. Expression of protein gene product 9.5 (PGP9.5) was however detected only on KRJ1, BON and QGP1. NET markers VMAT1 and SCG3, and a novel potential NET marker PNMA2 were investigated by western blot on BON, CNDT2.5 and QGP1 cells (Fig.3). VMAT1 protein was detected on BON, CNDT2.5 and QGP1 cells, while PNMA2 and SCG3 were not detected on CNDT2.5 (Fig.4). Somatostatin receptors (SSTRs) were investigated by RT-PCR. SSTR1, 2, 3 and 5 were detected in all screened cell lines with different expression profiles. However, all cell lines except KRJ1 were also examined by Q-RT-PCR and western blot. Q-RT-PCR results (Fig.5) show that CNDT2.5, HC45 and QGP1 express higher amount of SSTR2, compared to either SSTR5 or SSTR3. BON mainly expresses SSTR5, and less SSTR2, SSTR1 and SSTR3. Furthermore, western blot analysis shows no significant difference of expression of SSTR1, 2, 3 or 5 on all cell lines (Fig.6).
2. Quantification of plasma SERPINA10 antigen Sandwich ELISA The goal to establish a sandwich ELISA for plasma SERPINA10 antigen screening has not been achieved yet. We were not able to identify specific commercially available monoclonal antibodies against SERPINA10 to complete our sandwich ELISA. After testing some of the available polyclonal antibodies (rabbit polyclonal anti-SERPINA10, Protechtech Group, USA, and goat polyclonal anti-SERPINA10, Novus Biologicals, USA), very high background absorbance was generated. We are still investigating which antibodies may be used for further analyses. Western blot We performed western blot analysis to check the quality of rabbit polyclonal antibody (Protechtech Group, USA), to confirm the presence of SERPINA10 on collected plasma samples, and try to investigate any difference in expression between plasma from normal healthy donors and plasma from midgut NET patients at different stages of disease. Fig.7 shows that the rabbit anti-SERPINA10 polyclonal antibody (Proteintech Group, USA) works specifically to detect SERPINA10 antigen in the circulation, as an approximately 50KD protein on the blot. This preliminary analysis did not detect a clear difference in concentration of SERPINA10 of normal healthy donors’ plasma compared to patients’ plasma. 3. Quantification of sera PNMA2 autoantibody Paraneoplastic antigen Ma2 (PNMA2) autoantibody levels in normal healthy sera and sera collected from midgut NET patients at different disease stages were screened by indirect

18
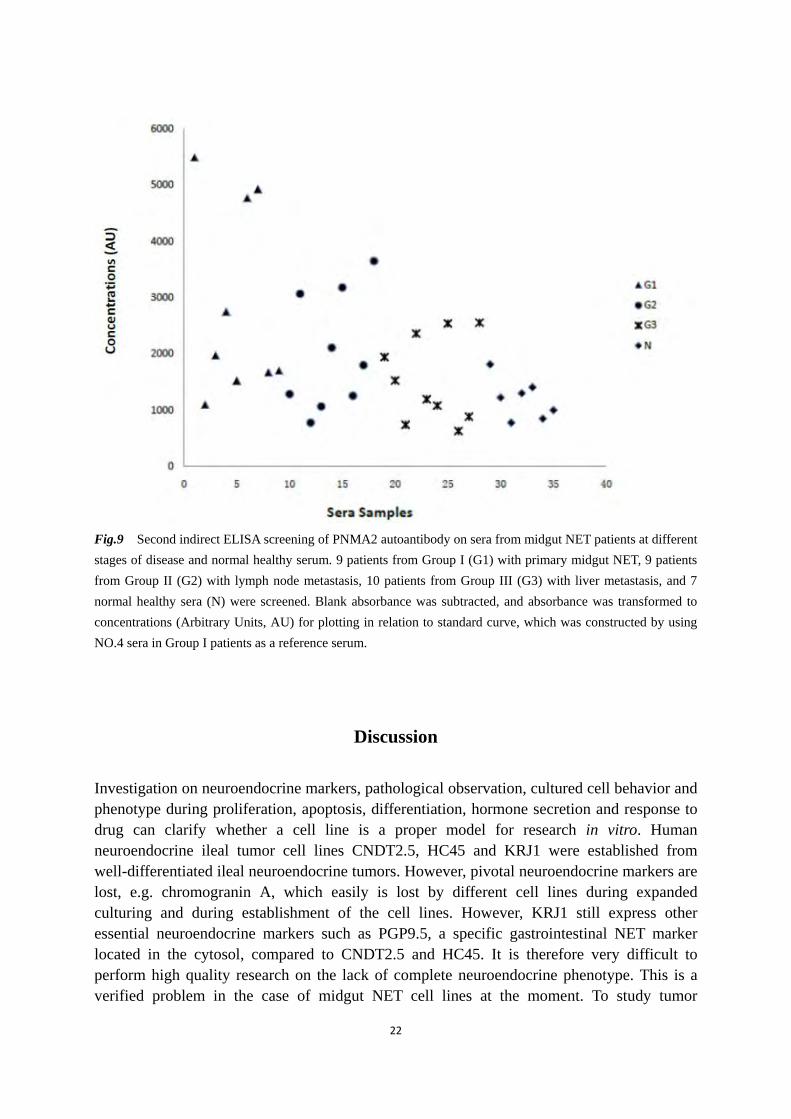
ELISA. Fig.8 and Fig.9 show the screening result of a variety of samples. Fig.8 shows a decreasing trend of the PNMA2 autoantibody levels from the sera of patients at the stage of primary midgut NETs to more severe disease, and back to the sera of the normal healthy donor. Fig. 9 illustrates that the PNMA2 autoantibody levels are different between the majority of investigated patients and the investigated normal healthy donors. Table 6 Summary of expression profiles of NET markers and SSTRs in studied cell lines by RT-PCR.
CNDT2.5 HC45 KRJ1 BON QGP1
CGA - - - +++ +++ TPH ++ ++ ++ +++ +++ SYN ++ ++ ++ +++ +++ IA2 ++ ND ND +++ +++
VMAT1 + + + +++ +++ VMAT1Δ15* ++ ++ ++ +++ ++
VMAT2 - - ND +++ ++ CDX2 +++ ND ND +++ +++ PGP9.5 - - ++ ++ ++ Survivin +++ ND +++ +++ +++ SSTR1 + ++ + ++ + SSTR2 +++ +++ +++ +++ +++ SSTR3 ++ ++ + +++ ++ SSTR5 + ++ + +++ +++
ND: not done; - no expression, + low expression, ++ moderate expression, +++ high expression * an alternatively spliced form of VMAT1. Primers used in the analysis are shown in Table 5.
Fig.2 Relative expression of chromogranin A (CHGA) on 3 human neuroendocrine tumor cell lines. CNDT2.5, KRJ1 and BON were screened Q-RT-PCR. The expression fold change was calculated and plotted by using log2 transformation in relation to the average expression of β-actin gene in corresponding cell lines by using the 2-ΔΔCt method [36]. Primers used in the analysis are shown in Table 5.
19
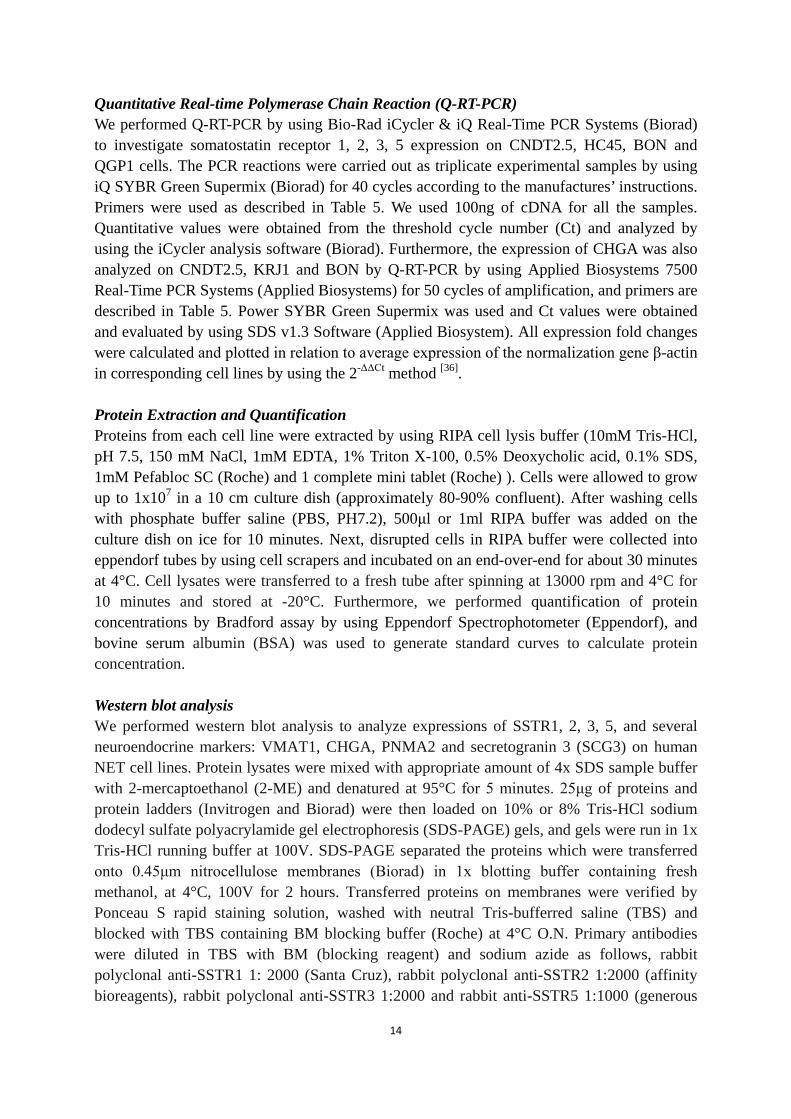
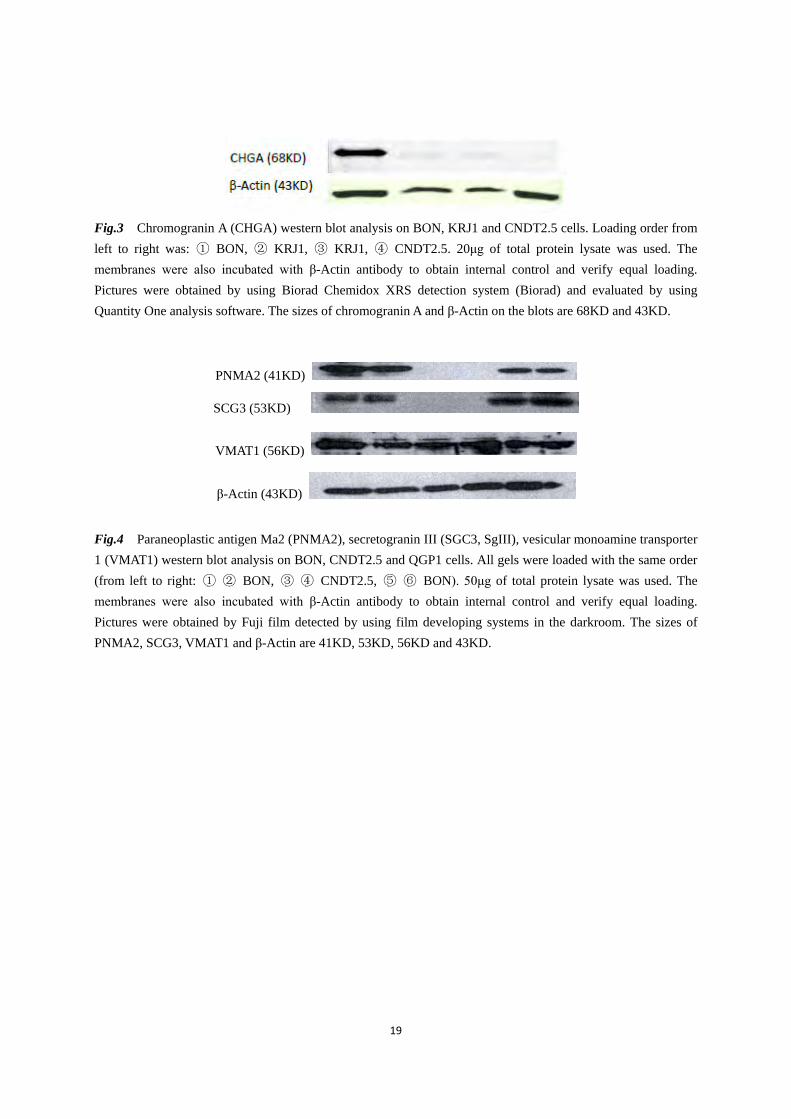
Fig.3 Chromogranin A (CHGA) western blot analysis on BON, KRJ1 and CNDT2.5 cells. Loading order from left to right was: ① BON, ② KRJ1, ③ KRJ1, ④ CNDT2.5. 20μg of total protein lysate was used. The membranes were also incubated with β-Actin antibody to obtain internal control and verify equal loading. Pictures were obtained by using Biorad Chemidox XRS detection system (Biorad) and evaluated by using Quantity One analysis software. The sizes of chromogranin A and β-Actin on the blots are 68KD and 43KD.
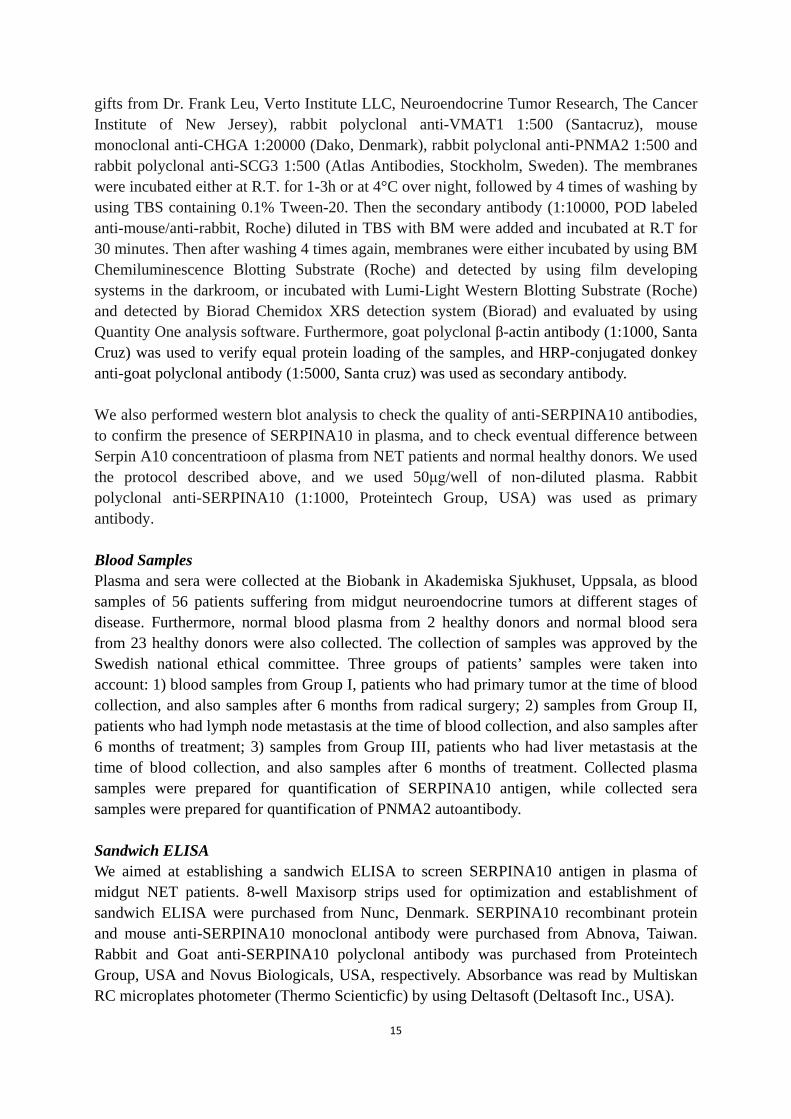
PNMA2 (41KD)
SCG3 (53KD)
VMAT1 (56KD)
β-Actin (43KD)
Fig.4 Paraneoplastic antigen Ma2 (PNMA2), secretogranin III (SGC3, SgIII), vesicular monoamine transporter 1 (VMAT1) western blot analysis on BON, CNDT2.5 and QGP1 cells. All gels were loaded with the same order (from left to right: ① ② BON, ③ ④ CNDT2.5, ⑤ ⑥ BON). 50μg of total protein lysate was used. The membranes were also incubated with β-Actin antibody to obtain internal control and verify equal loading. Pictures were obtained by Fuji film detected by using film developing systems in the darkroom. The sizes of PNMA2, SCG3, VMAT1 and β-Actin are 41KD, 53KD, 56KD and 43KD.
20
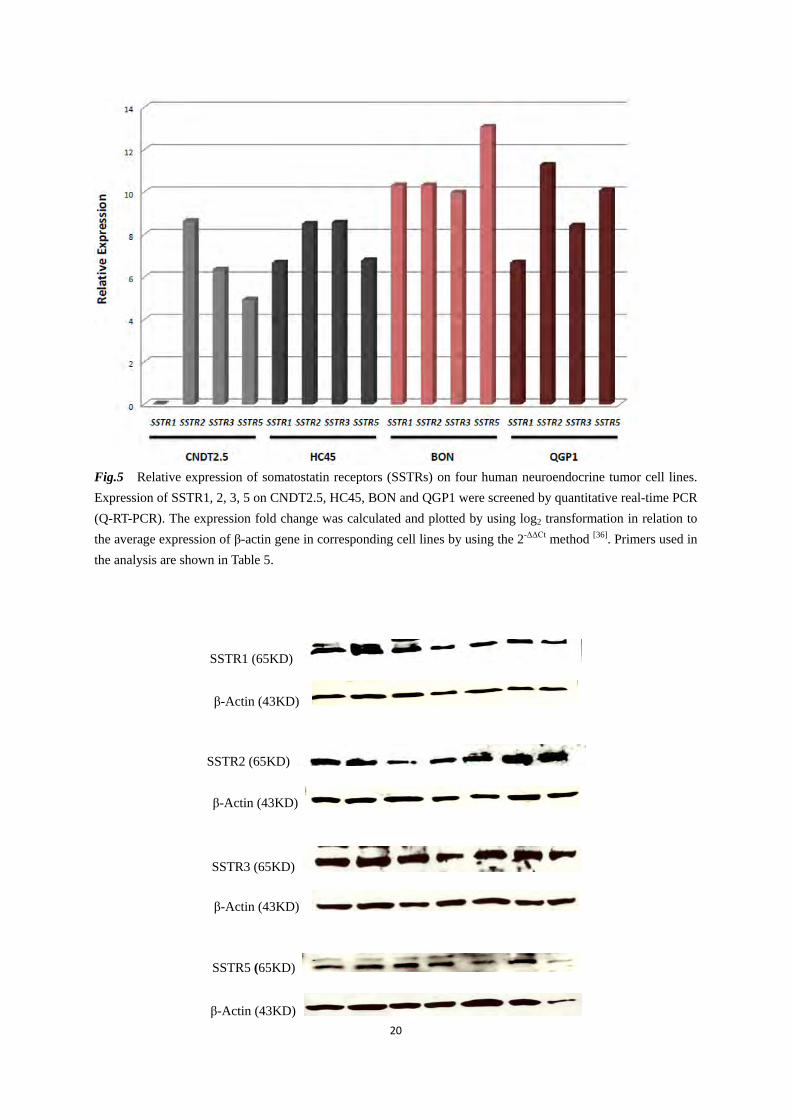
Fig.5 Relative expression of somatostatin receptors (SSTRs) on four human neuroendocrine tumor cell lines. Expression of SSTR1, 2, 3, 5 on CNDT2.5, HC45, BON and QGP1 were screened by quantitative real-time PCR (Q-RT-PCR). The expression fold change was calculated and plotted by using log2 transformation in relation to the average expression of β-actin gene in corresponding cell lines by using the 2-ΔΔCt method [36]. Primers used in the analysis are shown in Table 5.
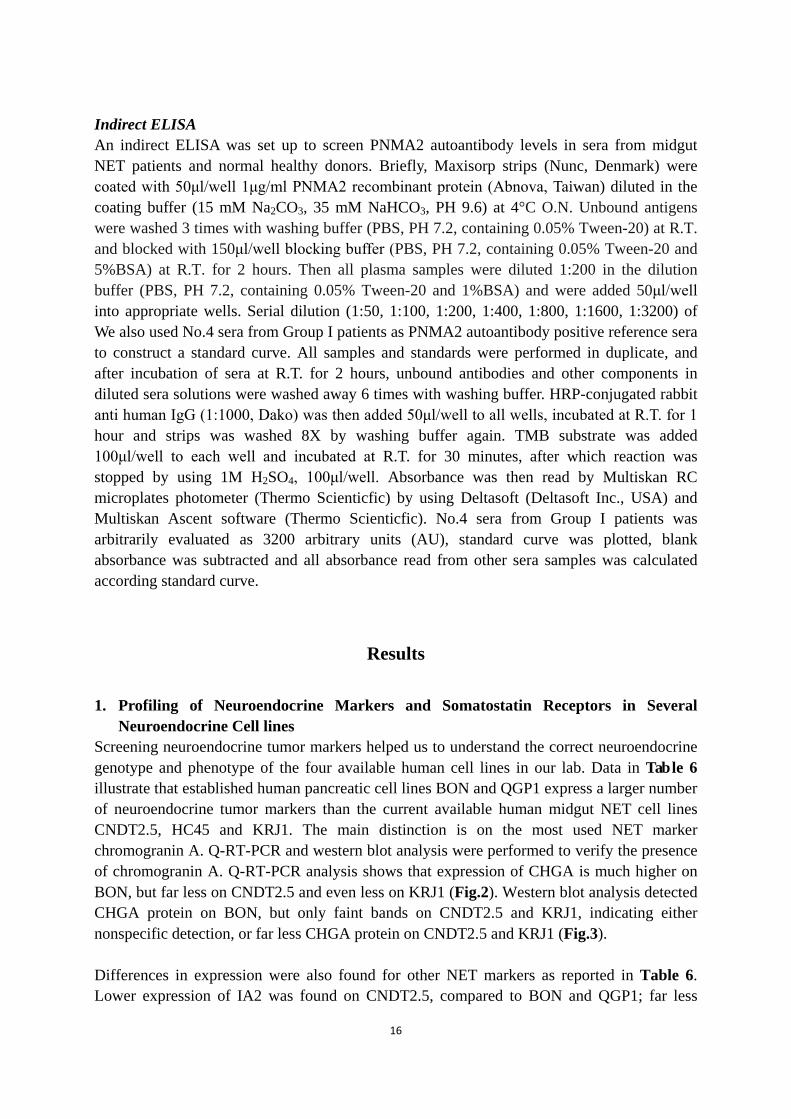
SSTR1 (65KD)
β-Actin (43KD)
SSTR2 (65KD)
β-Actin (43KD)
SSTR3 (65KD)
β-Actin (43KD)
SSTR5 (65KD)
β-Actin (43KD)

21
Fig.6 Somatostatin receptors analysis on neuroendocrine tumor cell lines by using western blot analysis. All blots have the same loading order (from left to right: ① CNDT2.5 wild type, ② CNDT2.5 wild type, ③ CNDT2.5 + 1μM octreotide long treatment, ④ CNDT2.5 + 1μM octreotide long treatment, ⑤ HC45, ⑥ BON, ⑦ QGP1). Protein lysates from CNDT2.5 wild type and CNDT2.5 under 1μM octreotide long treatment were loaded in duplicate. 25μg of total protein lysate was used. The membranes were also incubated with β-Actin antibody to obtain internal control and verify equal loading. Pictures were obtained by using Biorad Chemidox XRS detection system (Biorad) and evaluated by using Quantity One analysis software. The sizes of SSTR1, 2, 3, 5 on the blots are 65KD and β-Actin 43KD.
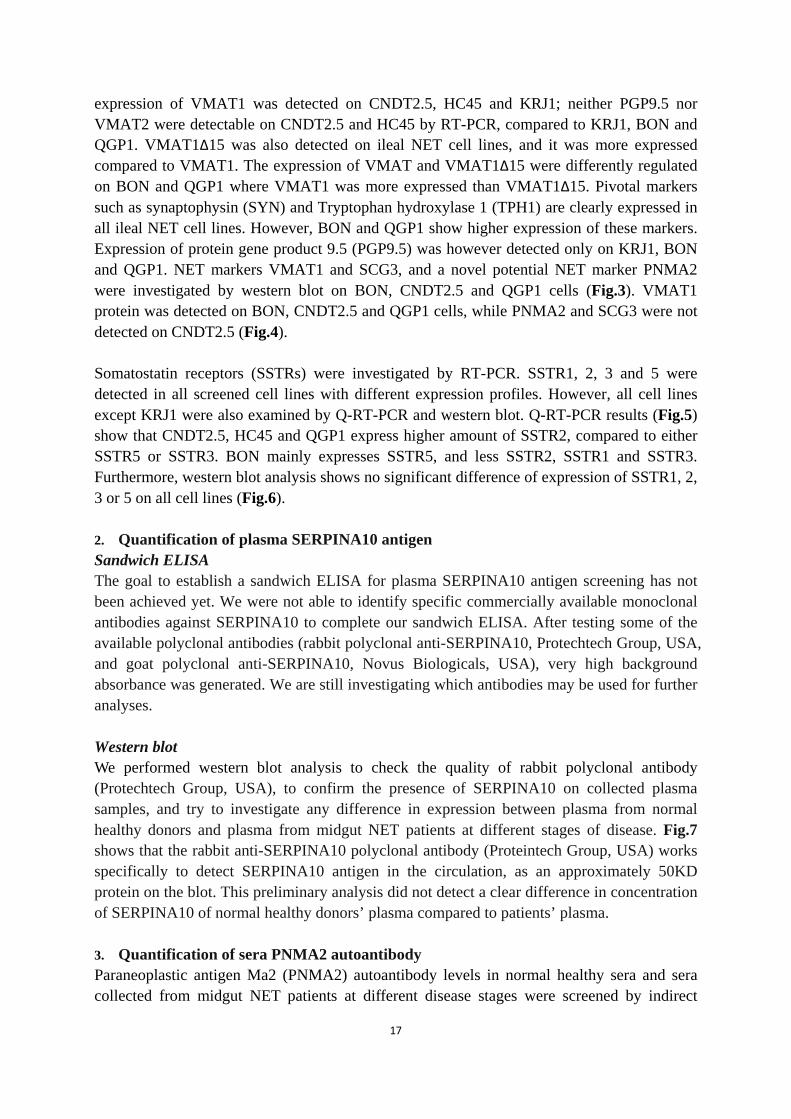
SERPINA10 (~ 50KD)
Fig.7 Western blot analysis of SERPINA10 on plasma from normal healthy donors and midgut NET patients at different stages of disease. From left to right: 2 normal healthy plasma, 2 plasma from patients with primary midgut NET, 2 plasma from midgut NET patients with lymph node metastasis and 3 plasma from midgut NET patients with liver metastasis. Plasma was loaded as 50μg in each well.
Fig.8 First indirect ELISA screening of PNMA2 autoantibody on sera from midgut NET patients at different stages of disease and normal healthy serum. 9 patients from Group I (G1) with primary midgut NET, 9 patients from Group II (G2) with lymph node metastasis, 10 patients from Group III (G3) with liver metastasis, and one normal healthy serum (N) was screened. Blank absorbance was subtracted before plotting.
22
Fig.9 Second indirect ELISA screening of PNMA2 autoantibody on sera from midgut NET patients at different stages of disease and normal healthy serum. 9 patients from Group I (G1) with primary midgut NET, 9 patients from Group II (G2) with lymph node metastasis, 10 patients from Group III (G3) with liver metastasis, and 7 normal healthy sera (N) were screened. Blank absorbance was subtracted, and absorbance was transformed to concentrations (Arbitrary Units, AU) for plotting in relation to standard curve, which was constructed by using NO.4 sera in Group I patients as a reference serum.
Discussion Investigation on neuroendocrine markers, pathological observation, cultured cell behavior and phenotype during proliferation, apoptosis, differentiation, hormone secretion and response to drug can clarify whether a cell line is a proper model for research in vitro. Human neuroendocrine ileal tumor cell lines CNDT2.5, HC45 and KRJ1 were established from well-differentiated ileal neuroendocrine tumors. However, pivotal neuroendocrine markers are lost, e.g. chromogranin A, which easily is lost by different cell lines during expanded culturing and during establishment of the cell lines. However, KRJ1 still express other essential neuroendocrine markers such as PGP9.5, a specific gastrointestinal NET marker located in the cytosol, compared to CNDT2.5 and HC45. It is therefore very difficult to perform high quality research on the lack of complete neuroendocrine phenotype. This is a verified problem in the case of midgut NET cell lines at the moment. To study tumor

23
progression, drug resistance mechanism, and signaling pathways on midgut NET cells, it is important to study KRJ1, CNDT2.5 and other cell lines to create the proper in vitro system acquiring knowledge and minimizing the pending problems. However, somatostatin receptor profiles of these cell lines demonstrate the possibility to use different somatostatin analogues to study possible molecular mechanisms of their effects. Different concentration levels of SERPINA10 antigen between patient plasma and normal plasma from healthy donors can’t be detected by sandwich ELISA yet. We were not able to set up a functional ELISA due to the absence of proper commercial antibodies. We are therefore still evaluating the use of novel antibodies. At the moment, the accessible method to screen plasma SERPINA10 on protein level is to use western blot analysis. However, western blot analysis is not an ideal method for this analysis. The lack of sensitivity of this technique and the absence of absolute quantification represent severe limits. To set up a sandwich ELISA is therefore a main choice for our investigation. Furthermore, we aim at setting up a more reliable indirect ELISA to screen sera PNMA2 autoantibody levels in order to obtain more reliable data with smaller deviation. We should be able to screen more samples before drawing some conclusive remarks. However, this novel method is very promising and will be further optimized.
Acknowledgement
Thanks to my supervisor Dr. Valeria Giandomenico for her sincere supervision, cultivation, encouragement and warmhearted life assistance. Thanks to Dr. Graciela Elgue for her excellent technical assistance. Thanks to Prof. Kjell Öberg for his kind support on my way to the cancer molecular biology research. Thanks to Suchen Li, Åsa Forsberg and all the students and colleagues at the Medical Science Faculty, Endocrine Oncology Department, Uppsala Hospital/Uppsala University, as well as Prof. Magnus Essand, Berith Nilsson, Di Yu and all the friends at the Clinical Immunology Department, Uppsala University, for their sincere technical and life assistance. Last and not least, also thanks to my parents and girl friend for their long-term back-up on my career.
24
References
1. Liao DH, Zhao JB, Gregersen H (2009). Gastrointestinal tract modelling in health and disease. World J
Gastroenterol. 2009 Jan 14; 12(2):169-76. 2. Root DE. When you remove drug residues from your body, your physical cravings stop [WWW document].
URL www.drug-detox-center.com/detox_process.html. Date visited 2009-05-15. 3. Modlin IM, Oberg K, et al (2008). Gastroenteropancreatic neuroendocrine tumours. Lancet Oncol. 2008 Jan;
9(1):61-72. 4. Modlin IM, Moss SF, Chung DC, Jensen RT, Snyderwine (2008). Priorities for improving the management
of gastroenteropancreatic neuroendocrine tumors. J Natl Cancer Inst 2008; 100: 1282-1289. 5. R. Arnold (2005). Introduction: Definition, historical aspects, classification, staging, prognosis and
therapeutic options. Best Practice & Research Clinical Gastroenterology. Vol. 19, No. 4, pp. 491–505, 2005 6. Solcia E, Kloppel G, Sobin L (2000). Histological typing of endocrine tumours. In: Verlag S, editor. World
Health Organization histological classification of tumours, 2nd ed. Berlin, Heidelberg, New York, Geneva: Springer; 2000. pp. 38–74.
7. G. Rindi, G. Klöppel, A. Couvelard et al (2007). TNM staging of midgut and hindgut (neuro) endocrine tumors: a consensus proposal including a grading system. Virchows Arch (2007) 451:757–762.
8. Sobin LH,Wittekind C (ed) (2002) TNMClassification ofmalignant tumours. Wiley-Liss, New York 9. Kjell Öberg (2009). Genetics and molecular pathology of neuroendocrinegastrointestinal and pancreatic
tumors (gastroenteropancreatic neuroendocrine tumors). Current Opinion in Endocrinology, Diabetes & Obesity 2009, 16:72–78.
10. Durán-Prado M, Malagón MM, Gracia-Navarro F, Castaño JP (2008). Dimerization of G protein-coupled receptors: new avenues for somatostatin receptor signalling, control and functioning. Mol Cell Endocrinol. 2008 May 14; 286(1-2):63-8. Epub 2007 Dec 23.
11. Grozinsky-Glasberg S, Shimon L, Korbonits M and Grossman AB (2008). Somatostatin analogues in the control of neuroendocrine tumors: efficacy and mechanisms. Endocrine-Related Cancer (2008) 15 701-720.
12. Guillermet-Guibert J, Lahlou H, Pyronnet S, Bousquet C, and Susini C (2005). Somatostatin receptors as tools for diagnosis and therapy: molecular aspects. Best Practice & Research Clinical Gastroenterology 2005; 19 535-551.
13. Reubi JC, Waser B (2003). Concomitant expression of several peptide receptors in neuroendocrine tumors: molecular basis for in vivo multireceptor tumor targeting. Eur J Nucl Med Mol Imaging 2003; 30:781-793.
14. Kulaksiz H, Eissele R, Rossler D, Schulz S, Hollt V, Cetin Y, Arnold R (2002). Identification of somatostatin receptor subtypes 1, 2A, 3, and 5 in neuroendocrine tumors with subtype specific antibodies. Gut 2002; 50:52-60.
15. Irvin M. Modlin, Kjell Öberg et al. A Century of Advances in Neuroendocrine Tumor Biology and Treatment. Published by Felsenstein. 2007 ISBN 978-3-00-023638-9.
16. Parekh D, Ishizuka J, Townsend CM Jr, et al (1994). Characterization of a human pancreatic carcinoid in vitro: morphology, amine and peptide storage, and secretion. Pancreas 1994; 9: 83–90.
17. Van Buren G 2nd, Rashid A, Yang AD, Abdalla EK, Gray MJ, Liu W, Somcio R, Fan F, Camp ER, Yao JC, Ellis LM (2007). The Development and Characterization of a Human Midgut Carcinoid Cell Line. Clin Cancer Res 2007 Aug 15; 13(16):4704-12.
18. Stilling GA, Zhang H, Ruebel KH, Leontovich AA, Jin L, Tanizaki Y, Zhang S, Erickson LA, Hobday T, Lloyd RV (2007). Characterization of the functional and growth properties of cell lines established from
25
ileal and rectal carcinoid tumors. Endocr Pathol. 2007 Winter; 18(4):223-32. 19. Irvin M. Modlin, Mark Kidd, Roswitha Pfragner, Geeta N. Eick, and Manish C (2006). Champaneria. The
Functional Characterization of Normal and Neoplastic Human Enterochromaffin Cells. J Clin Endocrinol Metab. 2006 Jun; 91(6):2340-8. Epub 2006 Mar 14.
20. Rindi G, Bordi C (2005). Endocrine tumours of the gastrointestinal tract: aetiology, molecular pathogenesis and genetics. Best Pract Res Clin Gastroenterol 2005; 19:519–534.
21. Kölby L, Bernhardt P, Swärd C, Johanson V, Ahlman H, Forssell-Aronsson E, Stridsberg M, Wängberg B, Nilsson O (2004). Chromogranin A as a determinant of midgut carcinoid tumour volume. Regul Pept. 2004 Aug 15; 120(1-3):269-73.
22. Leja J, Essaghir A, Essand M, Wester K, Oberg K, Tötterman TH, Lloyd R, Vasmatzis G, Demoulin JB, Giandomenico V (2009). Novel markers for enterochromaffin cells and gastrointestinal neuroendocrine carcinomas. Mod Pathol. 2009 Feb; 22(2):261-72. Epub 2008 Oct 24.
23. Corral J, González-Conejero R, Hernández-Espinosa D, Vicente V (2007). Protein Z/Z-dependent protease inhibitor (PZ/ZPI) anticoagulant system and thrombosis. Br J Haematol. 2007 Apr; 137(2):99-108. Review.
24. Han, X., Fiehler, R. & Broze, Jr, G.J (1998). Isolation of a protein Z-dependent plasma protease inhibitor. Proceedings of the National Academy of Sciences of the United States of America, 95, 9250–9255.
25. Capurso G, Lattimore S, Crnogorac-Jurcevic T, Panzuto F, Milione M, Bhakta V, Campanini N, Swift SM, Bordi C, Delle Fave G, Lemoine NR (2006). Gene expression profiles of progressive pancreatic endocrine tumours and their liver metastases reveal potential novel markers and therapeutic targets. Endocr Relat Cancer. 2006 Jun; 13(2):541-58.
26. Bernacka K, Kuryliszyn-Moskal A & Sierakowski S (1998). The levels of alpha 1-antitrypsin and alpha 1-antichymotrypsin in the sera of patients with gastrointestinal cancers during diagnosis. Cancer 15 1188_1193.
27. Monstad SE, Knudsen A, Salvesen HB, Aarseth JH, Vedeler CA (2009). Onconeural antibodies in sera from patients with various types of tumors. Cancer Immunol Immunother. 2009 Mar 18. [Epub ahead of print]
28. Stich O, Jarius S, Kleer B, Rasiah C, Voltz R, Rauer S (2007). Specific antibody index in cerebrospinal fluid from patients with central and peripheral paraneoplastic neurological syndromes. Journal of Neuroimmunology. 183 (2007) 220-224.
29. Stich O, Kleer B and Rauer S (2007). Absence of paraneoplastic antibneuronal antibodies in sera of 145 patients with motor neuron disease. J. Neurol. Neurosurg Psychiatry. 2007; 78: 883-885.
30. Hoffmann LA, Jarius S, Pellkofer HL, Schueller M, Krumbholz M, Koenig F, Johannis W, la Fougere C, Newman T, Vicent A and Voltz R (2008). Anti-Ma and anti-Ta associated paraneoplastic neurological syndromes: 22 newly diagnosed patients and review of previous cases. J Neurol Neurosurg Psychiatry. 2008 Jul; 79(7):767-73. Epub 2008 Jan 25. Review.
31. Kidd M, Eick GN, Modlin IM, Pfragner R, Champaneria MC, Murren J (2007). Further delineation of the continuous human neoplastic enterochromaffin cell line, KRJ-I, and the inhibitory effects of lanreotide and rapamycin. J Mol Endocrinol. 2007 Feb; 38(1-2):181-92.
32. Detjen KM, Welzel M, Farwig K, Brembeck FH, Kaiser A, Riecken EO, Wiedenmann B, Rosewicz S (2000). Molecular mechanism of interferon alfa-mediated growth inhibition in human neuroendocrine tumor cells. Gastroenterology. 2000 Apr; 118(4):735-48.
33. Essand M, Vikman S, Grawé J, Gedda L, Hellberg C, Oberg K, Totterman TH, Giandomenico V (2005). Identification and characterization of a novel splicing variant of vesicular monoamine transporter 1. J Mol Endocrinol. 2005 Dec; 35(3):489-501.

26
34. Vikman S, Essand M, Cunningham JL, de la Torre M, Oberg K, Tötterman TH, Giandomenico V (2005). Gene expression in midgut carcinoid tumors: potential targets for immunotherapy. Acta Oncol. 2005; 44(1):32-40.
35. Leja J, Dzojic H, Gustafson E, Oberg K, Giandomenico V, Essand M. A novel chromogranin-A promoter-driven oncolytic adenovirus for midgut carcinoid therapy. Clin Cancer Res. 2007 Apr 15; 13(8):2455-62.
36. Livak KJ, Schmittgen TD (2001). Analysis of relative gene expression data using real-time quantitative PCR and the 2(-Delta Delta C (T)) method. Methods 2001; 25:402–408.