Embed Size (px)
Citation preview

International Journal of Scientific Research and Engineering Development-– Volume 3 - Issue 4, July - Aug 2020
Available at www.ijsred.com
ISSN : 2581-7175 ©IJSRED: All Rights are Reserved Page 1177
Study on Productivity Development Status of a Jute Mill in
West Bengal, India
Dr.Satya Narayan Bag
Principal AMS College of Polytechnic.
Rangapur, Barrackpur, 24 Pgs( N ) , West Bengal, India.
Abstract :In weaving department , strong positive significant correlation ship exist between loom efficiency and loom
production of Kgs/loom/shift. Positive correlation ship present between spinning frame efficiency and per winder
production/shift. Strong positive correlation exists between Hemming and Herackle monthly production. CV% of
Actual production/frame/shift and per winder production /shift in kgs and Actual efficiency of frame is comparatively
less in case of fine side spinning frame compare to the coarse side production. Skilled competent machine operator,
training of learners at workplace with proper guidance,, quality of yarn, etc. are important areas for improvement of
weaving efficiency. Sizing process parameters, e.g., quality of beam, steam pressure and temperature, sizing
ingredients composition are taken into consideration.
Key words :Efficiency, Correlation, Production, Weaving, Spinning
Introduction :
Agarpara jute Mills Ltd. Is a pioneer Jute Industry in West Bengal, India. Various types of Hessian, Sacking Jute Bags
,fine fabrics, Cultured yarn and fabric are manufacturing in this unit. Demand of jute products are now increasing in
domestic and international market. The unit is gradually modernized to manufacture fine good quality, fault free cloths.
As a result, Top management are installing various modern weaving and preparatory machineries to meet the
Customer’s requirement. The Management is now trying to manufacture in right time, right quality and right quantity
too. Present study is observing the productively status of finished and semi-finished products and possible measures for
future development .Statistical analysis is done based on the data obtained from day wise, monthly productivity report
of the unit for observing the relationship of efficiency ,productivity parameters in different stages of production
process.
Research Methodology:
Productivity parameters of day wise, monthly of various stages of manufacturing process are studied, collected and
analyzed for finding out the statistical relationship of production process relating to efficiency, productivity of various
departments. Based on the studied productivity status and statistical analysis, suitable corrective actions are finding out
.This analysis will give a guideline to the management to find out the present productivity status of the unit and
possible improvement criteria for future development.
Study Area :Productivity has been studied OF THE Jute Industry Agarpara Jute Mills Ltd (. AJML).Kamarhati ,
Kolkata . The unit is ISO 9001: 2015 certified organization. Round the year of 2018-19 and 2019-2020 periods
RESEARCH ARTICLE OPEN ACCESS

International Journal of Scientific Research and Engineering Development-– Volume 3 - Issue 4, July - Aug 2020
Available at www.ijsred.com
ISSN : 2581-7175 ©IJSRED: All Rights are Reserved Page 1178
production report has been collected, studied and analyzed for further development of the unit., Various departments
has been selected for study . Thereafter a study has been carried out for finding out the status of productivity of the
unit.
Literature Review:
Mahabubuzzaman A. K. M 1
,et.al., explained in their research findings that ,it is necessary to select proper flyer speed
for the production of yarn of particular linear density (tex). It was also observed that the number of breakages increased
with the increase of flyer speed. At 2900-rpm flyer speed, the yarn breakage was 0.8/ spindle-hr and at 4850 rpm the
yarn breakages is 3.5/spindle-hr. forproducing 241 tex jute yarn. Almost all jute mills of Bangladesh have been slip
draft spinning machine. Using proper flyer speed, whichwas found from the experiment, can use the machine in
production of medium count jute yarn. The produced yarn can replace the synthetic/manmade fibre in the world textile
market.
MD. Mohiuddin2
explained in his research findings that Bangladesh’s jute sector started to face a critical time since
1990s, as jute started to face increasing competitive pressure from synthetic substitutes, failure to follow modern
marketing procedure and international trade practices, lack of significant efforts and required investment towards
product development and diversification, inability to undertake the technological transformation undermined jutes
prospects as fiber. All these had adverse impact on production & marketing.
HabeeburRahman. T 3
explained in his research findings that Absenteeism is one of major human problem of Indian
textiles industries. Absenteeism is the term generally used to refer to unscheduled employee absences from the
workplace. It is a habitual pattern of absence from a duty or obligation. Absenteeism is a big barrier for any kind of
organization because its effect on organization growth. This research shows how absenteeism is a big barrier for retail
sector and how it’s give the inverse effect on organization growth and development.
Results and Discussion: Productivity has been studied in Agarpara Jute Mills Ltd, Agarpara, Kolkata. The data are
tabulated in the Table 1 and 2. From the table 1, it is found that efficiency at fine side spinning is much lower than
standard norms. The average of one month data is summarized in the table 1 and 2.Actual production in MT per day is
much lower than the target MT /day. It is due to lower efficiency % of spinning frame, higher absenteeism of skilled
labors, sliver shortage and idle spindles.
Table 1 Study of productivity status of Fine side spinning area for the month of September
2019(AJML)
Date Target
production in
MT /day
Actual
production in
MT /day
Actual
production
/frame/day in
kgs
Production
/winder
In kgs
Actual
efficiency %
Average 48.12414 39.85138 253.2414 270.3793 66.13793
Maximum
Value 54.3 44.2 262 289 69.3
Min value 28.9 23.22 245 260 63.1
SD 6.93 6.07 4.32 5.89 1.69
CV% 14.4 % 15.08% 1.7 % 2.1 % 2.55 %
International Journal of Scientific Research and Engineering Development
ISSN : 2581-7175
Source : Day wise productivity report of the mill
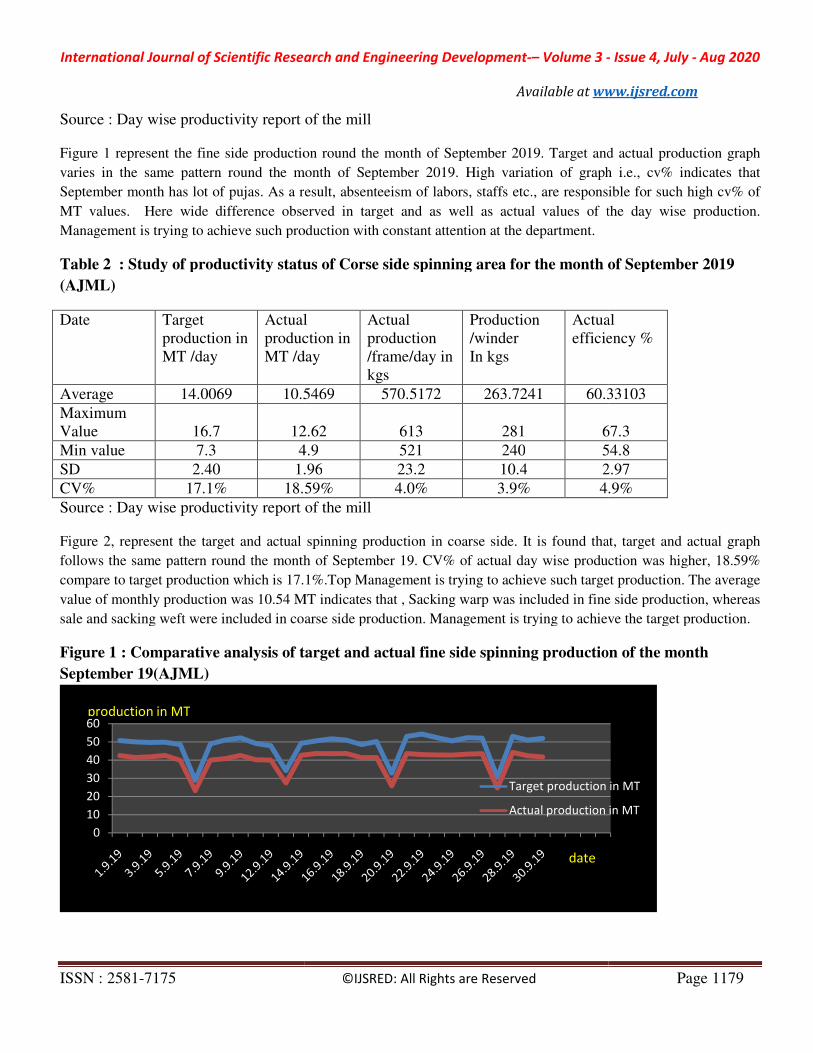
Figure 1 represent the fine side production round the month of September 2019. Target and actual production graph
varies in the same pattern round the month of September 2019. High variation of graph i.e., cv% indicates that
September month has lot of pujas. As a r
MT values. Here wide difference observed in target and as well as actual values of the day wise production.
Management is trying to achieve such production with constant atten
Table 2 : Study of productivity status of Corse side spinning area for the month of September 2019
(AJML)
Date Target
production in
MT /day
Actual
production in
MT /day
Average 14.0069 10.5469
Maximum
Value 16.7 12.62
Min value 7.3 4.9
SD 2.40 1.96
CV% 17.1% 18.59%
Source : Day wise productivity report of the mill
Figure 2, represent the target and actual spinning production in coarse side. It is found that, target and actual graph
follows the same pattern round the month of September 19. CV% of actual day wise production was higher, 18.59%
compare to target production which is 17.1%.Top Management is trying to achieve such target production. The average
value of monthly production was 10.54 MT indicates that , Sacking warp was included in fine side production, whereas
sale and sacking weft were included in coarse si
Figure 1 : Comparative analysis of target and actual fine side spinning production of the month
September 19(AJML)
0
10
20
30
40
50
60production in MT
International Journal of Scientific Research and Engineering Development-– Volume 3 -
Available at www.ijsred.com
©IJSRED: All Rights are Reserved
Source : Day wise productivity report of the mill
the fine side production round the month of September 2019. Target and actual production graph
varies in the same pattern round the month of September 2019. High variation of graph i.e., cv% indicates that
September month has lot of pujas. As a result, absenteeism of labors, staffs etc., are responsible for such high cv% of
MT values. Here wide difference observed in target and as well as actual values of the day wise production.
Management is trying to achieve such production with constant attention at the department.
: Study of productivity status of Corse side spinning area for the month of September 2019
Actual
production in
/day
Actual
production
/frame/day in
kgs
Production
/winder
In kgs
Actual
efficiency %
10.5469 570.5172 263.7241 60.33103
12.62 613 281 67.3
4.9 521 240 54.8
1.96 23.2 10.4 2.97
18.59% 4.0% 3.9% 4.9%
Source : Day wise productivity report of the mill
Figure 2, represent the target and actual spinning production in coarse side. It is found that, target and actual graph
follows the same pattern round the month of September 19. CV% of actual day wise production was higher, 18.59%
ion which is 17.1%.Top Management is trying to achieve such target production. The average
value of monthly production was 10.54 MT indicates that , Sacking warp was included in fine side production, whereas
sale and sacking weft were included in coarse side production. Management is trying to achieve the target production.
Figure 1 : Comparative analysis of target and actual fine side spinning production of the month
Target production in MT
Actual production in MT
date
- Issue 4, July - Aug 2020
www.ijsred.com
Page 1179
the fine side production round the month of September 2019. Target and actual production graph
varies in the same pattern round the month of September 2019. High variation of graph i.e., cv% indicates that
esult, absenteeism of labors, staffs etc., are responsible for such high cv% of
MT values. Here wide difference observed in target and as well as actual values of the day wise production.
: Study of productivity status of Corse side spinning area for the month of September 2019
Actual
efficiency %
60.33103
67.3
54.8
2.97
4.9%
Figure 2, represent the target and actual spinning production in coarse side. It is found that, target and actual graph
follows the same pattern round the month of September 19. CV% of actual day wise production was higher, 18.59%
ion which is 17.1%.Top Management is trying to achieve such target production. The average
value of monthly production was 10.54 MT indicates that , Sacking warp was included in fine side production, whereas
de production. Management is trying to achieve the target production.
Figure 1 : Comparative analysis of target and actual fine side spinning production of the month
Target production in MT
Actual production in MT

International Journal of Scientific Research and Engineering Development
ISSN : 2581-7175
Figure 2 : Comparative analysis of target and actual coarse side
September 19(AJML)
Figure 3 represent the kgs/frame /shift of fine and coarse side. It is found that coarse side graph is running above than
fine side curve. Coarse side graph runs almost 600 kgs /f/s line, whereas
Due to heavier yarn count , the curv always present in upper position than fine side curve. Now cv% of kgs/f/s in
coarse side is 4 %, which is higher than fine side cv% of 1.7 %. Higher cv% is not desirabl
fluctuation / changing of yarn count round the month.
Figure 4, represent the comparative analysis of per winder production in kgs over the month of September 19. It is
found that, both the curve are present higher than 250 kgs li
production curve is higher than coarse side curve. Initially first and second week of September 19, both the curve are
superimposed. CV% value in coarse side is 3.9% was higher than fine side which exh
is not desirable. Management is now trying to reduce this by close monitoring of winders production, winder : spinning
frame allocation etc. Minimum value of per winder production in coarse side is 240 kgs, which is much
kgs of fine side production. Management is now trying to improve this area.
Figure 3 : Comparative analysis of kgs/frame/shift of fine and coarse side spinning production of the
month September 19 (AJML)
0
200
400
600
800
1.9
.…
2.9
.…
3.9
.…
4.9
.…
5.9
.…
6.9
.…
7.9
.…
8.9
.…
9.9
.…
11
.…
12
.…
kgs/loom/shift
02468
1012141618
1.9
.19
2.9
.19
3.9
.19
4.9
.19
5.9
.19
6.9
.19
7.9
.19
8.9
.19
9.9
.19
11
.9.1
9
12
.9.1
9
13
.9.1
9
production inMT
International Journal of Scientific Research and Engineering Development-– Volume 3 -
Available at www.ijsred.com
©IJSRED: All Rights are Reserved
Figure 2 : Comparative analysis of target and actual coarse side spinning production of the month
Figure 3 represent the kgs/frame /shift of fine and coarse side. It is found that coarse side graph is running above than
fine side curve. Coarse side graph runs almost 600 kgs /f/s line, whereas , fine side curve runs almost 250 kgs /f/s line .
Due to heavier yarn count , the curv always present in upper position than fine side curve. Now cv% of kgs/f/s in
coarse side is 4 %, which is higher than fine side cv% of 1.7 %. Higher cv% is not desirabl
fluctuation / changing of yarn count round the month.
Figure 4, represent the comparative analysis of per winder production in kgs over the month of September 19. It is
found that, both the curve are present higher than 250 kgs line. At the end of the month of September 19,per winder
production curve is higher than coarse side curve. Initially first and second week of September 19, both the curve are
superimposed. CV% value in coarse side is 3.9% was higher than fine side which exhibits 2.1 %.Higher value of cv%
Management is now trying to reduce this by close monitoring of winders production, winder : spinning
frame allocation etc. Minimum value of per winder production in coarse side is 240 kgs, which is much
kgs of fine side production. Management is now trying to improve this area.
Figure 3 : Comparative analysis of kgs/frame/shift of fine and coarse side spinning production of the
12
.…
13
.…
14
.…
15
.…
16
.…
17
.…
18
.…
19
.…
20
.…
21
.…
22
.…
23
.…
24
.…
25
.…
26
.…
27
.…
28
.…
29
.…
kgs/frame/shift ,fine side
kgs/frame/shift ,coarse side
date
13
.9.1
9
14
.9.1
9
15
.9.1
9
16
.9.1
9
17
.9.1
9
18
.9.1
9
19
.9.1
9
20
.9.1
9
21
.9.1
9
22
.9.1
9
23
.9.1
9
24
.9.1
9
25
.9.1
9
26
.9.1
9
27
.9.1
9
28
.9.1
9
29
.9.1
9
30
.9.1
9
Target production in MT
Actual production in MT
date
- Issue 4, July - Aug 2020
www.ijsred.com
Page 1180
spinning production of the month
Figure 3 represent the kgs/frame /shift of fine and coarse side. It is found that coarse side graph is running above than
, fine side curve runs almost 250 kgs /f/s line .
Due to heavier yarn count , the curv always present in upper position than fine side curve. Now cv% of kgs/f/s in
coarse side is 4 %, which is higher than fine side cv% of 1.7 %. Higher cv% is not desirable, but this may be due to
Figure 4, represent the comparative analysis of per winder production in kgs over the month of September 19. It is
ne. At the end of the month of September 19,per winder
production curve is higher than coarse side curve. Initially first and second week of September 19, both the curve are
ibits 2.1 %.Higher value of cv%
Management is now trying to reduce this by close monitoring of winders production, winder : spinning
frame allocation etc. Minimum value of per winder production in coarse side is 240 kgs, which is much lower than 260
Figure 3 : Comparative analysis of kgs/frame/shift of fine and coarse side spinning production of the
29
.…
30
.…
kgs/frame/shift ,fine side
kgs/frame/shift ,coarse side
date
Target production in MT
Actual production in MT

International Journal of Scientific Research and Engineering Development-– Volume 3 - Issue 4, July - Aug 2020
Available at www.ijsred.com
ISSN : 2581-7175 ©IJSRED: All Rights are Reserved Page 1181
Figure 4 : Comparative analysis of production per winder in kgs of fine and coarse side spinning
production of the month September 19 (AJML)
Figure 5 : Comparative analysis of actual efficiency %of fine and coarse side spinning production of
the month September 19 (AJML)
Figure 5 explained the comparative analysis of efficiency % of spinning department of fine and coarse side. It is found
that fine side efficiency% is much higher than coarse side, round the month and it is always higher than 60%. Whereas
coarse side efficiency % curve runs almost 60% line. Slight fluctuation is observed in coarse side curve of efficiency
%. From table 1 and 2, it is found that cv% of coarse side is 4.9% which is higher than fine side spinning line, having
cv% of 2.55%. Higher variation in cv% of spinning efficiency% is not desirable. Management is trying for better batch
composition at coarse side and good monitoring at coarse side spinning line, maintenance of spinning machineries etc.
It is found that fine side spinning efficiency% is less than industry standard.
Table 3 explained the target and actual efficiency of various month of the year 2018-19. Both fine side and coarse side
from figure 6 and 7, foundthat, from November- December 2018 efficiency has been decreasinggradually up to
January 2019, thereafter it increased and reached maximum in the month of April-May 2019of efficiency more than
71% in fine side and 65% in coarse side. Per winder’s production of the month of November-December 2018 was
minimum due to various pujas and absenteeism of workmen, lot of machineries remained idle.
0
50
100
150
200
250
300
350
1.9
.…
2.9
.…
3.9
.…
4.9
.…
5.9
.…
6.9
.…
7.9
.…
8.9
.…
9.9
.…
11
.…
12
.…
13
.…
14
.…
15
.…
16
.…
17
.…
18
.…
19
.…
20
.…
21
.…
22
.…
23
.…
24
.…
25
.…
26
.…
27
.…
28
.…
29
.…
30
.…
production per winder in kgs
fine side
production per winder in kgs
coarse sidedate
per winder production in kgs
020406080
1.9
.19
2.9
.19
3.9
.19
4.9
.19
5.9
.19
6.9
.19
7.9
.19
8.9
.19
9.9
.19
11
.9.1
9
12
.9.1
9
13
.9.1
9
14
.9.1
9
15
.9.1
9
16
.9.1
9
17
.9.1
9
18
.9.1
9
19
.9.1
9
20
.9.1
9
21
.9.1
9
22
.9.1
9
23
.9.1
9
24
.9.1
9
25
.9.1
9
26
.9.1
9
27
.9.1
9
28
.9.1
9
29
.9.1
9
30
.9.1
9
efficiency % fine side
date
efficiency%

International Journal of Scientific Research and Engineering Development-– Volume 3 - Issue 4, July - Aug 2020
Available at www.ijsred.com
ISSN : 2581-7175 ©IJSRED: All Rights are Reserved Page 1182
Table 3 :Efficiency of Spinning frame over different Months Period : August 18 to June 19
Months Per Winder
Production
(target 300
Kgs)
Efficiency fine Side Efficiency Coarse Side
Target Actual Target Actual
August 18 256 80 % 69.3 80 % 67.9
September 18 264 80 % 69.2 80 % 70.6
October 18 254 80 % 72.3 80 % 67.2
November 18 236 80 % 72.2 80 % 68.1
December 18 243 80 % 70.3 80 % 64.8
January 19 259 80 % 69.3 80 % 61.3
February 19 261 80 % 70.9 80 % 62.0
March 19 285 80 % 72.0 80 % 65.1
April 19 296 80 % 71.5 80 % 65.3
May 19 269 80 % 69.6 80 % 64.5
June 19 256 80 % 69.7 80 % 63.7
Source :Monthly productivity report
Figure 06 : Variation of Average Sinning Frame Efficiency % over different months
Figure 07 : Variation of Coarse side Spinning Efficiency % over Different Months
67686970717273 Efficiency fine Side (Actual)
Efficiency fine Side (Actual)
efficiency%
55
60
65
70
75 Efficiency Coarse Side
Efficiency Coarse Side (Coarse
Side )months
Efficiency%
International Journal of Scientific Research and Engineering Development-– Volume 3 - Issue 4, July - Aug 2020
Available at www.ijsred.com
ISSN : 2581-7175 ©IJSRED: All Rights are Reserved Page 1183
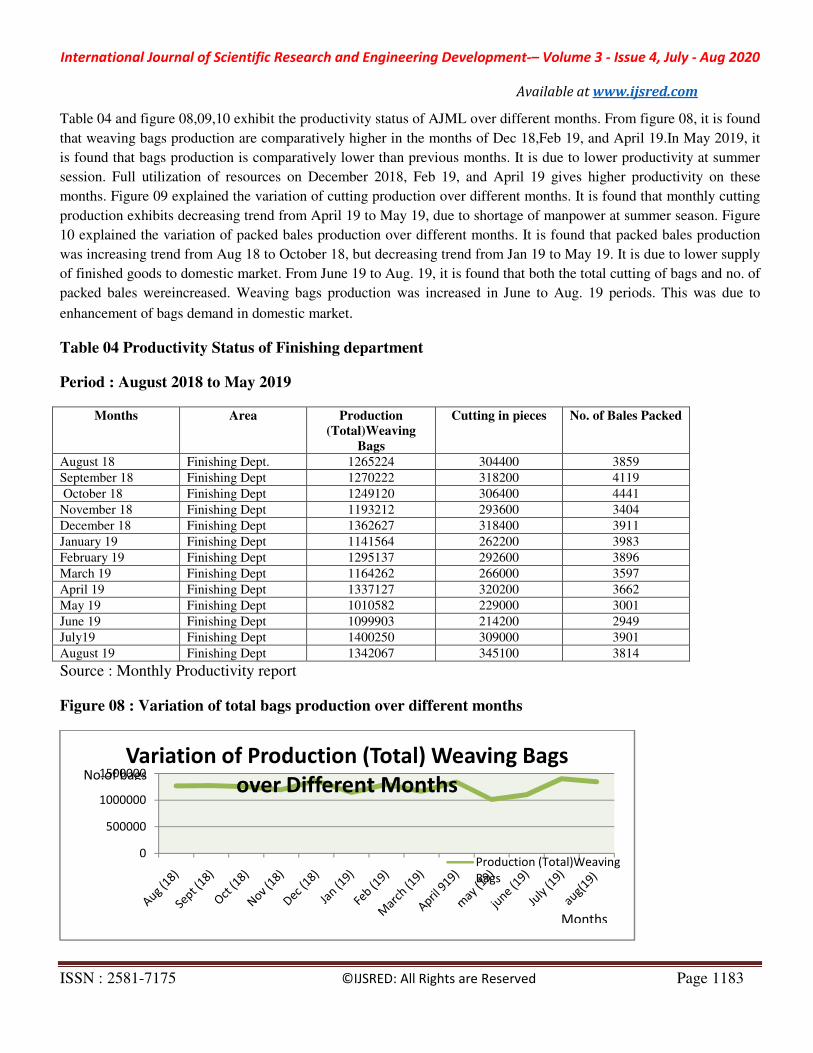
Table 04 and figure 08,09,10 exhibit the productivity status of AJML over different months. From figure 08, it is found
that weaving bags production are comparatively higher in the months of Dec 18,Feb 19, and April 19.In May 2019, it
is found that bags production is comparatively lower than previous months. It is due to lower productivity at summer
session. Full utilization of resources on December 2018, Feb 19, and April 19 gives higher productivity on these
months. Figure 09 explained the variation of cutting production over different months. It is found that monthly cutting
production exhibits decreasing trend from April 19 to May 19, due to shortage of manpower at summer season. Figure
10 explained the variation of packed bales production over different months. It is found that packed bales production
was increasing trend from Aug 18 to October 18, but decreasing trend from Jan 19 to May 19. It is due to lower supply
of finished goods to domestic market. From June 19 to Aug. 19, it is found that both the total cutting of bags and no. of
packed bales wereincreased. Weaving bags production was increased in June to Aug. 19 periods. This was due to
enhancement of bags demand in domestic market.
Table 04 Productivity Status of Finishing department
Period : August 2018 to May 2019
Months Area Production
(Total)Weaving
Bags
Cutting in pieces No. of Bales Packed
August 18 Finishing Dept. 1265224 304400 3859
September 18 Finishing Dept 1270222 318200 4119
October 18 Finishing Dept 1249120 306400 4441
November 18 Finishing Dept 1193212 293600 3404
December 18 Finishing Dept 1362627 318400 3911
January 19 Finishing Dept 1141564 262200 3983
February 19 Finishing Dept 1295137 292600 3896
March 19 Finishing Dept 1164262 266000 3597
April 19 Finishing Dept 1337127 320200 3662
May 19 Finishing Dept 1010582 229000 3001
June 19 Finishing Dept 1099903 214200 2949
July19 Finishing Dept 1400250 309000 3901
August 19 Finishing Dept 1342067 345100 3814
Source : Monthly Productivity report
Figure 08 : Variation of total bags production over different months
0
500000
1000000
1500000Variation of Production (Total) Weaving Bags
over Different Months
Production (Total)Weaving
Bags
Months
No.of bags

International Journal of Scientific Research and Engineering Development
ISSN : 2581-7175
Figure 09 : Variation of total cutting Production over different months
Figure 08 explained that monthly cutting production for bags has been increasing from May to Aug. 19 as the domestic
demand has been increased. In the month of May 19 , lower production of cutting is due to the summer season , less
machineries are running due to absenteeism
Figure 10 : Variation of No. of Bales Packed Over Different Months
Table 5 : Machine wise Productivity report
Months
Hemming
(Bags)
Herackle
(Bags)
August 18 3000 2250
September 18 2963 2217
October 18 2900 2120
November 18 2852 2112
December 18 2643 2180
January 19 2950 2185
February 19 2862 2110
March 19 2919 2127
April 19 2555 2164
May 19 2157 1675
0
100000
200000
300000
400000
Variation of Total Monthly Cutting
Production over Different Months Total Cutting
Production in
0
2000
4000
6000 Variation of No. of Bales Packed over Different No. of bales
International Journal of Scientific Research and Engineering Development-– Volume 3 -
Available at www.ijsred.com
©IJSRED: All Rights are Reserved
: Variation of total cutting Production over different months
explained that monthly cutting production for bags has been increasing from May to Aug. 19 as the domestic
demand has been increased. In the month of May 19 , lower production of cutting is due to the summer season , less
senteeism of labours.
: Variation of No. of Bales Packed Over Different Months
: Machine wise Productivity report
Production /mcs/day
Herackle
(Bags)
Hand sewing
(bags)
Lapping (yrds) Press
(no. of bales )
2250 8194 21700
2217 3245 20822
2120 4135 20925
2112 3311 20232
2180 3245 20021
2185 3416 19530
2110 3258 19902
2127 3247 15159
2164 3250 22785
1675 3021 16327
Variation of Total Monthly Cutting
Production over Different Months
Cutting Production
months
Variation of No. of Bales Packed over Different
Months
No. of Bales Packed
months
- Issue 4, July - Aug 2020
www.ijsred.com
Page 1184
explained that monthly cutting production for bags has been increasing from May to Aug. 19 as the domestic
demand has been increased. In the month of May 19 , lower production of cutting is due to the summer season , less
Press Production
(no. of bales )
53
59
58
60
55
52
55
56
62
55
Cutting Production
months
No. of Bales Packed
months
International Journal of Scientific Research and Engineering Development
ISSN : 2581-7175
June 19 2568 1980
July19 2684 2095
Aug 19 2796 2042
Source : monthly productivity report of the mill
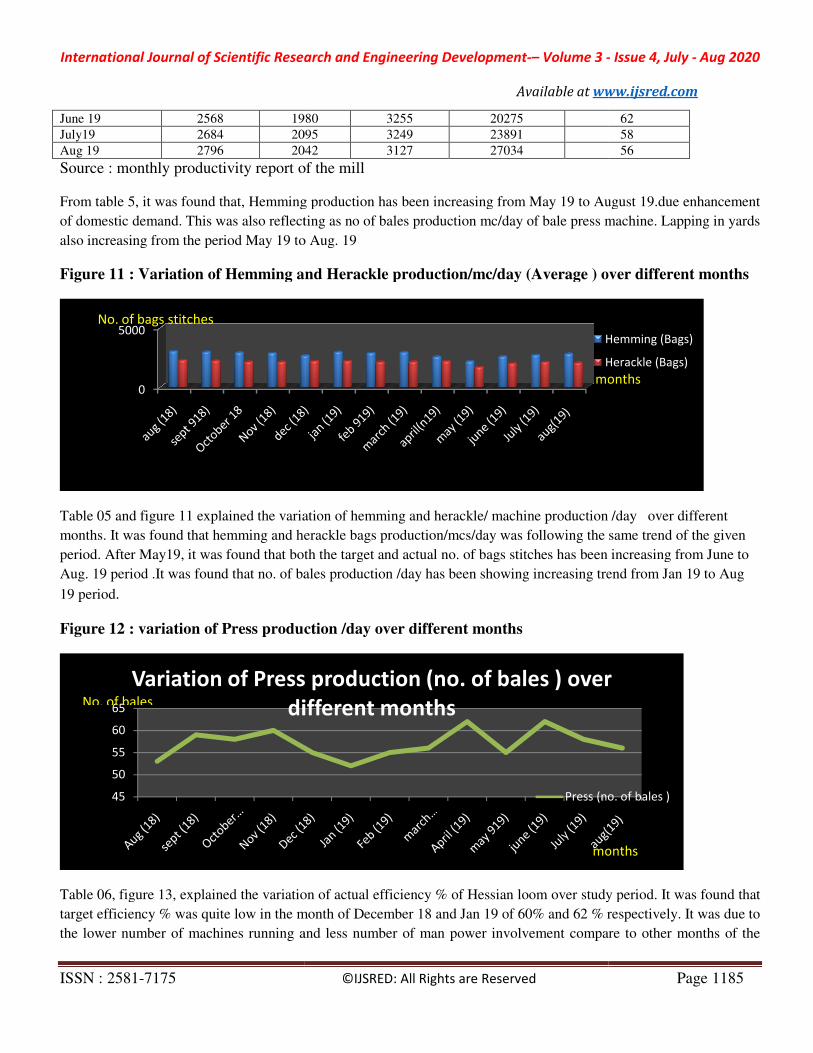
From table 5, it was found that, Hemming production has been increasing from
of domestic demand. This was also reflecting as no of bales production mc/day of bale press m
also increasing from the period May 19 to Aug. 19
Figure 11 : Variation of Hemming and Herackle production/mc/day (Average ) over different months
Table 05 and figure 11 explained the variation of hemming and herackle/ machine production /day over different
months. It was found that hemming and herackle bags production/mcs/day
period. After May19, it was found that both the targ
Aug. 19 period .It was found that no. of bales production /day has been showing increasing trend from Jan 19 to Aug
19 period.
Figure 12 : variation of Press production /day over differen
Table 06, figure 13, explained the variation of actual efficiency % of Hessian loom over study period. It
target efficiency % was quite low in the month of December 18 and Jan 19
the lower number of machines running and less n
0
5000No. of bags stitches
45
50
55
60
65
Variation of Press production (no. of bales ) over
different months No. of bales
International Journal of Scientific Research and Engineering Development-– Volume 3 -
Available at www.ijsred.com
©IJSRED: All Rights are Reserved
1980 3255 20275
2095 3249 23891
2042 3127 27034
Source : monthly productivity report of the mill
found that, Hemming production has been increasing from May 19 to Aug
also reflecting as no of bales production mc/day of bale press m
also increasing from the period May 19 to Aug. 19
: Variation of Hemming and Herackle production/mc/day (Average ) over different months
explained the variation of hemming and herackle/ machine production /day over different
found that hemming and herackle bags production/mcs/day was following the same trend of the given
found that both the target and actual no. of bags stitches has been increasing from June to
o. of bales production /day has been showing increasing trend from Jan 19 to Aug
: variation of Press production /day over different months
Table 06, figure 13, explained the variation of actual efficiency % of Hessian loom over study period. It
quite low in the month of December 18 and Jan 19 of 60% and 62 % respectively. It
of machines running and less number of man power involvement compare to other months of the
Hemming (Bags)
Herackle (Bags)
months
Variation of Press production (no. of bales ) over
different months
Press (no. of bales )
months
- Issue 4, July - Aug 2020
www.ijsred.com
Page 1185
62
58
56
19 to August 19.due enhancement
also reflecting as no of bales production mc/day of bale press machine. Lapping in yards
: Variation of Hemming and Herackle production/mc/day (Average ) over different months
explained the variation of hemming and herackle/ machine production /day over different
following the same trend of the given
et and actual no. of bags stitches has been increasing from June to
o. of bales production /day has been showing increasing trend from Jan 19 to Aug
Table 06, figure 13, explained the variation of actual efficiency % of Hessian loom over study period. It was found that
60% and 62 % respectively. It was due to
of man power involvement compare to other months of the
Hemming (Bags)
Herackle (Bags)
months
Variation of Press production (no. of bales ) over
Press (no. of bales )
months

International Journal of Scientific Research and Engineering Development
ISSN : 2581-7175
study period. As a result actual efficiency % of the Hessian loom on those months
months of the study period. In the month of April, May 19, actual efficiency of Hessian loom
than other months due to summer season. At that time less number of weavers, weavers away from the workplace,
absenteeism of weavers were the main factors for lo
sacking loom are the function of actual efficiency %.
Table 06: Productivity report of weaving department over different months
MONTH HESSIAN
EFFICIENCY %
TARGET ACTUAL
August 18 65 54.1
September 18 65 52.7
October 18 65 50.2
November 18 65 55.4
December 18 60 49.3
January 19 62 50.3
February19 63 51.7
March19 65 50.2
April 19 65 43.6
May 19 65 41.9
June 19 65 42.4
July 19 65 46.2
Aug 19 65 51
Sept 19 65 52.4
Source : Monthly Productivity report of
Figure 13: Variation of Actual efficiency % in hessian loom over different months
0
50
100Efficiency %
International Journal of Scientific Research and Engineering Development-– Volume 3 -
Available at www.ijsred.com
©IJSRED: All Rights are Reserved
study period. As a result actual efficiency % of the Hessian loom on those months was comparatively lower than other
riod. In the month of April, May 19, actual efficiency of Hessian loom
than other months due to summer season. At that time less number of weavers, weavers away from the workplace,
the main factors for lower efficiency%. It was found that kg/loom/shift for Hessian and
sacking loom are the function of actual efficiency %.
Productivity report of weaving department over different months
HESSIAN
SACKING
KG/LOOM/SHIFT
EFFICIENCY % KG/LOOM/SHIFT
TARGET ACTUAL TARGET ACTUAL TARGET
38.1 30.9 80 70.1 64.3
38.1 30.9 80 69.6 64.3
32.5 29.4 80 70.6 64.3
25.8 20.4 80 71.7 64.3
31.5 25.7 80 71.4 64.3
33.8 27.0 80 70.2 64.2
34.1 28 80 69.8 64.3
37.1 28 80 69.6 64.2
38.6 25.3 80 69.4 66.3
37.2 24.3 80 71.1 66.3
35.5 23.5 80 70.3 64.3
32.4 23.8 80 71.5 64.3
33.1 25.4 80 72.1 64.2
33.1 26.2 80 72.4 66.3
Source : Monthly Productivity report of Mill
Variation of Actual efficiency % in hessian loom over different months
EFFICIENCY % TARGET
EFFICIENCY % ACTUAL
months
- Issue 4, July - Aug 2020
www.ijsred.com
Page 1186
comparatively lower than other
riod. In the month of April, May 19, actual efficiency of Hessian loom was comparatively lower
than other months due to summer season. At that time less number of weavers, weavers away from the workplace,
found that kg/loom/shift for Hessian and
SACKING
KG/LOOM/SHIFT
TARGET ACTUAL
64.3 56.3
64.3 55.9
64.3 56.7
64.3 57.6
64.3 57.3
64.2 56.1
64.3 56.1
64.2 55.9
66.3 55.9
66.3 57.2
64.3 56.4
64.3 57.4
64.2 57.9
66.3 58.4
Variation of Actual efficiency % in hessian loom over different months
EFFICIENCY % TARGET
EFFICIENCY % ACTUAL

International Journal of Scientific Research and Engineering Development
ISSN : 2581-7175
Figure 14 : Variation of Actual efficiency % of sacking loom over different months
From table 06 and figure 14, it is found that Sacking loom actual efficiency %
was due to the Eco loader mechanism and fabric construction. The Sacking loom efficiency
standard industry norms. The actual efficiency %
Table 07: Productivity report of Victor C loom over different months
MONTH
EFFICIENCY %
TARGET ACTUAL
August 18 70 41.3
September 18 70 44.6
October 18 70 45.4
November 18 70 44.7
December 18 70 42.0
January 19 68 42.3
February19 65 41.8
March19 66 43.6
April 19 59 42.2
May 19 60 43.0
June 19 59 37.2
July 19 61 35.2
Aug 19 59
Sept 19 70 37.6
Source : Monthly Productivity report of Mill
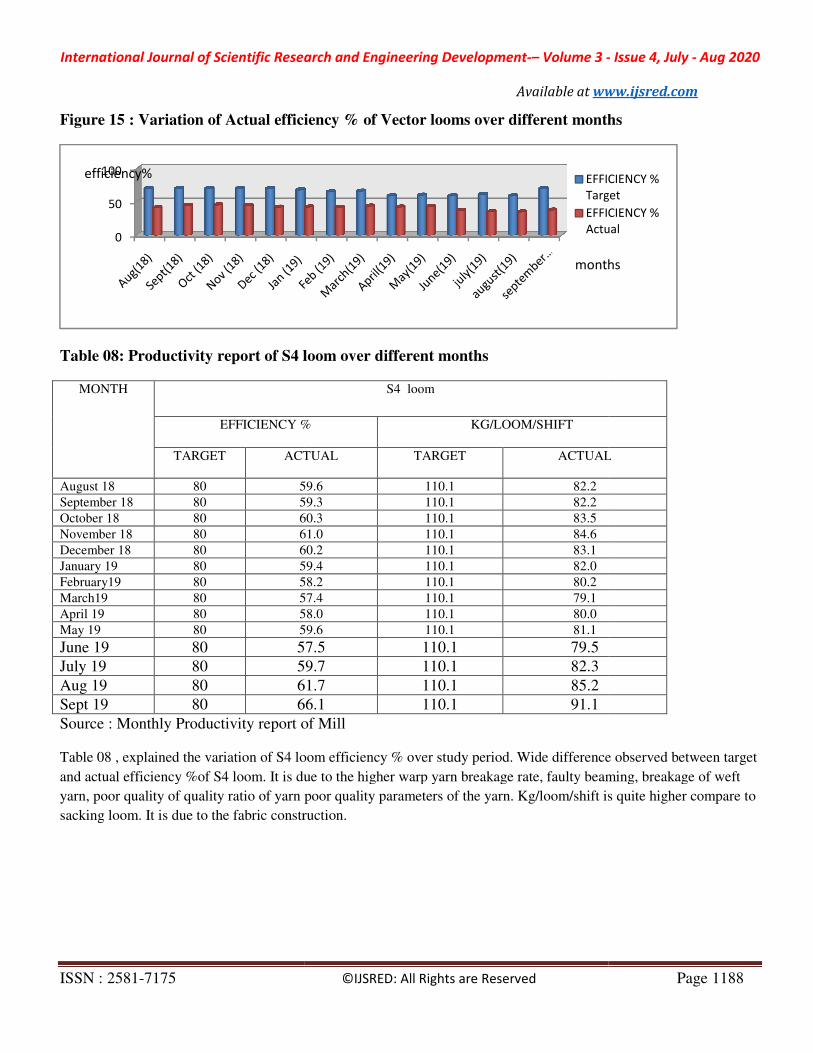
Table 07 and figure 15, explained the variation of Victor loom efficiency% over study period. It was
differences were observed between target and actual efficiency. It was due to the higher warp yarn breakage rate ,
lower quality ratio of warp yarn, , variation of yarn quality ratio etc. were responsible Kg/loom/shift were the function
of actual efficiency % were proved here.
60
80efficiency%
International Journal of Scientific Research and Engineering Development-– Volume 3 -
Available at www.ijsred.com
©IJSRED: All Rights are Reserved
Variation of Actual efficiency % of sacking loom over different months
From table 06 and figure 14, it is found that Sacking loom actual efficiency % was quite higher than Hessian loom. It
due to the Eco loader mechanism and fabric construction. The Sacking loom efficiency
actual efficiency % wasobserved round the 70 % on the study period.
ctor C loom over different months
Vector C loom
EFFICIENCY % KG/LOOM/SHIFT
ACTUAL TARGET ACTUAL
41.3 84.3 50.9
44.6 85 52.6
45.4 88 55.8
44.7 89.2 56.6
42.0 91.9 54.8
42.3 83.6 55.1
41.8 77.4 51.3
43.6 77.5 51.5
42.2 77.1 53.7
43.0 79.9 55.6
37.2 77.1 47.9
35.2 79.9 45.5
35 80.7 45.4
37.6 53.7 49.1
Source : Monthly Productivity report of Mill
Table 07 and figure 15, explained the variation of Victor loom efficiency% over study period. It was
differences were observed between target and actual efficiency. It was due to the higher warp yarn breakage rate ,
lower quality ratio of warp yarn, , variation of yarn quality ratio etc. were responsible Kg/loom/shift were the function
EFFICIENCY %
TargetEFFICIENCY %
Actual
months
- Issue 4, July - Aug 2020
www.ijsred.com
Page 1187
Variation of Actual efficiency % of sacking loom over different months
quite higher than Hessian loom. It
due to the Eco loader mechanism and fabric construction. The Sacking loom efficiency % was following the
0 % on the study period.
ACTUAL
Table 07 and figure 15, explained the variation of Victor loom efficiency% over study period. It was found that wide
differences were observed between target and actual efficiency. It was due to the higher warp yarn breakage rate ,
lower quality ratio of warp yarn, , variation of yarn quality ratio etc. were responsible Kg/loom/shift were the function
EFFICIENCY %
EFFICIENCY %
International Journal of Scientific Research and Engineering Development
ISSN : 2581-7175
Figure 15 : Variation of Actual efficiency % of Vector looms over different months
Table 08: Productivity report of S4 loom
MONTH
EFFICIENCY %
TARGET ACTUAL
August 18 80 59.6
September 18 80 59.3
October 18 80 60.3
November 18 80 61.0
December 18 80 60.2
January 19 80 59.4
February19 80 58.2
March19 80 57.4
April 19 80 58.0
May 19 80 59.6
June 19 80 57.5
July 19 80 59.7
Aug 19 80 61.7
Sept 19 80 66.1
Source : Monthly Productivity report of Mill
Table 08 , explained the variation of S4 loom efficiency % over study period. Wide difference observed between target
and actual efficiency %of S4 loom. It is due to the higher warp yarn breakage rate, faulty beaming, breakage of weft
yarn, poor quality of quality ratio of yarn poor quality parameters of the yarn. Kg/loom/shift is quite higher compare to
sacking loom. It is due to the fabric construction.
0
50
100efficiency%
International Journal of Scientific Research and Engineering Development-– Volume 3 -
Available at www.ijsred.com
©IJSRED: All Rights are Reserved
Variation of Actual efficiency % of Vector looms over different months
S4 loom over different months
S4 loom
EFFICIENCY % KG/LOOM/SHIFT
ACTUAL TARGET ACTUAL
59.6 110.1 82.2
59.3 110.1 82.2
60.3 110.1 83.5
61.0 110.1 84.6
60.2 110.1 83.1
59.4 110.1 82.0
58.2 110.1 80.2
57.4 110.1 79.1
58.0 110.1 80.0
59.6 110.1 81.1
57.5 110.1 79.5
59.7 110.1 82.3
61.7 110.1 85.2
66.1 110.1 91.1
Source : Monthly Productivity report of Mill
Table 08 , explained the variation of S4 loom efficiency % over study period. Wide difference observed between target
and actual efficiency %of S4 loom. It is due to the higher warp yarn breakage rate, faulty beaming, breakage of weft
quality ratio of yarn poor quality parameters of the yarn. Kg/loom/shift is quite higher compare to
It is due to the fabric construction.
EFFICIENCY %
Target
EFFICIENCY %
Actual
months
- Issue 4, July - Aug 2020
www.ijsred.com
Page 1188
Variation of Actual efficiency % of Vector looms over different months
ACTUAL
Table 08 , explained the variation of S4 loom efficiency % over study period. Wide difference observed between target
and actual efficiency %of S4 loom. It is due to the higher warp yarn breakage rate, faulty beaming, breakage of weft
quality ratio of yarn poor quality parameters of the yarn. Kg/loom/shift is quite higher compare to
EFFICIENCY %
Target
EFFICIENCY %
Actual
months

International Journal of Scientific Research and Engineering Development
ISSN : 2581-7175
Figure 16 . Variation of Actual efficiency % of S4 looms over different months
Source : Monthly Productivity report of Mill
Figure 17 :Variation of actual kgs/loom/shift hessian loom over different months
Figure 17 is describing the variation of Kgs/loom/shift from June 19 to September 19 as the efficiency of the Hessian
loom has been increasing on the said period .It is found that curve of Kgs/loom/shift is running above the line of 20 kgs
of the same period.
Figure 18 :Variation of actual kgs/loom/shift sacking loom over different months
0
50
100efficiency%
0
10
20
30
40
june (19) July(19)
Kgs/loom/shift
50
55
60
65
70
june (19) July(19)
Kgs/loom/shift %
International Journal of Scientific Research and Engineering Development-– Volume 3 -
Available at www.ijsred.com
©IJSRED: All Rights are Reserved
. Variation of Actual efficiency % of S4 looms over different months
Productivity report of Mill
Variation of actual kgs/loom/shift hessian loom over different months
Figure 17 is describing the variation of Kgs/loom/shift from June 19 to September 19 as the efficiency of the Hessian
n the said period .It is found that curve of Kgs/loom/shift is running above the line of 20 kgs
Variation of actual kgs/loom/shift sacking loom over different months
EFFICIENCY % Target
EFFICIENCY % Actual
months
July(19) Aug(19) sept(19)
target
kg/loom/shift
actual
kgs/loom/shift
months
July(19) Aug(19) sept(19)
target kgs/loom/shift
actual kgs/loom/shift
months
- Issue 4, July - Aug 2020
www.ijsred.com
Page 1189
Variation of actual kgs/loom/shift hessian loom over different months
Figure 17 is describing the variation of Kgs/loom/shift from June 19 to September 19 as the efficiency of the Hessian
n the said period .It is found that curve of Kgs/loom/shift is running above the line of 20 kgs
Variation of actual kgs/loom/shift sacking loom over different months
EFFICIENCY % Target
EFFICIENCY % Actual
target
kg/loom/shift
actual
kgs/loom/shift
months
actual kgs/loom/shift

International Journal of Scientific Research and Engineering Development
ISSN : 2581-7175
Figure 18 explained that the Kgs/loom/shift has been
sacking loom has been increasing on the said period. It is found that the kgs/loom/shift is running above the line of 55
Kgs/loom/shift.
Figure 19 :Variation of actual kgs/loom/shift Vector
From the figure 19 , it is found that Kgs/loom/shift slightly increasing from the year June 19 to September 2019,as the
efficiency has been increasing on the said period. The kgs/loom/shift line has been present above the st
kgs/loom/shift.
Figure 20 :Variation of actual kgs/loom/shift s4 loom over different months
Figure 20 described the variation of kgs/loom/shift from June 19 to September 2019. It is found that Kgs/loom/shift has
been increasing from June to September 19 as the loom efficiency has been increasing on the same period.
Table 09 : Statistical Significance Test
Sl
No.
Department Subject under
testing
1 Weaving
Department
Relationship
between Loom
Efficiency and
Kgs/loom/shift
0
20
40
60
80
100
june(19) july(19)
Kgs/loom/shift
0
100
200
june(19)
Kgs/loom/shift%
International Journal of Scientific Research and Engineering Development-– Volume 3 -
Available at www.ijsred.com
©IJSRED: All Rights are Reserved
Figure 18 explained that the Kgs/loom/shift has been increasing from June 19 to September 19,as the efficiency of the
sacking loom has been increasing on the said period. It is found that the kgs/loom/shift is running above the line of 55
Variation of actual kgs/loom/shift Vector C loom over different months
From the figure 19 , it is found that Kgs/loom/shift slightly increasing from the year June 19 to September 2019,as the
efficiency has been increasing on the said period. The kgs/loom/shift line has been present above the st
Variation of actual kgs/loom/shift s4 loom over different months
Figure 20 described the variation of kgs/loom/shift from June 19 to September 2019. It is found that Kgs/loom/shift has
to September 19 as the loom efficiency has been increasing on the same period.
Statistical Significance Test
Pearson’s
correlation
coefficient
R
Coefficie
nt of
Determin
ation R2
Value of p Remarks
0.9927 0.9855 0.00001 Strong positive
correlation, p
value is <0.00001.
The result is
july(19) aug(19) sept(19)
target kgs/loom/shift
actual kgs/loom/shift
months
july(19) aug(19) sept(19)
target kgs/loom/shift
actual kgs/loom/shift
months
- Issue 4, July - Aug 2020
www.ijsred.com
Page 1190
increasing from June 19 to September 19,as the efficiency of the
sacking loom has been increasing on the said period. It is found that the kgs/loom/shift is running above the line of 55
C loom over different months
From the figure 19 , it is found that Kgs/loom/shift slightly increasing from the year June 19 to September 2019,as the
efficiency has been increasing on the said period. The kgs/loom/shift line has been present above the state line of 40
Figure 20 described the variation of kgs/loom/shift from June 19 to September 2019. It is found that Kgs/loom/shift has
to September 19 as the loom efficiency has been increasing on the same period.
Remarks
Strong positive
correlation, p
value is <0.00001.
The result is
target kgs/loom/shift
actual kgs/loom/shift
months
target kgs/loom/shift
actual kgs/loom/shift
months

International Journal of Scientific Research and Engineering Development-– Volume 3 - Issue 4, July - Aug 2020
Available at www.ijsred.com
ISSN : 2581-7175 ©IJSRED: All Rights are Reserved Page 1191
production for
S4 loom
significant at
p<0.05
2 Weaving
Department
Relationship
between Loom
Efficiency and
Kgs/loom/shift
production for
Victor loom
0.9043 0.8178 0.00001 Strong positive
correlation,p value
is <0.00001. The
result is significant
at p<0.05
3 Weaving
Department
Relationship
between Loom
Efficiency and
Kgs/loom/shift
production for
Hessian
shuttle loom
0.3449 0.119 0.227171 Positive
correlation, the
relationship
between two
variables is weak.
The result is not
significant t
p<0.05 and p<0.1
4 Weaving
Department
Relationship
between Loom
Efficiency and
Kgs/loom/shift
production for
Sacking
shuttle loom
0.9902 0.9805 0.00001 Strong positive
correlation ,p
value is <0.00001.
The result is
significant at
p<0.05
5 Spinning
Department
Relationship
between
Spinning
frame
efficiency %
and per
winder’s
production
0.0949 0.009 0.781359 Weak positive
correlation ship ,
but the result is not
significant as p
value is higher
than 0.05
6 Finishing
Department
Total number
of bags
production
/month and
total number
of bales press
production
/month
0.6289 0.3955 0.021302 Positive
correlation ship
between the two
variables. P value
is less than 0.05. It
is significant tat
95 % confidence
level.
7 Finishing
Department
Relationship
between
Hemming and
Herackle
production/mc
/day
0.8303 0.6894 0.000424 Strong positive
correlation ship
Exist between the
two variables. The
result is significant
at p<0.05

International Journal of Scientific Research and Engineering Development-– Volume 3 - Issue 4, July - Aug 2020
Available at www.ijsred.com
ISSN : 2581-7175 ©IJSRED: All Rights are Reserved Page 1192
Table 9 described the Pearson’s correlation coefficient ‘R’ of different production process and their relationship. Here
Weaving, Spinning and Finishing, these three department are selected for analysis. In Weaving department ,Victor, S4
, Hessian and sacking shuttle loom efficiency% and Kgs/loom/shift are observing and it is found that strong positive
correlation exist between the production variables.In Spinning department, Spinning frame efficiency% and per winder
production /shift in Kgs has positive correlation, but not significant at 955 confidence level. In Finishing department
,total number of bags production /month and press production /month has strong positive correlation . Hemming and
Herackle ,production /mc/day has strong positive correlation .
Suggestive Measures for Improvement:
• Both fine side and coarse side actual spinning frame efficiency % are comparatively less than industry norms.
In such cases, efficiency of spinning frame are to be improved. Regarding this ,timely schedule maintenance of
spinning frames, quality of feed material ,proper speed of flyers, spinner’s efficiency, skilled manpower,
reduction of absentees of workmen etc. are areas for further improvement.
• Fluctuations of coarse side spinning frame efficiency are to be improved. Regarding this, feed material quality,
skilled manpower, better supervision, timely maintenance of machineries are to be taken in time.
• Both coarse side and fine side average monthly spinning efficiency data are to be improved. Regarding this
above mentioned points is to be taken in time.
• Regarding efficiency of victor and S4 loom, Management is trying for improvement. Skilled competent
machine operator, training of learners at workplace with proper guidance,, quality of yarn, etc. are important
areas for improvement of weaving efficiency. Sizing process parameters, e.g., quality of beam, steam pressure
and temperature ,sizing ingredients composition are taken into consideration.
Conclusions:
The study is based on the day to day study of productivity of machineries of various department of the unit. It also
indicates the present, efficiency status of the unit. The present study has identified the critical areas for development of
the unit. Jute products have higher demand in National and International market due to biodegradable nature. Under
this circumstances, productivity, efficiency of machineries along with skilled trained machine operators are now urgent
to fulfil the demand of customers.
Acknowledgement:
We are extremely thankful to the Senior Officers of Agarpara Jute Mills Ltd. , Kolkata for carrying out such
research work at their organization.
Reference :.
1. Mahabubuzzaman A. K. M, Md. Miazi O.G and Khan .A.N. , ( July 2009), Effect Of Flyer Speed On Yarn Breakages In
Production Of Jute Yarn, Daffodil International University Journal Of Science And Technology, Volume 4, Issue 2.
2. MD. Mohiuddin, (Feb. 2015), Green Marketing Of Jute and Jute Products: A Study on Bangladesh, IOSR Journal of Business and
Management (IOSR-JBM), e-ISSN: 2278-487X, p-ISSN: 2319-7668. Volume 17, Issue 2.Ver. I
3. HabeeburRahman. T , (May 2016 ), A Study on Causes of Absenteeism among Employees in Retails Shops (With Special
Reference to Textiles, T-Nagar Chennai.), ISBR Management Journal. , Volume1, Issue1.
4. Paul A, (May 2012), Sustainable Growth in Indian Jute Industry—An Exploratory Study, The Management Accountant.

International Journal of Scientific Research and Engineering Development-– Volume 3 - Issue 4, July - Aug 2020
Available at www.ijsred.com
ISSN : 2581-7175 ©IJSRED: All Rights are Reserved Page 1193
5. Shamna A,. Jha S. K , Chakraborty A. K. and Kumar S.,(January 2018), Jute Production: The Need for Linkage among Research,
Farmers and Industries in West Bengal, India , Current Journal of Applied Science and Technology, 25(3): 1-6, 2017; Article
no.CJAST.38295, Previously known as British Journal of Applied Science & Technology, ISSN: 2231-0843, NLM ID:
101664541
6. Tandon N and Reddy E ,( July 2013), A Study On Emerging Trends In Textile Industry In India, International Journal of
Advancements in Research & Technology, Volume 2, Issue 7 .
7. Kumar I ,and Patel N B , (July 2017), Management perspective on low productivity and related causative factors: A study on
Indian apparel manufacturing industry , International Journal of Academic Research and Development , Volume 2; Issue 4; Page
No. 314-325.
8. Ahlawat V and Renu ,(2018), An Analysis of Growth and Association between Labour Productivity and Wages in Indian Textile
Industry , Management and Labour Studies 43(1&2) 78–87 .http://journals.sagepub.com/home/mls.
9. Kadhar R M &Muthuraju P, (July 2016), An Analysis Of Trend And Growth Rate Of Textile Industry In India ,Shanlax
International Journal of Commerce , Vol 4,issue 3.


![Study on jute mill workers exposed to occupational hazardsiaimjournal.com/wp-content/uploads/2018/04/iaim_2018_0504_09.pdfMuralidhar Y, et al. [1] among the jute mill workers showed](https://img.pdfslide.net/doc/110x75/5e9c12ad9627d7740a6521fc/study-on-jute-mill-workers-exposed-to-occupational-muralidhar-y-et-al-1-among.jpg)