Embed Size (px)
Citation preview

Study on the Application of
Economic Valuation Techniques
for Determining Transfer Prices
of Cross Border Transactions
between Members of Multinational Enterprise Groups
in the EU
Specific contract no. 6 under Framework contract
TAXUD/2014/CC/126
Final Report

European Commission
Study on the Application of Economic Valuation Techniques for Determining Transfer Prices of Cross Border Transactions between Members of Multinational Enterprise
Groups in the EU
September 2016 – 2
Date 03.10.2016
Prepared by Cedric Popa, Maria Panina, Liana Andreiescu, Karel Holvoet
Checked by Sue Tilstone, Ciara Walsh
Approved by Andre Schaffers
Version Final Report
The information and views set out in this report are those of the author and do not
necessarily reflect the official opinion of the Commission. The Commission does not
guarantee the accuracy of the data included in this study. Neither the Commission nor
any person acting on the Commission's behalf may be held responsible for the use
which may be made of the information contained in therein.
ISBN: 978-92-79-55024-9
Doi: 10.2778/478527
Catalogue number: KP0116145ENN
© European Union, 2016
Reproduction is authorised provided the source is acknowledged.

European Commission
Study on the Application of Economic Valuation Techniques for Determining Transfer Prices of Cross Border Transactions between Members of Multinational Enterprise
Groups in the EU
September 2016 – 3
Table of Contents
List of Figures ................................................................................................... 5 List of Tables .................................................................................................... 7 Abstract (EN) .................................................................................................... 8 Abstract (FR) .................................................................................................... 8 Executive Summary (EN) .................................................................................... 9 Résumé (FR) ....................................................................................................13 1.Introduction ..................................................................................................17
1.1 Context .........................................................................................17 1.2 Objectives and Scope of the Study ....................................................20 1.3 Work performed and methodology ....................................................22 1.4 Limitations of the study ...................................................................23
2. Similarities and differences in valuation approach and basis of value ...................25 2.1 Introduction ...................................................................................25 2.2 Theoretical premises .......................................................................25 2.3 Practical observations ......................................................................39
3. Intangibles valuation methods used in TP ........................................................62 3.1 Introduction ...................................................................................62 3.2 Valuation approaches and methods ...................................................62 3.3 Alignment of valuation methodologies with the OECD - authorised TP
methods ....................................................................................................67 3.4 Use of valuation methods in transfer pricing .......................................69 3.5 SWOT analysis of valuation methods .................................................74 3.6 Potential remedies to weaknesses of income-based methods ................79 3.7 Valuation standards and their application in transfer pricing valuations ..85
4. Practical application of economic valuation methods ..........................................94 4.1 Introduction ...................................................................................94 4.2 Theoretical premises .......................................................................95 4.3 Parametrisation of main building blocks in practice ........................... 109
5. Legislative measures ................................................................................... 143 5.1 Introduction ................................................................................. 143 5.2 US Transfer Pricing rules and regulations ......................................... 143 5.3 German domestic law .................................................................... 150 5.4 Potential application to EU Member States ....................................... 153
6. Capacity building in tax administrations ......................................................... 155 6.1 Introduction ................................................................................. 155 6.2 Estimated costs of valuation study .................................................. 155 6.3 Resources at tax administration and taxpayer’s side .......................... 157 6.4 Conclusions .................................................................................. 161
7. Considerations for possible policy actions ....................................................... 162 7.1 Understanding general background for a valuation ............................ 162 7.2 General valuation techniques ......................................................... 162 7.3 Building blocks ............................................................................. 162 7.4 Legislative measures ..................................................................... 163 7.5 Resources .................................................................................... 163
Bibliography ................................................................................................... 164 Appendix 1 – Survey ....................................................................................... 167 Appendix 2.A – Description of valuation methodologies ....................................... 176 Appendix 2.B – Examples for valuation methodologies ........................................ 187

European Commission
Study on the Application of Economic Valuation Techniques for Determining Transfer Prices of Cross Border Transactions between Members of Multinational Enterprise
Groups in the EU
September 2016 – 4
Appendix 3 – Description of OECD methodologies ............................................... 196 Appendix 4 – Valuation standards ..................................................................... 202 Appendix 5 – Discount rate inputs .................................................................... 204 Appendix 6 – Parameters internal sources ......................................................... 206 Appendix 7 – Parameters external sources ......................................................... 207 Appendix 8 – Overview of transfer pricing legislation .......................................... 208 Appendix 9 – Glossary & Abbreviations.............................................................. 213

European Commission
Study on the Application of Economic Valuation Techniques for Determining Transfer Prices of Cross Border Transactions between Members of Multinational Enterprise
Groups in the EU
September 2016 – 5
List of Figures Figure 1. State of play – Experience in IP valuation for TP purposes ........................40 Figure 2. State of play – Experience in valuing specific types of intangibles ..............42 Figure 3. State of play – Experience in IP valuation for transfer pricing purposes –
main trade partners ..........................................................................................43 Figure 4. State of play – Experience in valuing specific types of intangibles ..............44 Figure 5. Is the purpose of valuation (being TP) important? ...................................44 Figure 6. Important information to consider before selecting valuation approach in
transfer pricing, (besides financial data) ..............................................................45 Figure 7. Use of PPA studies for TP purposes. .......................................................46 Figure 8. Dealing with goodwill part of PPA – EU Member States .............................47 Figure 9. Dealing with the goodwill part of PPA – Trade partners ............................49 Figure 10. Frequency of valuation from both parties’ perspectives in practice – EU
Member States .................................................................................................50 Figure 11. Do you agree that valuations from both parties’ perspectives are important?
– EU Member States .........................................................................................51 Figure 12. Most common approach to select a value in the range? – EU Member States
......................................................................................................................51 Figure 13. Analysis used to determine a value in two-sided valuation – EU Member
States .............................................................................................................52 Figure 14. Analysis possibly undertaken by Tax Administration – EU Member States .53 Figure 15. Treatment of workforce – EU Member States ........................................56 Figure 16. Treatment of location savings – EU Member States ................................57 Figure 17. Treatment of business synergies – EU Member States ............................57 Figure 18. Have you treated goodwill as intangible from the transfer pricing
perspective? – EU Member States .......................................................................59 Figure 19. Treatment of workforce – Trade partners .............................................59 Figure 20. Treatment of location savings – Trade partners .....................................60 Figure 21. Treatment of business synergies – Trade partners .................................60 Figure 22.Valuation approaches ..........................................................................63 Figure 23. Usage of main IP valuation methods for TP purposes .............................70 Figure 24. Most important factors in selecting the valuation method .......................71 Figure 25. Are the income-based methods a common practice? – EU Member States 72 Figure 26. Usage of main IP valuation methods for TP purposes – Trade partners .....73 Figure 27. Are the income-based methods a common practice? – Trade partners .....74 Figure 28. Strength and weaknesses analysis of the valuation methods ...................75 Figure 29. How often more than one method is used for valuation of IP for TP
purposes? – EU Member States ..........................................................................81 Figure 30. Importance of using more than one method – EU Member States ............82 Figure 31. Use of more than one method for valuation of IP for TP purposes – Trade
partners ..........................................................................................................82 Figure 32. How often do you use price adjustment clauses in practice? – EU Member
States .............................................................................................................83 Figure 33. How important do you consider the use of price adjustment clauses? – EU
Member States .................................................................................................84 Figure 34. Strengths and Weaknesses analysis of valuation standards .....................90 Figure 35. Frequency of reasonability check on financial data provided – EU Member
States ........................................................................................................... 110 Figure 36. Ways to perform reasonability check of the forecast – EU Member States
.................................................................................................................... 111 Figure 37. Use of operating profit or free cash flow to determine IP value – EU Member
States ........................................................................................................... 112 Figure 38. Pre-tax or post-tax value of IP obtained – EU Member States................ 113

European Commission
Study on the Application of Economic Valuation Techniques for Determining Transfer Prices of Cross Border Transactions between Members of Multinational Enterprise
Groups in the EU
September 2016 – 6
Figure 39. Frequency of reasonability check on financial data provided – Trade
partners ........................................................................................................ 113 Figure 40. Ways to perform reasonability check of the forecast – Trade partners .... 114 Figure 41. Use of operating profit of free cash flow to determine IP value – Trade
partners ........................................................................................................ 115 Figure 42. Pre-tax or post-tax value of IP obtained – Trade partners ..................... 115 Figure 43. Databases used in searches for royalty rates ...................................... 117 Figure 44. Difficulties in finding appropriate royalty rates – EU Member States ....... 118 Figure 45. Acceptability of royalty rates by tax authorities – EU Member States ..... 119 Figure 46. Databases used in searches for royalty rates – Trade partners .............. 120 Figure 47. Acceptability of royalty rates by tax authorities – Trade partners ........... 121 Figure 48. Databases used in benchmarking routine returns ............................... 122 Figure 49. Difficulties in determining routine returns – EU Member States ............. 123 Figure 50. Acceptability of routine benchmarks by tax authorities – EU Member States
.................................................................................................................... 124 Figure 51. Difficulties in determining routine returns – Trade partners ................... 125 Figure 52. Acceptability of routine returns by tax authorities – Trade partners ....... 126 Figure 53. For which types of intangibles is indefinite life applied – EU Member States
.................................................................................................................... 127 Figure 54. Factors determining useful life – EU Member States ............................. 128 Figure 55. For which types of intangibles is indefinite life applied – Trade partners . 130 Figure 56. Factors determining useful life – Trade partners .................................. 131 Figure 57. Use of decay schedule – EU Member States ........................................ 132 Figure 58. Reason for decay schedule – EU Member States .................................. 133 Figure 59. Purpose of depreciation - Trading Partners ......................................... 134 Figure 60. Source of discount rate – EU Member States ....................................... 135 Figure 61. Frequency of challenging the taxpayer-sourced discount rates by valuers –
EU Member States .......................................................................................... 135 Figure 62. Frequency of challenging discount rates (by tax administration) – EU
Member States ............................................................................................... 136 Figure 63. Frequency of using industry-wide rates as discount rate in valuation – EU
Member States ............................................................................................... 137 Figure 64. Use of different discount rates depending on type of IP – EU Member States
.................................................................................................................... 138 Figure 65. Source of discount rate – Trade partners ............................................ 138 Figure 66. Frequency of challenging the taxpayer-sourced discount rates (by Deloitte)
– Trade partners ............................................................................................ 139 Figure 67. Frequency of challenging discount rates (by tax administration) – Trade
partners ........................................................................................................ 140 Figure 68. Frequency of using industry-wide rates as discount rates in valuation –
Trade partners ............................................................................................... 140 Figure 69. Use of different discount rates depending on type of IP – Trade partners 141 Figure 70. Applicable Methods for Testing Intercompany Transfers of Intangible
Property ........................................................................................................ 143 Figure 71. Median costs of valuation study for intangibles from transfer pricing
perspective for tax authorities – EU Member States ............................................ 156 Figure 72. Median costs of valuation study involving a single intangible, from transfer
pricing perspective – EU Member States. ........................................................... 156 Figure 73. Frequency of a taxpayer preparing valuation of intangibles for transfer
pricing purposes internally – Member States ...................................................... 158

European Commission
Study on the Application of Economic Valuation Techniques for Determining Transfer Prices of Cross Border Transactions between Members of Multinational Enterprise
Groups in the EU
September 2016 – 7
List of Tables Table 1. Types of intangibles ..............................................................................41 Table 2. Valuation methodologies for IP ...............................................................65 Table 3. Additional Valuation methodologies ........................................................66 Table 4. OECD characterisation of valuation methods ............................................69 Table 5. Opportunities and threats of valuation methods .......................................77 Table 6. Opportunities and threats of valuation standards ......................................92 Table 7. Relevance of parameters .......................................................................95 Table 8. Example determination royalty rate ...................................................... 100 Table 9. Median costs for IP valuation study ....................................................... 157 Table 10. Capacity building measures at the level of tax authorities – EU Member
States ........................................................................................................... 158 Table 11. Capacity building measures at the level of tax authorities – Trade Partners
.................................................................................................................... 160
European Commission
Study on the Application of Economic Valuation Techniques for Determining Transfer Prices of Cross Border Transactions between Members of Multinational Enterprise
Groups in the EU
September 2016 – 8
Abstract (EN)
This document provides a view on how valuation techniques can practically and most
efficiently be used for transfer pricing purposes in the EU. The information to support
the study was gathered through desk research and interviews with transfer pricing and
corporate finance valuation specialists from all EU Member States and nine of the EU’s
main trade partners. The study investigates the differences between valuations for
transfer pricing purposes and valuations for other purposes, and the state of play in
terms of experience of the EU Member States and trade partners. This was conducted
through four aspects: 1) a SWOT analysis of economic valuation techniques applied in
the context of transfer pricing, 2) the practical application of these techniques in the
EU Member States and trade partners, 3) the identification of potential legislative
measures, and 4) capacity building approaches for tax administrations. The report
concludes with considerations of potential policy actions that could offer helpful
guidance to both tax administrations and taxpayers regarding the valuation of
intangibles for transfer pricing purposes in the EU.
Abstract (FR)
Le présent rapport décrit la manière dont les techniques de valorisation peuvent être
mises en œuvre en pratique et utilisées le plus efficacement en prix de transfert dans
l’UE. Les informations reprises dans cette étude ont été recueillies par des recherches
documentaires et interviews avec des spécialistes en prix de transfert et finance
d’entreprises de tous les états membres de l’UE et neuf de ses partenaires
commerciaux principaux. Le rapport analyse les différences entre les valorisations
effectuées en prix de transfert, d’une part, et celles effectuées à d’autres fins, d’autre
part, ainsi que l’expérience des différents états membres de l’UE et de ses principaux
partenaires commerciaux en la matière. L’étude s’articule autour de quatre aspects: 1)
une analyse SWOT des techniques de valorisation économique appliquées en prix de
transfert, 2) l’application pratique de ces techniques dans les états membres de l’UE et
chez ses partenaires commerciaux, 3) l’identification de mesures législatives
potentielles, et 4) les approches de renforcement des capacités au sein des
administrations fiscales. Le rapport conclut par des considérations d’actions
potentielles qui pourraient fournir une guidance utile tant aux administrations fiscales
qu’aux contribuables en matière de valorisation des actifs incorporels en prix de
transfert dans l’UE.

European Commission
Study on the Application of Economic Valuation Techniques for Determining Transfer Prices of Cross Border Transactions between Members of Multinational Enterprise
Groups in the EU
September 2016 – 9
Executive Summary (EN)
- Premises
Significant changes in the economic environment, driven by the evolution of global
markets and international trade, as well as by rapid technological progress, have led
to the emergence of new complex business models, including company value chains
becoming more integrated and intangible sources of value increasingly driving
business success.
Recent years have also been characterised by increased political attention on harmful
tax competition and profit shifting, urging governments to address aggressive tax
planning and manipulation of prices through intra-group transactions. Intangible
assets have been especially viewed as an important means of shifting profit. By
nature, intangibles are the assets that do not have any physical or financial
embodiment, making it difficult to identify them and determine their value at the time
of the transaction. Moreover, again due to their nature, intangibles are easily movable
between jurisdictions. Thus, much of the current political discourse centres on
transfers of intangible assets and the correct approach to value these assets in
transfer pricing terms.
- Study objectives and methodology
The purpose of this current study is to support the efforts of the European Commission
in exploring options to tackle these issues. Accordingly, it will explore the most
practical and efficient valuation techniques be used for transfer pricing purposes in the
EU. This includes identifying advantages, obstacles and pitfalls of the practical
application of various valuation technique already used in the EU and internationally.
The information to support the study was gathered through desk research and
interviews with transfer pricing and corporate finance valuation specialists from all EU
Member States and nine of the EU’s main trade partners, namely Australia, Canada,
China, India, Japan, Norway, South Korea, Switzerland and the United States. The
answers received were incorporated in the report after careful analysis and
interpretation accompanied by extensive discussions between transfer pricing and
corporate finance experts.
- Approach and factors to consider when performing valuation for transfer pricing purposes
The report starts by investigating the background for performing a valuation for
transfer pricing purposes as opposed to a valuation exercise for other purposes. In this
respect, special focus is given to the purpose of valuation and its main stakeholders,
the standards and concepts of value governing the valuation, and to the definition and
the scope of intangibles in a valuation study.
The effect that these factors may have on the approach to the valuation and on the
type of results achieved was investigated both theoretically and in practice. The study
confirms that these factors may have a significant effect on the practical outcome of
the transaction. Valuations in transfer pricing can be different from valuations for
other purposes in terms of the purpose, stakes and perspectives of the valuators.
Similarly, differences can be noted regarding the evidence needed for documentation
European Commission
Study on the Application of Economic Valuation Techniques for Determining Transfer Prices of Cross Border Transactions between Members of Multinational Enterprise
Groups in the EU
September 2016 – 10
purposes, the background of the transactions, the standards used, the definition of
intangibles, the scope of the valuation itself (having the possibility of aggregating
transactions for transfer pricing purposes) and other factors.
The survey investigated the importance of various factors on the valuation for transfer
pricing purposes. In this respect, it should be first noted that the practice of
intangibles valuation for the purposes of transfer pricing is relatively underdeveloped
in many of EU Member States, with only 13 Member States confirming relatively
significant experience with such valuations, ten countries recording limited or
extremely limited experience and five indicating no such experience at all. On the
other hand, by surveying nine main trade partners of the EU, it was observed that the
practice of IP valuation for the purposes of transfer pricing is also developed only in a
handful of countries.
- Valuation methodologies and standards
In Section 3, the report investigates the use of various valuation methodologies for
transfer pricing purposes. It was observed that the most used methods among the EU
member are the residual value method and the relief from royalty method. It was
found that the most important factor considered when choosing the most appropriate
method to apply is the availability of data.
The study provides a “strengths, weaknesses, opportunities and threats” (“SWOT”)
analysis of the main valuation methods identified for valuation of IP for transfer pricing
purposes. Strengths and weaknesses of the methods were identified by reviewing
them based on their level of economic relevance, objectivity, relative ease of use,
appropriate benchmarks found, market connection and extent of data required for
their application. The analysis identified that there are potential weaknesses for each
method and each of them should be used in accordance with the facts and
circumstances of the valuation. Ideally, the right method to use is the one that gives
the lowest probability of a bias or error, subject to practical considerations (regarding
data availability, timing and budget.) Furthermore, opportunities and threats of using
each of the methods were noted by pinpointing situations where their use is
considered suitable or not.
Potential solutions to identified weaknesses were also identified, such as use of more
than one method in a valuation. It was found that the use of more than one method
(or similarly, a valuation from two-party perspectives) is not widely spread and are
certainly not a norm in the EU (or among trade partners’). For dealing with intangibles
for which valuation is highly uncertain at the moment of the transaction, a remedy
may be also the use of price adjustment clauses. Although most of the EU Member
States do not appear to commonly use these clauses in practice, the vast majority of
the respondents seem to be almost unanimous in attributing at least some importance
to them.
As a related topic, the valuation standards are addressed, focusing particularly on the
use of these standards in valuations of intangibles. A SWOT analysis of standards was
carried out. Strengths and weaknesses were analysed in accordance with nine criteria:
global applicability, range of the intangible assets covered, consistency with other
standards, provision of guidelines on ethical behaviour and quality focus, binding
force, technical guidance, clear definitions, guidance on valuation report content, and
identification of factors important to consider. In the context of this analysis, the
OECD guidance has been considered as one of the standards. It was identified that
only few standards such as IVS (International Valuation Standards), ISO standards
and the OECD TPG have a global reach. The standards also differ greatly in respect of

European Commission
Study on the Application of Economic Valuation Techniques for Determining Transfer Prices of Cross Border Transactions between Members of Multinational Enterprise
Groups in the EU
September 2016 – 11
their consistency with each other and amount of guidance given on the ethical
behaviour and quality. In addition, only a few standards, including IVS, IFRS and
USGAAP provide detailed technical guidance whereas the other standards include only
a high-level guidance on valuation methods and approaches without providing detailed
technical directions. In valuations for transfer pricing purposes, it is not compulsory to
refer to certain valuation standards (with some exceptions). In this respect,
opportunities and threats of using the surveyed valuation standards in the context of
transfer pricing were illustrated. The OECD guidance was found to be applied rather
uniformly in practice across OECD members and observer countries. Adherence to the
OECD guidance is reflected in the national rules on transfer pricing and intangibles.
- Building blocks for building a valuation model
In Section 4, the report produces results of the investigation into the practical
application of the valuation techniques in transfer pricing. Five main building blocks of
valuation models were analysed, namely financial projections, royalties, routine
return, discount rates and useful life of intangibles. From a theoretical background
perspective, it was found that these parameters are generally the same in any
valuation. Based on surveys and interviews in the Member states and trade partner
countries, it was found that in practice, some parameters are documented in a
different manner or with differing degree of detail, depending on the purpose of the
valuation. The findings with respect to these parameters, including the ways to
objectivise them are found in supporting tables in appendix.
- Legislative measures
Section 5 of the report produces results of the investigation of the implementation of
valuation methodologies into the domestic law of the trade partners of the EU. The
potential changes to legislation/administrative guidance on transfer pricing within the
EU was also explored. Further, an overview of any existing legal or administrative
obstacles to the implementation of such changes in the Member States is provided.
It was found that only the US transfer pricing regulations provide a detailed legal
framework for the valuation of intangible assets for transfer pricing purposes. This
covers especially the choice of the right methodology, guidance on the use of financial
projections and on the calculation of the discount rate, accompanied by detailed
examples illustrating the practical application of the methods.
Within the EU, Germany was also found to have implemented specific legislative
measures in relation to the valuation of intangibles. Some aspects of the German
regulations are considered as valuable examples of important legislative measures to
be taken, particularly with regards to the implementation of the two-sided approach,
the treatment of synergies and location savings and the guidance provided on the
calculation of the discount rate.
- Capacity building
Section 6 of the report produces results of the investigation into the capacity building
for Member State tax administrations in IP valuation based on the experiences of the
trade partners’ countries. It also looks at the estimated costs for valuing a transfer of
intangibles.
In the EU, just five out of 28 Member State respondents noted that their country’s tax
administration has the same level of resources available to them as taxpayers. Even if
there is a sufficient number of personnel focusing in transfer pricing, the available
specialists typically lack expertise and experience precisely in valuations in the
transfer pricing context. Among the surveyed trade partners, only two countries

European Commission
Study on the Application of Economic Valuation Techniques for Determining Transfer Prices of Cross Border Transactions between Members of Multinational Enterprise
Groups in the EU
September 2016 – 12
mentioned sufficient resources. It transpires that insufficient resources is a problem
present to more or less an equal degree in the Member States and among the main
trade partners.
- Conclusions and potential policy actions
Based on the information gathered on analysis of legislative measures regulating
valuations of intangibles and on the differences encountered throughout the EU in
performing valuations of intangibles for transfer pricing purposes, the report draws
conclusions and outlines several potential policy actions that would offer guidance to
both tax administrations and taxpayers, making the valuation exercise more
straightforward:
Understanding the general background of a valuation as a starting point of the
valuation exercise, as it is important to acknowledge and understand that the
transfer pricing discipline is based on the detailed analysis of facts and
circumstances, as well as on the functional and risk profile of the parties relevant
to the transaction.
With regards to the general valuation techniques, it is important to understand the
methodologies well, in order to select the most appropriate methodology. This
includes understanding the assumptions retained and the relevant building blocks
for each of the technique. Such an understanding is a key factor to defending the
valuation successfully from a transfer pricing perspective.
With regards to the building blocks, consideration should be given to the
parametrisation of the valuation model and a proper justification is needed to
defend all the parameters. In this respect, good practices exist (with respect to
routine return, royalties, verification of financial data and proper discount rate
studies) and should be further promulgated among transfer pricing practitioners.
With regards to legislative measures, it is considered that the transfer pricing laws
in the US and Germany are a useful starting point in terms of the extent of
guidance provided on the choice and application of valuation methodologies. More
guidance with respect to the building blocks and factors to consider are
recommended, together with practical examples on the application of the methods.
With regards to resources, there is a need for more resources within the tax
administrations to promulgate a correct understanding and use of economic
valuation techniques. This applies to the number of specialists in tax authority
administration as well the skill level of these specialists in valuations of intangibles
for transfer pricing purposes.
European Commission
Study on the Application of Economic Valuation Techniques for Determining Transfer Prices of Cross Border Transactions between Members of Multinational Enterprise
Groups in the EU
September 2016 – 13
Résumé (FR)
- Introduction
D’importants changements dans l’environnement économique, résultant de l’évolution
des marchés mondiaux, et du commerce international et par les progrès
technologiques rapides ont conduit à l’émergence de nouveaux modèles commerciaux
complexes avec, au niveau des entreprises, des chaînes de valeur de plus en plus
intégrées et des sources de valeur intangibles agissant de plus en plus comme le
moteur du succès commercial.
Ces dernières années ont également été caractérisées par une attention politique
accrue envers la concurrence fiscale dommageable et le transfert de bénéfices,
poussant les gouvernements à prendre des actions afin de lutter contre la planification
fiscale agressive et la manipulation des prix de transfert. Les actifs incorporels ont tout
spécifiquement été identifiés comme un moyen de transfert de profit. Par nature, les
actifs incorporels sont des actifs sans représentation physique ou financière, ce qui
rend parfois difficile leur identification et la détermination de leur valeur au moment
de la transaction. En outre, une nouvelle fois en raison de leur nature, les actifs
incorporels sont facilement transférables entre les juridictions. Ainsi, l’attention du
politique a été attirée sur leurs transferts et sur les approches de valorisation, dans un
contexte de prix de transfert.
- Méthodes de valorisation et normes
Dans sa Section 3, le rapport étudie l’utilisation des diverses méthodes de valorisation
en prix de transfert. Il a été observé que les méthodes les plus utilisées parmi les
états membres de l’UE sont les méthodes de valeurs résiduelles et la méthode « relief
from royalty ». Le facteur le plus important remarqué par les répondants pour le choix
de la méthode appliquée est la disponibilité des données.
L’étude fournit une analyse SWOT1 des principales méthodes de valorisation de
propriétés intellectuelles utilisables dans un contexte de prix de transfert. Les forces et
faiblesses des méthodes ont été examinées en fonction de leur niveau de pertinence
économique, de leur objectivité, de leur relative simplicité d’utilisation, de la
disponibilité de références adéquates, de leur lien avec le marché et du volume de
données nécessaires à leur application. L’analyse a identifié qu’il existait des faiblesses
potentielles pour chaque méthode et que chacune d’entre elles devrait être utilisée en
fonction des faits et circonstances. Idéalement, la méthode appropriée est celle qui est
la moins sujette à biais ou erreurs, après toutes considérations pratiques (concernant
les données disponibles, le timing et le budget). De plus, des opportunités et risques
dans l’utilisation de chaque méthode ont été relevés en identifiant des situations où
leur utilisation est appropriée ou non.
Des solutions possibles pour les faiblesses potentielles des méthodes ont été étudiées, telles que l’utilisation de plus d’une méthode de valorisation. Il a été constaté que l’utilisation de plus d’une méthode (ou, alternativement, l’utilisation d’une méthode de la perspective des deux parties) n’est pas très répandue et ne constitue pas la norme dans l’UE (ou ses principaux partenaires commerciaux). Pour traiter les actifs incorporels dont la valorisation est peu certaine au moment de la transaction, un recours peut être d’utiliser des clauses d’ajustement des prix. Bien que la plupart des
1 Strength, Weaknesses, Opportunities and Threats ou Forces, Faiblesses,
Opportunités et Menaces.
European Commission
Study on the Application of Economic Valuation Techniques for Determining Transfer Prices of Cross Border Transactions between Members of Multinational Enterprise
Groups in the EU
September 2016 – 14
états membres de l’UE semble ne pas utiliser ces clauses en pratique, la grande majorité des répondants veut leur attribuer une certaine importance.
A titre corollaire l’utilisation des normes de valorisation a été abordée, dans le
contexte particulier des valorisations d’actifs incorporels. Une analyse SWOT des
normes a été effectuée. Les forces et faiblesses ont été analysées sur base de neuf
critères : l’applicabilité globale, l’étendue des actifs incorporels, la cohérence avec les
autres normes, les recommandations sur le comportement éthique et la qualité, le
caractère obligatoire, les recommandations techniques, les définitions claires, les
recommandations concernant le contenu du rapport de valorisation, et l’identification
de facteurs importants à considérer. À la lumière de cette analyse, les principes
directeurs publiés par l’OCDE ont été considérées comme l’une des normes. Il a été
constaté que seules certaines normes, telles que les normes IVS (« International
Valuation Standards »), les normes ISA and les recommandations OCDE en matière de
prix de transfert ont une portée globale. Les normes diffèrent également de manière
significative de par leur cohérence respective ainsi que par le volume de
recommandations émises en ce qui concerne le comportement éthique et la qualité.
Par ailleurs, seules quelques normes, en ce inclus les normes IVS, IFRS et USGAAP,
décrivent de façon détaillée la guidance technique, les autres normes ne fournissant
que des recommandations basiques sur les méthodes et approches de valorisation. En
ce qui concerne les valorisations à des fins de prix de transfert, il n’est pas requis de
faire référence à certaines normes de valorisation (avec certaines exceptions). À ce
propos, les opportunités et risques d’utilisation des normes de valorisation examinées
dans le cadre des prix de transfert ont été illustrées. Les guidances fournies par
l’OCDE sont en effet utilisées de façon assez uniforme par les états membres de
l’OCDE et par les pays «observateurs». L’adhésion aux recommandations de l’OCDE
est généralement reflétée dans les règles nationales sur les prix de transfert et les
actifs incorporels.
- Objectifs du rapport et méthodologie
L’objectif du présent rapport est de soutenir les efforts de la Commission Européenne
dans l’exploration de solutions permettant de résoudre ces problèmes. À cette fin,
l’étude déterminera les techniques de valorisation les plus pratiques et efficaces en
prix de transfert dans l’UE. Ceci comprend l’identification des avantages, des obstacles
et des difficultés dans l’application pratique des techniques de valorisation utilisées au
niveau européen et mondial.
Les informations reprises dans cette étude ont été recueillies au travers de recherches
documentaires, suivie par des interviews avec des spécialistes prix de transfert et en
finance d’entreprises de tous les états membres de l’UE et neuf des principaux
partenaires commerciaux de l’UE, à savoir l’Australie, le Canada, la Chine, l’Inde, le
Japon, la Norvège, la Corée du Sud, la Suisse et les Etats-Unis. Les réponses reçues
ont été incorporées dans le rapport après analyse détaillée et interprétation, ainsi que
des discussions approfondies entre les experts en prix de transfert et financement
d’entreprise.
- Approche et facteurs à considérer dans le cadre des valorisations effectuées à des fins de prix de transfert
Le rapport examine d’abord le contexte dans lequel une valorisation à des fins de prix
de transfert doit être réalisée par opposition aux valorisations préparées à d’autres
fins. En effet, dans une valorisation, une attention particulière est accordée à ses
objectifs et ceux de ses principaux protagonistes, aux normes et concepts de valeurs
retenus et à la nature et l’étendue des actifs incorporels.

European Commission
Study on the Application of Economic Valuation Techniques for Determining Transfer Prices of Cross Border Transactions between Members of Multinational Enterprise
Groups in the EU
September 2016 – 15
L’impact que ces facteurs peuvent avoir sur l’approche et sur les résultats a été étudié
tant en théorie qu’en pratique. L’étude confirme que ces facteurs peuvent avoir un
effet significatif sur les résultats de la transaction. Les valorisations pour les prix de
transfert peuvent être différentes des valorisations à d’autres fins en termes
d’objectifs, d’enjeux et de perspectives des experts. De même, des différences
peuvent exister en ce qui concerne les éléments de preuve nécessaires à des fins de
documentation, de contexte des transactions, de normes utilisées, de définition des
actifs incorporels, de portée de la valorisation même (en ayant la possibilité d’agréger
les transactions en prix de transfert) et d’autres facteurs.
L’enquête a examiné l’importance des différents facteurs sur la valorisation en prix de
transfert. A cet égard, il convient tout d’abord de souligner que la pratique de
valorisation des actifs incorporels en prix de transfert est relativement sous-
développée dans la plupart des états membres de l’UE, avec seulement treize états
confirmant une expérience relativement importante en la matière, dix états
enregistrant une expérience limitée ou extrêmement limitée et cinq états indiquant ne
pas avoir d’expérience. D’autre part, sur interrogation des neuf principaux partenaires
commerciaux de l’UE, il apparaît que la pratique de valorisation de la propriété
intellectuelle en prix de transfert est seulement développée dans une poignée de pays.
- Paramètres principaux d’un modèle de valorisation
Dans sa Section 4, le rapport décrit les résultats de l’enquête sur l’application pratique
des techniques de valorisation en prix de transfert. Cinq paramètres principaux d'un
modèle de valorisation ont été analysés, à savoir les projections financières, les
redevances, le rendement de routine, les taux d’actualisation et la durée de vie utile
des actifs incorporels. D’un point de vue théorique, il a été constaté que ces
paramètres sont généralement les mêmes pour chaque modèle de valorisation. Sur
base des enquêtes et entrevues menées, il a été constaté qu’en pratique certains
paramètres sont documentés de manières différentes ou avec des niveaux de détail
différents, en fonction de l’objectif de la valorisation. Les conclusions concernant ces
paramètres, en ce inclus la manière de les objectiver, sont fournis dans les tableaux
en annexe.
- Mesures législatives
La Section 5 du rapport examine la transposition des méthodes de valorisation dans le
droit national des partenaires commerciaux de l’UE et explore tout changement
potentiel dans la législation ou directives administratives sur les prix de transfert au
sein de l’UE, ainsi que tout obstacle légal ou administratif à la mise en œuvre de ces
changements dans les états membres.
Il a été constaté que seule la réglementation prix de transfert des Etats-Unis fournit
un cadre légal pour la valorisation d’actifs incorporels à des fins de prix de transfert.
Cela couvre notamment le choix de la méthodologie la plus appropriée, la guidance
sur l’utilisation des projections financières et sur le calcul du taux d’actualisation,
accompagnés d’exemples détaillés illustrant l’application pratique des méthodes.
Au sein de l’UE, il a été constaté que l’Allemagne a mis en œuvre des mesures
législatives spécifiques en ce que concerne la valorisation des actifs incorporels.
Certains aspects de la réglementation allemande sont considérés comme de bons
exemples de mesure législative, plus particulièrement au niveau de la mise en œuvre
d’une approche bilatérale au traitement des synergies et des économies de
localisation, ainsi qu’au niveau des recommandations spécifiques fournies sur le calcul
des taux d’actualisation.
European Commission
Study on the Application of Economic Valuation Techniques for Determining Transfer Prices of Cross Border Transactions between Members of Multinational Enterprise
Groups in the EU
September 2016 – 16
- Renforcement des capacités
La Section 6 du rapport examine le renforcement des capacités des administrations
fiscales des états membres en matière de valorisation d’actifs incorporels, sur base de
l’expérience des pays partenaires commerciaux. Cette section estime également les
coûts relatifs à l’évaluation d’un transfert d’actifs incorporels.
Dans l’UE, seuls cinq des 28 états membres ont indiqué que l’administration fiscale de
leur pays disposait du même niveau de ressources que les contribuables. Cependant,
bien qu’il y ait un nombre suffisant de personnes spécialisées en prix de transfert, ces
spécialistes semblent manquer parfois d’expertise et d’expérience en matière de
valorisation dans un cadre de prix de transfert. Parmi les partenaires commerciaux
interrogés, deux pays seulement ont fait mention des ressources suffisantes,
suggérant que le problème de ressources était présent à un degré plus moins égal
auprès des états membres de l’UE et ses partenaires commerciaux.
- Conclusions et actions possibles
Sur base des informations recueillies concernant l’analyse des mesures législatives en
matière de valorisations d’actifs incorporels et les différences identifiées au sein de
l’UE à ce propos, le rapport conclut et suggère plusieurs actions potentielles qui
permettraient d’offrir des considérations utile aux administrations fiscales et aux
contribuables et de rendre l’exercice de valorisation plus simple:
Prendre le contexte général d’une valorisation comme point de départ de
l’exercice, étant donné qu’il est important de reconnaître que la discipline des prix
de transfert est basée sur une analyse détaillée des faits et circonstances, ainsi
que sur le profil fonctionnel et de risques des parties participant à la transaction.
Concernant les techniques générales de valorisation, il est crucial de bien
comprendre les méthodes, en vue de sélectionner la méthodologie la plus
appropriée. Ceci comprend la compréhension des hypothèses et des paramètres
dans chacune de ces techniques. De fait, une telle compréhension est un facteur
clé pour arriver à une valorisation en prix de transfert fiable.
Concernant les éléments constitutifs, une attention particulière doit être portée au
paramétrage du modèle de valorisation et au support desdits paramètres. A cet
égard, il existe des bonnes pratiques (en ce qui concerne le rendement de routine,
les redevances, la vérification des données financières et les déterminations de
taux d’actualisation). Celles-ci sont davantage divulgués parmi les praticiens prix
de transfert.
Concernant les mesures législatives, les règlementations des prix de transfert aux
Etats-Unis et en Allemagne peuvent être considérées comme point de départ utile
en termes de guidance sur le choix et l’application des méthodes de valorisation.
Davantage de guidance en ce qui concerne les paramètres à prendre en
considération serait recommandée, ainsi que des exemples pratiques sur
l’application des méthodes.
En ce qui concerne les ressources, il est nécessaire d’accroître celles-ci au sein des
administrations fiscales afin de divulguer une compréhension et une utilisation
correcte des techniques de valorisation économiques. Cela s’applique tant pour le
nombre de spécialistes au niveau des autorités fiscales que pour leur niveau de
connaissance en la matière.

European Commission
Study on the Application of Economic Valuation Techniques for Determining Transfer Prices of Cross Border Transactions between Members of Multinational Enterprise
Groups in the EU
September 2016 – 17
1. Introduction
1.1 Context
Intangibles and transfer pricing 1.1.1
The taxation of multinational companies has come under scrutiny by tax
administrations, tax experts and the general public in recent years. More and more
evidence suggests that considerable amounts of corporate income from cross-border
activities can avoid taxation. In a world of increasingly integrated national economies,
rapidly progressing technology, and growing transportation and communication,
Multinational Enterprises’ (MNEs) role in international cross-border trade has become
ever more important, intra-group transactions have multiplied and multinationals'
integrated value chains make it more difficult to determine where profits are created.
Intra-group transactions have brought attention to “transfer pricing” methods applied
in “controlled” transactions between associated enterprises, as opposed to pricing
methods that would apply in “uncontrolled” transactions (i.e. established between
unrelated parties who act independently and whose transaction price is assumed to be
set on an open-market). A transfer price is a price of an intra-group cross-border
transfer of goods, intangibles or services.2 Due to the fact that the parties to the
transaction are related, the transfer price is not inherently a market price. Setting a
transfer price too high or too low may impact the tax base of the companies which are
parties to transaction, in their respective countries. As such, the importance of the
transfer price initially stems from the necessity to establish income and expenses and
therefore a company’s taxable profits.
Tax administrations now struggle to determine within the current set of international
tax rules, the extent of taxable income and where these monies should be taxed. The
interaction between different sets of domestic rules leads to gaps and mis-matches
that allow multinationals to take advantage of methods to eliminate or significantly
reduce taxation.3 As the corporate tax rate is generally imposed on the net profits
obtained by the company in one jurisdiction, one of the most significant methods of
base erosion is profit shifting.
In order to deal with transfer pricing taxation issues, the Organisation for Economic
Cooperation and Development (OECD) has established the “arm’s length principle” as
an international standard for setting the price in controlled transactions. The arm’s
length principle works effectively in the majority of cases, but there are significant
situations in which the application of this principle is more complicated and difficult,
for instance when a comparable “uncontrolled” transaction does not exist. This is the
case when the companies are dealing with highly specialised goods, unique intangibles
or the provision of specialised services.4
2 UN (2011), at 2. 3 OECD, Addressing BEPS, at 4. 4 See OECD TPG, paragraphs 1.9-1.11, where the OECD states that this is the case
when the companies are dealing with highly specialised goods, unique intangibles or
the provision of specialised services; see also OECD, Scope of work for guidance on
the transactional profit split method, para. 1-2, where the OECD states that the
transactional profit split method could be the most appropriate method in cases where
the parties to the transaction make unique and valuable contributions.

European Commission
Study on the Application of Economic Valuation Techniques for Determining Transfer Prices of Cross Border Transactions between Members of Multinational Enterprise
Groups in the EU
September 2016 – 18
Certain economic developments have created additional challenges for transfer pricing
and enforcement of the arm’s length principle – among them, the emergence of
“virtual” business models5 and the dematerialisation of certain goods, services and
economic activities6. In this context, the treatment of intangibles is even more
significant. The current business landscape is based more and more on intangible
assets as an important source of economic growth and innovation. At the corporate
level, particularly in the case of multinationals, there has been a steep increase in the
importance of intangibles in the overall business. Therefore, enterprises are now
compelled to focus on growth through innovation which implies heavy investments in
intangible assets. In fact, intangibles may be regarded as representing the main
element of competitiveness and acting as an important value driver for enterprises. In
addition, in attempts to stay competitive, enterprises seek solutions in their business
models for optimising the tax benefits associated with intangible assets and thus,
reducing the corporate tax burden.7
At the governmental level, originally, tax regimes were predominantly designed to
deal with physical flows of goods, with products being manufactured and distributed in
physical locations. The shift to an increasingly digitalised environment and the growing
importance of intangibles in recent years has reduced the relevance of traditional tax
systems.8
Transfer pricing of intangibles has always been considered a complex issue due to the
specifics of transactions involving intangibles. Intangibles are assets that do not have
any physical or financial embodiment.9 Thus, this “special character” makes it difficult
to determine their value at the time of a transaction.10 Moreover, the (re)location of
intangible assets is easier than for tangible (e.g. machinery, factories) assets.11 This
situation strengthens the likelihood that assets are transferred for less than their full
(or market) value or that there is a contractual allocation of intangibles to low-tax
environments in transactions that would be unlikely to occur between unrelated
parties.12
BEPS and valuation of intangibles 1.1.2
As explained above (Section 1.1.1), transfer pricing of intangibles is a topic of interest
in relation to profit shifting. For this reason, the OECD identified transfer pricing of
intangibles as a key area of concern for governments as well as for taxpayers. Due to
the lack of international guidance on the matter, especially on the definition of
intangible assets, identification and valuation of intangibles for transfer pricing, the
OECD has embarked on designing a framework of guidelines to put at the disposal of
tax authorities and taxpayers.13
5 Refers to business models adopted by groups operating in the digital world. 6 Refers to cross-border transactions of digital goods and services. 7 Ibid. 8 European Parliament, Tax policy in the EU. Issues and challenges, February 2015, at
4. 9 OECD, New sources of growth: intangible assets, at 1. 10 OECD TPG, para. 6.13. 11 European Commission, COMMISSION STAFF WORKING DOCUMENT, SWD (2015)
302 final, at 8. 12 OECD, Action Plan on Base Erosion and Profit Shifting, at 19-20. 13 OECD, Action Plan on Base Erosion and Profit Shifting, at 10-11.

European Commission
Study on the Application of Economic Valuation Techniques for Determining Transfer Prices of Cross Border Transactions between Members of Multinational Enterprise
Groups in the EU
September 2016 – 19
With international tax issues gaining significant political attention worldwide, in
addition to the efforts of the OECD, individual governments across the world have also
increased their focus on this issue. In Europe, the Action Plan of the EU Commission
recognises the following challenges:14
Significant tax revenue losses for the Member States;
Economic double taxation15 for multinational corporations, resulting from disputes
between two countries on the determination of the arm’s length remuneration for
their cross-border transactions with associated enterprises;
Heavier taxes for European citizens and local companies;
Competitive distortions for businesses not engaged in aggressive tax planning; and
A perceived lack of fairness, which in turn may have an impact on overall tax
compliance.
As a result, there is a growing focus on strengthening the rules and guidance on
corporate taxation by improving regulation and enforcement of transfer pricing both at
an international and European level. This has resulted in the launch of the following
initiatives:
OECD Base Erosion and Profit Shifting (“BEPS”) Action Plan;16 and
EU Commission's Action Plan.17
BEPS is the main result of aggressive tax planning, a practice that the OECD is actively
trying to combat. In the field of transfer pricing, BEPS is achieved mainly through
shifting risks and intangibles, artificially splitting the ownership of assets between legal
entities and entering into transactions that would not take place between independent
parties.18
BEPS has become the centre of the OECD’s concerns because of its multiple
implications. BEPS leads to lower tax revenue in high-tax jurisdictions, distorts
competition among businesses and raises questions of tax fairness. The international
tax system is considered to no longer reflect the way MNEs operate, as the distribution
of the global profits is fictional and driven by tax purposes.19
Intangible assets play a prominent role in transfer pricing strategies as their unique
characteristics make it more difficult to find comparable transactions on the open
market, an issue which leads to a greater scope for manipulation of values than in the
case of tangible assets.20 Recent econometric evidence illustrates the importance of
14 European Commission, Communication from the Commission to the European
Parliament and the Council, COM (2015) 302 Final. 15 Economic double taxation refers to the taxation of two different taxpayers with
respect to the same income (or capital). On the other hand, juridical double taxation
refers to circumstances where one taxpayer is subject to tax on the same income (or
capital) in more than one jurisdiction. 16 OECD, Action Plan on Base Erosion and Profit Shifting. 17 European Commission, Communication from the Commission to the European
Parliament and the Council, COM (2015) 302 Final. 18 Van den Brekel (2013). 19 UN (2011), page 2; See also European Parliament, Tax policy in the EU. Issues and
challenges, at 4. 20 Lohse et al. (2013), at 8-9.

European Commission
Study on the Application of Economic Valuation Techniques for Determining Transfer Prices of Cross Border Transactions between Members of Multinational Enterprise
Groups in the EU
September 2016 – 20
profit shifting through the strategic location of intangibles. For instance, Karkinsky and
Riedel (2012)21 find that an increase of 1 percentage point of the corporate tax rate
reduces the number of patent holdings by about 3.5%. The estimates in Böhm et al.
(2012)22 for Europe indicate that the probability of patent relocation to a tax haven is
increasing with the value of the patent and that controlled foreign company (CFC) -
legislation may be effective in reducing this form of profit shifting. Subsequent to
these results, OECD’s BEPS Action Plan devoted special attention to transactions with
intangibles.
A specific part of the BEPS Action Plan (Action 8) focuses on changing the OECD
Transfer Pricing Guidelines (“TPG”)23 and possibly the OECD Model Tax Convention24 to
prevent BEPS when multinational groups move intangibles among the group members,
in order to ensure that transfer pricing outcomes are aligned with value creation.
A concrete accomplishment of Action 8 was the revision of Section VI of the TPG
“Intangibles”, which contains guidance focused on ensuring that the profits associated
with the transfer and use of intangibles are appropriately allocated in accordance with
value creation, as well as a new approach to address transfers of hard-to-value
intangibles. The targeted changes to the OECD TPG include the following:25
Clarify the definition of intangibles;
Provide guidance on identifying transactions involving intangibles;
Provide supplemental guidance for determining arm’s length conditions for
transactions involving intangibles; and
Clarify the treatment of local market features and corporate synergies.
Therefore, an important aspect of the BEPS Action Plan was represented by the
valuation of intangibles for transfer pricing purposes. This has been reflected in the
new Section VI through a framework for establishing appropriate arm's length prices
for intra-group transactions of intangibles.26 Among the recommendations of the
revised Section VI, there is a reference to economic valuation techniques based on the
discounted value of projected income streams or cash flows derived from exploitation
of the intangibles being valued, as “particularly useful” tools.27
1.2 Objectives and Scope of the Study
The purpose of the present study is to support the efforts of the European Commission
in exploring options to tackle the issues associated with transfer pricing in the EU. The
study objectives are to evaluate the practical application of various transfer pricing
valuation techniques and to conclude on the most efficient and practical application of
these techniques for the EU. This includes identifying the advantages, obstacles and
21 Karkinsky et al (2012), at 176–185. 22 Böhm et al (2012). 23 OECD, OECD Transfer Pricing Guidelines for Multinational enterprises and Tax
Administrations. 24 OECD, Model Convention with respect to Taxes on Income and on Capital. 25 Deloitte, United States Tax Alert. OECD Releases Final BEPS Reports, October 6,
2015. 26 OECD, Aligning transfer pricing outcomes with value creation, page 63 27 OECD, Aligning transfer pricing outcomes with value creation, section D.2.6.3 –
D.2.6.4.
European Commission
Study on the Application of Economic Valuation Techniques for Determining Transfer Prices of Cross Border Transactions between Members of Multinational Enterprise
Groups in the EU
September 2016 – 21
pitfalls in the practical application of the various valuation techniques for intangibles in
the transfer pricing context.
Intangible assets (i.e. “intangibles” or “IP”), refer to intangible assets and/or property
not limited to Intellectual Property (IP). Whereas IP is a result of conscious human
creative activity (e.g. patents, brands, designs, logos, etc.), intangible property can be
a result of business activities (such as, for instance, contractual arrangements and
rights, or arguably simply favourable economic circumstances (access to local
market)). As such, intangible property is wider in scope than IP: all types of IP are
intangible property whereas the opposite is not true. In this respect, the study
addressed the transfers of intangible assets in general, as inter-company transactions
are not limited to transfers of IP. More information on the definition of intangible
assets can be found in Section 2.2.5.
The present study’s objective and activities were based on and aligned with the
conclusions of the Expert group on Intellectual Property Valuation, created by the EU
Commission Directorate-General for Research and Innovation. In the present report,
the conclusions and observations of the expert group’s final report (“hereinafter, the
“RTD report”) are referenced where relevant.
The key activities of the study are as follows:
Identifying key differences in the general approach, basis of value, stakeholders
and stakes at hand in the case of the valuation of intangibles for transfer pricing
purposes as opposed to general valuation practice;
Providing an overview of the economic valuation techniques applied in the context
of transfer pricing within the 28 EU Member States, analysing their strengths and
weaknesses, opportunities and threats (“SWOT”) and exploring and reviewing the
different standards available both at European and international level, illustrated
by examples and cases;
Studying the practical application of valuation techniques in transfer pricing
including identification of the various parameters under each of the key building
blocks of such valuations (projections of future cash flows including growth rates,
determining a discount rate, the useful life of intangibles and terminal values of
the valuation techniques, etc.) and elaborating on the information, which is needed
for estimating the parameters of these building blocks;
Identifying legislative measures implemented into domestic law of major non-EU
States and exploring any potential changes to legislation/administrative guidance
on transfer pricing within EU, as well as existing legal or administrative obstacles
to the implementation of such changes in the specific Member States; and
Commenting on the capacity building of tax administration based on the situations
in non-EU Member States’ and estimating the costs to be expected for valuing a
transfer or use of intangibles.
Providing high-level considerations with respect to the aspects addressed above
that could help support the use of economic valuation techniques in the EU
Member States.

European Commission
Study on the Application of Economic Valuation Techniques for Determining Transfer Prices of Cross Border Transactions between Members of Multinational Enterprise
Groups in the EU
September 2016 – 22
1.3 Work performed and methodology
The study was performed through the following steps:
1. Data Collection & Analysis:
- Desk research and literature review;
- Design and drafting of the survey addressing the study’s objectives;
- Face-to-face or phone interviews with experts in transfer pricing and / or
corporate finance at the level of the Deloitte offices in the EU Member
States and in the EU Main Tarde Partners;
- Analysis and conclusions from the survey responses, interviews and desk
research;
2. Expert Discussion:
- The study team engaged in extensive discussions with experts in transfer
pricing and corporate finance with respect to the issues covered and
preliminary findings of the study;
- The study team partook in discussions with key experts / quality reviewers
on several aspects of the report (US TP regulations, German TP regulations,
overall structure and scope of the report, key findings of the report);
- Refinement of the analysis and findings based on expert input.
3. Final report drafting: including reviews by two experts in transfer pricing and
valuation techniques;
4. Thorough discussion with the Commission on the findings and structure of the
study, including cooperation with finalisation of the report.
In order to collect information and prepare an overview of the theoretical framework,
desk research was performed focusing on the specific topics covered by the study.
This included the detailed review of the TPG, the relevant US and German rules and
regulations, overview of regulations in other countries, various valuation standards as
well as economic literature on the topic including several valuation manuals, valuation
research, and opinion articles, etc.
For the collection of data in the Member States and third countries, a 100-question
detailed survey (found in Appendix 1 – Survey) aimed at experts covering all topics
required for successful completion of this study. The survey was completed by legal
professionals of the Deloitte network.
The aim of the survey was to identify the legislative framework and existing practice
with respect to valuations of intangibles for transfer pricing purposes. More precisely,
the survey focused on the following items:
(i) Background information - overall experience in respect of valuations of
intangibles for transfer pricing and the experts involved in such project;
(ii) Intangibles covered - focusing on the experience of the countries with respect
to various types of intangibles and the position taken regarding special items
such as goodwill, location savings, and workforce;
(iii) Practice of reconciling transfer pricing valuations with the valuations for other
purposes - the extent of the use of valuations for other purposes (such as
Purchase Price Allocation studies or PPAs) in transfer pricing. This section also
included questions on the minimum background information collected for a
valuation study;

European Commission
Study on the Application of Economic Valuation Techniques for Determining Transfer Prices of Cross Border Transactions between Members of Multinational Enterprise
Groups in the EU
September 2016 – 23
(iv) Approach to selecting the method for valuation in transfer pricing, including the
important factors to consider in this respect and the use of main types of
methodologies;
(v) Practice of the countries with the two-sided approach and importance assigned
to this approach;
(vi) Parameterisation of the five identified building blocks or parameters: financial
and forecast, royalty, routine return, time horizon and useful life of intangible,
and discount rate;
(vii) Standards - the use of valuation standards in studies for transfer pricing
purposes;
(viii) Capacity building, including the information on the existing resources and their
competencies at the level of taxpayers and local tax administrations;
(ix) Legislative background, rules and regulations in the country.
The surveys were circulated to the heads of the TP practices in each of 28 Member
state and each identified non-EU trade partner country.
The answers to the survey were collected through interviews (face-to-face or via call)
with Transfer Pricing and/or Corporate Finance valuation specialists from the 28 EU
Member States and from identified non-EU’s main trade partners. The respondents
were encouraged to provide examples to illustrate their answers and points. The
drafted written answers were then sent to the countries to be reviewed and
supplemented with additional details from both TP and valuation specialists. The
collected responses were analysed and interpreted by the project team to be reflected
in the current report. In this respect, where deemed useful, a visual illustration of
results is presented.
1.4 Limitations of the study
The main goal of the study is to understand the way and to what extent the economic
valuation methods and techniques are currently being used for transfer pricing
valuations and what can be done in order to make their use more wide-spread without
jeopardising the quality of the transfer pricing analysis. In this respect, at least in the
overview of the practical experience, the study does not focus on or explore fully the
general valuation practice in respect of valuation for other purposes.
Related to this, purchases of entire businesses or valuation of the shares in companies
were not directly addressed, as they generally do not qualify as a transaction from the
transfer pricing perspective. Experience shows that a valuation of shares is rarely
performed or analysed by transfer pricing specialists nor performed in line with the
TPG and the local transfer pricing rules or regulations.
However, to the extent that valuations of intangibles for transfer pricing purposes
were a part of or involved a valuation of a business activity or full business, the study
has covered these aspects.
As with any research project, there are practical limitations regarding data collection.
The key data collection tools employed for this study were desk research by the core
study team and the completion of an extensive survey by the Deloitte network of
transfer pricing and valuation practitioners in the Member States and relevant third
countries. In the context of the survey, Deloitte practitioners were asked to comment
not only on their direct experience, but also on any other relevant experiences they

European Commission
Study on the Application of Economic Valuation Techniques for Determining Transfer Prices of Cross Border Transactions between Members of Multinational Enterprise
Groups in the EU
September 2016 – 24
may be aware of in their respective countries, with the aim of reducing and eliminating
(to the extent this is possible) potential biases related to specific experience of one or
several persons. Even if the report is believed to be fairly representative of the current
EU transfer pricing landscape, it cannot be construed as exhaustive.
While this study is based on research undertaken by a Deloitte project team and
survey responses from the Deloitte network, its intention is not to provide a Deloitte-
only view on the topics in the scope. Instead, the research and survey methodology
have been specifically set up in order to obtain a fair representation of the transfer
pricing landscape in the EU and in the EU’s main trade partners, to the best of the
knowledge of the writers of this report and the interviewees. In certain areas, the
project team has performed additional analysis in addition to the views expressed by
the survey respondents or set out in the literature reviewed. Where this concerns key
aspects in the report, it has been clearly identified in the report (for example, by
prefacing such comments with “The study team’s analysis” or similar wording).

European Commission
Study on the Application of Economic Valuation Techniques for Determining Transfer Prices of Cross Border Transactions between Members of Multinational Enterprise
Groups in the EU
September 2016 – 25
2. Similarities and differences in valuation approach and basis of value
2.1 Introduction
The section aims to introduce the practice of valuation of intangibles in transfer pricing
by first analysing the common points and the differences between valuations for other
purposes and valuations for transfer pricing purposes. In this respect, the study
presents the theoretical premises on which valuations are based and, in particular,
first attempts to clarify the impact of ‘valuation cause’ and main stakeholders
involved. In addition, the scope and concepts of value used in the context of transfer
pricing compared to valuation for other purposes are explained. The similarities and
differences of these elements are analysed.
In the second part of the section, practical observations collected through surveys are
presented to illustrate the degree of experience registered in the EU Member States
with valuations for transfer pricing and the observed similarities and specific
differences between valuations for transfer pricing purposes vis-à-vis valuations
prepared for other purposes.
2.2 Theoretical premises
As stated in Section 1 above, the purpose of this study is to investigate the practice of
valuation of intangibles for transfer pricing purposes. The RTD report states that
“concrete valuation cause (which means the concrete reason why the Intellectual
Property valuation is performed) predetermines the information to be considered in
the valuation and the addressee of the value information. The valuation purpose also
defines the role of the valuer as a consultant, an arbitrator or a neutral expert.” 28 As
a result, “each case for valuation requires investigation rather than having an
automated approach to IP valuation.”29
Understanding this premise and why purpose of valuation appears to be of ultimate
importance provides an important framework for guiding the objectives of the present
study. This is a topic that has caught the attention of many authors and is addressed
in business, tax and economic literature. Therefore, the main reason why purpose of
valuation, i.e. transfer pricing, is important according to principal literature30 is set out
below. It appears that the key reasons for a difference between valuations for the
purpose of transfer pricing and general valuations stem from the following main
aspects:
(1) Differences in context/situation arising and hence in the scope of the valuation
exercise;
(2) Differences in the interest of the stakeholders (of the valuation exercise) and,
also the audience to which the valuation study is addressed to. For instance,
the (ultimate) audience of the study are the tax authorities in the case of a
valuation for transfer pricing purposes and the financial regulatory authorities –
for valuations for financial statements. The stakeholders that referred to are
28 The RTD report, at 81. 29 The RTD report, at 5. 30 Primarily based on the RTD report, Finan et al (2011), Dembitz (2003) and
Wittendorff (2010).
European Commission
Study on the Application of Economic Valuation Techniques for Determining Transfer Prices of Cross Border Transactions between Members of Multinational Enterprise
Groups in the EU
September 2016 – 26
the company’s management which gives a mandate to perform the study (such
as tax management in case of transfer pricing valuations and financial
management requesting a study for financial statements);
(3) Differences in the concepts / bases of value (i.e. Fair / Market Value and Arm’s
Length) that the valuers adhere to;
(4) Closely related to the aspects above, adoption of the two-sided approach by a
valuer;
(5) Differences in scope of intangibles to be valued and special items (such as
workforce, location savings, business synergies and goodwill).
These aspects are explored in detail below.
As a general comment, in any valuation, independent of its precise purpose, a valuer
attempts to estimate an appropriate value. In general valuations, this exercise, by its
set up, typically takes place already in a third party context (i.e. a valuation of assets
of a potential acquisition target, or valuation of patents in the context of infringement
claim, etc.). In transfer pricing, a key underlying premise is to establish pricing that
would be adopted by third parties. Thus, adhering to this principle, a transfer pricing
specialist, performing a valuation or determining the pricing for an intra-group
transaction, including a transfer of intangibles, would use reasonable efforts to seek
adequate references to similar transactions between unrelated parties, and the pricing
thereof. In essence, any valuation, independent of its purpose, should be carried out
in a similar manner. Accordingly, in the study team’s analysis of literature and survey
responses, key similarities in theoretical and practical aspects of valuations for general
purposes and valuation for transfer pricing are underlined.
In this context, it is also crucial to note that “valuations for other purposes” do not
reflect a monolithic approach in terms of valuation methods, inputs, analysis etc.
Valuation standards provide an increasingly structured approach to prepare such
valuations, but, as discussed later (in Section 3), they are not necessarily prescriptive
or highly detailed, which leaves considerable room for varying practical applications
depending on jurisdiction, context, etc.
Situation-specific cause 2.2.1
Valuations of both businesses and intangible assets are in general performed for a
wide variety of purposes, including Mergers & Acquisitions (M&A), disputes and
litigation, financial reporting, non-transfer pricing tax purposes and other statutory
regulations.
The RTD report presents a grouping of the key causes for valuation of intangibles,
including internal or management-related causes, enterprise-related causes, transfer-
oriented causes or conflict-oriented causes. The main features of these causes are
commented upon however reference is made to the RTD report for more detail.
Depending on the situation, the valuation may have a “voluntary”31 character (such as
for instance, a valuation of IP portfolio made by the internal IP department inform
management), or “involuntary” (such as valuation of IP for the claim of infringement
or litigation). (This terminology is used by the RTD report; an alternative but
31 The RTD report at 13.

European Commission
Study on the Application of Economic Valuation Techniques for Determining Transfer Prices of Cross Border Transactions between Members of Multinational Enterprise
Groups in the EU
September 2016 – 27
equivalent terminology is to look at valuations that are “optional” and valuations that
are “required by law”). Another distinction stemming from the situation or the context
of the valuation is the requirement for an external third-party view to be adopted to
perform a valuation (which is a statutory requirement in many cases), and related to
that, the rigour and approach to objectivising the inputs for analysis that, ultimately,
result in a higher or lower degree of subjectivity of a valuation analysis.
As an example, some of the most detailed guidance on valuation of intangible assets
has been developed for the purpose of, or is used in the context of purchase price
allocations and impairment tests under various financial reporting frameworks (in
particular International Financial Reporting Standards (IFRS and US Generally
Accepted Accounting Principles (GAAP)), which themselves aim at reflecting values
and prices obtainable in an open market. There are however significant transactions
in which intangible property is valued and priced, which do not fall under the scope of
financial reporting technical guidance, such as unrelated party transactions in
portfolios of patents, disputes regarding the value of IP in the context of infringement
cases, joint ventures focused on technologies in development, etc.
According to the RTD, transfer pricing belongs to the “transfer-oriented” causes. The
transfer pricing purpose of a valuation differentiates itself from the general transfer
purpose through the fact that the buyer and the seller of the transaction are already
known and they are related parties. This, firstly, implies that “the IP owner is not
acting alone any longer in his decisions concerning the economic conversion of the IP.”
The IP owner, the seller, is not independent of the second party of the transaction, i.e.
the buyer. Thus, “high yardsticks are set” to the objectivizing the values.32
In practice, as reflected in the findings below, the objectivizing the parameters and
assumptions is reflected in the detailed factual, function and risk analysis that is
provided as part of a transfer pricing study. Since it is a good practice to justify
assumptions for any valuation, it seems that a solution to reconcile differences
stemming from different situations may be to adopt the most scrupulous approach to
documenting and objectivizing the assumptions and analysis behind them.
Stakeholders of valuation33 2.2.2
In addition to the situation and context of the valuation, the stakeholders who will be
interpreting and applying the results of valuation may also have an influence on the
valuation analysis. Such stakeholders include the audience for whom the valuation is
intended, as well as the company’s responsible giving a mandate for such valuation.
For instance, a valuation for financial statement purposes is performed under a
mandate from financial management and is intended to pass a check of a financial
regulatory agency, such as SEC in the US and Financial Services Authority in the UK,
and Financial Supervisory Authority in Sweden. In case of valuations for transfer
pricing purposes, it is typically tax management of the company who gives a mandate
and the valuation is intended to be presented to country’s local tax administration.
Due to different stakeholders, an approach and a result of valuation performed for
financial reporting purposes may be not the same as the valuation for transfer pricing
purposes that is prepared by the same company’s corporate tax department.
32 The RTD report, at 13. 33 Based on Dembitz (2003).

European Commission
Study on the Application of Economic Valuation Techniques for Determining Transfer Prices of Cross Border Transactions between Members of Multinational Enterprise
Groups in the EU
September 2016 – 28
To take one example of how the conflicting interests matter, assume that the
valuation for financial statements is performed following a “business combination” (i.e.
acquisition of a company), under IFRS or US GAAP. In this case, the price paid for the
acquired business must be allocated to the fair values of its assets and liabilities,
including tangible assets, working capital, net debt, identifiable intangible assets and
goodwill. Goodwill represents the residual asset representing the difference between
price paid and the fair value of all intangible asset and liabilities acquired.34
As goodwill is not amortised under US GAAP or IFRS, allocating a higher proportion of
acquisition value to goodwill would result in lower amortisation, and hence higher
earnings per share. Accordingly, “there may be a bias to find a higher value in
goodwill than in other tangible or intangible assets, since this will maximize reported
future earnings.”35 If a stakeholder is the company’s investor, he or she may be
interested in the valuation resulting in a higher value of intangibles.
On the other hand, the purchased intangibles in the same company may lead to a
transfer pricing issue.36 A higher or lower value of intangibles may be preferred by the
company’s tax management, depending on the effective tax rates the multinational
company is subject to in different jurisdictions. Thus, it could be that, from the tax
perspective, it is cash maximizing for the company to have a higher or lower value of
intangible than identified in the valuation performed for financial reporting purposes.
In the example above, a professional preparing a valuation for financial reporting
purposes may make different assumptions and use different methodologies than a
transfer pricing professional performing a valuation for the purposes of a transfer
pricing study. Both valuations will be, in practice, subjective, and thus possibly biased
exercises in the framework of recognized and well accepted methodologies in the
country(ies) of the valuer(s), subject to local rules and regulations. One possible
solution would be to understand if there are differences in methodologies required by
the purpose of valuation and, next, to assess the differences in assumptions adopted
by valuers involved in both valuations.
Basis of value:37 the arm’s length principle and the fair / market value 2.2.3
- Introduction
Many professionals use the terms Market Value and Arm’s Length Price
interchangeably and often assume that they are synonymous with ‘Fair Value’ as
determined for accounting purposes. However, they are not – each definition of value
can and often does give quite different values for the same asset. Furthermore,
34 See for instance Deloitte (2015) at 29 or KPMG (2009) at 11. 35 Dembitz (2003). 36 In the cases when, for instance, an acquisition is followed by a subsequent
migration of the acquired intangibles to another jurisdiction different from the country
of the legacy ownership or, alternatively, a license of the purchased intangibles to
related companies for the use in other operations abroad. 37 IVS defines “basis of value” as “a statement of the fundamental measurement
assumptions of a valuation”. Various other standards and technical literature may use
different terminology to describe the same concept: definition of value, principle of
value, concept of value or standard of value. In this section, for consistency purposes
and to avoid confusion with “valuation standards” analysed in Section 3 of the report,
“basis of value” is referred to, except in direct quotes or direct references to sources
using different terminology.

European Commission
Study on the Application of Economic Valuation Techniques for Determining Transfer Prices of Cross Border Transactions between Members of Multinational Enterprise
Groups in the EU
September 2016 – 29
valuation standards used in non-transfer pricing contexts also use several bases of
value, which themselves can result in different values, as set out further below in the
present section.
A comparison of the arm’s length principle and the valuation bases of corporate
finance and financial reporting is noteworthy as income-based methods rely on
corporate finance approaches. Furthermore, valuation experts with limited knowledge
of taxation and the arm’s length principle are often involved in the valuation of
intangibles prepared for transfer pricing purposes. Equally, transfer pricing experts
may lack knowledge about economic valuation techniques when undertaking valuation
studies of intangibles for transfer pricing purposes. It is therefore critical to ensure
that valuation approaches deviating from the arm’s length principle reconcile with it
when used in transfer pricing analyses.
Speciality literature has tackled the topic of differences encountered between the two
bases, being the arm’s length principle and fair value standard. Jens Wittendorff, in his
article on Valuation of intangibles under income-based methods – Part I,38 performed
a comparison highlighting the most relevant differences between valuations for
transfer pricing and general valuations. An overview of the main ideas expressed in
this article are presented below, as well as additional comments based on analysis of
the definitions / bases of value found in valuation standards by the study team.
- The arm’s length principle
The authoritative international definition of the arm’s length principle used in transfer
pricing is set out in Art. 9(1) of the OECD Model:
Where
(a) An enterprise of a Contracting State participates directly or indirectly in the
management, control or capital of an Enterprise of the other Contracting State, or
(b) the same persons participate directly or indirectly in the management, control or
capital of an enterprise of a Contracting State and an enterprise of the other
Contracting State,
and in either case conditions are made or imposed between the two enterprises in
their commercial or financial relations which differ from those which would be made
between independent enterprises, then any profits which would, but for those
conditions, have accrued to one of the enterprises, but, by reason of those conditions,
have not so accrued, may be included in the profits of that enterprise and taxed
accordingly.
The arm’s-length standard is achieved if the results of the transaction are consistent
with the results that would have been realized if uncontrolled taxpayers had engaged
in the same transaction under the same circumstances (arm's length result).
The interpretation of the arm’s length principle is provided in the OECD TPG. The
domestic transfer pricing laws of many countries rely on the arm’s length principle of
Art. 9(1) and the OECD TPG.
38 Wittendorff (2010) at 323-328.

European Commission
Study on the Application of Economic Valuation Techniques for Determining Transfer Prices of Cross Border Transactions between Members of Multinational Enterprise
Groups in the EU
September 2016 – 30
- Market value
The International Valuation Standards Council (IVSC) uses the following definition of
the market value basis:39
Market value is the estimated amount for which a property should exchange on
the date of valuation between a willing buyer and a willing seller in an arm’s-
length transaction after proper marketing wherein the parties had each acted
knowledgeably, prudently, and without compulsion.
It is noted that this definition, although it defines market value, also uses the arm’s
length concept as a reference.
The IVSC has also adopted two other valuation bases, which are different from the
market value basis:40
Investment Value, or Worth: The value of property to a particular investor, or
a class of investors, for identified investment or operational objectives. This
subjective concept relates specific property to a specific investor, group of
investors, or entity with identifiable investment objectives and/or criteria.
Special Value: An amount above the Market Value that reflects particular
attributes of an asset that are only of value to a Special Purchaser.
According to Wittendorff, the differences between these three bases (market-,
investment-, and special value) rest largely on whether a one-sided or two-sided
perspective is adopted and whether the reference transaction is deemed to take place
between the actual parties or hypothetical parties.
- Fair value (financial reporting)
For financial reporting purposes, the author refers to definition of fair value by the
International Accounting Standards Board (IASB):41
Fair value is the price that would be received to sell an asset or paid to transfer a
liability in an orderly transaction between market participants at the measurement
date.
The key feature of the definition is the reference to the market participants.
Fair value continues to be an important measurement basis in financial reporting. It
provides information about what an entity could realise if it sold an asset or what they
could pay to transfer a liability. In recent years, the use of fair value as a
measurement basis for financial reporting has been expanded, even as the debate
over its usefulness to stakeholders continues.
- Comparison of the Arm’s length principle with Fair value (market value) basis
Jens Wittendorff performed a detailed comparison of these two bases of value
reflecting on their three main elements, namely: (1) the controlled transaction, (2) the
reference transaction and (3) implications on value:42
39 International Valuation Standards 1 (2007) para. 3.1. 40 International Valuation Standard 2 (2007) para. 3.3 and 3.5. 41 See e.g. International Accounting Standard 16, Property, Plant and Equipment.

European Commission
Study on the Application of Economic Valuation Techniques for Determining Transfer Prices of Cross Border Transactions between Members of Multinational Enterprise
Groups in the EU
September 2016 – 31
(1) The Controlled Transaction: as cited by Wittendorff, according to the OECD
guidelines, both bases treat the controlled transaction in the same form and
structure as adopted by the parties by transactions.43
(2) The Reference Transaction: Furthermore, both bases require that the reference
transaction be concluded between independent parties. “The arm’s length principle
also establishes a comparability requirement under which the reference transaction
should be a perfect mirror image of the controlled transaction in terms of all the
factors that may affect price formation”, hence requiring the object and other
aspects of the transactions to be comparable. “This means a subjective valuation
which must be made on an ex ante basis.” Moreover, the arm’s length principle “is
based on an assumption of profit maximisation and arguably also a premise of
information symmetry.”44
The author finds that fair value is similar as it also establishes a comparability
requirement in relation to the object of the valuation and necessitates the
valuation to be made on an ex-ante basis. It also assumes information symmetry
and profit maximisation. However, it is important that fair value is based on a
hypothetical market (e.g. most advantageous market, i.e. the market where the
highest price is quoted), a hypothetical transaction (“orderly transaction”45) and
hypothetical market participants.
Thus, Wittendorff concludes that the fair value basis (due to hypothetical market
assumptions) does not allow “any element of entity-specific value or any element
of value that would not be available in a typical market transaction,” such as, for
example, economies of integration, the relative bargaining powers, legal rights, tax
benefits and location savings.
(3) Implications on value: With regard to the third element, both bases are
transactional and price-based and require an aggregation approach when the value
of an asset in use with other assets exceeds the value of the asset on a stand-
alone basis. However, linked to the discussion of a hypothetical market above, fair
value is based on a highest-and-best-use principle. This principle is rejected in the
OECD Guidelines because it implies a one-sided perspective. According to the
OECD Guidelines, the arm’s length principle thus considers the perspective of both
parties. Furthermore, the author finds it important that the transfer pricing
practitioner, governed by the arm’s length principle, determines the appropriate
price on a pre-tax basis, whereas the valuation techniques used in valuations other
than transfer pricing, “may result in prices being determined on a post-tax basis”.
Based on this analysis, it can be concluded that differences between the “fair value /
market value” and the “arm’s length” principle may lead to different values of the
same asset. As stated by the author: “the outcome of valuations performed under the
two standards, will not necessarily coincide. This should be seen in light of the fact
that the two standards pursue different objectives, and that the arm’s length principle
42 Wittendorff (2010) at 325. 43 That is, without challenging the form of transaction based on substance or the form
adopted by independent parties. See TPG, para. 1.64. 44 Wittendorff (2010) at 325. 45 Transaction that assumes exposure to the market for a period before the
measurement date to allow for marketing activities that are usual and customary for
transactions involving such assets or liabilities; it is not a forced transaction (e.g. a
forced liquidation or distressed sale).

European Commission
Study on the Application of Economic Valuation Techniques for Determining Transfer Prices of Cross Border Transactions between Members of Multinational Enterprise
Groups in the EU
September 2016 – 32
is applied with respect to an actual transaction between actual parties, whereas fair
value is often applied without any actual transaction”.46
- Additional comment
It is interesting that the fair value basis adopted by valuers for financial reporting
purposes (based on IASB) is not the fair value definition adopted elsewhere. For
instance, the IVSC definition is the following.
“Fair value is the estimated price for the transfer of an asset or liability between
identified knowledgeable and willing parties that reflects the respective interests of
those parties.” 47
As defined above, the fair value requires the assessment of the price that is fair
between two identified parties taking into account the respective advantages or
disadvantages that each will gain from the transaction. Such a definition is commonly
applied in judicial contexts.
This basis of value is clearly different to market value. Therefore, in a valuation
prepared under the IVSC, the values estimated under these two bases of value
(market or fair value bases) may diverge, depending on the specific facts and
circumstances of the transaction. According to the study team, the fair value basis
defined under IVS is more closely aligned to the arm’s length principle under TPG than
with market value basis. This further supports the conclusion that the basis of value
used may have important consequences on valuation performed.
- Conclusion
As set out above, the fact that the basis of value may affect the assessed value is not
specific to transfer pricing. In other business contexts, value can also justifiably be
different when differing bases of values are applied. This is relevant with regards to
the distinctive IVS definitions of fair value and market value, but also for other bases
of value such as ‘fair value less costs to sell’, ‘value in use’, ‘value to a specific buyer’
etc.
Nevertheless, based on the points set out above and on complementary research by
the study team, significant similarities between the fair value / market value standard
and the arm’s length standard of value are apparent; hence, there are many situations
where valuations would not need to be conducted differently under these two
standards, such as, for example:
- In cases where the seller and particularly the buyer can be considered as “normal”
market participants (from the point of view of size, geography, activities, etc.)
- In cases where the relative bargaining power48 of the two parties is broadly in line
with that of typical participants to the market
- In cases where the assets transferred are similar to those transferred in third party
transactions
46 Wittendorff (2010) at 326. 47 IVS Framework para 38 – 41. 48 The bargaining power is the relative ability of parties in a situation to exert influence
over each other.

European Commission
Study on the Application of Economic Valuation Techniques for Determining Transfer Prices of Cross Border Transactions between Members of Multinational Enterprise
Groups in the EU
September 2016 – 33
- In cases where the tax regimes of the buyer and seller are broadly aligned to
“normal” tax regimes for other market participants.
It is generally very infrequent that a valuer performing a valuation for transfer pricing
purposes will have in front of her also a valuation of the same asset(s) performed for
other purposes.49 If this is however the case, a transfer pricing valuation analysis
should take into account the results of such a valuation and its premises, and material
differences in value assessed should be explained by specific references to the
differences in the bases used (or to the perimeter of assets valued).
Two-sided versus one-sided approach 2.2.4
The two-sided approach is a fundamental principle of transfer pricing valuation. This
means that the valuation must be prepared from the perspective of each party to the
transaction. As stated by the TPG (revised Section 6):
“In applying the principles of the Guidelines related to the content and process of a
comparability analysis to a transaction involving intangibles, a transfer pricing analysis
must consider the options realistically available to each of the parties to the
transaction.” 50
And
“In considering the options realistically available to the parties, the perspectives of
each of the parties to the transaction must be considered. A comparability analysis
focusing only on one side of a transaction generally does not provide a sufficient basis
for evaluating a transaction involving intangibles (including in those situations for
which a one-sided transfer pricing method is ultimately determined).”51
In general, the two-sided approach to valuation is not followed by valuers other than
transfer pricing practitioners. Instead, the valuer typically represents only one party of
the transaction, (i.e. a buyer or a seller), and/or refers to hypothetical buyers or
sellers in a transaction, and uses market values benchmarks to objectivise the
assumptions behind its valuation. As such, the valuation performed for purposes
other than transfer pricing is typically one-sided.
Understanding the difference between the bases of value and, also, the two-sided
approach in valuations for transfer pricing purposes, may build up a solid bridge
between valuations for transfer pricing and other purposes.
Scope of intangibles subject to a valuation 2.2.5
The current analysis focused on valuation techniques to be performed for the most
common categories of intangibles identified by the OECD TPG (i.e. patents, know-how
and trade secrets, trademarks, trade names and brands, rights under contracts and
government licences, licences and similar rights in intangibles and for the application
of such techniques to the transfer of a business or a part of a business). However,
valuations of intangibles for other purposes, should also be considered. The list below
49 Such situation may occur if, for instance, shortly after an acquisition of an
independent company, an intercompany transfer of assets takes place and a transfer
pricing valuer is provided with the valuation made for purchase price allocation (PPA). 50 OECD, Aligning transfer pricing outcomes with value creation, para. 6.111 51 OECD, Aligning transfer pricing outcomes with value creation, para. 6.112

European Commission
Study on the Application of Economic Valuation Techniques for Determining Transfer Prices of Cross Border Transactions between Members of Multinational Enterprise
Groups in the EU
September 2016 – 34
provides a definition of intangibles used for accounting and financial purposes. Key
similarities and differences between these definitions and the definitions of the OECD
BEPS Action Plan are highlighted.
- Definition of intangibles for accounting and financial reporting purposes
Under IFRS (IAS 38 – Key definitions), an intangible asset is defined as ‘an identifiable
non-monetary asset without physical substance’.
Furthermore, “An asset is a resource that is controlled by the entity as a result of past
events (for example, purchase or self-creation) and from which future economic
benefits (inflows of cash or other assets) are expected”. [IAS 38.8]
The definition of intangibles under IFRS and US GAAP (used for accounting and
financial reporting purposes) focuses on the following three points52:
(i) The identifiable intangible assets reported must fall under the definition of an
asset;
(ii) The intangible must satisfy one of the following criteria: it should be either
separable from the business or arise from a legal or contractual right; and
(iii) There is a rebuttable presumption that the value of intangible identified under
the framework above can be measured reliably.
- Transfer Pricing definition of intangibles
Under Action 8-10 final deliverable of the BEPS project, the OECD has identified the
word “intangible” as “intended to address:
something which is not a physical asset or a financial asset,
which is capable of being owned or controlled for use in commercial activities, and
whose use or transfer would be compensated had it occurred in a transaction
between independent parties in comparable circumstances.”53
The OECD also recognises a special category of “unique and valuable” intangibles as
those intangibles “(i) that are not comparable to intangibles used by or available to
parties to potentially comparable transactions, and (ii) whose use in business
operations (e.g. manufacturing, provision of services, marketing, sales or
52 FAS 141 in US GAAP and IFRS 3. 53 OECD, Aligning transfer pricing outcomes with value creation, para. 6.6.
The BEPS deliverable further divide intangibles into two categories, namely marketing
intangibles and trade intangibles. A marketing intangible is “an intangible (within the
meaning of paragraph 6.6) that relates to marketing activities, aids in the commercial
exploitation of a product or service, and/or has an important promotional value for the
product concerned. Depending on the context, marketing intangibles may include, for
example, trademarks, trade names, customer lists, customer relationships, and
proprietary market and customer data that is used or aids in marketing and selling
goods or services to customers.” (Final report, Para. 6.16) Accordingly, trade
intangibles are all other intangibles (within the meaning of paragraph 6.6) that do not
fall under the category of marketing intangibles, such as patents, know-how and trade
secrets, unpatented technology, software, databases, copyrights, music/video
recordings, rights under contracts and government licenses, etc.
European Commission
Study on the Application of Economic Valuation Techniques for Determining Transfer Prices of Cross Border Transactions between Members of Multinational Enterprise
Groups in the EU
September 2016 – 35
administration) is expected to yield greater future economic benefits than would be
expected in the absence of the intangible.”54
- Similarities and differences in definition
Unsurprisingly, there are key similarities between the definitions of intangible assets
for financial reporting and for transfer pricing. In both cases, there is:
A requirement for ownership or control,
A clarification that intangible assets are non-physical and non-monetary/financial,
and
A reference to economic benefits / compensation.
These definitions are in fact much closer together than some broad definitions of
intangible sources of value used elsewhere. For instance, definitions of intangibles in
economic literature may compass assets such as management know-how,
organisational structure, first-mover advantage, etc., which may not qualify under the
definitions above.
The OECD broadens the definition of an intangible property by not explicitly requiring
an item to (1) enjoy legal protection or (2) be separately transferable in order to be
considered an intangible property55. at least one of which is a required characteristic
of identifiable intangible assets from an accounting / financial reporting perspective.
By comparing the financial reporting definition of intangible property provided above
to the OECD deliverables definition, it can be seen how items that do not qualify as
identifiable intangible assets under financial reporting could be included as an
intangible property for tax-related intercompany transfer pricing purposes.56 The most
important differences are represented by the definition of goodwill, which will be
discussed in more detail below.57
However, in line with the comments above, the OECD also underlines that it is crucial
to distinguish between intangibles and market conditions or local market
circumstances. These items may affect and must be taken into account for the
determination of the arm’s length price but they are not intangibles falling under the
above definition.58 [cfa Special items below].
- Differences in practice59
Book value may not reflect market value
The OECD (in the Final report) specifically indicates that the intangibles that are
significant for transfer pricing purposes may not always be recognised as intangibles
for accounting purposes. This is mainly due to accounting and financial reporting
standards in general (i.e. except for acquisition accounting), under which few
intangibles generated internally can be recognised. As supported by the OECD, there
may be valuable intangibles that are transacted inter-company “even though they
54 OECD, Aligning transfer pricing outcomes with value creation, para. 6.17. 55 OECD, Aligning transfer pricing outcomes with value creation, para. 6.8. 56 Rostowski (2015). 57 Sadang (2015) 58 OECD, Aligning transfer pricing outcomes with value creation, para. 6.9. 59 This section discussed the differences in practice stemming from the definitions of
certain items in transfer pricing; other differences such as the use and calculation of
parameters will be discussed in the following sections.

European Commission
Study on the Application of Economic Valuation Techniques for Determining Transfer Prices of Cross Border Transactions between Members of Multinational Enterprise
Groups in the EU
September 2016 – 36
may have no book value in the company’s balance sheet”.60 Accordingly, even when
an item does not qualify as an intangible for accounting purposes, it may still be
appropriate to assign it a transfer price in the context of a controlled transaction.
Under acquisition accounting, the purchasing company must assign a fair value to
most of the tangible and intangible assets purchased and record these asset values on
its balance sheet. This reduces the likelihood that an intangible asset considered to
have value for TP purposes would not be recognised for book purposes. However, due
to differing definitions and classifications of intangible assets, as well as due to the
different scope and standard of valuation for PPA and TP purposes, the value of
intangibles for transfer pricing purposes may be different from the PPA. This is
explored right below.
Intercompany character determining uniqueness of intangible scope
Besides the differences between book values and transfer pricing values, there are two
other significant differences in scoping intangibles in practice. First, transfer pricing
valuations frequently involve transactions for unique intangibles that would not be
transacted between unrelated parties.61 Besides the fact that (many of) the intangibles
are unique and thus may not have market comparables, in transfer pricing in
particular, the situations are frequently unique due to the nature of multinational
enterprise acting as one business with several entities in different jurisdictions. This
aspect is addressed in economic literature, pointing out the fact that “multinational
enterprises can and do enter into certain transactions that third parties operating in
the open market could not, or would not, enter into. For example, a parent company
rich in valuable IP would have a strong incentive to transfer rights to use and possibly
further develop all of its IP to an affiliated foreign entity if that transfer of rights
increases value to its shareholders. Clearly, this would not necessarily be the case in a
third party context.”62
The uniqueness of inter-company transactions may also be reflected in the specific
terms of the inter-company transaction as structured. For example, “the transfer
pricing analysis may evaluate a 20-year license in which the licensor, rather than
licensee, incurs future R&D expenses”63 which is a situation that is arguably difficult to
find between two independent enterprises.
Aggregation or bundling
Related to the specific scope of the intangible to be valued, it is frequently the case
that a transfer pricing valuation is carried out for a piece of business or a set of
identified intangibles. That is, it is not necessary for transfer pricing to value separate
intangibles transferred but instead, it is important to consider a “package deal.” The
OECD Guidelines specifically support the view that “an MNE may package as a single
transaction and establish a single price for a number of benefits such as licenses for
patents, know-how, and trademarks, the provision of technical and administrative
services and the lease of production facilities”. Note that in the example of the OECD
the transfer of intangibles is bundled together with provision of services and a lease
60 OECD, Aligning transfer pricing outcomes with value creation, para. 6.7. 61 Finan et al (2011). 62 Henshall et al (2016). 63 Chandler et al (2010).
European Commission
Study on the Application of Economic Valuation Techniques for Determining Transfer Prices of Cross Border Transactions between Members of Multinational Enterprise
Groups in the EU
September 2016 – 37
payment.64 The reason for allowing aggregation or bundling of several transactions lies
in the fact that these transactions are viewed as closely linked.
This aggregation or bundling approach differs from valuations for other purposes, in
many of which (in particular but not only in valuations for financial reporting) assets
are identified and valued separately.65
Special items 2.2.6
Under the BEPS definition of intangibles, special items such as location savings and
other local market conditions, assembled workforce and group synergies would be
excluded. This is because they do not fulfil the condition of “capable of being owned or
controlled”. Similarly, the OECD special item examples would fall outside this scope:
higher purchasing power of households in certain market, low prevailing labour costs,
proximity to markets, streamlined management, integrated systems, other synergies,
etc.66
There is a difference between Section VI of the OECD TPG tackling the transfer pricing
of intangibles and Section I which deals with comparability analyses. In this respect,
the OECD mentions that factors such as location savings, workforce and group
synergies will need to be taken into account when performing a comparability analysis.
These factors can influence the arm’s length price of a transaction and they might lead
to comparability adjustments. However, as they cannot be owned or controlled by a
party, these are not intangibles under the definition of the OECD. A more detailed
discussion of these items is provided below.
- Workforce
Assembled workforce represents the success of a business in assembling a uniquely
qualified or experienced collective of employees. The OECD TPG clearly situates this
item in the list of factors to be considered when performing a comparability analysis
and not under the intangibles definition. While workforce may not be intangible as it
does not fulfil the condition of being capable of being owned or controlled for
commercial purposes, it can nevertheless have important effects on arm’s length
prices in matters involving the use of intangibles. It is recognised that the transfer or
secondment of employees may in some circumstance results in the transfer of
valuable know-how or other intangibles from one enterprise to another.67
- Location savings
Location savings are those location-specific market features and/or factors of
production that enable a business to achieve an improved financial outcome from the
provision of the same product or service compared to alternative locations. It may
include access to skilled labour, incentives, market premiums, access to growing
markets, superior infrastructure, and cost savings.68
Similarly to workforce, this item must also be considered in the process of a
comparability analysis, but it does not fulfil the condition of being owned, necessary
64 OECD TPG, para. 3.11; see also OECD, Aligning transfer pricing outcomes with value
creation, para. 6.12. 65 Finan et al (2011). 66 OECD, Aligning transfer pricing outcomes with value creation, para. 6.31. 67 OECD, Aligning transfer pricing outcomes with value creation, para. 1.152-1.156. 68 Ghosh et al (2013).

European Commission
Study on the Application of Economic Valuation Techniques for Determining Transfer Prices of Cross Border Transactions between Members of Multinational Enterprise
Groups in the EU
September 2016 – 38
for characterisation as an intangible. However, some tax authorities in newly
industrialised countries, such as India and China, take the position that their unique
market features deserve separate recognition and compensation through appropriate
transfer prices.
- Business synergies
Business synergies represent the interactions among group members that would not
generally be available to similarly situated independent enterprises. Such group
synergies can arise, for example, as a result of combined purchasing power or
economies of scale, combined and integrated computer and communication systems,
integrated management, elimination of duplication, increased borrowing capacity, and
numerous similar factors.69 Although these synergies may contribute to the level of
income earned by a group, they cannot be owned or controlled and thus they are not
intangibles.70
- Goodwill
The term “goodwill” has different definitions depending on the purpose of the
valuation. For financial reporting purposes, goodwill is a residual concept that reflects
the difference between the aggregate value of an operating business and the sum of
the values of all separately identifiable tangible and intangible assets. In transfer
pricing, a goodwill which is a part of residual goodwill value in financial reporting, may
not be a separate asset or item – rather, the underlying value may be embedded in
the intangibles value and consists of buyer specific synergies, future customer
relationships, future technology and all future opportunities.71
The BEPS deliverable does not precisely define goodwill and ongoing concern value.
Moreover it notes that financial accounting or business valuation definitions of goodwill
do not correspond to the goodwill definition used in transfer pricing analyses. The
qualities attributed to goodwill and ongoing concern value includes qualities such as a
reputation for producing high quality products that enables a company to charge
higher prices.72
The BEPS deliverable concludes that depending on facts and circumstances, goodwill
may or may not be an intangible, taxpayers being advised to consider whether
independent enterprises would provide compensation for such intangibles in
comparable circumstances.73
Summary comments, observations and practical implications 2.2.7
The analysis presented at points 2.2.1 – 2.2.6 above has shown that there are both
key similarities and important differences between valuations for general purposes and
valuations for TP purposes, starting from the underlying principles and basis of value
and including the context or situation of the valuation, stakeholders of the valuation,
potential adoption of two-sided approach and scope of intangibles subject to the
valuation.
In practice, a first important point is to recognise that the situations in which
intangibles transferred intra-group and requiring a valuation for TP purposes have
69 OECD, Aligning transfer pricing outcomes with value creation, para. 1.157. 70 OECD, Aligning transfer pricing outcomes with value creation, para. 6.30. 71 Sadang (2015). 72 Rostowski (2015). 73 OECD, Aligning transfer pricing outcomes with value creation, para. 6.29.
European Commission
Study on the Application of Economic Valuation Techniques for Determining Transfer Prices of Cross Border Transactions between Members of Multinational Enterprise
Groups in the EU
September 2016 – 39
already been valued for another purpose (PPA, dispute, M&A, internal analyses, etc.)
are likely to be a minority of cases. Accordingly, in most situations there is no direct
comparison possible between the actual values of intangibles for TP and for other
purposes.
In such cases, a valuer will need to assess to what extent the methods and inputs that
would be used in a valuation for other purposes are relevant for a TP valuation.
However, the key aspects to consider are broadly the same whether or not a previous
valuation exists and values can be directly compared. To consider these aspects one
should seek answers to the following questions:
- Are the two parties to the transaction studied broadly similar to typical market
participants or not? (This may have impact on financial forecasts for the two
parties, on tax rates considered, etc.)
- Are the assets (to be transferred) comparable to assets transferred in unrelated
party transactions (with reference to perimeter, scope, treatment of goodwill etc.)?
- Are there specific transfer pricing principles that are different from general
valuation approaches to take into account (in particular, is the two-sided approach
likely to result in a different value)?
- Are the stakeholders’ interests likely to bias the valuation and how can the
valuation inputs be objectivised (and what level of objective support has been
provided in the existing TP / non-TP valuation)
- What is the level of documentation is required, both in terms of providing a
sufficient background on the transaction and documenting the chosen
methodology(ies) as the most appropriate as well as the assumptions made for
application of such methodology(ies).
In the study team’s analysis, there cannot be an automatic conclusion that a valuation
process and methods for TP purposes, and its results, are necessarily different than a
valuation (and its results) for other purposes, but neither an automatic conclusion that
they should be the same. Just like in any other valuations, the valuer should always
consider all available information and should justify specific departures from methods,
inputs and results of the previous valuations.
The next section proceeds to practical observations registered in the EU Member
States in terms of experience in valuations of intangibles for TP purposes, treatment of
certain items in this context, and information used to perform such studies.
2.3 Practical observations
In the remainder of Section 2, we explore the practical experiences in the 28 Member
states based on the interview of the experts in Deloitte network. In particular, to
support the theoretical premises explored in section 2.2 above, we investigated the
general experience with valuations of IP for transfer pricing purposes in the Member
states as well as nine main trade partners countries, the types of intangibles valued in
the transfer pricing context, the factors to be considered important by transfer pricing
valuers and the degree they accept valuations performed for other purposes, to be
used for transfer pricing analyses. The respondents were also requested to comment
whether or not they special items: workforce, location savings, goodwill and business
synergies as intangibles or not.

European Commission
Study on the Application of Economic Valuation Techniques for Determining Transfer Prices of Cross Border Transactions between Members of Multinational Enterprise
Groups in the EU
September 2016 – 40
Degree of experience with IP valuations for TP purposes 2.3.1
- EU Member States
The practice of valuing intangibles for the purposes of transfer pricing is relatively
under-developed. In this respect, many of the surveyed respondents in 28 Member
States commented on their limited experience in the field. The figure below observes
the current state of the play among Member States.
Figure 1. State of play – Experience in IP valuation for TP purposes
Five out of 28 Member States respondents (i.e. Croatia, Cyprus, Ireland, Malta and
Slovenia) note that they are unaware of the existence of local experience with
performing an IP valuation for TP purposes specifically. Malta and Cyprus do not have
transfer pricing regulations (the law in Cyprus is limited in acknowledging the arm’s
length standard), whereas Irish law covers only trading transactions (and thus, not
intangibles). Croatian and Slovenian respondents note a limited development of the
transfer pricing discipline in general following only recent adoption of transfer pricing
rules and regulations. Furthermore, 10 Member States respondents note (extremely)
limited experience with IP valuations for TP purposes, i.e. Austria, Bulgaria, Czech
Republic, Estonia, Hungary, Latvia, Lithuania, Luxembourg, Romania and Slovakia.
This means that just 13 Member States out of 28 have accumulated somewhat
significant and thus meaningful experience in valuing IP for TP purposes.
For the purpose of the survey, the study team identified and listed the types of
intangibles, based on three classifications:
1. categories that are typical for general valuation studies (for purposes other
than financial reporting or transfer pricing),
2. categories for financial reporting purposes, and

European Commission
Study on the Application of Economic Valuation Techniques for Determining Transfer Prices of Cross Border Transactions between Members of Multinational Enterprise
Groups in the EU
September 2016 – 41
3. categories that are common in transfer pricing studies.
Table 1. Types of intangibles
No. Various type of intangibles in
Valuation studies
Categories for financial reporting valuations
Categories / grouping for the purpose of TP
approach
1 Patented technology
Technology-based intangible assets
Patents
2 Trade secrets
Non Patented technology
3 In-process research and development
4 Computer software
5 Unpatented technology
6 Trademarks
Marketing-related intangible assets Trademark,
tradenames, brands
7 Trade names
8 Service marks
9 Collective marks
10 Certification marks
11 Trade dress
12 Newspaper mastheads
13 Copyrights (esp. for media companies)
Artistic-related intangible assets
Rights under contracts/
(government) licenses
14 Non-competition agreements
Contract-based intangible assets
15 Customer contracts
16 Concessions, permits
17 Order or production backlog
18
Other contract-based intangible assets (e.g. lease agreements, advertising contracts)
19 Customer lists
Customer-related intangible assets Customer related intangibles such as customer-related
goodwill
20
Related customer relationships (customer contracts & related customer relationships)
21 Internet domain names
22 Customer base Not an identifiable intangible asset if
not linked to a customer contract
24 Workforce Not an identifiable intangible (no
control)
Specifically excluded by the OECD from the
definition of intangibles (suggested
to consider as comparability factors)
25 Location savings Not an identifiable intangible (not separable from the business, not
arising from a contract / legal right)
26
Goodwill / ongoing concern (may or may not be intangible depending on the context)
not an identifiable intangible BUT a significant intangible asset (difference between business value and value of
all identifiable assets)
In the survey, respondents were offered a choice between the type of categorisation
to use.
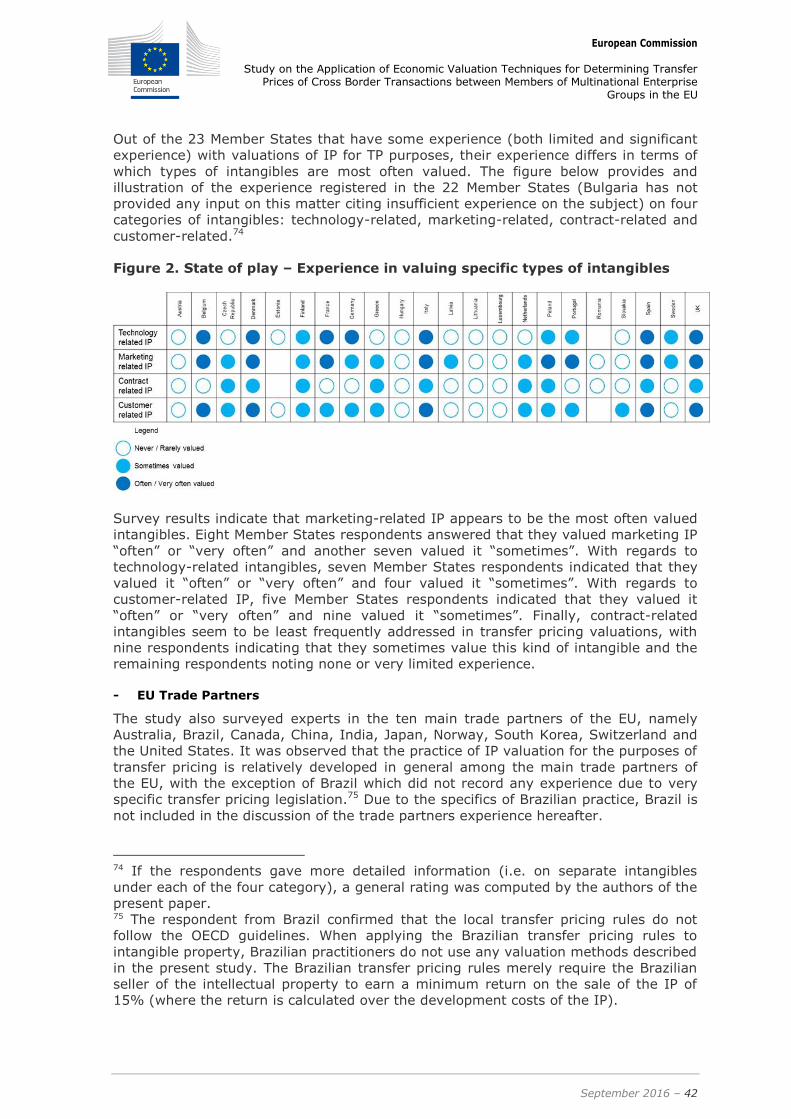
European Commission
Study on the Application of Economic Valuation Techniques for Determining Transfer Prices of Cross Border Transactions between Members of Multinational Enterprise
Groups in the EU
September 2016 – 42
Out of the 23 Member States that have some experience (both limited and significant
experience) with valuations of IP for TP purposes, their experience differs in terms of
which types of intangibles are most often valued. The figure below provides and
illustration of the experience registered in the 22 Member States (Bulgaria has not
provided any input on this matter citing insufficient experience on the subject) on four
categories of intangibles: technology-related, marketing-related, contract-related and
customer-related.74
Figure 2. State of play – Experience in valuing specific types of intangibles
Survey results indicate that marketing-related IP appears to be the most often valued
intangibles. Eight Member States respondents answered that they valued marketing IP
“often” or “very often” and another seven valued it “sometimes”. With regards to
technology-related intangibles, seven Member States respondents indicated that they
valued it “often” or “very often” and four valued it “sometimes”. With regards to
customer-related IP, five Member States respondents indicated that they valued it
“often” or “very often” and nine valued it “sometimes”. Finally, contract-related
intangibles seem to be least frequently addressed in transfer pricing valuations, with
nine respondents indicating that they sometimes value this kind of intangible and the
remaining respondents noting none or very limited experience.
- EU Trade Partners
The study also surveyed experts in the ten main trade partners of the EU, namely
Australia, Brazil, Canada, China, India, Japan, Norway, South Korea, Switzerland and
the United States. It was observed that the practice of IP valuation for the purposes of
transfer pricing is relatively developed in general among the main trade partners of
the EU, with the exception of Brazil which did not record any experience due to very
specific transfer pricing legislation.75 Due to the specifics of Brazilian practice, Brazil is
not included in the discussion of the trade partners experience hereafter.
74 If the respondents gave more detailed information (i.e. on separate intangibles
under each of the four category), a general rating was computed by the authors of the
present paper. 75 The respondent from Brazil confirmed that the local transfer pricing rules do not
follow the OECD guidelines. When applying the Brazilian transfer pricing rules to
intangible property, Brazilian practitioners do not use any valuation methods described
in the present study. The Brazilian transfer pricing rules merely require the Brazilian
seller of the intellectual property to earn a minimum return on the sale of the IP of
15% (where the return is calculated over the development costs of the IP).

European Commission
Study on the Application of Economic Valuation Techniques for Determining Transfer Prices of Cross Border Transactions between Members of Multinational Enterprise
Groups in the EU
September 2016 – 43
Chinese and Japanese respondents noted somewhat limited experience with regards to
the valuations for the purposes of IP transfer and also Korean respondents indicated
that the country’s experience is very limited. The figure below sets out the state of the
play among the main EU trade partners. The discussion that follows thus refers to nine
trade partners.
Figure 3. State of play – Experience in IP valuation for transfer pricing
purposes – main trade partners
Similar to the situation among EU Member States, the degree of valuation experience
among the survey trade partners is uneven with respect to the different types of
intangibles (see Figure 4 below). The most frequently valued intangibles are
marketing-based intangibles (with six out of nine respondents valuing them “often” or
“very often” and two valuing them “sometimes”) followed by technology-based
intangibles (with three respondents valuing them “often” or “very often” and five
valuing them “sometimes”). Following this, five respondents indicated that they value
customer-related IP “often” or “very often”. Contract-related intangibles were the least
valued type of intangible with four respondents out of nine valuing them “often” or
“very often”.
Conversely, in an inbound transaction, whereby Brazil acquires IP, the Brazilian
transfer pricing rules will test the level of profitability earned by the foreign seller of
the IP. If the level is below 20%, it will be conclude that the transactions was
conducted at “a market price.”

European Commission
Study on the Application of Economic Valuation Techniques for Determining Transfer Prices of Cross Border Transactions between Members of Multinational Enterprise
Groups in the EU
September 2016 – 44
Figure 4. State of play – Experience in valuing specific types of intangibles
In general, according to survey results, Canada, India, Switzerland and United States
can be regarded as the countries with more advanced experience in valuing
intangibles for transfer pricing purposes than other surveyed countries. China, Japan,
and especially South Korea were found to have rather limited experience.
Importance of Transfer Pricing aspects to performing IP valuation 2.3.2
- EU Member States
Consistent with the observations in Section 2.2 and the findings in the RTD paper, the
purpose of the valuation exercise (being TP in this case) is found important by most
respondents.
Figure 5. Is the purpose of valuation (being TP) important?
Out of the 22 Member States that responded to the question (non-respondents being
Member States with none or very limited experience with IP valuations for TP
purposes76), 16 noted that keeping the purpose of the valuation (TP in this case) in
mind when performing the valuation exercise is important. Four (Austria, France,
Hungary, and Latvia) Member States respondents indicated that it is not important.
76 Namely, Bulgaria, Croatia, Cyprus, Malta, Ireland and Slovenia.
16
4
8
-
2
4
6
8
10
12
14
16
18
Yes No n/a
Freq
uen
cy

European Commission
Study on the Application of Economic Valuation Techniques for Determining Transfer Prices of Cross Border Transactions between Members of Multinational Enterprise
Groups in the EU
September 2016 – 45
However, among the 13 Member States with substantial experience in the field
(identified in the beginning of section 2.3.1 above), all but one of the respondents
note that the purpose of valuation is important. For France, the only outlier, the
respondent mentions that the OECD methodologies are so widely defined that any
valuation technique could be put in the framework of an OECD method. German
respondent notes that the purpose of a valuation (being transfer pricing) is not
important in terms of the principles of the valuation methodologies applied but that it
does matter in terms of how this methodology is implemented.
Member State respondents were further asked to comment on the minimum
background information to collect in performing a valuation for transfer pricing
purposes. All 22 Member States respondents to the question note that the information
to be analysed includes functional and risk analyses77 of the parties to the transaction
before and after the transaction. All but one Member State respondent also include the
contracts and the understanding of business (and other) reasons for restructuring
leading to a transfer of IP in the minimum information required.
Figure 6. Important information to consider before selecting valuation
approach in transfer pricing, (besides financial data)
Au
str
ia
Belg
ium
Czech
Rep
ub
lic
Den
mark
Esto
nia
Fin
lan
d
Fran
ce
Germ
an
y
Greece
Hu
ng
ary
Ita
ly
Latv
ia
Lit
hu
an
ia
Lu
xem
bou
rg
Neth
erla
nd
s
Po
lan
d
Po
rtu
gal
Ro
man
ia
Slo
vakia
Sp
ain
Sw
ed
en
UK
Functional and risk profile of parties ”before” and “after”
x x x x x x x x x x x x x x x x x x x x x x
Contracts x x x x x x x x x x x x x
x x x x x x x x
Business (and all other reasons) for restructuring
x x x x x x x x x x x x x x x x x x x x x
Member States respondents also noted some other information that is especially
important, such as understanding of the business plan, business strategy, operational
structure, value drivers, and the background information on the intangibles valued
(including, for example, any studies regarding the perception of the intangibles by
consumers, any differentiation of brands/trademarks, background on how the R&D
was conducted and what were the costs involved, the level of IP protection and what
value it brings to the user).
All Member State respondents supported the view that the collected information
analysis should be provided in the form of the transfer pricing study and more
particularly the section devoted to the description of the business and factual,
functional and risk analyses. Some Member States explicitly noted in this respect, that
77 It is common understanding in Deloitte network (including TP professionals
surveyed) that the factual, functional and risk analysis will contain such items,
description of supply chain, value drivers, markets and industry, functional
contributions by relevant entities (parties of transaction) to value creation, etc. These
are the elements that are typically addressed by transfer pricing documentation. In
this respect, see OECD, Transfer Pricing Documentation and Country-by-Country
Reporting, Action 13 – 2015 Final Report (2015).
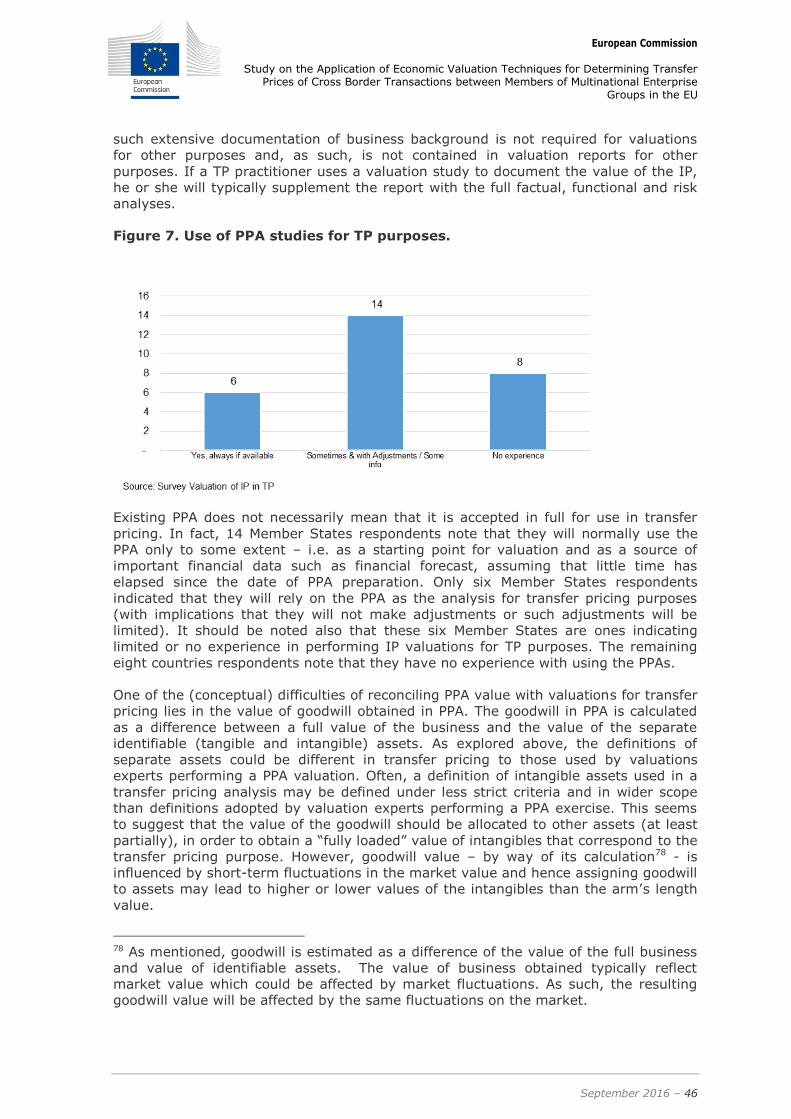
European Commission
Study on the Application of Economic Valuation Techniques for Determining Transfer Prices of Cross Border Transactions between Members of Multinational Enterprise
Groups in the EU
September 2016 – 46
such extensive documentation of business background is not required for valuations
for other purposes and, as such, is not contained in valuation reports for other
purposes. If a TP practitioner uses a valuation study to document the value of the IP,
he or she will typically supplement the report with the full factual, functional and risk
analyses.
Figure 7. Use of PPA studies for TP purposes.
Existing PPA does not necessarily mean that it is accepted in full for use in transfer
pricing. In fact, 14 Member States respondents note that they will normally use the
PPA only to some extent – i.e. as a starting point for valuation and as a source of
important financial data such as financial forecast, assuming that little time has
elapsed since the date of PPA preparation. Only six Member States respondents
indicated that they will rely on the PPA as the analysis for transfer pricing purposes
(with implications that they will not make adjustments or such adjustments will be
limited). It should be noted also that these six Member States are ones indicating
limited or no experience in performing IP valuations for TP purposes. The remaining
eight countries respondents note that they have no experience with using the PPAs.
One of the (conceptual) difficulties of reconciling PPA value with valuations for transfer
pricing lies in the value of goodwill obtained in PPA. The goodwill in PPA is calculated
as a difference between a full value of the business and the value of the separate
identifiable (tangible and intangible) assets. As explored above, the definitions of
separate assets could be different in transfer pricing to those used by valuations
experts performing a PPA valuation. Often, a definition of intangible assets used in a
transfer pricing analysis may be defined under less strict criteria and in wider scope
than definitions adopted by valuation experts performing a PPA exercise. This seems
to suggest that the value of the goodwill should be allocated to other assets (at least
partially), in order to obtain a “fully loaded” value of intangibles that correspond to the
transfer pricing purpose. However, goodwill value – by way of its calculation78 - is
influenced by short-term fluctuations in the market value and hence assigning goodwill
to assets may lead to higher or lower values of the intangibles than the arm’s length
value.
78 As mentioned, goodwill is estimated as a difference of the value of the full business
and value of identifiable assets. The value of business obtained typically reflect
market value which could be affected by market fluctuations. As such, the resulting
goodwill value will be affected by the same fluctuations on the market.

European Commission
Study on the Application of Economic Valuation Techniques for Determining Transfer Prices of Cross Border Transactions between Members of Multinational Enterprise
Groups in the EU
September 2016 – 47
The Figure below illustrates that adjusting the PPA values by allocating goodwill is at
least attempted by a majority of Member States respondents with experience of
dealing with PPAs for transfer pricing purposes.79 Eleven Member States respondents
note that they attempt such an allocation.80 Only four Member States respondents
(France, Romania, Czech Republic and the UK) note that they will not attempt to
allocate goodwill. In the case of Czech Republic, this is dictated by accounting rules,
which permit classifying goodwill as a separate asset subject to depreciation on the
balance sheet. With regards to this question, the UK respondent refers to the OECD
view that the values received in a PPA exercise are not automatically equivalent to
transfer pricing values8182: “in particular, valuations of intangibles contained in
purchase price allocations performed for accounting purposes are not determinative
for transfer pricing purposes and should be utilised in a transfer pricing analysis with
caution and careful consideration of the underlying assumptions.” 83
Figure 8. Dealing with goodwill part of PPA – EU Member States
Section 2.2 above provides a more detailed discussion on the scope of intangibles
valued in transfer pricing opposed to valuations for other purposes.
- EU Main Trade Partners
The respondents in trade partners countries were also asked whether the purpose of
valuation (being transfer pricing) is important to consider, to make a corresponding
choice of methodology and its modalities. Eight of the nine respondents confirmed that
the purpose of the valuation is important. Only one respondent (India) responded
79 Five countries with no experience with performing valuations for TP purposes were
counted as “no experience” as they explicitly answered the question. 80 In such case, the allocation will be performed in proportion to the value of types of
intangible assets identified in the PPA. 81 An even stricter view was expressed (in the Bloomberg BNA / Baker & McKenzie
Global Transfer pricing conference in March-April 2014 in Paris) by Michael McDonald,
that the approach of using the results of a PPA as a starting point for a valuation of IP
for TP, and especially taking the results of a PPA and reallocating the value of goodwill
to other identified assets is not a correct approach. 82 For examples, see discussion below dealing with goodwill part of PPA for Trade
partners. 83 OECD, Aligning transfer pricing outcomes with value creation, para. 6.155. See also
Finan et al (2011).
13
11
4
-
2
4
6
8
10
12
14
No experience/ do not usePPA
Will try to allocate it to otherintangibles identified for TP
purposes
Will not allocate it / will notreconcile

European Commission
Study on the Application of Economic Valuation Techniques for Determining Transfer Prices of Cross Border Transactions between Members of Multinational Enterprise
Groups in the EU
September 2016 – 48
negatively to the question, explaining that the valuations are done based on fair
market value standard and independently of the purpose of the valuation exercise.
With regards to the minimum background to consider for the analysis before
committing to the valuation approach, all nine respondents indicated that they
consider the functional and risk profiles of the parties “before” and “after”, relevant
contracts between the entities of the group and the business reasons behind the
restructuring. …
Other factors were also mentioned by respondents as important (additional)
information to consider:
Business and market strategy (how the company plans to sell its products, its
market penetration strategy), together with a complete understanding of the
industry;
All factual details surrounding the transaction;
All information that is important to determine the transferred IP correctly and all
historical quantitative information behind these assets (costs to develop, former
acquisition value if assets were acquired even if long time ago, etc.);
Options realistically available.
The nine surveyed trade partners respondents confirmed that the collected
information is fully reflected in prepared factual, functional and risk analyses that are
part of a transfer pricing study.
In terms of the usefulness of PPA analysis, all countries respondents note that they
review it, if it is available. The general comment from surveyed trade partners
respondents that the financial data may be useful and it is important to understand
the approach (and the difference with this approach) with a potential transfer pricing
approach. As such, the specialists in the trade partners’ countries are consistent with
the specialists in the Member States.
In terms of the issue of the goodwill identified in the PPA, respondents were divided.
As the Figure below illustrates, some respondents try to allocate the goodwill value to
the identified assets whereas others (India and Norway) will not. In this respect,
Norway respondent notes that because of the singularity of the tax law in Norway,
they avoid the inclusion of goodwill in intangible assets value. Indian respondent notes
that goodwill is left as a separate asset in the valuation. Japan, Switzerland, and US
experts84 note that indeed, because of the difference in the definition of intangibles in
transfer pricing versus other purposes, the goodwill may to some extent be allocated
to other intangible assets.
84 See discussion below.
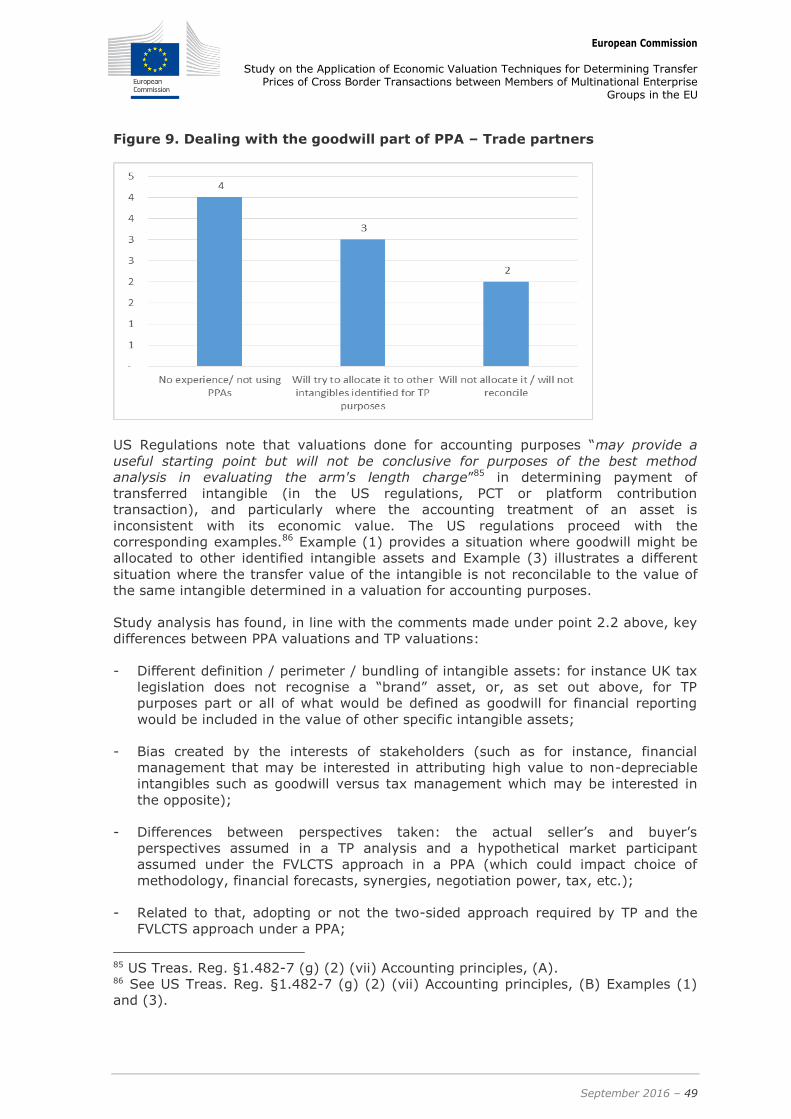
European Commission
Study on the Application of Economic Valuation Techniques for Determining Transfer Prices of Cross Border Transactions between Members of Multinational Enterprise
Groups in the EU
September 2016 – 49
Figure 9. Dealing with the goodwill part of PPA – Trade partners
US Regulations note that valuations done for accounting purposes “may provide a
useful starting point but will not be conclusive for purposes of the best method
analysis in evaluating the arm's length charge”85 in determining payment of
transferred intangible (in the US regulations, PCT or platform contribution
transaction), and particularly where the accounting treatment of an asset is
inconsistent with its economic value. The US regulations proceed with the
corresponding examples.86 Example (1) provides a situation where goodwill might be
allocated to other identified intangible assets and Example (3) illustrates a different
situation where the transfer value of the intangible is not reconcilable to the value of
the same intangible determined in a valuation for accounting purposes.
Study analysis has found, in line with the comments made under point 2.2 above, key
differences between PPA valuations and TP valuations:
- Different definition / perimeter / bundling of intangible assets: for instance UK tax
legislation does not recognise a “brand” asset, or, as set out above, for TP
purposes part or all of what would be defined as goodwill for financial reporting
would be included in the value of other specific intangible assets;
- Bias created by the interests of stakeholders (such as for instance, financial
management that may be interested in attributing high value to non-depreciable
intangibles such as goodwill versus tax management which may be interested in
the opposite);
- Differences between perspectives taken: the actual seller’s and buyer’s
perspectives assumed in a TP analysis and a hypothetical market participant
assumed under the FVLCTS approach in a PPA (which could impact choice of
methodology, financial forecasts, synergies, negotiation power, tax, etc.);
- Related to that, adopting or not the two-sided approach required by TP and the
FVLCTS approach under a PPA;
85 US Treas. Reg. §1.482-7 (g) (2) (vii) Accounting principles, (A). 86 See US Treas. Reg. §1.482-7 (g) (2) (vii) Accounting principles, (B) Examples (1)
and (3).

European Commission
Study on the Application of Economic Valuation Techniques for Determining Transfer Prices of Cross Border Transactions between Members of Multinational Enterprise
Groups in the EU
September 2016 – 50
Valuations from both parties’ perspective 2.3.3
- EU Member States
Respondents were asked to comment on how often in practice they perform a
valuation from both parties’ perspective.
Figure 10. Frequency of valuation from both parties’ perspectives in practice
– EU Member States
Only four Member States respondents (i.e. Denmark, France, Germany, and the UK)
indicated that valuations are performed from both parties’ perspectives “often” or
“very often”. The reasons for not performing the valuations from both parties’
perspective may include the following:
General limited experience with the IP valuation for TP purposes as a whole;
Data availability – and especially absence of the second forecast that reflects the
perspective of the second party;
Resource limitations (budget/fees and time constraints);
Absence of the requirement to perform the valuation from both parties’
perspective.
The respondents also note that they frequently represent strictly one certain party of
the transaction (buyer or seller) – and thus they are not required to look into a
valuation from the second party’s perspective.
At the same time, the importance of both parties’ approach appears to be more
significant in theory than in practice, as observed in the figure below.
11
7
4
0
2
4
6
8
10
12
Never/ Rarely Sometimes Often/ Very often

European Commission
Study on the Application of Economic Valuation Techniques for Determining Transfer Prices of Cross Border Transactions between Members of Multinational Enterprise
Groups in the EU
September 2016 – 51
Figure 11. Do you agree that valuations from both parties’ perspectives are
important? – EU Member States
The survey found that 16 Member States respondents agree with the importance of
both parties approach. These countries are: Belgium, Czech Republic, Denmark,
Finland, France, Germany, Greece, Hungary, Latvia, Lithuania, Luxembourg, Poland,
Portugal, Spain, Sweden, and the UK. Only two disagree (Romania and Slovakia).87
Six Member States respondents did not answer this question.
Next, respondents were asked to comment on the most common approach to selecting
a value in the range of values received from buyer’s and seller’s perspectives (when
applying this approach). The answers are summarised in the following figure:
Figure 12. Most common approach to select a value in the range? – EU
Member States
87 Malta was another country which disagreed with importance of both sided valuations
but, due to the absence of valuations for TP purposes and to be consistent with the
analysis above, it was not accounted for in the Figure.
2
4
16
-
2
4
6
8
10
12
14
16
18
(Strongly) disagree Neutral (Strongly) agree

European Commission
Study on the Application of Economic Valuation Techniques for Determining Transfer Prices of Cross Border Transactions between Members of Multinational Enterprise
Groups in the EU
September 2016 – 52
Only 11 Member States respondents answered this question, due to insufficient
experience of most of the countries. Out of these 11:
Three Member States respondents (i.e. Belgium, the Netherlands and the UK)
indicated that they will choose the point that is closest to the price of the party
which is stronger (as opposed to the second party who is a price taker). The UK
respondent, in this respect gave an example that is it is connected with the use of
different methods for each party's side valuation. For instance, a buyer may not
want to pay more than replacement value, i.e. it is a maximum price to be paid; in
this case, it would not matter what seller wants for the IP based on residual value
approach.
Two Member States respondents (i.e. France and Finland) indicated that the value
selected will be close or equal to the value received for a valuation from the party
in the local Member State.
Six Member States respondents (i.e. Denmark, Germany, Italy, Poland, Romania
and Sweden) note that they are most likely to select a mid-point, for the lack of a
better analysis.
One Member State respondent (Spain, noted as “Other” in the figure above)
pointed out that there is a range of value for each perspective – i.e. a range for
seller and a range for buyer – thus they will try to find an overlap and pick up a
value that lies in this range.
Respondents were also asked about the type of analysis that would be used to
establish the chosen value:
Figure 13. Analysis used to determine a value in two-sided valuation – EU
Member States
Five Member States respondents (i.e. Belgium, the Netherlands, the UK, Italy and
Finland) noted that they attempt bargaining analysis/analysis of options
realistically available to the parties.

European Commission
Study on the Application of Economic Valuation Techniques for Determining Transfer Prices of Cross Border Transactions between Members of Multinational Enterprise
Groups in the EU
September 2016 – 53
Four Member States respondents (i.e. Denmark, Sweden, Germany, and Greece)
noted that it is a simple statistical median/ average between two values, and
Two Member States respondents (i.e. Spain and Portugal) indicated that they use
another type of analysis (noted as other on figure above):
o In case of Spain, the respondent commented that they use a point in the
overlapping portion of two ranges (as per question above)
o In the case of Portugal, the external valuer will not be allowed to pick a
value in the range and this will be left to the client. However, it is
considered in Portugal that any point in the range should be acceptable
from the legal perspective.
Finally, the respondents were asked to comment on what approach a tax
administration may undertake for choosing a value in the range, if not simply settling
on a mid-point value. Respondents’ answers are summarised below.
Figure 14. Analysis possibly undertaken by Tax Administration – EU Member
States
Three Member States respondents (i.e. Belgium, Germany, the Netherlands) noted
that the tax authorities in this case could consider bargaining argumentation or
consideration of the options realistically available;
Five Member States respondents (i.e. Finland, France, Italy, Spain, and the UK)
warn that it is likely that the tax administration will be leaning towards the value
that is best from the local perspective.
Finally, three Member States respondents (i.e. Poland, Portugal and Romania)
noted that it is most likely that the tax administration will stick to the mid-point.
- EU Trade partners
With regards to performing the valuation from both parties’ perspective, most (five) of
the surveyed EU trade partners respondents indicated that they do this “sometimes.”
The US respondent notes that it carried out valuations from both perspectives “often”
and Japanese respondent indicates that it does this “rarely”. Two countries
respondents (Korea and India) explain that although the concept is familiar in their
European Commission
Study on the Application of Economic Valuation Techniques for Determining Transfer Prices of Cross Border Transactions between Members of Multinational Enterprise
Groups in the EU
September 2016 – 54
respective markets, it is usually one particular party of the transaction that is
considered.
All countries but one respondent (Japan) agree that this is important or very
important however to consider both perspectives. The US respondent mentions that it
is not a matter of choice, but is required by US regulations. Japanese respondent
notes that it does not have a strong opinion on the question.
Similar to the respondents in the EU Member States, the trade partners’ respondents
were asked to comment on the most common approach to select a value, if the two
sided approach is used. The responses received can be summed up as follows (due to
their diversity and the limited number of respondents, they are not presented
graphically):
Chinese respondent mentioned that the selected figure will be close to the value
for valuation from the perspective of the party with the stronger bargaining
position.
Swiss respondent noted that this will be a mid-point.
The other four countries respondents to the question gave somewhat unique
answers:
In Australia, according to respondent, only one valuation is done but
accounting for both parties’ perspectives (the price that a transferor accepts
and the transferee is willing to pay),
In Canada, it is left to the client to select a number in the range,
Norwegian respondent mentions no rules in this respect,
The US respondent mentions the cost sharing regulations which need to be
taken into account by the valuer.
Respondents in India, Japan and Korea did not answer due to the lack of
experience with the two-sided valuations.
Respondents were further asked about the kind of analysis that is carried out to
establish and support the value. The answers of the countries vary:
Respondent in Australia commented that it is commercial and market analysis that
is conducted;
Respondent in Canada indicated that mid-point is likely to be chosen;
Respondent in China referred to the functional analysis of the parties;
Respondent in Norway, similarly, referred to a contribution analysis or a similar
analysis;
The US respondent referred to bargaining analysis/ analysis of options realistically
available to the parties;
Respondent in Switzerland noted that, according to its experience, no special
analysis is performed (and mid-point is chosen).

European Commission
Study on the Application of Economic Valuation Techniques for Determining Transfer Prices of Cross Border Transactions between Members of Multinational Enterprise
Groups in the EU
September 2016 – 55
Finally, with respect to experience with the tax authorities’ position, it was noted that:
Four countries respondents (i.e. Australia, Canada, India and the US) noted
(similarly to several Member States for this question) that it is likely that the tax
authority will select a value which is most in its favour.
One country respondent (i.e. Norway) noted that it is expected that contribution
analysis or alike may be attempted by the tax authority.
Special issues: Workforce, Location Savings, Synergies, Goodwill 2.3.4
This section summarises the experience observed in the EU and among EU trade
partners with regards to the special cases that stem from the definition of IP, such as
treatment of workforce, location savings, synergies and goodwill. For this purpose,
information collected from all 28 Member States including the countries with no or
very limited valuation experience in transfer pricing has been analysed, since it is
possible that the legal position or practicalities in their Member State may be relevant
for some of these aspects.
- EU Member States
Workforce
EU Member States respondents were asked about the treatment of workforce from the
standpoint of a valuation for transfer pricing purposes. The responses of all 28
Member States respondents are summarised below. The majority of respondents (16)
indicate no experience with regards to the treatment of workforce in this context. Nine
of respondents (i.e. Austria, Belgium, Estonia, Finland, Germany, Greece, the
Netherlands, Poland, and the UK) consider workforce “something of value” – in this
respect, some Member States respondents refer to the OECD view that workforce is a
comparability factor, while others simply recognise that workforce has a value though
it is never valued separately. No Member State respondent mentioned that workforce
is viewed exclusively as a standalone intangible asset. However three countries
respondents (Denmark, Italy and Spain) mark that they have taken opposing
positions, i.e. defending that it is either an intangible or not an intangible in different
cases. Denmark’s expert mentioned that this choice depended on particular facts and
circumstances. Italian respondent noted that workforce was characterised as an
intangible asset but only in the situation of a full business exit and Spanish respondent
stated that workforce was defended as an intangible in the sense of being viewed as a
transfer of technology (knowledge and expertise, present in the workforce). The
survey results are summarised in the Figure below.

European Commission
Study on the Application of Economic Valuation Techniques for Determining Transfer Prices of Cross Border Transactions between Members of Multinational Enterprise
Groups in the EU
September 2016 – 56
Figure 15. Treatment of workforce – EU Member States
Location savings
The practical observations in the EU show again that many countries do not have
experience with this item. The majority of the Member States respondents with
experience adhere to the OECD approach that location savings represent a
comparability factor and or something of value which is never valued separately but
needs to be considered in the valuation88,89. Only two Member States respondents
mentioned that this item may be an intangible depending on facts and
circumstances90. The results are illustrated in the figure below.
88 In Finland, even the Supreme Administrative Court decided in ruling KHO 2013:36
that location savings are a comparability factor. 89 German experience notes that location savings are part of the valuation pre- and
post-restructuring, being split normally 50/50, at mid-point. 90 In Italy, location savings are linked to going concern value, similar to goodwill.
Other country answering that it “could be either” is Czech Republic.
0
9
3
16
0
2
4
6
8
10
12
14
16
18
1. Intangible 2. Something of value -Not intangible
3. Defended either 4. No experience

European Commission
Study on the Application of Economic Valuation Techniques for Determining Transfer Prices of Cross Border Transactions between Members of Multinational Enterprise
Groups in the EU
September 2016 – 57
Figure 16. Treatment of location savings – EU Member States
Business synergies91
The practical observations in the EU show that, among the Member States with
experience on this issue, most Member States respondents again support the OECD
view that business synergies are something of value and something to consider in
valuations, but are not a separate intangible asset. Respondents in Denmark, France
and Italy indicated that they had experience taking both sides of the argument. The
Member State respondent that views business synergies (in many cases) as an
intangible is Belgium. Member States respondents that indicated that they view
business synergies as something of value but not an intangible are: Austria, Finland,
Germany, the Netherlands, Poland, Romania, Spain, Sweden and the UK.
Figure 17. Treatment of business synergies – EU Member States
91 It is interesting to note that inherently different treatment of synergies in PPA and in
transfer pricing is already analyzed in the literature on the subject. According to
Chandler et al (2010), the fair value in PPAs reflects the synergies that will be realized
by a typical market participant but exclude the synergies specific to a buyer. In
contrast to that, in transfer pricing, the two-sided approach by definition implies that
the valuation (for either party) should include party-specific synergies.
0
13
2
13
0
2
4
6
8
10
12
14
1. Intangible 2. Something of value -Not intangible
3. Defended either 4. No experience
1
9
3
15
0
2
4
6
8
10
12
14
16
1. Intangible 2. Something of value- Not intangible
3. Defended either 4. No experience

European Commission
Study on the Application of Economic Valuation Techniques for Determining Transfer Prices of Cross Border Transactions between Members of Multinational Enterprise
Groups in the EU
September 2016 – 58
Goodwill
The treatment of goodwill differs significantly from Member State to Member State. A
summary of survey results is provided below:
16 Member States respondents mention no experience with the treatment of
goodwill. In this respect, it is noted that goodwill is never valued separately
(Estonia, Finland, Hungary, Italy, Sweden), or the value of goodwill may be
allocated between other identified intangibles (Germany) and that goodwill is not
an intangible, but it is something of value in case of a transfer (Netherlands).
Four Member States respondents note that “goodwill” is referred to as a special
hard-to-value intangible, such as:
- know-how to run the business and having a well-functioning mechanism in
place (Belgium),
- the business reputation of the client/ ability to increase profits of business
in the future (Greece), or
- the emotional connection of consumer with the product or services (the UK
and Sweden).
Five Member States respondents note that they do identify goodwill as a separate
intangible due to the requirements in the national tax code. Respondents in
Austria, Denmark, Poland and Romania note existing special tax statutory rules
that characterise goodwill as IP. Czech respondent refers to accounting legislature
noting that transfer pricing practitioners will adhere to this legislature in such
issues as goodwill.
Respondents in Malta and Cyprus note that they will treat goodwill as IP. In this
respect, it is important to note that these Member States respondents identified
themselves as not having any experience of valuing IP for transfer pricing
purposes due to the lack of transfer pricing rules and regulations.
Spanish respondent notes that it sometimes qualifies goodwill as intangibles.92
92 French respondent also notes that it could be the case that goodwill is an intangible
for transfer pricing purposes, but this position will be avoided as much as possible;
hence France was recorded in the figure as “never.”

European Commission
Study on the Application of Economic Valuation Techniques for Determining Transfer Prices of Cross Border Transactions between Members of Multinational Enterprise
Groups in the EU
September 2016 – 59
Figure 18. Have you treated goodwill as intangible from the transfer pricing
perspective? – EU Member States
- EU Main Trade partners
Workforce
The trade partners respondents were asked the same question as the EU Member
States, with similar findings. The only country considering the workforce as an
intangible is the respondent in India. Respondents in Australia and Korea indicate that
they do not have any experiences in this area.
Figure 19. Treatment of workforce – Trade partners
Location Savings
Similar results were found with respect to the treatment of location savings, with all
countries respondents with relevant experience in the area indicating that they do not
treat it as an intangible. The respondent for India commented that, according to the
16
4 5
3
0
2
4
6
8
10
12
14
16
18
Never (as separateIP)/ No experience
Only if it meanscertain special IP
Special item in the taxcode
Other
1
6
0
2
0
1
2
3
4
5
6
7
1. Intangible 2. Something ofvalue - Notintangible
3. Defended either 4. No experience
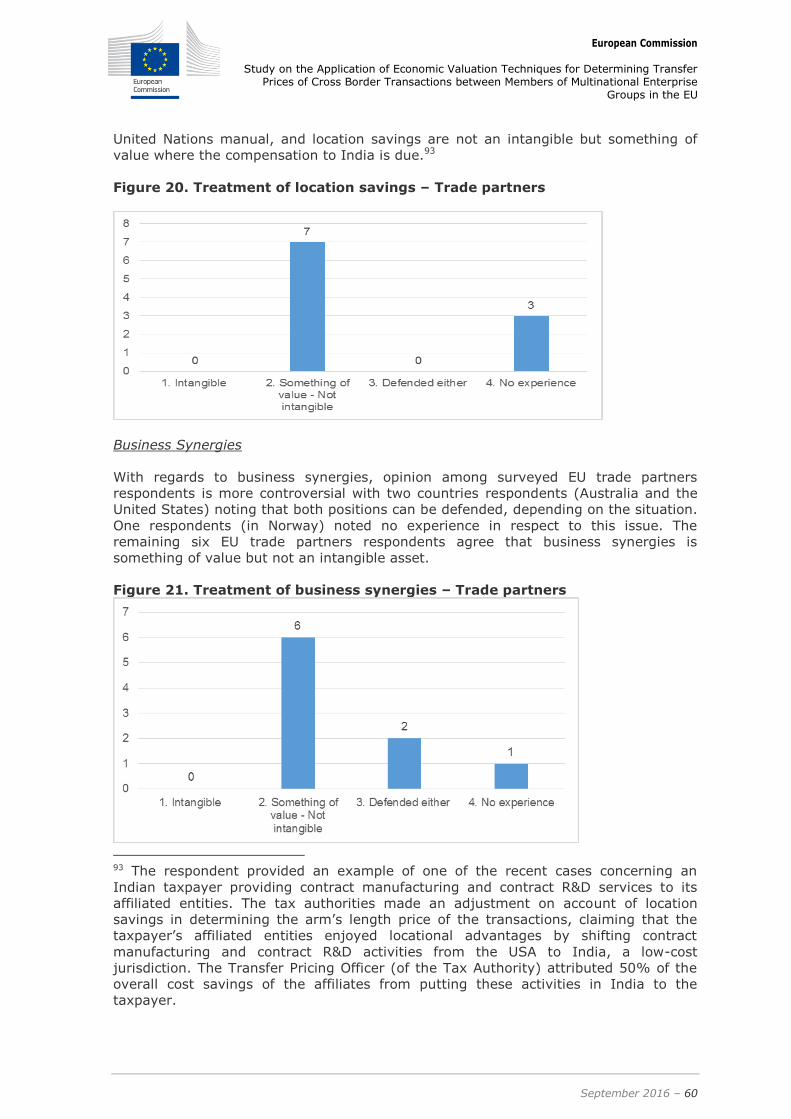
European Commission
Study on the Application of Economic Valuation Techniques for Determining Transfer Prices of Cross Border Transactions between Members of Multinational Enterprise
Groups in the EU
September 2016 – 60
United Nations manual, and location savings are not an intangible but something of
value where the compensation to India is due.93
Figure 20. Treatment of location savings – Trade partners
Business Synergies
With regards to business synergies, opinion among surveyed EU trade partners
respondents is more controversial with two countries respondents (Australia and the
United States) noting that both positions can be defended, depending on the situation.
One respondents (in Norway) noted no experience in respect to this issue. The
remaining six EU trade partners respondents agree that business synergies is
something of value but not an intangible asset.
Figure 21. Treatment of business synergies – Trade partners
93 The respondent provided an example of one of the recent cases concerning an
Indian taxpayer providing contract manufacturing and contract R&D services to its
affiliated entities. The tax authorities made an adjustment on account of location
savings in determining the arm’s length price of the transactions, claiming that the
taxpayer’s affiliated entities enjoyed locational advantages by shifting contract
manufacturing and contract R&D activities from the USA to India, a low-cost
jurisdiction. The Transfer Pricing Officer (of the Tax Authority) attributed 50% of the
overall cost savings of the affiliates from putting these activities in India to the
taxpayer.

European Commission
Study on the Application of Economic Valuation Techniques for Determining Transfer Prices of Cross Border Transactions between Members of Multinational Enterprise
Groups in the EU
September 2016 – 61
Goodwill
Results regarding the treatment of goodwill among trade partners are similar to those
among Member States. The comments received in this respect are the following:
Goodwill is not valued separately but it is part of the overall business value in case
of the transfer of a business and it needs to be attached to something
(respondents in India, Japan, Norway and Switzerland).
Respondents in Canada, China and Korea note that it would rather not be valued
as a separate asset.
The US respondent notes that although it is not a stand-alone intangible, it needs
to be explicitly considered, based on the US regulations that address this issue.94
Australian respondent notes that it is valued in the sense that it stands for a
special intangible such as business reputation and customer base.
94 See discussion under Section 2.3.2 when dealing with goodwill part of PPA for Trade
Partners and corresponding examples in US Treas. Reg. §1.482-7 (g) (2) (vii)
Accounting principles, (B).

European Commission
Study on the Application of Economic Valuation Techniques for Determining Transfer Prices of Cross Border Transactions between Members of Multinational Enterprise
Groups in the EU
September 2016 – 62
3. Intangibles valuation methods used in TP
3.1 Introduction
Building on the previous analysis (in Section 2), it can be concluded that, it is not
(broadly defined) valuation approaches and methods that are different when used in
transfer pricing (vis-à-vis other applications) but the fact that “the use of methods is
highly context-specific. The context of the particular valuation will determine which
method, or methods, is most appropriate for valuing a specific asset in a particular
situation.95” In addition, the valuation involves assumptions and judgement by the
valuer which, in practice, are translated into how the valuation model is assembled in
terms of its building blocks and underlying financial data and how parameters are
calibrated and quantified.96
The OECD’s TPG recognise economic valuation techniques as “a useful tool for
determining the arm’s length price for transactions involving the transfer of intangibles
or rights in intangibles.” However, under the TPG, the most appropriate transfer
pricing (i.e. OECD endorsed) method must be selected and hence, transfer pricing
specialists (usually) present economic valuation techniques chosen for analysis as
consistent with an OECD method(s).
The follow elements are contained in this section:
(1) An overview of general valuation approaches, namely, market-, income- and cost-
, and the specific valuation methods under these approaches
(2) Description on how these approaches fit in the framework of the OECD methods
for transfer pricing
(3) Explanations, based on the survey performed, of the state of play in the EU
Member States in terms of valuation techniques used currently for transfer pricing
valuations of IP
(4) A SWOT analysis of these methods, in theory and based on the survey.
(5) Indication of potential solutions that are especially appropriate for transfer pricing
purposes that may address some of the shortcomings of valuation methodologies
in a transfer pricing context. The main two solutions investigated are the use of
more than one method to perform a valuation and the use of price adjustment
clauses.
3.2 Valuation approaches and methods
Specific issues in valuing intangibles 3.2.1
The valuation of intangible assets is generally made more complex by the
heterogeneous nature of these intangibles. The uniqueness of intangible assets makes
comparisons with other assets more difficult, thereby limiting the usefulness of
comparison based pricing. As stated in the RTD report, as a result of this uniqueness,
“valuations are often based on assumptions about the asset’s future use, what
95 The RTD report at 12. 96 The RTD report at 5-6.

European Commission
Study on the Application of Economic Valuation Techniques for Determining Transfer Prices of Cross Border Transactions between Members of Multinational Enterprise
Groups in the EU
September 2016 – 63
important milestones are to be met and what management decisions will be taken.”97
This conclusion is not limited to a particular field (e.g. accounting, financial reporting,
etc.) but is equally true for transfer pricing.
The economic characteristics of intangible assets are rather well-known, and are
significantly different to tangible assets98:
Intangible assets are in general not diminished by use, and can typically be used
simultaneously by more than one party (from an economic point of view, although
this may of course be subject to legal / contractual limitations);
There is seldom a linear relationship between the cost of creating the asset and its
value. The risk of wasted investment is high and variable, but this is usually
countered by a high upside potential;
The value of intangibles often results from linkages with other assets; and
Most companies have inadequate metrics regarding the strength, performance and
value of their intangibles.
This does not mean that valuations for intangibles cannot be prepared reliably, but the
approaches used, although based on similar principles, are often more complex than
for tangible assets, and additional information and support may be required for a
robust valuation.
General valuation approaches: market-, cost-, and income 3.2.2
The valuation methodologies in general can be divided into three main approaches:
Figure 22.Valuation approaches
Although nearly all valuation methods fall under one (or more) of these three
approaches, it is sometimes arguable99 to determine which particular approach is
selected.
97 Ibid, at 5. 98 See for instance, Baruch (2001) at 2-4. 99 One method can be considered both market and income approach, e.g. the Relief
from royalty method.

European Commission
Study on the Application of Economic Valuation Techniques for Determining Transfer Prices of Cross Border Transactions between Members of Multinational Enterprise
Groups in the EU
September 2016 – 64
While the broad principles of these approaches are similar when applied to different
asset classes and to businesses, the practical application and appropriate methodology
can be more complex for intangible assets.
(1) The Income Approach quantifies the net present value of future benefits
associated with ownership of the business or asset. The estimated future benefits
that accrue to the owner are typically the future expected “income”, i.e. earnings
or cash flows obtained from exploitation of the asset. A key aspect of this
approach as applied to intangible assets is the method by which earnings or cash
flows related to a specific intangible asset are estimated / derived, starting from
the earnings or cash flows of the business as a whole. This forms the subject of
several specific methods analysed below.
Next, the forecast of the earnings is discounted or capitalised at a rate appropriate
for the risks associated with those future benefits. Discounting is a standard
approach in the application of the income approach (but also relevant in several
cases under the other approaches below).
(2) The Market Approach estimates the value of an asset by a reference to “market”
prices. In respect of valuations of businesses, both M&A activity and stock market
activity are considered in deriving various “benchmarks” (such as multiples of
financial or non-financial indicators). On the other hand, for valuations of
intangible assets, there may not be an available (or disclosed) market price for
the full transfer of such assets, due both to the less frequent nature of such
outright transfers between unrelated parties, and to the uniqueness of such
assets. The market approach may also be based on identification of a “market”
price (such a royalty for rights to use an intangible or a price premium enjoyed by
the products containing the valued IP), which is then translated into a future
earnings stream and discounted to calculate an overall value. However, such a
methodology (relief from royalty or price premium methods) may be referred to,
based on focus and preference of the valuer, as both a market and an income
approach.
(3) The Cost-based Approach connects a value of an individual asset with a measure
of its cost. The cost-based approach has certain limitations in the valuation of
intangible assets, as the value generated by an intangible may have no or limited
connection to the costs incurred in its development, but may remain relevant in
the case of intangible assets that can be (quickly) re-created or re-acquired to a
similar standard. One can further expect that in a world of perfect competition,
where intangibles can be developed in many competing forms, intangible values
would converge towards a fair return on investments, i.e. costs incurred.
A subset of the cost-based approach, used in the valuation of businesses, is the
asset-based approach. This is consistent with the notion that a business is worth
the sum of its parts, i.e. its individual assets (which in turn may be valued by one
of the three main approaches). This approach is less common in transfer pricing,
as it concerns the value of an entire business rather than of a specific asset. For
general valuation purposes, it is mainly used for specific asset-heavy sectors (real
estate, financial institutions, etc.) or in specific circumstances (business closure or
restructuring, etc.).
Main Valuation methodologies 3.2.3
Under the general valuation approaches, there are specific valuation techniques. For
the purposes of the present study, the following main techniques have been defined
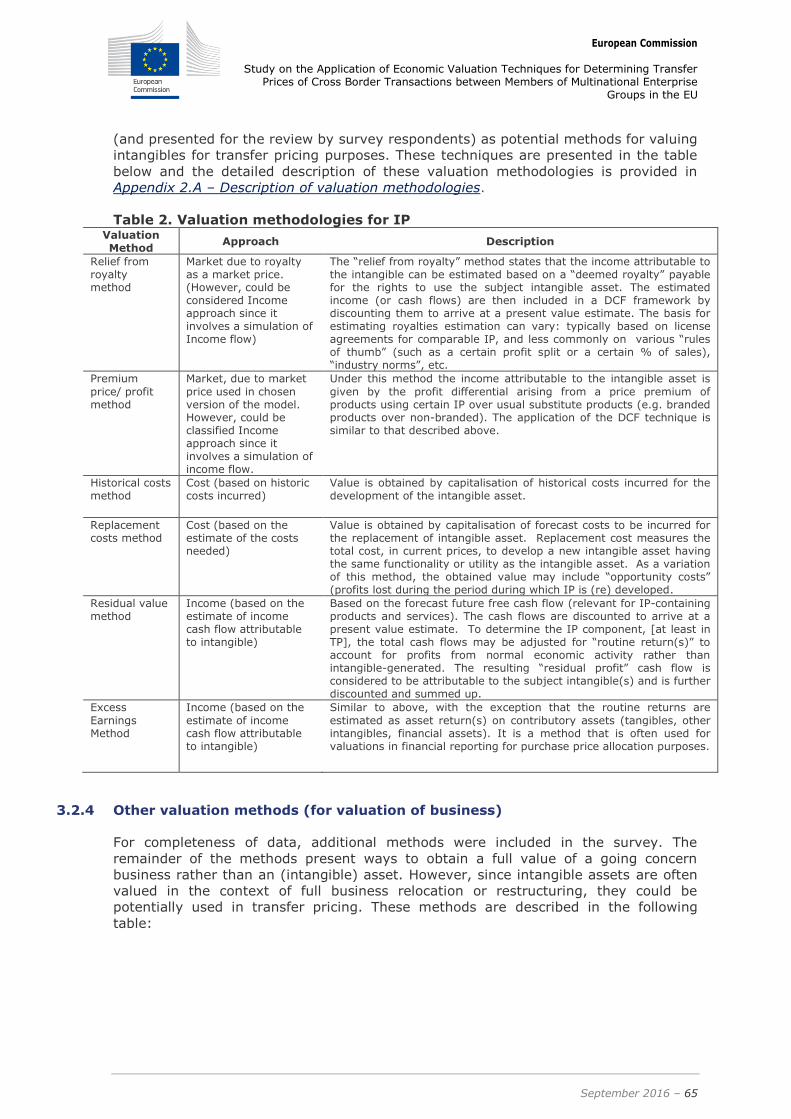
European Commission
Study on the Application of Economic Valuation Techniques for Determining Transfer Prices of Cross Border Transactions between Members of Multinational Enterprise
Groups in the EU
September 2016 – 65
(and presented for the review by survey respondents) as potential methods for valuing
intangibles for transfer pricing purposes. These techniques are presented in the table
below and the detailed description of these valuation methodologies is provided in
Appendix 2.A – Description of valuation methodologies.
Table 2. Valuation methodologies for IP Valuation Method
Approach Description
Relief from royalty method
Market due to royalty as a market price. (However, could be considered Income approach since it involves a simulation of Income flow)
The “relief from royalty” method states that the income attributable to the intangible can be estimated based on a “deemed royalty” payable for the rights to use the subject intangible asset. The estimated income (or cash flows) are then included in a DCF framework by discounting them to arrive at a present value estimate. The basis for estimating royalties estimation can vary: typically based on license agreements for comparable IP, and less commonly on various “rules of thumb” (such as a certain profit split or a certain % of sales), “industry norms”, etc.
Premium
price/ profit method
Market, due to market
price used in chosen version of the model. However, could be classified Income approach since it involves a simulation of income flow.
Under this method the income attributable to the intangible asset is
given by the profit differential arising from a price premium of products using certain IP over usual substitute products (e.g. branded products over non-branded). The application of the DCF technique is similar to that described above.
Historical costs method
Cost (based on historic costs incurred)
Value is obtained by capitalisation of historical costs incurred for the development of the intangible asset.
Replacement costs method
Cost (based on the estimate of the costs needed)
Value is obtained by capitalisation of forecast costs to be incurred for the replacement of intangible asset. Replacement cost measures the total cost, in current prices, to develop a new intangible asset having the same functionality or utility as the intangible asset. As a variation of this method, the obtained value may include “opportunity costs” (profits lost during the period during which IP is (re) developed.
Residual value method
Income (based on the estimate of income cash flow attributable to intangible)
Based on the forecast future free cash flow (relevant for IP-containing products and services). The cash flows are discounted to arrive at a present value estimate. To determine the IP component, [at least in TP], the total cash flows may be adjusted for “routine return(s)” to account for profits from normal economic activity rather than intangible-generated. The resulting “residual profit” cash flow is considered to be attributable to the subject intangible(s) and is further discounted and summed up.
Excess
Earnings Method
Income (based on the
estimate of income cash flow attributable to intangible)
Similar to above, with the exception that the routine returns are
estimated as asset return(s) on contributory assets (tangibles, other intangibles, financial assets). It is a method that is often used for valuations in financial reporting for purchase price allocation purposes.
Other valuation methods (for valuation of business) 3.2.4
For completeness of data, additional methods were included in the survey. The
remainder of the methods present ways to obtain a full value of a going concern
business rather than an (intangible) asset. However, since intangible assets are often
valued in the context of full business relocation or restructuring, they could be
potentially used in transfer pricing. These methods are described in the following
table:
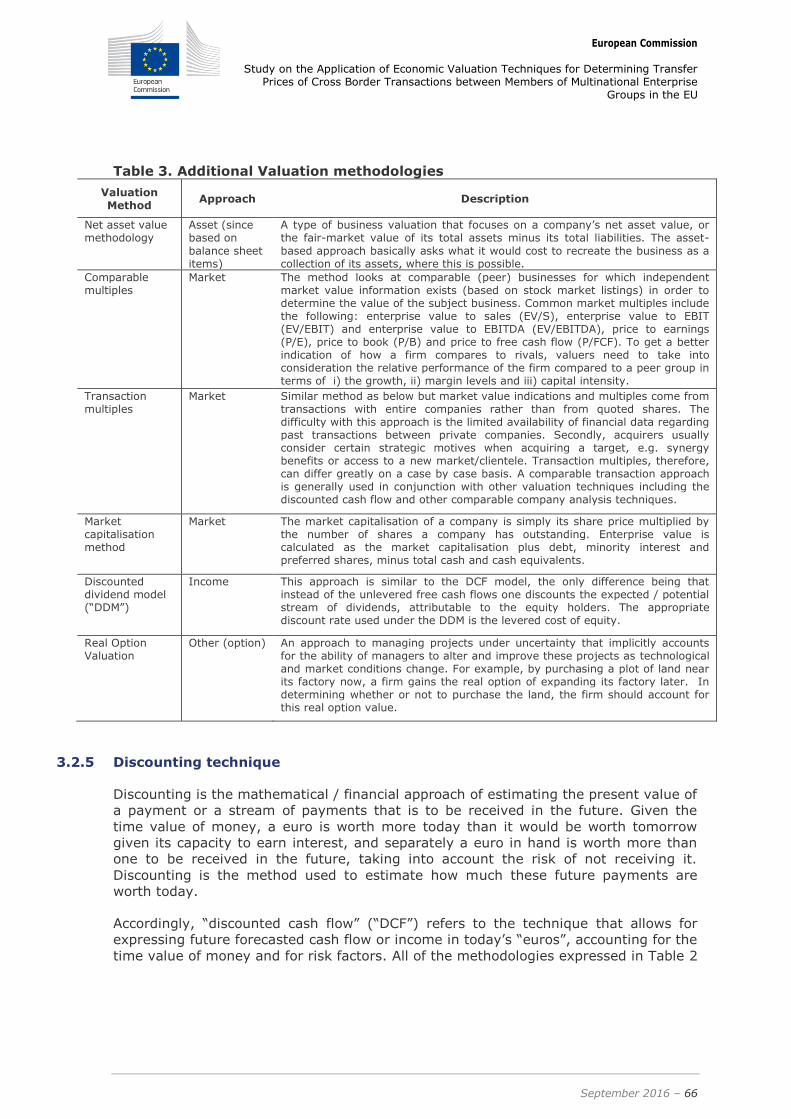
European Commission
Study on the Application of Economic Valuation Techniques for Determining Transfer Prices of Cross Border Transactions between Members of Multinational Enterprise
Groups in the EU
September 2016 – 66
Table 3. Additional Valuation methodologies
Valuation Method
Approach Description
Net asset value methodology
Asset (since based on
balance sheet items)
A type of business valuation that focuses on a company’s net asset value, or the fair-market value of its total assets minus its total liabilities. The asset-
based approach basically asks what it would cost to recreate the business as a collection of its assets, where this is possible.
Comparable multiples
Market The method looks at comparable (peer) businesses for which independent market value information exists (based on stock market listings) in order to determine the value of the subject business. Common market multiples include the following: enterprise value to sales (EV/S), enterprise value to EBIT (EV/EBIT) and enterprise value to EBITDA (EV/EBITDA), price to earnings (P/E), price to book (P/B) and price to free cash flow (P/FCF). To get a better indication of how a firm compares to rivals, valuers need to take into consideration the relative performance of the firm compared to a peer group in terms of i) the growth, ii) margin levels and iii) capital intensity.
Transaction multiples
Market Similar method as below but market value indications and multiples come from transactions with entire companies rather than from quoted shares. The difficulty with this approach is the limited availability of financial data regarding past transactions between private companies. Secondly, acquirers usually consider certain strategic motives when acquiring a target, e.g. synergy benefits or access to a new market/clientele. Transaction multiples, therefore, can differ greatly on a case by case basis. A comparable transaction approach is generally used in conjunction with other valuation techniques including the discounted cash flow and other comparable company analysis techniques.
Market capitalisation method
Market The market capitalisation of a company is simply its share price multiplied by the number of shares a company has outstanding. Enterprise value is calculated as the market capitalisation plus debt, minority interest and preferred shares, minus total cash and cash equivalents.
Discounted dividend model (“DDM”)
Income This approach is similar to the DCF model, the only difference being that instead of the unlevered free cash flows one discounts the expected / potential stream of dividends, attributable to the equity holders. The appropriate discount rate used under the DDM is the levered cost of equity.
Real Option Valuation
Other (option) An approach to managing projects under uncertainty that implicitly accounts for the ability of managers to alter and improve these projects as technological and market conditions change. For example, by purchasing a plot of land near its factory now, a firm gains the real option of expanding its factory later. In determining whether or not to purchase the land, the firm should account for this real option value.
Discounting technique 3.2.5
Discounting is the mathematical / financial approach of estimating the present value of
a payment or a stream of payments that is to be received in the future. Given the
time value of money, a euro is worth more today than it would be worth tomorrow
given its capacity to earn interest, and separately a euro in hand is worth more than
one to be received in the future, taking into account the risk of not receiving it.
Discounting is the method used to estimate how much these future payments are
worth today.
Accordingly, “discounted cash flow” (“DCF”) refers to the technique that allows for
expressing future forecasted cash flow or income in today’s “euros”, accounting for the
time value of money and for risk factors. All of the methodologies expressed in Table 2
European Commission
Study on the Application of Economic Valuation Techniques for Determining Transfer Prices of Cross Border Transactions between Members of Multinational Enterprise
Groups in the EU
September 2016 – 67
above may employ discounting techniques, except a historic cost approach which
would rather involve “capitalising”.100
The OECD confirms this view, noting that there are multiple valuation techniques
using discounting of cash flows: “Valuation techniques that estimate the discounted
value of projected future cash flows derived from the exploitation of the transferred
intangible or intangibles can be particularly useful when properly applied. There are
many variations of these valuation techniques.”101
3.3 Alignment of valuation methodologies with the OECD - authorised TP methods
OECD methodologies 3.3.1
In general, OECD valuation methodologies aim to be applicable to various types of
transactions, including intra-group transactions with goods and services, in the normal
course of business of the relevant entities, as well as one-off transactions with
tangible or intangible assets of such entities. Accordingly, the overall categorisation
and description of these methodologies does not reconcile automatically with methods
used in the valuations of intangibles. In the remainder of this subsection the standard
OECD methodologies are set out, and under Section 3.3.2 (Table 4) suggested
reconciliation between these standard methodologies and intangible asset valuation
methodologies is provided.
In transfer pricing, the main five methods are distinguished on the basis of being able
to establish a “direct” comparison between the tested transfer price and the price
established by application of the method. These five methods are summarised as
follows and are described in detail in Appendix 3 – Description of OECD
methodologies:
Comparable uncontrolled price (“CUP”) method: provides the most direct
comparison by comparing prices (including royalties as a “price” for the use of an
intangible) in the related party transactions with prices in the comparable
transactions. Therefore, due to such direct comparison, the CUP method has the
strictest comparability conditions.
Cost plus method: evaluates the gross margin / mark up earned in the tested
transaction by comparison on the same type of margin in the comparable
transaction. There is one level of separation from the CUP methodology in the way
that methodology compares margins rather than absolute prices. Cost plus
method, as such, is rarely used in connection with the intangibles given the fact
that gross (production) prices are often difficult to establish for intangibles, but
also based on the fact that it has been argued by some – among which the OECD -
that there may be disconnect between the value of intangibles and the underlying
costs of their development.
Resale price method: looks at gross margin earned at a reseller side instead of
mark-up on the selling party (typically manufacturer or service provider). Again,
the same type of comparison is pursued with the margins in unrelated transactions
of similar type. The resale price method appears to be most applicable for testing
resellers that do not significantly change the product – or the intangible. Situations
100 Compounding is a technique that is opposite of discounting which translates
yesterday’s values in today’s euros or the present values in tomorrow’s euro terms. 101 OECD, Aligning transfer pricing outcomes with value creation, para. 6.157
European Commission
Study on the Application of Economic Valuation Techniques for Determining Transfer Prices of Cross Border Transactions between Members of Multinational Enterprise
Groups in the EU
September 2016 – 68
whereby a party would re-sell an intangible, or a license to an intangible, if
technically not impossible, tend not to be common, making the resale price
method a less used approach for intangibles.
Transactional net margin method (TNMM): by construction is similar to cost plus
and resale price methodologies but has less strict standards of comparability, and
implies looking at the net operating profits earned in (aggregated) transactions. In
practice, the TNMM proves to be most used method as it allows comparing overall
operating profit of the tested (i.e. related) entity with the operating profit of
generally comparable companies observed in similar markets and industry. Due to
the abstraction of separate / individual transactions, the method allows a transfer
pricing practitioner to look at annual profitability and compare it with identified
benchmarks. By its definition, the TNMM method is applied only to test a “routine”
activity, i.e. the activity for which benchmarks could exist. In application to the
transactions involving a transfer or license of an intangible, the TNMM method
typically implies that the profitability remaining after deducting a routine margin
(established by comparing the comparable companies’ profitability) is attributable
to an excess profit capacity generally attributable to intangibles. In this way,
TNMM is an indirect method for intangibles pricing.
The transactional profit split methodology: looks at the overall (net) profit earned
by parties at the both end of the transaction. The allocation of this profit is then
pursued by the methodology, either directly, based on the contribution of the
parties (contribution analysis), or after deducting “routine” returns to the parties
for their regular business activities (such as routine manufacturing, distribution,
service, etc.). As such, profit split method can derive an arm’s length remuneration
to the parties – presumably parties on both sides of transactions own and/or
develop intangibles. If this is not a case (and only one party owns intangibles), the
method appears to converge to the TNMM methodology described above (testing
the party with no intangible as an entity with routine functions).
In their “classical” application, the OECD methodologies aim to establish a price for
regularly occurring transactions that do not have a long-lasting effect. This is not a
case of a transfer of intangible assets which generally has a long-lasting effect.
However, nothing in design of the OECD methodologies precludes their use in
combination with the discounted cash flow / discounted income techniques. To the
contrary, the OECD makes explicit reference to cash flow technique in its Action 8-10
report.102 In practice, this will mean that the relevant financial result from one-year
price or margin will be forecast into the future and the present value can be obtained
by a discounting technique.
Fitting the two together 3.3.2
Establishing a link between a valuation technique and approach and an OECD
methodology is, to some extent, a subjective decision of a transfer pricing practitioner.
In the same way as the valuation expert can describe a royalty relief method as an
income approach or a market approach, depending on his/her focus of the various
elements of the methodology, a transfer pricing practitioner may qualify a particular
valuation model/approach under a different transfer pricing methodology. The possible
“fit” of the surveyed methodology and the OECD methodologies is explored in the
table below.
102 OECD, Aligning transfer pricing outcomes with value creation, sections D.2.6.3 –
D.2.6.4.

European Commission
Study on the Application of Economic Valuation Techniques for Determining Transfer Prices of Cross Border Transactions between Members of Multinational Enterprise
Groups in the EU
September 2016 – 69
Table 4. OECD characterisation of valuation methods
Valuation methods for intangible
assets
Possible characterisation
from OECD perspective
Brief reasoning
Relief from royalty CUP The deemed royalty is typically based on the royalty rates observed in the market based on the search under the CUP method
Premium profits /price CUP The premium profits stem from comparison of prices for products containing the intangible vis-à-vis prices for generic product
Historic/ replacement cost
Cost plus Similar to the cost plus methodology which accounts for underlying costs; especially if the historic/ replacement costs are accounted with inclusion of a (limited) profit element (mark-up)
Residual value method
TNMM The full forecast of operating profits/ cash flows is typically adjusted for a routine profit from regular business activity. The routine profit is benchmarked based on the principles of the TNMM.
Excess earnings TNMM Similar to the method above, but instead of deducting a routine profit on other activities, under this method a return on contributory assets is deducted. These returns on identifiable assets may be subject to a benchmarking study.
The table above provides only one possibility of merging the methods and it should be
kept it mind that the precise characterisation will depend on the details of the studied
transfer. An example provided by one survey respondent involved a case of a contract
manufacturer in the local country which acquires the rights to a trademark from a
related foreign entity. To determine the value for the trademark, the profitability of
the contract manufacturer was estimated, after deducting a routine return for
manufacturing activities from overall forecast profitability. The “residual profit”, i.e.
profit remaining after a routine return deduction (and after summing up and
discounting) was considered to be an arm’s length value of the trademark. The
methodology was described as a profit split methodology.
3.4 Use of valuation methods in transfer pricing
EU Member States 3.4.1
In respect of surveyed methods, the respondents from each Member State were asked
to rank the usage of each method in valuation of IP for transfer pricing purposes.
Responses to this question were provided by 21 Member States respondents. Seven
countries which identified no cases of valuation for transfer pricing purposes were
omitted (Croatia, Cyprus, Malta, Ireland, and Slovenia, Bulgaria and Estonia).

European Commission
Study on the Application of Economic Valuation Techniques for Determining Transfer Prices of Cross Border Transactions between Members of Multinational Enterprise
Groups in the EU
September 2016 – 70
Figure 23. Usage of main IP valuation methods for TP purposes
It is observed that method 5, defined as “Residual value method” is ranked as the
most popular by respondents. Only one country noted that it is rarely used (Austria)
whereas three countries noted it is used sometimes (Lithuania, Luxembourg, and
Romania). It is important to note that, in these three countries, the valuation of
intangibles for TP purposes appears to be limited.
The second method in popularity is method 1, “Relief from royalty” with 10 Member
States respondents indicating that they use it frequently while seven others note that
it is sometimes used.
With regards to the approach for selecting the (valuation) method, Member States
respondents were asked to identify the most important factors driving the decision to
use a specific valuation method(s) to value an intangible asset, e.g. OECD historical
hierarchy of methods, acceptability by local tax administration, availability of (reliable)
information on parameters, availability of reliable forecast, or any other factor.

European Commission
Study on the Application of Economic Valuation Techniques for Determining Transfer Prices of Cross Border Transactions between Members of Multinational Enterprise
Groups in the EU
September 2016 – 71
Figure 24. Most important factors in selecting the valuation method
For this question, 18 Member State respondents answered. Out of 18 responses, five
provided more than one answer as the first and second priorities. In this case, both
answers were included in the analysis; thus the total number of responses accounted
for in the graph is 23. One responded answered “all” factors and thus the most
important factor could not be differentiated from each other. This response was
discounted from the sample. Other Member States respondent noted that they lack
experience with valuations of IP for transfer pricing purposes, and therefore had no
input.
As illustrated from the figure above, availability of (internal and market) data that
makes a certain method the most reliable was indicated as the most important factor.
Consistency with the OECD and/or local regulations was indicated six times; the other
reasons indicated as most important were acceptability / experience with the local tax
administration and type of intangible valued.
A related question in the survey inquired whether a Member State respondent agreed
with the OECD finding that the income-based methods may be most useful than cost-
based or market-based approaches and to what degree the use of income-based
methods is a common practice.
10
4
6
3
0
2
4
6
8
10
12
Availability of datathat allows the use of
a certainmethodology as the
most reliable/appropriate
Acceptability by TA OECD or localregulations guidance
Type of intangiblevalued
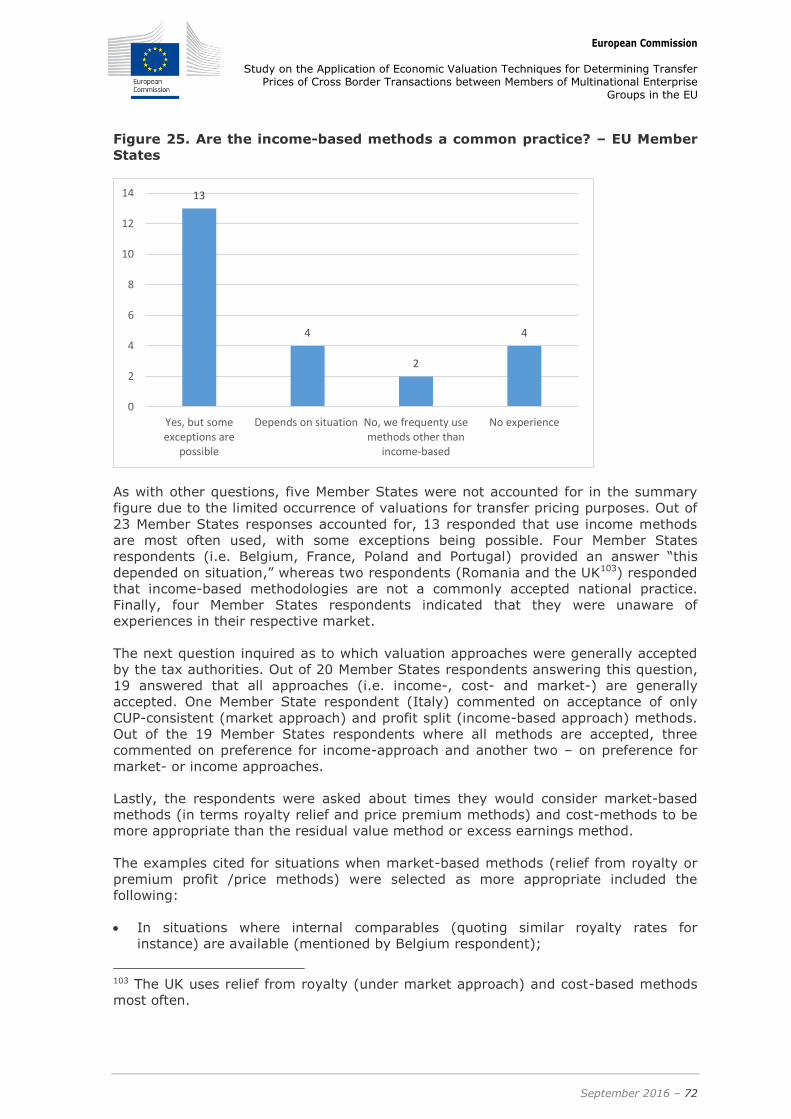
European Commission
Study on the Application of Economic Valuation Techniques for Determining Transfer Prices of Cross Border Transactions between Members of Multinational Enterprise
Groups in the EU
September 2016 – 72
Figure 25. Are the income-based methods a common practice? – EU Member
States
As with other questions, five Member States were not accounted for in the summary
figure due to the limited occurrence of valuations for transfer pricing purposes. Out of
23 Member States responses accounted for, 13 responded that use income methods
are most often used, with some exceptions being possible. Four Member States
respondents (i.e. Belgium, France, Poland and Portugal) provided an answer “this
depended on situation,” whereas two respondents (Romania and the UK103) responded
that income-based methodologies are not a commonly accepted national practice.
Finally, four Member States respondents indicated that they were unaware of
experiences in their respective market.
The next question inquired as to which valuation approaches were generally accepted
by the tax authorities. Out of 20 Member States respondents answering this question,
19 answered that all approaches (i.e. income-, cost- and market-) are generally
accepted. One Member State respondent (Italy) commented on acceptance of only
CUP-consistent (market approach) and profit split (income-based approach) methods.
Out of the 19 Member States respondents where all methods are accepted, three
commented on preference for income-approach and another two – on preference for
market- or income approaches.
Lastly, the respondents were asked about times they would consider market-based
methods (in terms royalty relief and price premium methods) and cost-methods to be
more appropriate than the residual value method or excess earnings method.
The examples cited for situations when market-based methods (relief from royalty or
premium profit /price methods) were selected as more appropriate included the
following:
In situations where internal comparables (quoting similar royalty rates for
instance) are available (mentioned by Belgium respondent);
103 The UK uses relief from royalty (under market approach) and cost-based methods
most often.
13
4
2
4
0
2
4
6
8
10
12
14
Yes, but someexceptions are
possible
Depends on situation No, we frequenty usemethods other than
income-based
No experience

European Commission
Study on the Application of Economic Valuation Techniques for Determining Transfer Prices of Cross Border Transactions between Members of Multinational Enterprise
Groups in the EU
September 2016 – 73
When there is no business plan and thus not possible to use an income method
(like the residual value method) but broadly comparable prices can be identified
(Italy);
When there is a third party price available for the full bundle of intangibles
acquired (for instance, the IP is acquired from a third party and subsequently
transferred intercompany) (quoted by Romanian respondent);
For trademarks and trade names (if comparable royalty arrangements are possible
to identify), mentioned by Swedish respondent;
The cost based methods (historical costs or replacement costs) were found more
appropriate by respondents in the following situations:
When the final product is not fully developed, for example pharmaceuticals up to a
certain phase of development (when there is high degree of uncertainty in financial
forecast to use discounted cash flow / residual profit method). Four countries
respondents provided the example of pharma-type situation (Belgium, Poland,
Sweden, and the UK);
When valuation concerns a software (e.g. computer games) or simple /
copyrighted IP which can be replicated (six countries respondents provided an
example of the software-type product, these are from Belgium, Cyprus, Germany,
Latvia, Netherlands, and Poland);
When valuated IP may be of limited / not significant value (mentioned by Spain).
EU trade partners 3.4.2
The experience of the trade partners with respect to methods is similar to EU Member
States. Overall, respondents also ranked method 5 (residual value method) as the
most popular. Modelling based on the projected free cash flows and adjusting for
routine return is ranked as often used among the nine trade partners surveyed.
Figure 26. Usage of main IP valuation methods for TP purposes – Trade
partners

European Commission
Study on the Application of Economic Valuation Techniques for Determining Transfer Prices of Cross Border Transactions between Members of Multinational Enterprise
Groups in the EU
September 2016 – 74
With regards to the factors most important for determining a valuation approach, the
countries provided slightly different answers (similar to the EU Member States
responses):
Respondents from Korea and Norway mentioned that, indeed, the availability of
data is probably the most important factor.
Respondents from China, India and Switzerland identified the acceptability by the
tax administration, given that data is available, as the most important factor.
Australian respondent responded that its focus is on identifying the most
appropriate and reliable method in line with what third parties would choose,
taking into account available data and experience with the tax administration.
Canadian respondent mentioned that it is typically income-based methods that are
used; Japanese respondent echoes the answer noting that TNMM-based or profit-
based methodology is typically used in valuations of IP for transfer pricing
purposes
Finally, the US respondent stressed that the most important step is to correctly
identify the rights that are to be valued, with the next priority being the guidance
in the US regulations, and the use of “the best method” approach.
With respect to the common use of the income-based methods in practice, the
answers of trade partners’ specialists were predominately affirmative, as illustrated
below.
Figure 27. Are the income-based methods a common practice? – Trade
partners
3.5 SWOT analysis of valuation methods
An analysis of the Strengths, Weaknesses, Opportunities and Threats (SWOT) of the
valuation methods was carried out. The SWOT analysis was conducted in accordance
with the following criteria:
(1) Economic Relevance – this feature measures to what degree the methodology
reflects the economic value of the intangible studied;

European Commission
Study on the Application of Economic Valuation Techniques for Determining Transfer Prices of Cross Border Transactions between Members of Multinational Enterprise
Groups in the EU
September 2016 – 75
(2) Objectivity – to what degree the main parameters can be objectivised based on
the comparable or taxpayer-specific data. A higher objectivity, in a way, may
narrow the range of the values obtained through application of the methodology;
(3) Relative ease of use – this feature attempts to measure the how simple the
methodology is to understand and ease of adoption for use by a valuer (TP
practitioner who acts as a valuer);
(4) Appropriate benchmarks – this feature looks at the degree to which (appropriate)
market benchmarks are available. For instance, most intangibles will not have
exact comparables – e.g. it is not possible to find a comparable to “Coca Cola”
brand and trademark. Similarly, customer relationships in a particular business or
industry and territory may not have any “comparables”;
(5) Market connection – this measures to what degree the key inputs can be observed
directly on the market (i.e. to what degree the methodology measures the price
directly based on market price); and
(6) Amount of data required – this feature measures the amount and extent of data
required for applying the methodology.
SWOT analysis 3.5.1
The figure below summarises the analysis of strengths and weaknesses of the
methods. The level of strength or weakness in illustrated by the coloured circles:
- A dark blue coloured circle indicates that the method ranks highly (strongly)
with respect to the aspect studied;
- A medium blue coloured circle indicates that the method ranks medium with
respect to the aspect studied;
- A white coloured circle indicates that the method ranks low (weak) with respect
to the aspect studied.
Figure 28. Strength and weaknesses analysis of the valuation methods

European Commission
Study on the Application of Economic Valuation Techniques for Determining Transfer Prices of Cross Border Transactions between Members of Multinational Enterprise
Groups in the EU
September 2016 – 76
From the graphic presentation above, the following strengths and weaknesses can be
observed:
In terms of economic relevance, the residual value and excess earnings methods
seem to be strongest as they reflect the full potential of the assessed intangible.
This is also true for relief from royalty and premium profits techniques, provided
that the valuer is able to find appropriate (comparable) transactions to determine
royalty rate in relief from royalty and correctly estimate price premium enjoyed by
the product using a valued IP.104 The cost-based methods seem to be less
connected to the economic value of the intangible, especially the historic costs
approach measuring the actual incurred costs, which may have no link to the value
of intangible.
In terms of objectivity, the historical cost approach seems to be most objective as
it is based on the measure of actual costs. The least objective methods appear to
be Method 5 (Residual value method) and Method 6 (Excess earnings method)
since they are based on the forecasted profits which cannot necessarily be
objectivised, if it is not by historical data. In the middle are methods 1 and 2 (relief
from royalty and premium price/profit methods respectively) as they require fewer
inputs (i.e. volume and price of products forecast) that are easier to substantiate.
With respect to the relative ease of use, the first methods appear to be most
simple; premium profit method appears slightly more difficult due to possible
difference in interpretation of “premium profits”. The residual value and excess
earnings methods require a construction of more detailed financial models and
thus are deemed to be more complex by default.
Appropriate benchmarks is strongest for Method 5 (Residual value method) and
Method 6 (Excess earnings method), as well as historical cost. Although appealing
to use for other reasons, relief from royalty and premium price methods prove
difficult when it comes to finding appropriate benchmarks for some intangible
assets. For instance, the valuation could concern a unique intangible that does not
have any suitable comparable on the open market (due to its extraordinary
character as a “super” intangible (for instance, the Coca-Cola trademark) or due to
its scope (e.g. specific customer base in a specific business in a specific territory).
Similarly, the study could involve the products for which no generic substitute
goods are available, precluding the use of the premium profit method. With respect
to the available benchmarks, it is easier to apply all other four methodologies, with
the only exception being replacement costs (which may need some benchmarks
measuring the price of labour to develop a replacement and / or time required to
reproduce the intangible).
Market connection – according to this aspect, the relief from royalty and premium
price method provide the most direct measure of market value by their
construction. Other methods provide indirect measures.
Amount of data required – this feature measures the amount of financial
(quantitative) information required from the taxpayer to apply the method. As with
the general ease of the model (aspect 3), the highest amount of data is required in
methods 5 (residual value method) and 6 (excess earnings method). The lowest
amount of financial data is required in application of the method 1, relief from
royalty.
104 For instance, if the substitute products used to determine a price premium contain
products of other (valuable) brands, the price premium may be undervalued.

European Commission
Study on the Application of Economic Valuation Techniques for Determining Transfer Prices of Cross Border Transactions between Members of Multinational Enterprise
Groups in the EU
September 2016 – 77
Next, the analysis of opportunities and threats was performed. This analysis
approached each method in respect to its potential application for a valuation for
transfer pricing purpose.
Table 5. Opportunities and threats of valuation methods Method Opportunities Threats
1. Relief from royalty
• potentially to use for intangibles with "me too" features, for which reliable comparables can be found • potentially to use for intangibles where comparability can be justified
by strong references
• typically not used for intangibles with unique features, for which reliable comparables do not exist
2. Premium profit method
• potentially to use for marketing intangibles (brands, trademarks), e.g. for trademarks, where a branded
product is priced clearly differently
than a non-branded product (or more generally there is clear distinction between forecast for product containing the intangible and one without). • potentially to use for intangibles that will save costs in the future
• typically not used when price premium assessment involves subjectivity (e.g. when there
are no clear generic alternatives
to branded products, etc.)
3. Historical cost • potentially to use for internally generated intangibles with no identifiable income streams (e.g. self-developed software, websites) • potentially to use for intangibles in
early stages of development, that have not yet resulted in a final product (e.g. early stage pharmaceuticals)
• typically not used for complex intangibles • typically not used for fully developed intangibles that are already generating income
streams • typically not used for high-valued marketing intangibles whose value rely on popularity
with consumers
4. Replacement
cost
• potentially to use for intangibles that
can be replaced with quantifiable resources (e.g. software) • potentially to use for intangibles in early stages of development, that have not yet resulted in a final product (e.g. pharmaceuticals)
• typically not used for complex
intangibles • typically not used for fully developed intangibles (that are already generating income streams) • typically not used for high-
valued marketing intangibles whose value rely on popularity with consumers
5. Residual value method
• potentially to use for intangibles with unique features • potentially to use when reliable
financial projections are available • potentially to use for unpatented technology or customer relations (for
which cost- and market- based approaches deem irrelevant)
• typically not used when definition of "routine function" is not clear
• typically not used when it is difficult to identify all routine functions and to find reliable
comparables in order to asses profitability for each of them - high possibility of overlap • difficult to use reliably when
the forecast is highly uncertain

European Commission
Study on the Application of Economic Valuation Techniques for Determining Transfer Prices of Cross Border Transactions between Members of Multinational Enterprise
Groups in the EU
September 2016 – 78
6. Excess earnings method
• potentially to use for customer contracts, customer relationships and in process research and development
projects
• typically not used when definition of "contributory assets" is not clear
• typically not used when it is difficult to identify all assets and the return attributable to each of them - high possibility of overlap • Typically very limited use in valuation for transfer pricing
purposes due to a disconnect with functional and risk analysis (return on contributory assets and not economic returns on functions)
Detailed discussion of survey responses related to SWOT 3.5.2
The performed SWOT analysis above reflects (in an organised structure) the various
answers of respondents to the survey. The respondents were asked to list the (first
coming to mind) advantages and disadvantages of the methods that they most used.
Most of respondents commented on only one or two methods as requested (out of six
main methods as described above) which are used more frequently in their practice
and others commenting on more methods. Below, the responses are summarised
based on two key methods that have enjoyed the greatest response, these methods
being Relief from royalty and Residual value methods.105
- Relief from royalty:
In terms of relief from royalty method, 12 respondents noted specific advantages of
the method:
Eight respondents note that the main advantage is that the method is simple and
easy to use.
Three other respondents note that the advantage of the method is that it is
preferred by the local tax administration since they consider it directly linked to the
market.
Two additional advantages (each mentioned once) are the fact that there are less
inputs needed, and that the method is “well-established” (i.e. being used for a long
time).
105 Since the countries could select on which methods they should comment, in the
discussion of the respondents’ answers below we did not mark which countries
provided which responses. In opinion of the authors of this study, the main benefit of
the survey in respect to SWOT analysis was to confirm the most used methodologies
applied for valuation of intangibles in transfer pricing and obtain a picture which
factors are considered to be the most obvious advantages and disadvantages of the
methods. The responses of the main trade partners’ respondents were consistent with
the conclusions and comments of EU Member States respondents and are therefore
not included in this section.

European Commission
Study on the Application of Economic Valuation Techniques for Determining Transfer Prices of Cross Border Transactions between Members of Multinational Enterprise
Groups in the EU
September 2016 – 79
Seven countries respondents commented on disadvantages of the relief from royalty
method:
Six of them quote the comparability of the identified royalty rates as the most
serious disadvantage.
The other disadvantage quoted is the lack of benchmarks (e.g. the benchmarks are
not specific for Eastern European countries).
- Residual value method
For the residual value method, in total, eight respondents commented on the
advantages of the method:
Six out of the eight respondents highlighted that the main advantage is the ability
of the method to reflect a full potential value of the IP.
The three other advantages noted are: no need to find comparables (as in the
relief from royalty method), possibility to aggregate (e.g. over several type of
intangibles), and wider acceptance by the tax administration.
In terms of disadvantages, 12 countries respondents commented:
The most frequent disadvantage mentioned is a great number of parameters and
assumptions that a valuer has to make to apply the method. This is mentioned by
four respondents. Two other respondents mention related disadvantages:
subjectivity of parameters, and sensitivity of valuation results to parameters.
Six respondents mentioned reliability of the forecast as a disadvantage (including
objectivity of forecast and related to that, the frequent challenge of the forecast by
the tax administration).
Other disadvantages mentioned in general: amount of data required, the fact that
this method is not explicitly mentioned either by OECD or local regulations, and
that it may give a value for a bundle of IP transferred, making it challenging to
distinguish between different types of IP.
- Other methods
Only three respondents in total commented at least partially on cost-based and
premium profit methods. No respondents separately commented on method 6,
excess earnings.
For premium profit method, an advantage noted was that it is a method with fewer
inputs (than residual value or excess earnings methods) and also, that it could be
very appropriate to use in some circumstances. The disadvantages mentioned
were the fact that the method can be rarely used and that the data (used to
calculate price premium) could be subjective.
For the cost-based methods, an advantage noted was that that the method may in
some cases be adequate to use. The main disadvantage is the fact that the costs
rarely reflect the value of the intangible. In terms of the replacement cost method,
one respondent also noted that it may be difficult to estimate costs under
replacement cost method.
3.6 Potential remedies to weaknesses of income-based methods
The SWOT analysis identified that there are potential weaknesses for each method and
each of them should be used depending on facts and circumstances. Ideally, the right

European Commission
Study on the Application of Economic Valuation Techniques for Determining Transfer Prices of Cross Border Transactions between Members of Multinational Enterprise
Groups in the EU
September 2016 – 80
method to use is the one that gives the lowest probability of a bias or error, subject to
practical considerations.
One of the potential approaches to address the shortcomings of specific valuation
methods, which is also a widely used approach in valuations for other purposes, could
be a potential use of more than one method. Examples of this approach would include:
Valuing a brand using both the relief from royalty approach and a premium
profit or residual value approach;
Valuing software based both on a replacement cost approach (and/or a
historical cost approach) and a residual value approach.
Alternatively, the valuer could start from the requirements in the TPG to perform a
valuation from both parties’ perspective and to assess the intangible asset value based
on the range provided by the two valuations. In some cases, this approach could be
equivalent to the approach set out above, since looking at the value from another
party’s perspective may involve a different method and vice versa.
As an example of this approach, in the situation of a valuation of technology (for
instance software that performs certain automation) from the seller’s perspective, a
residual value methodology may be used (method 5 above), calculating the present
value of profits generated by the business after deducting a routine return. However,
from the buyer’s perspective, the value obtained by seller may appear too high. The
buyer may consider performing its own R&D and developing the same technology/
software. Under this approach, the buyer may estimate its own value under a
replacement cost methodology. In this situation, the buyer’s valuation represents a
use of an alternative method as well as a valuation from the second party perspective.
In some other cases a valuation from both parties’ perspective would use the same
methods, and the difference in results would arise from different inputs used. For
instance, a technology may be valued by both seller and buyer using a premium
profits approach (e.g. estimating production cost differences for a process
improvement technology). However, if the buyer is a significantly larger company
than the seller, the value obtained would be correspondingly much higher. In this
example, one of the relatively weaker points of the selected method, objectivity, is
addressed directly, by estimating inputs from more than one source.
Another approach to address a shortcoming of chosen methodology could be
potentially the use of price adjustment clauses. As discussed above, the residual value
method is considered not objective since the result of its application highly depends on
the reliability of financial forecast which is typically uncertain at the time of the
valuation. Therefore, in theory, price adjustment clauses could create a mechanism to
account for deviations of actual results with the forecasts used in the valuation.
Use of more than one method 3.6.1
- EU Member States
The figure below presents how often more than one method is used in valuation for TP
purposes by respondents to the survey. Out of the 28 Member States, seven countries

European Commission
Study on the Application of Economic Valuation Techniques for Determining Transfer Prices of Cross Border Transactions between Members of Multinational Enterprise
Groups in the EU
September 2016 – 81
respondents did not provide any answer, including five countries respondents that are
not aware of IP valuations cases for TP purposes in their respective markets.106
Figure 29. How often more than one method is used for valuation of IP for TP
purposes? – EU Member States
Out of 21 Member State respondents, eight record that they perform secondary
calculation “often” or “very often” (Austria, Belgium, Denmark, France, Greece, Latvia
and Portugal, and the UK); seven indicated “sometimes”, and six indicated “never” or
“very rarely”. Member State respondents note that performing the secondary
valuation is the question of a risk (how big is the issue at stake and the risk associated
with the underlying transfer), ability to secure funding (fees) for the second valuation,
(reliable) data available for the secondary methodology, and a general difficulty with
finding a secondary method to defend the result.
Based on observations from the survey, the use of more than one method for
valuations of IP in transfer pricing, seems to be more important in theory than in
practice. When asked whether they found the use of more than one method for
valuation of IP in transfer pricing important, 12 respondents out of 21 indicated that
they did. A further seven indicated that it may be important and that it can depend on
the strength of the first method.
106 Cyprus, Ireland and Malta have provided an answer (which was, in all three cases
“rarely”) but are the countries with no experience with IP valuation for TP purposes
and thus their answer refers to experience with general valuations. Their answers
were not considered in the Figure below (were recorded as “n/a”).
6
7
8
-
1
2
3
4
5
6
7
8
9
Never / Rarely Sometimes Often/ very often

European Commission
Study on the Application of Economic Valuation Techniques for Determining Transfer Prices of Cross Border Transactions between Members of Multinational Enterprise
Groups in the EU
September 2016 – 82
Figure 30. Importance of using more than one method – EU Member States
- EU Trade partners
The trade partner respondents have similar (diverse) experiences with respect to
using more than one method in practice.
Figure 31. Use of more than one method for valuation of IP for TP purposes –
Trade partners
When asked about the frequency of use of more than one method for valuation of IP
for TP purposes, the majority of respondents indicated that they do this “sometimes”
(Australia, China, India, and Korea). Respondents in Canada, Switzerland and the US
use more than one method “often” or “very often”. Japan and Norway responded that
they “never/rarely” use more than one method.
Furthermore, with regards to the importance of using more than one method, most
(six) of the trade partners respondents commented that they deem it be important.
The remaining three respondents (China, India and Korea) commented that the level
of importance depends (typically, on the reliability of the primary method of the
analysis).
12
7
2
0
2
4
6
8
10
12
14
Important May be/ depends Not important

European Commission
Study on the Application of Economic Valuation Techniques for Determining Transfer Prices of Cross Border Transactions between Members of Multinational Enterprise
Groups in the EU
September 2016 – 83
Price adjustment clauses 3.6.2
- EU Member States
Another issue that is connected with the fact that the forecast financial data is
uncertain and may be unreliable is the use of the price adjustment clauses. The OECD
suggests the use of price adjustment clauses in cases where the valuation of an IP is
highly uncertain. In cases where “independent enterprises might find that pricing
based on anticipated benefits alone does not provide adequate protection against the
risks posed by the high uncertainty in valuing the intangible”, they “might include
price adjustment clauses in the terms of the agreement, or adopt a payment structure
involving contingent payments107 to protect against subsequent developments that
might not be sufficiently predictable.”108 The respondents were asked to reflect on the
practice in the country in terms of use of these clauses:
Figure 32. How often do you use price adjustment clauses in practice? – EU
Member States
Only three Member States respondents (Germany, the Netherlands and Portugal)
indicate that price adjustment clauses are often or very often used. The respondents
in the Netherlands and Germany note that it is an obligation to use such clauses,
based on the local TP rules and regulations.
Despite the limited practical use of these clauses at present (as illustrated in the
Figure above), the respondents seem to be almost uniform in attributing some or large
importance to these clauses. As observed from the Figure below, nine Member States
respondents find these clauses very important and another seven – as potentially
important. Only one Member State respondent (Sweden) notes that it is not possible
to implement such clauses and these clauses may not be important for treating
uncertainty. In addition, several Member States respondents provide two additional
related comments. One, the fact that such clauses are typically absent between third
107 According to para. 6.183 of OECD report “Aligning transfer pricing outcomes with
value creation”, “… a contingent pricing arrangement is any pricing arrangement in
which the quantum or timing of payments is dependent on contingent events,
including the achievement of predetermined financial thresholds such as sales or
profits, or of predetermined development stages (e.g. royalty or periodic milestone
payments).” 108 OECD, Aligning transfer pricing outcomes with value creation, para. 6.183.
14
4 3
-
2
4
6
8
10
12
14
16
Never / Rarely Sometimes Often/ Very often
Freq
uen
cy

European Commission
Study on the Application of Economic Valuation Techniques for Determining Transfer Prices of Cross Border Transactions between Members of Multinational Enterprise
Groups in the EU
September 2016 – 84
parties. If, however, it appears that in some industries or types of transactions, price
clauses are a common practice between unrelated parties, this could make their use
more justified. Second, it is noted that it is difficult to avoid using hindsight when
there is a price adjustment clause. After a period of time elapses, new circumstances
may rise changing the value of the intangibles. Some of these circumstances could
possibly have been foreseen in the original valuation whereas others, objectively
speaking, could not have been foreseen. However, because it is difficult to establish
whether or not the change of circumstances could be foreseen, the use of price
adjustment clauses may increase the risk of using hindsight inappropriately.
Figure 33. How important do you consider the use of price adjustment
clauses? – EU Member States
A good practice with respect to the use of price adjustment clauses (supported by the
OECD) is to refer to the behaviour between third parties. In some industries and
sometimes, the third parties fix a price for an intangible even if information available
to them is limited and the future profit potential is uncertain. In other cases, they
agree on an “earn out” which depends on the future profits derived from the
invention.
In this respect, the OECD guidelines suggest to consider, in some cases, “ex-post
outcomes” as a “presumptive evidence about the appropriateness of the ex-ante
arrangements.”109 However, this consideration applies only if necessary to assess the
reliability of information on which ex-ante pricing is based. Such approach
(reassessment based on ex post outcomes does not apply if the taxpayer provides
details on ex ante projects, including consideration of risks and “reasonably
foreseeable events” as well as probability of occurrence, and reliable evidence that any
differences between ex ante projections and actual outcomes is a result of
unforeseeable developments or the probability of occurrence of foreseeable outcomes
considered ex ante were not significantly overestimated or overestimated.110
In addition, the consideration of ex-post outcomes does not apply if the difference
between financial projections and actual outcomes does not have an effect on
calculated compensation of over 20% of the value at the time of valuation, or when,
over a period of commercialisation of five years starting from first generated
109 OECD, Aligning transfer pricing outcomes with value creation, para. 6.192. 110 OECD, Aligning transfer pricing outcomes with value creation, para. 6.193.
9
7
2
- 1 2 3 4 5 6 7 8 9
10
Very important May be important Not important/ not possible
Freq
uen
cy

European Commission
Study on the Application of Economic Valuation Techniques for Determining Transfer Prices of Cross Border Transactions between Members of Multinational Enterprise
Groups in the EU
September 2016 – 85
(unrelated) revenue, the difference between projections and actual outcomes was not
greater than 20%.111
Evidence from commercial court cases seem to mirror the OECD recommendation.112
For example, one interesting case is the French Supreme Court decision of July 9,
2013 (Case No. 12-22157) regarding a compensation of inventor Mr Audibert, by its
employer, Sollac (now Arcelor Mittal France). The decision implied that it is possible to
take into account the events which occurred after the transfer of rights, to confirm the
initial assessment of the economic prospects of the invention. Another such case is the
UK Court case, Gorne v. Scales (2006), where the judge of Appeal rejected the value
of expert witness and the method used on the ground that the method involved
hindsight.113
- EU Trade partners
The opinions of the EU trade partner respondents on price adjustment clauses are also
diverse, with a general consensus that these clauses are not very frequently observed
in practice. Only respondents in Australia and Canada note that these clauses are used
sometimes in practice. The US comments that the use of these clauses is governed by
a taxpayer’s Treasury motivation, i.e. to minimise the movement of cash flows rather
than by transfer pricing considerations; and that these clauses are difficult to
implement in practice because certain formalities have to be satisfied. All other six
respondents (China, Japan, India, Korea, Norway and Switzerland) indicate that the
use of these clauses is rare or not observed.
With respect to the importance of price adjustment clauses as a counter-measure of
uncertainty, five trade partners’ respondents confirm that they may be an important
measure. Two countries find them assertively important (Australia and Canada), one
(Norway) finds them not important at all. Finally, the US had no marked opinion on
the issue114.
3.7 Valuation standards and their application in transfer pricing valuations
General valuation standards 3.7.1
- Introduction
Standards have a significant role to play in helping to regulate professional practice at
global, national and regional level. Standards promote professional ethics, integrity,
impartiality and trust. Many governments and professional bodies are responding to
international pressures to restore confidence in the financial and economic system by
reviewing the regulatory environment and the standards applicable in many areas,
including various professional services in the business sector.
111 OECD, Aligning transfer pricing outcomes with value creation, para. 6193. 112 References to the court cases of Mr. Audibert v. Sollac and First India Formula One
is provided by the UK respondent. 113 Cited in Judgement text, Force India Formula One Team Limited, where the judge
made a reference to the case establishing that the value of the intangible determined
should be determined at the date of the event (in the case of Formula India Formula
One, on the day of breach of confidentiality agreement). 114 The neutrality of the US on the issue perhaps is due to price adjustment
mechanism built in the US regulations. The latter prescribe an adjustment in case of
certain thresholds being met (i.e. result being less than 80% than the target arm’s
length result or over 120% of the value).
European Commission
Study on the Application of Economic Valuation Techniques for Determining Transfer Prices of Cross Border Transactions between Members of Multinational Enterprise
Groups in the EU
September 2016 – 86
As mentioned previously, valuations of both businesses and intangible assets are in
general performed for a wide variety of purposes, including M&A, disputes and
litigation, financial reporting, non-transfer pricing tax purposes, other statutory
regulations, etc. Practical valuation approaches have often emerged on a country by
country basis, or depending on the specific valuation context. As a result, while there
is broad agreement between valuers on many key principles and approaches /
methods of valuation, and while some valuation standards have been around for
decades, specific standards with wide applicability have been relatively slow to emerge
and are still relevant only in certain contexts and geographic areas. This contrasts with
transfer pricing valuation guidance, which, as it is issued by the OECD, has a more
uniform application in practice across OECD members and all countries who are
“observers” to the OECD.
- Key valuation standards
Today, there is a multitude of business and intangible asset valuation standards set by
different standardisation bodies. The guidance contained in the standards for different
valuation causes may differ significantly. These different interpretations of concepts
and differing valuation approaches continue to represent major challenges. However,
so far, the contents and recommendations of these different standards and guidelines
are not contradictory in themselves. When the concrete recommendations are
different, this is because of the different purposes and fields of application (e.g.
valuation causes / contexts) of these standards.
The key valuation standards which have international acceptance are as follows:
International Valuation Standards (‘IVS’), issued by the International Valuation
Standards Council, an independent, not-for-profit organisation that produces and
implements universally accepted standards for the valuation of assets across the
world in the public interest
ISO 10668:2010 (issued by International Organisation for Standards or ISO) which
specifies a framework for brand valuation, including objectives, bases of valuation,
approaches to valuation, methods of valuation and sourcing of quality data and
assumptions. It also specifies methods for reporting the results of such valuation.
International Financial Reporting Standards (‘IFRS’) and US Generally Accepted
Accounting Principles (‘GAAP’) include valuation guidance with respect to
businesses and other assets, including intangible assets. This guidance is
compulsory for financial reporting under these standards. Moreover, the specific
requirements for the valuation of intangible assets in financial reporting contexts
have been extensively developed by the Financial & Accounting Standards Board
(‘FASB’), in Statement of Financial & Accounting Standard (‘SFAS’) 157, Fair Value
Measurements and by the International Accounting Standards Board (‘IASB’) in
IFRS 13.
In addition, the valuation standards originally generated for US and UK purposes have
gained a widespread acceptance in many countries:
Uniform Standards of Professional Appraisal Practice (‘USPAP’), the US standards
issued by the US Appraisal Foundation / Appraisers Association. These are quality
control standards applicable for real property, personal property, intangible assets,
and business valuation appraisal analysis and reports in the United States. The US
Financial Institutions Reform, Recovery and Enforcement Act of 1989 recognized
USPAP as the generally accepted appraisal standards and has required USPAP
compliance for appraisers in federal-related transactions in the United States.

European Commission
Study on the Application of Economic Valuation Techniques for Determining Transfer Prices of Cross Border Transactions between Members of Multinational Enterprise
Groups in the EU
September 2016 – 87
RICS Valuation standards- Professional Standards (so called “Red Book”) in the
UK. The Red Book is issued by the Royal Institute of Chartered Surveyors (‘RICS’)
with the purpose of promoting and supporting high standards in valuation delivery
worldwide. The publication details mandatory practices for RICS members
undertaking valuation services. It also offers a useful reference resource for
valuation users and other stakeholders.
DIN77100 - DIN (German Institute for Standardisation) develops norms and
standards as a service to industry, state and society as a whole. Ninety percent of
the standards carried out by DIN are international in nature. DIN 77100 specifies
requirements for procedures and methods of monetary patent value measurement
as well as their interdependent value drivers. The norm specifies a framework for
patent valuation, including objectives, bases of valuation, approaches to valuation,
methods of valuation, sourcing of quality data and assumptions including the
reporting of results of such a valuation.
European valuation standards – the European Group of Valuer’s association is a
pan-European association of professional bodies working for standards, ethics and
quality in the real estate valuation market. Besides setting standards for valuers,
TEGoVA provides a conduit for business.
Other standards are generated for and applied on a national level (e.g):
The Institute of Public Auditors in Germany, Incorporated Association (IDW) is a
privately run organisation established to serve the interests of its members who
comprise German Public Auditors and German Public Audit firms. The purpose of
IDW S5 is to offer a general framework along with guidance on the valuation of
brands, while its format strongly resembles that of business valuations, i.e. a
process open driven standard.
Issue of valuation standards alignment 3.7.2
As noted above, the broad agreement between valuers on many key principles and
approaches / methods of valuation has translated only partially into the
standardisation of these approaches and methods across the world (or across the EU
Member States). This may be due, among others, to long-established methodological
history in each country, but also to legal differences in various countries using specific
standards.
However, efforts are currently under way to align standards. For instance, the US-
based Appraisal Foundation and the International Valuation Standards Council have
published in June 2016 “A bridge from USPAP to IVS (A guide to providing IVS-
compliant appraisals”). While this is not a two-way bridge (it does not cover a bridge
from IVS-compliant to USPAP-compliant appraisals), the document makes several key
points:
- The use of the International Valuation Standards (IVS) published by the
International Valuation Standards Council (IVSC) is currently growing;
- Many differences between the standards are superficial and are simply due to
different presentational and organisational aspects. Some differences are
unavoidable due to IVS being global and USPAP reflecting US law and practice;
- The standards are “remarkably similar”:
o Both address the development of a valuation opinion based on an appropriate
scope of work,

European Commission
Study on the Application of Economic Valuation Techniques for Determining Transfer Prices of Cross Border Transactions between Members of Multinational Enterprise
Groups in the EU
September 2016 – 88
o Both address report content and file documentation,
o Both address the competency and independence of the appraiser.
With regards to incorporating IVS, the RICS Valuation Standards incorporate IVS from
2011, and the “Red Book” has been extensively revised since 2013 to become better
aligned with IVS. RICS valuation standards have been described as providing
additional detail to the high-level approach used by IVS (although a significant part of
this additional detail concerns real estate valuations).
In this context, whether or not the valuation profession needs additional standards for
valuation of intangibles is a reasonable question. It can be argued that it is in the
valuation practices’ interest and more generally in the public interest that, despite the
existence of international and local valuation standards, these different tiers of
standards complement each other in both content and practical influence. Local level
standards can operationalise the international standards in terms of content and
practical influence. While IVS provide the underpinning valuation principles to be
followed, the local standards can add to these through illustrating practical application.
However, a convergence of standards operating at the same level, or at least a bridge
of such standards (such as USPAP and IVS, as set out above) appears to be in the
interest of the profession as well as public interest, in order to enhance the
applicability, relevance and comparability of valuations across several jurisdictions and
types of assets.
SWOT analysis of valuation standards 3.7.3
This subsections contains a “SWOT” (i.e. Strengths, Weaknesses, Opportunities and
Treats) analysis of the various valuation standards covered in this report, scored on
several relevant criteria.
A full list of the standards reviewed and a brief description of their key characteristics
is included in Appendix 4 – Valuation standards.
The remainder of this subsection focuses specifically, first on analysis of strengths and
weaknesses of valuation standards, and next, on opportunities of threats of using
valuation standards (not OECD TPG) for valuations for transfer pricing purposes.
The study team selected nine key criteria based on which the standards of valuation
were assessed by using ranking. The list below sets out these criteria and an
explanation of the meaning of each assessment ranking. A key point is that a “c” rank
(represented in the graph by a light blue ball) does not necessarily indicate that the
respective standard has a deficiency in that area – it may be that the standard is
adequate for its specific purposes but when compared to other standards provides less
information, guidance or detail on specific areas.
(1) Global applicability – this criterion measures to what degree the standards are
adhered to and applied on a geographical scale:
a. Global reach
b. Regional reach
c. Local reach (national);
(2) Range of intangible assets covered – to what degree the different types of
intangibles are covered in the standard:

European Commission
Study on the Application of Economic Valuation Techniques for Determining Transfer Prices of Cross Border Transactions between Members of Multinational Enterprise
Groups in the EU
September 2016 – 89
a. All intangible asset categories covered
b. A selection of intangible assets categories covered, or a single asset category
c. Standard does not cover intangible assets;
(3) Consistency with other standards – this criterion attempts to measure how
different standards include content and/or guidance that is consistent with other
standards:
a. Standard exhibits significant similarities with other(s) standards, or
incorporates other standards
b. Standard has overlap with other standards
c. Standard has limited overlap and/or shows inconsistencies with other
standards
This is a relative rating, as there may be “groups” of standards that may be
similar to each other, with different such groups being less similar. The
assessment aimed at scoring I or II for standards that overlap with other widely
applicable standards.
(4) Guidelines on ethical behaviour and quality focus – this criterion evaluates to what
degree guidance is provided on how to deliver a qualitative, independent and
objective product:
a. The standard includes extensive guidance on ethical behaviour and
requirements for an objective and independent valuation
b. The standard only includes limited guidance on the subject
c. No guidance is provided or the standard was not assessed for this criterion
(“n/a” - IFRS / US GAAP);
(5) Binding force – this measures to what degree the standard is binding and mainly
depends on the standard setting organisation and its legitimation to professionals:
a. Compliance with standards is imposed by laws/ regulations (obligatory)
b. The standard is binding for the members of the standard setting body
c. The standard is voluntary
(6) Technical guidance – this criterion measures the amount and extent of guidance
that is provided on valuation approaches and/or whether detailed guidance on
implementation of valuation methods and techniques is included:
a. Extensive high-level and detailed technical guidance provided
b. Only high-level guidance provided
c. Limited guidance included in the standard;
(7) Clear definitions – this criterion measures to what degree concepts and language
are defined and explained in the standard:
a. All-inclusive glossary
b. Glossary defining most important concepts
c. No definitions included;

European Commission
Study on the Application of Economic Valuation Techniques for Determining Transfer Prices of Cross Border Transactions between Members of Multinational Enterprise
Groups in the EU
September 2016 – 90
(8) Guidance on report content – to what degree the standard covers and provides
guidance on the elements to be included in a valuation report:
a. Extensive guidance on all elements to be included in the report
b. Limited guidance
c. No guidance;
(9) Clear identification of factors relevant to valuation – to what degree the standard
covers context, purpose, parties and basis and standard of value, providing a
contextual framework in which the valuation is prepared:
a. Extensive guidance
b. Limited guidance
c. No guidance.
Figure 34. Strengths and Weaknesses analysis of valuation standards
Based on the analysis above, the following key points are observed:
As a general comment, standards discussed in the figure above vary greatly as
they provide valuation guidance for different purposes, under different regulatory
and legal systems, etc. In essence, standards may provide valuation guidance in
the specific context of transfer pricing or financial reporting, or in a more general
context of taking informed business decisions.
A relatively high number of standards exist, mainly due to parallel evolution in
different jurisdictions and professional bodies.

European Commission
Study on the Application of Economic Valuation Techniques for Determining Transfer Prices of Cross Border Transactions between Members of Multinational Enterprise
Groups in the EU
September 2016 – 91
Most of the standards were quite well structured, with the exception of the OECD
Transfer Pricing Guidelines, which were less so.115
Global applicability - it is observed that besides the IVS and ISO standards, only
the financial reporting standard IFRS and the transfer pricing standard OECD TPG
have a clear global reach. It seems that the other standards are organised and
adhered to on a local (mostly national) level.
Range of the intangibles covered - most of the standards provide at least a
framework for intangible asset valuation, which can be applied to all intangible
assets (although the level of detail provided varies, as analysed below under the
technical guidance criterion). The ISO 10668 Standard, IDW S5 Standard and
DIN77100 however, have a particular focus on a subset of the intangible assets.
Consistency of the standards - this is a relative rating, as there may be “groups” of
standards that may be similar to each other, with different such groups being less
similar. The assessment aimed at scoring I or II for standards that overlap with
other widely applicable standards. A standard that exhibits significant similarities
with another standard, is considered to be consistent. A significant level of
consistency was found between the financial reporting standards, IFRS and
USGAAP, as well as between IVS, RICS, ASA and USPAP, and to a lesser extent
between IBA, SSVS (AICPA) and USPAP. In that respect, it can be said that these
different standards are making efforts towards convergence. Others were not
necessarily found to be inconsistent with each other, but showed generally much
less overlap.
Guidelines on ethical behaviour and quality focus –A strong focus across all
standards on objectivity, ethics and quality was observed (within the standard or
within the overall framework – e.g. IFRS, US GAAP). As a note for the financial
reporting standards: while the standard-setting bodies endorse the significant
requirements in terms of objectivity, ethical focus and competence in a financial
reporting context, the standards themselves do not specifically contain these. The
financial reporting standards, have therefore been excluded from the analysis. It is
observed that RICS, USPAP, SVSS (AICPA) and OECD TPG provide explicit and
extensive guidance on the subject matter. The German standards on the other
hand provide little or no guidance (IDW S5 and DIN77100) on ethical behaviour.
The other standards include limited guidance.
Binding force - four standards are legally enforced: IFRS & USGAAP, the OECD
Transfer Pricing Guidelines and the German DIN77100 Standards. However, for
most of the other standards, it was found that adoption was obligatory for
members of the standard setting body. In cases were no membership community
is organised (IVSC, European Valuation Standards and IDW), adoption of the
standards was assigned voluntarily. It is noted that there is a significant growth in
importance of IVS.
Judging the amount and extent of guidance that is provided on valuation
approaches and/or whether detailed guidance on implementation of valuation
methods and techniques is included in the standard, it was found that only the IBA
Professional Standard provides limited guidance on the matter. IVS, RICS (in
reference to IVS), IFRS and USGAAP provide detailed technical guidance in their
standards. The other standards include high-level guidance on valuation methods
115 This comment is made on evaluating the OECD TPG in the capacity of valuation
standards. The study authors do not have the same opinion on the OECD TPG as a
overall guidelines on transfer pricing.

European Commission
Study on the Application of Economic Valuation Techniques for Determining Transfer Prices of Cross Border Transactions between Members of Multinational Enterprise
Groups in the EU
September 2016 – 92
and approaches, however, do not include detailed technical direction. As such, a
strong variation in level of technical guidance detail was found.
With respect to the availability of clear definitions, all standards include a section
on specific concepts and language, although some standards provide less detail.
Guidance on report content - all standards (except for one, DIN77100) include a
section on report contents, although some standards provide less detail.
Clear identification of factors relevant to valuation – it is observed that all
standards include guidance on this, although some standards provide less detail.
Based on the analysis of valuation standards (but not including the OECD TPG), the
following opportunities and threats are identified in respect to the use of the above
described standards in valuations for transfer pricing purposes specifically.
Table 6. Opportunities and threats of valuation standards
Opportunities Threats
Valuation standards (not written for TP
purposes, i.e. excluding OECD TPG)
• More extensive technical guidance -
some valuation standards provide detailed technical guidance (exceeding that of the OECD TPG) The examples of such guidance could be determination of the appropriate discount rates (adjusted for risk) and the terminal value
computation (considering the economically useful life of the assets). • Global reach – there is an opportunity to develop global comprehensive valuation technical framework that is principle-based and can be used in the
transfer pricing context; this would improve consistency of valuations performed and allow for better comparability across markets and increase confidence in valuations.
• Valuation standards typically
do not account for all circumstances of the transaction • Valuation standards do not specify (and do not imply) the use of two-sided approach, i.e. a valuation from both parties'
perspective. • Valuation standards in present form are not uniform and have different definitions for the "special items" (workforce, location savings, synergies). • Using valuation standards
typically implies searching for hypothetical buyers/sellers on the market which does not take into account the specific entities under consideration (e.g. sometimes group entities enter into transactions that
independent entities would not). • The use of valuation standards in their present form for valuations TP purposes instead of the OECD TPG might lead to approaches not consistent with
the OECD TPG and may be challenged by the tax authorities.
Use of valuation standards in valuations for transfer pricing purposes 3.7.4
Next, we summarized our analysis in respect to the use of valuation standards in
practice for valuations of intangibles in transfer pricing, based on the survey of experts
in the 28 Member States and nine EU trade partners. Among the Member States
respondents, only two (respondents Germany and Austria) mention that, in case of
the valuation for transfer pricing purposes, there is a certain legislative guidance to
refer to certain valuation standards. In both Germany and Austria there are special
European Commission
Study on the Application of Economic Valuation Techniques for Determining Transfer Prices of Cross Border Transactions between Members of Multinational Enterprise
Groups in the EU
September 2016 – 93
valuation standards which are referred to in the context of transfer pricing regulations
or related guidance issued by the government. In Germany, the Administration
Principles – Business Restructurings make a reference to IDW S1 and IDW S5,
Principles for the Valuation of Intangible Assets and Principles for the Valuation of
Companies. All other Member States confirm that the only standard applicable to
valuations for transfer pricing purposes are the OECD TPG and the local laws and
regulations that are based on or refer to the OECD guidelines.116
To the degree that the transfer pricing experts refer to the help of general valuation
experts outside of transfer pricing practice, the local valuation standards are used.
However, only six countries note the practice of such standards, with three of the six
noting that these are international valuation standards.
116 Another exception, based on the survey results, is potentially Denmark. In 2009,
the Danish tax authorities published valuation guidelines on transfer of ownership of
intangibles and businesses. The legal status of the guidelines means that they are not
binding for taxpayers or courts. The guidelines are based on corporate finance
approaches and generally adhere on guidelines on the valuation of businesses issued
by the Institute of State Authorized Public Accounts in Denmark.
European Commission
Study on the Application of Economic Valuation Techniques for Determining Transfer Prices of Cross Border Transactions between Members of Multinational Enterprise
Groups in the EU
September 2016 – 94
4. Practical application of economic valuation methods
4.1 Introduction
As explored in Section 3, from the transfer pricing perspective, the most important
condition to observe when using the economic valuation techniques is the consistency
with the arm’s length principle.117 In this respect, Section 3 explored some of
important considerations for a valuation from the transfer pricing perspective that are
a consequence of the arm’s length standard (e.g., considerations from both parties’
perspective, importance of functional and risk analysis, etc.). This Section will explore
the impact of the purpose of the valuation (being transfer pricing) and of the arm’s
length standard criterion on the assumptions and parametrisation made in the course
of a valuation exercise. In respect of the difference between inputs and assumptions
used in valuations for transfer pricing as opposed to other purposes, the TPG notes,
for instance: “for sound accounting purposes, some valuation assumptions may
sometimes reflect conservative assumptions and estimates of the value of assets
reflected in a company’s balance sheet. This inherent conservatism can lead to
definitions that are too narrow for transfer pricing purposes and valuation approaches
that are not necessarily consistent with the arm’s length principle. Caution should
therefore be exercised in accepting valuations performed for accounting purposes as
necessary reflecting arm’s length prices or valued for transfer pricing purposes without a thorough examination of underlying assumptions.”118
The ensuing sub-sections focus on exploring the main principles of the main building
blocks (i.e. parameters) of a valuation made for transfer pricing purposes. These are
divided into five main blocks:
(1) Financial projections
(2) Royalty
(3) Routine return
(4) Discount rate
(5) Useful life and terminal value
The relevance of each parameter for the surveyed main valuation methodologies is
described in the following table:
117 OECD, Aligning transfer pricing outcomes with value creation, para. 6.154. 118 OECD, Aligning transfer pricing outcomes with value creation, para. 6.155.

European Commission
Study on the Application of Economic Valuation Techniques for Determining Transfer Prices of Cross Border Transactions between Members of Multinational Enterprise
Groups in the EU
September 2016 – 95
Table 7. Relevance of parameters
Financial
projections Royalty Routine return Discount rate
Useful life and
terminal value
1. Relief from
royalty
Limited (sales/
turnover only) Required n.a. Required Required
2. Premium profit
method
Limited (sales
/turnover) n.a. n.a. Required Required
3. Historical cost n.a. n.a. n.a.
Required
(Capitalisation
rate)
n.a.
4. Replacement
cost
Limited (costs
only) n.a. n.a. Required n.a.
5. Residual value Full detailed
forecast n.a.
Required (based on
functional returns) Required Required
6. Excess earnings
method Full forecast n.a.
Required
(asset returns are used instead)
Required Required
Appendix 2.A describe the methodologies and Appendix 2.B provides examples
showing the use of parameters and financial data.
In the first part of the present section, the guidance, principles, standards and practice
regarding each of these building blocks from the perspective of general valuation
expertise are addressed. Next, these issues are investigated from the perspective of
transfer pricing based on the TPG. Subsequently, analysis is made on the extent to
which the requirements under general valuation standards and under TPG overlap,
and specific situations where they may differ.
In the second part of this section, focus is placed on the state of play observed with
respect to these building blocks in practice, based on the survey results. An overview
of practices in respect of the same parameters in major trade partners’ countries is
also provided. Finally, the issue of similarities and specific differences between the
application of valuation methods for general valuation purposes and for TP purposes is
revisited from a practical perspective.
4.2 Theoretical premises
Financial projections 4.2.1
The reliability of a valuation of intangibles using DCF valuation techniques depends on
the robustness and reasonableness of financial projections on which the valuation is
based. Below, the guidance governing the transfer pricing practice as well as the
general valuation principles regarding this building block is described.

European Commission
Study on the Application of Economic Valuation Techniques for Determining Transfer Prices of Cross Border Transactions between Members of Multinational Enterprise
Groups in the EU
September 2016 – 96
- General valuation perspective
Generally, it is preferable when applying a valuation technique based on financial
projections of cash flows to carefully examine the likely pattern of revenue and
expense growth. In this context, in addition to the transfer pricing experts and
literature quoted above, a list is provided below of general practices on assessing and
challenging financial projections, based on well-known literature in valuations for non-
TP purposes, including M&A, tax, and dispute valuations, which may be useful as
additional guidance in the framework of a TP valuation:
In practice, analysts should carefully review the information they are provided and
make adjustments to income statements projections; 119
“To build a revenue forecast, you can use a top down forecast, in which you
estimate the revenues by sizing the total market, determining market share, and
forecasting prices”. Likewise, “a bottom-up approach using company’s own
forecasts of demand from existing customers, customer turnover, and potential for
new customers can be used“;120
Once the necessary adjustments are performed, analysts can compare the
financial projections to: “a historical period which should encompass an operating
cycle of the entity’s industry, this period will often equal five years, beyond this
period data can become “stale”;”121
In some circumstances, past is not indicative of the future and “analysts must
exercise care in analysing projected performance in these situation. Adequate
support must exist for the assumptions that the projections are based upon;”122
Focusing on key economic and financial indicators is more important than detailed
forecasting: “While you are building a forecast, it is easy to become engrossed in
the details of individual line items, you must rather place your aggregate result in
the proper context. As such, matching future ROIC123 against a company’s
competitive advantage will much more improve your valuation than precisely (but
perhaps inaccurately) forecasting account receivables 10 years out.”124
A good practice is considered to perform a combination of some or all of the following
cross-checks:
the performance of a selected peer group of comparable companies (historical and
forecast by market analysts) in terms of growth, margins, etc.;
the industry forecasts as per public sources;
the comparison of the financial projections provided with historical performance of
the business / asset in question;
the management’s / company’s record of achieving previous forecasts;
the industry and company experience with similar products.
All these checks, combined, should provide an objective basis for assessing and
challenging the reasonableness of the forecast provided.
119 Hitchner (2011) at 127-129. 120 Koller et al (2010) at 325. 121 Hitchner (2011) at 134. 122 Hitchner (2011) at 138-139. 123 Return on Invested Capital. 124 Koller et al (2010) at 229.

European Commission
Study on the Application of Economic Valuation Techniques for Determining Transfer Prices of Cross Border Transactions between Members of Multinational Enterprise
Groups in the EU
September 2016 – 97
With regards to the use of cash flows or (operating) profits to value intangible assets,
a distinction needs to be made between theory and practice. Valuation theory. in
general, recommends the use of cash flows to value businesses or assets, and this is
indeed the case in the vast majority of “income method” valuations for businesses
(although methods such as capitalisation of profits rely usually on operating or net
profit measures, and the market methods most usually rely on multiples of profits).
Thus, when goodwill is valued through an income method, since this practically always
requires a full business valuation, a cash-flow approach is also often used. By
contrast, there are more complex practical issues regarding estimating cash flows
related to a specific intangible – a general issue being that the working capital position
and capex intensity of a business are often driven primarily by the business model,
and not by a specific intangible (or the effect of that specific intangible is difficult to
estimate separately), and to that extent these elements should not impact the value
of the intangible. Accordingly, in practice, valuations of identifiable intangibles take
into account mainly profit measures (often operating profit) or profit differentials, as
proxies for the cash flow generation of the intangible in many more cases.
- Transfer pricing perspective
In transfer pricing, the TPG urges that, given the fact that the accuracy of this data is
dependent on developments in the marketplace that are both unknown and impossible
to know at the time of the valuation, it is essential for valuers to examine carefully the
assumptions underlying the projections of both future revenue and future expense.125
Although the guidance of the TPG is not of a prescriptive character, it provides the
following recommendations regarding factors to consider for formulation of financial
projections:
Source and purpose of projections: The OECD recognises that the source and
purpose of the financial projections are particularly important, generally the
situation being that projections prepared for non-tax business planning purposes
are more reliable than projections prepared exclusively for tax purposes, or
exclusively for purposes of a transfer pricing analysis.126
Time horizon increasing the uncertainty of projections: When evaluating the
reliability of financial projections, it is important to consider the length of time
covered by the projections, keeping in mind that the further into the future the
intangible in question can be expected to produce positive cash flows, the less
reliable projections of income and expense are likely to be. 127
In this respect, a key element in financial projections that needs careful
examination is the projected growth rate. Often financial projections are based on
current cash flows (or short-term forecasts) that are extended by reference to a
steady growth rate.
In cases where such growth rates are used, the basis for the assumed growth rate
needs to be considered. More particularly, it is unusual for revenues derived from a
specific product to grow at a steady rate over a long period of time. Therefore,
simple models containing linear growth rates should be justified on the basis of
either experience with similar products and markets or of a reasonable evaluation
of likely future market conditions.
125 OECD, Aligning transfer pricing outcomes with value creation, para. 6.163 126 Ibid, para. 6.164. 127 Ibid, para. 6.165.

European Commission
Study on the Application of Economic Valuation Techniques for Determining Transfer Prices of Cross Border Transactions between Members of Multinational Enterprise
Groups in the EU
September 2016 – 98
Use of past financial indicators for new products or services: The use of past
performance indicators in the preparation of financial projections must be done
with caution given that many factors are subject to change, especially with respect
to products or services that have not been introduced to the market or that are
still in development.128
Inclusion of development costs: Another aspect relevant to financial projections is
the inclusion of development costs, which mainly depends on the nature of the
transferred intangible. If the intangible is still in the development phase, it seems
reasonable to include also future development costs in projections. However, if the
intangible is fully developed and will not provide a platform for development of
other intangibles, no development costs should be included in the forecast of the
transferred intangible. 129
The OECD underlines the necessity of valuers verifying the reliability and degree of
speculation of financial projections and of paying special attention to cases where the
valuation is highly uncertain at the time of the transaction and to hard-to-value
intangibles.130 In the first case, the evaluation should be performed by taking into
account what independent enterprises would decide in similar circumstances given the
valuation uncertainty.131 Possibilities include the use of anticipated benefits,
accounting for foreseeable and predictable developments, or adopting short-term
agreements, including price adjustment clauses in the terms of the agreement or
adopting a payment structure with contingent payments.132 The second case, of hard-
to-value intangibles, includes intangibles or rights in intangibles in respect of which
either comparables do not exist, or the projections or future cash flows or income to
be expected to be derived therefrom, or the assumptions used in the valuation, are
highly uncertain.133 The TPG notes that, in this case, it may prove difficult to establish
and verify the relevant information for the performance of valuation studies.134
Remedies for the two types of intangibles have also been discussed in previous section
3.6 where the advantages of valuations from both parties’ perspective, of using more
than one method in a valuation and of price adjustment clauses were presented.
Even in the latest draft of section 6 issued in December 2015, the TPG does not give a
precise guidance on the level of profit to consider in applying the discounted cash flow
method. Although, from the name of the method and general valuation practice, it
should be “free cash flows,” the TPG refers to “income” or “cash flow” as the level of
income to consider. It notes that “accrual based measures of income, such as those
determined for accounting or tax purposes, may not properly reflect the timing of cash
flows which can create a difference in outcome between and income and a cash flow
based approach. However, in light of a number of considerations, the use of income
projections rather than cash flow projections may, in some cases, yield a more reliable
result in a transfer pricing context as a practical matter.”135 Furthermore, it is noted
that the references to cash flows in the TPG should “be read broadly to include both
cash flow and income measures.”
128 Ibid, para. 6.166. 129 Ibid, para. 6.167. 130 Ibid, para. 6.168 131 Ibid, para. 6.181. 132 Ibid, para. 8.182-6.183. 133 Ibid, para. 6.190. 134 Ibid, para. 6.186. 135 Ibid, note 19 to para. 6.157.

European Commission
Study on the Application of Economic Valuation Techniques for Determining Transfer Prices of Cross Border Transactions between Members of Multinational Enterprise
Groups in the EU
September 2016 – 99
In terms of tax considerations, the revised TPG notes that it often becomes “necessary
to evaluate and quantify the effect of projected future income taxes on projected cash
flows. Tax effects to be considered include (i) taxes projected to be imposed on future
cash flows, (ii) tax amortisation benefits projected to be available to the transferee, if
any and (iii) taxes projected to be imposed on the transferor as a result of the
transfer, if any.”136
- Key similarities / differences
It appears that the two approaches (general valuation and transfer pricing) regarding
the use of financial projections in the valuation exercise are broadly similar. In this
regard, both perspectives require special attention to be paid to the procedure used
for forecasting (e.g. past performance might not be used as purpose of transaction
needs to be taken into account) and to perform various cross-checks.
However, it is notable that the OECD TPG goes a step further in requirements for
valuations of intangibles for TP purposes, such as by advising the use of management
projections for non-tax purposes as being more reliable than projections performed for
tax purposes or by mentioning the importance of including development costs in the
calculations.
Royalty rate 4.2.2
As explained in Section 3, the royalty rate serves as a building block for the relief from
royalty method – which estimates the value of a transferred intangible by viewing the
future “deemed” (saved) royalty payments as a future income stream representing the
intangible and calculating the present value of this income stream. However, the
royalty rate is also often addressed in transfer pricing as a recurring payment for the
rights to use intangible assets. In this respect, the royalty rate and the approach to
estimate that rate are the same from the transfer pricing perspective.
Furthermore, the same principles apply to guide a determination of royalty for purpose
of a valuation of the fully transferred intangible asset or for the purpose of recurring
license payments that do not involve an asset transfer. It is important to understand
that both the value and the royalty rate are “flip sides of the same coin”,137 as they
are both driven by the earnings capability of the asset.
Finally, the royalty could be a way to implement the compensation for the transferred
IP. For instance, the value could be determined by a cost or income approach as
deemed appropriate (any of methods 2, 3, 4, 5, or 6 explored in the analysis) but then
expressed as a royalty. In order to do so, the obtained value is simply re-calculated
/expressed as percent of sales (or other appropriate base). Based on the example
below, the present value of IP is divided by present value of sales, to arrive to an
annual royalty for the period of 5 years.
136 Ibid, para. 6.178. 137 Heberden (2011) at 3.

European Commission
Study on the Application of Economic Valuation Techniques for Determining Transfer Prices of Cross Border Transactions between Members of Multinational Enterprise
Groups in the EU
September 2016 – 100
Table 8. Example determination royalty rate
Discount rate
8.00%
Year 1 Year 2 Year 3 Year 4 Year 5
Sales forecast
100,000 110,000 120,000 130,000 140,000
Sales, PV
96,225 98,007 98,997 99,303 99,020
Total Sales, 5 years A 491,551
IP value (PV) B 25,000
Royalty for 5 years B/A 5%
- General valuation perspective
In general, valuation practice for financial purposes or in the context of M&A
transactions, relief from royalty method138 is a common method to value for instance,
trademarks / trade name or technology patents.
Determining a royalty rate is a key building block for this method and actual licensing
agreements for the same or similar intangibles generally provide the best basis for
determining an appropriate royalty rate. In general, the valuation literature also refers
to the “arm’s length” licensing agreements covering identical or similar intangible
assets that should therefore be considered in all valuations.139
In practice, determining a comparable royalty rate can be done through different
sources of information:
In-depth discussion with the management of the company covering aspects such
as the existence of license agreements with third parties, or intra-group. Common
practice is also used to inquire from Company’s management about recent
licensing transactions in the industry covering comparable assets. The discussion
also covers the investigation on the nature of the asset licensed and industry, for
instance, whether or not it is used in connection to business-to-business or
business-to-consumer products or services, and the understanding of the strength
of the intangibles (brand awareness etc.)
In practice, existing intra-group royalties used by the subject company for the
same or similar IP, or used by other companies in the group (and available
publicly), are also relevant, in particular as a cross-check and in cases where too
few or no third-party agreements for sufficiently similar property are available.
However, in the majority of cases, such intra-group royalties are not considered as
the main assumption sources in the valuation.
An external source of information (in addition to internal company information)
which is commonly used to determine comparable royalty rates for any valuation
exercise are publicly available databases such as the Royaltystat or Royalty Source
databases: “The hypothetical royalty rate is hence usually derived from market-
based royalty rates for guideline or similar transactions. A prerequisite for this
method is the existence of comparable assets that are licensed at arm’s length on
138 Appendix 2.A – Description of valuation methodologies, 1.1 relief from royalty
method. 139 Grant Thornton, 2008, page 40.

European Commission
Study on the Application of Economic Valuation Techniques for Determining Transfer Prices of Cross Border Transactions between Members of Multinational Enterprise
Groups in the EU
September 2016 – 101
a regular basis”140. The search is typically run by focusing on industry codes similar
to those of the company analysed.
Comparability of the intangible assets found in agreements on public databases is
commonly assessed through criteria such as the industry sector, sub-sector and the
specific type and description of the asset. Besides, it is important to consider the
company’s revenues as royalty base: “The royalty rate and corresponding financial
parameters, such as revenues that would hypothetically be paid in an arm’s length
transaction by a willing licensee to a willing licensor for the rights to use the subject
intangible asset;”141
A final step in royalty benchmarking in valuations is a check for reasonableness of
the royalty in agreements found. It is important to note that, from a valuation
perspective: “Royalty rates can often vary significantly in the market for apparently
similar assets. It could be useful to cross-check the assumed royalty input by
reference to the operating margin that a typical operator would require from sales
generated from use of the asset.”142 In practice, this means that the results are
filtered and the rates that are considered to be outliers, and / or those that result in
royalties that are unreasonably high or low by reference to the profits of the
notional licensee are excluded in order to select the most similar licensing
agreement for the valuation.
- Transfer pricing perspective
In transfer pricing, determination of a royalty rate applicable for a specific IP, falls
under the principles of the CUP method in the TPG. As the OECD states, “where
reliable comparable uncontrolled transactions can be identified, the CUP method can
be applied to determine the arm’s length conditions for a transfer of intangibles or
rights in intangibles.”
As encountered in any application of the CUP method, the most important aspect to
consider is the comparability analysis. The TPG notes the five factors important in any
comparability analysis, being characteristics of the property or service, functional
analysis, contractual terms, economic circumstances, and business strategy. These
factors need to be similar in tested transactions (e.g. a transfer of intangible property)
in the controlled transaction and in the potential comparable uncontrolled
transactions. The first factor, characteristics of the property, is especially important for
analysis of the intangibles or rights in intangibles.143 In this respect, the OECD openly
recognises that finding reliable comparables may prove difficult or even impossible in
some cases.144
For determining the comparability of intangibles, it is essential to consider the unique
features that they might have. Some of the features that need to be taken into
account in this regard are the following:
Exclusivity – parties that have the right to exclude others from using the
intangibles do not have the same degree of market power or influence as parties
holding non-exclusive rights;
140 Guidance Note No. 4, para. 12-13. 141 Ibid. 142 Ibid. 143 OECD TPG, para.1.40. 144 OECD, Aligning transfer pricing outcomes with value creation, para. 6.146.

European Commission
Study on the Application of Economic Valuation Techniques for Determining Transfer Prices of Cross Border Transactions between Members of Multinational Enterprise
Groups in the EU
September 2016 – 102
Extent and duration of legal protection – for some intangibles that have limited
useful life (such as patents), the duration of the legal protection affects the
expectation of the parties of the future benefits;
Geographic scope – global rights may prove more valuable than geographically
limited rights;
Useful life – the useful life is affected by rate of technological change in a certain
industry and by the development of similar or potentially improved products; the
extent of useful life is also linked to expected future benefits from the use
intangibles, hence proving the intangibles with longer useful life to be more
valuable;
Stage of development – generally intangibles relating to products with established
commercial viability are more valuable than those related to products whose
commercial viability is not yet established; for partially developed intangibles, the
likelihood that the development will lead to future benefits must be evaluated;
Rights to enhancements, revisions, updates – having access to updates,
enhancements can make the difference between deriving short- or long-term
advantages from the intangibles;
Expectation of future benefit – in cases where a significant discrepancy is observed
between the anticipated future benefit of using one intangible as opposed to
another, it is difficult to consider the intangibles as being sufficiently comparable in
the absence of reliable comparability adjustments; moreover, actual and potential
profitability of products or potential products must be considered.
Furthermore, in performing a comparability analysis, the existence of risks related to
the likelihood of obtaining future benefits from the intangibles must be considered,
especially taking into account especially the following types of risks:145
Risks related to the future development of the intangibles;
Risks related to product obsolescence and depreciation in the value of the
intangibles;
Risks related to infringement of the intangible rights; and
Product liability and similar risks related to the future use of the intangibles.
It may prove necessary from the results of a comparability analysis to perform
comparability adjustments. The OECD makes reference to the specific principles laid
down by the OECD Guidelines with regards to such procedures, and it expresses
concern relating to performing such adjustments in situations where they represent a
large percentage of the compensation for the intangible. 146
In practice, a transfer pricing practitioner performing such comparability analyses
relies on the information drawn from external databases or proprietary compilations of publicly available licence or similar agreements.147
It is important, first, to verify if such
data is sufficiently detailed in order to permit an evaluation of the specific features of
comparability analysis presented above.148
145 OECD, Aligning transfer pricing outcomes with value creation, para. 6.128. 146 OECD, Aligning transfer pricing outcomes with value creation, para. 6.129. 147 OECD, Aligning transfer pricing outcomes with value creation, para. 6.130. 148 Ibid.

European Commission
Study on the Application of Economic Valuation Techniques for Determining Transfer Prices of Cross Border Transactions between Members of Multinational Enterprise
Groups in the EU
September 2016 – 103
In evaluating the comparable licence arrangements identified from databases, the
objective must be finding the most reliable data, keeping in mind that this will not
always be perfect.149 In this respect, the OECD points to the fact that sometimes
pragmatic solutions need to be found, without giving any specific guidance on the
actual level of pragmatism one can have while still respecting the comparability
standards. Examples are provided, such as the broadening of the search with regards
to other geographical markets, industries or even to different economic circumstances.
However, the choice between these options must be made on a case-by-case basis,
depending on the facts and circumstances and on the significance of the expected
effects of comparability defects on the reliability of the analysis.
- Key similarities / differences
From comparing the general valuation practice and the transfer pricing one, it appears
that although they are broadly similar, due to the strict comparability requirement of
the CUP method and to the extensive guidance of the TPG in this respect (reflected
also in the local laws and regulations in different countries), the royalty search is a
more detailed and rigorous exercise in the transfer pricing field than in valuations for
other purposes.
Routine return 4.2.3
Routine returns are used in the application of the Discounted Cash Flow and the
Excess Earnings Method as described in Section 3.
- General valuation perspective
In general, there are several approaches in valuation that aim at assessing the value
of an intangible by reference to the residual profits / cash flows and / or residual value
after taking into account the contribution to total profits or total value of all other
assets / activities of the business:
One variation of the premium profits method used in valuations for other purposes
derives a value of an IP asset by comparing an estimate of the profits or cash
flows that would be earned by a business using the asset with “normal profit” i.e.
profits that would be earned by a business that does not use the asset (that is, it is
based on the difference of the profits ‘with and without’ an asset).150 The method
deducts a “normal profit” from a peer company(ies) in the same sector which does
not own the same intangible. The valuer will prepare a forecast of periodic profit or
cash flows expected to be generated (or costs expected to be incurred) by a
market participant not using the IP. In this respect, it is common valuation practice
to search for quoted companies, looking specifically for listed peer companies that
do not own such an intangible. Typically, quoted company data is readily available
on publicly available databases (e.g. on Bloomberg, CapitalIQ or Infinancials). In
case no listed company matches the search criteria, it is possible to use non-
quoted companies (and hence to get data from Amadeus). In general, valuers
prefer to use quoted companies over non-quoted companies as more and
transparent data is readily available.
149 OECD TPG, para. 3.38. 150 Another variation of the method which is defined in Section 3 is estimating the
difference between the price of the products containing intangible with the price of a
generic product, and estimating the difference in cash flows linked to this price
difference.

European Commission
Study on the Application of Economic Valuation Techniques for Determining Transfer Prices of Cross Border Transactions between Members of Multinational Enterprise
Groups in the EU
September 2016 – 104
The method is used in PPA valuations infrequently, but this approach may come
closest to the “routine return” concept used in transfer pricing.
Excess earnings method determines the value of IP as the present value of the
profits attributable to the subject IP after excluding the proportion of the profits
that are attributable to other assets. The method deducts a “contributory asset”
charge based on a ‘fair return” on all other assets contributing to that income
stream, including other intangibles. In practice, the fair return on all other assets
are established based on available literature and on the experience of the valuer.
Typically, the fair return calculation builds up from the risk free rate, Weighted
Average Cost of Capital (‘WACC’) or Cost of equity, depending on the type of asset
(fixed assets, working capital, etc.).
One variation of the ‘residual profit method’ is the so called “Greenfield” method
[referred to in Section 3.2.3 main valuation methodologies (method 5) and
Appendix 3 – Description of OECD methodologies, point 4 – residual methods].
Under this method, the value of the subject intangible is determined using cash
flow projections that assume the only asset of the business at the valuation date is
the subject intangible. All other tangible and intangible assets must be bought,
built or rented. The Greenfield method deducts the total cost of buying or renting
all other assets. In this respect, the valuer will need to estimate the timing and
amount of expenditures related to the acquisition, creation or rental of all other
assets needed to operate the subject business.
- Transfer pricing perspective
In transfer pricing, “routine return(s)” account for profits from normal economic
activity earned by an entity using or owning the IP. That is, this return needs to
correspond to the profits performed by comparable companies which do not have the
specific intangible assets that are being examined. For the purposes of the application
of the Discounted Cash Method, these estimates are deducted from total cash-flows in
order to arrive to the residual profits, which are considered to reflect a value of the
intangibles.151
According to the transfer pricing principles and practice, identifying routine functions
and their respective returns falls under requirements of the TNMM method of TPG.
Similarly to the application of the CUP method, when performing a TNMM analysis, a
transfer pricing practitioner should first perform a comparability analysis in order to
comply with the arm’s length standard. However, for an application of the TNMM, the
functional similarity may be more important than the product / property similarity.152
Hence, a functional analysis is of a “must” to perform, in order “to identify and
compare the economically significant activities and responsibilities undertaken, assets
used and risks assumed by the parties to the transactions.”153 In this respect, the TPG
suggests to focus on the “principal functions performed by the party under
examination,” assessing “the economic significance of the functions performed in
terms of their frequency, nature, and value to the respective parties to the
151 With respect to this approach, it is important to note that one should not simply
assume that all residual profit, after a limited return to those providing routine
functions, should necessarily be allocated to the owner of intangibles. The transfer
pricing method selected should take into account all of the relevant factors materially
contributing to the creation of value, not only intangibles and routine functions (OECD
TPG, para. 6.133). 152OECD TPG, para.1.41. 153Ibid, para. 1.42.

European Commission
Study on the Application of Economic Valuation Techniques for Determining Transfer Prices of Cross Border Transactions between Members of Multinational Enterprise
Groups in the EU
September 2016 – 105
transactions”154 and considering the type and the nature of assets, and the risks
assumed. Adjustments should be considered, both for any material differences in the
functions undertaken155 (by an independent enterprise with which the tested party is
compared to) as well as for the differences in the risks assumed.156
In practice, the routine return is established by a search for comparable companies
that perform functions that are comparable (based on the functional analysis) to the
functions performed by the tested company (i.e. in the case of the discussed DCF, by
the company of which the forecast is considered for determining the value of the
intangibles), and their financial analysis. The search is in practice done on publicly
available database (e.g. BvD Amadeus, etc.) containing financial information on
companies for a number of years. Based on well-formulated search process and
qualitative and quantitative criteria (industry codes, size of operations, certain
financial rations, etc.),157 a transfer pricing specialist selects a set of comparable
companies and estimates certain financial indicators (net profit margin, etc.) based on
the sample of the selected companies and a number of years of financial data
available for such set. The TPG provides detailed advice with respect to the number of
years, the statistical range to calculate the financial return, etc. It is especially of high
importance for the sake of the arm’s length standard that the comparable companies
are independent entities and are not impacted by intercompany transactions that may
possibly not be priced at arm’s length.
For determining a set of the comparable companies, the reference to “pragmatic
solutions” of TPG is still valid (and based on the lighter comparability requirements is
arguably easier to implement with respect to routine returns benchmarks than to
royalty benchmarks).
- Key similarities / differences
As can be seen, the general valuation and the transfer pricing approaches regarding
routine / normal return are in principle rather similar. The transfer pricing concept of
routine returns seems to be stricter as it falls under the TNMM where there is
extensive TP practice, which cannot be said by the general valuation approach.
Accordingly, the transfer pricing notion is much more structured both in terms of
definition and the concept and very detailed in terms of the approach to concretely
determine the routine return than a similar concept used in general valuation practice.
The differences include:
(i) By virtue of using comparable companies’ financial information, the routine return
used in transfer pricing may incorporate a certain amount of normal goodwill and
going-concern value, which may not be the case in a valuation performed for
other purpose.158
In this respect, identifying the routine return is a more precise and prescribed
process in transfer pricing which is subject to a high level of scrutiny. This does
not seem to be the case with the general valuation practice which seems to be,
more simply, relying on publicly available peers in the same industry (without a
step-by-step search process required by the TNMM of the TPG).
154 Ibid, para. 1.43. 155 Ibid. 156 Ibid. 157 Ibid, para. 3.43. 158 Chandler et al (2010).

European Commission
Study on the Application of Economic Valuation Techniques for Determining Transfer Prices of Cross Border Transactions between Members of Multinational Enterprise
Groups in the EU
September 2016 – 106
(ii) A transfer pricing analysis may take industry-specific and business-cycle attributes
into account in a different way than in a PPA (e.g., assets that are trapped in a
declining industry could theoretically have a negative return [considered in the
PPA] while routine profits during a boom year may reflect a specific point in the
business cycle.159
With respect to the latter, transfer pricing practitioners may be governed by multi-
year analysis160 and weighted average calculations of profit margins to determine
appropriate routine return, as well as special considerations – based on factual,
functional and risk analysis – on what point in the range of routine returns161 to
select for applying a discounted cash flow/ residual profit method. Such
regimented approach is unlikely to be in case in general valuation practice, where
valuer’s judgment and experience often play a more significant role.
Discount rate 4.2.4
A key element of a valuation model is the discount rate or rates used in converting a
stream of projected cash flows into a present value. The final value of an asset valued
changes significantly based on the value of this parameter.
- General Valuation perspective
In the context of valuations of intangible assets and IP for purposes other than
transfer pricing (e.g. M&A purposes, for capital investment decision-making and / or
for dispute and litigation purposes), a certain body of research, practice and opinions /
guidance have evolved in respect of relevant factors affecting the estimation of
discount rates. The following are extracts found in valuation literature:
Since return requirements increase as risk increases and since intangible assets
are usually riskier for a company than are tangible assets, it is reasonable to
conclude that the returns expected on intangible assets typically will be at or
above the average rate of return (discount rate) for the company as a whole;162
“A comparative study of the uncertainty associated with R&D and that of property,
plant and equipment confirms the large risk differentials: The earnings volatility (a
measurement of risk) associated with R&D is, on average, three times larger than
the earnings volatility associated with physical investment”;163
In the specific context of litigation or disputes, the appropriate cost of capital is
often a significant aspect when valuing the lost profit of the plaintiff. As an
example, “in lost profits cases relating to intellectual property rights the law strives
to compensate the plaintiff for the cash flow it lost, and the law recognise time
value of money, hence the need for a rate of return discounting the IP cash
flows.164 As simplification, in many lost profit cases, the proper discount rate which
will be used in calculating the plaintiff’s lost profits will be its costs of capital of the
latter;165
159 Ibid. 160 OECD TPG, para. 3.175-3.179. 161 OECD TPG, para. 3.60-3.62. 162 Hitchner (2011). 163 Lev (2001), at 39. 164 Pratt et al (2011) at 109. 165 Ibid, at 110.
European Commission
Study on the Application of Economic Valuation Techniques for Determining Transfer Prices of Cross Border Transactions between Members of Multinational Enterprise
Groups in the EU
September 2016 – 107
Although for specific cases of IP rights valuation, discount rates can have a
significant explicit impact on the outcome of a dispute, “there is relatively little
guidance in case law regarding which specific discount rates apply in intellectual
property damages matters.” “Courts have allowed several methods to develop a
discount rate, including the CAPM166 method and the build-up method. For
intellectual property assets, the basic CAPM and the build-up method may be
expanded to include an additional intellectual property-related risk premium”.167
- Transfer pricing perspective
The TPG stresses the importance of the discount rate for the transfer pricing
practitioners performing a valuation. It notes that “the discount rate takes into
account the time value of money and the risk or uncertainty of the anticipated cash
flows. As small variations in selected discount rates can generate large variations in
the calculated value of intangibles using these techniques, it is essential for taxpayers
and tax administrations to give close attention to the analysis performed and the
assumptions made in selecting the discount rate or rates utilised in the valuation
model.”168
The OECD underlines that “there is no single measure for a discount rate that is appropriate for transfer pricing purposes in all instances.”169 Valuers should not
assume that there is a pre-determined formula or that the WACC approach should
always be used when determining discount rates for transfer pricing purposes –
“instead specific conditions and risks associated with the facts of a given case and the
particular cash flows in question should be evaluated in determining the appropriate discount rate.”170
It is important to account for risk when calculating discount rates; for instance,
intangibles still in the development phase may be the riskier elements of a taxpayer’s
business.171 However, not all businesses have the same level of risk and some cash
flow streams are inherently more volatile than others, such as the likelihood of
expenses is higher than the likelihood of revenues to be generated from an intangible.
The discount rate(s) needs to reflect the level of risk in the overall business as well as
the expected volatility of the various projected cash flows taking into consideration the circumstances of each individual case, with care to avoid double discounting for risk.
172
- Key similarities / differences
As illustrated above, the theory on discount rates is basically the same for general
valuations as well as for transfer pricing ones. The two practices register some
differences, supported also by transfer pricing literature. In this sense, it is mentioned
that that the discount rate determination in transfer pricing practice may be not as
thorough or complete as in the valuation practice for other purposes. For instance, one
author comments that, historically in the context of transfer pricing, relatively
straightforward approaches relating to discount rates have been taken, often only
analysing / estimating the WACC of the business as a whole or similar sources of
discount rates. [The author explains a reason behind this being that transfer pricing
166 Capital Asset Pricing Model. 167 Pratt et al, 2011, at 132-134. 168 OECD, Aligning transfer pricing outcomes with value creation, para. 6.170. 169 OECD, Aligning transfer pricing outcomes with value creation, para. 6.171. 170 Ibid. 171 OECD, Aligning transfer pricing outcomes with value creation, para. 6.172. 172 OECD, Aligning transfer pricing outcomes with value creation, para. 6.173.

European Commission
Study on the Application of Economic Valuation Techniques for Determining Transfer Prices of Cross Border Transactions between Members of Multinational Enterprise
Groups in the EU
September 2016 – 108
analyses have focused on determining correct taxable income for a specific year,
rather than determining present value, which is not the case for transfer pricing
valuations of transferred IP].
In PPA analyses, more attention is given to discount rate issues, especially by (i)
comparing the internal rate-of-return (IRR) implied by the financial forecasts used to
price the acquisition with the WACC as a way of assessing consistency between these
forecasts and the price that was paid as part of the acquisition and (ii) developing a
weighted-average return, which is used to evaluate whether or not the specific
discount rates applied to the cash flows derived from different assets are consistent
with the overall WACC.173
Useful life 4.2.5
- General Valuation perspective
International Valuation Standards address the issue of useful life of intangible assets:
“An important consideration is the remaining useful life (‘RUL’) of an intangible asset.
This may be a finite period limited by either contract or typical life cycles in the sector;
other assets may effectively have an indefinite or even infinite life. Estimating the RUL
will include consideration of legal, technological or functional and economic factors.
For instance, an asset comprising a drug patent may have a remaining legal life of five
years before expiry of the patent, but a competitor drug with expected improved
efficacy may be expected to reach the market in three years. This might cause the
RUL of the first product to be assessed as only three years”174.
- Transfer pricing perspective
The TPG also gives special attention to the useful life. It is stated that “to determine
the projected useful life of specific intangibles, all relevant facts and circumstances
must be taken into consideration. As mentioned before under the comparability
analysis factors, the useful life of a particular intangible can be affected by the nature
and duration of the legal protections afforded the intangible, by the rate of
technological change in the industry, and by other factors affecting competition in the
relevant economic environment.”175
The OECD recognises that intangibles might contribute to the generation of cash flows
even after the legal protection have expired or the products related the intangibles
have ceased to be marketed. On the other hand, the TPG notes that even though
“some intangibles have an indeterminate useful life at the time of valuation, this does
not imply that non-routine returns are attributable to such intangibles in
perpetuity.”176 However, the TPG does not elaborate however, on this statement any
further.
When intangibles contribute to revenues beyond the period for which financial
projections exist, usually a terminal value for the intangible related cash flows is
calculated. “Where terminal values are used in valuation calculations, the assumptions
173 Chandler et al (2010). 174 Guidance note no. 4, at 26. 175 OECD, Aligning transfer pricing outcomes with value creation, para. 6.175. 176 OECD, Aligning transfer pricing outcomes with value creation, para. 6.176.

European Commission
Study on the Application of Economic Valuation Techniques for Determining Transfer Prices of Cross Border Transactions between Members of Multinational Enterprise
Groups in the EU
September 2016 – 109
underlying their calculation should be clearly set out and the underlying assumptions
thoroughly examined, particularly the assumed growth rates.”177
- Key similarities / differences
From the above, it appears that the intangible useful life definition is similar or the
same for transfer pricing and for valuations for other purposes. Differences between
the approaches stem from transfer pricing being a separate discipline which looks at
the transactions from perspectives of two specific parties, while general valuations
consider hypothetical buyers or sellers on the open market. This means that the
transfer pricing experts will focus on the useful life of the intangible assets in the
hands of the two particular parties rather than a useful life of the same intangible
asset in the hands of a hypothetical market participant.
Some authors note that there are differences in practice for determining useful noting
that the corporate finance valuations or PPA will come up with a useful life different
from a transfer pricing valuation”178 It is however observed in the literature that the
life of an intangible is an aspect where it may be especially important to coordinate
PPA and transfer pricing analyses. This is because the analyses and decisions that are
made about life for financial statement purposes are likely to carry a certain amount of
weight in the cases of transfer pricing controversy.179
Conclusion 4.2.6
Based on the analysis in section 3, it was evident that the definition of the methods
and theoretical framework is different in transfer pricing compared to general
valuation practice, governed by the OECD’s TPG and the degree the TPG is
implemented in the local laws and regulations. Based on the investigation in the
present section, it seems that the parameters (building blocks) used for building a
valuation model are broadly similar, however there are differences registered between
the two practices mainly caused by transfer pricing being a particular discipline.
Besides the differences listed above at both levels, it is important to note that the
degree and scope of the documentation of valuation may also be different. This
difference stems from the specifics of the audience to the valuation exercise. In case
of transfer pricing in particular, it is important to note that the valuation report
(transfer pricing report) may often be reviewed by the tax authorities in the course of
a transfer pricing audit only several years after its preparation. “Tax authorities often
have a high level of scepticism about the forecasts and assumptions and underlying
the analysis, and are willing to second guess both methods and data.”180 In this
respect, the full documentation of factual background, of functional and risk analyses
of the parties involved in the transactions becomes of ultimate importance as a proper
justification of the valuation approach and results obtained years before the audit.
4.3 Parametrisation of main building blocks in practice
For the presentation of the results on analysis of the building blocks, answers provided
to the study team in response to the survey sent to practitioners in all EU Member
States is used as the main basis for analysis, as described in Section 1. For the
177 OECD, Aligning transfer pricing outcomes with value creation, para. 6.177. 178 Se for instance Chandler et al, 2010, or Finan et al, 2011. 179 Chandler et al, 2010. 180 Ibid.

European Commission
Study on the Application of Economic Valuation Techniques for Determining Transfer Prices of Cross Border Transactions between Members of Multinational Enterprise
Groups in the EU
September 2016 – 110
purposes of consistency, unless noted otherwise, the input of 22 Member States 181
that have been exposed to valuations of IP in the context of transfer pricing. For the
answers of the main trade partners of the EU, nine respondent inputs have been
used.182
Financial Data 4.3.1
- EU Member States
Financial forecast validation
The first question related to financial data inquired as to how frequently the experts
performing valuations for transfer pricing purposes perform a reasonability check of
financial data provided to them by the taxpayer. In this respect, besides five Member
States respondents having observed little activity on valuations for transfer pricing
purposes, three additional Member States respondents did not provide an answer to
this question.183 All responding countries agreed that they perform some kind of
reasonability analysis, with 17 Member States respondents noting valuations are often
or always performed and only three countries answering that valuations are only
“sometimes” performed.
Figure 35. Frequency of reasonability check on financial data provided – EU
Member States
Following the previous question, the respondents were asked to indicate which data
are used in order to perform such a reasonability check of the financial data provided
for valuation purposes and in what way they are used. The following choices were
provided:
No data, just checking for obvious outliers (“jumps” in sales / profitability, etc.);
181 Missing countries that did not have experience are Bulgaria, Croatia, Cyprus,
Ireland, Malta and Slovenia. 182 Brazil does not have experience with valuations of intangibles for transfer pricing
purposes. 183 These are Bulgaria, Estonia, and Luxembourg.

European Commission
Study on the Application of Economic Valuation Techniques for Determining Transfer Prices of Cross Border Transactions between Members of Multinational Enterprise
Groups in the EU
September 2016 – 111
Compare the forecast or projected growth with the past profitability (historical
data) of the company;
Other (please explain).
The results are illustrated in the figure below.
Figure 36. Ways to perform reasonability check of the forecast – EU Member
States
Member States respondents were requested to mark all answers that apply to their
market. Among 20 respondents that responded to this question, the most frequently
indicated answer was a comparison of the forecast with the past profitability (with 17
Member States noting indicating this). Checking for outliers was marked by 11
respondents. Also, 10 Member States respondents noted that they will do some kind
of comparison with the market or with competitors or peer companies. From five
additional responses, respondents from Member States cited checks concerning
working capital, reinvestment levels and relevant ratios. Among these five, one
Member State respondent184 also quoted that it is important to compare the past
actuals with the past forecasts (to determine whether or not the forecasts in the past
overstated the past performance) and another Member State respondent noted that
perform an interview with the management may be performed, particularly to discuss
the forecast and all assumptions behind it.185
It is important to note the survey inquired about the practice with respect to price
adjustment clauses and their frequency since those may serve as potential remedies
for the financial data being uncertain. This part of the survey results is addressed in
Section 3.
184 UK. 185 Italy.
11
17
10
5
-
2
4
6
8
10
12
14
16
18
Outliers Forecast vs. past profitability Peer comparison/ industrynorms/ market
Other

European Commission
Study on the Application of Economic Valuation Techniques for Determining Transfer Prices of Cross Border Transactions between Members of Multinational Enterprise
Groups in the EU
September 2016 – 112
Level of profit and taxes
One of the rather controversial questions in transfer pricing is whether to use free
cash flows or operating profit for the purposes of valuation. As mentioned in Section
4.1, the OECD leaves this question open in the TPG. Practice in this respect was
investigated in the survey.
Figure 37. Use of operating profit or free cash flow to determine IP value –
EU Member States
Only 18 Member States specialists responded to the question, with others observing
no relevant use of valuations for transfer pricing purposes in their respective markets.
It is interesting that the respondents are divided on whether free cash flows will be
exclusively used or either free cash flows or operating profit will be chosen, depending
on the approach, method, or the case in hand. There is no Member State respondents
which states that operating profit will be exclusively used, although two Member
States respondents (UK and Greece) out of nine answering “Both / Depends” indicate
that the operating profit is used as often as possible. The UK expert notes in this
respect that using operating profits allows avoiding the issue of differences in tax
amortisation benefits and tax rates when performing a valuation.
Another interesting question in this regard, is whether a final value of intangible asset
obtained through the valuation is a value on pre-tax or post-tax basis. Presumably,
since the transfer pricing focuses on determining taxpayers’ tax base, the value should
be obtained on a pre-tax basis. However, the answers to this question were somewhat
divided.
9 9
- 1 2 3 4 5 6 7 8 9
10
Free cash flow Both / Depends

European Commission
Study on the Application of Economic Valuation Techniques for Determining Transfer Prices of Cross Border Transactions between Members of Multinational Enterprise
Groups in the EU
September 2016 – 113
Figure 38. Pre-tax or post-tax value of IP obtained – EU Member States
Out of 19 responses to this question, ten respondents report that post-tax basis is
used. Five respondents report that pre-tax value is used (it may involve making
calculations on a post-tax basis but then grossing up the result to arrive at a pre-
taxed value). Four other respondents report that both types of valuations may occur,
some with post-tax or others with post-tax values. Furthermore, respondents in
Denmark, Germany, Sweden and the Netherlands have a relatively high level of
experience in transfer pricing valuations.
- EU Main trade members
Financial forecast validation
Similarly to EU Member States, checking financial forecasts that serve as a basis of
the valuation exercise is important in trade partners’ countries. Of nine trade partner
respondents, eight perform a reasonability analysis “often” to “always”. Only one
country (Australia) puts this frequency at “sometimes.”
Figure 39. Frequency of reasonability check on financial data provided –
Trade partners
5
10
4
-
2
4
6
8
10
12
Pre-tax Post- tax Both/ Depends
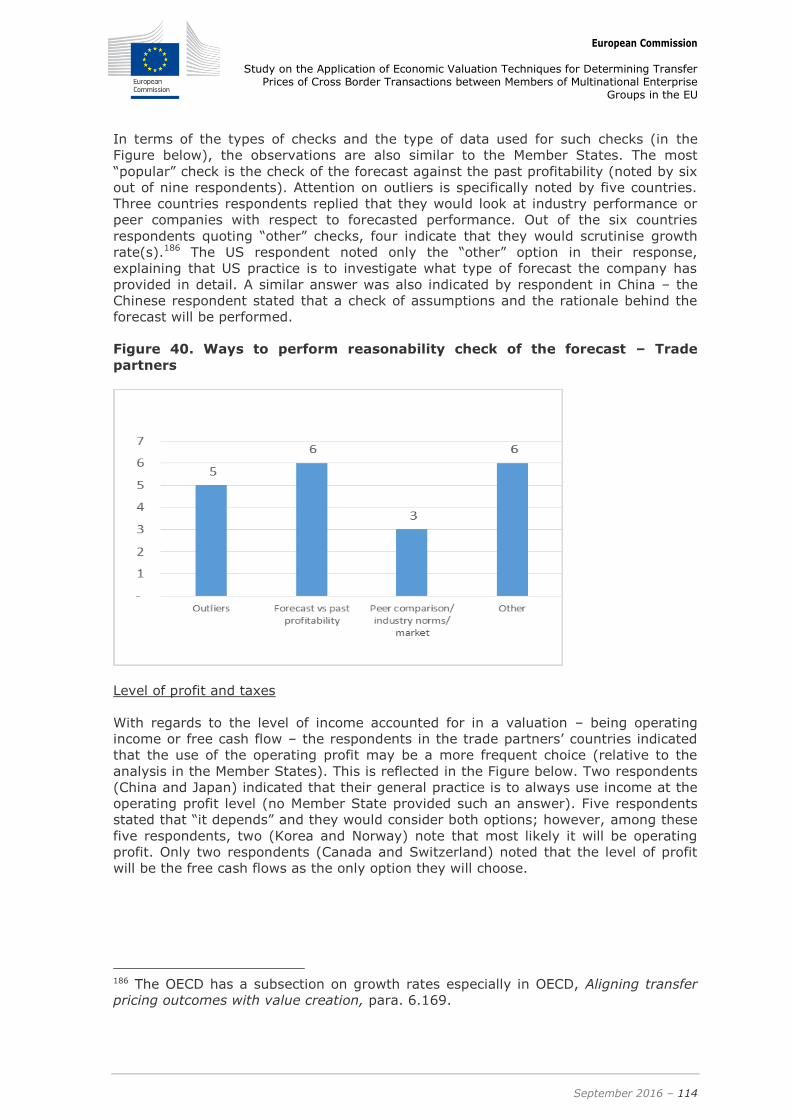
European Commission
Study on the Application of Economic Valuation Techniques for Determining Transfer Prices of Cross Border Transactions between Members of Multinational Enterprise
Groups in the EU
September 2016 – 114
In terms of the types of checks and the type of data used for such checks (in the
Figure below), the observations are also similar to the Member States. The most
“popular” check is the check of the forecast against the past profitability (noted by six
out of nine respondents). Attention on outliers is specifically noted by five countries.
Three countries respondents replied that they would look at industry performance or
peer companies with respect to forecasted performance. Out of the six countries
respondents quoting “other” checks, four indicate that they would scrutinise growth
rate(s).186 The US respondent noted only the “other” option in their response,
explaining that US practice is to investigate what type of forecast the company has
provided in detail. A similar answer was also indicated by respondent in China – the
Chinese respondent stated that a check of assumptions and the rationale behind the
forecast will be performed.
Figure 40. Ways to perform reasonability check of the forecast – Trade
partners
Level of profit and taxes
With regards to the level of income accounted for in a valuation – being operating
income or free cash flow – the respondents in the trade partners’ countries indicated
that the use of the operating profit may be a more frequent choice (relative to the
analysis in the Member States). This is reflected in the Figure below. Two respondents
(China and Japan) indicated that their general practice is to always use income at the
operating profit level (no Member State provided such an answer). Five respondents
stated that “it depends” and they would consider both options; however, among these
five respondents, two (Korea and Norway) note that most likely it will be operating
profit. Only two respondents (Canada and Switzerland) noted that the level of profit
will be the free cash flows as the only option they will choose.
186 The OECD has a subsection on growth rates especially in OECD, Aligning transfer
pricing outcomes with value creation, para. 6.169.

European Commission
Study on the Application of Economic Valuation Techniques for Determining Transfer Prices of Cross Border Transactions between Members of Multinational Enterprise
Groups in the EU
September 2016 – 115
Figure 41. Use of operating profit of free cash flow to determine IP value –
Trade partners
Finally, regarding the valuation result being reported on a post-tax or pre-tax basis
(see Figure below), most trade partners’ respondents agreed that it should ultimately
be a pre-tax number (and thus the value obtained by summing up discounted cash
flows would need to be grossed up). One respondent (Australia) that answered that
both options are possible and noted that, in most cases, the pre-tax value is used. The
three respondents that mention post-tax values used are from Canada, India and
Japan. The US expert noted that the US Cost sharing regulations require obtaining
post-tax cash flows and gross them up, thus arriving at pre-tax value.187
Figure 42. Pre-tax or post-tax value of IP obtained – Trade partners
187 US Treas. Reg. 1.482-7(g)(4)(i)(G) state that “In principle, the present values …
should be determined by applying post-tax discount rates to post-tax income…”
5
3
1
-
1
2
3
4
5
6
Pre-tax Post-tax Both/ Depends

European Commission
Study on the Application of Economic Valuation Techniques for Determining Transfer Prices of Cross Border Transactions between Members of Multinational Enterprise
Groups in the EU
September 2016 – 116
Royalty rate 4.3.2
- EU Member States
Approach
Member States respondents were requested to comment on their practice with regards
to the determination of a royalty rate. Whereas it is viewed as a building block for the
“relief from royalty” method, the approach for finding an appropriate royalty is the
same whether or not it is also a study to determine an on-going royalty payment for a
right to use intangibles (i.e. for the transactions not involving a transfer of IP.
All surveyed Member States respondents agreed that they follow the principles of the
CUP method of the TPG when estimating a royalty. In this respect, as a first step, the
transfer pricing practitioners in all countries look for internal CUPs, whereby they try
to obtain information about the transactions in terms of the same or similar IP entered
by any company of the group with a third party. These are typically license
arrangements concluded with unrelated parties covering the same or similar
intangibles as the ones being valued. In a second step, the transfer pricing
practitioners attempt a search for external license agreements for the same or similar
IP, after gathering the necessary information about the intangibles on its use and
popularity, functional profile of the company, business activities, geographical scope
and any related information.
Databases
Member States respondents were asked to comment on the database used for the
external searches. The most often used databases for royalty rate CUP searches are
illustrated in the figure below. It can be seen that RoyaltyStat seems to be the most
popular database among transfer pricing specialists (19 out of 20188 Member States
respondents to this question), sometimes used in parallel with RoyaltySource, ktMINE
or TP Catalyst.
188 Estonia registered no experience in performing external CUP searches as these are
outsourced to Lithuania or Latvia. Finland also outsources searches within Deloitte.
Other six countries with no experience with valuations for TP purposes (Bulgaria,
Croatia, Cyprus, Ireland, Malta and Slovenia).

European Commission
Study on the Application of Economic Valuation Techniques for Determining Transfer Prices of Cross Border Transactions between Members of Multinational Enterprise
Groups in the EU
September 2016 – 117
Figure 43. Databases used in searches for royalty rates189
Main difficulties
Next, the Member States respondents were requested to comment on the main
difficulties when performing a royalty search. Comparability factor was cited as the
biggest difficulty in this respect by 21190 Member States respondents, be it related to
the uniqueness of the intangible or to the terms and conditions of the contractual
relationship.
Regarding comparability, Member States respondents pointed out the subjectivity and
hassle of making decisions on the degree of comparability. In this respect, the UK
interviewed experts note that, on the onset of the potential comparable search, it is
important to evaluate whether or not the intangibles at stake are “me too” intangibles,
that is, if they may have substitutes performing the same function. In this respect,
although all intangibles are unique, they do not necessarily provide unique services or
value and may have substitutes. For example, with respect to software technology,
there may be comparable technologies performing the same function (i.e. enabling a
use of a keyboard), hence finding comparables may be possible. However, this is not
true for all intangibles – for instance the Coca-Cola brand is unlikely to have
comparables that perform the same function or which have similar value creation
characteristics in the same industry.
Other difficulties encountered are illustrated and described below.
189 Countries were allowed to list more than one database used if relevant for them. 190 Finland has answered this question, in contrast to the previous question on the
databases. Countries were allowed to mention more than one difficulty when
answering the question. However all countries that provided at least one response to
this question mentioned comparability as the main issue.

European Commission
Study on the Application of Economic Valuation Techniques for Determining Transfer Prices of Cross Border Transactions between Members of Multinational Enterprise
Groups in the EU
September 2016 – 118
Figure 44. Difficulties in finding appropriate royalty rates – EU Member States
In addition to comparability, one Member State respondent mentioned that
occasionally the range calculated for the royalties is too wide and it is difficult to
choose and justify a certain point within the range. Another three Member States
respondents have observed that the quality and amount of data are not sufficiently
reliable due to the limited number of transactions found in databases and to the
outdated character of many of the agreements. Four countries respondents have
pointed out that an important problem in comparability is the fact that the databases
used for searching for royalty agreements contain mainly the US agreements and that
the conditions are not comparable and applicable to European cases.
Acceptability of external benchmarks
The benchmarked royalty rates seem to be rather accepted by the tax administrations
in the EU Member States, as illustrated in the chart below. Sixteen Member States
respondents (out of 23191 answering the question) noted that royalty rates are often or
very often accepted, sometimes due to lack of experience at the level of tax
authorities or due to limited access to databases. Four of the Member States
respondents are aware of occasional challenges from the tax authorities. Member
States respondents noted that the most frequent reason of challenging the royalty
rate is a lack of comparability or the quality of work and aggressiveness of the royalty
rate. Two Member States respondents out of 23 providing an answer noted no
experience with regards to this question.
191 Estonia answered this question in comparison with the question above. The only
five countries with no experience with valuations for TP did not respond to this
question.
21
1
3 4
0
5
10
15
20
25
Comparability Wide range ofroyalties
Quality andamount of data
Georgraphicalcriteria

European Commission
Study on the Application of Economic Valuation Techniques for Determining Transfer Prices of Cross Border Transactions between Members of Multinational Enterprise
Groups in the EU
September 2016 – 119
Figure 45. Acceptability of royalty rates by tax authorities – EU Member
States
- EU Main Trade Partners
Approach
Similar to the professionals in the EU countries, practices in trade partners countries,
appear to be starting benchmarking the royalty with first checking whether or not an
internal CUP exists before proceeding to perform an external search. In Japan and in
the US, the Comparable Uncontrolled Transaction (“CUT”) method is used in this
respect, a method very similar to the OECD’s CUP method. The Indian experts note
that, besides external comparable agreements search, the practice is also to look at
the royalty rates of competitors and or to apply the rule of thumb of the royalty being
equal to 25%-33% of EBIT.
In proceeding with the external comparables search, the US expert especially stressed
that a highly important step is to clearly delineate the extent and nature of the
right(s) that need to be measured before proceeding with any kind of search – internal
or external. For instance, if the project concerns a “right to further develop an
intangible”, such specific right will be hard to match in a comparables’ search since
there are rarely agreements that license out a right to further develop an intangible to
an external party. The same consideration occurs with respect to the exclusivity of the
license. When “the right” to the intangible is so difficult to match, it may be the case
that the CUP / CUT method is not the most appropriate one; or, if the circumstances
allow, there is a need to perform adjustments.192
Databases
The databases mostly used by the EU’s main trade partners are illustrated below. It
can be observed that all of them use the RoyaltyStat database and that the second
most popular one is ktMINE, third being RoyaltySource. In the US, the LexisNexis
database is also used, which contains data extracted from the SEC filing reports.
192 This is similar to the OECD TPG in this respect. The US TP Regulations in addition
lay down rules for performing adjustments.
4
17
2
0
2
4
6
8
10
12
14
16
18
Sometimes Often / very often No experience

European Commission
Study on the Application of Economic Valuation Techniques for Determining Transfer Prices of Cross Border Transactions between Members of Multinational Enterprise
Groups in the EU
September 2016 – 120
Figure 46. Databases used in searches for royalty rates – Trade partners
Difficulties
All trade partner respondents recognise that the biggest difficulty in finding
appropriate royalty rates stands in the comparability factor. This can be related to the
intangible itself, the industry, the specific extent and nature of the right, or to the
other terms and conditions of the agreement. One country respondent also notes that
the disclosure of sufficient information in order to enable reliable comparability
assessments is an issue, next to the difference in timing between comparable and
tested agreements.
Acceptability of external benchmarks
The degree of acceptability of benchmarked royalty rates by the tax authorities in the
trade partner countries seems rather high, as in the EU Member States (see Figure
below). Five countries respondents note that royalty rates are often or very often
accepted, while in the four countries royalty rates are only sometimes accepted. In
terms of comments on this question, one respondent also noted that tax authorities
always challenge the rates. However, they cannot sustain this challenge given that
they do not offer a better methodology for the search. Another two respondents made
the observation that royalty rates are accepted in their jurisdiction as long as
comparables are reliable in terms of matching the right of the tested transaction, the
business activities of the parties, and the profit potential.
9
4
6
1
-
1
2
3
4
5
6
7
8
9
10
RoyaltyStat RoyaltySource ktMINE LexisNexis

European Commission
Study on the Application of Economic Valuation Techniques for Determining Transfer Prices of Cross Border Transactions between Members of Multinational Enterprise
Groups in the EU
September 2016 – 121
Figure 47. Acceptability of royalty rates by tax authorities – Trade partners
In terms of reasons for the challenge, one respondent193 explained that tax authorities
may try to re-characterise the transactions involving the payment of royalties into
service provision agreements. The same respondent notes that in the cases of internal
CUPs, tax authorities reconsider the royalty rate taking into account the fact that local
IP-related expenses were incurred to develop the intangible; in this respect, they may
argue that for instance a trademark would not be worth the royalty payment. This
respondent also mentioned that most of challenges are regarding “soft” intangibles,
and that “hard” intangibles, whereby the IP is developed outside of the country and
then licensed to this jurisdiction, are usually accepted.
The rest of the respondents noted that the most frequent challenge from the tax
authorities is the comparability of the intangibles and rights under consideration. One
country specifically mentioned that tax authorities look at the profitability of the party
abroad and only then decide on the acceptability of the royalty rate.
Routine return 4.3.3
- EU Member States
Approach
For the determination of routine returns (for the purposes of DCF / residual profit
method), all 20194 Member States specialists responding to the question indicated that
first the routine functions would be identified, and then a benchmarking search under
the principles TNMM would be performed. Two respondents also expressed reservation
in the application of the residual profit methodology, one being more inclined to apply
full profit split instead due to court favouring in such a direction.195 196 On the general
193 Canada. 194 Estonia outsources such searches to Lithuania or Latvia and Luxembourg has no
experience in this respect. Austria did not answer this question; plus other five
countries as before are not accounted for (Croatia, Cyprus, Ireland, Malta and
Slovenia). 195 The UK. 196 Second country, Austria mentioned that the residual profit split model was rejected
during a recent audit; however not due to the TNMM per se but the (high) value of the
routine return rate.
4
5
-
1
2
3
4
5
6
Sometimes Often / Very often

European Commission
Study on the Application of Economic Valuation Techniques for Determining Transfer Prices of Cross Border Transactions between Members of Multinational Enterprise
Groups in the EU
September 2016 – 122
question of whether the TNMM is a well-accepted methodology, 24197 Member States
respondents confirmed that this is the case.
Databases
For benchmarking routine returns, the most used databases are illustrated in the
figure below. It can be seen that the Bureau van Dijk’s (“BvD”) Amadeus database is
by far the most used, with some Member States respondents also using Orbis (a BvD’s
worldwide database) and the local databases. The local databases are often the
databases of BvD limited to a certain country or region and containing more
companies in these areas rather than Amadeus which has Pan-European (regional)
coverage. An explicit limitation of Amadeus appears to be that it does not provide
enough information in order to make an informed decision relating to comparability of
functions. In contrast, the US SEC Reports used in the US and Canadian practices for
selecting local comparables allow for this.
Figure 48. Databases used in benchmarking routine returns 198
Difficulties
In practice, some difficulties appear when applying the TNMM for determining routine
returns. However, whereas all Member States specialists responding to a similar
question regarding royalties cited at least one difficulty (being comparability), the
routine return exercise appears to raise fewer difficulties. The figure below illustrates
the most frequent difficulties encountered by the 21199 Member State professionals
responding to the question. Respondents could indicate more than one factor in their
response.
197 Croatia, Cyprus, Estonia Luxemburg did not provide a response to this question. 198 Four countries did not answer the question as they cited no experience with
performing, reviewing or defending benchmarking searches .These are Cyprus,
Croatia, Luxemburg and Malta. 199 Austria, Cyprus, Croatia, Estonia, Malta, Luxemburg, and Slovenia did not provide
an answer to this question.
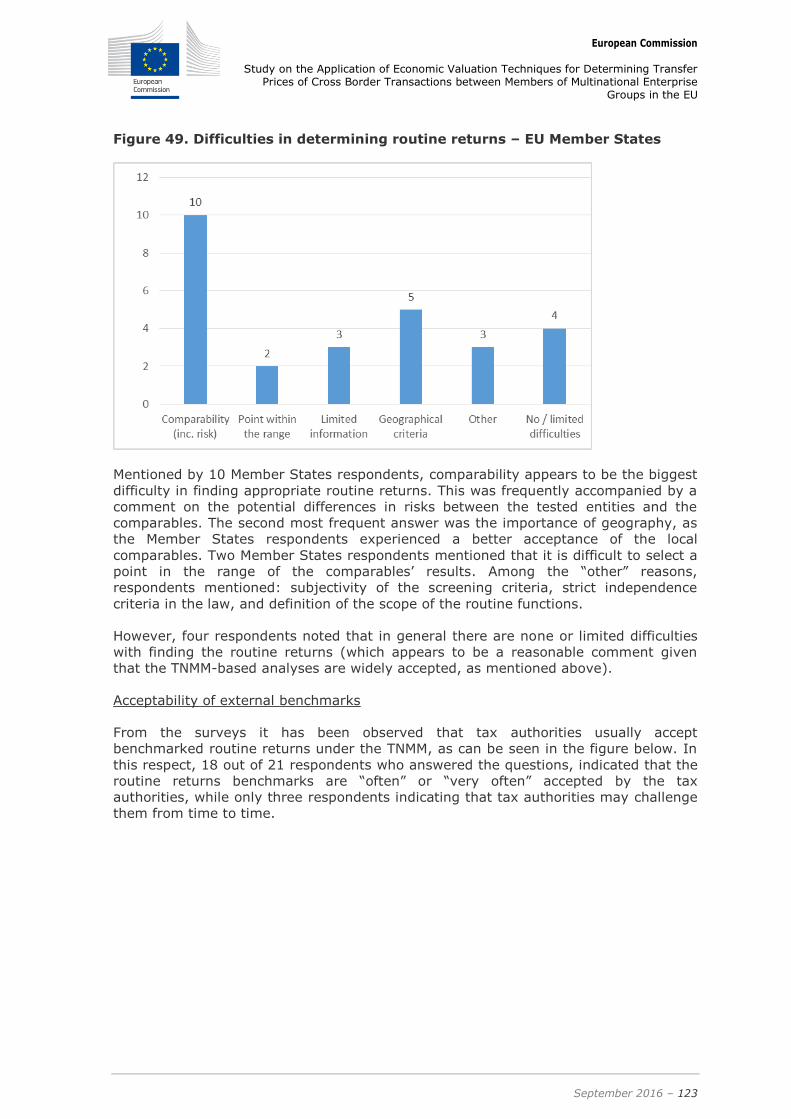
European Commission
Study on the Application of Economic Valuation Techniques for Determining Transfer Prices of Cross Border Transactions between Members of Multinational Enterprise
Groups in the EU
September 2016 – 123
Figure 49. Difficulties in determining routine returns – EU Member States
Mentioned by 10 Member States respondents, comparability appears to be the biggest
difficulty in finding appropriate routine returns. This was frequently accompanied by a
comment on the potential differences in risks between the tested entities and the
comparables. The second most frequent answer was the importance of geography, as
the Member States respondents experienced a better acceptance of the local
comparables. Two Member States respondents mentioned that it is difficult to select a
point in the range of the comparables’ results. Among the “other” reasons,
respondents mentioned: subjectivity of the screening criteria, strict independence
criteria in the law, and definition of the scope of the routine functions.
However, four respondents noted that in general there are none or limited difficulties
with finding the routine returns (which appears to be a reasonable comment given
that the TNMM-based analyses are widely accepted, as mentioned above).
Acceptability of external benchmarks
From the surveys it has been observed that tax authorities usually accept
benchmarked routine returns under the TNMM, as can be seen in the figure below. In
this respect, 18 out of 21 respondents who answered the questions, indicated that the
routine returns benchmarks are “often” or “very often” accepted by the tax
authorities, while only three respondents indicating that tax authorities may challenge
them from time to time.

European Commission
Study on the Application of Economic Valuation Techniques for Determining Transfer Prices of Cross Border Transactions between Members of Multinational Enterprise
Groups in the EU
September 2016 – 124
Figure 50. Acceptability of routine benchmarks by tax authorities – EU
Member States
The main reasons why tax authorities challenge benchmarked routine returns are the
following:
Comparability – geography may be an important aspect where local comparables
are required; also the routine character of the comparables is questioned by tax
authorities;
The choice of method – some tax authorities argue that there was another more
appropriate method to determine routine returns; or there may exist a hierarchy of
methods in place.
It is noted that the tax authority may also focus on “cherry picking” the comparable
companies thus leaving in the set the companies that give a more favourable result.
- EU Main Trade partners
Approach
Out of the nine trade partners’ respondents considered for this summary, all agreed
that for determining routine returns they would perform a TNMM analysis. In some
countries (Canada and the US), the Comparable profits method (“CPM”) is used, which
is the correspondent of the OECD method TNMM. Japanese respondent explained that,
in Japan, the law specifies that, in order to determine the routine returns, the transfer
pricing analysis should adhere to the principles of the TNMM, with consideration of any
adjustments if needed.
The US respondent noted that two methods could be used for this purpose, CUT
(similar to the OECD’s CUP) and CPM (similar to the TNMM). In this respect, the CUT
analysis may be used in the case when the studied intangibles are more extensive in
scope than the intangibles in the comparable agreements. For instance, a CUT analysis
may be used to benchmark the “make and sell” rights only, whereas the full profit
potential may represents the rights to “make, sell and develop.” Hence, the profit
potential remaining after deduction of the benchmarked right “to make and sell” will
represent the value of the right to further develop (which is a typical tested
transaction in this jurisdiction).

European Commission
Study on the Application of Economic Valuation Techniques for Determining Transfer Prices of Cross Border Transactions between Members of Multinational Enterprise
Groups in the EU
September 2016 – 125
Databases
The variety of databases used for benchmarking routine returns is much broader
among the EU trade partner respondents. However, comparing the sources is not a
fruitful exercise since the databases cover different regions where the selected trade
partners are located. For example, there is little reason to expect that Asian countries
use the US databases or vice-versa.
This is different from the databases used for royalty benchmarks since these are fed
with one unique underlying source of the royalty agreements - being SEC filings of the
US corporations. Therefore, independent of his or her region, any transfer pricing
analyst can potentially use the same database.
Difficulties
The most frequent difficulties encountered in benchmarking routine returns are
illustrated in the figure below. As also observed between EU Member States
respondents, comparability (geography, risk profile) is registered as the biggest
difficulty in this respect, with seven respondents indicating this. One respondent also
observed that the distinction between routine and non-routine functions represents
another difficulty, as there are market factors that can affect profitability and it is
difficult to determine whether this is part of a routine return or not. Two respondents
(i.e. Canada and the US) state that there are not many difficulties in finding routine
returns. One country (i.e. Australia) also notes that there is no sufficient information
publicly available to make an informed decision on comparability.
Figure 51. Difficulties in determining routine returns – Trade partners
Acceptability of external benchmarks
The rate of acceptability of routine returns by the tax authorities in trade partner
countries is also high, similar to what was observed among Member State
respondents. The figure below illustrates that in seven countries benchmarked routine
returns are “often” or very “often accepted”, while in two countries this is only
sometimes accepted by the tax authorities.

European Commission
Study on the Application of Economic Valuation Techniques for Determining Transfer Prices of Cross Border Transactions between Members of Multinational Enterprise
Groups in the EU
September 2016 – 126
Figure 52. Acceptability of routine returns by tax authorities – Trade partners
The most frequent reason cited in challenging the routine returns by tax authorities
seems to be a lack of comparability. The practitioners also mentioned that cases have
been observed where tax authorities challenged the appropriateness of some
comparables in a set, depending on their interest in the result. In Japan, as previously
mentioned, tax authorities always look at the profitability registered abroad. If the
profitability is higher than that in Japan, they may challenge the analysis of routine
returns. If they see that the results are reasonable from Japanese perspective (i.e. the
routine returns benchmarks in Japan are no lower than abroad), the routine returns
analyses are generally accepted. One respondent (i.e. India) also mentioned that tax
authorities may prefer the CUP method over the TNMM or that they might challenge
the chosen profit level indicator. Finally, in the US, the IRS sometimes challenges
routine returns depending on level of aggressiveness of the position from the US
perspective.
Useful life and terminal value 4.3.4
- EU Member States
Finite or Indefinite life
With respect to “useful life”, Member State respondents were requested to comment
on what basis they decide whether or not an intangible asset in the scope of analysis
has a finite or indefinite life.
Due to the nature of the question asked (being an open question), the extent and
scope of the answers differ greatly. In total, 16 Member States respondents
commented on the issue. Comments can be summarised as follows:
Four Member States respondents comment that deciding on whether or not an
intangible asset has a finite or indefinite life depends on whether or not the
situation at hand is the full business exit or a valuation of a certain intangible asset
– in the former case, the life is usually indefinite and in the latter case, the life is
usually finite.
Six Member States respondents comment that they are largely governed by
factual, functional and risk analysis including information on the type of intangible
asset at issue; perhaps, a related answer (provided an additional six times)

European Commission
Study on the Application of Economic Valuation Techniques for Determining Transfer Prices of Cross Border Transactions between Members of Multinational Enterprise
Groups in the EU
September 2016 – 127
consists of a reference to economic and legal circumstances (i.e. a rate of product
replacement, technological development, etc.).
One additional answer provided (by respondent in Portugal) refers to accounting
rules in respect of specific IP in the scope of the analysis as a possible reference
source for determining the useful life of the asset.
Finally, one respondent simply noted that the useful life in the analysis for transfer
pricing purposes would be different from an analysis for other purposes.
Next, the survey contained a more specific question about the kind of intangible assets
that most commonly have an indefinite life. The answers among the 19 respondents200
to this question vary greatly. Eight respondents (i.e. Austria, France, Germany,
Poland, Portugal, Romania, Spain, and the UK) commented that brands and
trademarks typically have indefinite lives. Three others (Denmark, France, Spain)
mentioned that an indefinite life could be also the case for certain technologies or
customer related intangibles. Five respondents (Denmark, Germany, Italy, the
Netherlands, Sweden) commented that indefinite life is typically applied with respect
to the full business exit / going concern valuations in their Member State. Finally,
three Member States respondents (Finland, Latvia and Lithuania) stated that there are
no precise rules and this decision depends on facts and circumstances. Another three
respondents (in Belgium, Hungary, Slovakia) mentioned that they generally avoid
using indefinite life for intangible assets valuations for transfer pricing purposes. In
addition (not depicted on the graph), one Member State respondent (Greece)
mentioned that for any asset it is common in their jurisdiction to use indefinite life.
Figure 53. For which types of intangibles is indefinite life applied – EU
Member States201
200 Besides six countries that do not have experience with valuations for TP purposes
(Bulgaria, Croatia, Cyprus, Ireland, Malta and Slovenia), Czech Republic, Estonia, and
Luxembourg did not provide any answer to the question. 201 Three countries provided more than one answer (two answers).
3
8
3
5
3
-
1
2
3
4
5
6
7
8
9

European Commission
Study on the Application of Economic Valuation Techniques for Determining Transfer Prices of Cross Border Transactions between Members of Multinational Enterprise
Groups in the EU
September 2016 – 128
Factors to determine finite useful life
Next, the survey asked respondents to indicate all important factors that determine
the number of years constituting the (finite) life. In this respect 19 responses were
accounted for.202 It is important to note that the respondents were offered the
following choices of the answer and they could choose more than one answer:
Technological change (i.e. the speed with which better new products are
developed),
Economic life (how long there are profits that are not washed out by the market),
Functional life (the period when the products are replaced with completely new
products)
Publications
Other (please indicate)
Figure 54. Factors determining useful life – EU Member States
As observed in the figure above,203 most respondents commented that all of the
factors such as technological change, economic life, and functional life are all very
important in considering the useful life.
In addition, four Member States respondents noted some additional ways that are
common to use:
Use of attrition rate analysis (constant rate attrition analysis or actuarial attrition
analysis) or churn rate (mentioned by respondents in Austria and Romania
respectively);
202 Besides five countries with no exposure to IP valuation for transfer pricing purposes
in their markets, Estonia, Luxembourg and Bulgaria did not provide an answer to this
question. In addition, Greece indicated that it is most common to use indefinite life. 203 Countries experts were requested to mark all factors that they thought would
apply.
14
17 18
9
4
-
2
4
6
8
10
12
14
16
18
20
Technologicalchanges
Economic life Functional life Publications Other
Freq
uen
cy

European Commission
Study on the Application of Economic Valuation Techniques for Determining Transfer Prices of Cross Border Transactions between Members of Multinational Enterprise
Groups in the EU
September 2016 – 129
Legal protection period in the case a pattern (mentioned by respondents in
Portugal and Romania),
Taxpayer providing studies on the useful life (Lithuania)
With respect to publications, only nine Member States respondents noted that their
common practice is to search for industry references to determine useful life. These
Member States respondents noted that they run google searches to find some
indications of life period for certain types of intangibles (Belgium, Poland), or use
some well-known experts – such as, for example, Valente, Quatri, and University
professors in Italy.
However, for this question, the UK expert commented that the industry average data
should not be used because OECD prohibits its use;204 however, it could be used as a
reasonability check. In this respect, see the discussion of the feedback of the Member
States below.
Considerations
The survey asked whether the respondents have any views on what can be done with
respect to this parameter (time horizon) for transfer pricing purposes (in terms of
databases, approach of tax administration, etc.). The following answers were
obtained:
Four Member States respondents commented that it would be good to have more
guidance or even some sort of common approach in terms of how to approach this
parameter for different types of intangibles (i.e. some possible standardisation of
the parameter)
Four Member States respondents commented that a database or data source with
the average information on the useful life for several type of intangibles or of R&D
activity or some sort of relevant market data would be desirable.
Five Member States respondents however, deliver a warning that determining the life
depends on understanding the facts and circumstances of the valuation and any
attempt to standardise the approach is dangerous (Finland, France, Hungary, Sweden
and the UK). In this respect, the UK practitioner provided an example of valuation that
explains why industry type data would not help (if taken out of context). The example
concerns a purchase of a variety of patents by a taxpayer with a certain specific
purpose to have a defence in case of an infringement claim from a competitor (that is,
if a competitor claims an infringement, the taxpayer may find a patent among the
ones purchased as a defence or a counter infringement). The case also concerns the
electronics industry which is characterised by a high number of patented technologies.
Besides a potential defence, the taxpayer was not planning to actively use the patents
and did not fully know what type of technologies they covered. In the case, there was
no point to determine economic life of patents or run industry analysis. The useful life
of IP in this case is equal to the legal life, because the purpose of the intangibles
transfer was to use them only as a defence from lawsuit.
204 Reference is made to OECD TPG, para. 1.40.

European Commission
Study on the Application of Economic Valuation Techniques for Determining Transfer Prices of Cross Border Transactions between Members of Multinational Enterprise
Groups in the EU
September 2016 – 130
- EU Main trade partners
Finite or indefinite life
The open question regarding the approach to determine whether or not the useful life
is finite, received generally similar responses from the respondents of the nine main
trade partners as those received from the respondents from the Member States. With
regards to determining the useful life, the main findings are as follows:
Eight respondents comment that they generally investigate the nature and type of
the IP in question and its economic and technological characteristics.
Again, one respondent questions whether or not the issue is the full business exit
or a useful life of a certain intangible asset. However, in this case the conclusion is
the opposite to the comment of a member state giving similar answer – that is, in
the case of a full business exit the useful life applied in the valuation will be finite.
This comes from Canadian experts.
One respondent refers to the accounting rules with respect to specific IP in the
scope of analysis as a possible source of a reference (Australia).
Korean respondent answers that in general the expectation is of a finite life – i.e.
that the value of IP does not last forever.
With respect the types of IP for which typically an indefinite life is used, many answers
mirror the observations of the Member States respondents:
Figure 55. For which types of intangibles is indefinite life applied – Trade
partners
Three of the nine trade partner respondents (China, Japan and Korea) indicate that
they generally avoid using indefinite useful life, three (Australia, Norway and
Switzerland) indicate that it may be a case for trademark or brands. Another two
respondents (the US and Canada) state that indefinite life could be applied for other
types of IP such as software platform (in the case of the Member States, the other IP
that could be of indefinite life was non-patented technology or customer-related IP).
One respondent (India) notes that there are no common approaches or rules
regarding determination of the useful life.
3 3
2
1
-
1
1
2
2
3
3
4
Generally avoid indefinte life Trademarks / brands Other (platform software) No rules/ depends on facts

European Commission
Study on the Application of Economic Valuation Techniques for Determining Transfer Prices of Cross Border Transactions between Members of Multinational Enterprise
Groups in the EU
September 2016 – 131
Factors to determine finite useful life
All nine trade partner respondents commented on the factors important for
determining useful finite life.
Figure 56. Factors determining useful life – Trade partners
Similar to the EU Member States, the nine responding trade partners practicioners
indicate that technological changes, economic and functional lives are important
factors for considerations. Three of the nine respondents (Australia, India and the US)
indicate that they have had experience using publications indicating the useful life. In
this respect, the US practitioner in particular comments on the references found in
economic literature (academic articles found with the help of Econlit database).
Four of the countries also identify the following factors as being important:
Terms of useful life for tax depreciation purposes that could sometimes be
considered (Australia);
Past studies that may have determined useful life for similar IP (India);
Taxpayer’s studies about useful life (Norway);
Terms of contract that may indicate remaining useful life (Switzerland).
Considerations
The main trade partner respondents volunteered the following suggestions in respect
of determination useful life:
Additional rules or guidance with respect to each category of intangibles
(respondent in Norway). However the same respondent notes that this might be
difficult in practice since lifetime is very case-by-case dependent. Case-by-case
consideration is also noted by Japanese respondent. The same factor is stressed
for its importance by the US.
Determination of useful life should be based on the commercial rationale/ business
(Canada and Australia).
9 9 9
3
4
-
1
2
3
4
5
6
7
8
9
10
Technological changes Economic life Functional life Publications indicatinguseful life in this
industry
Other
Freq
uen
cy

European Commission
Study on the Application of Economic Valuation Techniques for Determining Transfer Prices of Cross Border Transactions between Members of Multinational Enterprise
Groups in the EU
September 2016 – 132
Taxpayer’s advice and knowledge should be of ultimate priority since the taxpayer
knows their IP the best (China).
There could be a potential benefit from having a database regarding the useful life
(Switzerland).
- Decay schedule applied to a measure of profits
Next, respondents were asked whether there is a practice in their country to apply
some kind of decay schedule (perhaps in the form of a depreciation schedule) when
obtaining a residual profit under a residual profit method. That is, not a full residual
profit in the future years will be accounted for in determining the full value of IP but,
perhaps, only part of it, as one considers future years further away from valuation
date.
EU Member States
There were 16 responses to this question. Out of 16 answers, 13 respondents
confirmed that they were aware of cases where decay rates were used in the
application of residual profit.
Figure 57. Use of decay schedule – EU Member States
Regarding the use of depreciation, Member State respondents were asked to explain
for what purpose this is performed:
1) To account that intangibles do not hold their full value in terms of generating
economic returns over time;
2) To determine the appropriate value of initial IP in the cases when the
development of the intangibles has been continued by another party (purpose 2);
3) Other reasons.

European Commission
Study on the Application of Economic Valuation Techniques for Determining Transfer Prices of Cross Border Transactions between Members of Multinational Enterprise
Groups in the EU
September 2016 – 133
Figure 58. Reason for decay schedule – EU Member States
As illustrated in the figure above (Figure 58), 10 respondents205 (out of 15) used the
decay schedule to account for the fact that intangibles do not hold their full value into
the future, and seven206 used it to determine the proportion of residual profit
attributable to intangibles generated up to and before the date of valuation. 207
EU Trade partners
All main trade partner respondents apply decay schedules, except for the ones in
Australia and India, who do not use it.
For the seven trade partner respondents that make use of depreciation, five
respondents208 do so because the intangibles do not hold their full value. Six209
respondents further state that depreciation is done to divide the residual profit
between new and old owners of IP. Four of the seven respondents cited both reasons.
205 Belgium, France, Germany, Greece, Italy, the Netherlands, Poland, Slovakia, Spain
and the UK. 206 Belgium, Czech Republic, Greece, Germany, Italy, Poland, Spain. 207 Six countries out of 15 marked both answers. 208 Canada, China, Japan, Korea, Switzerland. 209 Canada, China, Japan, Norway, Switzerland, and the US.
10
7
-
2
4
6
8
10
12
Intangibles do not hold their full value Determine portion of residual profit due to the formerowner of IP in comparison with the new owner
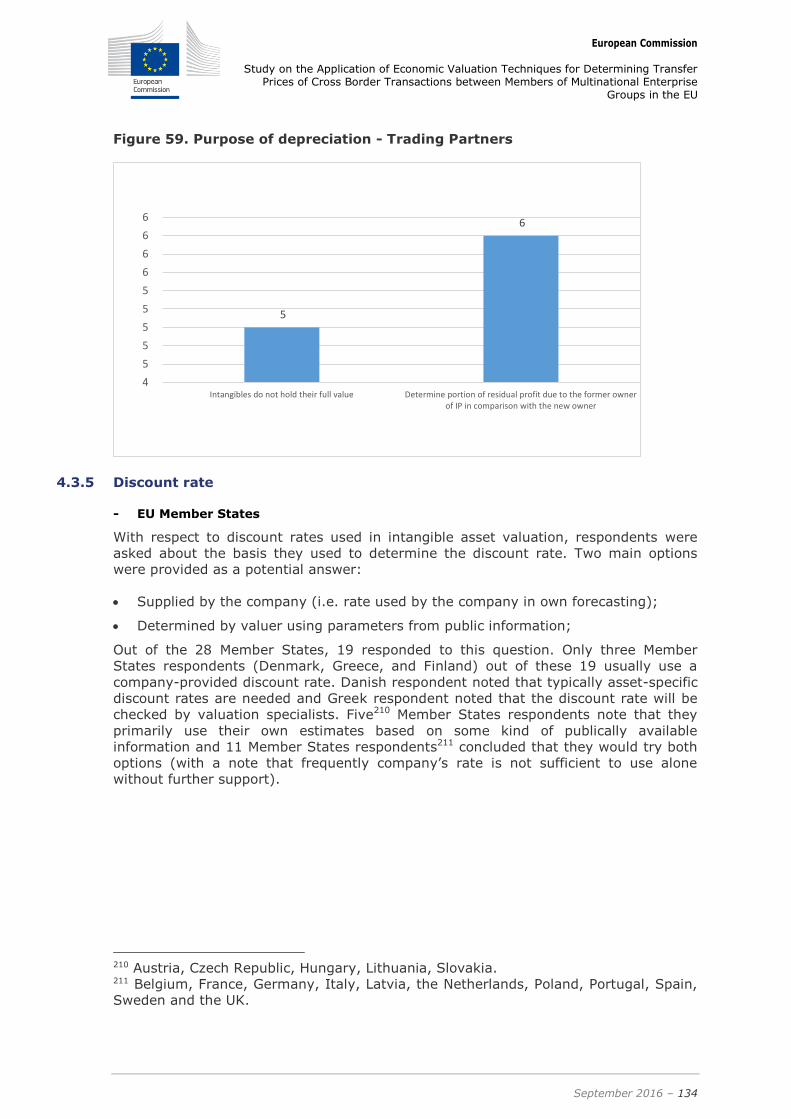
European Commission
Study on the Application of Economic Valuation Techniques for Determining Transfer Prices of Cross Border Transactions between Members of Multinational Enterprise
Groups in the EU
September 2016 – 134
Figure 59. Purpose of depreciation - Trading Partners
Discount rate 4.3.5
- EU Member States
With respect to discount rates used in intangible asset valuation, respondents were
asked about the basis they used to determine the discount rate. Two main options
were provided as a potential answer:
Supplied by the company (i.e. rate used by the company in own forecasting);
Determined by valuer using parameters from public information;
Out of the 28 Member States, 19 responded to this question. Only three Member
States respondents (Denmark, Greece, and Finland) out of these 19 usually use a
company-provided discount rate. Danish respondent noted that typically asset-specific
discount rates are needed and Greek respondent noted that the discount rate will be
checked by valuation specialists. Five210 Member States respondents note that they
primarily use their own estimates based on some kind of publically available
information and 11 Member States respondents211 concluded that they would try both
options (with a note that frequently company’s rate is not sufficient to use alone
without further support).
210 Austria, Czech Republic, Hungary, Lithuania, Slovakia. 211 Belgium, France, Germany, Italy, Latvia, the Netherlands, Poland, Portugal, Spain,
Sweden and the UK.
5
6
4
5
5
5
5
5
6
6
6
6
Intangibles do not hold their full value Determine portion of residual profit due to the former ownerof IP in comparison with the new owner

European Commission
Study on the Application of Economic Valuation Techniques for Determining Transfer Prices of Cross Border Transactions between Members of Multinational Enterprise
Groups in the EU
September 2016 – 135
Figure 60. Source of discount rate – EU Member States
In addition, in the case where the discount rate provided by the taxpayer was used,
the survey inquired as to the frequency this rate would be challenged by a specialist
responsible for the valuation. As shown in the Figure below, out of 17 respondents
who answered this question, seven212 responded that they will do so often or very
often and eight213 responded “sometimes.” Other respondents did not answer the
question either because they have no experience with valuations for transfer pricing
purposes or because they do not use the discount rates provided by the taxpayers in
the valuations for transfer pricing purposes.
Figure 61. Frequency of challenging the taxpayer-sourced discount rates by
valuers – EU Member States
212 Finland, France, Hungary, Latvia, Poland, Portugal, and the UK. 213 Belgium, Denmark, Germany, Greece, Italy, the Netherlands, Spain and Sweden.
3
5
11
-
2
4
6
8
10
12
Provided by company Estimate by Deloitte Both
8
7
-
1
2
3
4
5
6
7
8
9
Sometimes Often

European Commission
Study on the Application of Economic Valuation Techniques for Determining Transfer Prices of Cross Border Transactions between Members of Multinational Enterprise
Groups in the EU
September 2016 – 136
Respondents were also asked about the frequency of potential challenges posed by the
tax authorities. It is however important to note that countries answered this question
in the view of a potential challenge of any discount rate by the tax authorities (not just
with respect to the discount rate provided by the taxpayer). Out 17 Member States
respondents to this question, six reported that the challenge is infrequent, with seven
reporting “sometimes” and four “often” or “very often.” The Member States
respondents that indicated to never or rarely have had a challenge in this respect are
from Belgium, Latvia, Lithuania, Luxemburg, Portugal and the UK.
Figure 62. Frequency of challenging discount rates (by tax administration) –
EU Member States
To go deeper into estimating the discounts rates using public information, respondents
were asked how often publicly available full discount rates are used (e.g. industry-
wide estimated rates), rather than discount rate computed using corporate finance
theory. From a total of 17 answers, ten Member States respondents214 stated that an
industry-wide rate would never or very rarely be used. Six Member States
respondents confirmed that it can be the case sometimes (Belgium, France, Italy,
Netherlands, Portugal and Sweden) and one Member States respondent (Poland)
acknowledged this being done regularly.
214 Austria, Czech Republic, Finland, Germany, Hungary, Latvia, Romania, Slovakia,
Spain and the UK.
6
7
4
-
1
2
3
4
5
6
7
8
Never/ Rarely Sometimes Often / Very often

European Commission
Study on the Application of Economic Valuation Techniques for Determining Transfer Prices of Cross Border Transactions between Members of Multinational Enterprise
Groups in the EU
September 2016 – 137
Figure 63. Frequency of using industry-wide rates as discount rate in
valuation – EU Member States
Among seven Member States respondents that reported usage of industry-wide rates,
Damodaran was quoted as being used most often. In addition, Bloomberg, Capital IQ
and Thomson Reuters were also mentioned as sources of data.
Respondents indicating that they may estimate the discount rate themselves (i.e.
related to the question in the beginning of this section (whether or not the rate is
estimated by specialist or obtained from the taxpayer), were further asked to confirm
whether or not they would use a financial formula from corporate finance to evaluate
the discount rate, such as weighted average cost of capital (“WACC”) or weighted
average return on assets (“WARA”). All respondents confirmed that they use these
formulas for their estimate of the rate.
Input of the respondents from Member States with regards to the WACC formula are
provided in Appendix 5 – Discount rate inputs. Due to the technicalities of this
question, this information is absent from the main report.
The survey also inquired whether or not the respondents apply different discount rates
for different types of IP valued (for the same company). Out of 20 respondents
providing an answer to this a question, 12 indicated that they would use different
rates.
10
6
1
-
2
4
6
8
10
12
Never/ Rarely Sometimes Often / Very often

European Commission
Study on the Application of Economic Valuation Techniques for Determining Transfer Prices of Cross Border Transactions between Members of Multinational Enterprise
Groups in the EU
September 2016 – 138
Figure 64. Use of different discount rates depending on type of IP – EU
Member States
When asked to explain on what basis the discount rates vary for different types of IP,
most of the respondents using such a differentiation explained that it will be based on
the risk – i.e. a certain intangible could be riskier than another intangible of the same
business.
- EU Main Trade partners
In terms of the source for discount rate, a picture similar to the Member States
respondents is observed among the main trade partners. Four out of nine trade
partner respondents (Australia, Japan, Norway and Switzerland) use both sources.
Only two respondents (China and Korea) typically stop at the discount rate obtained
from the taxpayer. Three respondents (Canada, India and the US) report that they
normally estimate the rate based on publicly available information. In this respect, the
US respondent mentioned that although the discount provided by a taxpayer may be a
starting point, it would never be used without its own estimate.
Figure 65. Source of discount rate – Trade partners
12
8
-
2
4
6
8
10
12
14
Yes No
2
3
4
-
1
1
2
2
3
3
4
4
5
Provided by company Estimate by Deloitte Both

European Commission
Study on the Application of Economic Valuation Techniques for Determining Transfer Prices of Cross Border Transactions between Members of Multinational Enterprise
Groups in the EU
September 2016 – 139
The frequency of challenging the rate provided by the client (if used by Deloitte expert
for valuation purpose) is different among the countries. Two respondents state that
they never challenge such a rate (Japan and Korea). Two respondents challenge it
sometimes (Austria and China) and two respondents (Norway and Switzerland) do it
often.
Figure 66. Frequency of challenging the taxpayer-sourced discount rates (by
Deloitte) – Trade partners
Two respondents stated that they rarely get face a challenge from tax administration
regarding the discount rates provided by the clients (Australia and Korea). Three
respondents sometimes get such a challenge (Japan, China and Switzerland) and two
respondents frequently face a challenge (Norway and Canada). Respondents in India
and the US did not answer the question since they never use internal discount rates
provided by the client.
2 2 2
-
1
1
2
2
3
Never/ rarely Sometimes Often

European Commission
Study on the Application of Economic Valuation Techniques for Determining Transfer Prices of Cross Border Transactions between Members of Multinational Enterprise
Groups in the EU
September 2016 – 140
Figure 67. Frequency of challenging discount rates (by tax administration) –
Trade partners
In terms of the rates that are estimated by experts, they are infrequently based on
the industry-wide benchmarks. Five respondents (Canada, India, Japan, Korea and the
US) note that they would never use such a rate but two out of them note that they
may consider such rates for supporting reference (Canada and India). Two
respondents may use it sometimes (China and Switzerland) and one respondent may
use it often (Norway).
Figure 68. Frequency of using industry-wide rates as discount rates in
valuation – Trade partners
2
3
2
-
1
1
2
2
3
3
4
Never/ Rarely Sometimes Often/ Very often
5
2
1
-
1
2
3
4
5
6
Never/ Rarely * Sometimes Often/ Very often

European Commission
Study on the Application of Economic Valuation Techniques for Determining Transfer Prices of Cross Border Transactions between Members of Multinational Enterprise
Groups in the EU
September 2016 – 141
In terms of databases for industry-wide rates, Thomson Reuters, Bloomberg, Duff &
Phelps are used (Switzerland). Norwegian practitioners may use a standard rate (a
rate in the range of 8% – 10%) or rates obtained from Bloomberg.
If respondents answered that they may estimate the rate themselves rather than
using the rate provided by the taxpayer, they were asked to comment if they use
financial formula such as WACC or WARA to evaluate the rate. Six of the trade partner
respondents confirm that they do. Chinese specialists note that they never do so, and
respondent in Norway has explained that they do not evaluate the discount rates (but
rather uses industry-wide rates or client-provided rates). In cases when it is needed,
the study is passed to the valuation team. Australian respondents did not provide the
answer to this question as they explained they most often use the rates provided by
the taxpayer by default.
The inputs to the financial estimation of a discount rate is similarly provided in
Appendix 5 – Discount rate inputs.
Similarly to the findings regarding the Member States respondents, most of the
countries do apply different rates with respect to different intangibles. Three
respondents noted that it is typically not the case (China, Korea and Norway)215.
Figure 69. Use of different discount rates depending on type of IP – Trade
partners
In terms of explanations for the use of different rates, most respondents using the
rate reported that different intangible assets are exposed to different risks. This must
be accounted for in the selected discount rate. The US expert further explains that
systemic risk needs to be properly measured and included in the discount rate.
Sources of information, challenges and potential solutions for objectivisation 4.3.6
Appendix 6 – Parameters internal sources provides information on the potential
sources of information located at the individual company level, identifies the main
215 i.e. China noted that this may be done but it is rare.
6
3
-
1
2
3
4
5
6
7
Yes No

European Commission
Study on the Application of Economic Valuation Techniques for Determining Transfer Prices of Cross Border Transactions between Members of Multinational Enterprise
Groups in the EU
September 2016 – 142
challenges encountered in the practical application of the parameters and provides
potential solutions for how these challenges could be addressed.
Appendix 7 – Parameters external sources provides information on the potential public
sources of information (e.g. databases) and identifies possibilities to objectivise the
underlying assumptions of each of the building blocks.
With regards to discount rate inputs, similar information is provided in Appendix 5 –
Discount rate inputs.

European Commission
Study on the Application of Economic Valuation Techniques for Determining Transfer Prices of Cross Border Transactions between Members of Multinational Enterprise
Groups in the EU
September 2016 – 143
5. Legislative measures
5.1 Introduction
It has been observed that most of the countries surveyed, except for Brazil, do have
the arm’s length principle specifically mentioned in their domestic law. However, only
one country’s regulations, i.e. the US, actually lay down detailed rules on the
application of valuation methods to intangibles for transfer pricing purposes. The other
countries’ laws may contain corporate finance valuation guidelines, but not specific to
transfer pricing purposes. Similarly, the transfer pricing regulations in the nine trade
partners do not explicitly concern valuation of intangible assets (besides the reference
and acceptance of the OECD guidelines). Same, for exception of Germany, can be said
about 28 Member States.
The overview of the transfer pricing rules for other trade partners and for EU Member
States can be found in Appendix 9 – Overview of transfer pricing legislation.
In the following sections, the main characteristics of the US regulations on valuation
methods for transfer pricing are presented. The German regulations on the same
matter are also presented.
5.2 US Transfer Pricing rules and regulations
General methods for valuation of intangibles 5.2.1
The methods prescribed under the US Transfer Pricing Regulations for testing
intercompany transfers of intangible property are similar to those prescribed by the
OECD Transfer Pricing Guidelines, which are summarized in the figure below.216
Figure 70. Applicable Methods for Testing Intercompany Transfers of
Intangible Property
Methods Applicable Under the US Transfer Pricing Regulations
Methods Applicable Under the OECD Transfer Pricing Guidelines
1. Comparable uncontrolled transaction (“CUT”) method
217
2. CUP method
3. Profit split method218
4. Profit split method
5. CPM219
6. TNMM
The US Transfer Pricing Regulations also allow for the use of unspecified methods,
provided certain conditions are met. Below each method is described.
216 The OECD TPG do not distinguish between the methods for tangible and intangible
property. The RPM and the cost plus method under the OECD TPG are generally not
applicable to a license of intangible property. Therefore, only the methods under the
OECD TPG that are analogous to the methods applicable to intangible property under
the US Transfer Pricing Regulations were considered. 217 US Treas. Reg. §1.482-4(c). 218 US Treas. Reg. §1.482-6. 219 US Treas. Reg. §1.482-5.
European Commission
Study on the Application of Economic Valuation Techniques for Determining Transfer Prices of Cross Border Transactions between Members of Multinational Enterprise
Groups in the EU
September 2016 – 144
- CUT Method
The application of the CUT method to transfers of intangible property is essentially the
same as the application of the CUP method to the transfer of tangible property. The
US Transfer Pricing Regulations state that the results derived from applying the CUT
method generally will be the most direct and reliable measure of an arm’s length price
for the controlled transaction if uncontrolled transactions exist that have no
differences from the controlled transaction that would materially affect the price. Such
uncontrolled transactions might be observed between a controlled seller and an
uncontrolled buyer (internal CUT), between an uncontrolled seller and a controlled
buyer (internal CUT), or between an uncontrolled seller and an uncontrolled buyer
(external CUT). The use of this method is dependent upon the controlled transaction
being similar to the uncontrolled transaction with respect to a number of factors,
including similarity in products or intangibles, contractual terms, level of the market,
and geographic market. The principles for selection of this method under the OECD
Transfer Pricing Guidelines are similar.
- Profit Split Method
The profit split methods specified in the US Transfer Pricing Regulations and the OECD
Transfer Pricing Guidelines allocate operating profits or losses from controlled
transactions in proportion to the relative contributions made by each party in creating
the combined profits or losses. Relative contributions may be determined by functions
performed, risks assumed, resources employed, and costs incurred.
The US Transfer Pricing Regulations specifically include the following two specified
profit split methods:
Comparable Profit Split Method – Transfer prices are based on the division of
combined operating profit between uncontrolled taxpayers whose transactions and
activities are similar to those of the controlled taxpayers in the relevant business
activity. Under this method, the uncontrolled parties’ percentage shares of the
combined operating profit or loss is used to allocate the combined operating profit
or loss of the relevant business activity between the related parties.
Residual Profit Split Method – This method involves two steps. First, operating
income is allocated to each party in the controlled transactions to provide a market
return for their routine contributions to the relevant business activity. Second, any
residual profit is divided among the controlled taxpayers based on the relative
value of their contributions of any valuable intangible property to the relevant
business activity. This method is best suited for analyzing the transfer of highly
profitable intangibles.
- CPM
The CPM specified in the US Transfer Pricing Regulations and the TNMM specified in
the OECD Transfer Pricing Guidelines both evaluate whether the amount charged in a
controlled transaction is arm’s length by comparing the profitability of one of the
parties involved in the controlled transaction (the “tested party”) to that of companies
that are similar to the tested party. In most cases, the tested party is chosen to be the
simpler of the two parties involved in the controlled transactions. In particular, the
tested party should not use intangible property or unique assets that distinguish it
from unrelated comparable companies.
The degree of comparability between the tested party and the comparable companies
affects the reliability of the CPM/TNMM analysis. Reliability may be adversely affected
by varying cost structures, differences in business experience, or differences in

European Commission
Study on the Application of Economic Valuation Techniques for Determining Transfer Prices of Cross Border Transactions between Members of Multinational Enterprise
Groups in the EU
September 2016 – 145
management efficiency. However, less functional comparability is required for reliable
results than under the transactional methods (e.g., the CUP method, the RPM, or the
cost plus method). In addition, less product similarity is required for reliable results
than under the transactional methods. Adjustments that may be required include
those for differences in accounting classifications, credit terms, inventory, currency
risk, and business circumstances.
Based on the example cited in the US regulations, evaluating the intangibles by
building a projection of overall profitability and deducting a routine return falls under
the principles of the CPM method.
Methods for Valuation of Platform Contribution Transactions 5.2.2
Final cost-sharing regulations (Final Regulations) were issued on 16 December 2011,
providing guidance on the treatment of cost-sharing arrangements (“CSAs”). IRS and
Treasury Department also issued proposed regulations (2011 Proposed Regulations),
which propose to include a new specified application of the income method based on
the use of the ‘differential income stream’ as temporary regulations. The later were
finalized without change in the 2013 Final Cost Sharing Regulations.
Cost-sharing buy-ins that are also referred to as Platform Contribution Transactions
(“PCTs”) can be valued under the US Regulations based on five specified methods, and
the specified method, chosen under the best method rule. However, the section on
PCT only applies when the arrangement satisfies the definition of CSA, i.e., if the
participant’s “costs of developing the intangible significantly exceeds its share of
reasonably anticipated benefits,” the arrangement would not be in substance a CSA.
In order to be a CSA, the arrangement has to meet substantive and administrative
requirements described in U.S. Treas. Reg. § 1.482-7(b) and § 1.482-7(k).
The methods used to evaluate the amount charged for a PCT are:
The comparable uncontrolled transaction (“CUT”) method;220
The income method;221
The acquisition price method (“APM”);222
The market capitalization method (“MCM”);223
The residual profit split method (“RPSM”);224 and
Unspecified methods.225
Each method must be applied in accordance with the best method rule and the general
requirements in Treas. Reg. § 1.482-1, except as modified by Treas. Reg. § 1.482-7.
An unspecified method could be applied if such method provides a more reliable
measure of the PCT than the specified methods. However, in order to use an
unspecified method, a taxpayer must maintain documentation to describe and explain
the method selected to determine the arm’s length payment due in a PCT.
220 US Treas. Reg. § 1.482-7(g)(3). 221 US Treas. Reg. § 1.482-7(g)(4). 222 US Treas. Reg. § 1.482-7(g)(5). 223 US Treas. Reg. § 1.482-7(g)(6). 224 US Treas. Reg. § 1.482-7(g)(7). 225 US Treas. Reg. § 1.482-7(g)(8).

European Commission
Study on the Application of Economic Valuation Techniques for Determining Transfer Prices of Cross Border Transactions between Members of Multinational Enterprise
Groups in the EU
September 2016 – 146
- CUT Method
The CUT method may be applied to evaluate whether the amount charged in a PCT is
arm’s length by reference to the amount charged in a comparable uncontrolled
transaction. The requirements of the CUT method stay the same as for a transfer of
intangibles that is not in the framework of CSA.
- Income Method
The income method evaluates whether the amount charged in a PCT is arm’s length
by reference to a controlled participant’s best alternative to entering into a CSA.
Under this method, the arm’s length charge for a PCT payment will be an amount such
that a controlled participant’s present value, as of the date of the PCT, of its cost
sharing alternative of entering into a CSA equals the present value of its “best realistic
alternative.” According to the regulations, the best realistic alternative of the PCT
Payor (i.e., the buyer) to entering into the CSA would be to license the intangibles
instead of entering a CSA. In this alternative, the intangibles are developed by an
uncontrolled licensor that undertakes the commitment to bear the entire risk of
intangible development (that would otherwise have been shared under the CSA).
The present value of the PCT Payor’s licensing alternative may be determined using
the CUT method as described above or using the CPM as described above. The CUT
method is applied to determine what the license payments would be under the
licensing alternative by reference to the amount charged in a comparable uncontrolled
transaction. The CPM evaluates the amount charged in a controlled transaction based
on objective measures of profitability derived from uncontrolled taxpayers that engage
in similar business activities under similar circumstances.
In general, the Income method using CUT is broadly similar to the Relief from Royalty
method reviewed in the present study226 and the Income method using CPM – to the
residual value method.
- Acquisition Price Method
The acquisition price method determines the value of a contributed intangible by
reference to the acquisition price of a contemporaneous acquisition of that intangible
in an asset or stock acquisition from an uncontrolled party.
The acquisition price method is ordinarily used where substantially all of the
acquisition target’s non-routine contributions made to the PCT payee’s business
activities are covered by a PCT or group of PCTs. That is, if the acquired company’s
activities exceed the scope of the PCT / buy-in payment that is being determined, its
acquisition price does not only cover the buy-in payment but also other assets (and
thus other methods may be more reliable if the carve-outs for such other assets
cannot be precisely quantified).
Under this method, the arm’s length charge for a PCT is equal to the adjusted
acquisition price, as divided among the controlled participants according to their
226 The use of CUT method for the purposes of income method application under the
US regulations is arguably a more specific approach than the use of CUP under the
defined “relief from royalty method.” For instance, the US regulations require a more
careful considerations of the rights granted in the comparable (license transactions) –
under the US rules, these need to be “make-or-sell” rights to a resource or capabilities
combined with the right to further develop such item (US regulations, 1.482-7(c)(4).

European Commission
Study on the Application of Economic Valuation Techniques for Determining Transfer Prices of Cross Border Transactions between Members of Multinational Enterprise
Groups in the EU
September 2016 – 147
respective reasonable anticipated benefit (“RAB”) shares. The adjusted acquisition
price is the acquisition price of the target increased by the value of the target’s
liabilities and decreased by the value of the target’s assets on the date of the
acquisition.
In order to apply the method, the CSA should follow an acquisition of a third-party
company to obtain its price.
- Market Capitalization Method
The market capitalization method evaluates whether the amount charged in a PCT is
arm’s length by reference to the average market capitalization of a controlled
participant (i.e., the PCT payee) whose stock is regularly traded on an established
securities market. Under the market capitalization method, the arm’s length charge for
a PCT is equal to the adjusted average market capitalization, as divided among the
controlled participants according to their respective RAB shares. The adjusted average
market capitalization is the average market capitalization of the PCT Payee (i.e., the
seller) increased by the value of the PCT Payee’s liabilities on the date of the PCT and
decreased by the value on such date of the PCT Payee’s tangible property and any
other resources, capabilities, or rights of the PCT Payee not covered by the PCT.
In turn, the average market capitalization is the average of the daily market
capitalizations of the PCT Payee over a period of time beginning 60 days before the
date of the PCT and ending on the date of the PCT. The daily market capitalization of
the PCT Payee is calculated on each day as the total number of shares outstanding
multiplied by the adjusted closing price of the stock on that day. The adjusted closing
price is the daily closing price of the stock, after adjustments for stock-based
transactions (e.g., dividends and stock splits) and other pending corporate (e.g.,
combination and spin-off) restructuring transactions for which reliable adjustments
can be made.
Application of the method thus requires that the participant of CSA is a publicly traded
company. In addition, similarly to the acquisition price method above, it is used when
substantially all of the PCT payee’s non routine contributions to the PCT Payee’s
business are covered by a PCT. That is, if the PCT Payee had another business or
assets that would not be cost shared (and thus, for which no payment is due), the full
market capitalization value will include also a value of this business / assets and thus
should be adjusted for these “significant non routine contributions.”
- RPSM
The RPSM evaluates whether the allocation of combined operating profit or loss
attributable to one or more platform contributions subject to a PCT is arm’s length by
reference to the relative value of each controlled participant’s contribution to that
combined operating profit or loss. Under the RPSM, the present value of each
controlled participant’s residual divisional profit or loss attributable to non-routine
contributions is allocated between the controlled participants that each furnish
significant non-routine contributions to the relevant business activity in that division.
The RPSM may not be used where only one controlled participant makes significant
non-routine contributions (including platform or operating contributions) to the CSA
activity and is only used in cases where more than one party makes significant non-
routine platform contributions.
The RPSM specified in the 2011 Final Cost Sharing Regulations at U.S. Treas. Reg. §
1.482-7(g)(7) is a modified version of the RPSM of Section 1.482-6. The former

European Commission
Study on the Application of Economic Valuation Techniques for Determining Transfer Prices of Cross Border Transactions between Members of Multinational Enterprise
Groups in the EU
September 2016 – 148
(RPSM in section 7) is actually more of a two-pronged income method (meaning that it
involves two-sided projections and includes a selection of the result obtained by
calculating the PCT payment based on both projections). The former RPSM in U.S.
Treas. Reg. § 1.482-6 is de-specified for purposes of calculating PCT Payments under
the 2011 Final Cost Sharing Regulations (that is, the method in section § 1.482-6 is
no longer supposed to be used for determining the value of PCT payments since the
date Temporary Regulations were issued on January 5, 2009) Guidance on selected
topics
Best method rule
The choice of the most appropriate methodology must be subject to the “best method
rule”, a condition that the arm’s length result should be determined under the method
that, given facts and circumstances, provides the most reliable measure of an arm’s
length result, based on two primary factors, namely the degree of comparability
between the controlled transaction (or taxpayer) and any uncontrolled comparables,
and the data and assumptions used in the analysis.227
Periodic adjustments
The US regulations note that in cases when an intangible is transferred for a lump
sum, the amount has to be “commensurate” with the income attributable to the
intangible (the “CWI principle”). In this respect, a payment is “commensurate with
income in a taxable year if the equivalent royalty amount for that taxable year is equal
to the arm’s length royalty.”228 Determining equivalent royalty requires “a present
value calculations based on a lump sum, an appropriate discount rate and the
projected sales over the relevant period.” However, the CWI principle is subject to
many exceptions (e.g., CWI adjustment may not be made where the income in
question was not reasonably anticipated and the events leading to such unanticipated
income were beyond the control of the controlled taxpayers in the transaction) and
threshold barriers (the income in questions has to pertain to 936(h)(3)(B)229
intangibles, and it cannot apply to income attributable to services) that will often limit
its usefulness to the IRS. Moreover, as a practical matter, the CWI principle has never
been used by the IRS to make an adjustment in the thirty years since it was added as
the second sentence to section 482 in the 1986 Tax Reform Act.
227 US Treas. Regs. Section 1.482-1(c). 228 US Treas Regs Section 1.482-4(f)(6). 229 US. Code §936 covers Puerto Rico and possession tax credit regulations. Its
subsection (h)(3)(B) contains a definition of intangible property which is arguably not
exhaustive.
European Commission
Study on the Application of Economic Valuation Techniques for Determining Transfer Prices of Cross Border Transactions between Members of Multinational Enterprise
Groups in the EU
September 2016 – 149
In terms of price adjustment approach, these are in principle allowed and described in
1.482-7(h), “Payment rules.” This section contains theoretical Examples 4, 5, 6, 7 that
demonstrate the use of the price adjustment clauses. However, the use of the price
adjustment clauses is only allowed under the following conditions: (i) there should be
a price/ payment determined for the price adjustment possibility itself and it should
have clearly specified trigger (i.e. deviation of a certain amount), (ii) mandatory for
both downwards and upwards adjustments, (iii) the process of adjustment needs to be
clearly specified (“occurrence or nonoccurrence” is “unambiguous and determinable”)
a priori, when formulating the price adjustment clause. All these conditions are in
practice may be very difficult to comply with and thus, possibly as a result of these
difficulties, the price adjustments are not often use in the US transfer pricing practice
(as validated by our survey).
Discount rate
The discount rate “should be used that most reliably reflect the market-correlated
risks of activities or transactions and should be applied to the best estimates of the
relevant projected results, based on all the information potentially available at the
time for which the present value calculation is to be performed.”230 Therefore, the US
regulations provide that discount rates can be checked against market evidence of
discount rates as a way of evaluating the reliability of the income method.
The US Regulations distinguish between realistic alternatives in the analysis of the
discount rate, as this involves different risk exposure. For instance, there is potentially
lower risk for licensees of intangibles, corresponding to lower discount rates,
compared to the additional risk assumed when entering a CSA. The discount rate may
vary also between the forms of payment, noting that a royalty computed on a profits
base would be more volatile (hence require higher discount rate) than a royalty
computed on a sales base.
For certain activities or transactions, implied discount rates may exist; however, the
facts and circumstances of each case must be analysed in detail and evidence must be
provided on the reliability of such implied rate. In cases where the implied discount
rate is unreliable, so will be the results of the income method using such rate. The
2013 Final Cost Sharing Regulations add examples and discussion pertaining to the
“implied discount rate” approach to applying the income method.
Financial projections
The financial projections should estimate best the items projected and the approach
for the calculation should be decided based on which provides the best result taking
into account the facts and circumstances in light of the completeness and accuracy of
the underlying data, the reliability of assumptions and sensitivity of results. In that
sense, projections prepared for non-tax purposes are more reliable than projections
prepared for tax purposes. Financial projections must be a probability-weighted
average of all different scenarios for future income projections.
Accounting principles
Similar to the OECD Guidelines, the US Regulations acknowledge that valuations of
intangibles for other purposes may provide a starting point for valuations in a transfer
230 US Treas. Regs. § 1.482-7(g)(2).

European Commission
Study on the Application of Economic Valuation Techniques for Determining Transfer Prices of Cross Border Transactions between Members of Multinational Enterprise
Groups in the EU
September 2016 – 150
pricing context, but they should not be conclusive in determining the arm’s length
range for a transaction.
Two sided approach
The US regulations do not explicitly address the issue of the two-sided approach
besides in the instances where the residual profit split method (by definition, a two-
sided method) is discussed.
In general, it appears that the perspective taken is from the side of “PCT Payor” (i.e.
the party entering a cost sharing arrangement, acquiring the rights to intangibles and
thus making a payment for such arrangement). For instance, the income method
discussion talks about the “best realistic alternative” of PCT Payor. The payment
acceptable from perspective PCT Payee is not discussed in this content.
In the instances where the PCT Payee perspective is taken, the methodology applied
becomes “unspecified.”
5.3 German domestic law
A main source for transfer pricing guidance in Germany is contained in the Foreign Tax
Act or Auβensteuergesetz (AStG). Among principles on transfer pricing, Section 1(3)
of the Act introduces how the transfer pricing should be set in cases of business
restructuring such as a transfer of functions.
In addition to the Foreign Tax Act, the authorities in Germany can be authorised by
law to issue “decree law” or “ordinance” (Rechtsverordnungen) on specific matters
that have statutory character that are binding upon taxpayers and tax authorities.
With respect to Section 1(3) of the Act, the authorities issued an ordinance specifying
further details on the transfer pricing rules on cross-border transfer of functions
(Funktionsverlagerungsverordnung or “FVerlV”). This ordinance also covers the
principles of valuation to be used with the respect of “transfer of functions."
In addition, the German Ministry of Finance has issued the “Principles for the Audit of
the Allocation of Income between Related Persons in Cases of Cross-Border Transfers
of Business Functions (Administration Principles – Business Restructurings)”
(hereinafter, “Administrative Principles”). These principles are binding to the tax
authorities but not to the taxpayers or courts.
FVerlV and the Administrative Principles provide clarification and guidance on many
aspects of the valuation that relevant to the current study. Below, a summary
understanding of the most relevant topics addressed in the German regulations
including Administrative Principles is provided.
Overview 5.3.1
Based on the German law it may be required to evaluate “transfer package”. A
transfer package consists of:
a function and its associated opportunities and risks
the assets and advantages that the transferring enterprise transfers or concedes to
the receiving enterprise (together with the function and the services which are
performed in this regard).
Valuating a transfer package implies finding one price for a bundle of elements. There
are three “escape clauses” which allow for the use of individual (asset) prices for

European Commission
Study on the Application of Economic Valuation Techniques for Determining Transfer Prices of Cross Border Transactions between Members of Multinational Enterprise
Groups in the EU
September 2016 – 151
different elements rather than determining one price of the assets being transferred.
These clauses may be used:231
if the taxpayer shows credibly that no “material intangible assets and advantages”
were object of the business transfer; or
if the sum of the individual prices for the elements of the transfer package, as
measured by the valuation of the transfer package as a whole, complies with the
arm’s length principle; or
if the taxpayer shows credibly that at least one material intangible asset232 is
subject to the relocation of functions and he defines it accurately.
Two-sided approach 5.3.2
According to the AStG, depending on the availability of (at least) limited transactional
comparables, a hypothetical arm’s length test may be applied.
By the virtue of its construction, the hypothetical arm’s length test is a two-sided
approach. The taxpayer has to determine the minimum price of the supplier and the
maximum price of the recipient (range of potential agreement) as a result of a
functional analysis and internal financial planning. The range of potential agreement
will be determined by the profit expectations (profit potentials) of the supplier and the
recipient. The price, which complies with the arm´s length principle with the utmost
probability shall be used. If no other price is substantiated, the mean amount shall be
used.
Main Methodologies 5.3.3
The Administrative Principles which are binding upon the tax authorities but not on the
taxpayers distinguish two approaches:
Direct approach – the expected future benefits associated with a transfer package.
Indirect approach – the assessment of value of both the transferring and the
receiving enterprise takes place before and after the restructuring, based on
certain principles.
Further, the Administrative Principles note that “when performing the hypothetical
arm’s length comparison, in principle, an evaluation method (net present value
oriented method, e.g. following IDW Standard 1 or IDW Standard 5) has to be
applied”233 thus referring to “Principles for the valuation of the enterprises,” and “the
Principles for the valuation of Intangible Assets”, respectively.234
It is also stated: “whether or not a method of valuation should be applied that
corresponds to IDW Standard 1 or IDW Standard 5 […], or corresponds to another
economically accepted method and is to be accepted fiscally for the respective case,
231 Administrative principles, note 2.2.3.1 para. 71, note 2.2.3.2. para. 72 and note
2.2.3.3. para 74. 232 Exceeding in value 25% of the transfer package (Administrative principles, para.
75). 233 Administrative principles, note 2.3.2.1 para. 87. 234 IDW Standards contain requirements relevant to services provided by German
Public Auditors other than with respect to audit engagements and accounting matters.

European Commission
Study on the Application of Economic Valuation Techniques for Determining Transfer Prices of Cross Border Transactions between Members of Multinational Enterprise
Groups in the EU
September 2016 – 152
depends on the character and meaning of the business restructuring. If the
restructuring comprises mainly intangible assets, the application of an evaluation
method that corresponds to IDW Standard 5 suggests itself. If, on the other hand, a
business restructuring consists mainly of a relocation of an enterprise or a business
unit with its own viability, then an evaluation method corresponding to IDW Standard
1 is appropriate”235.
In turn, the IDW Standard 5 defines four methods for valuating intangibles under the
income approach:
(1) Direct cash flow projection method (assuming that one can identify cash flows
directly attributable to the intangible assets)
(2) Relief from royalty method
(3) Incremental cash flow method, and
(4) Multi-period excess earnings method.
The cost approach and market approach are also discussed in the IDW.
Building blocks 5.3.4
Financial data
The Administrative Principles note that in terms of the financial data, the documents
on which the enterprise bases its decision to restructure provide the ideal point for the
valuation. The rational being that “these documents supply the assumptions made and
in particular the information which revenues and expenses will cease to exist for the
transferring enterprise and which revenues and expenses will be generated by the
receiving enterprise due to the business restructuring”236.
For the determination of the net profit after tax, essentially only those “financial
surpluses after cost of debt and tax” are relevant for the valuation. These financial
surpluses are regularly derived from the prospectively planned annual results. The
underlying forecast can be calculated following commercial law, tax law or other
provisions (i.e. IFRS, US-GAAP), depending on the customary practice of the
respective enterprise. The annual result is to be adjusted by non-cash contributions. A
proper deduction of the value-relevant cash-flows demands coordinated projected
balance sheets, profit-and loss statements as well as financial planning for the
following years (No. 27 IDW S 1). If required, additional calculations to determine the
tax base can be necessary. Whether the financial surpluses can be distributed under
consideration of the corporate circumstances, however, is not important.237
Royalty
In general according to the German regulations, the valuation in the framework of
business restructuring implies a use of hypothetical arm’s length test. The hypothetical
arm’s length test implies a two-sided approach where the range of potential prices is
determined by the profit expectations. By its construction, the hypothetical arm’s
length test assumes that no (or at least limited) transactional comparables exist. As
235 Administrative Principles, note 2.3.2.1 para 87. 236 Administrative Principles note 2.3.2.1, para. 90. 237 Administrative Principles, note 2.1.4.1, para 31.

European Commission
Study on the Application of Economic Valuation Techniques for Determining Transfer Prices of Cross Border Transactions between Members of Multinational Enterprise
Groups in the EU
September 2016 – 153
such, the regulations for business restructuring do not make a direct link with the use
of market comparables such as royalties for the rights to use intangibles.
However, outside the business restructuring, German rules are in many ways
consistent with the OECD TPG – thus the guidance with respect to the CUP method is
relevant.
Routine return
The hypothetical arm’s length is based on evaluation of profit potential (of a transfer
package, i.e. a combination of function(s), assets and other elements). Evaluation of
the profit potential implies a comparison of “before” and “after”, e.g. profits before the
transfer using all elements of a transfer package, and profits after the transfer,
without the transfer package (when taking the view of the transferring entity). In the
latter case, depending on the transfer price approach applied after the business
transaction, the transferring enterprise could only earn routine returns, i.e. the cash
flows of “the fictitious comparable entity without the intangible assets.”238
In this respect, there is a disconnection with the Valuation standards IDW Standard 5
– the latter touch upon only “contributory asset charges” in the form of the reasonable
return on the contributory assets.
Discount rate
It is important to note that the German ordinance explicitly mentions that the discount
rates should reflect the actual risk profile of the function. In order to determine the
respective appropriate discount rate, the interest for a risk-free investment shall be
applied in consideration of the tax charge; a functional and risk adequate surcharge
shall be applied. The term of the risk-free investment depends on how long the
transferred function will presumably be exercised. The surcharge shall be determined
taking into account the respective risk assessment for the transferring and the
receiving enterprise that would be common for enterprises in comparable cases.239
Useful life
In terms of useful life (referred to as “capitalisation period”), an infinite life should be
applied unless a shorter useful life can be proven. The latter can be the case for
intangibles with limited duration of legal protection. In practice, IDW S5 may be used
as a reference for listing factors that could serve as indicators of the economic life.240
5.4 Potential application to EU Member States
The transfer pricing laws in the US and Germany are a useful starting point in terms of
the extent of guidance they provide on the choice and application of valuation
methodologies.
In this respect, more guidance should be considered to be included in the transfer
pricing regulations (either on international basis such as for instance, the OECD
Guidelines) or on a national basis. This guidance should ideally cover the following
aspects:
238 IDW S 5, para. 36. 239 FVerlV, Section 5. 240 IDW S 5, para. 99.

European Commission
Study on the Application of Economic Valuation Techniques for Determining Transfer Prices of Cross Border Transactions between Members of Multinational Enterprise
Groups in the EU
September 2016 – 154
1) Guidance on the application of the economic valuation techniques, possibly in line
or under the framework of the OECD transfer pricing methodologies. In this
respect, a (fuller) overview of the possible economic techniques is necessary
including indication to what extent they correspond to the OECD TPG methods.
Assuring this correspondence will allow more consistency in application of the
certain methods and in evaluation of their appropriateness. Additionally, it will
allow a use of the existing OECD methods framework for valuations (i.e.
consideration of comparability requirements in the conjunction of potential
application of Relief from Royalty method, etc.)
2) Guidance on the “best method” or “most appropriate method” approach including
the factors and circumstances to consider when selecting the appropriate economic
technique for valuation of intangibles in the transfer pricing context.
3) Guidance on the building blocks and parameters for each of economic technique to
consider, including guidance (more extensive than in the OECD TPG including the
revised Chapter 9):
Financial forecasts and practical ways to justify the forecasted used data (e.g.
use of sensitivity analysis, explanations for extra-high profitability forecast,
history of the company of achieving forecasts, and other good practices to
objectivize the data);
Discount rate including the conceptual construction and the ways to evaluate
the discount rate. This should cover the important factors for consideration
such as accounting for and adjusting for a difference in risk.
Useful life including consideration of the most important factors to consider
when determining a useful life. In this respect, it may be important to include
in the guidance a principle of taking a position of the specific parties of
transaction on the useful life on the intangibles, i.e. to estimate useful life in
the context of their specific application and use of such intangibles.

European Commission
Study on the Application of Economic Valuation Techniques for Determining Transfer Prices of Cross Border Transactions between Members of Multinational Enterprise
Groups in the EU
September 2016 – 155
6. Capacity building in tax administrations
6.1 Introduction
It has been established by the EU Commission that there are deficiencies in current IP
valuation practice, lack of valuation experience and of IP valuation related knowledge.
In this respect, it is desirable that fill up in knowledge and quantity of resources at the
level of tax administration and taxpayers.
The present section investigates the costs to be expected for preparing a valuation of
IP study in the transfer pricing context, based on the survey of Deloitte experts in 28
Member states and nine trade partners.
Further, based on the survey results, it is investigated how the Member States and ten
partners respondents assess their capacity in respect to resources (experts) available
at the tax administration and taxpayer’s level, to conduct valuation studies for transfer
pricing purposes. Additional commentary was included investigating the recent and
present measures taken in the Member States and trade partners in respect to
building capacity, especially focusing on the US experience.
6.2 Estimated costs of valuation study
- EU Member States
The costs of performing a study involving valuation of intangibles for transfer pricing
purposes were investigated through posing the respective question in the survey to
Member State experts. First, the question was asked irrespective of the number of
types of intangible assets in a study but simply based on the representative
experience in the country’s practice and based on respondents’ experience.
The respondents have found the question very difficult and noted that, because of the
unique nature of intangible assets, the analysis and its cost vary, from situation to
situation. In general, most of the respondents made a caveat that the range of the
costs for a project involving valuation of intangibles is very high. Among the 21
respondents to this question, the majority (14 out of 21) think that the costs of such a
valuation exercise lie below EUR 40,000. More particularly, seven respondents
indicated that the costs are between EUR 10,000 – 20,000 and seven – between EUR
20,000 – 40,000.

European Commission
Study on the Application of Economic Valuation Techniques for Determining Transfer Prices of Cross Border Transactions between Members of Multinational Enterprise
Groups in the EU
September 2016 – 156
Figure 71. Median costs of valuation study for intangibles from transfer
pricing perspective for tax authorities – EU Member States
Next, the respondents were asked to comment on the estimate of costs in cases
where the study involves only one defined intangible is single. Presumably it will be a
case in smaller scope projects, than an average study which may involve more than
one intangible asset valued. Based on the answers, the costs of studies with one
intangible asset being valued are estimated to be generally lower, with 17 respondents
out of 20241 respondents estimating the costs below EUR 40,000 in their respective
markets. The responses are presented below.
Figure 72. Median costs of valuation study involving a single intangible, from
transfer pricing perspective – EU Member States.
Member State respondents also commented that the cost estimate for a valuation
study is based on the assumption that the full factual, functional and risk analyses are
241 The UK did not respond to the second question about the estimate citing that the
spread of the costs for such study is too wide, based on the UK experience.
2
12
5
1
0 0 0
2
4
6
8
10
12
14
Less than10,000
10,001 – 20,000
20,001 – 40,000
40,001 – 60,000
60,001 – 80,000
80,001 andmore

European Commission
Study on the Application of Economic Valuation Techniques for Determining Transfer Prices of Cross Border Transactions between Members of Multinational Enterprise
Groups in the EU
September 2016 – 157
completed. One respondent also noted that the spread of the fees/costs may be
extensive, due to the unique nature of intangibles and the difficulty of their valuation;
hence, the estimate of a median cost bracket may be of limited use.
- EU Trade partners
Similar questions were also posed to the nine trade partners respondents. Their
detailed answers are found below. It is important to note that the respondents found
the question of estimating the average cost extremely difficult because the intangibles
are unique and it is difficult to predict average costs of their valuation.
Table 9. Median costs for IP valuation study
Median costs in EUR for IP
valuation study Median costs in EUR of a study with one intangible
Australia 40,000 - 60,000 10,000 - 20,000
Canada 40,000 - over 100,000 40,000 – 60,000
China 30,000 - 50,000 20,000 - 40,000
India - Less than 10,000
Japan - 60,000 - 80,000
Korea 20,000 - 40,000 10,000-40,000
Norway 40,000 - 60,000 40,000 - 60,000
Switzerland 40,000 - 60,000 20,000 - 40,000
United States Over 100,000 20,000- 40,000.242
6.3 Resources at tax administration and taxpayer’s side
- EU Member States
Only five (Belgium, Finland, Germany, Netherlands and Spain) out of 28 Member
States respondents confirmed the presence of adequate transfer pricing resources in
their country’s tax administration. However, respondents noted (except being Finland)
that these specialists may either be in insufficient numbers or lacking expertise and
experience precisely in valuations in the transfer pricing context.
Eleven Member states respondents noted that the taxpayers (multinationals)
sometimes have internal resources to perform valuation for transfer pricing purposes
with ten Member States (out of 11) noting that these resources are very rare.
As shown by the Figure below, only six Member States respondents (Germany,
Hungary, the Netherlands, Poland, Romania and Spain) noted that the taxpayer would
sometimes attempt to perform a valuation study internally. However, in these cases, it
is expected that they would request an advisor to review such a study. One Member
State respondents (France) indicated that it is frequently the case that a taxpayer will
attempt a valuation internally however this valuation would be a first draft to be
further reviewed by a third party specialist.
242 The estimate refers to the valuation of “make or sell” rights of a trademark.
However, if the rights are more complex (and include rights to develop), the costs
could be higher.

European Commission
Study on the Application of Economic Valuation Techniques for Determining Transfer Prices of Cross Border Transactions between Members of Multinational Enterprise
Groups in the EU
September 2016 – 158
Figure 73. Frequency of a taxpayer preparing valuation of intangibles for
transfer pricing purposes internally – Member States
The survey respondents were requested to comment on any developments and
measures observed at the level of tax authorities and taxpayers in respect to their
capacity building. The finding (responses received in this respect) are summarized
below.
Table 10. Capacity building measures at the level of tax authorities – EU
Member States Belgium Recent years the tax administration in Belgium has grown
significantly. The number of tax inspectors has at least doubled by 2015 from the 10 auditors team registered in 2009; the TP audit cell is still looking to grow by recruiting new personnel. One of the
important developments was the establishment of a Centre for Large Enterprises. The Central TP team also took the initiative to
train the local tax inspectors in the TP issues.
Bulgaria No. In 2015, there was a public procurement call to train the tax administration and it was Deloitte who has won the work. The training covered 160 tax inspectors who were split in 7 groups and
each group trained for 3 days. The training covered all important topics on a basic level, as far as services and also IP transactions but the latter were covered also on a high level. It also covered developments at the OECD level and BEPS initiatives. So it is clear that the TA want to develop their technical skills.
Croatia The team performing audits is about 20 people, and within this there is a 5 person teams who are top intelligence in TP in the tax administration. This team was formed at the end of 2012, and it has been operating now successfully for these years while auditing big taxpayers in Croatia (i.e. companies with turnover of over 20 mio EUR). However, this team is not particularly specialized in IP or
valuations.
Hungary The Central APA team has economists and lawyers but has limited practical experience. These personnel educate themselves by studying valuations from APAs that Deloitte and other tax advisors and taxpayers submit to them, this is their way of education with technical matters like valuation of IP.

European Commission
Study on the Application of Economic Valuation Techniques for Determining Transfer Prices of Cross Border Transactions between Members of Multinational Enterprise
Groups in the EU
September 2016 – 159
Poland The tax administration has TP specialists. It includes three central teams (Ministry of Finance team deals with APA, MAPs, and CA; it
has just been merged with the team engaged in detecting GAAR (General Anti-Avoidance Rules) violations): small team that deals with regulations (coordinating with Ministry of Finance), and two specialized teams, one in Tax Chamber in Lodz supporting tax audit teams throughout country; and a specialized Audit team In Warsaw. The process of centralization has been implemented for the last 2 years – this reorganization is considered impressive. The
Ministry of Finance team is responsible for providing trainings for the tax auditors engaged in TP.
Slovenia The tax administration has a TP group which is part of Corporate Income Tax group of personnel. It is known that the tax administration has not been allowed to hire new people for the past
5 years or so. As such, a big percentage of tax administration
specialists are getting close to retirement. Each of them has estimated 6-7 open audit cases, thus they are overloaded.
Spain There are TP specialists in the Tax Administration, in ONFI (Oficina Nacional de Fiscalidad Internacional). They are currently building the team so they are growing in numbers.
Sweden Insufficient resources at tax administration with only a few (2-3) focusing on valuations of IP for TP purposes. One of such persons has a background in a Big 4. Generally the tax administration positions have very low salaries in comparison with Consulting so it is not attractive career option.
UK The Tax Administration tends to use Capital Gain Valuators for assessing valuations, who are not TP specialists. The tax administration has many TP specialists but they are not specialized in IP valuations for TP purposes.
- EU Trade partners
Among surveyed trade partners, only two respondents (Canada and Norway) indicated
that there are sufficient resources for handling cases involving transfer pricing
valuations with others noting that either in the number of specialists at tax
administration or their level of familiarity with the economic valuations is insufficient.
The similar situation is at the multinationals in trade partners’ (with only four countries
noting that such specialists are sometimes present in the multinationals and others
commenting that this happens rarely or never).
Thus, it seems that the problem of insufficient resources is more or less consistent
with the situation in the Member States. It was found that this is mainly due to the
specificity of the technical issues encountered in valuations for transfer pricing
purposes, the evolution of the valuation exercise and the growing importance of
transfer pricing accompanied by increased scrutiny as the discipline and the industries
mature. In this sense, there seems to be a general need for strengthening resources
at the level of tax administrations by engaging specialists with experience in transfer
pricing and / or valuations.
Similarly to the interviews with the Member States experts, the survey respondents in
nine trade partner countries were requested to comment on any developments and
measured observed at the level of tax authorities and taxpayers in respect to their

European Commission
Study on the Application of Economic Valuation Techniques for Determining Transfer Prices of Cross Border Transactions between Members of Multinational Enterprise
Groups in the EU
September 2016 – 160
capacity building. The finding (responses received in this respect) are summarized
below. The feedback received from the US is presented separately below.
Table 11. Capacity building measures at the level of tax authorities – Trade
Partners Australia No sufficient qualified resources at the tax authorities. However the ATO
is in the process of increasing its resources in the transfer pricing field, so an increase in the quality and amount of these resources is expected.
Canada The Local Tax Services Office generally has a valuator on staff, usually someone that is a Chartered Business Valuator (CBV). Valuations are generally performed by such a person. To the extent issues arise that cannot be resolved with a local TSO, cases are often referred to or
reviewed by the Head Office, which has senior valuators with a lot of experience.
Japan The tax authority typically hires lawyers and not economists and this could be a challenge (to assess a valuation). Sometimes they are good specialists. They are trained on the job. NTA assigns the best (most experienced) specialists to technically challenging cases.
Norway A considerable team in Norwegian tax administration has been established. This Centralized Valuation team is there to assist in APAs and in Audit in terms of questions regarding valuations for tax. People in the team are specialized by industry. There is a sub-team that deals with valuation of technology (includes 4-5 engineers in this sub-team). In the
oil industry, there are many transactions involving transfers of IP – hence, a focus of the tax authorities on this industry. Since technology in this field is rather complex, they need to be engineers.
- US experience243
The US tax authority (IRS) has actually faced severe constraints on its budgets and
resources for the past six years since the Republicans took over Congress in 2010.
Since that time, the IRS has imposed strict budget controls on travel and any non-
case related expenses. So there have been numerous hiring freezes since that time.
That being said, the LBI (Large Business and International division of IRS) is always
trying to reallocate resources to transfer pricing. So this was part of the 2010
realignment to consolidate APA and Competent Authority to cut down on duplication
and allow for same people to work both APA and CA matters.
The U.S. transfer pricing (including cost sharing) regulations are written by academics
and people highly trained and highly specialized in economics and transfer pricing. It
is however a challenge to apply the rules and regulations in practice as most of
transfer pricing practitioners (not only taxpayers but also including resources of the
Big 4 consulting companies) are not as skilled as the authors of the regulations and it
is difficult to correctly understand and interpret the methods.
The IRS is always trying to obtain PhD economists for transfer pricing for its APMA
(Advanced Pricing and Mutual Agreement Program) and Competent Authority
243 Information received from Deloitte US in the interview and the following
correspondence.

European Commission
Study on the Application of Economic Valuation Techniques for Determining Transfer Prices of Cross Border Transactions between Members of Multinational Enterprise
Groups in the EU
September 2016 – 161
programs and for transfer pricing field economists. However, they have a very difficult
time hiring PhD economists because they cannot compete in salary offers with the
private sectors. So the IRS tends to only be able to get economists with Bachelor’s
degrees or at most a Master’s degree.
Faced with budget constraints, LBI has tried to focus its strategy on applying its “best
resources to its best cases.” So instead of going after everyone, they are going after
the most influential targets. They are trying to get a great deal of public attention with
what they hope will be some big wins against big taxpayers.244
6.4 Conclusions
The findings of the research of the capacities available in the tax administration and
taxpayers can be summarized as follows:
The survey has confirmed insufficiency of resources as well as particularly the skills
of the staff, both at tax administrations as well as at tax payer levels.
The costs of performing a valuation for transfer pricing purposes vary greatly, from
less than EUR 10,000 in simple cases involving one intangible to over EUR 100,000
in complex cases.
Several countries have positive experience in recent years expanding the staff of
transfer pricing specialists to address a growing need in such specialists and
performing necessary training, either using external resources (e.g. Bulgaria) or
internal resources (e.g. Belgium and Poland)
Other interesting positive observations in respect to the organization of resources
include:
o Experience of Norwegian tax authorities employing engineers for valuation of IP
in oil industry
o Experience of finding internal resources by refocusing personnel on big cases
and large taxpayers (US and Japan)
o Use of valuators by the Canadian tax authorities that are made available to
local / regional tax auditing team
The negative observations in respect to resources at the tax authorities and
taxpayers include:
o Observations of budget limitations that prevent from hiring new specialists at
tax authorities (e.g. Slovenia)
o Low salaries for such specialists at the tax administration level that prevent
them from attracting new hires (e.g. Sweden and the US).
o Complexity of the national regulations (prepared by academics) and the
difficulty to fully understand and apply such regulations at a level of taxpayers
and possibly their advisers (the US).
244 Information received from Deloitte US in the interview and the following
correspondence.

European Commission
Study on the Application of Economic Valuation Techniques for Determining Transfer Prices of Cross Border Transactions between Members of Multinational Enterprise
Groups in the EU
September 2016 – 162
7. Considerations for possible policy actions
7.1 Understanding general background for a valuation
It is important to acknowledge and understand that the transfer pricing discipline is
based on the detailed analysis of facts and circumstances, as well as functional and
risk profile of the parties relevant to transaction. In practice, the analysis is developed
in a specific transfer pricing report documenting, among other, the full business
model, value change, the extent of business transformation and the economic
functions and risks of the parties. Considering “before” and “after” business
circumstances of the analysed transaction are of a higher importance for a transfer
pricing specialist than to a general valuation expert.
Furthermore, the standard of value for transfer pricing, being the arm’s length
standard, warrants certain differences in a valuation for transfer pricing purposes as
opposed to valuation for other purposes. Among others, these differences include a
requirement to consider the perspectives of both parties of the transaction in the
analysis. This two-sided approach is typically absent from a valuation for other
purposes where a valuer presents only one side of the transaction be it as a buyer or a
seller.
It is further important to acknowledge and understand that the stakeholders, readers,
and stakes/risks are considerably different depending on the purpose of the valuation
(cfa Section 2 of the present document).
7.2 General valuation techniques
The principles of the valuation models and techniques remain similarly independent
from the valuation purpose and context. Based on the general background, and the
personal judgement, the choice of the methodology may be different.
It is important to understand the methodologies and the amount of the assumptions
and building blocks in each of them in order to select the most appropriate
methodology. In fact, such an understanding is a key factor to defend the valuation
successfully from the transfer pricing perspective.
In this respect, certain valuation standards may represent a useful reference point for
a transfer pricing practitioner attempting a valuation exercise. The valuation standards
(such as IDW S 5 in Germany) may provide useful insights on the methodology and
parameters of a valuation model.
7.3 Building blocks
Care should be given to the parametrisation of the valuation model including each of
the parameters. From a transfer pricing perspective, a proper justification is needed to
defend all the parameters. This matters even more considering that the valuation may
be challenged by a tax administration a few years after the inter-company transfer. In
this respect, good practices exist (with regards to routine return, royalties, verification
of financial data and proper discount rate studies) and should be further promulgated
among transfer pricing practitioners.

European Commission
Study on the Application of Economic Valuation Techniques for Determining Transfer Prices of Cross Border Transactions between Members of Multinational Enterprise
Groups in the EU
September 2016 – 163
7.4 Legislative measures
The transfer pricing laws in the US and Germany are a useful starting point in terms of
the extent of guidance they provide on the choice and application of valuation
methodologies.
In addition, the commercial court experience may provide useful evidence regarding
third party behaviour when addressing the issue of the IP value, including the
approach to take to value and parameters to use. The presence or awareness of the
commercial court cases however, seem to vary greatly from one Member State to
another.
In this respect, the development of more guidance regarding the factors to consider in
choosing the most appropriate methodology as well as the ways to objectivise the
assumptions and parameters of the models employed should be considered. This
guidance may be accompanied by practical examples (contained in legislature) on
building a full valuation, including the use of financial data and parameterisation, and
examples of reconciling the valuation for transfer pricing purposes with valuation for
other (accounting) purposes.
7.5 Resources
More resources are needed to promulgate a correct understanding and use of
economic valuation techniques. This applies both to the number of specialists at tax
authority administrations as well skill level of these specialists in valuations of
intangibles for transfer pricing purposes. Attracting specialists by some countries’
administration may mean reconsidering their budgets and salaries, to be able to
compete for qualified resources.
In respect for more immediate actions, positive observations at several tax authorities
may be considered as a good practice, including internal trainings provided by most
specialized central teams to the local and regional professionals, external training
using the resources of specialists in consulting and/or industry, and focusing best
country tax administration experts only on the large taxpayers and difficult cases.

European Commission
Study on the Application of Economic Valuation Techniques for Determining Transfer Prices of Cross Border Transactions between Members of Multinational Enterprise
Groups in the EU
September 2016 – 164
Bibliography
Böhm, T., Karkinsky, T., and Riedel, N. (2012). “The Impact of Corporate Taxes on
R&D and Patent Holdings”, Presented at the 2012 TAPES Conference in Oxford.
Chandler, C., Blough, S., Williams, W. (2010). “Reconciliation of purchase price
allocation and transfer pricing”, Tax Management Transfer Pricing Report 23, 1235-
1238.
Deloitte (2015). “IFRS in your pocket 2015”. Available at:
http://www2.deloitte.com/ch/en/pages/audit/articles/ia-plus-ifrs-in-your-pocket.html.
Dembitz, E. (2003). “Valuation of intangibles for financial and tax purposes…or EPS vs.
the IRS”, The Tax Executive 55(3), 218-221.
European Commission (2015) “Communication from the Commission to the European
Parliament and the Council, A fair and efficient corporate tax system in the European
Union: 5 key areas for action”. Available at: https://ec.europa.eu/priorities/sites/beta-
political/files/com_2015_302_en.pdf.
European Commission (2014) “Final Report from the Expert Group on Intellectual
Property Valuation”. Available at: http://ec.europa.eu/research/innovation-
union/pdf/Expert_Group_Report_on_Intellectual_Property_Valuation_IP_web_2.pdf.
Eustace, C. (2001). “The intangible economy impact and policy issues”, CEPS
Research Report 24, 1-38.
Financial Accounting Standards Board (FASB), Statement of financial accounting
standards No. 157 - Fair Value Measurements.
Finan, W. F., Launiau, S. (2011). ”Valuation of Intangibles for Transfer Pricing
Purposes: Convergence of Valuations for Transfer Pricing Purposes with Valuation for
Other Purposes - Presentation to Working Party No. 6 of the Committee on Fiscal
Affairs”. Available at: http://www.oecd.org/ctp/transfer-pricing/47429988.pdf.
Foreign Tax Act / Außensteuergesetz (AStG) (BGBl. 1972 I S. 1713), Germany.
Funktionsverlagerungsverordnung (FVerlV) (BGBl. I S. 1680), Germany.
Generally Accepted Accounting Principles (US GAAP).
Ghemawat, P., Pisani, N. (2013). “Are multinationals becoming less global?”, Harvard
Business Review. Available at: https://hbr.org/2013/10/are-multinationals-becoming-
less-global.
Ghosh, S., Shu, W., Tomar, R. (2013). “Location-specific advantages: India and
China”, International Tax Review. Available at:
http://www.internationaltaxreview.com/Article/3300894/Location-specific-advantages-
India-and-China.html.
Grant Thornton (2013). “Intangible assets in a business combination, Identifying and
valuing intangibles under IFRS 3”, May 2008. Available at:
http://www.grantthornton.ca/resources/insights/newsletters/Intangible_Assets_Guide
_May_2008[1].pdf.

European Commission
Study on the Application of Economic Valuation Techniques for Determining Transfer Prices of Cross Border Transactions between Members of Multinational Enterprise
Groups in the EU
September 2016 – 165
Heberden, T. (2011). International Licensing and Technology Transfer: Practice and
the law, Kluwer, Mechelen, 3.
Henshall, J., Penelle, P. (2016). “Intellectual property and controversy”, International
tax review. Available at:
http://www.internationaltaxreview.com/Article/3539714/Intellectual-property-and-
controversy.html.
Hitchner, J.R. (2011). Financial Valuation: Application and Models 3rd ed., Wiley, New
York, 127-139.
Internal Revenue Service (1986), US Treasury Regulations § 1.482.
International Accounting Standards, IAS 16 - Property, Plant and Equipment.
International Financial Reporting Standards (IFRS).
International Valuation Standards (IVSC), International Valuation Guidance Note No. 4
– Valuation of Intangible Assets.
Institut der Wirtschaftsprüfer Standard, IDW Standard: Principles for the Valuation of
Intangible Assets (IDW S 5, Status at 23 May 2011).
Karkinsky, T. and Riedel, N. (2012). “Corporate Taxation and the Location of Patents
within Multinational Firms”, Journal of International Economics 88(1), 176–185.
Koller, T., Goedhart, M., Wessels, D. (2010). Valuation: Measuring and Managing the
Value of Companies 5th ed., Wiley, New York, 229-235.
KPMG (2009). “Intangible assets and goodwill in the context of business combinations
– An industry study”. Available at:
https://www.kpmg.com/PT/pt/IssuesAndInsights/Documents/Intangible-assets-and-
goodwill.pdf.
Lev, B (2001). Intangibles: Management, Measurement and Reporting, Brooking
Institution Press, Washington DC.
Lohse, T., Riedel, N. (2013). “Do transfer pricing laws limit international income
shifting? Evidence from European multinationals”, University of Mannheim, University
of Hohenheim, CESifo Munich & Oxford University CBT, 1-30.
OECD (2013) “Addressing Base Erosion and Profit Shifting”.
OECD (2015) “BEPS Actions 8-10 - Aligning transfer pricing with value creation”.
OECD (2006) “Comparability: public invitation to comment on a series of draft issues
notes”.
OECD (2011) “New sources for growth: intangible assets”.
OECD (2014) “Model Convention with respect to Taxes on Income and on Capital”.
OECD (2010) “Transfer Pricing Guidelines for Multinational enterprises and Tax
Administrations”.

European Commission
Study on the Application of Economic Valuation Techniques for Determining Transfer Prices of Cross Border Transactions between Members of Multinational Enterprise
Groups in the EU
September 2016 – 166
Pratt, S.P., Grabowski, R.J. (2010). Cost of capital in litigation: application and
examples, Wiley, New York, 109-134.
Rostwoski, A.M. (2015). “Intangible property in transfer pricing analyses”, Willamette
Management Associates. Available at:
http://www.willamette.com/insights_journal/15/winter_2015_7.pdf.
Sadang A. (2015). “Finding an intersection between intangibles valuation and transfer
pricing”, Global Tax Weekly 139.
United Nations (2011) “United Nations Practical Manual on Transfer Pricing for
Developing Countries”.
Van den Brekel, R. (2013). “Global: Transfer pricing and the OECD project on BEPS”,
International Tax Review. Available at:
http://www.internationaltaxreview.com/Article/3217950/Global-Transfer-pricing-and-
the-OECD-project-on-BEPS.html.
Wittendorff, J. (2010). “Valuation of intangibles under income based methods - Part
I”, International Transfer Pricing Journal 17(5), 323-335. Available at:
http://corit-academic.org/wp-content/uploads/2011/12/Valuation-of-Intangibles.pdf

European Commission
Study on the Application of Economic Valuation Techniques for Determining Transfer Prices of Cross Border Transactions between Members of Multinational Enterprise
Groups in the EU
September 2016 – 167
Appendix 1 – Survey
1Please describe the composition of your team when performing a valuation study for Transfer Pricing
purposes (e.g. strictly TP experts, Valuation Experts, both).Open question
2
Do you have different teams / departments dealing with intangibles valuation / exit issues for transfer
pricing purposes and with valuation of intangibles for other purposes (Accounting, M&A, reporting,
general corporate tax)?
Yes / No
3Please indicate what kind of intangibles you have valued in your country (based on your practice) for
Transfer Pricing purposes.1. Never
2. Rarely
- Please refer to Table 1 and identify the relevant categorization 3. Sometimes
- For each of the selected categories, please indicate the frequency of valuation for TP purposes 4. Often
5. Very often
4Please indicate what approach (in terms of deciding whether or not it is an intangible) you have taken for
the item "workforce".1. Defended it is an intangible
2. Defended that it is not an intangible
3. Defended either depending on the situation
4. No experience dealing with the item
Please provide a brief explanation to your answer (e.g. why it was defended as an intangible). Open for explanation of the answer above
5Please indicate what approach (in terms of deciding whether or not it is an intangible) you have taken for
the item "location savings".1. Defended it is an intangible
2. Defended that it is not an intangible
3. Defended either depending on the situation
4. No experience dealing with the item
Please provide a brief explanation to your answer (e.g. why it was defended as an intangible) Open for explanation of the answer above
6Please indicate what approach (in terms of deciding whether or not it is an intangible) you have taken for
the item "business synergies".1. Defended it is an intangible
2. Defended that it is not an intangible
3. Defended either depending on the situation
4. No experience dealing with the item
Please provide a brief explanation to your answer (e.g. why it was defended as an intangible) Open for explanation of the answer above
7Have you identified and valued "goodwill" as an intangible asset for transfer pricing purposes? If so, how
often?1. Never
2. 1 or 2 special situations
3. 3-10 times
4. More than 10 times
Please explain what you have meant and defined by "goodwill" in this case, to explain your answer.
8
In the situation of a business restructuring, when there are no identifiable intangibles from Table 1, how
do you approach an issue of business closure (e.g. closure of the sales agent with no own customers,
or shut-down of contract manufacturer whose only customer was a related entity, etc.)?
1. There are always intangibles that are found
2. There are no intangibles but there is still an exit payment due.
3. There are no intangibles and no exit payment due
4. Other
Could you please explain your answer and / or provide a short example? If you think that there is more
than one answer that applies, please explain the situations when each of them is appropriate in your
experience.
Open question
Question
Section I. Background
This section provides a background on the TP practitioners who are our respondents
Section II. Intangibles in Transfer Pricing
Answer
This section gives us a framework for position of Respondents to what are intangib les for TP purposes

European Commission
Study on the Application of Economic Valuation Techniques for Determining Transfer Prices of Cross Border Transactions between Members of Multinational Enterprise
Groups in the EU
September 2016 – 168
9In respect to the previous question, what would be the approach of your country's tax administration to
this issue? 1. They will likely argue that there is always a payment due
2. They agree that in some cases, no payment on business
restructuring is warranted
3. No experience with reaction of TA on the matter
Please explain what would be their reasoning if you answered 1 or 2
10Has the use of certain definition of intangible assets in other fields (e.g. IFRS in Accounting) created
issues for transfer pricing / tax purposes? If so, which definition and what was the related difficulty?Open question
Please provide a short example.
11Do you use the valuations prepared for different purposes in your country (e.g. accounting, PPA,
management reporting) in your practice for TP purposes?1. Yes, always if available
2. Yes, but with corrections and validation (please explain)
3. Sometimes in certain circumstances (please explain when)
4. To some extent (I may use some parameters and financial
data contained)
5. Usually, no (please explain why)
6. Never (please explain why)
7. No experience with Tax Administration applicability
12Are valuation studies prepared for other purposes / accepted in your country by the tax administration (as
Transfer Pricing study)?
1. Yes, quite often, with minimal explanation as to why this
valuation is also useful for transfer pricing
2. Yes, but with corrections and validation (please explain)
3. Sometimes in certain circumstances (please explain when)
4. Usually, no (please explain why)
5. Never (please explain why)
6. No experience with tax administration applicability
What would the tax administration challenge in particular in this respect? Open question
13If you use these studies under question 11, how have you dealt with the issue of goodwill that is a part of
PPA? 1. No experience (not used)
2. I would try to allocate it to other intangibles I identified for TP
purposes
3. Other (please indicate
14
Please indicate cases when the results of the valuation for different purpose (e.g. PPA's values of certain
assets) was challenged and disregarded by the tax administration. Please be detailed and concrete in
your example.
Open question
(For instance, in France, in the case of a PPA valuation, the tax administration argued that a portion of the
goodwill in a business needs to be allocated to a transfer of certain intangib le assets, as goodwill cannot
be separated from those assets).
15Please explain what is the minimum background you need to have (besides financial data) to perform a
valuation for transfer pricing purposes. Please mark all that applies.
1. Functional and risk profile of parties before and after the
transfer in question
2. Contracts
3. Business (and all other) reasons for restructuring
4. Other (please indicate)
16How do you reflect the rationale & economic circumstances (i.e. "before" and "after" functional profile of
the parties) behind a transaction into the valuation study?1. Factual and functional analysis
2. Other (please indicate)
Section III: Reconciling with Valuations for other purposes and important pre-requisites for performing
TP valuations This section investigates to what extent the valuations for other purposes are used in TP practice

European Commission
Study on the Application of Economic Valuation Techniques for Determining Transfer Prices of Cross Border Transactions between Members of Multinational Enterprise
Groups in the EU
September 2016 – 169
17
Which are most important factors driving your decision to use a specific valuation method(s) to value an
intangible asset, e.g. OECD historical hierarchy of methods, acceptability by local tax administration,
availability of (reliable) information on parameters, availability of reliable forecast, other?
Open question
18Referring to the previous question, do you think / agree that the purpose of the valuation (i.e. Transfer
Pricing) is important to the choice of methodology and its modalities?
If yes, could you please explain to what degree you think it is influencing the choice of methodology? Open question
19Which valuation methods (market-, income-, and cost-) in the context of TP are generally accepted in
your country by the tax administration?Open question
20The OECD considers income-based valuation techniques more useful when valuing intangibles than
costs-based or market-based approaches. 1. Yes, but some exceptions are possible
Is it a commonly accepted practice in your country? 2. Depends on situation (we see about 50:50 cases)
3. No, we frequently use methods other than income-based
methods
4. No experience
21Could you provide an example or situation when the market or cost method was deemed to be more
appropriate to value an intangible asset?Open question
221. Never
2. Rarely
3. Sometimes
4. Often
5. Very often
23Could you please indicate if you use any of the other valuation techniques (Table 3) for TP purposes?
(The answer could be marked in provided listing if convenient) 1. Never
2. Rarely
3. Sometimes
4. Often
5. Very often
24
Are there other methodologies that you applied for the valuation of IP in a business restructuring context
for TP purposes, that are not listed? In this case, could you please provide us with a brief explanation of
the methodology applied?
Open question
25Of the top three intangible assets which you valued most frequently (ref. to question 3) please indicate
which of the methods have you applied in practice most often?Open question
26What are the methods and techniques that appear preferred by the tax administration in your country
(during audits or suggested in the APA process)?Open question
27Are there other methods you would consider, but have not applied yet in practice? And if so, could you
describe these methods and indicate why they are not currently used?Open question
28How important do you consider the use of more than one method for valuation of intangibles / exit
payment in the light of business restructuring? If important, why ?Open question
Could you please indicate which of the listed methods you applied (and how often) when addressing the
valuation of IP in the context of business restructuring for TP purposes?
In the light of the present survey, we have described the most common valuation techniques used for TP purposes in the context of business restructuring (and their
characterization in terms of OECD methodology) in provided listing (corresponding to Table 2) . Please refer to this listing when answering the following questions
Section IV.a Selection of the method for Valuation in Transfer Pricing
Section IV.b Application of the method (technique behind)
Section IV: Selecting appropriate methodology(ies) for TP valuation & their application (including
techniques and parameterization)In this section, we focus on selecting the most appropriate methodology and relevant techniques to valuating Intangib le(s) (separate intangib les or a bundle of intangib les).
The analysis investigated focuses on a transfer of intangib les (to distinguish between cases of evaluation of period royalty (cfa "Defining the purpose and scope"). Please note
that the analysis of royalty is however addressed.

European Commission
Study on the Application of Economic Valuation Techniques for Determining Transfer Prices of Cross Border Transactions between Members of Multinational Enterprise
Groups in the EU
September 2016 – 170
29 1. (Almost) Never
2. Rarely
3. Sometimes
4. Often
5. Very often
Why? Or why not? Open question
30In respect to the methods that you use from provided listing (Tables 1 and 2) and any additional
methods, could you please describe for us the advantages and disadvantages?Open question
31 1. Different assumptions (please explain)
2. Different values of parameters (please explain)
3. Different type of financial data (please explain)
4. Different set up of methods used (please explain)
5. Other
32 How do you in practice account for the factors identified above? Why? Open question
33Is it mandatory in your country to perform a valuation from the perspective of both parties to the
transaction?Yes / No
If so, when and under what circumstances? Open question
34Are there any guidelines in your country (presumably issued by the tax administration), related to the
preparation of valuation from the perspective of both parties in the transaction? Yes / No
In which cases do those apply? [e.g. Administrative Principles in Germany that make it necessary to
prepare valuation from both parties' perspective in cases of a cross-border transfer of function. These
apply]
Open question
35How often in practice do you perform valuations from the perspective of both parties (Transferee and
Transferor) in your country?1. Never
2. Rarely
3. Sometimes
4. Often
5. Very often/ Always
36If you answered Never to Rarely, could you please explain why? What is the main impediment to
performing valuations from perspective of both parties?Open question
37 Do you think valuations from both parties' perspective should be applied more often in general? 1. Strongly disagree
2. Disagree
3. Neutral
4. Agree
5. Strongly agree
Why? Open question
Please also see more on two-sides valuations questions (questions 68 - 70) below
38If you selected a royalty relief method to value certain intangibles, could you please describe your
approach to determining the appropriate royalty?Open question
39
(in the absence of internal comparables or of the client providing you with an appropriate input for
royalty), is doing a search for comparable license agreements covering the same / similar type of
intangibles under the OECD standards of CUP method necessary for this approach?
1. Yes
2. No
3. No experience
Section V. Information Gathering/ Parameters ("Building Blocks")
Section V.a. Royalty -- Please note that the questions below also apply to a general analysis of royalty as arm's length payment for the use of intangib les
Section IV.c. Analysis from the perspective of transferee and transferor
In OECD Guidelines Chapter 9 (and para 6.157 of TPG), it is stressed that is important to have a valuation done from perspective of both parties, Transferee (Seller) and
Transferor (buyer). In the following questions we inquire about applicability of this issue in your country
When performing a valuation for transfer pricing purposes, we understand that the purpose (i.e. TP) in
practice needs to be considered. We are trying to identify what the important factors are that should be
accounted for when performing the valuation for TP (in comparison with valuation for other purposes
(PPA, etc.). Please mark all that applies. Please be as detailed as possible.
In practice, how often do you use more than one methods to estimate the value of intangible(s) / exit
payment for one project?
We would like now to address the questions regarding the input needed for the application of the methods.

European Commission
Study on the Application of Economic Valuation Techniques for Determining Transfer Prices of Cross Border Transactions between Members of Multinational Enterprise
Groups in the EU
September 2016 – 171
40In your practice & experience as TP practitioner, what has been the main difficulty in your opinion to find
appropriate royalties?Open question
41 Please indicate what databases you use in practice for benchmarking royalty rates?
42How would you describe the acceptability of the benchmarked royalties (on external databases indicated
above) in your country?1. Never
2. Rarely
3. Sometimes
4. Often
5. Very often
What is the main reason of non-acceptability, if applicable? Please indicate
43If you selected a residual profit methodology, could you please describe your approach to determining
the appropriate routine return?Open question
44
(In the absence of internal comparables or of the client providing you with an appropriate input for the
royalty) Is doing a search for comparable companies under the principles and standards of TNMM the
most common and accepted approach?
1. Yes
2. No
3. No experience
45In your practice & experience as TP practitioner, what has been the main difficulty in your opinion to find
appropriate routine returns?Open question
46 Please describe what databases you use in practice for benchmarking routine returns.
1. Never
47How would you describe the acceptability of the benchmarked routine returns under TNMM method (on
external databases indicated above) in your country? 2. Rarely
3. Sometimes
4. Often
5. Very often/ Always
What is the main reason of non-acceptability, if applicable? Please indicate
48The timing horizon in the models utilizing the DCF technique usually implies a forecast of several years.
Using indefinite life implies that DCF model will contain a terminal value.
On what basis do you decide to apply an indefinite or a finite life for an intangible asset? [If it is required
by regulations, please indicate so]Open question
49For which type of intangibles is it common practice in your country to apply an indefinite life? Reference to
Table 1Please mark all that are apply.
50If you selected a finite life, could you please indicate what are the important facts and factors to
determine the number of years constituting the life. Please mark all that applies.
1. Technological changes (how fast the newer better products
are developed and released)
2. Economic life (how long there are profits that are not washed
out by new market entrants)
3. Functional life (the products are replaced by completely new
products)
4. Publications indicating useful life in this industry.
5. Other (please explain)
If you indicated answer 4, could you please indicate how often you find external references for useful life
and what is the source of these references?
Open question
51Do you have any recommendations on what can be done in respect to this parameter (time horizon) in
transfer pricing (in terms of databases, approach of tax administration, etc.)?Open question
52Is there a practice in your country to apply a depreciation when using any of the methods applying DCF,
especially Residual profit methodology (depreciation schedule is applied to (residual) profit?Yes/ No
53 If yes, could you please explain with what purpose is this performed? Please indicate all that applies.1. To account that intangibles do not hold their full value in terms
of generating intangible-generating economic return over time
2. To determine the appropriate value of initial IP in the cases
when the development of the intangibles has been continued by
another party
3. Other (please indicate)
54If yes, could you please indicate what is the common practice in respect to the depreciation schedule
(and what type of analysis you use for this purpose)?
Open question (we mean is it straghtline/ linear constant
decline, or something else?)
Section V.b. Routine returns
Section V.c Timing horizon, useful life and terminal value

European Commission
Study on the Application of Economic Valuation Techniques for Determining Transfer Prices of Cross Border Transactions between Members of Multinational Enterprise
Groups in the EU
September 2016 – 172
55 On what basis do you determine the discount rate for your valuation?1. Internal rate (WACC) of taxpayer (which is used in internally in
budgeting or other projects)
2. Estimate it based on the public information
3. Other
56 If you answered 1, could you please explain how often do you challenge the rate provided by the client? 1. Never
2. Rarely
3. Sometimes
4. Often
5. Very often/ Always
57 If you answered 1, could you please explain how often the Tax administration challenges the rate? 1. Never
2. Rarely
3. Sometimes
4. Often
5. Very often
58If you answered 2 above (Estimate the rate based on public information), could you please explain how
often you use publicly available rates for industries in different databases?1. Never
2. Rarely
3. Sometimes
4. Often
5. Very often/ Always
If you answered from Rarely to Very Often in this question could you please indicate the databases you
use?
59If you answered 2 above (Estimate the rate based on public information), could you please explain how
often you estimate the discount rate using finance formulas (such as WACC, WARA, etc.)?1. Never
2. Rarely
3. Sometimes
4. Often
5. Very often
Please indicate the most common techniques in this respect. Open question
60
Could you please comment on the main parameters of the formula applied. For instance for WACC
these are the following (modify as needed). Please insert what kind of data you commonly use for this
valuation.
Open questions.
* Debt/ Equity ratio
* Return on debt
* Return on equity (CAPM and its parameters, market premium, beta, risk-free rate, etc.)
* tax rate
61Do you use/ estimate different discount rates in relation to different types of IP in cases when the study
covers more than one type of IP? Yes/ No
62If yes, on what basis would you calculate different discount rates (what is the factor in your calculations
leading to different discount rates)?Open question
63
Could you please recommend what, in your practice and from your country's perspective, is the best
practice in respect to determining the discount rate for valuations in Transfer Pricing? [E.g. certain
reasonability checks, etc.]
Open question
64 Do you perform any reasonability analysis on the financial data provided? 1. Never
2. Rarely
3. Sometimes
4. Often
5. Very often/ Always
65 If yes, could you please indicate what kind of data you may use for checking the above?1. No data, just checking for obvious outliers (jumps in sales/
profitability, etc.)
2. I will compare the forecast /projected growth with the past
profitability of this company
3. Other (please explain)
Section V.d Discount rate
Section V.e Financial data
For applying the methods encompassing a use of DCF technique, a financial forecast is needed. Depending on the methodology used, the data needed could range from a
forecast of sales only (e.g Relief from royalty) to a full P&L with identification of major costs forecasts for application of the residual profit method. This financial data is typically
obtained from the taxpayer.

European Commission
Study on the Application of Economic Valuation Techniques for Determining Transfer Prices of Cross Border Transactions between Members of Multinational Enterprise
Groups in the EU
September 2016 – 173
66
The OECD TPG suggest the use of price adjustment clauses in cases where the valuation of an IP is
highly uncertain. What is the practice in your country in respect to adopting price adjustments associated
with transfer of IP?
1. Never
2. Rarely
3. Sometimes
4. Often
5. Very often/ Always
67 How important do you consider these adjustments as potential solution for data that is highly uncertain? 1. Very important
2. May be important
3. Not important at all
4. I do not have an opinion
68When performing a valuation for transfer pricing purpose, do you use operating profit or free cash flow for
determining an arm's length result?Open question
69When performing a valuation for transfer pricing purposes, do you determine the value of the intangible
asset on a pre-tax or post-tax basis? Open question
70When performing a valuation from both parties perspective, what is the most common approach in
determining which value (between Transferor's and Transferee's values) to use?Open question
71When performing a valuation of valuation from both parties' perspective, what kind of analysis /
reasoning would you use to determine which point of the range?
Open question
72
When performing a valuation of valuation from both parties' perspective, if selecting a value other than
the middle of the range, what kind of approach is the most common for the tax administration in your
country?
Open question
73When performing a valuation for Transfer Pricing purposes, do you take into account a certain
standard(s) (besides the OECD guidelines and the arm's length principle)? Yes/ No
74 If so, which standard(s) do you apply (e.g. ISV, OECD, USPAP and or national standards)? Open question
75Are some of these standards compulsory in your country in respect to Transfer Pricing valuations and to
what extent?
Open question
[E.g. for instance, the administrative principles in Germany ("Principles relating to the Examination of
Income Allocation between Related Parties in case of Cross-Border Transfer of Functions") which set out
the approach on valuation such as capitalization principles, discount rules, etc.). These principles build
on the Ordinance for Cross border of functions which is b inding for tax payers and tax courts. Although
the Principles are not legally finding, the level of proof shifts to taxpayer in cases when it does not follow
up the approach in the Principles]
76Which changes / improvements would you propose to the standards you use most often or are obliged
to use for Valuation for Transfer Pricing purposes?
Open question
77 If not, why not? Open question
78Does a specific standard or any regulation in your country prohibit or advise against the use of certain
valuation methods in relation to Transfer Pricing? And if so, which methods are these?Open question
79Has the use of certain valuation standards created issues for transfer pricing / tax purposes? Which
standards? Please provide a short example.Open question
Section VI. Standards

European Commission
Study on the Application of Economic Valuation Techniques for Determining Transfer Prices of Cross Border Transactions between Members of Multinational Enterprise
Groups in the EU
September 2016 – 174
80
What do you see as the median external costs (in Euro) for performing a Intangibles Valuation under an
income-based method for the purposes of transfer pricing in your country? This question is
independent from the scope of the intangibles in this case and is a measure of average pricing
observed
1. <10,000
is in euros but you can indicate your currency and bracket amount 2. 10,001 – 20,000
3. 20,001 – 40,000
4. 40,001 – 60,000
5. 60,001 – 80,000
6. 80,001 – 100,000
7. >100,000
81
How would your answer changes if the study is limited to a valuation of one rather well defined intangible
(e.g. a particular Patent or Patent family, a Trademark or Brand, etc.) in the context of an income-based
method used in a valuation for transfer pricing purposes
1. <10,000
2. 10,001 – 20,000
is in euro but you can indicate the amoutn in your currency 3. 20,001 – 40,000
4. 40,001 – 60,000
5. 60,001 – 80,000
6. 80,001 – 100,000
7. >100,000
82
Would you consider that the tax administration in your country has specialists that are in their skill at par
with the resources available for taxpayers (in this respect, consider that the tax payers could use external
consulting firms such as Big 4's etc.)?
Open question
If yes, do you think that they have these resources in sufficient numbers?
Do you have any other comments about these specialists (their education, etc.)
1. Never
83 Does your tax administration depend on external expertise when examining intangible asset valuation 2. Rarely
If often or very often, could you explain why and what kind of external expertise they use? 3. Sometimes
4. Often
5. Very often/ Always
84Does the tax administration in your country has a special division dealing with valuations of intangible
assets? Could you briefly describe how it is structured?Open question
85How often do you find that the taxpayer (i.e. personnel of MNC) in your country has internal personnel that
is capable to perform Intangible Valuations for Transfer Pricing purposes?1. Never
2. Rarely
3. Sometimes
4. Often
5. Very often/ Always
If yes (Rarely - Very Often), who are these specialists in terms of their job responsibility in the company Open question
86How often in practice do taxpayers in your country perform Intangible Valuations for Transfer Pricing
purposes with own staff? 1. Never
2. Rarely
3. Sometimes,
4. Often
5. Very often/ Always
87If you answered Rarely, Sometimes, Often or Very Often, please indicate how often these internally
prepared studies will still be reviewed and corrected by external advisors1. Never
2. Rarely
3. Sometimes,
4. Often
5. Very often/ Always
88Do you expect any changes in respect to resources at both tax administration and MNC level ? (e.g. MNC
hiring specialized personnel, etc.). Please comment what kind of changes you expectOpen question
Section VII. Capacity Building
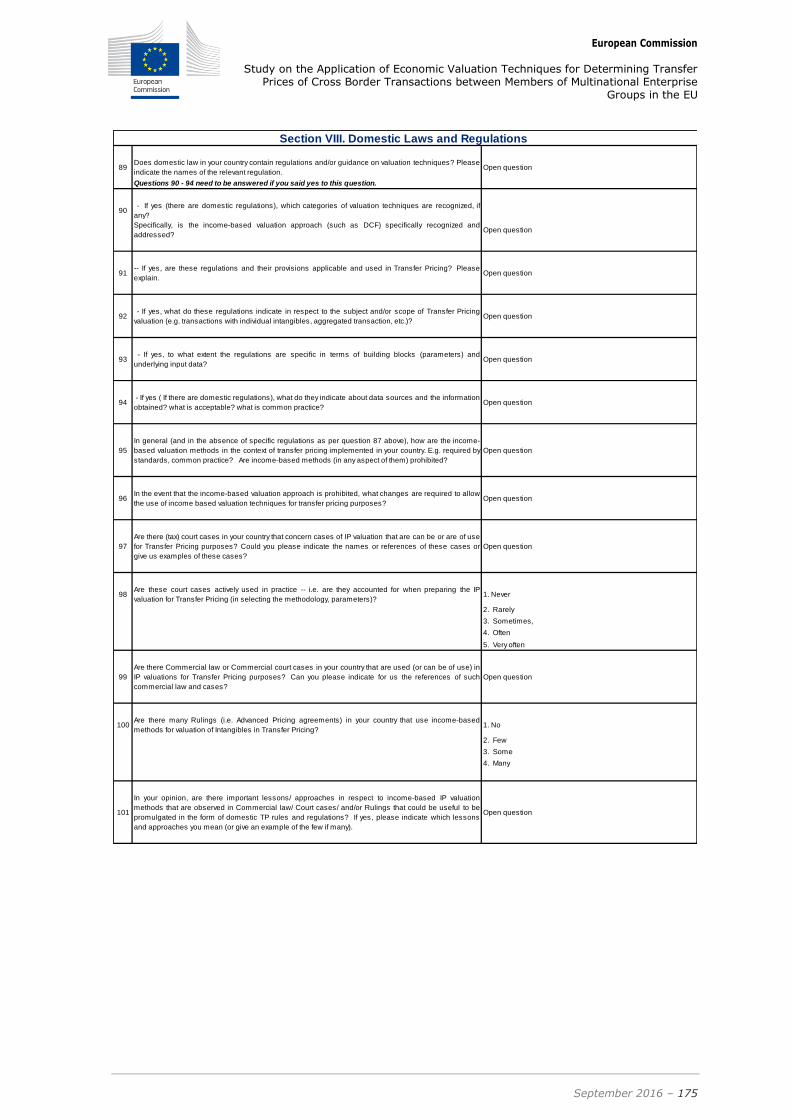
European Commission
Study on the Application of Economic Valuation Techniques for Determining Transfer Prices of Cross Border Transactions between Members of Multinational Enterprise
Groups in the EU
September 2016 – 175
89Does domestic law in your country contain regulations and/or guidance on valuation techniques? Please
indicate the names of the relevant regulation.Open question
Questions 90 - 94 need to be answered if you said yes to this question.
90- If yes (there are domestic regulations), which categories of valuation techniques are recognized, if
any?
Specifically, is the income-based valuation approach (such as DCF) specifically recognized and
addressed?Open question
91-- If yes, are these regulations and their provisions applicable and used in Transfer Pricing? Please
explain.Open question
92- If yes, what do these regulations indicate in respect to the subject and/or scope of Transfer Pricing
valuation (e.g. transactions with individual intangibles, aggregated transaction, etc.)?Open question
93- If yes, to what extent the regulations are specific in terms of building blocks (parameters) and
underlying input data?Open question
94- If yes ( If there are domestic regulations), what do they indicate about data sources and the information
obtained? what is acceptable? what is common practice?Open question
95
In general (and in the absence of specific regulations as per question 87 above), how are the income-
based valuation methods in the context of transfer pricing implemented in your country. E.g. required by
standards, common practice? Are income-based methods (in any aspect of them) prohibited?
Open question
96In the event that the income-based valuation approach is prohibited, what changes are required to allow
the use of income based valuation techniques for transfer pricing purposes?Open question
97
Are there (tax) court cases in your country that concern cases of IP valuation that are can be or are of use
for Transfer Pricing purposes? Could you please indicate the names or references of these cases or
give us examples of these cases?
Open question
98Are these court cases actively used in practice -- i.e. are they accounted for when preparing the IP
valuation for Transfer Pricing (in selecting the methodology, parameters)? 1. Never
2. Rarely
3. Sometimes,
4. Often
5. Very often
99
Are there Commercial law or Commercial court cases in your country that are used (or can be of use) in
IP valuations for Transfer Pricing purposes? Can you please indicate for us the references of such
commercial law and cases?
Open question
100Are there many Rulings (i.e. Advanced Pricing agreements) in your country that use income-based
methods for valuation of Intangibles in Transfer Pricing?1. No
2. Few
3. Some
4. Many
101
In your opinion, are there important lessons/ approaches in respect to income-based IP valuation
methods that are observed in Commercial law/ Court cases/ and/or Rulings that could be useful to be
promulgated in the form of domestic TP rules and regulations? If yes, please indicate which lessons
and approaches you mean (or give an example of the few if many).
Open question
Section VIII. Domestic Laws and Regulations

European Commission
Study on the Application of Economic Valuation Techniques for Determining Transfer Prices of Cross Border Transactions between Members of Multinational Enterprise
Groups in the EU
September 2016 – 176
Appendix 2.A – Description of valuation methodologies
This document provides a general overview of intangible valuation methodologies
widely used for various purposes (financial reporting, M&A, disputes, etc.). This
description is based on ‘IVS 210: Intangible assets’ (2011, IVSC) and ‘IVS 210:
Intangible assets exposure draft’ (April 2016, IVSC) and the ‘Final Report from the
Expert Group on Intellectual Property Valuation’ (2013, EC). While the description
attempts to stay comprehensive and describe different variants of the same method,
the variation of the valuation methods discussed in the study are also indicated
throughout.
1 – Relief from royalty
Introduction to the methodology
The relief from royalty methodology is based on the economic theory of deprival value.
Based on this theory, the value of the IP is equal to the capitalised amount of the
royalties that would be payable if the IP was not owned but had to be licensed at
arm’s length from a third party. In other words, the Relief from Royalty approach
posits intangible value based on a royalty savings hypothesis, essentially asking: “over
the useful life of the intellectual property, what would a person or business save by
owning, rather than licensing, the intellectual property under consideration?” The
primary steps involved in applying this method are:
Identifying the appropriate royalty rate;
Calculating royalty cash flows (by applying the royalty rate to an appropriate
‘royalty base’ which is often projections of revenues derived from use of the IP);
and
Capitalising periodic royalty payments, generally on a post-tax basis (although for
TP purposes this may be on a pre-tax basis), by discounting at a suitable discount
rate.
Variations of the method
The relief from royalty method is generally used to measure the overall value of an IP
asset, and so the calculation is usually based on royalty cash flows projected over the
entire useful life of the asset (finite or indefinite lifetime). IP assets that are licensed
for a period of time (often several years) in return for an upfront payment, have a
clear finite useful lifetime. One advantage of the relief from royalty method is that it
can also be used to consider the value of such a license (by capitalising projected cash
flows over the license period only).
In general, there are two commonly used ways of establishing an appropriate royalty
rate:
Comparable royalty approach,
Economic benefits analysis.
European Commission
Study on the Application of Economic Valuation Techniques for Determining Transfer Prices of Cross Border Transactions between Members of Multinational Enterprise
Groups in the EU
September 2016 – 177
- Comparable royalties approach
The comparable royalties approach is often regarded as the best approach for
establishing a suitable royalty rate. Negotiations between willing licensors and willing
licensees, in like circumstances, will, at least in theory, provide the best available
information about the level of an appropriate royalty for the IP in question.
In practice, however, it may not be possible to identify perfect comparables. In this
case, it may be necessary to adjust the comparables available to reflect important
differences, taking into consideration factors such as the IP being licensed, specific
rights of use granted to the licensee, specific terms of the license, etc. In practice, it
can be challenging to identify even imperfect comparables for many IP assets.
- Economic benefits approach to determining an appropriate royalty rate
This approach builds on the premise that IP generally provides, or is intended to
provide, an economic benefit to the user and an appropriate royalty is a means to
share this benefit between the user of the IP and its owner. This approach is most
useful when it is possible to identify the specific economic benefits created through
use of the IP. A royalty rate can then be derived by considering how these benefits
should be shared between licensor and licensee.
The economic benefit created through use of the IP is the incremental benefit a
business derives through using the IP, compared with using the next best alternative.
In many cases, it is difficult to measure this incremental benefit. In such
circumstances, it is possible instead to consider the overall profits a business derives
from the operations that utilise the IP (the ‘available profits’), and to consider how
these are shared between licensor and licensee.
The appropriate split of incremental benefits, or overall profits, between licensor and
licensee will depend on the costs incurred, assets contributed, risks borne, and the
functions performed by each party. It is particularly important, when dividing overall
available profits (as opposed to specific incremental benefits), to take into account the
other assets that contribute to earning the profits of the business, and which party is
providing these.
***
In the present study, for a number of reasons, the focus is placed on the comparable
royalties approach within the relief of royalty method. The economic benefit approach
requires identification of the profits attributable to IP and then some kind of profit split
of this profit. The methods based on identification of profits attributable to IP
reviewed in this study are the premium profit and the residual value methods
described below.
The selection of the appropriate royalty (necessary for the selected variant of the
method) should consider the characteristics of the subject intangible asset and the
environment in which it is utilised. The consideration of these characteristics form the
basis for selection of a royalty rate within a range of observed transactions.
Factors that should be considered include the competitive environment, the
importance of the subject intangible to the owner, and the life cycle of the subject
intangible.
Data required
The following valuation inputs may be required in the relief from royalty method:

European Commission
Study on the Application of Economic Valuation Techniques for Determining Transfer Prices of Cross Border Transactions between Members of Multinational Enterprise
Groups in the EU
September 2016 – 178
Estimate of hypothetical royalty rate that would be paid if the assets were licensed
from a third party;
Projections for the royalty base, e.g. revenues that the royalty rate would be
applied to over the life of the IP;
An estimate of the remaining useful life of the IP (numbers of years or indefinite
period);
The cost of marketing and any other costs that would be borne by a licensee in
utilising the asset;
An appropriate discount rate (or weighted average cost of capital), taking risk into
account, by which to obtain the present value of these future, hypothetical royalty
savings;
Rate at which tax deduction would be obtainable on hypothetical royalty
payments;
Calculation of the tax amortisation benefit (“TAB”). In most cases, the acquirer of
individual intangible assets is able to offset the amortisation of the identifiable
intangible assets against tax. This creates a tax amortisation benefit that increases
the value of the intangible asset. Under the most usual interpretation of IFRS, TAB
has to be added to the intangible asset valuation as if the asset was acquired on a
stand-alone basis. As such, TAB can apply even when the actual transaction
structure does not allow tax amortisation, on the basis that a sale of individual
assets would generate amortisation.
Potential sources of input data
The following sources of data may be used in the relief-from-royalty method:
Financial reports and data of the Company utilising the IP;
Sales data, forecasted sales data of products and services with an IP component;
Market research data and documents;
Databases of license agreements;
IP valuation professionals;
IP transfer professionals.
Application and examples of intangible assets
Examples of intangibles that could be valued using premium profits (in valuations not
limited to transfer pricing) are as follows:
Brand and trademarks;
Technology;
Know-how.
Practical example
See Example 1 in Appendix 2.B.

European Commission
Study on the Application of Economic Valuation Techniques for Determining Transfer Prices of Cross Border Transactions between Members of Multinational Enterprise
Groups in the EU
September 2016 – 179
2 – Premium Profit
Introduction
The premium profit, or incremental income, is a method which indicates the value of
an IP asset by comparing an estimate of the profits or cash flows in two scenarios:
(i) profits that would be earned by a business using the asset; and
(ii) profits that would be earned by a business that does not use the asset (‘with and
without’).
The forecast incremental profits or cash flows achievable through use of the asset are
then calculated. Forecast periodic amounts are brought to a present value through use
of either a suitable discount factor or suitable capitalisation multiple.
Variations of the method
The comparison of the two scenarios can be done in two ways:
Calculating the value of the business under each scenario (with and without) and
determining the value of the subject intangible asset as a difference between
business value “with the asset” and “without the asset”; or
Calculating, for each future period, the difference between the profits in the two
scenarios. The present value of those amounts is then used to reach the value of
the subject intangible asset.
In theory, either variation should reach a similar value for the intangible asset
provided the valuer considers not only the impact on the entity’s profit, but also
additional factors such as differences between the two scenarios in working capital
needs and capital expenditures.
Also, in both variants, the values may need to be probability-weighted. For example,
when valuing a non-competition agreement, the value corresponding to the profits
without the asset should account for probability that an individual or business subject
to the agreement may choose not to compete.
***
The present study focuses on the second variation of the method. More precisely, a
particular version of the method is investigated which implies that difference in profits
is driven by the difference in price between the products containing the intangible and
their “generic” equivalent. In this respect, the effect of a lower price may also have
implications on the volumes of the products forecasted for the purposes of estimating
free cash flow.
Data required
The following valuation inputs may be required in the premium profits method:
Forecast periodic profit, cost savings or cash flows expected to be generated by a
market participant using the intangible asset (such as, for instance, prices and
volumes for the products containing the intangible asset);
European Commission
Study on the Application of Economic Valuation Techniques for Determining Transfer Prices of Cross Border Transactions between Members of Multinational Enterprise
Groups in the EU
September 2016 – 180
Similarly, forecast of periodic profit, cost savings or cash flows expected to be
generated by a market participant not using the IP (for the variation of the method
reviewed in data, data on sales price and volumes of the products that do not
contain an intangible asset, i.e. generic substitute);
An appropriate capitalisation multiple or discount rate to capitalise forecast
periodic profit, and;
If appropriate and applicable, tax amortisation benefit.
Potential sources of input data
The following sources of data may be used in the premium profits method:
Financial reports and data of the organisation utilising the IP;
Sales data, forecasted sales (volumes and prices) and costs data of products and
services with an IP component;
Market research data and documents;
Any entities using similar or identical intangible assets for which information is
available publicly and;
Proprietary databases of the valuer.
Application and examples of intangible assets
In practice, the premium profit method can be used in the context of valuation of
intangible assets which correspond to the following criteria:
No observable markets;
The difference in cash flows (both revenue and costs) between the two scenarios,
with or without the intangible asset, can be identified;
The following examples could correspond to the above criteria and hence would be
valued using premium profits (in valuations not limited to transfer pricing):
Processes and technologies;
Brands and trademarks;
Non-competition agreements;
Franchises.
Practical example
See example 2 in the attached Appendix 2.B.
3 – Historical Costs and Replacement Costs
Introduction
Based on the cost approach, the value of the asset is based on the estimation of the
costs that are either incurred in the past to create the asset or that would be incurred

European Commission
Study on the Application of Economic Valuation Techniques for Determining Transfer Prices of Cross Border Transactions between Members of Multinational Enterprise
Groups in the EU
September 2016 – 181
today to re-create an asset. Both approaches seek to estimate the costs relevant for
the development of the subject IP.
Generally, the cost approach should be used as the primary basis for the valuation of
intangible assets only if the following criteria are met:
It would be possible for market participants to recreate an intangible asset of
similar utility to the subject asset;
There are no legal protections (e.g., patents, trademarks) or other barriers to
entry (e.g. trade secrets) preventing market participants from recreating an asset
of similar utility or profiting from such a recreated asset; and
The intangible asset could be recreated quickly enough that a market participant
would not be willing to pay a significant premium for the ability to use the subject
asset immediately.
Variations of the method
There are two main cost-based methodologies that can be applied to valuing IP:
Historical cost method measures the actual cost incurred in creating the IP in the
past, using the capitalisation factor to translate them in today’s euros,
Replacement cost method quantifies the estimated cost of replacing the IP or
creating an equivalent asset, by projecting the costs to be incurred. The costs will
be discounted to reflect today’s value.
Data required
The following valuation inputs are required in the excess earning method:
Either (i) all hypothetical costs needed to recreate the asset including materials
and labour (for the replacement cost) or (ii) the actuals costs incurred (historical
method);
Adjustment factors to reduce the replacement cost to the functional, economic,
and technological condition of the subject asset might be necessary as well;
Both methods might include a discount factor, either to capitalise actual costs
incurred in the past (‘capitalisation rate’) or to discount project cost incurred over
a longer period (discount rate).
Data sources
Company’s data on costs / estimation of costs
Market / industry research and documents
Application and examples of intangible assets
In valuations not limited to transfer pricing purposes, this method is commonly used
with respect to the following intangibles:

European Commission
Study on the Application of Economic Valuation Techniques for Determining Transfer Prices of Cross Border Transactions between Members of Multinational Enterprise
Groups in the EU
September 2016 – 182
Certain licenses and permits;
Certifications;
Internally-generated software; and
Workforce.
Practical example
See Example 3.A in Appendix 2.B to illustrate historical cost method and Example 3.B
in Appendix 2.B to illustrate replacement cost method.
4 – Residual value
Introduction
The residual value method takes, as its starting point, the value of a business as a
whole, and allocates it between the various assets employed in it proportionate to
their contribution to the overall value. Once part of the value of the business has been
allocated to its tangible assets, the residual value is considered relative to intangibles.
This approach is easier to apply where all the intangibles of the business are being
valued collectively. Where an individual IP is to be valued, it is necessary to allocate
the residual value identified among the various intangible assets employed in the
business. Although there are some methods that can be used to make such an
allocation, the data and techniques required to apply these methods reliably are often
unavailable. The residual value method is therefore most suited to a valuation of all
the intangible assets of a business.
Variations of the method
To obtain the residual value, the market value of tangible assets should, in theory, be
deducted from enterprise value (i.e. cash flows of the business as a whole). In
practice, the value of tangible assets is usually recorded in accounting statements
which are often the only source of data available. The accounting statements value
most assets at historical cost, which may result in the book value of assets being
lower than the market value. In such circumstances, the residual value calculated will
be overstated.
In the variation of this method that is reviewed in detail and included in the survey,
the “routine returns” to the functions are deducted, instead of market value of the
tangible assets. As such, a portion of the forecast profits is allocated to routine
business operations. The residual profit, obtained by deducting routine returns from
the total profit is deemed to represent a profit attributable to intangibles. As such, this
variant of the method is similar to premium profit method in the sense that the
routine return replaces the return of the business without any intangibles (the latter is
obtained from the Company directly when applying the premium profit method).
The key steps in the selected variant of the method are to:
Obtain a forecast of the whole business in which the studied IP is being used;
European Commission
Study on the Application of Economic Valuation Techniques for Determining Transfer Prices of Cross Border Transactions between Members of Multinational Enterprise
Groups in the EU
September 2016 – 183
Ascertain the market routine returns for the main functions of the business;
Deduct the value of routine returns to obtain the value of intangible assets (the
‘residual value/profit’); and
If there are separate intangibles to be valued, allocate the residual value among
the various intangibles (cfa below).
In this application of the method, market returns for the routine contributions should
be determined (based on comparables).
A variation of this method is the ‘Greenfield method’. Under the Greenfield method,
the value of the subject intangible is determined using cash flow projections that
assume the only asset of the business at the valuation date is the subject intangible.
All other tangible and intangible assets must be bought, built or rented and thus their
costs are inherently accounted for in obtained cash flow projections. As such, ‘buy,
built and rental costs’ associated with the other assets need to be identified in order to
apply the method appropriately.
Case of more than one intangible
Once the residual value has been estimated, it may be necessary to allocate it
between intangibles. In general valuation practice, this is done in one of the following
ways:
Value chain analysis, or
Market Reference points.
A value chain analysis requires an understanding of all the value-adding activities
undertaken by the business. From this analysis, the intangible assets that contribute
to the business (making profits) can be identified, and their relative importance is
estimated using benchmark returns for comparable companies. Where it is possible to
perform such an analysis, this method has the advantage of taking into account the
specific circumstances in which the IP is being used. The difficulty, however, can be to
perform this analysis in a quantitative rather than qualitative way.
An approach using market reference points is built on the assumption that other
comparable, companies which have performed a similar allocation exercise can act as
a reference point to allocate residual value. A situation in which companies often
perform such an analysis is when they acquire assets in a business combination
(M&A). However, the allocation of assets in an acquisition can be affected by
accounting practice, which can vary over time and from one jurisdiction to another,
and so care must be taken when interpreting the results of such an analysis.
***
In transfer pricing, as mentioned, the residual profit is obtained after deducting the
routine returns that are benchmarked based on the TNMM principles. The value of the
residual profit (i.e. profit after routine returns) is deemed to represent the aggregate
value of intangibles that are valued. (Exclusively) this variation of method is reviewed
in the context of the survey in the present study.
Data required
Forecast of profit or loss or cash flows for the business (or the full value of the
enterprise);

European Commission
Study on the Application of Economic Valuation Techniques for Determining Transfer Prices of Cross Border Transactions between Members of Multinational Enterprise
Groups in the EU
September 2016 – 184
Market returns / routine returns based on the comparables search (or the value of
identified assets);
If appropriate and applicable, a calculation of tax amortisation benefits, tax rate
and working capital changes;
Appropriate discount rate;
Benchmarks or appropriate ways to split the residual profit between separate
assets (or different IP owners) if necessary.
Potential sources of input data
Financial reports and data of the organisation utilising the IP;
Forecast period profit, costs or cash flow of the business;
Market research data and documents;
Databases with companies data by industries and other classifications.
Proprietary databases of the valuer.
Application and example of intangible assets
In practice, the residual method can be used in the context of valuation of intangible
assets which correspond to the following criteria:
No observable market data (preventing the use of relief from profits or premium
profits method) or ability to replace independently (preventing the use of cost
based methodologies);
Cash flows or profits (related to the intangibles) and fair returns to other functions
can be identified.
Several examples which may be valued using premium profits (in valuations not
limited to transfer pricing purposes) are listed below:
Customer relationship;
Vendor relationship;
Technology;
IPR&D;
Order Backlog;
Licenses.
Practical example
See Example 4 in Appendix 2.B.
European Commission
Study on the Application of Economic Valuation Techniques for Determining Transfer Prices of Cross Border Transactions between Members of Multinational Enterprise
Groups in the EU
September 2016 – 185
5 – Excess earnings
Introduction
The excess earnings method determines the value of IP as the present value of the
cash flows attributable to the subject IP after excluding the proportion of the cash
flows that are attributable to other assets. It is a method that is often used for
valuations used in financial reporting when there is a requirement for the acquirer to
allocate the overall price paid for a business between tangible assets, identifiable
intangible assets, and goodwill.
The excess-earnings method should generally be applied only to a single intangible
asset for any given stream of revenue and income (generally the primary or most
important intangible asset). For example, in valuing the intangible assets of a
company utilising both technology and a tradename in delivering a product or service
(i.e. the revenue associated with the technology and the tradename is the same) the
excess earnings method should only be used to value one of the intangible assets and
an alternative method should be used to value the other. However, if the company
had multiple product lines each using a different technology and each generating
distinct revenue and profit, the excess earnings method could be applied in the
valuation of the multiple different technologies.
Variations of the method
The excess earnings method can either be applied using several periods of forecast
cash flows i.e. the “multi-period excess earnings method” or using a single period of
forecast cash flows i.e. the “single-period excess earnings method”. The single-period
excess earnings method is only appropriate for intangibles that will be used/consumed
in a single period. As most intangible assets have economic lives exceeding one
period, frequently follow non-linear growth/decay patterns, and may require different
levels of contributory assets over time, the multi-period excess earnings method or
MPEEM is the most commonly used excess earnings method as it offers the most
flexibility and allows valuers to explicitly forecast changes in such inputs.
***
The method is similar to the residual value method addressed earlier. The main
distinct feature is that instead of deducting a routine return to business functions, the
returns to the contributory assets are deducted from overall business profits.
Data required
The following valuation inputs are required in the excess earning method:
Forecast cash flows obtainable from the business to which the subject intangible
asset contributes to cash flows – this will involve allocating both income and
expenses appropriately to the pertinent business or group of assets of the entity
that includes all the income derivable from the subject intangible asset;
Fair returns / contributory asset charges in respect of all other assets in such
business(es), including other intangible assets;
An appropriate discount rate to enable expected cash flows attributable to the
subject IP alone to be brought to a present value; and
If appropriate and applicable, a calculation of tax amortisation benefits.

European Commission
Study on the Application of Economic Valuation Techniques for Determining Transfer Prices of Cross Border Transactions between Members of Multinational Enterprise
Groups in the EU
September 2016 – 186
Potential sources of input data
The following sources of data may be used in the premium profits method:
Sales data, forecasted sales data of products and services with an IP component;
Market research data and documents;
Financial reports and data of the organisation utilising the IP.
Application and examples of intangible assets.
As with the residual value methods, in practice, the excess earning method can be
used in the context of valuation of intangible assets which correspond to the following
criteria:
No observable markets or ability to replace independently;
Cash flows (related to that specific asset) and fair returns to other assets can be
identified.
Examples which could correspond to the above criteria and hence may be valued using
premium profits (in valuations not limited to transfer pricing purposes) are:
Customer relationship;
Vendor relationship;
Technology;
IPR&D;
Order Backlog;
Licenses.
Practical example
See example 5 in the attached Appendix 2.B

European Commission
Study on the Application of Economic Valuation Techniques for Determining Transfer Prices of Cross Border Transactions between Members of Multinational Enterprise
Groups in the EU
September 2016 – 187
Appendix 2.B – Examples for valuation methodologies
Abbreviations used in Examples 1 - 5
CAC Contributory asset charge
COGS Costs of goods sold
EBIT Earnings before income taxes
EBITDA Earnings before income taxes and depreciation
FA Fixed assets
FCF Free cash flows
FV Fair value
G&A General and administrative expenses (operating expenses)
LT growth rate Long-term growth rate
NWC Net working capital
RUL Remaining useful life
ST growth rate Short-term growth rate
TAB
TV
WC Working capital
Tax amortisation benefit (TAB) refers to the net present value of income tax savings resulting from the tax-deductible
amortisation of intangible assets. Applying TAB results in an intangible value in between pre- and post-tax.
Terminal value (TV) represents the present value of cash flows in perpetuity, growing at the long-term growth rate. It is
calculated using the Gordon growth model (Expected cash flows in the year following detailed forecast divided by discount
rate minus growth factor).
The examples in this Appendix are provided for illustration purposes only. They are not intended to provide any guidance on the selection of the
transfer pricing method or the values of parameters used for application of the method or their arm’s length character, but only to illustrate a
possible way of application of the valuation technique. The context of each example is based on a broad experience of valuations of IP in
various cases not specific to transfer pricing. It has been modified in several cases to protect client confidentiality, and hence may not fully
reflect an actual situation. Relevant figures have also been modified.

European Commission
Study on the Application of Economic Valuation Techniques for Determining Transfer Prices of Cross Border Transactions between Members of Multinational Enterprise
Groups in the EU
September 2016 – 188
Example 1. Valuation of a Tradename with the Relief from Royalty Method
Model hypotheses
Discount rate 7.0%
Tax rate 33.0%
Royalty rate² 1.0%
IP life Indefinite
LT growth rate 1.0%
Tax Amortisation Benefit (TAB)1 1.00
2016 2017 2018 2019 2020 TV3
Sales 1,000 1,050 1,103 1,158 1,216
Royalty "savings" 10 11 11 12 12
Taxes (3) (3) (4) (4) (4)
After-tax Royalty "savings" 7 7 7 8 8
Terminal Value 137
Discount periods 0.5 1.5 2.5 3.5 4.5 4.5
Discount factor 0.97 0.90 0.84 0.79 0.74 0.74
Present value 6 6 6 6 6 101
Total present value 132
TAB factor 1.00
Total value 132
1The TAB factor is 1 (multiplicative) since the remaining useful life is indefinite and hence we assume that the
intangible cannot be
The example is for illustration only and not intended to provide any guidance on the selection of model input
values or hypotheses (or their arm's length character).
² Royalty rates can vary significantly depending on sector and type of brand (consumer or B2B brand). Materially
higher and lower royalty rates may apply in different situations.
3 Terminal value is calculated by dividing the cash flows in 2021 by discount rate minus growth factor).
Context:
In the context of an audit review of a global food retailer, we reviewed several tradenames in use for US and Europe. The relief from royalty method is the most used method to value tradenames and was also
the method selected by the client given that similar agreements could be found in databases.
The client provided a five year business plan to which we applied a royalty rate of 1.0%. The royalty rate
was provided by the client and was based on review of similar agreements in databases such as Royaltysource and Royaltystat.
The cost method was not relevant given that the costs required to develop the tradenames could not be quantified. Residual value method and excess earnings methods were deemed too complex because we could not identify and value all other intangibles of the company and hence isolate the value to be
attributed to the tradename. Premium profit was too complex because we were not able to estimate the company cash flows without its tradenames.

European Commission
Study on the Application of Economic Valuation Techniques for Determining Transfer Prices of Cross Border Transactions between Members of Multinational Enterprise
Groups in the EU
September 2016 – 189
Example 2.Valuation of Technology with Premium Profits method
Model hypotheses
Discount rate 9.0%
Tax rate 25.0%
LT Growth rate 2.0%
Avg. Pricing of products with Technology 118€
Avg. Pricing of products w/o Technology 100€
RUL1 7
TAB 1.23
1RUL is set to 7 years for this example (within a reasonable range for technology assets)
FCF with Technology 2016 2017 2018 2019 2020 2021 2022
Volume 10 11 11 12 12 13 13
Price 118 118 118 118 118 118 118
Sales 1,180 1,239 1,301 1,366 1,434 1,506 1,581
COGS (708) (743) (781) (820) (861) (904) (949)
Gross margin 472 496 520 546 574 602 633
G&A (236) (248) (260) (273) (287) (301) (316)
EBITDA 236 248 260 273 287 301 316
Depreciation (59) (62) (65) (68) (72) (75) (79)
EBIT 177 186 195 205 215 226 237
Capex (83) (87) (91) (96) (100) (105) (111)
Change in WC (6) (6) (7) (7) (7) (8)
Add back depreciation 59 62 65 68 72 75 79
Tax on EBIT (44) (46) (49) (51) (54) (56) (59)
FCF 109 109 114 120 126 132 139
Context:
Our client was a company active in food processing sector and used technologies which were publicly known/ available. They further developed a new technology internally which aimed to increase product quality. To manage
R&D more efficiently, they contributed the technology in a new entity and hence requested valuation advice.
No similar royalty license could be found in the market due to the uniqueness of the technology. We hence selected
the premium profit method given the possible comparison between existing public technology and the newly developed technology. In practice, the comparison was carried out using different pricing for products with and w/o the new technology (provided by the client) leading to higher cash flows with the new technology.
The royalty saving method was not used because no comparable agreements were found. The cost method could not been used either as the client did not have detailed data on past spending / investment related to the new
technology development.

European Commission
Study on the Application of Economic Valuation Techniques for Determining Transfer Prices of Cross Border Transactions between Members of Multinational Enterprise
Groups in the EU
September 2016 – 190
FCF without Technology 2016 2017 2018 2019 2020 2021 20221Volume 10 11 11 12 12 13 13 2Price 100 100 100 100 100 100 100
Sales 1,000 1,050 1,103 1,158 1,216 1,276 1,340 3COGS (600) (630) (662) (695) (729) (766) (804)
Gross margin 400 420 441 463 486 511 536 4G&A (200) (210) (221) (232) (243) (255) (268)
EBITDA 200 210 221 232 243 255 268
Depreciation (50) (53) (55) (58) (61) (64) (67)
EBIT 150 158 165 174 182 191 201
5Capex (70) (74) (77) (81) (85) (89) (94)
Change in WC (5) (5) (6) (6) (6) (6)
Add back depreciation 50 53 55 58 61 64 67
Tax on EBIT (38) (39) (41) (43) (46) (48) (50)
FCF 93 92 97 102 107 112 118
1Volume is not deemed to be impacted by technology in the example (but may vary in other cases).2Prices are impacted by technology in the example.3COGS is the same.4Marketing and sales costs are assumed to be similar in this example (but may vary in other cases).5Capex are assumed to be similar in % of revenues (but may vary in other cases).
Technology value2016 2017 2018 2019 2020 2021 2022
FCF using Technology 109 109 114 120 126 132 139
FCF without Technology 93 92 97 102 107 112 118
Difference 17 17 17 18 19 20 21
Discount periods 0.5 1.5 2.5 3.5 4.5 5.5 6.5
Discount factor 0.96 0.88 0.81 0.74 0.68 0.62 0.57
Present value 16 15 14 14 13 13 12
Total Present value 96
TAB 1.23
Total value 118
The example is for illustration only and not intended to provide any guidance on the selection of model input values or
hypotheses (or their arm's length character).
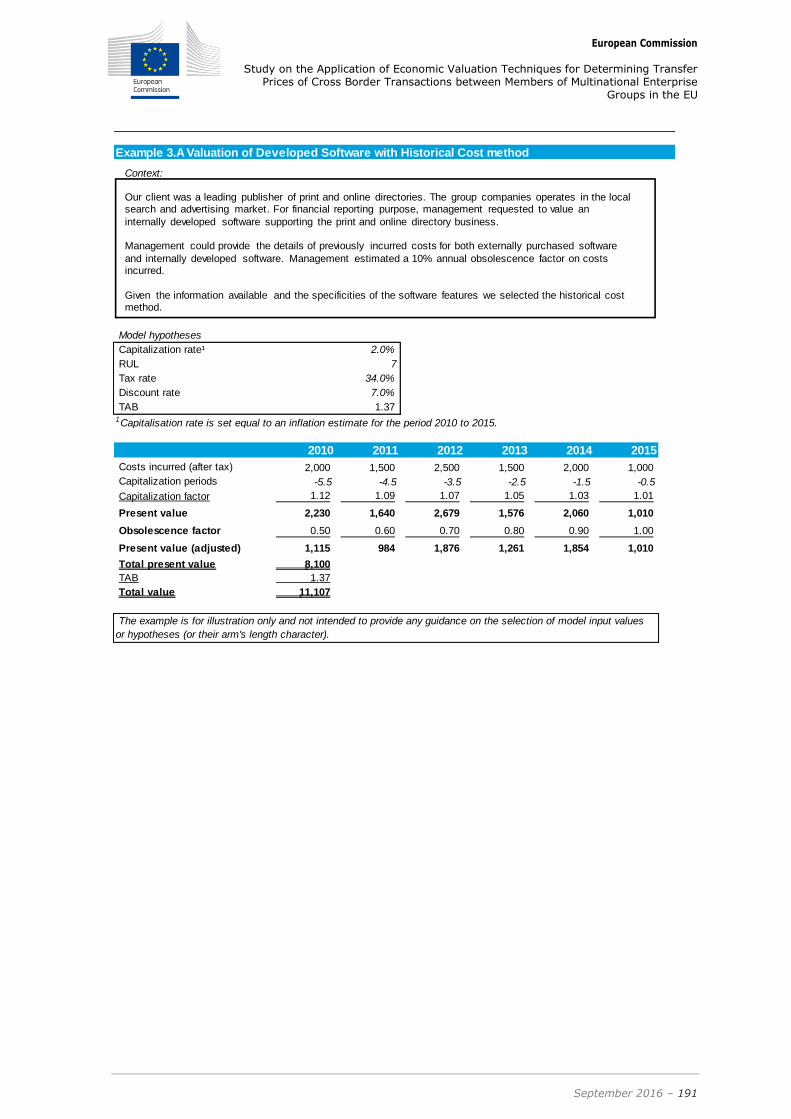
European Commission
Study on the Application of Economic Valuation Techniques for Determining Transfer Prices of Cross Border Transactions between Members of Multinational Enterprise
Groups in the EU
September 2016 – 191
Example 3.A Valuation of Developed Software with Historical Cost method
Model hypotheses
Capitalization rate¹ 2.0%
RUL 7
Tax rate 34.0%
Discount rate 7.0%
TAB 1.37 1Capitalisation rate is set equal to an inflation estimate for the period 2010 to 2015.
2010 2011 2012 2013 2014 2015
Costs incurred (after tax) 2,000 1,500 2,500 1,500 2,000 1,000
Capitalization periods -5.5 -4.5 -3.5 -2.5 -1.5 -0.5
Capitalization factor 1.12 1.09 1.07 1.05 1.03 1.01
Present value 2,230 1,640 2,679 1,576 2,060 1,010
Obsolescence factor 0.50 0.60 0.70 0.80 0.90 1.00
Present value (adjusted) 1,115 984 1,876 1,261 1,854 1,010
Total present value 8,100
TAB 1.37
Total value 11,107
The example is for illustration only and not intended to provide any guidance on the selection of model input values
or hypotheses (or their arm's length character).
Context:
Our client was a leading publisher of print and online directories. The group companies operates in the local search and advertising market. For financial reporting purpose, management requested to value an
internally developed software supporting the print and online directory business.
Management could provide the details of previously incurred costs for both externally purchased software
and internally developed software. Management estimated a 10% annual obsolescence factor on costs incurred.
Given the information available and the specificities of the software features we selected the historical cost method.

European Commission
Study on the Application of Economic Valuation Techniques for Determining Transfer Prices of Cross Border Transactions between Members of Multinational Enterprise
Groups in the EU
September 2016 – 192
Model hypotheses
Discount rate 7%
RUL 5
Tax rate 34.0%
Discount rate 7.0%
TAB 1.41
2016 2017
Development hours 300 400
Cost per hour (after tax) 200 200
Costs to incur1 60,000 80,000
Capitalization periods 0.5 1.5
Capitalization factor 0.97 0.90
Present value 58,004 72,279
Total present value 130,284
TAB 1.41
Total value 183,087
1If the asset takes a significant period to replace, opportunity costs may need to be factored in the valuation
Example 3.B Valuation of Developed Software with Replacement Cost method
The example is for illustration only and not intended to provide any guidance on the selection of model input values
or hypotheses (or their arm's length character).
Context:
Our client was a company which owns, amongst others, a software used to run the fiber optic network of a commune. The network was operated by a third party.
For strategic purposes, the compnay intended to sell the software to, at the time, a related company.
In order to estimate the floor price of the software, our client asked us specifically to apply a replacement
costs method. They provided us with estimated devopment hours as well as costs to incur if the software was to be redeveloped.
In the example, the client had no information about historical spend incurred to developed the software due to a lack of follow up, hence we could not use a historic cost method.

European Commission
Study on the Application of Economic Valuation Techniques for Determining Transfer Prices of Cross Border Transactions between Members of Multinational Enterprise
Groups in the EU
September 2016 – 193
Model hypotheses
Discount rate 9.0%
Tax Rate 33.0%
LT Growth rate 1.0%
RUL1 10
Routine return (operating margin, i.e. return on sales) 3.0%
TAB 1.28 1RUL is set to 10 years for this example (within a reasonable range for technology assets)
2016 2017 2018 2019 2020 2025
Sales 1,000 1,050 1,103 1,158 1,216 1,551
COGS (600) (630) (662) (695) (729) (931)
Gross margin 400 420 441 463 486 621
G&A (200) (210) (221) (232) (243) (310)
EBITDA 200 210 221 232 243 310
Depreciation (40) (42) (44) (46) (49) (62)
EBIT 160 168 176 185 194 248
EBIT as % of revenues 16% 16% 16% 16% 16% 16%
Routine return (for operating non-
intangible generating activities) 30 32 33 35 36 47
Residual profit 130 137 143 150 158 202
(attributable to Intangibles)
Capex (30) (32) (33) (35) (36) (47)
Change in WC (10) (10) (11) (11) (12) (15)
Add back depreciation 40 42 44 46 49 62
Tax (on EBIT) (53) (55) (58) (61) (64) (82)
Free Cash Flows 77 82 86 90 94 121
Discount periods 0.5 1.5 2.5 3.5 4.5 9.5
Discount factor 0.96 0.88 0.81 0.74 0.68 0.44
Present value 74 72 69 67 64 53
Total present value 632
TAB 1.28
Total present value 811
The example is for illustration only and not intended to provide any guidance on the selection of model
input values or hypotheses (or their arm's length character).
Example 4. Example of Trademark and Know-How valuation with Residual Value method
Context:
The client was a company which had to value its intangible property consisting of a franchise that included a tradename and know-how concerning a mode of operation of the retail shops. The franchise was granted to the
entities of the group that operated as retail shops.
The approach to value the intangible assets consisted in determining the return on operating non-intangible
generating activities to be earned by the group entities which were to be deducted from combined profit at the EBIT level of these entities. The value of the IP would then be equal to the discounted present value of the residual profit (i..e total EBIT minus routine profit). The remaining useful life of the asset was set at 10 years.
Other valuation methods were not used due to the lack of relevant information. The relief from royalty method was not used since there were no agreements that could be identified covering the same scope of intangible
(tradename in combination with know-how) in the relevant sector. The cost-based methods were considered not appropriate since the development costs did not reflect the value of the fully developed IP generating profits.

European Commission
Study on the Application of Economic Valuation Techniques for Determining Transfer Prices of Cross Border Transactions between Members of Multinational Enterprise
Groups in the EU
September 2016 – 194
Example 5. Customer Contracts and Relationships valuation with Excess Earnings method
Model hypotheses Budget hypotheses
Discount rate 10.0% ST Growth 5.0%
Tax rate 33.0% COGS / Revenues 60.0%
Customer attrition rate 20.0% Operations / Exist. Cust. Rev. 10.0%
Remaining useful life 8.00 G&A / Exist. Cust. Rev. 5.0%
TAB 1.30 Depr. / Exist. Cust. Rev. 9.0%
CAC calculation
Cost of capital hypotheses
Discount rate 10.0%
Post tax cost of debt 3.1%
Additional return FA 4.0%
Additional return NWC 1.0%
% of sales due to CR1 25.0% 1Customer relationships
Assets Return Fair value FV attribut.
to CRCAC
CAC (% of
sales)
Comment
s2016 Sales due to CR 1,000
Fixed assets 7.1% 2,500 625 44.3 4.4%
Brand 10.0% 1,000 250 25.0 2.5%
Net working capital 4.1% 950 238 9.7 1.0%
Workforce 10.0% 550 138 13.8 1.4%
Return on contributory assets 9.3%
Context:
The client was a downstream oil company with a tank-stations network. The company was optimizing their operations and they wanted to value the fuel cards of the tank stations network in order to centralize the relevant intangibles in one locations.
Fuel cards drive value and are considered intangible assets related to customer contracts and relationships.In order to estimate the value of the fuel cards we used a excess earnings method. The approach to calculate the value of thefuel cards consisted in deducting the contributory assets charge from the EBIT of the company (and hence isolating the
excess earnings representing the portion of total profits attributable to the fuel cards). The contributory charge of each tangible asset class was calculated based on a fair return on the asset converted in a percentage of sales.
Other valuation methods were not used due to the lack of relevant information (profit differential, historical cost incurred, etc).

European Commission
Study on the Application of Economic Valuation Techniques for Determining Transfer Prices of Cross Border Transactions between Members of Multinational Enterprise
Groups in the EU
September 2016 – 195
Customer relationship 2016 2017 2018 2019 2020 2021 2022 2023
Total sales 4,000 4,200 4,410 4,631 4,862 5,105 5,360 5,628
Revenues attributed to CR 1,000 1,050 1,103 1,158 1,216 1,276 1,340 1,407
Annual customer attrition 80% 64% 51% 41% 33% 26% 21% 17%
Existing customer sales 800 672 564 474 398 335 281 236
COGS (480) (403) (339) (284) (239) (201) (169) (142)
Operations (80) (67) (56) (47) (40) (33) (28) (24)
G&A (40) (34) (28) (24) (20) (17) (14) (12)
EBITDA 200 168 141 119 100 84 70 59
Depreciation (72) (60) (51) (43) (36) (30) (25) (21)
EBIT 128 108 90 76 64 54 45 38
Tax (42) (35) (30) (25) (21) (18) (15) (12)
Contributory asset charge 74 62 52 44 37 31 26 22
Fixed assets 35 30 25 21 18 15 12 10
Brand 20 17 14 12 10 8 7 6
WC 8 7 5 5 4 3 3 2
Workforce 11 9 8 7 5 5 4 3
Earning after taxes and CAC 12 10 8 7 6 5 4 3
Discount periods 0.5 1.5 2.5 3.5 4.5 4.5 4.5 4.5
Discount factor 0.95 0.87 0.79 0.72 0.65 0.65 0.65 0.65
Present value 11 8 6 5 4 3 3 2
Total present value 42
TAB factor 1.30
Total Value 55
The example is for illustration only and not intended to provide any guidance on the selection of model input values or hypotheses (or
their arm's length character).

European Commission
Study on the Application of Economic Valuation Techniques for Determining Transfer Prices of Cross Border Transactions between Members of Multinational Enterprise
Groups in the EU
September 2016 – 196
Appendix 3 – Description of OECD methodologies
The description contained in this document is based on the Transfer Pricing Guidelines
for Multinational Enterprises and Tax Administrations issued by Organisation for
Economic Cooperation and Development (“OECD”) in 2010 as well as all consequent
papers, discussion papers and final deliverables of the OECD pertaining to the “Base
Erosion and Profit Shifting (“BEPS”) initiative.
1 – Arm’s length principle
The principles set forth by the OECD state that transactions between related parties
should be consistent with the arm’s length standard. In particular, the statement of
the arm’s length principle can be found in paragraph 1.6 of the 2010 OECD Transfer
Pricing Guidelines for Multinational Enterprises and Tax Administrations:
“The authoritative statement of the arm's length principle is found in paragraph 1 of
Article 9 of the OECD Model Tax Convention, which forms the basis of bilateral tax
treaties involving OECD Member countries and an increasing number of non-Member
countries. Article 9 provides:
"[Where] conditions are made or imposed between two [associated] enterprises in
their commercial or financial relations which differ from those which would be made
between independent enterprises, then any profits which would, but for those
conditions, have accrued to one of the enterprises, but, by reason of those conditions,
have not so accrued, may be included in the profits of that enterprise and taxed
accordingly."
“By seeking to adjust profits by reference to the conditions which would have obtained
between independent enterprises in comparable transactions and comparable
circumstances (i.e. in “comparable uncontrolled transactions”), the arm’s length
principle follows the approach of treating the members of an MNE group as operating
as separate entities rather than as inseparable parts of a single unified business.
Because the separate entity approach treats the members of an MNE group as if they
were independent entities, attention is focused on the nature of the transactions
between those members and on whether the conditions thereof differ from the
conditions that would be obtained in comparable uncontrolled transactions. Such an
analysis of the controlled and uncontrolled transactions, which is referred to as a
“comparability analysis”, is at the heart of the application of the arm’s length
principle.”
In determining the most appropriate measure of an arm’s length result, the following
factors should be considered:
Degree of comparability between controlled and uncontrolled transactions;
Quality of data and assumptions.
The degree of comparability is assessed by:
Functions;
Contractual terms;
Risks;

European Commission
Study on the Application of Economic Valuation Techniques for Determining Transfer Prices of Cross Border Transactions between Members of Multinational Enterprise
Groups in the EU
September 2016 – 197
Economic conditions;
Nature of goods and services supplied.
The quality of data and assumptions is assessed by:
Completeness and accuracy of data;
Reliability of assumptions;
Sensitivity of results to deficiencies in data and assumptions.
The arm’s length amount charged in a controlled transaction must be tested under one
of the following methods: comparable uncontrolled price method, resale price method,
cost plus method, transactional net margin method, profit split method, or unspecified
methods that are in line with the arm’s length standard (e.g. modified resale price or
cost plus method).
2 – Overview of transfer pricing methods Comparable Uncontrolled Price (“CUP”) method
According to paragraph 2.13 of the 2010 OECD report, the comparable uncontrolled
price (hereafter: “CUP”) method compares amounts charged in controlled transactions
with amounts charged in comparable third party transactions. Comparable sales may
be between two third parties or between one of the related parties and a third party.
The CUP method is generally the most reliable measure of arm’s length results if
transactions are identical or if only minor, readily quantifiable differences exist. The
CUP method requires a high degree of comparability of products and functions.
Comparability can be achieved by a reasonable number of adjustments, which do not
materially affect the comparable price. Adjustments likely to be required include those
for differences in:
Product quality;
Contractual terms;
Geographic market;
Embedded intangibles;
Foreign currency risks.
Resale Price method
The resale price method evaluates whether the amount charged in a controlled
transaction is at arm’s length by reference to the gross margin realised in comparable
uncontrolled transactions.
According to paragraph 2.21 of the 2010 OECD report, “The resale price method
begins with the price at which a product that has been purchased from an associated
enterprise is resold to an independent enterprise. This price (the resale price) is then
reduced by an appropriate gross margin on this price (the “resale price margin”)
representing the amount out of which the reseller would seek to cover its selling and
other operating expenses and, in the light of the functions performed (taking into
European Commission
Study on the Application of Economic Valuation Techniques for Determining Transfer Prices of Cross Border Transactions between Members of Multinational Enterprise
Groups in the EU
September 2016 – 198
account assets used and risks assumed), make an appropriate profit. What is left after
subtracting the gross margin can be regarded, after adjustment for other costs
associated with the purchase of the product (e.g. customs duties), as an arm’s length
price for the original transfer of property between the associated enterprises. This
method is probably most useful where it is applied to marketing operations.”
The resale price method is most often used for distributors that resell products without
physically altering them or adding substantial value to them.
This method requires detailed comparisons of functions performed, risks borne, and
contractual terms of controlled and uncontrolled transactions. As a result, a higher
degree of comparability is more likely to exist between controlled and uncontrolled re-
sales of property by the same reseller (i.e. internal resale price method). In the
absence of comparable uncontrolled transactions involving the same reseller, an
appropriate comparison may be derived from comparable uncontrolled transactions of
other resellers (i.e. external resale price method).
The resale price method is unlikely to lead to accurate results if there are differences
in:
Level of market;
Functions performed;
Products.
A reasonable number of adjustments may be made to compensate for the lack of
comparability between controlled and uncontrolled transactions in:
Inventory turnover;
Contractual terms;
Transport costs; and
Other measurable differences.
Cost Plus method
The cost plus method compares gross margins of controlled and uncontrolled
transactions.
According to paragraph 2.39 of the 2010 OECD report, “the cost plus method begins
with the costs incurred by the supplier of property (or services) in a controlled
transaction for property transferred or services provided to an associated purchaser.
An appropriate cost plus mark-up is then added to this cost, to make an appropriate
profit in light of the functions performed and the market conditions. What is arrived at
after adding the cost plus mark up to the above costs may be regarded as an arm's
length price of the original controlled transaction.”
The cost plus method is most often used to assess the mark-up earned by
manufacturers selling to related parties.
This method requires detailed comparisons of products produced, functions performed,
risks borne, manufacturing complexity, cost structures and intangibles between

European Commission
Study on the Application of Economic Valuation Techniques for Determining Transfer Prices of Cross Border Transactions between Members of Multinational Enterprise
Groups in the EU
September 2016 – 199
controlled and uncontrolled transactions. Comparability is most likely found among
controlled and uncontrolled sales of property by the same seller (i.e., internal cost plus
method). In the absence of such sales, an appropriate comparison may be derived
from comparable uncontrolled sales of other producers (i.e., external cost plus
method).
The cost plus method is less likely to be reliable if material differences exist between
the controlled and uncontrolled transactions with respect to:
Intangibles;
Cost structure;
Business experience;
Management efficiency;
Functions performed;
Products.
A reasonable number of adjustments may be made to compensate for the lack of
comparability between controlled and uncontrolled transactions in:
Inventory turnover;
Contractual terms;
Transport costs;
Other measurable differences.
Transactional profit split method
The transactional profit split method allocates operating profits or losses from
controlled transactions in proportion to the relative contributions made by each party
in creating the combined profits or losses. Relative contributions may be determined
by functions performed, risks assumed, resources employed, and costs incurred.
According to paragraph 2.108 of the 2010 OECD report: “The transactional profit split
method first identifies the profit to be split for the associated enterprises from the
controlled transactions in which the associated enterprises are engaged (the
“combined profits”). It then splits those combined profits between the associated
enterprises on an economically valid basis that approximates the division of profits
that would have been anticipated and reflected in an agreement made at arm’s
length.”
The method is used where transactions are very interrelated and cannot be evaluated
on a separate basis. The method generally does not rely on closely related comparable
transactions and can therefore be used in cases when no such transactions can be
identified. Since under this method both parties are evaluated, it is less likely that
either party to the transaction is left with extreme and improbable profit results. Thus,
the method is particularly useful when analysing the contributions by parties in
respect of the intangible property employed or such issues as, for example, division of
profits from economies of scale or other joint efficiencies achieved by two related
parties.

European Commission
Study on the Application of Economic Valuation Techniques for Determining Transfer Prices of Cross Border Transactions between Members of Multinational Enterprise
Groups in the EU
September 2016 – 200
In practice, the transactional profit split method is generally used when entities on
both sides of the transaction contribute, to a large extent, to the creation of valuable
intangibles. Applying the profit split would mean splitting any (residual) profit between
the entities on both sides of the transaction.
The contribution of each party to the profit is determined by means of an analysis of
the functions performed, assets used, and risks assumed by the enterprise, and
valued to the extent possible by available reliable external market data (OECD
Guidelines, paragraph 2.108).
There are two approaches most commonly taken to divide the combined profits:
Contribution analysis; and
Residual analysis.
Applying the contribution analysis, the combined profits are divided between the
associated enterprises based on the relative value of the functions performed, assets
used, and risks assumed by each enterprise, supplemented as much as possible by
external market data that indicate how independent enterprises would have divided
profits in similar circumstances (OECD Guidelines, paragraph 2.119).
Applying the residual analysis, the combined profits are divided in two stages. In the
first stage, each participant is allocated sufficient profit to provide it with a basic
return appropriate for the type of routine activities in which it is engaged. Ordinarily,
this basic return would be determined by reference to the market returns achieved for
similar types of activities by independent entities and would generally not account for
the return that would be generated by any unique and valuable assets possessed by
the participants.
In the second stage, any residual profit (or loss) remaining after the first stage
division would be allocated among the parties based on an analysis of how this
residual would have been divided between independent enterprises (OECD Guidelines,
paragraph 2.121).
Transactional net margin method
According to paragraph 2.58 of the 2010 OECD report, “The transactional net margin
method examines the net profit relative to an appropriate base (e.g. costs, sales, and
assets) that a taxpayer realises from a controlled transaction (or transactions that are
appropriate to aggregate under the principles of paragraphs 3.9-3.12). Thus, a
transactional net margin method operates in a manner similar to the cost plus and
resale price methods. This similarity means that in order to be applied reliably, the
transactional net margin method must be applied in a manner consistent with the
manner in which the resale price or cost plus method is applied. This means in
particular that the net profit indicator of the taxpayer from the controlled transaction
(or transactions that are appropriate to aggregate under the principles of paragraphs
3.9-3.12) should ideally be established by reference to the net profit indicator that the
same taxpayer earns in comparable uncontrolled transactions, i.e. by reference to
“internal comparables” (see paragraphs 3.27-3.28). Where this is not possible, the net
margin that would have been earned in comparable transactions by an independent
enterprise (“external comparables”) may serve as a guide (see paragraphs 3.29-3.35).
A functional analysis of the controlled and uncontrolled transactions is required to
determine whether the transactions are comparable and what adjustments may be

European Commission
Study on the Application of Economic Valuation Techniques for Determining Transfer Prices of Cross Border Transactions between Members of Multinational Enterprise
Groups in the EU
September 2016 – 201
necessary to obtain reliable results. Further, the other requirements for comparability,
and in particular those of paragraphs 2.68-2.75, must be applied.”

European Commission
Study on the Application of Economic Valuation Techniques for Determining Transfer Prices of Cross Border Transactions between Members of Multinational Enterprise
Groups in the EU
June 2016 – 202
Appendix 4 – Valuation standards
Global Valuation Standards and Guidance
Standards Issuer Specific valuation cause Description Scope & perimeter Binding force Geography Types of assets
International Valuation standards (IVS)**IVSC Broadly applicable across
several valuation causes*
The IVS Framew ork includes generally accepted valuation concepts,
principles and definitions upon w hich the International Valuation
Standards are based.
The standards identify valuation methods that are commonly
used. The current version of the standards provides more
detailed technical guidance in separate commentary / technical
information papers, but the draft 2017 version of the standards
provides detailed technical guidance in the body of the
standards (at least IVS 210 - Intangible Assets).
IVS 101-102 General standards
IVS 200-250 Asset standards
IVS 300-310 Valuation applications
Voluntary adoption by its members. Where a
statement is made that a valuation w ill be or has
been undertaken in accordance w ith IVS, it is implicit
that all relevant individual standards are complied
w ith.
Global: 75 organisation in
membership across 50+
countries.
All.
ISO standards on brand and patents
valuation
ISO Broadly applicable across
several valuation causes*
ISO specif ies a framew ork for brand valuation, including objectives,
bases of valuation, approaches to valuation, methods of valuation
and sourcing of quality data and assumptions. It also specif ies
methods for reporting the results of such valuation.
This International Standard provides a consistent, reliable
approach to brand valuation, including f inancial, behavioural
and legal aspects.
ISO 10668:2010(en)
Voluntary adoption by its members. Global reach. Brand & Patent intangible assets.
European Valuation Standards and
Applications (blue book)
TeGoVA Broadly applicable across
several valuation causes*
EVS 2016 provides harmonised European standards, guidance and
technical information for use by all sectors of the European valuation
profession. Corporate governance and ethical considerations are
embedded w ithin the standards, confirming, for instance, that a
valuation produced in accordance w ith these standards is signed by
a qualif ied professional w hose experience, qualif ication, diligence
and ethical behaviour are appropriate to the instruction.
The standards cover valuation methods w ithout providing
detailed technical guidance
EVS (1-5) European Valuation Standards
EVA (1-8) European Valuation Applications
Voluntary adoption by its members. Mainly Europe: the members of
45 valuers’ associations from 26
countries representing the
membership of TEGoVA (The
European group of valuer's
associations).
Mainly real estate property
IFRS IASB Financial reporting The International Financial Reporting Standards (IFRS) are a set of
international accounting standards issued by the International
Accounting Standards Board stating how particular types of
transactions and other events should be reported in f inancial
statements. IFRS w ere established in order to have a common
accounting language, so business and accounts can be understood
from company to company and country to country.
IFRS are not valuation standards per se , but several of the
standards and interpretations address a w ide range of
technical valuation issues, including in respect of valuation
methods for intangible assets.
IFRS 1 - 16: International Financial Reporting Standards
IAS 1 - 41: International Accounting Standards
IFRIC 1 - 21: Interpretations
SIC 1 - 33: Interpretations
Compliance w ith standards is imposed by
government regulations (obligatory). Legally binding
for member states w hich have adopted it
E.g.: Binding in EU based on the Fourth Council
Directive and Seventh Council Directive.
Global: currently, standards are
adopted in 143 jurisdictions,
including all the G20
jurisdictions.
All (w here applicable, as set out
below ).
IFRS 13 provides the guidance on the
measurement of fair value. IFRS 13
applies w hen another IFRS requires or
permits fair value measurements or
disclosures about fair value
measurements.
OECD Transfer Pricing Guidelines for
Multinational Enterprises and Tax
Administrations.
OECD Transfer pricing The Transfer Pricing Guidelines for Multinational Enterprises and Tax
Administrations provide guidance on the application of the "arm's
length principle" for the valuation, for tax purposes, of cross-border
transactions betw een associated enterprises.
Guidelines on transfer pricing methods including some
valuation techniques. They do no prescribe a standard but
rather refer to acceptable valuation techniques.
The OECD Guidelines for Multinational Enterprises
are the most often used recommendations in
transfer pricing. Their usage is strongly encouraged
by the governing bodies of OECD member states.
The OECD does not aim these Guidelines to be
legally binding, rather to provide a useful framew ork
and foundation for proper transfer pricing.
How ever, effectively, the OECD Guidelines are
effectively adopted by many countries law s and
regulations.
34 Member countries span the
globe, from North and South
America to Europe and Asia-
Pacif ic. They include many of
the w orld’s most advanced
countries but also emerging
countries like Mexico, Chile and
Turkey.
OECD also w orks closely w ith
emerging economies like the
People's Republic of China, India
and Brazil and developing
economies in Africa, Asia, Latin
America and the Caribbean.
Intangible assets mainly.
*Other valuation purposes refers to commercial & strategic purposes (third party valuation), valuation for tax and transfer pricing, f inancial reporting, conflict related or other statutory & legal purposes.
**Note that IVSC is in the progress of updating its current standards.

European Commission
Study on the Application of Economic Valuation Techniques for Determining Transfer Prices of Cross Border Transactions between Members of Multinational Enterprise Groups in the EU
September 2016 – 203
Country Valuation Standards and Guidance
Name Valuation cause Description Scope & perimeter Binding force Geography Types of assets
USGAAP FASB Financial reporting The FASB Accounting Standards Codif ication is the source of
authoritative generally accepted accounting principles (USGAAP)
recognized by the FASB to be applied to an assortment of entities
w hich include privately held and publicly traded companies, non-
profit organizations, and governments
USGAAP are not valuation standards per se, but several of the
standards and interpretations address a w ide range of
technical valuation issues, including in respect of valuation
methods for intangible assets.
USGAAP 105: Generally accepted accounting principles
USGAAP 205 - 280: Presentation
USGAAP 305 - 480: Financial statement accounts
USGAAP 505: Equity
USGAAP 605 - 610: Revenue
USGAAP 705 - 740: Expenses
USGAAP 805 - 860: Broad transactions
USGAAP 905 - 995: Industry
Compliance w ith standards is imposed by
government regulations (obligatory).
United States All.
ASC 820, Fair Value Measurements and
Disclosures, applies to U.S. GAAP that
require or permit fair value
measurements or disclosures and
provides a single framew ork for
measuring fair value and requires
disclosures about fair value
measurement.
RICS (red book) Broadly applicable across
several valuation causes*
The standards set out procedural rules and guidance for valuers.
They not only cover matters relating to ethics and conduct, but also
establish a framew ork for uniformity and best practice in the
execution and delivery of valuations. The Red Book is a procedural
manual and not a valuation text book setting out methodology.
VS 1 Compliance and ethical requirements
VS 2 Agreement of terms of engagement
VS 3 Basis of value
VS 4 Applications
VS 5 Investigations
VS 6 Valuation reports
Voluntary adoption by its members. Mainly UK. All.
US PAP ASB Broadly applicable across
several valuation causes*
Uniform Standards of Professional Appraisal Practice (USPAP) can
be considered the quality control standards applicable for real
property, personal property, intangible assets, and business
valuation appraisal analysis and reports.
USPAP provides a minimum set of quality control standards for
conduct, it does not attempt to prescribe specif ic methods to
be used:
10 standards on real estate, personal property and business
valuation
Voluntary adoption by its members. Mainly United States. Real estate, personal property and
business valuation.
IDW S 5 Standard IDW Financial reporting IDW S5 is one of the several standards published by the Institute of
Public Auditors in Germany (IDW), a privately run organization w hich
aims to serve the interests of its members, i.e. the German Public
Auditors and German Public Audit f irms.
IDW standards are not valuation standards per se, but several
of the standards and interpretations address a w ide range of
technical valuation issues, including in respect of valuation
methods for intangible assets. The purpose of IDW S 5 is to
offer a general framew ork along w ith guidance on the
valuation of brands, w hile its format strongly resembles that of
business valuations, i.e. a process driven standard.
Voluntary adoption by its members: best practice. Germany Intangible assets.
DIN77100 Patent Valuation - General
Principles for Monetary Patent
Valuation
DIN Broadly applicable across
several valuation causes*
The standard regulating the monetary valuation of patents is
published by the German Institute for Standardization (DIN), an
organization entirely focused on the development of best practices
and standards to be used across different industries.
The standard of DIN 77100 provides a process driven
framew ork for patent valuation by specifying procedures,
methods, additional factors and assumptions influencing the
value, and assessment of data quality.
DIN is the sole national standardization body based
on the agreement w ith the Government of the
Federal Republic of Germany (legally binding).
Germany Patent valuation.
Business Appraisal Standards IBA Broadly applicable across
several valuation causes*
These principles-based Standards have been developed to provide
guidance to members and other valuation professionals performing
valuation services. The use of professional judgment is an essential
component of estimating value.
- General and ethical standards
- Development standards
- Reporting standards
- Review engagement development standards
- Business valuation review
- Review engagement reporting standards.
Voluntary adoption by its members. United States All.
AICPA SSVS AICPA Broadly applicable across
several valuation causes*
AICPA standards and guidance apply to all members w ho perform
consulting, litigation services, personal f inancial planning, tax and
accounting as w ell as valuation services for various purposes.
-Audit & Attest Standards
-Code of Professional Conduct
-Compilation and Review Standards
-Peer Review Standards
-Tax Standards
-Valuation services Standards (VS section 100)
Voluntary adoption by its members. United States All.
Principles of Appraisal Practice and
Code of Ethics
ASA Broadly applicable across
several valuation causes*
The American Society of Appraisers, in its Principles of Appraisal
Practice and Code of Ethics, and the Appraisal Foundation, in
itsUniformStandards of Professional Appraisal Practice (“USPAP”),
have established authoritative principles and a code of professional
ethics. These Standards incorporate the Principles of Appraisal
Practice and Code of Ethics and the relevant portions of
USPAP, either explicitly or by reference, and are designed to clarify
them and provide additional requirements specif ically applicable to
the valuation of businesses, business ow nership interests,
securities and intangible assets.
These Standards provide minimum criteria to be follow ed by
business appraisers in developing and reporting the valuation
of businesses, business ow nership interests, securities and
intangible assets.
BVS I - IX: Business valuation standards
SBVS I - II: Statements on ASA business valution standards
AO I: Advisory opinions
PG I -II: Policy guidelines
Voluntary adoption by its members. United States Valuation of businesses, business
ow nership interests, securities and
intangible assets.
*Other valuation purposes refers to commercial & strategic purposes (third party valuation), valuation for tax and transfer pricing, f inancial reporting, conflict related or other statutory & legal purposes.

European Commission
Study on the Application of Economic Valuation Techniques for Determining Transfer Prices of Cross Border Transactions between Members of Multinational Enterprise Groups in the EU
September 2016 – 204
Appendix 5 – Discount rate inputs
Input of countries on the discount rate evaluated with the help of WACC formula *
where:
* Discount rate is equal to WACC = Debt/(Debt+Equity)*Return on debt + Equity/(Debt + Equity)*Return on Equity.
* Return on equity is based on the CAPM formula (Return on equity = Risk-free rate + Beta * Market Premium
Belgium Czech Republic France Germany Greece Hungary Italy Latvia
* Debt/ Equity ratio From comparables, or from client
/ tested party.
Client or industry - Both are
considered. Client may indicate if
in the future moving towards peer
group
Ask the Company to
provide
Depends on (either
company's or industry's
average)
Client's ratio To be consistent with FVM, we
use industry average D/E ratio
Client normally provides;
otherwise - industry
D/E - depends on the case. If
client's ratio is very different
from industry, then take its
ratio. Peer group also
possible. More often, peer
groups
* Return on debt Usually the interest charged to
the group company (under Arm's
length policy…) - we can also
estimate it based on the rating of
the company & subsidiaries
Margin paid by the company,
added to the long-term risk free
rate.
Interest on the external
borrowing of the company
Company specific interest
rate (borrowings)
From Bloomberg Industry benchmark - difficult
to collect so in practice, use
the interest spread of the
client.
Internal rate (client's interest
rate on borrowings)
If capital structure very
diffierent, then client's -
otherwise, the avearge
lending rates in the country
We get it from the internet or
Bloomberg, given specifics of (IP)
activity considered. We also
typically use group's information
as a starting point.
Bloomberg, Reuters and Capital
IQ. Bloomberg is discontinued
now, so Reuters and Capital IQ.
Capital IQ is cheaper than other
two. Best practices is Bloomberg
and Reuters. Risk-free rate is a
long-term Czech bond rate.
Beta- Bloomberg,
[incomplete answer]
Beta - from Bloomberg, risk
free rate - government bond,
market return -
recommedation by Audit
Association (IDW) in
Germany which is published
and available
Bloomberg is the
source for CAPM
parameters
Used Bloomberg - now
switched to S&P database.
Risk free rate - Hungarian
bond yields. In some cases,
we follow different approach -
German bond and then adjust
Source is Bloomberg. For risk-
free rate - Italian 10 year
government bonds. Market
premium is evaluated case by
case (in the past, used
Ibbotson database for
estimation)
Databases: Bloomberg
(publically available
companies), S&P Capital IQ
Rf - Latvian bond rate, or
German bond rates.
* tax rate Where the P&L is expected to be
generated (could be seller's or
buyer's depending on
perspective). We may use
statutory tax rate (sometimes)
ETR (preferably). Ideally,
marginal tax rate, when available
releveling beta - statutory rate; but
in calculations we will consider
items that are not tax deductable.
French tax rate for the
industry. It is 15% if in a
patent box regime, or 30% -
if not in patent-box
Apply two-sided valuation , so
both rates in each's party
P&L
Deloitte database on
statutory tax rates
Tax rate that is applicable
(where cash flow was
generated historically)
Local tax rate of the client
* Return on equity
(CAPM and its main
parameters)

European Commission
Study on the Application of Economic Valuation Techniques for Determining Transfer Prices of Cross Border Transactions between Members of Multinational Enterprise Groups in the EU
September 2016 – 205
Input of countries on the discount rate evaluated with the help of WACC formula *
where:
* Discount rate is equal to WACC = Debt/(Debt+Equity)*Return on debt + Equity/(Debt + Equity)*Return on Equity.
* Return on equity is based on the CAPM formula (Return on equity = Risk-free rate + Beta * Market Premium
Lithuania Netherlands Poland Romania Slovakia Spain Sweden UK
* Debt/ Equity ratio Based on Client's
balance sheet
Either client or from
comparables or both
Obtained from Damodoran
database (not client), because
we do not want to focus on
client's few years, they could
be deviations from long-term
industry trend.
Based on the D/E ratio of a pool
of comparable companies.
Industry-wide rate From the Company but
compare with comparables/
industry.
Beta - from Bloomberg;
may adjust case to case.
Project specific D/E ratio is
needed (relevant for IP valued).
Therefore, need to see how it is
financed (maybe too risky, and
nobody will lend to you)
* Return on debt Client's cost of
borrowing
Return on debt - from
client
Bonds/ or client Cost of debt is calculated using
the intest rate of any recent long-
term loans taken by the
Company or (in the absence
thereof) as the average interest
rate of long term loans as
indicated by the National Bank
of Romania statistics for the
date of valuation.
Check on actual market
situation, Bank of Slovakia.
(lending rate), if they are
very different from client
From the company/ check the
borrowing rates in the industry
Rf - group or swedish free
rate (gov 10 year bond)
Bloomberg Beta - Damodaran. Market
premium - also from
Damodaran. Bloomberg for
other data
Capital IQ inputs are used Bloomberg or Capital IQ or
Reuters.
Beta - Bloomberg/
Damodaram; Risk-free rate -
depends, could be German
bond (depends also on
currency), Market premium -
Boston Consulting or
Damodaran .
Market premium - there is
survey of Swedish market
which is sometimes used
in respect to this input
Bloomberg for risk free rate
* tax rate Tax rate - typically Buyer
(unless both sides)
Historical effective tax rate
(preferably) or statutory tax rate
are used.
statutory tax rate of client Use both rates and compare resulting values (have a range)tax rate - in Sweden
(outbound cases)
Whether you do it pre-tax or post-
tax, you should get the same
answer because the discount
rate should be adjusted. WACC
need to be pre-tax or post tax
rate. If valuation is done from
both parties -- need to use tax
rate depending on each party's
country..
* Return on equity (CAPM
and its main parameters)

European Commission
Study on the Application of Economic Valuation Techniques for Determining Transfer Prices of Cross Border Transactions between Members of Multinational Enterprise Groups in the EU
September 2016 – 206
Appendix 6 – Parameters internal sources
Parameter(Potential) internal source - data on
individual company levelMain challenges Potential solution(s) to challenges
Financial projections Management projections / financial forecast • Limited availability of projections for other
purposes and, especially of relevant (segmented)
financial projections.
• Uncertainty of projections and, as a consequence,
limited accuracy and questionable reasonability of
projections.
• Unreliability of projects based on linear growth
rates and past performance due to uncertainty
• Preferred use of internal forecasts created for non-tax
purposes
• Challenge reasonability of projections: question growth rates
including long-term growth, profitability each year.
• Comparison with industry or competitors and comparables and
request for explanations of deviations; finally, potential
adjustments based on joint discussion
• Focus on key economic and financial indicators for reasonability
check.
• Keep caution in using linear growth rates and past
performance indicators.
Royalty rate • Internal comparables: Agreements of a
company in the same group with unrelated
parties covering the same intangible, under the
same conditions
• External comparables: Information regarding
or available third party agreements, known to
the Company (such as agreements of
competitors), which are in the same industry
and are similar/ comparable.
• Limited availability of internal comparables or any
information on third party agreements available to
the Company.
• If any agreements provided, comparability to the
studied transaction and IP in the scope of this
transaction.
• Assess comparability of identified agreements according to
OECD TPG (geography, products & their profit potential, market
level, applications, terms of agreements, etc.)
Routine return "Internal" comparable companies (e.g. third
party routine distribution/manufacturing entities
performing functions for one entity of the Group,
and possibly, their financial information allowing
to assess their rate of return/ profitability)
• Unavailability of internal comparables and/or their
information necessary to calculate routine return
• Perform functional and risk analysis of tested party
• Perform comparability analysis according to OECD TPG
Discount rate (see
Appendix 4 for
practices in respect to
inputs for Discount
rate)
Information on the discount rate (or inputs used
to calculate it) used by Company's management
for internal financial management, on the
company basis and/or, ideally, in respect to
projects with intangibles; or information on
different inputs that go into WACC calculations
• Appropriateness of the discount rate (other
parameters of WACC) that is available from
management (special risk of the IP being valued,
etc.) and more widely, availability of the discount
rate and ability of the company to justify it.
• Assessment of the full rate if provided by management (what is
application of the rate provided, etc.) with the intangible
valuation in hand.
• Analysis and assessment of various inputs for WACC
calculations, if provided by managements.
Useful life • Information from the Company regarding the
speed of replacement of products containing
the IP valued/ speed of development of new
technology and its updates.
• Information on the planned use of the
acquired IP by the "buyer";
• Information on the potential use of the IP by
the seller, under the scenario of options
realistically available.
• Level of judgement for finding factors affecting
useful life, e.g. technological changes, economic life,
functional life.
• Reasonability check with external data industry average data
and with expert publications but preference to understanding
better the specifics of the company, its products, markets, etc.

European Commission
Study on the Application of Economic Valuation Techniques for Determining Transfer Prices of Cross Border Transactions between Members of Multinational Enterprise Groups in the EU
September 2016 – 207
Appendix 7 – Parameters external sources
Parameter Use of potential external source Database Challenges Ways to objectivize the chosen value of parameter
Financial projections Reasonability check or
corroboration with competitors'
data or with industry averages in
terms of growth rate, etc.
Same potential sources as
for comparables for Routine
return
• Availability and applicability of
competitors' and industry data
• Applicability of data from competitors
and/or industry averages specifically to
the financial projections in question
• Challenge and assessment of projections based on
economic and financial indicators (industry forecasts /
industry expectations)
• Cross-check of projections with competitors' data.
• Cross-check and challenge of the forecast provided, based
on Company’s record of achievement of forecast.
• Provide and document justifications of deviations of
forecast from industry statistics / forecast, from competitors
and from the historical statistics (past growth and
profitability).
Royalty rate Search and identification of
agreements between unrelated
parties covering the same type
or similar intangibles, under the
same or similar conditions, obtain
the royalty rate.
Agreements databases:
RoyaltyStat, RoyaltySource,
ktMINE, TP Catalyst,
LexisNexis
• Availability and reliability of third party
agreements
• Comparability of third party
agreements in terms of characteristics of
intangibles and of rights transferred,
contractual conditions, geographical
scope
• Assess and document the comparability analysis of
external agreements (according to OECD TPG, i.e.
geographical coverage, same applications of IP, etc.)
• Cross-check of assumed royalty rate by reference to an
operating margin required from sales generated from the
use of the IP.
Discount rate (see
Appendix 4 for practices
in respect to inputs for
Discount rate)
Search for relevant information
for WACC parameters (company
beta, market premium, and risk
free rate (all for application of
CAPM formula)). Possibly, search
on industry-wide WACC's.
Financial databases:
Bloomberg, Reuters, Capital
IQ, S&P, Damodaran
• Identification of potential differences
between parameters for the Company
(i.e. relevant for IP project and reflecting
additional risk) and industry-wide
parameters.
• Sensitivity analysis (change in the value of analyzed IP)
based on the change of parameters for calculation of
discount rate.
• Detailed justification of the chosen parameters (and their
applicability to the analyzed transaction).
Routine return Search and identification of
external comparable companies
(e.g. entities with same routine
functional profile), to obtain a
benchmark for routine return.
Company databases:
Bureau van Dijk's Amadeus,
Orbis, local databases (local
editions of Amadeus)
• Definition of "routine" function
• Comparability in terms of risks and
performance of routine functions
• Availability of local comparables
• Availability of sufficient information for
assessing comparability
• Perform functional and risk analysis of tested company (in
respect to routine function(s) it performs).
• Perform comparable search and comparability analysis
according to OECD TPG.
• Document the search and identification of the comparable
companies (including all steps of the search and review of
potential companies).
Useful life Industry practices / external
studies mentioning useful life for
similar types of intangibles,
similar products (for which the IP
is used) and considering
observations of useful life of
intangibles in similar industries
and markets
Econlit (database of
economic academic
literature) or search on
google for other publically
available publications
studying useful life, product
life cycle, etc.
• Limited information on the useful life of
intangibles in the literature and absence
of any specific databases to consult.
• The characteristics of intangibles
studied are unique and thus any
industry-wide information (including
information on speed of technological
changes, product life cycle, etc.) may be
inappropriate to use.
• Explanation and documentation of selected life including
documentation any external sources and their applicability

European Commission
Study on the Application of Economic Valuation Techniques for Determining Transfer Prices of Cross Border Transactions between Members of Multinational Enterprise Groups in the EU
September 2016 – 208
Appendix 8 – Overview of transfer pricing legislation
EU Member State Transfer pricing legislation
Austria
• Section 6 para. 6 Income Tax Act, Section 8 para 1 and 2 Corporate Income Tax Act. • Specific transfer pricing guidelines as a decree from October 2010, which is binding on the Austrian tax authorities but non-binding on taxpayers and the courts
Belgium
• Law of 21 June 2004 introduced transfer-pricing-specific crossborder rules and correlative adjustments under
Articles 185, §2, and 235 ITC. For APAs, mutual agreement, or arbitration procedure, the OECD’s arm’s length standard, as introduced by article 185 §2 ITC, applies. • Administrative Transfer Pricing Circular Letter of 28.06.1999; Administrative Arbitration Convention Circular Letter
of 07.07.2000 and Administrative Circular Letter of 25.05.2003 (addendum to Circular Letter of 07.07.2000); Administrative Circular Letter of 04.07.2006 regarding article 185 §2 ITC; Administrative Circular Letter of 14.11.2006 on transfer pricing documentation and transfer pricing audits.
Bulgaria
• Corporate Income Taxation Act (CITA) and Ordinance H-9/14 August 2006 on the procedure for application of transfer pricing methods. • Transfer Pricing Manual of 2010 that follows closely the 1995 OECD Transfer Pricing Guidelines for Multinational Enterprises and Tax Administrations.
Croatia
• Croatian Corporate Income Tax Act, article 13, Croatian Corporate Income Tax Regulations, article 40; • General Tax Act, article 41 paragraph 2; Guidelines for auditing transfer prices for tax inspectors, issued in 2009 in the tax authorities’ gazette.
Republic of Cyprus
-
Czech Republic
• Section 23 para. 7 of the Income Taxes Act (effective January 1, 1993). • Decree D-332 on the application of international standards to the taxation of transactions between related persons; Decree D-333 on binding ruling over the transfer pricing policy used in related-party transactions (APAs); Decree D-334 on the recommended scope of transfer pricing documentation (in accordance with EU transfer pricing documentation). Regarding intercompany services, new Decree D-10 on Low-Value-Adding Intragroup Services was adopted
effective January 2013.
Denmark
• Tax Assessment Act Section 2 and Tax Control Act Section 3B. • Regulation no. 42 of January 24, 2006, on Transfer Pricing Documentation, Danish administrative guidelines 2014-1, section C.D.11 on Transfer Pricing; Danish guideline of 15 January 2013 on valuation.

European Commission
Study on the Application of Economic Valuation Techniques for Determining Transfer Prices of Cross Border Transactions between Members of Multinational Enterprise Groups in the EU
September 2016 – 209
Estonia
• Estonian Income Tax Act (Article 14 sections 7 and 8; Article 50 sections 4-8); Regulation No. 53 of the Minister of Finance of 10 November 2006, “Methods for determining values of transactions between related persons.” • The Tax and Customs Board has issued guidelines on its website on the determination of arm’s length prices for related-party transactions, but those guidelines are not binding on taxpayers.
Finland
• Sections 14 a-c and 31 Tax Procedure Act. • The Finnish Tax Administration issued a guidance letter on documentation on October 19, 2007. The English version, Transfer Pricing Documentation Requirements, was issued on April 16, 2009.
France
• General Tax Code: Article 57 – transfer of profits and arm’s length principle, Articles 238 A and 209 B – CFC rules,
Article 223 quinquies B – annual transfer pricing form to be filed with the tax authorities, Article 1729 F – penalties for failure to file country-by-country report, Article 1735 ter – penalties for lack of transfer pricing documentation; Tax Procedure Book: Article L.13 B – specific transfer pricing questions from tax authorities, Article L.13 AA –
general contemporaneous transfer pricing documentation requirements, Article L.13AB – additional requirements for transactions with non-cooperative states and territories as defined in Article 238-0-A of the French Tax Code, Article L.80 B 7 – advance pricing agreements and Supreme Tax Court case law on Abnormal Act of Management, L.188 A – extension of statute of limitations when the FTA makes a request from foreign tax authorities. • Administrative Doctrine on Article 57 (BOI-BICBASE-80-20), Adopted Procedures L.13 AA and L.13 AB (22 December 2009), Administrative Instruction on the Mutual Agreement Procedure (BOI-INT-DG-20-30), Administrative Instructions on APAs (BOI-SJ-RES-20), OECD transfer pricing guidelines (generally accepted in
practice).
Germany
• Section 8 para. 1 and 3 Corporate Income Tax Act (KStG); Section 4 para. 1 Income Tax Act (EStG); Section 1 Foreign Tax Code (AStG); Section 90 para. 3 and section 162 para. 3 and 4 General Tax Code (AO). Decree-law on the manner, content, and extent of documentation in the sense of section 90 para. 3 of the General Tax Code (GAufzV), decree-law on the relocation of business functions (FVerlV), decree-law on the profit allocation to
permanent establishments (BsGaV). • Principles for the Examination of Income Allocation in the Case of Internationally Related Enterprises of Feb. 23, 1983; Principles for the Examination of Income Allocation by Cost Sharing Arrangements between Internationally Related Enterprises of Dec. 30, 1999; Principles for the Audit of Income Allocation between Internationally Affiliated Enterprises in Cases of Employee Secondments of November 9, 2001; Principles for the Audit of the Income Allocation Between Related Parties with Cross-Border Business Relations in Respect of the Duty of Determination, the Duty of Cooperation, adjustments, Mutual Agreement Procedures, and EU Arbitration Procedures of April 12,
2005; Principles for the Examination of Income Allocation between Affiliated Companies in the Case of International Relocation of Functions, dated October 13, 2010; Principles for the Application of Section 1 Foreign Tax Code to Cases of Marginal Amortizations and other Depreciations on Loans Issued to Foreign Related Entities, dated March 29, 2011.

European Commission
Study on the Application of Economic Valuation Techniques for Determining Transfer Prices of Cross Border Transactions between Members of Multinational Enterprise Groups in the EU
September 2016 – 210
Greece
• Law 4172/2013 (new Income Tax Code applicable from 1 January 2014), Law 4174/2013 (Tax Procedures Code, also applicable from 1 January 2014); Law 2238/2013, as amended by L.3775/2009, L.3842/2010 and L.4110/2013 for transactions entered into up until FY 2013; Law 3728/2008 for transactions entered into in FYs 2008, 2009, and 2010.
• Ministerial Circular 1097/2014, amended by POL. 1144/2014 and 1284/2013, as well as the relevant guidelines released by the General Secretariat of Public Revenue with regard to advance pricing agreements.
Hungary
• Corporate Income Tax Act Article 18 (transfer pricing rules), Article 4/23 (definition of related parties) and Article 31/2 (reference to OECD transfer pricing guidelines); Tax Procedures Act Article 1 (8) on arm’s length principle, Article 132/B-C on APAs. The Hungarian Ministry of Finance issued Decree no. 22/2009 on transfer pricing documentation requirements.
• Decree no. 38/2006 on advance pricing agreements (modified as of January 1, 2012, and January 1, 2016 (the latter including solely administrative modifications))
Ireland
• Taxes Consolidation Act 1997 Section 835A -835H. Transfer pricing rules introduced into law in 2010 for trading transactions between associated persons. Effective for chargeable periods beginning on or after January 1, 2011. Taxes Consolidation Act 1997 Section 891H contains provisions introducing countryby-country Reporting into Irish law for companies within the scope for accounting periods beginning on or after January 1, 2016. The Taxes (Country-By-Country Reporting) Regulations 2015 contain provisions that give effect to the secondary filing mechanism for country-bycountry reporting as provided for under Action 13 of the OECD BEPS final report.
Italy
• Article 110 (7) of Presidential Decree n. 917/1986 (for corporate tax purposes – IRES); Legislative Decree n. 446/1997 (for regional tax purposes – IRAP); article 1, § 2-ter of Legislative Decree n.471/1997; Article 31-ter of
Presidential Decree n. 600/1973 (APA regulations). • Circular Letter nos. 32/9/2267 (September 22, 1980), 42/12/1587 (December 12, 1981) and 271/E/1059 (October 21, 1997). Circular Letter nos. 141/E/86270 (June 4, 1998), 98/E/107570 (May 17, 2000) and 148/E/139500 (July 26, 2000) for IRAP purposes only; decision of the Commissioner of Italy Revenue Agency dated September 29, 2010; Circular Letter no. 58/E (December 15, 2010); Circular no. 21/E (June 5, 2012).
Latvia
• Taxes and Duties Act, articles 15.2 , 16.1 (from January 1, 2013); Taxes and Duties Act, articles 23.2 ; Income Tax Act, article 12.
• Cabinet of Ministers Regulations No. 556, articles 83.-94; Cabinet of Ministers Regulations No. 981 and 16.

European Commission
Study on the Application of Economic Valuation Techniques for Determining Transfer Prices of Cross Border Transactions between Members of Multinational Enterprise Groups in the EU
September 2016 – 211
Lithuania
• Order No. 1K-123 of the Minister of Finance (transfer pricing rules), dated April 9, 2004; • Law on corporate income tax (No. IX-675), dated December 20, 2001; • Law on Tax Administration (No. IX-2112), dated April 13, 2004; • Order No. VA-27 of the head of STI regarding submission of the report on transactions and operations with
associated parties, dated March 22, 2005; • Order No. VA-105 of the head of STI regarding APAs, dated October 19, 2011; • Order No. VA-49 of the head of STI regarding the recovery of tax overpayments by taxpayer, dated June 30, 2009; • Order No. VA-25 of the head of STI regarding the method of imposing penalties and the calculation of late payment interest, dated March 28, 2007.
Luxembourg
• Article 56 of the Income Tax Law. • Grand-Ducal Decree of December 23, 2014 – defining the process for advance tax agreements; Circular ITL NS
No.164/1 dated June 9, 1993; Circular ITL No.164/1 dated March 23, 1998; Circular L.I.R. 164/2 dated January 28, 2010; and Circular 164/2 bis LITL issued April 8, 2011.
Malta -
Netherlands
• Corporate Income Tax Act Article 8b and 8c. • Transfer Pricing Decree, November 26, 2013, IFZ 2013/184M • Decree on APAs, ATRs, Financial Service Entities, June 26, 2014, DGB 2014/296M • Decree on TP Coordination Group, August 11, 2004, DGB 2004/1339
• APA Decree, June 26, 2014, DGB 2014/3098
• ATR Decree, June 26, 2014, DGB 2014/3099 • Decree on Financial service companies, June 26, 2014, DGB 2014/3101 • Q&A Decree re financial service companies, June 26, 2014, DGB 2014/3102 • Decree on Attribution of Profits to Permanent Establishments, January 15, 2011 IFZ2010/457M
Poland
• Articles 9a, 11, 19, and 27 of Corporate Income Tax Act; articles 25, 25a, and 45 of Personal Income Tax Act; section IIa of Tax Ordinance of 29 August 1997 (APAs); Convention on the Elimination of Double Taxation in
Connection with the Adjustment of Profits of Associated Enterprises (August 23, 2007). • Transfer Pricing Decree of September 10, 2009 (with further amendments), Decree on Tax Havens of April 23, 2015, Ordinance on APA Realization of May 31, 2006.
Portugal
• Article 63 and Article 138 of the Corporate Income Tax Code. • General guidance on transfer pricing - Ministerial Order (“Portaria”) #1446-C/2001; advance pricing agreements - Ministerial Order (“Portaria”) #620-A/2008.

European Commission
Study on the Application of Economic Valuation Techniques for Determining Transfer Prices of Cross Border Transactions between Members of Multinational Enterprise Groups in the EU
September 2016 – 212
Romania
• The Romanian Fiscal Code and its methodological norms; The Fiscal Procedure Code; Order no. 442/2016 regarding the values of transactions, the content, deadline for preparation, and conditions for the request of the transfer pricing file, and the procedures for adjustments/ estimates of transfer prices; • Government Decision no. 529/2007 regarding the approval of advance pricing agreements (APAs) and advance
fiscal solutions, and Order no. 3736/2015 regarding the application procedure and forms for issuing and amending APAs; the OECD Transfer Pricing Guidelines for Multinational Enterprises and Tax Administrations and the EU Code of Conduct on transfer pricing documentation.
Slovakia • Section 2(n) and (r), Section 17(5), and Section 18 of the Income Tax Act (ITA).
• ITA, MF/8120/2014-721, OECD transfer pricing guidelines
Slovenia
• Corporate Income Tax Act (Official Gazette of the Republic of Slovenia, no.117/06 to 50/14), articles 16-19, 32, 72; Tax Procedure Act (Official Gazette of the Republic of Slovenia, no. 13/11 to 90/14) article 382; amendment (Official Gazette of the Republic of Slovenia, no. 91/15) article 14.a to 14.g (APA); Financial Administration Act (Official Gazette of the Republic of Slovenia, no. 25/14) article 11. • Rules on transfer prices (Official Gazette of the Republic of Slovenia, no. 141/06 to 4/12).
Spain • Article 18 of the Spanish Corporate Income Tax Law (CITL) (Law 27/2014 of November 27, 2014). • The Corporate Income Tax Regulations (Royal Decree 634/2015, of July 10, 2015)
Sweden
• Chapter 14 §§ 19-20 of the Swedish Income Tax Act. • Arm’s length principle (SFS 1999:1229; 14:19-20); documentation requirements (SFS 2001:1227; 19:2a-2b); APAs (SFS 2009:1289); case law (RÅ 1991 ref. 107).
United Kingdom
• The UK transfer pricing legislation is found in Part 4 of the Taxation (International and Other Provisions) Act 2010 (TIOPA 2010) (S 146 et seq.). The mutual agreement procedure is set out in Part 2 of TIOPA 2010 (ss 124-125). APAs are in Part 5 of TIOPA 2010 (S 218 et seq.). • HMRC publishes guidance on its interpretation of transfer pricing legislation, OECD principles, and UK case law. This guidance is currently found in the International Manual at INTM410000 et seq., and includes guidance on thin capitalization. Statement of Practice SP1/11 provides guidance on mutual agreement procedures and arbitration in relation to transfer pricing matters.

European Commission
Study on the Application of Economic Valuation Techniques for Determining Transfer Prices of Cross Border Transactions between Members of Multinational Enterprise Groups in the EU
September 2016 – 213
Appendix 9 – Glossary & Abbreviations
Glossary
Term Definition
Accounts payables Debts to suppliers and contractors (trade creditors).
Administrative Principles Principles for the Audit of the Allocation of Income between Related Persons in Cases of Cross-Border Transfers of Business Functions (Administration Principles – Business Restructurings) issued by German Ministry of Finance
Arm's length principle Glossary OECD TPG
Associated enterprises Glossary OECD TPG
Asset Asset is a resource controlled by the entity as a result of past events and from which future economic benefits are expected to flow to the entity [IASB Framework].
Benchmark In transfer pricing, any (financial) indicator, price or royalties based on analysis of comparable companies or
comparable transactions.
Building blocks Grouping of inputs needed for the application of valuation methods.
Business combination A transaction or other event in which an acquirer obtains control of one or more businesses. Transactions sometimes referred to as 'true mergers' or 'mergers of equals' are also business combinations [IFRS 3].
Business valuation The act or process of determining the value of a business enterprise or ownership interest therein.
Capital intensity The amount / level of capital (money, other financial resources, tangible assets) required to produce a good or a service. A business is considered capital intensive based on the ratio of the capital required to the amount of
labor that is required.
Capitalisation (rate) A variant of a discount rate that is usually used for cash flows of one year.
Cash & Liquidity Detail of the other current assets, which typically include cash at bank and in hand of the company.
Cash flows Cash that is generated over a period of time by an asset, group of assets, or business enterprise. This term may be used in a general sense to encompass various levels of specifically defined cash flows. When the term is used, it should be supplemented by a qualifier (for example, 'discretionary" or 'operating') and a specific definition in the given valuation context.
Comparability adjustment An adjustment (to benchmarks) that arises from the differences identified through comparability analysis
Comparability analysis Glossary OECD TPG

European Commission
Study on the Application of Economic Valuation Techniques for Determining Transfer Prices of Cross Border Transactions between Members of Multinational Enterprise Groups in the EU
September 2016 – 214
Comparable uncontrolled price ("CUP") Method
According to paragraph 2.13 of the 2010 OECD report, the comparable uncontrolled price (“CUP”) method compares amounts charged in controlled transactions (between related parties) with amounts charged in comparable third party transactions (between a related party and a third party or between third parties).
Comparable uncontrolled transaction
Glossary OECD TPG
Comparables Comparable companies, agreements, or prices that have been identified through a well-defined search for
comparable uncontrolled transactions
Compounding The addition of interest to the principal sum of a loan or deposit is called compounding. Compound interest is interest on interest. It is the result of reinvesting interest, rather than paying it out, so that interest in the next
period is then earned on the principal sum plus previously-accumulated interest.
Corporate finance Corporate finance is the area of finance dealing with the sources of funding and the capital structure of corporations and the actions that managers take to increase the value of the firm to the shareholders, as well as the tools and analysis used to allocate financial resources.
Cost approach The cost approach seeks to determine the value of intangible assets by aggregating the costs involved in their development. There are two distinct cost approach methods: reproduction cost and replacement cost.
Cost of equity The cost of equity is the required rate of return to the equity investor, given all other options available and the capital structure of the firm. The required rate of return on equity measures the return necessary to compensate
investors for their investment risk.
Cost plus method Glossary OECD TPG
Current assets Balance sheet accounts that represent the value of all assets that can reasonably expect to be converted into cash within one year. Current assets include cash and cash equivalents, accounts receivable, inventory,
marketable securities, prepaid expenses and other liquid assets that can be readily converted to cash.

European Commission
Study on the Application of Economic Valuation Techniques for Determining Transfer Prices of Cross Border Transactions between Members of Multinational Enterprise Groups in the EU
September 2016 – 215
Customer base A customer base is a company's primary source of business. A client base consists of the current customers paying for the products, or services, as well as potential customers which have a high likelihood of becoming customers.
Customer relationship A customer relationship exists between an entity and its customer if (a) the entity has information about the
customer and has regular contact with the customer and (b) the customer has the ability to make direct contact with the entity. Customer relationship intangible assets may be either contractual or non-contractual [IFRS].
Decay schedule Attrition rate (also referred to as churn rate), in its broadest sense, is a measure of the number of individuals or items moving out of a collective group over a specific period of time. It is one of two primary factors that determine the steady-state level of customers a business will support.
Discount rate The discount rate refers to the interest rate used in discounted cash flow (DCF) analysis to determine the present value of future cash flows. The discount rate in DCF analysis takes into account not just the time value
of money, but also the risk or uncertainty of future cash flows; the greater the uncertainty of future cash flows, the higher the discount rate.
Discounted cash flows The discounted cash flow (DCF) is a method of valuing an asset or business using the concept of the time value of money and risk. Projected future cash flows are estimated and then discounted to present value using the relevant cost of capital. The sum of all discounted future cash flows, both incoming and outgoing, is the net present value (NPV), which is taken as the value or price of the cash flows in question.
Discounting (technique) The discounting technique relies on reducing the values of future cash flows or returns to make it directly comparable to the values at present.
Dispute valuation Valuations caused by a dispute. Disputes often include claims surrounding the value of an asset or group of assets, an ownership interest in a business, or intellectual property. If a dispute arises between shareholders,
the value of the business or of its assets will often be a point of discussion.
Dividend A dividend is a distribution of a portion of a company's earnings, decided by the board of directors, to a class of its shareholders. Dividends can be issued as cash payments, as shares of stock, or other property.

European Commission
Study on the Application of Economic Valuation Techniques for Determining Transfer Prices of Cross Border Transactions between Members of Multinational Enterprise Groups in the EU
September 2016 – 216
Earnings (with respect to income approach)
Earnings are the amount of profit that a company produces during a specific period, which is usually defined as a quarter (three calendar months) or a year.
Earnings volatility Earnings volatility refers to how stable, or unstable, the earnings of a corporation are.
EBIT Earnings Before Interest and Taxes or operating profit
Enterprise value Enterprise value (EV), total enterprise value (TEV), or firm value (FV) is an economic measure reflecting the market value of a business. It is a sum of claims by all claimants: creditors (secured and unsecured) and
shareholders (preferred and common). Enterprise value is one of the fundamental metrics used in business valuation, financial modelling, accounting, portfolio analysis, and risk analysis.
Excess earnings Earnings or profits attributable to the intangible asset being valued, obtained after excluding the proportion of
the cash flows attributable to other assets.
Excess earnings method The excess earnings method determines the value of intangibles as the present value of earnings (or cash flows) attributable to the subject intangible after excluding the proportion of earnings (cash flows) that are attributable
to other assets.
External comparables Comparable transactions between two third parties external to the considered taxpayer (or another entity of its group)
External CUP ("ECUP") An external CUP compares amounts charged in controlled transactions (between related parties) with amounts
charged in comparable third party transactions between third parties.
Extraordinary profit All extraordinary result not belonging to the ‘ordinary’ activities of the company.
Market value IVSC defines market value as the estimated amount for which an asset or liability should exchange on the valuation date between a willing buyer and a willing seller in an arm’s length transaction after proper marketing
and where the parties had each acted knowledgeably, prudently and without compulsion.
Fair value The price that would be received to sell an asset or paid to transfer a liability in an orderly transaction between market participants at the measurement date [IFRS13].

European Commission
Study on the Application of Economic Valuation Techniques for Determining Transfer Prices of Cross Border Transactions between Members of Multinational Enterprise Groups in the EU
September 2016 – 217
Financial asset Cash, equity or a contractual right to receive cash, equity, or another financial asset
Financial profit Result from financial activities of the company (financial revenue-financial expenses).
Financial reporting (standards)
A key prerequisite for meaningful financial statements is that they be comparable to those for other companies, especially firms within the same industry. To meet that requirement, statements are prepared in accordance with Generally Accepted Accounting Principles (or, more commonly, GAAP), which "encompasses the conventions, rules and procedures, necessary to define accepted accounting practice at a particular time." Refer to IFRS or USGAAP.
Forecast Projection regarding the financial position and the results of operations and cash flows based on expected conditions.
Functional and risk analysis
Glossary OECD TPG
Future benefit Capability or potential of intangible to generate cash flows (in form of cash and cash equivalents) for the entity.
Going concern business The going concern concept or going concern assumption states that businesses should be treated as if they will
continue to operate indefinitely or at least long enough to accomplish their objectives & obligations. In other words, the company will not have to liquidate or be forced out of business in the foreseeable future. Companies
that are expected to close in the near future are not a going concern. The significance of this principle becomes apparent when the value of a running business is compared with the value of one being liquidated.
Goodwill (accounting) The difference between the aggregate value of an operating business and the sum of the values of all separately identifiable tangible and intangible assets; or the representation of the future economic benefits
associated with business assets that are not individually identified and separately recognised; or the value of the assembled assets of an operating business over and above the sum of the separate values of the individual assets.
Gross margin Gross profit divided by turnover
Gross profit Operating revenue or turnover minus cost of goods sold.

European Commission
Study on the Application of Economic Valuation Techniques for Determining Transfer Prices of Cross Border Transactions between Members of Multinational Enterprise Groups in the EU
September 2016 – 218
Growth rate Annual rate of increase of a company's revenues, earnings and other financial data.
Highest-and-best-use principle
Assumption that the price a buyer will pay or that a seller will accept for an asset is based on the most profitable use of the asset.
Historical cost Refers to the costs incurred in the past
Historical cost method Method that is based on the evaluation of the historical costs incurred in developing an asset
Hypothetical market
participants
A typical market participant assuming the asset was offered in a market transaction (ie in a hypothetical market
transaction).
Identifiable asset An identifiable asset is an asset of an acquired company that can be assigned a fair value and can be reasonably expected to provide a benefit for the purchasing company in the future. Identifiable assets can be both tangible and intangible assets.
Income approach The income approach estimates the value of an intangible asset by converting future benefits stemming from the intangible in question into a current value.
Intangible asset An asset that is not physical (and not monetary) in nature.
Internal comparables Comparable transactions between the considered taxpayer (or another entity of its group) and an unrelated
party
Internal CUP ("ICUP") An internal CUP compares amounts charged in controlled transactions (between related parties) with amounts charged in comparable third party transactions between a related party and a third party.
IP portfolio A variety of intangible assets that are owned by one party or one group
License agreement An agreement under which the licensor, owner of an intangible asset, allows a licensee to use or engage in an activity in relation to that intangible asset, against a certain consideration.
Licensor (licensee) Owner of the intangible asset / of rights over the intangible asset; the party to a license agreement that
transfers rights over intangible
M&A Mergers and acquisitions (M&A) is a general term that refers to the consolidation of companies or assets. While there are several types of transactions classified under the notion of M&A, a merger means a combination of two
companies to form a new company, while an acquisition is the purchase of one company by another in which no new company is formed.

European Commission
Study on the Application of Economic Valuation Techniques for Determining Transfer Prices of Cross Border Transactions between Members of Multinational Enterprise Groups in the EU
September 2016 – 219
Market approach The market approach estimates the value of an intangible asset based on the selling price of similar items.
Market multiples (market approach)
The market value of a company's stock or invested capital divided by a company financial or operational metric (such as economic benefits or number of customers).
Market price (market approach)
The economic price for which a good or service is offered on the open market.
Market value The amount for which something can be sold on a given market. Market value and market price are equal only
under conditions of market efficiency, equilibrium, and rational expectations.
Net equity Total equity (capital+ other shareholders funds).
Net present value The value, as of a specified date, of future cash inflows less all cash outflows (including the cost of
investments), calculated using an appropriate discount rate.
Net profit Profit is a financial benefit that is realized when the amount of revenue gained from a business activity exceeds the expenses, costs and taxes needed to sustain the activity.
Normal profit Measure of profits that would be earned by a business that does not use the intangible asset that is being
valued.
Operating assets Total assets – Long term financial assets - Short term financial assets
Operating cycle The operating cycle is the average period of time required for a business to make an initial outlay of cash to produce goods, sell the goods, and receive cash from customers in exchange for the goods. This is useful for estimating the amount of working capital that a company will need in order to maintain or grow its business.
Operating profit Operating profit is the EBIT. It is obtained by deducting costs of goods sold and all operating expenses from turnover/ income from operating activities
Opportunity cost The New Oxford American Dictionary defines it as "the loss of potential gain from other alternatives when one alternative is chosen. Thus, opportunity costs are not restricted to monetary or financial costs: the real cost of output forgone, lost time, pleasure or any other benefit that provides utility should also be considered
opportunity costs.
Package deal Bundling of transactions involving intangibles and/or rights in intangibles that are closely linked, for the purpose of valuing them together in a transfer pricing context
Parameters Set of inputs needed for the application of valuation methods
European Commission
Study on the Application of Economic Valuation Techniques for Determining Transfer Prices of Cross Border Transactions between Members of Multinational Enterprise Groups in the EU
September 2016 – 220
Patent The exclusive right granted by a government to an inventor to manufacture, use, or sell an invention for a certain number of years.
Peer companies A peer (or comparable) company is a company which shares similar characteristics, such as business model, size, type of products or services, geographic location, etc.
Premium profit Refer to appendix valuation methods: premium profit method.
Premium profit method Refer to appendix valuation methods: premium profit method.
Pre-tax basis Calculated before taking into consideration taxes paid
Price premium (market
approach)
The percentage by which a product's selling price exceeds (or falls short of) a benchmarked price.
Private company A privately held company is a business company owned either by non-governmental organisations or by a relatively small number of shareholders or company members which does not offer or trade its company stock
(shares) to the general public on the stock market exchanges, but rather the company's stock is offered, owned and traded or exchanged privately.
Profit margin This is used to measure and compare profitability. It is calculated as a measure of profit (operating profit or net income, etc.) divided by revenue.
Profit split method Glossary OECD TPG
Profitability The ability of a company to earn a profit.
Purchase price allocation Purchase price allocation (PPA) is an application of goodwill accounting whereby one company (the acquirer), when purchasing a second company (the target), allocates the purchase price to various assets and liabilities acquired from the transaction.
Quoted share A share that can be bought or sold on a particular stock market
Reasonability analysis High-level verification (of financial information in this case) based on logic and sound judgement
Relative bargaining power Relative ability of parties at the moment of concluding a contract to exert influence over each other.
Relief from royalty method Valuation method that estimates the value of an intangible based on a “deemed royalty” payable for the rights to use the subject intangible asset.
Replacement cost The quantification of estimated cost of replacing an intangible asset or of creating an equivalent asset.
Replacement cost method Valuation method that estimates the value of an intangible through the capitalisation of forecast costs to be incurred for the replacement of intangible asset.
Resale price method Glossary OECD TPG
Residual method Glossary OECD TPG, under 'residual analysis'
European Commission
Study on the Application of Economic Valuation Techniques for Determining Transfer Prices of Cross Border Transactions between Members of Multinational Enterprise Groups in the EU
September 2016 – 221
Residual profit Cash flow of profits calculated by deducting "routine returns".
Return on contributory asset
Expected level of profit as percentage of the asset value earned during normal economic use of the asset.
Risk (systemic) Market risk is the possibility for an investor to experience losses due to factors that affect the overall performance of the financial markets. Market risk, also called "systematic risk," cannot be eliminated through diversification, though it can be hedged against. The risk that a major natural disaster will cause a decline in the market as a whole is an example of market risk. Other sources of market risk include recessions, political turmoil, changes in interest rates and terrorist attacks.
Routine activity Regular business activity for which comparables exist.
Routine margin Margin established by comparing the comparable companies' profitability
Routine return Remuneration attributable to a routine activity.
Royalty (deemed) Compensation or portion of the proceeds paid to the owner of an intangible assets / of rights in an intangible asset, under a license agreement. A deemed royalty refers to the application of the royalty relief method, which implies the use of a "deemed royalty" - that would be paid should the intangible be licensed.
Share capital Issued share capital.
Stakeholder (of the valuation exercise)
A stakeholder is a party that has an interest in an enterprise or project.
Stock market listing A listed security is a financial instrument that is traded through an exchange, such as the NYSE or Nasdaq.
When a private company decides to go public and issue shares, it will need to choose an exchange on which to be listed.
Substitute products Substitute goods or substitutes are products that a consumer perceives as similar or comparable, so that having more of one product makes them desire less of the other product.
Tangible asset A tangible asset is an asset that has a physical form. Tangible assets include both fixed assets, such as machinery, buildings and land, and current assets, such as inventory.
Tax amortisation Cost recovery system for intangible assets (against taxable income).
Tax valuation Valuation performed for tax purposes.
Time value of money The time value of money (TVM) is the idea that money available at the present time is worth more than the same amount in the future due to its potential earning capacity. This core principle of finance holds that, provided money can earn interest, any amount of money is worth more the sooner it is received.
European Commission
Study on the Application of Economic Valuation Techniques for Determining Transfer Prices of Cross Border Transactions between Members of Multinational Enterprise Groups in the EU
September 2016 – 222
Trademark (tradename) Distinctive design, graphics, logo, symbols, words, or any combination thereof that uniquely identifies a firm and/or its goods or services, guarantees the item's genuineness, and gives it owner the legal rights to prevent the trademark's unauthorized use.
Transactional net margin method ("TNMM")
Glossary OECD TPG
Transfer (of intangibles) Transaction involving a transfer of all rights in the intangible in question.
Transfer pricing The setting of prices for transfers of goods and/or services between associated (or related) enterprises.
Turnover Total operating revenues (net sales + other operating revenues + stock variations). The figures do not include VAT.
Two-sided valuation Valuation from both parties' perspective - from the perspective of the buyer and of the seller.
Unlevered free cash flow A company's cash flow before interest payments are taken into account.
Useful life The estimated lifespan of an intangible asset, during which it can be expected to contribute to company earnings.
Valuation approach General methodology to determine the value of an intangible asset using either income, market or cost data.
Valuation method Specific methodology falling under one of the three approaches (income, market or cost) prescribing a specific
technique (or variations of techniques) and the inputs needed for its application.
Valuation model Mathematical / financial model built according to certain valuation method
Valuation technique (Mathematical) feature (or collection of features) used in a valuation method or valuation model
Valuer A person / specialists engaged in the valuation exercise independent of its purpose
Weighted average cost of capital
Weighted average cost of capital (WACC) is a calculation of a firm's cost of capital in which each category of source of capital is proportionately weighted.
Working capital Capital used for day-to-day activities equal to the sum of inventories, accounts receivables net of accounts payables
Working capital position The working capital position can be positive working capital (current assets exceed current liabilities), neutral
working capital (current assets are equal to current liabilities) or negative working capital (current assets are less than current liabilities)

European Commission
Study on the Application of Economic Valuation Techniques for Determining Transfer Prices of Cross Border Transactions between Members of Multinational Enterprise
Groups in the EU
June 2016 – 223
Abbreviations
Term Explanation
AStG Auβensteuergesetz, Foreign Tax Act, Germany BEPS Base Erosion and Profit Shifting
CAPM Capital Asset Price Model CPM Comparable Profits Method CUP Comparable Uncontrolled Price
CUT Comparable Uncontrolled Transaction DCF Discounted Cash Flow
DDM Dividend Discount Model EBIT Earnings Before Interest and Tax EBITDA Earnings Before Interest, Tax and Amortisation
EV Enterprise value EU European Union
FASB Financial Accounting Standards Board FVerlV Funktionsverlagerungsverordung, German ordinance on relocation of functions IASB International Accounting Standards Board IFRS International Financial Reporting Standards IP Intellectual Property
IRR Internal Rate of Return
IVS International Valuation Standards IVSC International Valuation Standards Council
JTPF Joint Transfer Pricing Forum M&A Mergers & Acquisitions
MNE Multinational enterprises MPEEM Multi-period excess earnings method
NPV Net present value
OECD Organisation for Economic Co-operation and Development OECD TPG OECD Transfer Pricing Guidelines
P / B Price to Book P / FCF Price to Free Cash Flow
PLI Profit level indicator PPA Purchase Price Allocation
R&D Research & Development ROIC Return on invested capital RTD
report EU Commission Final report from the Expert Group on Intellectual Property Valuation, 29th November 2013
RUL Residual useful life SWOT Strengths Weaknesses Opportunities Threats
TNMM Transactional Net Margin Method TAB Tax amortisation benefits TP Transfer Pricing
TPG OECD Transfer Pricing Guidelines for Multinational Enterprises and Tax Administration
TVM Time value of money USGAAP US Generally Accepted Accounting Standards
WACC Weighted Average Cost of Capital
WARA Weighted Average Return on Assets