Embed Size (px)
Citation preview
“Study on the Effectiveness
of Personal Cooling Equipment
for Protecting Workers from Heat Stroke
while Working in a Hot Environment”
2013
Occupational Safety and Health Council

Study on the Effectiveness of Personal Cooling Equipment for Protecting Workers from Heat Stroke while Working in a Hot Environment
Occupational Safety and Health Council 1
Content Page
List of Tables .................................................................................................... 2
List of Figures .................................................................................................. 3
1. Introduction .................................................................................................. 4
2. Approach and Methodology ......................................................................... 5
3. Major activities undertaken .......................................................................... 6
4. Results ......................................................................................................... 8
4.1. Review and identification of two cooling vests ....................................... 8
4.2. Measuring the performance of cooling vests across four targeted
industries .................................................................................................... 11
4.2.1 Protocol of field study ..................................................................... 11
4.2.2 Record of field study ....................................................................... 12
4.2.3 Results of field study ....................................................................... 13
4.3 Summary of advantages and disadvantages of the personal cooling vests
under scrutiny ............................................................................................. 23
4.4. Determination of the cooling capacity of the selected cooling vest ...... 25
4.4.1 Protocol of treadmill running test inside a climatic chamber ........... 25
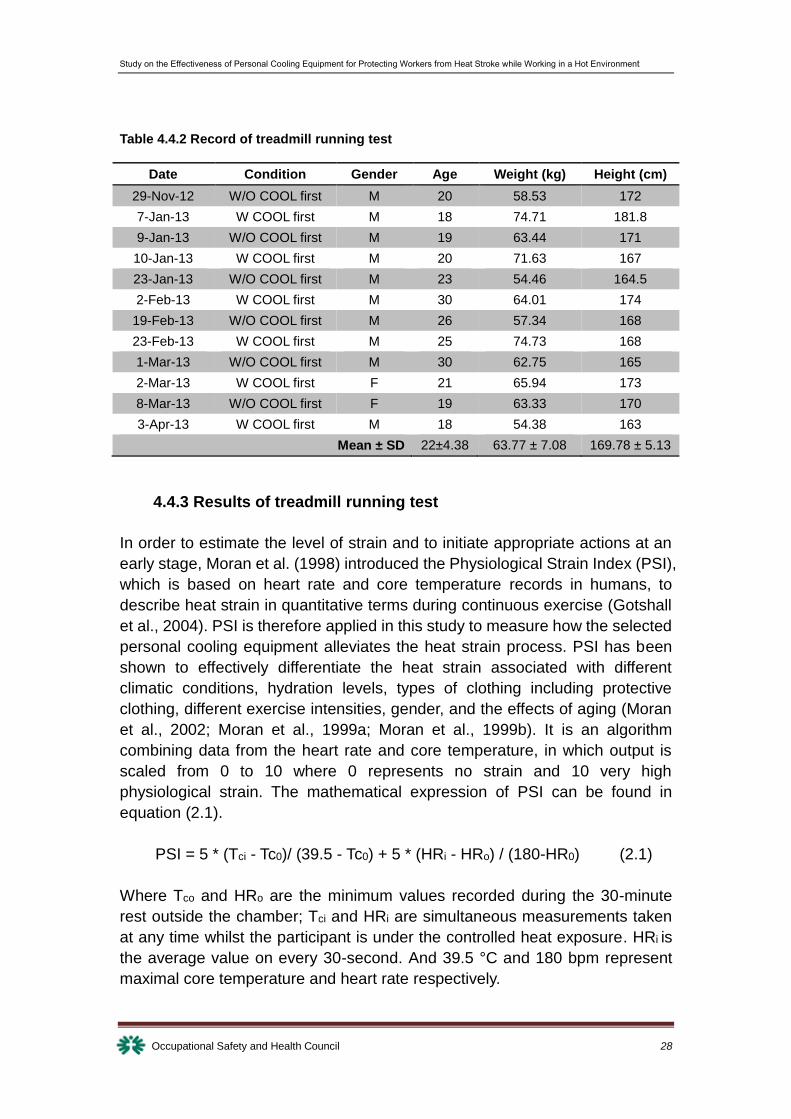
4.4.2 Records of treadmill running test .................................................... 27
4.4.3 Results of treadmill running test...................................................... 28
5. Recommendations ..................................................................................... 35
6. References ................................................................................................ 37
7. Appendices ................................................................................................ 41
Appendix A.................................................................................................. 41
Appendix B ................................................................................................. 43
Study on the Effectiveness of Personal Cooling Equipment for Protecting Workers from Heat Stroke while Working in a Hot Environment
Occupational Safety and Health Council 2
List of Tables Page
Table 4.1.1 Basic information of the cooling vests .................................................................... 9
Table 4.2.1 Protocol of field study ............................................................................................ 12
Table 4.2.2 Record of field study ............................................................................................. 12
Table 4.2.3 Basic demographic information ............................................................................ 14
Table 4.2.4a Environmental data (Outdoor: construction, horticulture and cleaning, and airport
apron service industries) ......................................................................................................... 16
Table 4.2.4b Environmental data (Indoor: kitchen and catering industry) ............................... 16
Table 4.2.5 Physiological data ................................................................................................. 17
Table 4.2.6 Ratings of perceived exertion (RPE) .................................................................... 17
Table 4.2.7 Subjective assessments ....................................................................................... 18
Table 4.2.8a Percentage of construction workers who liked (rating '5' to '7' inclusive) Vest A vs
Vest B ...................................................................................................................................... 19
Table 4.2.8b Percentage of horticultural and cleaning workers who liked (rating '5' to '7' inclusive)
Vest A vs Vest B ....................................................................................................................... 20
Table 4.2.8c Percentage of airport apron service workers who liked (rating '5' to '7' inclusive)
Vest A vs Vest B ....................................................................................................................... 21
Table 4.2.8d Percentage of kitchen and catering workers who liked (rating '5' to '7' inclusive)
Vest A vs Vest B ....................................................................................................................... 21
Table 4.3.1 Advantages and disadvantages of Vest A and Vest B .......................................... 25
Table 4.4.1 Protocol of treadmill running test inside a climatic chamber................................. 26
Table 4.4.1a Intensity of treadmill running test ........................................................................ 27
Table 4.4.2 Record of treadmill running test ............................................................................ 28
Table 4.4.3 Descriptive statistics ............................................................................................. 29
Study on the Effectiveness of Personal Cooling Equipment for Protecting Workers from Heat Stroke while Working in a Hot Environment
Occupational Safety and Health Council 3
List of Figures Page
Figure 3.1 Major activities undertaken ...................................................................................... 7
Figure 4.2.1 Number and percentage of participants distributed by occupations ................... 14
Figure 4.2.2a Number and percentage of participants distributed by construction trades ...... 14
Figure 4.2.2b Trade distribution of the horticulture and cleaning industry............................... 15
Figure 4.2.2c Trade distribution of the airport apron service industry ..................................... 15
Figure 4.2.2d Trade distribution of the kitchen and catering industry ...................................... 16
Figure 4.2.3 Perceived cooling effective time .......................................................................... 18
Figure 4.2.4 Percentages of workers who rated ‘5’ to ‘7’ (inclusive) on the attribute of ‘dislike-like’
to two cooling vests ................................................................................................................. 19
Figure 4.2.5 Factors affecting participants’ preferences ......................................................... 22
Figure 4.2.6 Summary of workers’ preference ........................................................................ 22
Figure 4.4.1 Scattered plots and linear curves of average Tc - with vs. without cooling vest
during exercise ........................................................................................................................ 30
Figure 4.4.2 Scattered plots and linear curves of average HR - with vs. without cooling vest
during exercise ........................................................................................................................ 31
Figure 4.4.3 Scattered plots and linear curves of average PSI - with vs. without cooling vest
during exercise ........................................................................................................................ 32
Figure 4.4.4 Scattered plots and linear curves of average Tc - with vs. without cooling vest
during recovery ........................................................................................................................ 33
Figure 4.4.5 Scattered plots and linear curves of average HR - with vs. without cooling vest
during recovery ........................................................................................................................ 34
Figure 4.4.6 Scattered plots and linear curves of average PSI - with vs. without cooling vest
during recovery ........................................................................................................................ 35
Study on the Effectiveness of Personal Cooling Equipment for Protecting Workers from Heat Stroke while Working in a Hot Environment
Occupational Safety and Health Council 4
1. Introduction
Hong Kong is getting warmer because of climatic change. It was recorded that
the outdoor temperature and relative humidity in summer time can be as high
as 35.4 °C and 95% respectively (Hong Kong Observatory, 2012). Such hot
conditions in outdoor environments may have a serious negative effect, such as
dehydration, heat stroke, and elevated heart rate, on front-line workers
(Fogleman et al., 2005). To control human heat strain in hot environments, the
practical approach is to provide a personal clothing ensemble to build up a
cooler microclimate for auxiliary body cooling (Nunneley, 1970; Shvartz, 1972).
Different types of heat protective personalized clothing ensembles (e.g. ice vest,
air- or water cooled vests, frozen gel vest, wettable covers) have been
developed to conserve a comfortable microclimate. Previous studies (Pimental
et al., 1992; Bennett et al., 1995; Webster et al., 2005; Choi et al., 2008; Hadid
et al., 2008) have showed that properly designed cooling vests were effective at
alleviating workers’ thermal strain when working in a hot weather.
In order to examine the effectiveness of various types of personal clothing
ensemble, OSHC commissioned the Kansas State University to test a number
of commercially available personal cooling products that are commonly used in
Hong Kong. Two cooling vests were identified for further on-site qualitative
comfort and usability assessments. The aim of these field studies is to conduct
qualitative comfort and usability assessment on the two types of personal
cooling vest. Front-line workers in four industries, including (1) construction, (2)
horticulture and outdoor cleaning, (3) airport apron, and (4) catering and kitchen
were selected to wear and assess the cooling vests. The key objectives of the
project are to:
(i) Conduct a survey to review and identify the types of personal
cooling products which are commonly used in Hong Kong for the
occupations/industries which require routine exposures of a
worker in a hot environment.
(ii) Determine the cooling performance of commercially available
phase change cooling vest (personal cooling equipment) under
different workloads and extreme temperature conditions and
evaluate the recovery rates such as recovery time, reduction in
core body temperature, and/or reduction in heart rate, etc
associated with the use of personal cooling equipment following
heat exposure while performing physical work.
(iii) Conduct physiological testing for measuring the performance
of personal cooling equipment and field research for FOUR

Study on the Effectiveness of Personal Cooling Equipment for Protecting Workers from Heat Stroke while Working in a Hot Environment
Occupational Safety and Health Council 5
target industry subjects including (a) construction workers, (b)
catering and kitchen workers, (c) horticulture workers and
outdoor cleansing workers, and (d) airport apron workers (e.g.
ramp handling workers).
(iv) Provide performance assessment using human subjects
while performing the task in a hot work environment under
different workloads.
(v) Summarize the advantages and disadvantages of the
personal cooling equipment.
(vi) Recommend the suitability and applicability of the personal
cooling equipment in the respective operations or industries.
2. Approach and Methodology
A combination of research methods including literature review, qualitative
studies, and quantitative studies were applied in delivering the project.
Literature review and fact finding. The literature relating to
different types of personal cooling products that is commonly
used in Hong Kong for the occupations/industries which require
routine exposures of a worker in a hot environment were
comprehensively reviewed. Extensive literature review also
acquires information on the advantages and disadvantages of the
targeted personal cooling equipment.
Performance assessment. Both qualitative comfort and usability
assessment and quantitative physiological responses
assessment were conducted on-sites and inside a climatic
chamber respectively.
Validation and recommendation. Recommendations were drawn
after the results were validated.
Study on the Effectiveness of Personal Cooling Equipment for Protecting Workers from Heat Stroke while Working in a Hot Environment
Occupational Safety and Health Council 6
3. Major activities undertaken
Major activities were undertaken by the research team from June 2012 to June
2013 as shown in Figure 3.1. After the commencement of the project, the
research team began to review and identify the commonly used personal
cooling products in Hong Kong for the occupations/industries and to design the
protocols for the field study and treadmill running tests inside a climatic
chamber. Briefing meetings with the main stakeholders of the four selected
industries were held to explain the rationale of the project and to recruit
front-line workers to voluntarily participate in the field study. Between August
2012 and January 2013, twelve field studies were conducted in four industries
(three in each industry), namely, the construction, horticulture and cleaning, and
airport apron service, and kitchen and catering industries to ascertain front-line
workers’ preference for a cooling vest qualitatively. Treadmill running tests
inside a climatic chamber were conducted from November 2012 to April 2013 to
assess the performance of the preferred cooling vest quantitatively. Data
collected were analyzed between April and May. Results and recommendations
were summarized in the final report which was submitted to OSHC in June
2013.
In addition, the research team had submitted two Progress Reports to OSHC’s
Project Monitoring Committee in September 2012 and November 2012
respectively.
Study on the Effectiveness of Personal Cooling Equipment for Protecting Workers from Heat Stroke while Working in a Hot Environment
Occupational Safety and Health Council 7
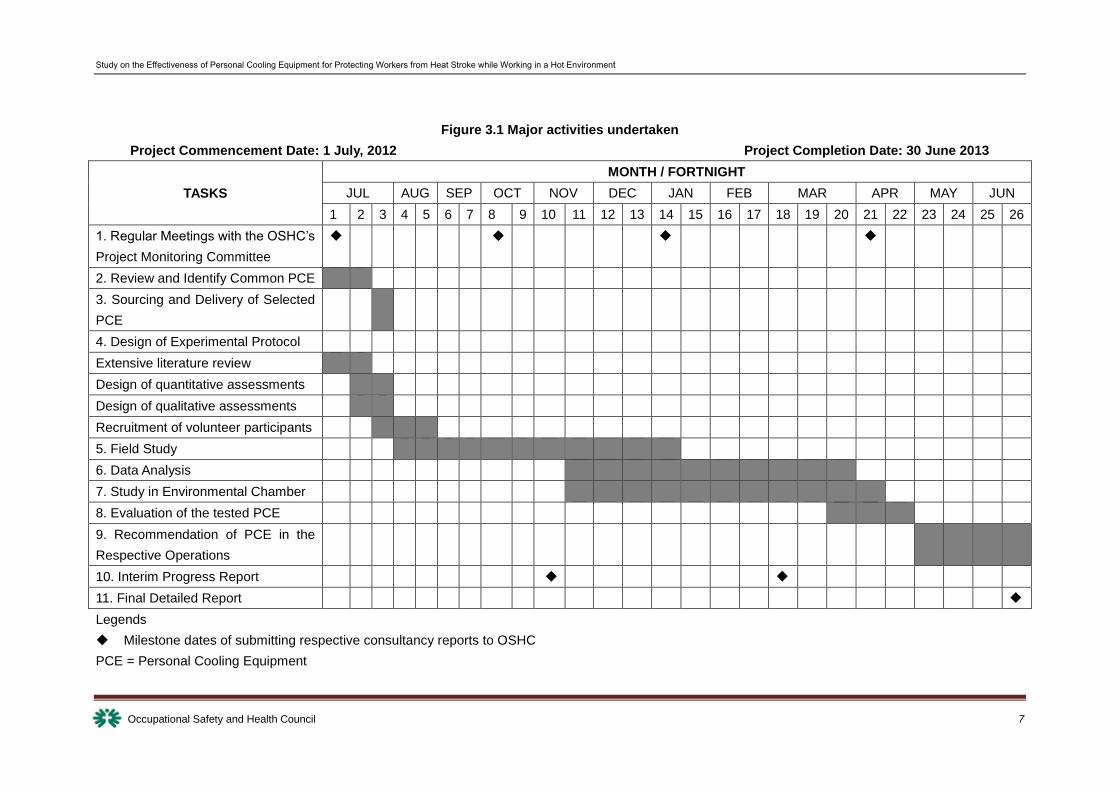
Figure 3.1 Major activities undertaken
Project Commencement Date: 1 July, 2012 Project Completion Date: 30 June 2013
TASKS
MONTH / FORTNIGHT
JUL AUG SEP OCT NOV DEC JAN FEB MAR APR MAY JUN
1 2 3 4 5 6 7 8 9 10 11 12 13 14 15 16 17 18 19 20 21 22 23 24 25 26
1. Regular Meetings with the OSHC’s
Project Monitoring Committee
2. Review and Identify Common PCE
3. Sourcing and Delivery of Selected
PCE
4. Design of Experimental Protocol
Extensive literature review
Design of quantitative assessments
Design of qualitative assessments
Recruitment of volunteer participants
5. Field Study
6. Data Analysis
7. Study in Environmental Chamber
8. Evaluation of the tested PCE
9. Recommendation of PCE in the
Respective Operations
10. Interim Progress Report
11. Final Detailed Report
Legends
Milestone dates of submitting respective consultancy reports to OSHC
PCE = Personal Cooling Equipment
Study on the Effectiveness of Personal Cooling Equipment for Protecting Workers from Heat Stroke while Working in a Hot Environment
Occupational Safety and Health Council 8
4. Results
4.1. Review and identification of two cooling vests
There are three main types of cooling systems: active, passive and combo
(combine the active and passive methods) (Chi et al., 2008). Active cooling
systems include external connections to air or liquid supplies such as
ventilated cooled air cooling (Shapiro et al., 1982; Pimental et al., 1987;
Kuklane et al., 2000) and circulated liquid cooling (Shapiro et al., 1982;
Pimental et al., 1988; Jetté, 2004) or without external connections such as a
battery driven ambient air fan based garment (Shapiro et al.,1982; Hadid et al.,
2008). Active cooling has the ability to reduce both the cardiovascular and
thermoregulatory strain (Selkirk et al., 2004). Passive cooling systems utilize
phase change materials (e.g. ice, frozen gel, salt, paraffin, etc.) in vests and
clothing (Bennett et al., 1995; Webster et al., 2005; Carter et al., 2007; Choi et
al., 2008; Chou et al., 2008; Reinertsen et al., 2008). Phase change materials
as the heat exchange mediums (Yu-Tsuan et al., 2000), are characterized by
their ability to absorb energy when they change from a solid to a liquid state
and to release heat as they return to the solid phase (Reinertsen et al., 2008).
Frozen gel has been demonstrated to be effective in reducing thermal strain
(Bennett et al., 1995; Choi et al., 2008) and enhancing endurance (Webster et
al., 2005). Researches on personal cooling equipment have been widely
discussed in military, fire-fighting, sports and a few industries (such as the
power industry and agriculture) (e.g. Pimental & Avellini, 1992; Chou et al.,
2008; Webster et al., 2005; Furtado et al., 2007; Choi et al., 2008).
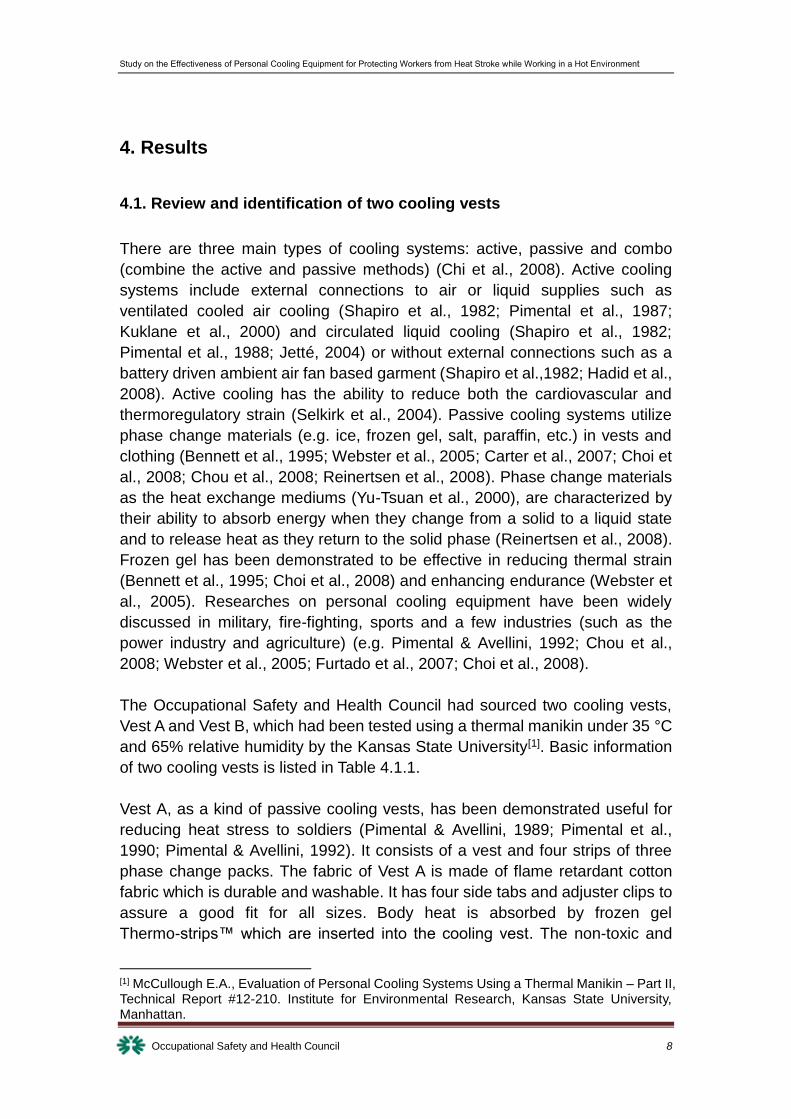
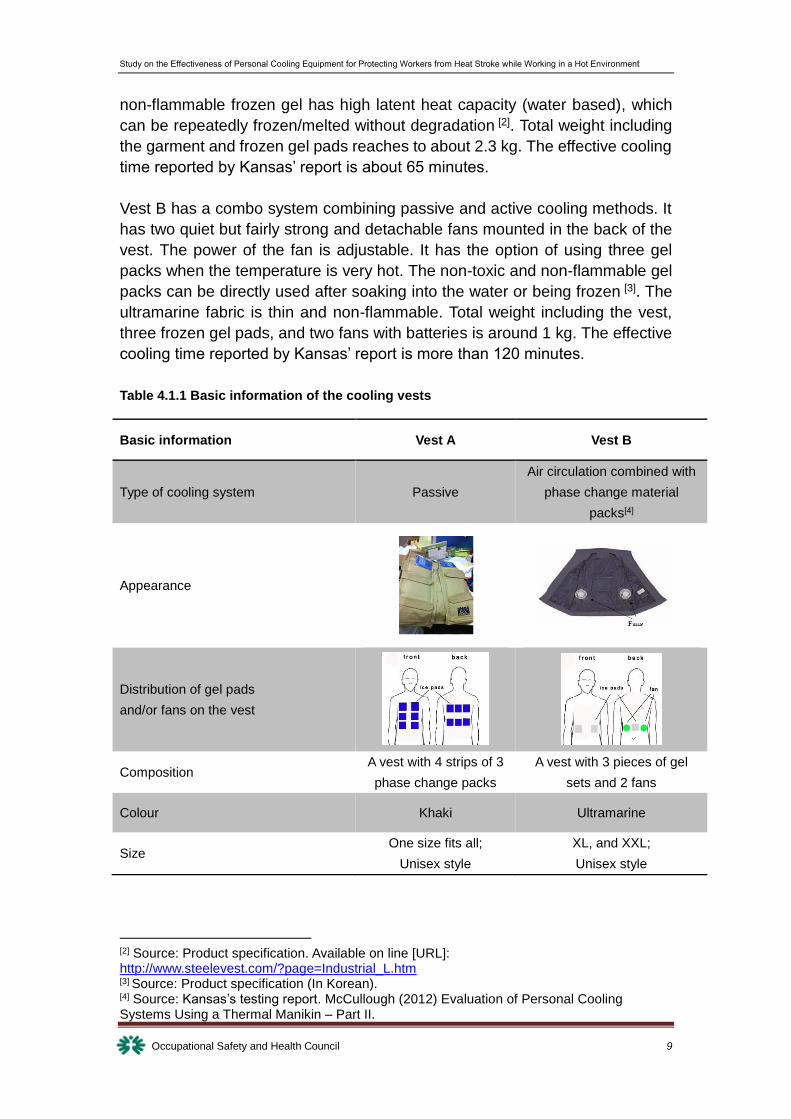
The Occupational Safety and Health Council had sourced two cooling vests,
Vest A and Vest B, which had been tested using a thermal manikin under 35 °C
and 65% relative humidity by the Kansas State University[1]. Basic information
of two cooling vests is listed in Table 4.1.1.
Vest A, as a kind of passive cooling vests, has been demonstrated useful for
reducing heat stress to soldiers (Pimental & Avellini, 1989; Pimental et al.,
1990; Pimental & Avellini, 1992). It consists of a vest and four strips of three
phase change packs. The fabric of Vest A is made of flame retardant cotton
fabric which is durable and washable. It has four side tabs and adjuster clips to
assure a good fit for all sizes. Body heat is absorbed by frozen gel
Thermo-strips™ which are inserted into the cooling vest. The non-toxic and
[1] McCullough E.A., Evaluation of Personal Cooling Systems Using a Thermal Manikin – Part II, Technical Report #12-210. Institute for Environmental Research, Kansas State University, Manhattan.
Study on the Effectiveness of Personal Cooling Equipment for Protecting Workers from Heat Stroke while Working in a Hot Environment
Occupational Safety and Health Council 9
non-flammable frozen gel has high latent heat capacity (water based), which
can be repeatedly frozen/melted without degradation [2]. Total weight including
the garment and frozen gel pads reaches to about 2.3 kg. The effective cooling
time reported by Kansas’ report is about 65 minutes.
Vest B has a combo system combining passive and active cooling methods. It
has two quiet but fairly strong and detachable fans mounted in the back of the
vest. The power of the fan is adjustable. It has the option of using three gel
packs when the temperature is very hot. The non-toxic and non-flammable gel
packs can be directly used after soaking into the water or being frozen [3]. The
ultramarine fabric is thin and non-flammable. Total weight including the vest,
three frozen gel pads, and two fans with batteries is around 1 kg. The effective
cooling time reported by Kansas’ report is more than 120 minutes.
Table 4.1.1 Basic information of the cooling vests
Basic information Vest A Vest B
Type of cooling system Passive
Air circulation combined with
phase change material
packs[4]
Appearance
Distribution of gel pads
and/or fans on the vest
Composition A vest with 4 strips of 3
phase change packs
A vest with 3 pieces of gel
sets and 2 fans
Colour Khaki Ultramarine
Size One size fits all;
Unisex style
XL, and XXL;
Unisex style
[2] Source: Product specification. Available on line [URL]: http://www.steelevest.com/?page=Industrial_L.htm [3] Source: Product specification (In Korean). [4] Source: Kansas’s testing report. McCullough (2012) Evaluation of Personal Cooling Systems Using a Thermal Manikin – Part II.
Study on the Effectiveness of Personal Cooling Equipment for Protecting Workers from Heat Stroke while Working in a Hot Environment
Occupational Safety and Health Council 10
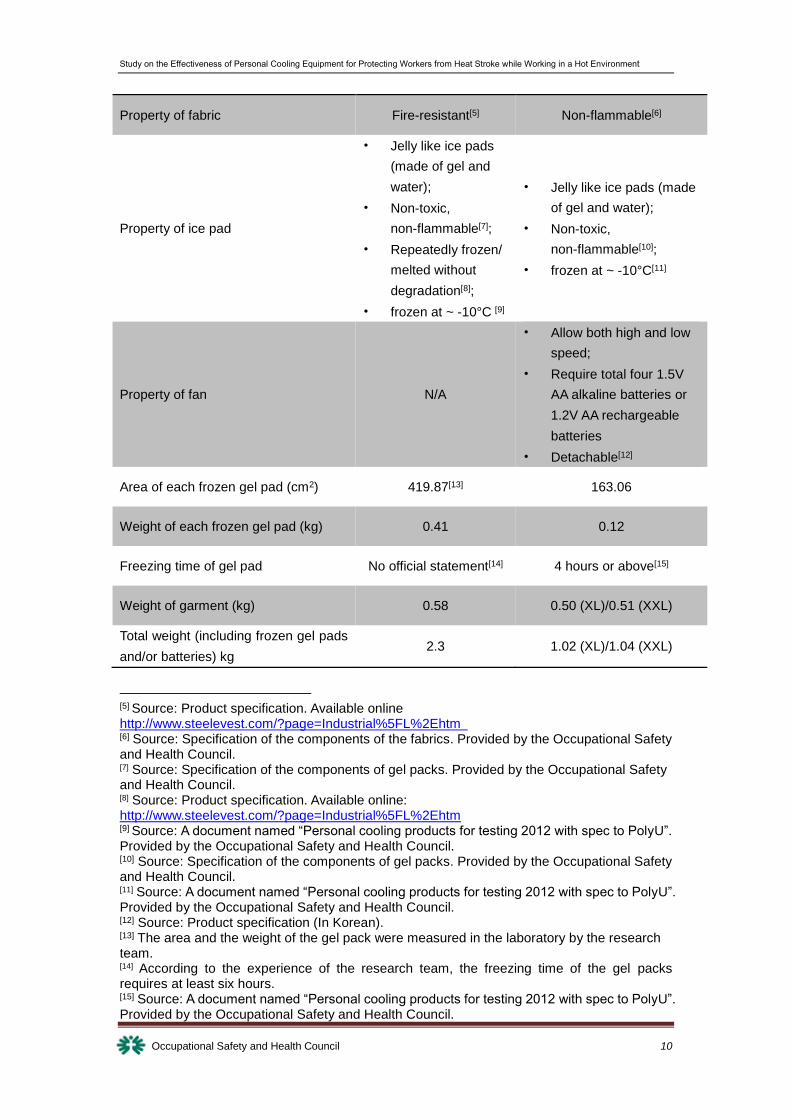
Property of fabric Fire-resistant[5] Non-flammable[6]
Property of ice pad
• Jelly like ice pads
(made of gel and
water);
• Non-toxic,
non-flammable[7];
• Repeatedly frozen/
melted without
degradation[8];
• frozen at ~ -10°C [9]
• Jelly like ice pads (made
of gel and water);
• Non-toxic,
non-flammable[10];
• frozen at ~ -10°C[11]
Property of fan N/A
• Allow both high and low
speed;
• Require total four 1.5V
AA alkaline batteries or
1.2V AA rechargeable
batteries
• Detachable[12]
Area of each frozen gel pad (cm2) 419.87[13] 163.06
Weight of each frozen gel pad (kg) 0.41 0.12
Freezing time of gel pad No official statement[14] 4 hours or above[15]
Weight of garment (kg) 0.58 0.50 (XL)/0.51 (XXL)
Total weight (including frozen gel pads
and/or batteries) kg 2.3 1.02 (XL)/1.04 (XXL)
[5] Source: Product specification. Available online http://www.steelevest.com/?page=Industrial%5FL%2Ehtm [6] Source: Specification of the components of the fabrics. Provided by the Occupational Safety and Health Council. [7] Source: Specification of the components of gel packs. Provided by the Occupational Safety and Health Council. [8] Source: Product specification. Available online: http://www.steelevest.com/?page=Industrial%5FL%2Ehtm [9] Source: A document named “Personal cooling products for testing 2012 with spec to PolyU”. Provided by the Occupational Safety and Health Council. [10] Source: Specification of the components of gel packs. Provided by the Occupational Safety and Health Council. [11] Source: A document named “Personal cooling products for testing 2012 with spec to PolyU”. Provided by the Occupational Safety and Health Council. [12] Source: Product specification (In Korean). [13] The area and the weight of the gel pack were measured in the laboratory by the research team. [14] According to the experience of the research team, the freezing time of the gel packs requires at least six hours. [15] Source: A document named “Personal cooling products for testing 2012 with spec to PolyU”. Provided by the Occupational Safety and Health Council.
Study on the Effectiveness of Personal Cooling Equipment for Protecting Workers from Heat Stroke while Working in a Hot Environment
Occupational Safety and Health Council 11
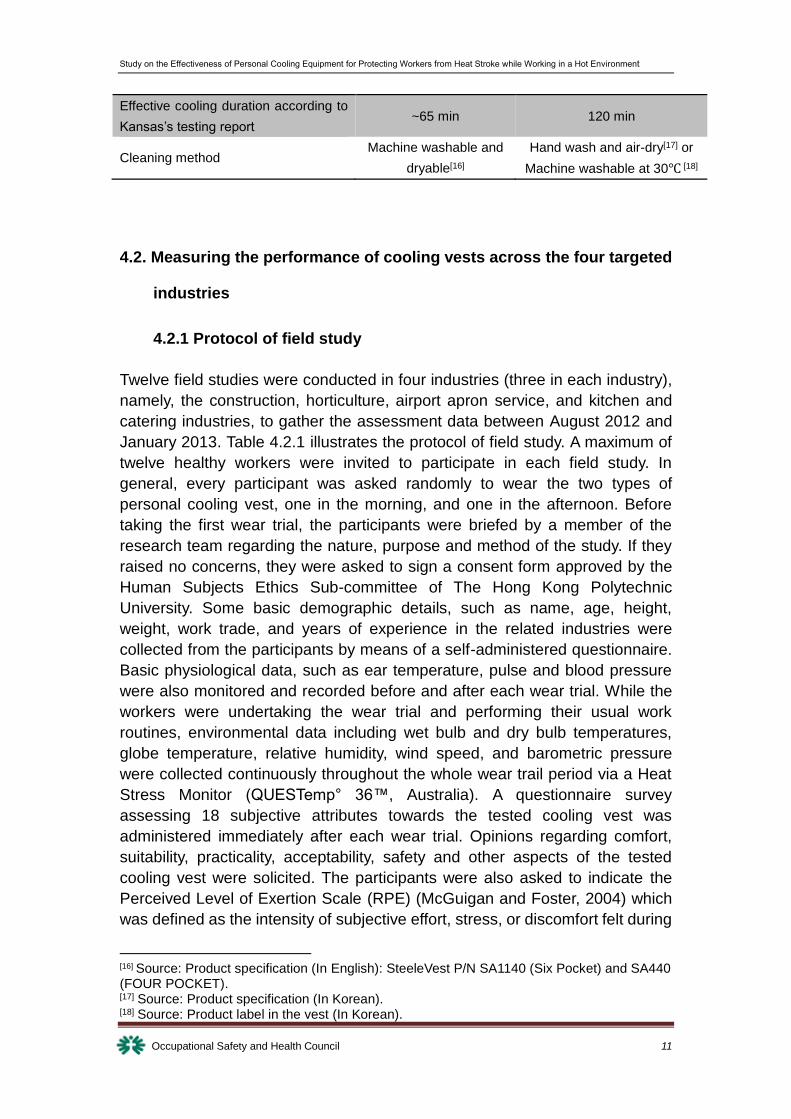
Effective cooling duration according to
Kansas’s testing report ~65 min 120 min
Cleaning method Machine washable and
dryable[16]
Hand wash and air-dry[17] or
Machine washable at 30℃ [18]
4.2. Measuring the performance of cooling vests across the four targeted
industries
4.2.1 Protocol of field study
Twelve field studies were conducted in four industries (three in each industry),
namely, the construction, horticulture, airport apron service, and kitchen and
catering industries, to gather the assessment data between August 2012 and
January 2013. Table 4.2.1 illustrates the protocol of field study. A maximum of
twelve healthy workers were invited to participate in each field study. In
general, every participant was asked randomly to wear the two types of
personal cooling vest, one in the morning, and one in the afternoon. Before
taking the first wear trial, the participants were briefed by a member of the
research team regarding the nature, purpose and method of the study. If they
raised no concerns, they were asked to sign a consent form approved by the
Human Subjects Ethics Sub-committee of The Hong Kong Polytechnic
University. Some basic demographic details, such as name, age, height,
weight, work trade, and years of experience in the related industries were
collected from the participants by means of a self-administered questionnaire.
Basic physiological data, such as ear temperature, pulse and blood pressure
were also monitored and recorded before and after each wear trial. While the
workers were undertaking the wear trial and performing their usual work
routines, environmental data including wet bulb and dry bulb temperatures,
globe temperature, relative humidity, wind speed, and barometric pressure
were collected continuously throughout the whole wear trail period via a Heat
Stress Monitor (QUESTemp° 36™, Australia). A questionnaire survey
assessing 18 subjective attributes towards the tested cooling vest was
administered immediately after each wear trial. Opinions regarding comfort,
suitability, practicality, acceptability, safety and other aspects of the tested
cooling vest were solicited. The participants were also asked to indicate the
Perceived Level of Exertion Scale (RPE) (McGuigan and Foster, 2004) which
was defined as the intensity of subjective effort, stress, or discomfort felt during
[16] Source: Product specification (In English): SteeleVest P/N SA1140 (Six Pocket) and SA440 (FOUR POCKET). [17] Source: Product specification (In Korean). [18] Source: Product label in the vest (In Korean).
Study on the Effectiveness of Personal Cooling Equipment for Protecting Workers from Heat Stroke while Working in a Hot Environment
Occupational Safety and Health Council 12
physical activity (rating from 0=rest to 10=maximal effort) and give their
comments on the cooling vest. Furthermore, the participants were asked to
choose a preferred cooling vest after they completed both wear trials.
Appendix A attaches the figures of the equipment for collecting the
physiological and environmental data and a copy of blank questionnaire.
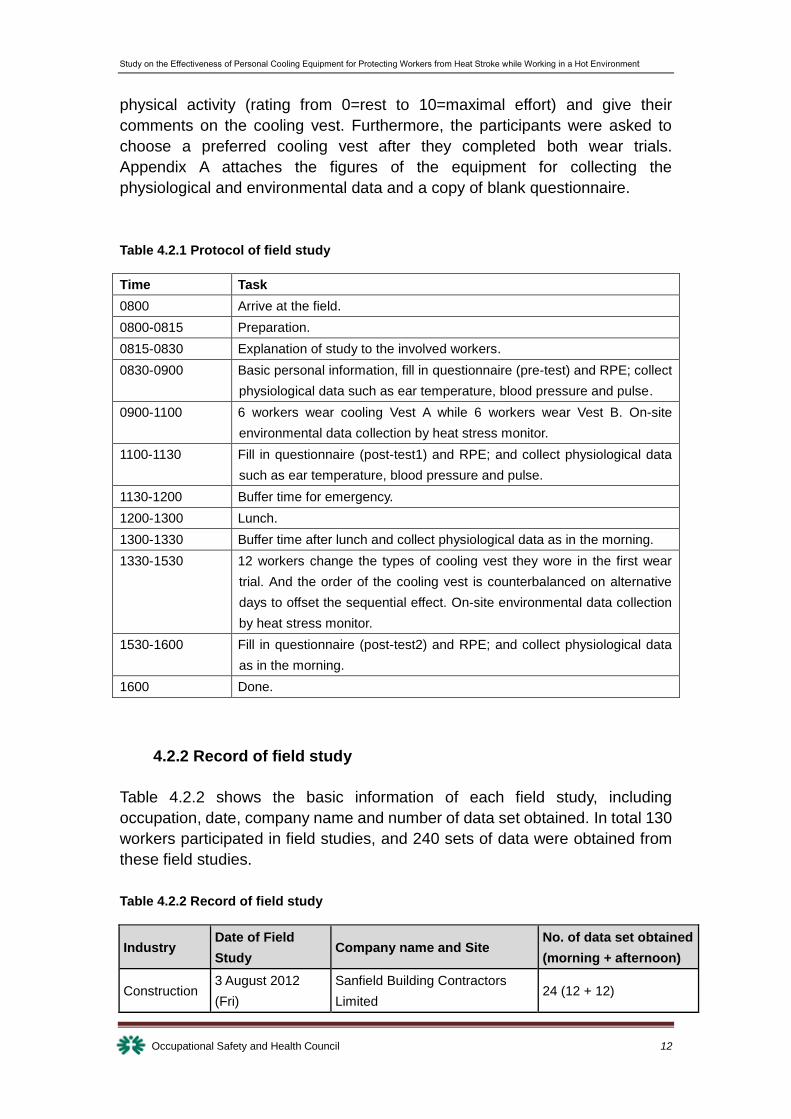
Table 4.2.1 Protocol of field study
Time Task
0800 Arrive at the field.
0800-0815 Preparation.
0815-0830 Explanation of study to the involved workers.
0830-0900 Basic personal information, fill in questionnaire (pre-test) and RPE; collect
physiological data such as ear temperature, blood pressure and pulse.
0900-1100 6 workers wear cooling Vest A while 6 workers wear Vest B. On-site
environmental data collection by heat stress monitor.
1100-1130 Fill in questionnaire (post-test1) and RPE; and collect physiological data
such as ear temperature, blood pressure and pulse.
1130-1200 Buffer time for emergency.
1200-1300 Lunch.
1300-1330 Buffer time after lunch and collect physiological data as in the morning.
1330-1530 12 workers change the types of cooling vest they wore in the first wear
trial. And the order of the cooling vest is counterbalanced on alternative
days to offset the sequential effect. On-site environmental data collection
by heat stress monitor.
1530-1600 Fill in questionnaire (post-test2) and RPE; and collect physiological data
as in the morning.
1600 Done.
4.2.2 Record of field study
Table 4.2.2 shows the basic information of each field study, including
occupation, date, company name and number of data set obtained. In total 130
workers participated in field studies, and 240 sets of data were obtained from
these field studies.
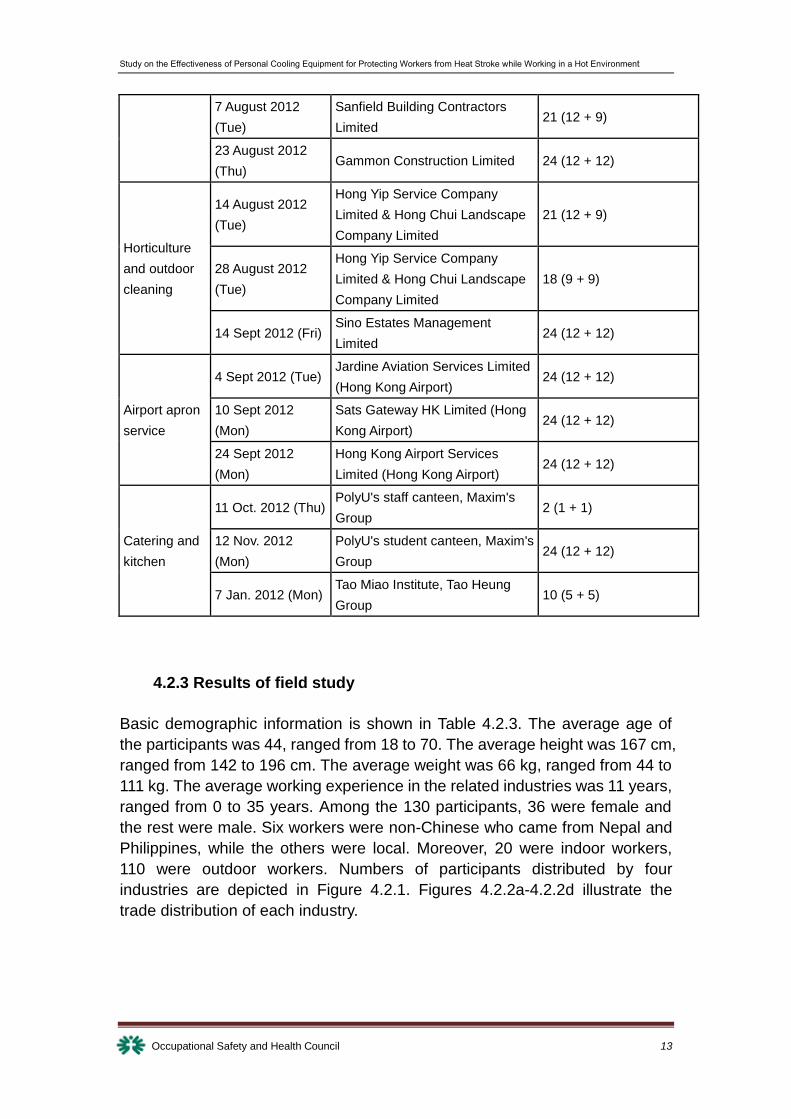
Table 4.2.2 Record of field study
Industry Date of Field
Study Company name and Site
No. of data set obtained
(morning + afternoon)
Construction 3 August 2012
(Fri)
Sanfield Building Contractors
Limited 24 (12 + 12)
Study on the Effectiveness of Personal Cooling Equipment for Protecting Workers from Heat Stroke while Working in a Hot Environment
Occupational Safety and Health Council 13
7 August 2012
(Tue)
Sanfield Building Contractors
Limited 21 (12 + 9)
23 August 2012
(Thu) Gammon Construction Limited 24 (12 + 12)
Horticulture
and outdoor
cleaning
14 August 2012
(Tue)
Hong Yip Service Company
Limited & Hong Chui Landscape
Company Limited
21 (12 + 9)
28 August 2012
(Tue)
Hong Yip Service Company
Limited & Hong Chui Landscape
Company Limited
18 (9 + 9)
14 Sept 2012 (Fri) Sino Estates Management
Limited 24 (12 + 12)
Airport apron
service
4 Sept 2012 (Tue) Jardine Aviation Services Limited
(Hong Kong Airport) 24 (12 + 12)
10 Sept 2012
(Mon)
Sats Gateway HK Limited (Hong
Kong Airport) 24 (12 + 12)
24 Sept 2012
(Mon)
Hong Kong Airport Services
Limited (Hong Kong Airport) 24 (12 + 12)
Catering and
kitchen
11 Oct. 2012 (Thu) PolyU's staff canteen, Maxim's
Group 2 (1 + 1)
12 Nov. 2012
(Mon)
PolyU's student canteen, Maxim's
Group 24 (12 + 12)
7 Jan. 2012 (Mon) Tao Miao Institute, Tao Heung
Group 10 (5 + 5)
4.2.3 Results of field study
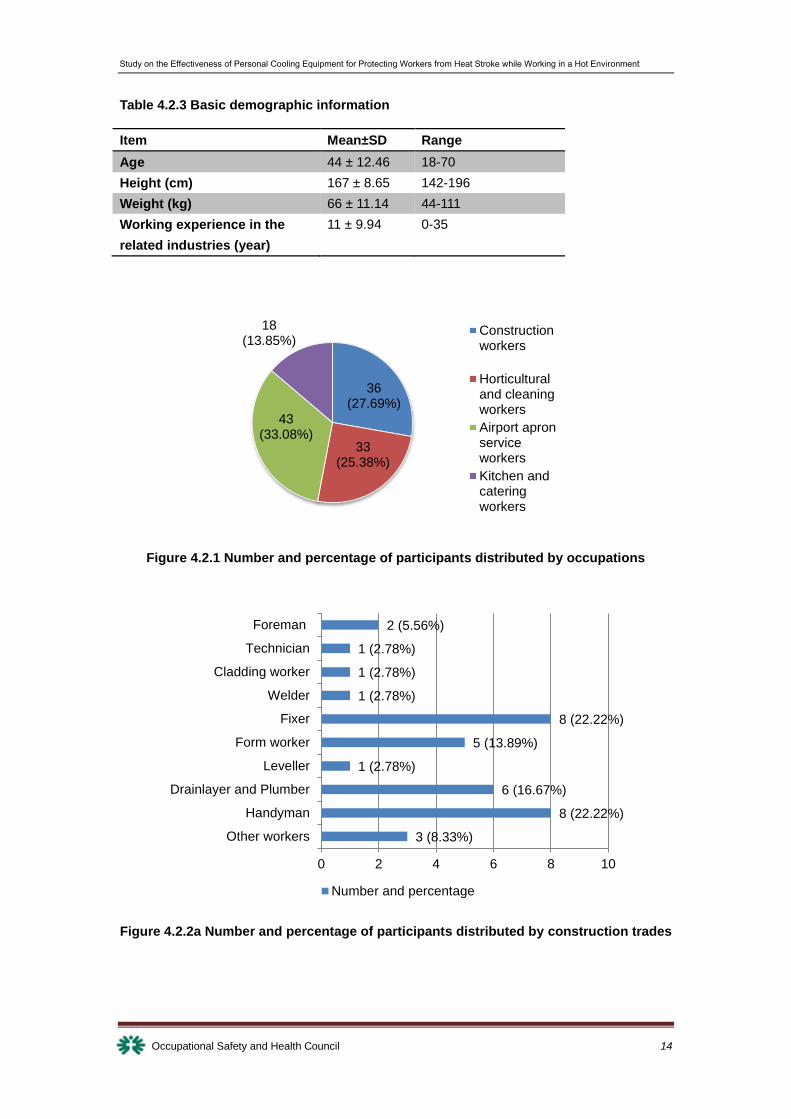
Basic demographic information is shown in Table 4.2.3. The average age of
the participants was 44, ranged from 18 to 70. The average height was 167 cm,
ranged from 142 to 196 cm. The average weight was 66 kg, ranged from 44 to
111 kg. The average working experience in the related industries was 11 years,
ranged from 0 to 35 years. Among the 130 participants, 36 were female and
the rest were male. Six workers were non-Chinese who came from Nepal and
Philippines, while the others were local. Moreover, 20 were indoor workers,
110 were outdoor workers. Numbers of participants distributed by four
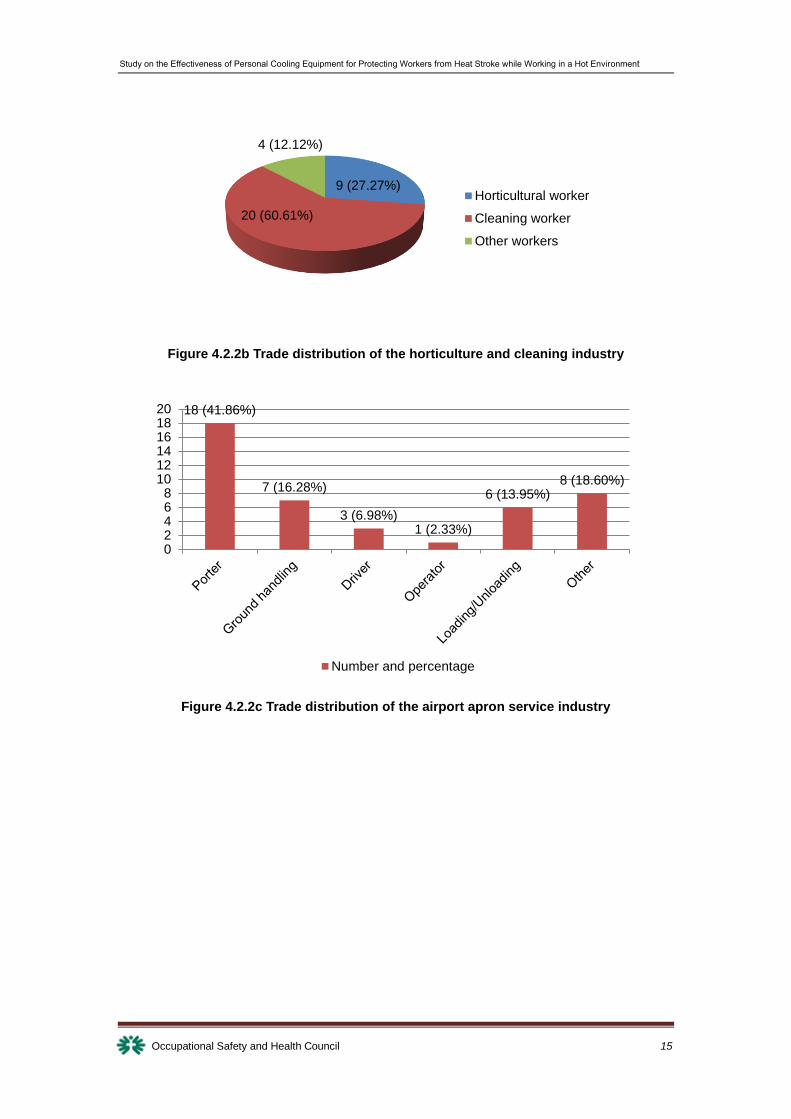
industries are depicted in Figure 4.2.1. Figures 4.2.2a-4.2.2d illustrate the
trade distribution of each industry.
Study on the Effectiveness of Personal Cooling Equipment for Protecting Workers from Heat Stroke while Working in a Hot Environment
Occupational Safety and Health Council 14
Table 4.2.3 Basic demographic information
Item Mean±SD Range
Age 44 ± 12.46 18-70
Height (cm) 167 ± 8.65 142-196
Weight (kg) 66 ± 11.14 44-111
Working experience in the
related industries (year)
11 ± 9.94 0-35
Figure 4.2.1 Number and percentage of participants distributed by occupations
Figure 4.2.2a Number and percentage of participants distributed by construction trades
36 (27.69%)
33 (25.38%)
43 (33.08%)
18 (13.85%)
Constructionworkers
Horticulturaland cleaningworkers
Airport apronserviceworkers
Kitchen andcateringworkers
3 (8.33%)
8 (22.22%)
6 (16.67%)
1 (2.78%)
5 (13.89%)
8 (22.22%)
1 (2.78%)
1 (2.78%)
1 (2.78%)
2 (5.56%)
0 2 4 6 8 10
Other workers
Handyman
Drainlayer and Plumber
Leveller
Form worker
Fixer
Welder
Cladding worker
Technician
Foreman
Number and percentage
Study on the Effectiveness of Personal Cooling Equipment for Protecting Workers from Heat Stroke while Working in a Hot Environment
Occupational Safety and Health Council 15
Figure 4.2.2b Trade distribution of the horticulture and cleaning industry
Figure 4.2.2c Trade distribution of the airport apron service industry
9 (27.27%)
20 (60.61%)
4 (12.12%)
Horticultural worker
Cleaning worker
Other workers
18 (41.86%)
7 (16.28%)
3 (6.98%)1 (2.33%)
6 (13.95%)8 (18.60%)
02468
101214161820
Number and percentage
Study on the Effectiveness of Personal Cooling Equipment for Protecting Workers from Heat Stroke while Working in a Hot Environment
Occupational Safety and Health Council 16
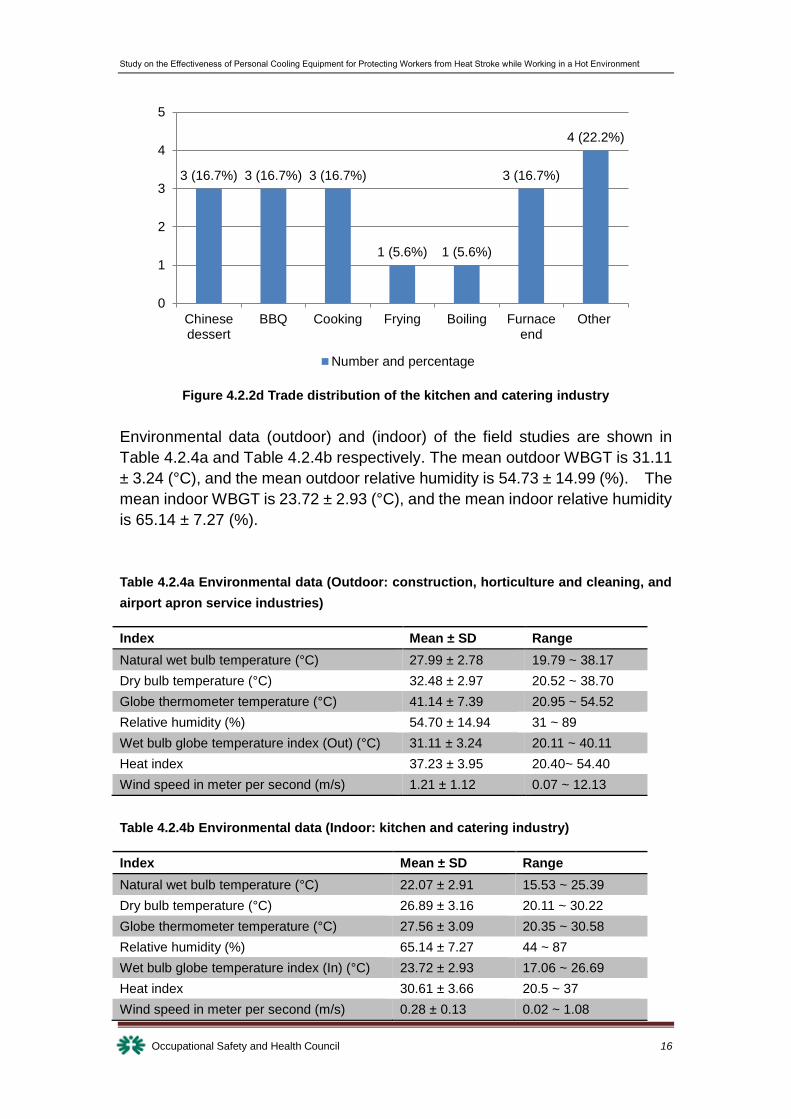
Figure 4.2.2d Trade distribution of the kitchen and catering industry
Environmental data (outdoor) and (indoor) of the field studies are shown in
Table 4.2.4a and Table 4.2.4b respectively. The mean outdoor WBGT is 31.11
± 3.24 (°C), and the mean outdoor relative humidity is 54.73 ± 14.99 (%). The
mean indoor WBGT is 23.72 ± 2.93 (°C), and the mean indoor relative humidity
is 65.14 ± 7.27 (%).
Table 4.2.4a Environmental data (Outdoor: construction, horticulture and cleaning, and
airport apron service industries)
Index Mean ± SD Range
Natural wet bulb temperature (°C) 27.99 ± 2.78 19.79 ~ 38.17
Dry bulb temperature (°C) 32.48 ± 2.97 20.52 ~ 38.70
Globe thermometer temperature (°C) 41.14 ± 7.39 20.95 ~ 54.52
Relative humidity (%) 54.70 ± 14.94 31 ~ 89
Wet bulb globe temperature index (Out) (°C) 31.11 ± 3.24 20.11 ~ 40.11
Heat index 37.23 ± 3.95 20.40~ 54.40
Wind speed in meter per second (m/s) 1.21 ± 1.12 0.07 ~ 12.13
Table 4.2.4b Environmental data (Indoor: kitchen and catering industry)
Index Mean ± SD Range
Natural wet bulb temperature (°C) 22.07 ± 2.91 15.53 ~ 25.39
Dry bulb temperature (°C) 26.89 ± 3.16 20.11 ~ 30.22
Globe thermometer temperature (°C) 27.56 ± 3.09 20.35 ~ 30.58
Relative humidity (%) 65.14 ± 7.27 44 ~ 87
Wet bulb globe temperature index (In) (°C) 23.72 ± 2.93 17.06 ~ 26.69
Heat index 30.61 ± 3.66 20.5 ~ 37
Wind speed in meter per second (m/s) 0.28 ± 0.13 0.02 ~ 1.08
3 (16.7%) 3 (16.7%) 3 (16.7%)
1 (5.6%) 1 (5.6%)
3 (16.7%)
4 (22.2%)
0
1
2
3
4
5
Chinesedessert
BBQ Cooking Frying Boiling Furnaceend
Other
Number and percentage
Study on the Effectiveness of Personal Cooling Equipment for Protecting Workers from Heat Stroke while Working in a Hot Environment
Occupational Safety and Health Council 17
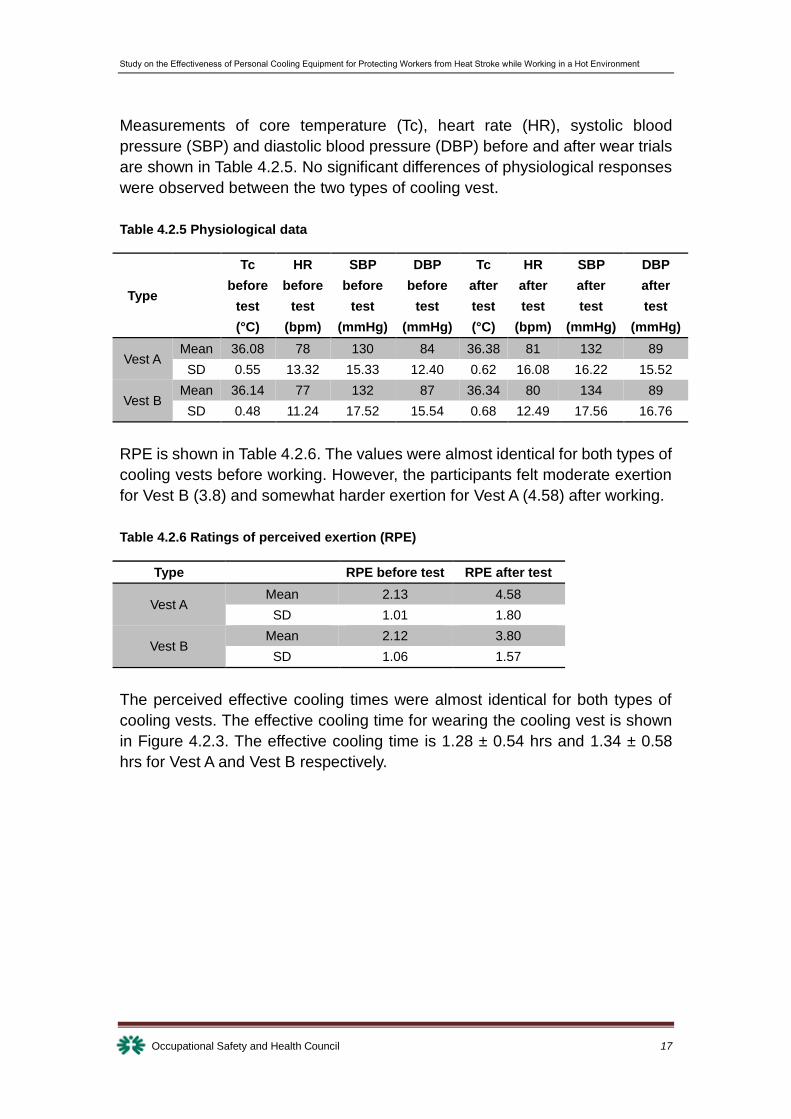
Measurements of core temperature (Tc), heart rate (HR), systolic blood
pressure (SBP) and diastolic blood pressure (DBP) before and after wear trials
are shown in Table 4.2.5. No significant differences of physiological responses
were observed between the two types of cooling vest.
Table 4.2.5 Physiological data
Type
Tc
before
test
(°C)
HR
before
test
(bpm)
SBP
before
test
(mmHg)
DBP
before
test
(mmHg)
Tc
after
test
(°C)
HR
after
test
(bpm)
SBP
after
test
(mmHg)
DBP
after
test
(mmHg)
Vest A Mean 36.08 78 130 84 36.38 81 132 89
SD 0.55 13.32 15.33 12.40 0.62 16.08 16.22 15.52
Vest B Mean 36.14 77 132 87 36.34 80 134 89
SD 0.48 11.24 17.52 15.54 0.68 12.49 17.56 16.76
RPE is shown in Table 4.2.6. The values were almost identical for both types of
cooling vests before working. However, the participants felt moderate exertion
for Vest B (3.8) and somewhat harder exertion for Vest A (4.58) after working.
Table 4.2.6 Ratings of perceived exertion (RPE)
Type
RPE before test RPE after test
Vest A Mean 2.13 4.58
SD 1.01 1.80
Vest B Mean 2.12 3.80
SD 1.06 1.57
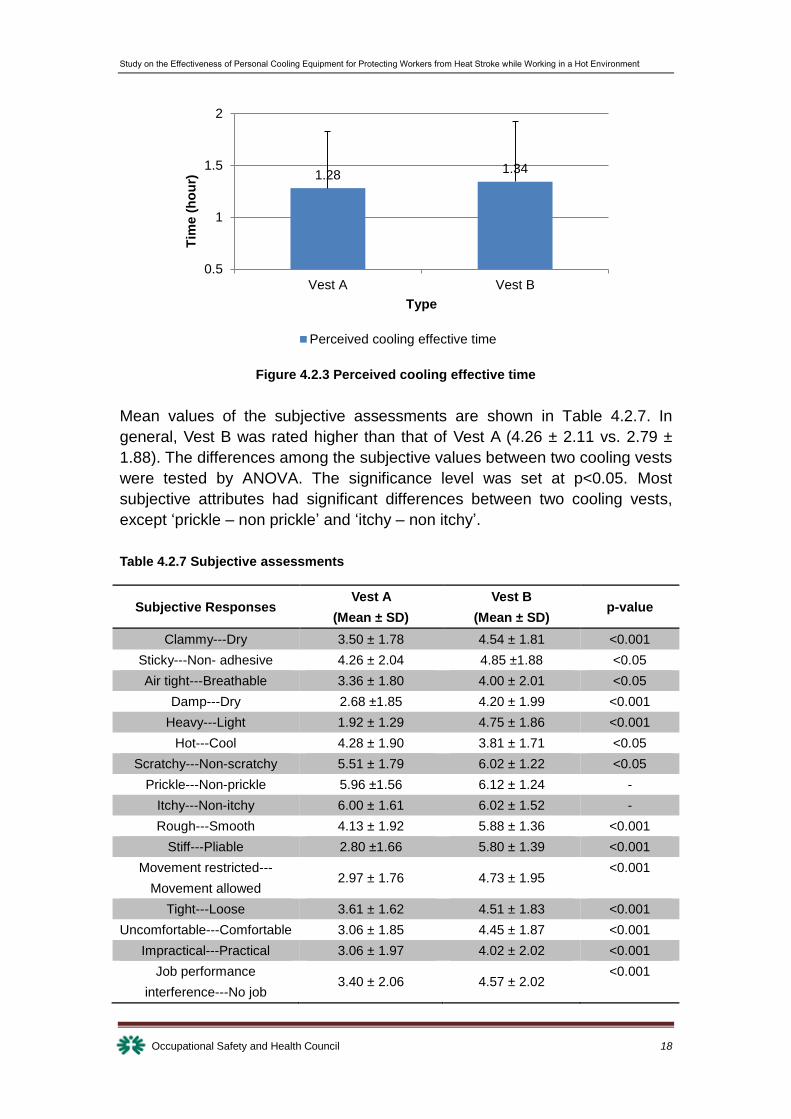
The perceived effective cooling times were almost identical for both types of
cooling vests. The effective cooling time for wearing the cooling vest is shown
in Figure 4.2.3. The effective cooling time is 1.28 ± 0.54 hrs and 1.34 ± 0.58
hrs for Vest A and Vest B respectively.
Study on the Effectiveness of Personal Cooling Equipment for Protecting Workers from Heat Stroke while Working in a Hot Environment
Occupational Safety and Health Council 18
Figure 4.2.3 Perceived cooling effective time
Mean values of the subjective assessments are shown in Table 4.2.7. In
general, Vest B was rated higher than that of Vest A (4.26 ± 2.11 vs. 2.79 ±
1.88). The differences among the subjective values between two cooling vests
were tested by ANOVA. The significance level was set at p<0.05. Most
subjective attributes had significant differences between two cooling vests,
except ‘prickle – non prickle’ and ‘itchy – non itchy’.
Table 4.2.7 Subjective assessments
Subjective Responses Vest A
(Mean ± SD)
Vest B
(Mean ± SD) p-value
Clammy---Dry 3.50 ± 1.78 4.54 ± 1.81 <0.001
Sticky---Non- adhesive 4.26 ± 2.04 4.85 ±1.88 <0.05
Air tight---Breathable 3.36 ± 1.80 4.00 ± 2.01 <0.05
Damp---Dry 2.68 ±1.85 4.20 ± 1.99 <0.001
Heavy---Light 1.92 ± 1.29 4.75 ± 1.86 <0.001
Hot---Cool 4.28 ± 1.90 3.81 ± 1.71 <0.05
Scratchy---Non-scratchy 5.51 ± 1.79 6.02 ± 1.22 <0.05
Prickle---Non-prickle 5.96 ±1.56 6.12 ± 1.24 -
Itchy---Non-itchy 6.00 ± 1.61 6.02 ± 1.52 -
Rough---Smooth 4.13 ± 1.92 5.88 ± 1.36 <0.001
Stiff---Pliable 2.80 ±1.66 5.80 ± 1.39 <0.001
Movement restricted---
Movement allowed 2.97 ± 1.76 4.73 ± 1.95
<0.001
Tight---Loose 3.61 ± 1.62 4.51 ± 1.83 <0.001
Uncomfortable---Comfortable 3.06 ± 1.85 4.45 ± 1.87 <0.001
Impractical---Practical 3.06 ± 1.97 4.02 ± 2.02 <0.001
Job performance
interference---No job 3.40 ± 2.06 4.57 ± 2.02
<0.001
1.281.34
0.5
1
1.5
2
Vest A Vest B
Tim
e (
ho
ur)
Type
Perceived cooling effective time
Study on the Effectiveness of Personal Cooling Equipment for Protecting Workers from Heat Stroke while Working in a Hot Environment
Occupational Safety and Health Council 19
performance interference
Unsafe---Safe 5.05 ± 1.72 5.52 ± 1.71 <0.05
Dislike---Like 2.79 ±1.88 4.26 ± 2.11 <0.001
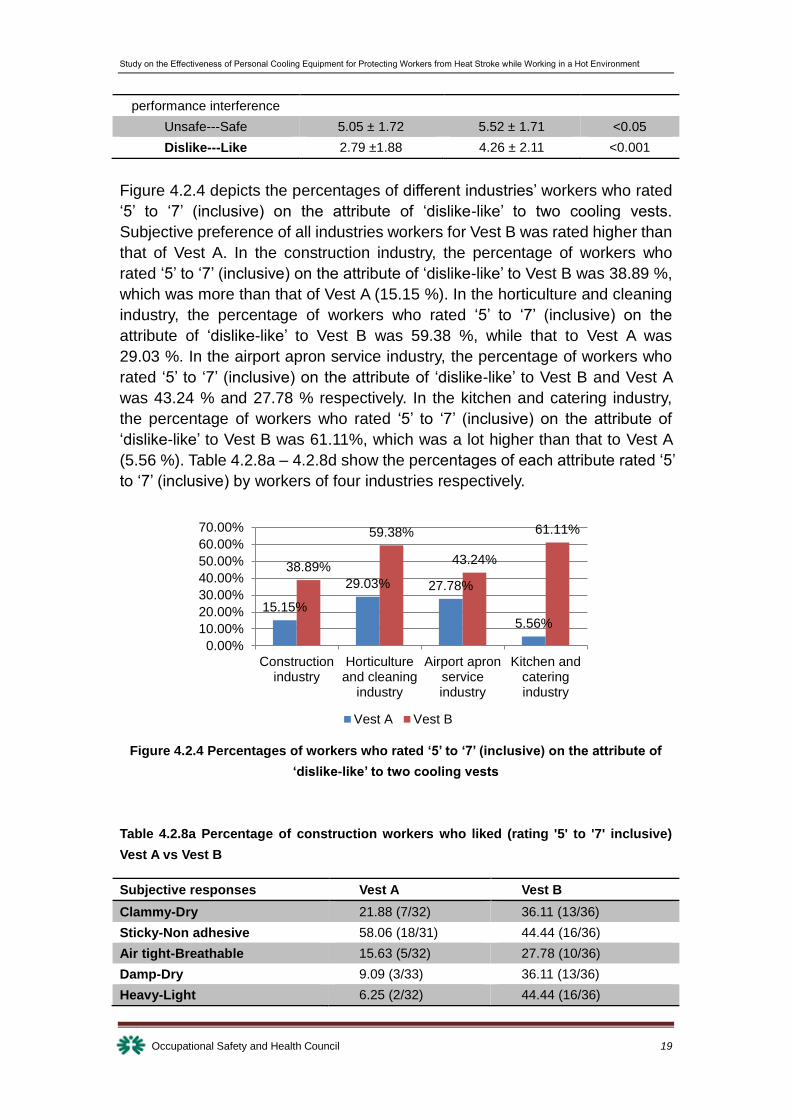
Figure 4.2.4 depicts the percentages of different industries’ workers who rated
‘5’ to ‘7’ (inclusive) on the attribute of ‘dislike-like’ to two cooling vests.
Subjective preference of all industries workers for Vest B was rated higher than
that of Vest A. In the construction industry, the percentage of workers who
rated ‘5’ to ‘7’ (inclusive) on the attribute of ‘dislike-like’ to Vest B was 38.89 %,
which was more than that of Vest A (15.15 %). In the horticulture and cleaning
industry, the percentage of workers who rated ‘5’ to ‘7’ (inclusive) on the
attribute of ‘dislike-like’ to Vest B was 59.38 %, while that to Vest A was
29.03 %. In the airport apron service industry, the percentage of workers who
rated ‘5’ to ‘7’ (inclusive) on the attribute of ‘dislike-like’ to Vest B and Vest A
was 43.24 % and 27.78 % respectively. In the kitchen and catering industry,
the percentage of workers who rated ‘5’ to ‘7’ (inclusive) on the attribute of
‘dislike-like’ to Vest B was 61.11%, which was a lot higher than that to Vest A
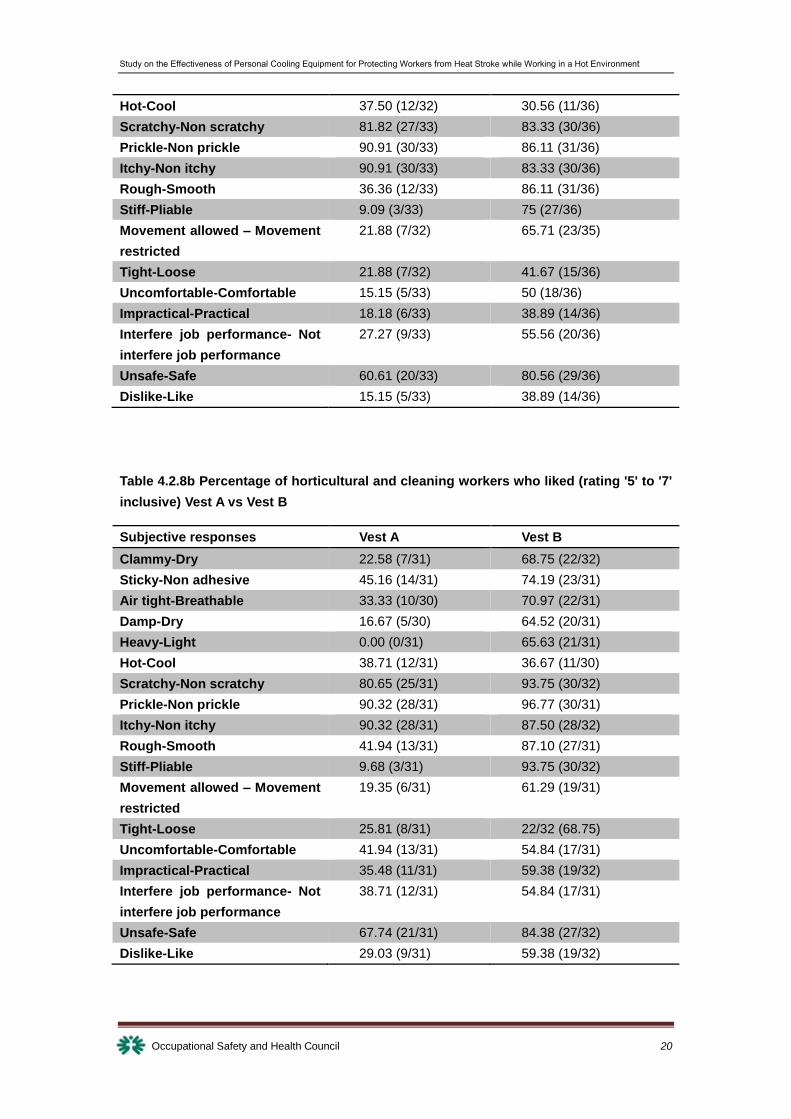
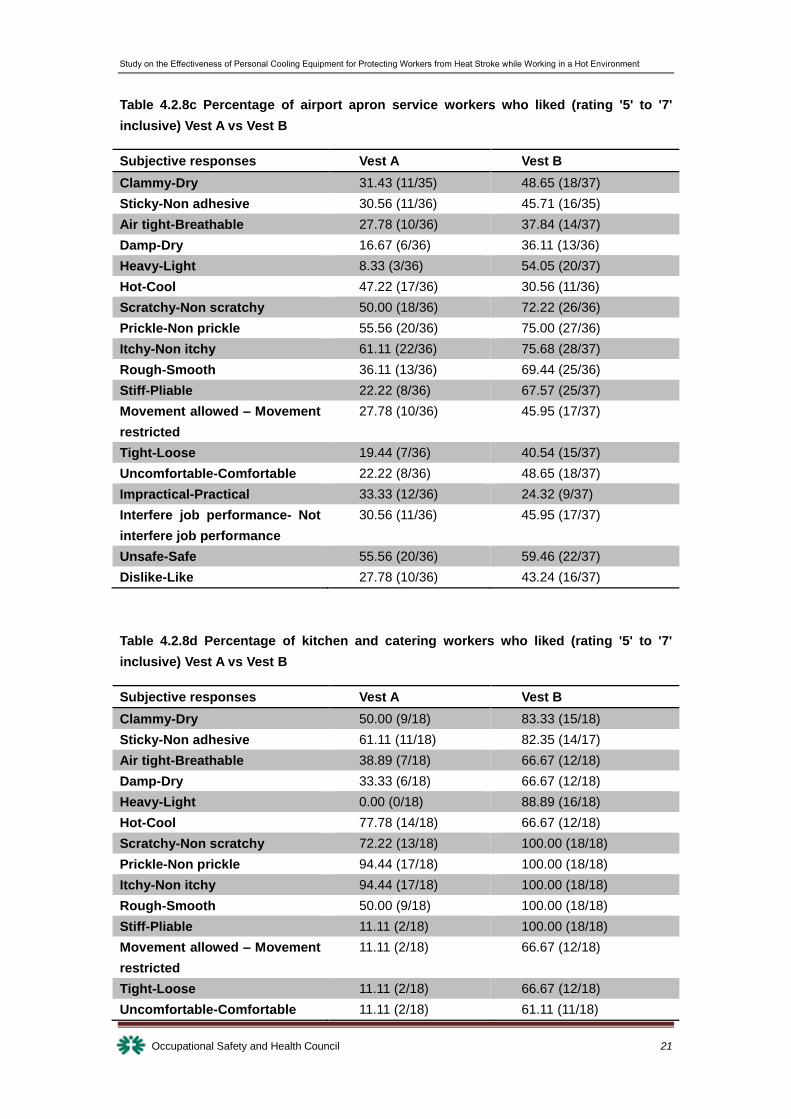
(5.56 %). Table 4.2.8a – 4.2.8d show the percentages of each attribute rated ‘5’
to ‘7’ (inclusive) by workers of four industries respectively.
Figure 4.2.4 Percentages of workers who rated ‘5’ to ‘7’ (inclusive) on the attribute of
‘dislike-like’ to two cooling vests
Table 4.2.8a Percentage of construction workers who liked (rating '5' to '7' inclusive)
Vest A vs Vest B
Subjective responses Vest A Vest B
Clammy-Dry 21.88 (7/32) 36.11 (13/36)
Sticky-Non adhesive 58.06 (18/31) 44.44 (16/36)
Air tight-Breathable 15.63 (5/32) 27.78 (10/36)
Damp-Dry 9.09 (3/33) 36.11 (13/36)
Heavy-Light 6.25 (2/32) 44.44 (16/36)
15.15%
29.03% 27.78%
5.56%
38.89%
59.38%
43.24%
61.11%
0.00%
10.00%
20.00%
30.00%
40.00%
50.00%
60.00%
70.00%
Constructionindustry
Horticultureand cleaning
industry
Airport apronserviceindustry
Kitchen andcateringindustry
Vest A Vest B
Study on the Effectiveness of Personal Cooling Equipment for Protecting Workers from Heat Stroke while Working in a Hot Environment
Occupational Safety and Health Council 20
Hot-Cool 37.50 (12/32) 30.56 (11/36)
Scratchy-Non scratchy 81.82 (27/33) 83.33 (30/36)
Prickle-Non prickle 90.91 (30/33) 86.11 (31/36)
Itchy-Non itchy 90.91 (30/33) 83.33 (30/36)
Rough-Smooth 36.36 (12/33) 86.11 (31/36)
Stiff-Pliable 9.09 (3/33) 75 (27/36)
Movement allowed – Movement
restricted
21.88 (7/32) 65.71 (23/35)
Tight-Loose 21.88 (7/32) 41.67 (15/36)
Uncomfortable-Comfortable 15.15 (5/33) 50 (18/36)
Impractical-Practical 18.18 (6/33) 38.89 (14/36)
Interfere job performance- Not
interfere job performance
27.27 (9/33) 55.56 (20/36)
Unsafe-Safe 60.61 (20/33) 80.56 (29/36)
Dislike-Like 15.15 (5/33) 38.89 (14/36)
Table 4.2.8b Percentage of horticultural and cleaning workers who liked (rating '5' to '7'
inclusive) Vest A vs Vest B
Subjective responses Vest A Vest B
Clammy-Dry 22.58 (7/31) 68.75 (22/32)
Sticky-Non adhesive 45.16 (14/31) 74.19 (23/31)
Air tight-Breathable 33.33 (10/30) 70.97 (22/31)
Damp-Dry 16.67 (5/30) 64.52 (20/31)
Heavy-Light 0.00 (0/31) 65.63 (21/31)
Hot-Cool 38.71 (12/31) 36.67 (11/30)
Scratchy-Non scratchy 80.65 (25/31) 93.75 (30/32)
Prickle-Non prickle 90.32 (28/31) 96.77 (30/31)
Itchy-Non itchy 90.32 (28/31) 87.50 (28/32)
Rough-Smooth 41.94 (13/31) 87.10 (27/31)
Stiff-Pliable 9.68 (3/31) 93.75 (30/32)
Movement allowed – Movement
restricted
19.35 (6/31) 61.29 (19/31)
Tight-Loose 25.81 (8/31) 22/32 (68.75)
Uncomfortable-Comfortable 41.94 (13/31) 54.84 (17/31)
Impractical-Practical 35.48 (11/31) 59.38 (19/32)
Interfere job performance- Not
interfere job performance
38.71 (12/31) 54.84 (17/31)
Unsafe-Safe 67.74 (21/31) 84.38 (27/32)
Dislike-Like 29.03 (9/31) 59.38 (19/32)
Study on the Effectiveness of Personal Cooling Equipment for Protecting Workers from Heat Stroke while Working in a Hot Environment
Occupational Safety and Health Council 21
Table 4.2.8c Percentage of airport apron service workers who liked (rating '5' to '7'
inclusive) Vest A vs Vest B
Subjective responses Vest A Vest B
Clammy-Dry 31.43 (11/35) 48.65 (18/37)
Sticky-Non adhesive 30.56 (11/36) 45.71 (16/35)
Air tight-Breathable 27.78 (10/36) 37.84 (14/37)
Damp-Dry 16.67 (6/36) 36.11 (13/36)
Heavy-Light 8.33 (3/36) 54.05 (20/37)
Hot-Cool 47.22 (17/36) 30.56 (11/36)
Scratchy-Non scratchy 50.00 (18/36) 72.22 (26/36)
Prickle-Non prickle 55.56 (20/36) 75.00 (27/36)
Itchy-Non itchy 61.11 (22/36) 75.68 (28/37)
Rough-Smooth 36.11 (13/36) 69.44 (25/36)
Stiff-Pliable 22.22 (8/36) 67.57 (25/37)
Movement allowed – Movement
restricted
27.78 (10/36) 45.95 (17/37)
Tight-Loose 19.44 (7/36) 40.54 (15/37)
Uncomfortable-Comfortable 22.22 (8/36) 48.65 (18/37)
Impractical-Practical 33.33 (12/36) 24.32 (9/37)
Interfere job performance- Not
interfere job performance
30.56 (11/36) 45.95 (17/37)
Unsafe-Safe 55.56 (20/36) 59.46 (22/37)
Dislike-Like 27.78 (10/36) 43.24 (16/37)
Table 4.2.8d Percentage of kitchen and catering workers who liked (rating '5' to '7'
inclusive) Vest A vs Vest B
Subjective responses Vest A Vest B
Clammy-Dry 50.00 (9/18) 83.33 (15/18)
Sticky-Non adhesive 61.11 (11/18) 82.35 (14/17)
Air tight-Breathable 38.89 (7/18) 66.67 (12/18)
Damp-Dry 33.33 (6/18) 66.67 (12/18)
Heavy-Light 0.00 (0/18) 88.89 (16/18)
Hot-Cool 77.78 (14/18) 66.67 (12/18)
Scratchy-Non scratchy 72.22 (13/18) 100.00 (18/18)
Prickle-Non prickle 94.44 (17/18) 100.00 (18/18)
Itchy-Non itchy 94.44 (17/18) 100.00 (18/18)
Rough-Smooth 50.00 (9/18) 100.00 (18/18)
Stiff-Pliable 11.11 (2/18) 100.00 (18/18)
Movement allowed – Movement
restricted
11.11 (2/18) 66.67 (12/18)
Tight-Loose 11.11 (2/18) 66.67 (12/18)
Uncomfortable-Comfortable 11.11 (2/18) 61.11 (11/18)
Study on the Effectiveness of Personal Cooling Equipment for Protecting Workers from Heat Stroke while Working in a Hot Environment
Occupational Safety and Health Council 22
Impractical-Practical 16.67 (3/18) 61.11 (11/18)
Interfere job performance- Not
interfere job performance
11.11 (2/18) 66.67 (12/18)
Unsafe-Safe 55.56 (10/18) 66.67 (12/18)
Dislike-Like 5.56 (1/18) 61.11 (11/18)
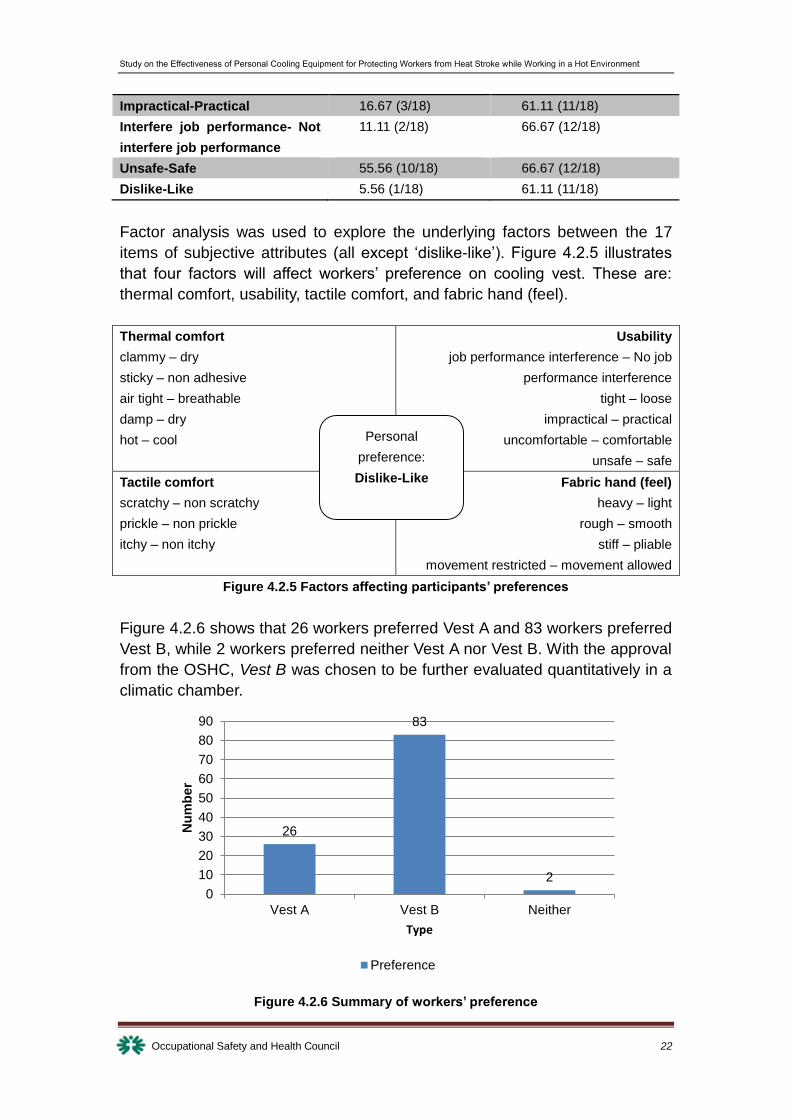
Factor analysis was used to explore the underlying factors between the 17
items of subjective attributes (all except ‘dislike-like’). Figure 4.2.5 illustrates
that four factors will affect workers’ preference on cooling vest. These are:
thermal comfort, usability, tactile comfort, and fabric hand (feel).
Thermal comfort
clammy – dry
sticky – non adhesive
air tight – breathable
damp – dry
hot – cool
Usability
job performance interference – No job
performance interference
tight – loose
impractical – practical
uncomfortable – comfortable
unsafe – safe
Tactile comfort
scratchy – non scratchy
prickle – non prickle
itchy – non itchy
Fabric hand (feel)
heavy – light
rough – smooth
stiff – pliable
movement restricted – movement allowed
Figure 4.2.5 Factors affecting participants’ preferences
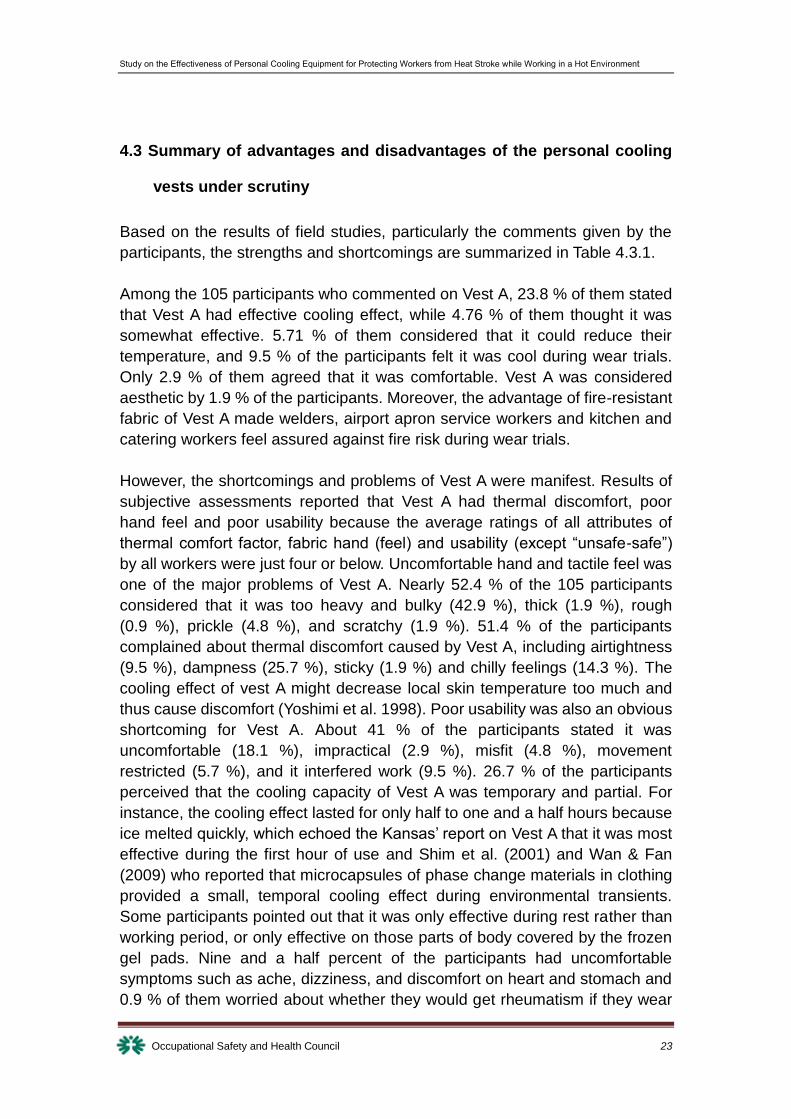
Figure 4.2.6 shows that 26 workers preferred Vest A and 83 workers preferred
Vest B, while 2 workers preferred neither Vest A nor Vest B. With the approval
from the OSHC, Vest B was chosen to be further evaluated quantitatively in a
climatic chamber.
Figure 4.2.6 Summary of workers’ preference
26
83
2
0
10
20
30
40
50
60
70
80
90
Vest A Vest B Neither
Nu
mb
er
Type
Preference
Personal
preference:
Dislike-Like
Study on the Effectiveness of Personal Cooling Equipment for Protecting Workers from Heat Stroke while Working in a Hot Environment
Occupational Safety and Health Council 23
4.3 Summary of advantages and disadvantages of the personal cooling
vests under scrutiny
Based on the results of field studies, particularly the comments given by the
participants, the strengths and shortcomings are summarized in Table 4.3.1.
Among the 105 participants who commented on Vest A, 23.8 % of them stated
that Vest A had effective cooling effect, while 4.76 % of them thought it was
somewhat effective. 5.71 % of them considered that it could reduce their
temperature, and 9.5 % of the participants felt it was cool during wear trials.
Only 2.9 % of them agreed that it was comfortable. Vest A was considered
aesthetic by 1.9 % of the participants. Moreover, the advantage of fire-resistant
fabric of Vest A made welders, airport apron service workers and kitchen and
catering workers feel assured against fire risk during wear trials.
However, the shortcomings and problems of Vest A were manifest. Results of
subjective assessments reported that Vest A had thermal discomfort, poor
hand feel and poor usability because the average ratings of all attributes of
thermal comfort factor, fabric hand (feel) and usability (except “unsafe-safe”)
by all workers were just four or below. Uncomfortable hand and tactile feel was
one of the major problems of Vest A. Nearly 52.4 % of the 105 participants
considered that it was too heavy and bulky (42.9 %), thick (1.9 %), rough
(0.9 %), prickle (4.8 %), and scratchy (1.9 %). 51.4 % of the participants
complained about thermal discomfort caused by Vest A, including airtightness
(9.5 %), dampness (25.7 %), sticky (1.9 %) and chilly feelings (14.3 %). The
cooling effect of vest A might decrease local skin temperature too much and
thus cause discomfort (Yoshimi et al. 1998). Poor usability was also an obvious
shortcoming for Vest A. About 41 % of the participants stated it was
uncomfortable (18.1 %), impractical (2.9 %), misfit (4.8 %), movement
restricted (5.7 %), and it interfered work (9.5 %). 26.7 % of the participants
perceived that the cooling capacity of Vest A was temporary and partial. For
instance, the cooling effect lasted for only half to one and a half hours because
ice melted quickly, which echoed the Kansas’ report on Vest A that it was most
effective during the first hour of use and Shim et al. (2001) and Wan & Fan
(2009) who reported that microcapsules of phase change materials in clothing
provided a small, temporal cooling effect during environmental transients.
Some participants pointed out that it was only effective during rest rather than
working period, or only effective on those parts of body covered by the frozen
gel pads. Nine and a half percent of the participants had uncomfortable
symptoms such as ache, dizziness, and discomfort on heart and stomach and
0.9 % of them worried about whether they would get rheumatism if they wear
Study on the Effectiveness of Personal Cooling Equipment for Protecting Workers from Heat Stroke while Working in a Hot Environment
Occupational Safety and Health Council 24
Vest A.
The ratings of all subjective attributes on Vest B were at four or above, which
implied that it had better thermal comfort (except “hot-cool”), fabric hand feel,
tactile comfort and usability than Vest A. Among 106 participants who gave
comments on Vest B, 16.2 % of them stated it was effective, while 13.3 % of
them thought it was somewhat effective. Cool feeling from two fans (15.1 %)
and comfortable perceptions (9.4 %) were the major reported advantages.
Other strengths such as dryness, thinness, and lightness (6.6 %), collectively
made it more acceptable and satisfied by the participants.
However, Vest B is not without disadvantages. The major shortcoming of Vest
B was the limited cooling capacity perceived by the participants (40.6 %). Most
participants could not feel the cooling effect when they worked under direct
sunlight or with high workloads. The sense of cooling was insufficient because
of the limited amount of phase change materials and covering area (Choi et al.,
2008; Gao et al., 2010) where the upper part of the body, the neck and the
head still felt hot during wear trials. Thirty-one percent of the participants
complained that it had poor thermal comfort. For instance, the dark colour
absorbed much heat from the surrounding hot environment (4.7 %). Thermal
discomfort also included dampness (6.6 %), airtight (12.3 %), hot outdoor
(4.7 %) and chilly indoor (2.8 %). Some participants also stated that Vest B
was impractical (2.8 %), misfit (4.7 %), and impeding works by adding
workload (6.6 %). Some participants considered that it was inconvenient to use
because of the non-durable fabric (1.9 %) and noisy fans (1.9 %). Moreover,
the fans could induce discomfort to the waist and blow hot air from surrounding
environment (12.3 %). About two percent of the participants were also
concerned about the potential safety hazards of the fabric and electronic fan.
Furthermore, Vest B had two distinct shortcomings. First, using common
alkaline batteries was not environmental friendly, while using rechargeable
batteries required a lengthy charge-up time and was unreliable. Second, Vest
B had to be washed by hand and air-dried, which was also time consuming
and labour intensive.

Study on the Effectiveness of Personal Cooling Equipment for Protecting Workers from Heat Stroke while Working in a Hot Environment
Occupational Safety and Health Council 25
Table 4.3.1 Advantages and disadvantages of Vest A and Vest B
Type Advantages Disadvantages
Vest A Effective in cooling down
temperature
Limited (temporary and
partly) cooling capacity
Fire-resistant Thermal discomfort
Aesthetic Heavy and other
uncomfortable hand and
tactile feel
Poor usability
Potential health problems
Vest B Effective in cooling down
temperature
Limited (temporary and
partly) cooling capacity
Light Thermal discomfort
Good effect of the fans Problems of fan, fabric and
batteries
Inconvenient to wash
4.4. Determination of the cooling capacity of the selected cooling vest
4.4.1 Protocol of treadmill running test inside a climatic chamber
Core temperature and heart rate were collected continuously and
simultaneously during the test. Core temperature was measured by an
ingestible CorTemp™ (HQInc., America) thermometer sensor (capsule) with a
CorTemp™ data recorder at a sampling frequency of 30 seconds. The data
recorder can detect the signal from the CorTemp™ sensor, then displays and
stores the data in memory. The data are transferred to a PC platform via the
CorTrack™ II software. Heart rate was measured outside the chamber by
Polar® (Finland) belt A every 60-second, and was measured inside the
chamber by Polar® belt B every second. The latter will transfer the data to the
computer through a sensor in the treadmill (h/p/cosmos® , Germany) which
synchronously records with running speed, distance, and time after installing
h/p/cosmos para control® and h/p/cosmos para graphics® . Appendix B
provides the figures of the abovementioned equipment.
The protocol of treadmill running test inside a climatic chamber is illustrated in
Table 4.4.1. Twenty-two healthy and fit participants were recruited from The
Hong Kong Polytechnic University and the Technological and Higher
Education Institute of Hong Kong. Participants having cardiovascular, or
oesophageal and other diseases would not be allowed to participate in this test.

Study on the Effectiveness of Personal Cooling Equipment for Protecting Workers from Heat Stroke while Working in a Hot Environment
Occupational Safety and Health Council 26
Selected participants were briefed the details of the climatic chamber treadmill
test, its objectives, requirements for participation, and potential risks prior to
the experiment. A day before the test, calibration of each capsule was
conducted to ensure its functionality. Then the calibrated capsule would be
delivered to the participant who would ingest it with warm water before s/he
went to bed. On the day of the test, the climatic chamber would be set and kept
constant at 33 °C and 75% respectively. As soon as the participant arrived,
s/he would be fed with breakfast or snack. After a proper briefing on the
protocol of treadmill running test, the participant was asked to complete some
basic demographic information and a consent form approved by the Human
Subjects Ethics Sub-committee of The Hong Kong Polytechnic University. A
registered nurse was engaged to station inside the chamber throughout the
whole exercise and would provide necessary medical care in case of
emergency.
The participants were asked to rest outside chamber for 30 minutes. Then they
were asked to wear a unified sportswear (a T-shirt and shorts) and Polar® belt
B, and rested on a backless chair inside the chamber for another 30 minutes to
get acclimated to the climatic chamber conditions. To minimize systematic
errors, the participants were randomly assigned to wear or not to wear a
cooling vest in the first running and recovery. This would be reversed in the
second running and recovery. The participants were initially asked to run at 5
km/h with 1% slope. The speed and slope would increase progressively to 9.5
km/h and 7%. The participants would be allowed to stop when their core
temperature reached 38.5 °C or if they were exhausted and requested to stop.
The participants would then be asked to rest and recover inside the chamber
for 40 minutes; and outside the chamber at room temperature for 20 minutes
or sooner to cool their core temperature down to the value before the first run.
In the second run, the participants would be asked to run with the same
progressive intensity and stopped when their core temperature reached
38.5 °C. After the second running, the participants would rest for 40 minutes
inside the climatic chamber. The participants’ core temperature, heart rate
would be monitored continuously and simultaneously throughout the entire
running and resting periods. Following each running and recovery period,
participants would be asked to report their RPE.
Table 4.4.1 Protocol of treadmill running test inside a climatic chamber
Duration Task
The day before test Calibration of capsule
Participants ingest capsule
30 min Chamber preparation;
Provide breakfast/snack;
Consent and basic demographic information
Study on the Effectiveness of Personal Cooling Equipment for Protecting Workers from Heat Stroke while Working in a Hot Environment
Occupational Safety and Health Council 27
30 min Rest outside the chamber
30 min Rest inside the chamber for adaptation
~ 30 min Start the 1st running with/without cooling vest;
- Increase the intensity of running progressively (Table 4.4.1a)
- Stop running when Tc of the participant reaches 38.5°C
40 min 1st recovery with/without cooling vest inside the climatic chamber
~20 min Rest outside the chamber
~ 30 min Start the 2nd running without/with cooling vest;
- Increase the intensity of running progressively (Table 4.4.1a)
- Stop running when Tc of the participant reaches 38.5°C
40 min 2nd recovery without/with cooling vest inside the climatic chamber
End
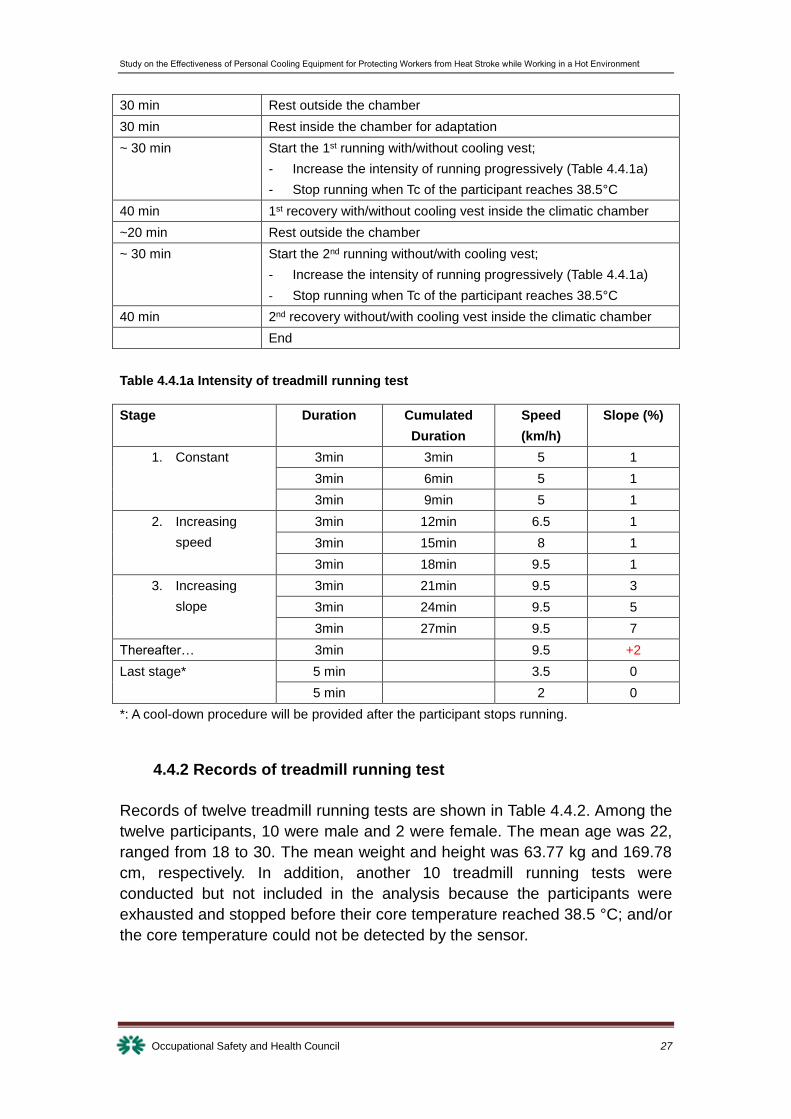
Table 4.4.1a Intensity of treadmill running test
Stage Duration Cumulated
Duration
Speed
(km/h)
Slope (%)
1. Constant 3min 3min 5 1
3min 6min 5 1
3min 9min 5 1
2. Increasing
speed
3min 12min 6.5 1
3min 15min 8 1
3min 18min 9.5 1
3. Increasing
slope
3min 21min 9.5 3
3min 24min 9.5 5
3min 27min 9.5 7
Thereafter… 3min 9.5 +2
Last stage* 5 min 3.5 0
5 min 2 0
*: A cool-down procedure will be provided after the participant stops running.
4.4.2 Records of treadmill running test
Records of twelve treadmill running tests are shown in Table 4.4.2. Among the
twelve participants, 10 were male and 2 were female. The mean age was 22,
ranged from 18 to 30. The mean weight and height was 63.77 kg and 169.78
cm, respectively. In addition, another 10 treadmill running tests were
conducted but not included in the analysis because the participants were
exhausted and stopped before their core temperature reached 38.5 °C; and/or
the core temperature could not be detected by the sensor.
Study on the Effectiveness of Personal Cooling Equipment for Protecting Workers from Heat Stroke while Working in a Hot Environment
Occupational Safety and Health Council 28
Table 4.4.2 Record of treadmill running test
Date Condition Gender Age Weight (kg) Height (cm)
29-Nov-12 W/O COOL first M 20 58.53 172
7-Jan-13 W COOL first M 18 74.71 181.8
9-Jan-13 W/O COOL first M 19 63.44 171
10-Jan-13 W COOL first M 20 71.63 167
23-Jan-13 W/O COOL first M 23 54.46 164.5
2-Feb-13 W COOL first M 30 64.01 174
19-Feb-13 W/O COOL first M 26 57.34 168
23-Feb-13 W COOL first M 25 74.73 168
1-Mar-13 W/O COOL first M 30 62.75 165
2-Mar-13 W COOL first F 21 65.94 173
8-Mar-13 W/O COOL first F 19 63.33 170
3-Apr-13 W COOL first M 18 54.38 163
Mean ± SD 22±4.38 63.77 ± 7.08 169.78 ± 5.13
4.4.3 Results of treadmill running test
In order to estimate the level of strain and to initiate appropriate actions at an
early stage, Moran et al. (1998) introduced the Physiological Strain Index (PSI),
which is based on heart rate and core temperature records in humans, to
describe heat strain in quantitative terms during continuous exercise (Gotshall
et al., 2004). PSI is therefore applied in this study to measure how the selected
personal cooling equipment alleviates the heat strain process. PSI has been
shown to effectively differentiate the heat strain associated with different
climatic conditions, hydration levels, types of clothing including protective
clothing, different exercise intensities, gender, and the effects of aging (Moran
et al., 2002; Moran et al., 1999a; Moran et al., 1999b). It is an algorithm
combining data from the heart rate and core temperature, in which output is
scaled from 0 to 10 where 0 represents no strain and 10 very high
physiological strain. The mathematical expression of PSI can be found in
equation (2.1).
PSI = 5 * (Tci - Tc0)/ (39.5 - Tc0) + 5 * (HRi - HRo) / (180-HR0) (2.1)
Where Tco and HRo are the minimum values recorded during the 30-minute
rest outside the chamber; Tci and HRi are simultaneous measurements taken
at any time whilst the participant is under the controlled heat exposure. HRi is
the average value on every 30-second. And 39.5 °C and 180 bpm represent
maximal core temperature and heart rate respectively.
Study on the Effectiveness of Personal Cooling Equipment for Protecting Workers from Heat Stroke while Working in a Hot Environment
Occupational Safety and Health Council 29
Descriptive statistics are summarized in Table 4.4.3. During exercise, mean
value of core temperature with cooling vest was 38.05 °C, which was
marginally higher than that without (38.00 °C). Mean value of heart rate with
cooling vest was 158.12 bpm, which was somewhat lower than that without
(158.20 bpm). Similarly, mean value of PSI with cooling vest was also lower
than that without (6.12 vs. 6.17). The participants running with cooling vest felt
somewhat hard with RPE of 4.5, while they felt hard without cooling vest with
RPE about 5. During recovery, mean value of core temperature with cooling
vest was lower than that without (38.42 °C vs. 38.46 °C). Mean value of heart
rate with cooling vest was much lower than that without (118.74 bpm vs.
121.82 bpm). Mean value of PSI with cooling vest was also lower than that
without (4.83 vs. 5.12). Similarly, the participants felt more comfortable (RPE)
with cooling vest than without during recovery (2.30 vs. 3.00).
Table 4.4.3 Descriptive statistics
Activity Parameter
With cooling vest Without cooling vest Difference
between
mean
values
Mean ± SD Range Mean ± SD Range
Exercise
Ave Tc
(°C)
38.05±0.38 37.12~38.59 38.00±0.37 37.06~38.55 -0.05
Ave HR
(bpm)
158.12±25.30 79.4~209.14 158.20±28.05 76.93~202.11 0.08
Ave PSI 6.12±1.38 1.52~9.33 6.17±1.30 1.75~8.82 0.05
RPE 4.45±1.37 3~7 5.09±2.12 2~9 0.64
Recovery
Ave Tc
(°C)
38.42±0.57 37.43~39.39 38.46±0.55 37.48~39.34 0.04
Ave HR
(bpm)
118.74±17.55 75~198.81 121.82±15.97 82.93~201 3.08
Ave PSI 4.83±2.02 1.18~9.15 5.12±1.66 1.76~9 0.29
RPE 2.30±0.95 1~4 3.00±1.15 1~5 0.70
Exercise
Core temperature, Tc
The trends of average Tc, HR and PSI changed over 30 seconds during
exercise and recovery were plotted. Linear regression analysis between the
physiological response and duration was conducted to compute the gradient of
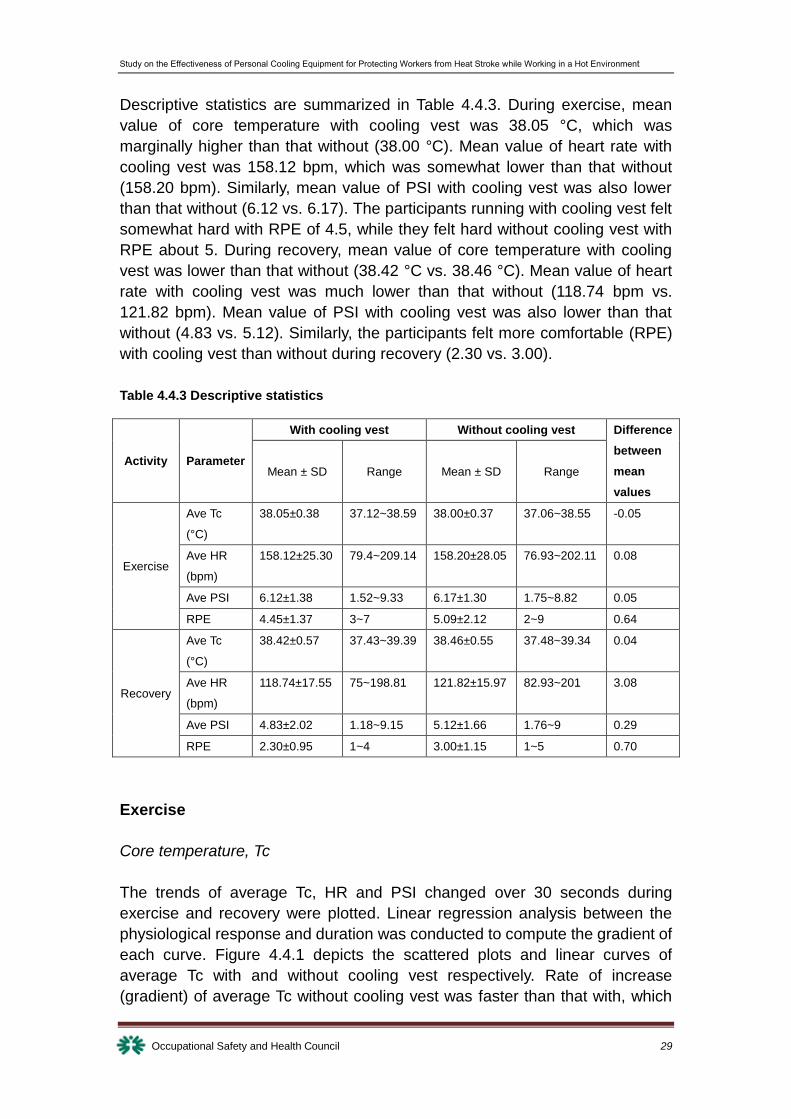
each curve. Figure 4.4.1 depicts the scattered plots and linear curves of
average Tc with and without cooling vest respectively. Rate of increase
(gradient) of average Tc without cooling vest was faster than that with, which
Study on the Effectiveness of Personal Cooling Equipment for Protecting Workers from Heat Stroke while Working in a Hot Environment
Occupational Safety and Health Council 30
was reinforced by the regression equations (3.1) and (3.2). Gradient of
average Tc with cooling vest was gentler than that without (0.025 °C /min vs.
0.026 °C /min). Taking 40.5 °C as a threshold where heat stroke might occur
(Vicario et al., 1986; Menaker et al., 2011), participants without a cooling vest
would take 111 min to reach this threshold, and participants wearing a cooling
vest would take 113 min. A 1.35 % improvement was observed with the use of
a cooling vest in terms of cooling down the core temperature.
Figure 4.4.1 Scattered plots and linear curves of average Tc - with vs. without cooling
vest during exercise
Tcw/o= 37.594 + 0.026 D + ε (Adj R2=0.961, p<0.001) (3.1)
Tcw=37.668 + 0.025 D + ε (Adj R2=0.963, p<0.001) (3.2)
where Tcw/o refers to average Tc (°C) without cooling vest, Tcw refers to
average Tc (°C) with cooling vest, D is duration (min), ε is the error term.
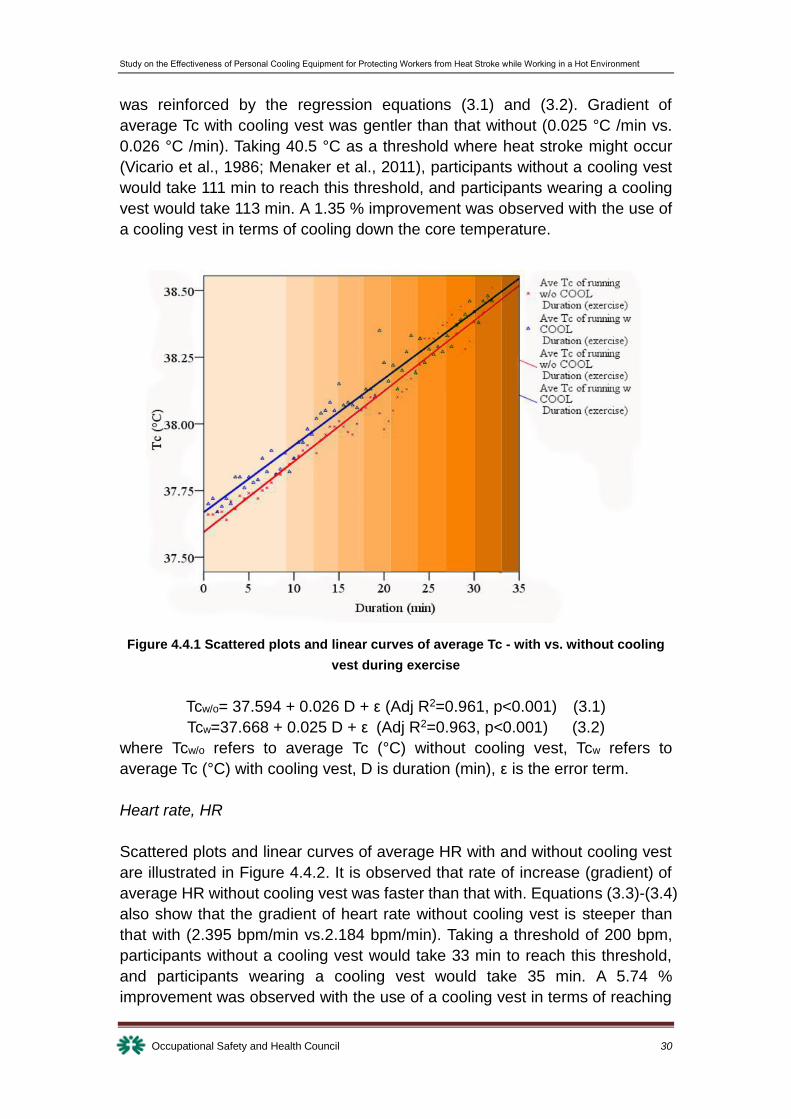
Heart rate, HR
Scattered plots and linear curves of average HR with and without cooling vest
are illustrated in Figure 4.4.2. It is observed that rate of increase (gradient) of
average HR without cooling vest was faster than that with. Equations (3.3)-(3.4)
also show that the gradient of heart rate without cooling vest is steeper than
that with (2.395 bpm/min vs.2.184 bpm/min). Taking a threshold of 200 bpm,
participants without a cooling vest would take 33 min to reach this threshold,
and participants wearing a cooling vest would take 35 min. A 5.74 %
improvement was observed with the use of a cooling vest in terms of reaching
Study on the Effectiveness of Personal Cooling Equipment for Protecting Workers from Heat Stroke while Working in a Hot Environment
Occupational Safety and Health Council 31
a dangerous level of heart rate during exercise.
Figure 4.4.2 Scattered plots and linear curves of average HR - with vs. without cooling
vest during exercise
HRw/o= 120.488 + 2.395 D + ε (Adj R2=0.883, p<0.001) (3.3)
HRw=123.329+ 2.184 D + ε (Adj R2=0.857, p<0.001) (3.4)
where HRw/o refers to average heart rate (bpm) without cooling vest, HRw
refers to average heart rate (bpm) with cooling vest, D is duration (min), ε is the
error term.
Physiological strain index, PSI
Scattered plots and linear curves of average PSI with and without cooling vest
are illustrated in Figure 4.4.3. It is obvious that rate of increase (gradient) of
average PSI without cooling vest was faster than that with. Equations
(3.5)-(3.6) also show that the gradient of PSI without cooling vest is steeper
than that with (0.183/min vs. 0.161/min). Taking a maximal score of 10 for PSI,
participants without a cooling vest would take 37 min to reach this threshold,
and participants wearing a cooling vest would take 40 min. A 6.69 %
improvement was observed with the use of a cooling vest in terms of reaching
the maximal score of 10 for PSI.

Study on the Effectiveness of Personal Cooling Equipment for Protecting Workers from Heat Stroke while Working in a Hot Environment
Occupational Safety and Health Council 32
Figure 4.4.3 Scattered plots and linear curves of average PSI - with vs. without cooling
vest during exercise
PSIw/o= 3.125 + 0.183 D + ε (Adj R2=0.977, p<0.001) (3.5)
PSIw=3.547+ 0.161 D + ε (Adj R2=0.907, p<0.001) (3.6)
where PSIw/o refers to average physiological strain index without cooling vest,
PSIw refers to average physiological strain index with cooling vest, D is
duration (min), ε is the error term.
Recovery
Core temperature, Tc
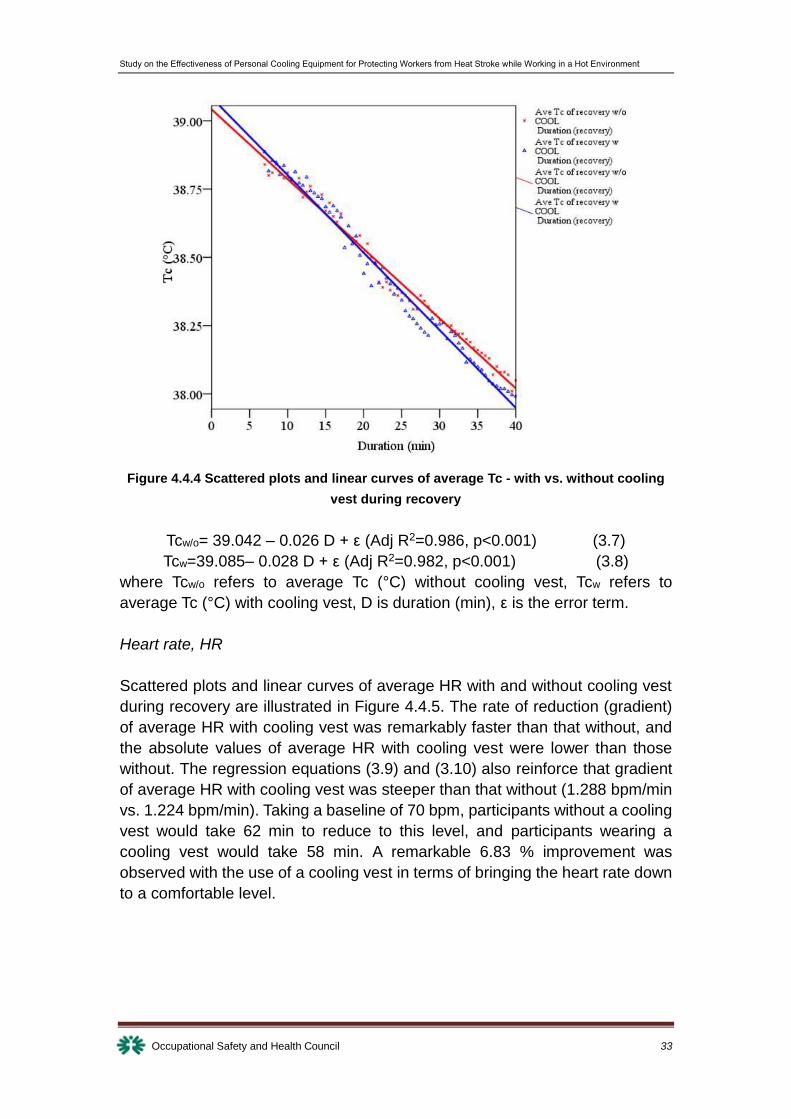
Figure 4.4.4 depicts the scattered plots and linear curves of average Tc with
and without cooling vest during recovery respectively. Rate of reduction
(gradient) of average Tc with cooling vest was faster than that without. It can
be also observed by the regression equations (3.7) and (3.8). Gradient of
average Tc with cooling vest was steeper than that without (0.028 °C /min vs.
0.026 °C /min). Taking a baseline of 37 °C, participants without a cooling vest
would take 79 min to reduce to this level, and participants wearing a cooling
vest would take 74 min. A 5.19 % improvement was observed with the use of a
cooling vest in terms of reducing the core temperature down to a comfortable
level.
Study on the Effectiveness of Personal Cooling Equipment for Protecting Workers from Heat Stroke while Working in a Hot Environment
Occupational Safety and Health Council 33
Figure 4.4.4 Scattered plots and linear curves of average Tc - with vs. without cooling
vest during recovery
Tcw/o= 39.042 – 0.026 D + ε (Adj R2=0.986, p<0.001) (3.7)
Tcw=39.085– 0.028 D + ε (Adj R2=0.982, p<0.001) (3.8)
where Tcw/o refers to average Tc (°C) without cooling vest, Tcw refers to
average Tc (°C) with cooling vest, D is duration (min), ε is the error term.
Heart rate, HR
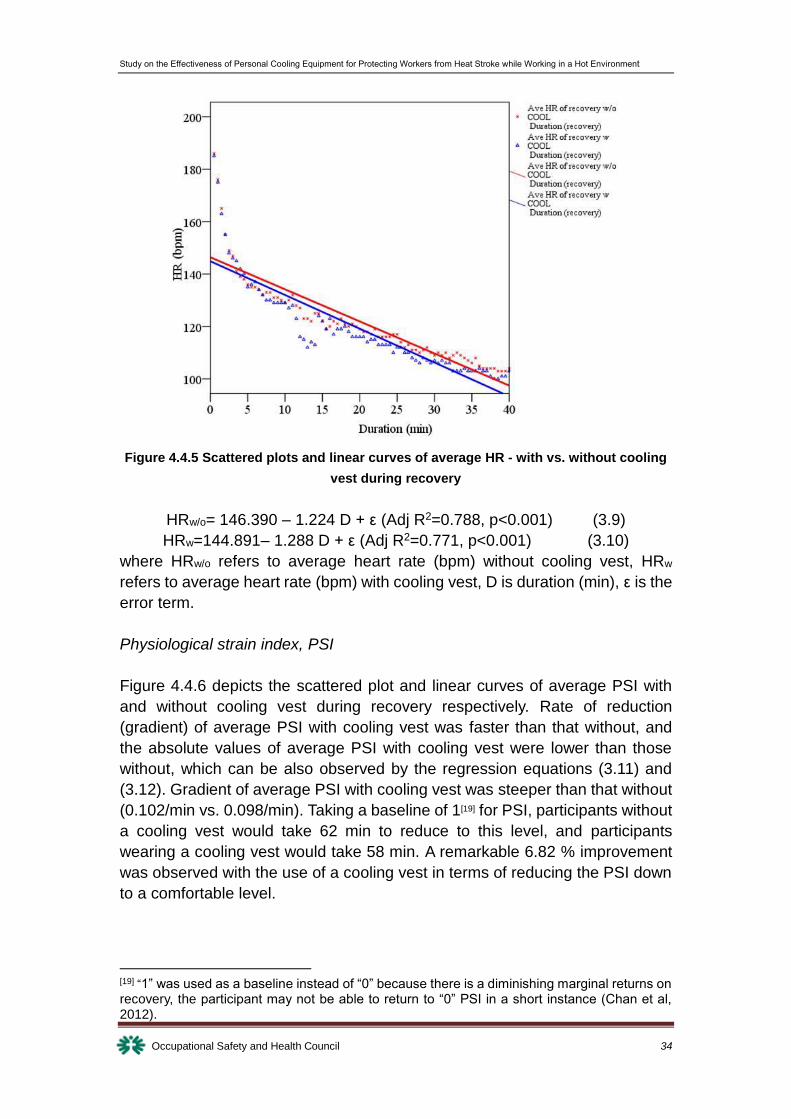
Scattered plots and linear curves of average HR with and without cooling vest
during recovery are illustrated in Figure 4.4.5. The rate of reduction (gradient)
of average HR with cooling vest was remarkably faster than that without, and
the absolute values of average HR with cooling vest were lower than those
without. The regression equations (3.9) and (3.10) also reinforce that gradient
of average HR with cooling vest was steeper than that without (1.288 bpm/min
vs. 1.224 bpm/min). Taking a baseline of 70 bpm, participants without a cooling
vest would take 62 min to reduce to this level, and participants wearing a
cooling vest would take 58 min. A remarkable 6.83 % improvement was
observed with the use of a cooling vest in terms of bringing the heart rate down
to a comfortable level.
Study on the Effectiveness of Personal Cooling Equipment for Protecting Workers from Heat Stroke while Working in a Hot Environment
Occupational Safety and Health Council 34
Figure 4.4.5 Scattered plots and linear curves of average HR - with vs. without cooling
vest during recovery
HRw/o= 146.390 – 1.224 D + ε (Adj R2=0.788, p<0.001) (3.9)
HRw=144.891– 1.288 D + ε (Adj R2=0.771, p<0.001) (3.10)
where HRw/o refers to average heart rate (bpm) without cooling vest, HRw
refers to average heart rate (bpm) with cooling vest, D is duration (min), ε is the
error term.
Physiological strain index, PSI
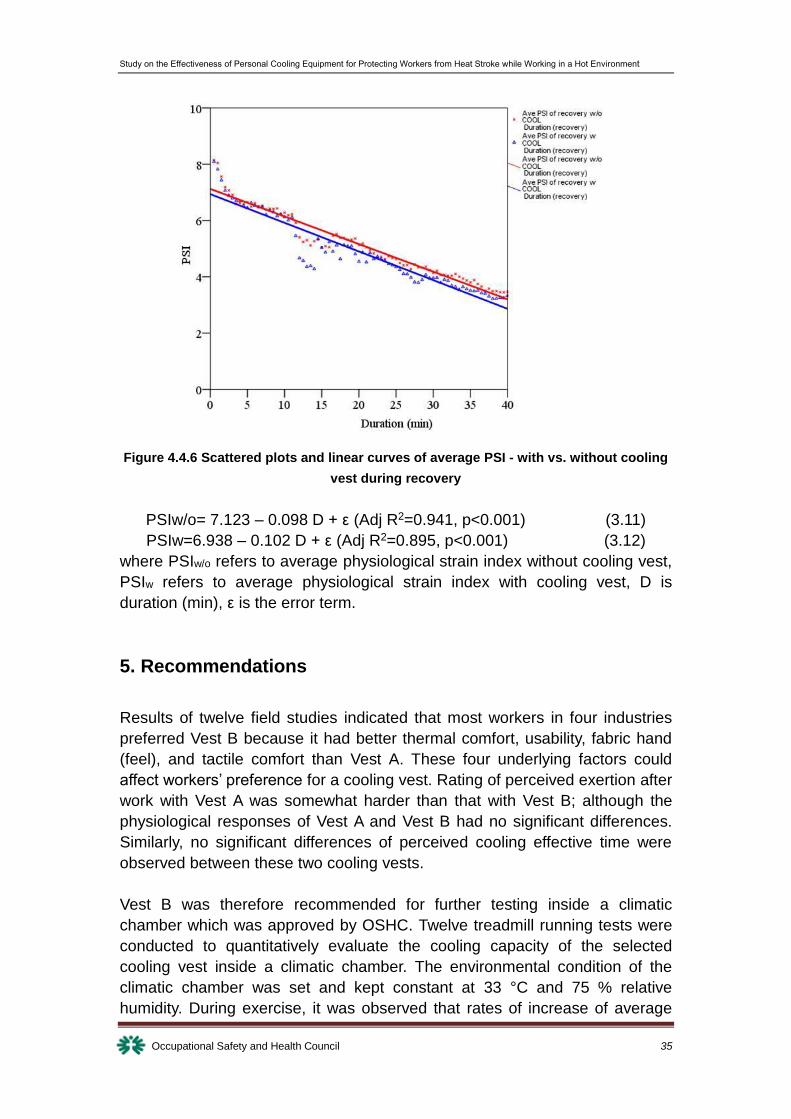
Figure 4.4.6 depicts the scattered plot and linear curves of average PSI with
and without cooling vest during recovery respectively. Rate of reduction
(gradient) of average PSI with cooling vest was faster than that without, and
the absolute values of average PSI with cooling vest were lower than those
without, which can be also observed by the regression equations (3.11) and
(3.12). Gradient of average PSI with cooling vest was steeper than that without
(0.102/min vs. 0.098/min). Taking a baseline of 1[19] for PSI, participants without
a cooling vest would take 62 min to reduce to this level, and participants
wearing a cooling vest would take 58 min. A remarkable 6.82 % improvement
was observed with the use of a cooling vest in terms of reducing the PSI down
to a comfortable level.
[19] “1” was used as a baseline instead of “0” because there is a diminishing marginal returns on recovery, the participant may not be able to return to “0” PSI in a short instance (Chan et al, 2012).
Study on the Effectiveness of Personal Cooling Equipment for Protecting Workers from Heat Stroke while Working in a Hot Environment
Occupational Safety and Health Council 35
Figure 4.4.6 Scattered plots and linear curves of average PSI - with vs. without cooling
vest during recovery
PSIw/o= 7.123 – 0.098 D + ε (Adj R2=0.941, p<0.001) (3.11)
PSIw=6.938 – 0.102 D + ε (Adj R2=0.895, p<0.001) (3.12)
where PSIw/o refers to average physiological strain index without cooling vest,
PSIw refers to average physiological strain index with cooling vest, D is
duration (min), ε is the error term.
5. Recommendations
Results of twelve field studies indicated that most workers in four industries
preferred Vest B because it had better thermal comfort, usability, fabric hand
(feel), and tactile comfort than Vest A. These four underlying factors could
affect workers’ preference for a cooling vest. Rating of perceived exertion after
work with Vest A was somewhat harder than that with Vest B; although the
physiological responses of Vest A and Vest B had no significant differences.
Similarly, no significant differences of perceived cooling effective time were
observed between these two cooling vests.
Vest B was therefore recommended for further testing inside a climatic
chamber which was approved by OSHC. Twelve treadmill running tests were
conducted to quantitatively evaluate the cooling capacity of the selected
cooling vest inside a climatic chamber. The environmental condition of the
climatic chamber was set and kept constant at 33 °C and 75 % relative
humidity. During exercise, it was observed that rates of increase of average
Study on the Effectiveness of Personal Cooling Equipment for Protecting Workers from Heat Stroke while Working in a Hot Environment
Occupational Safety and Health Council 36
Tc/HR/PSI with cooling vest were slower than those without. Projecting these
physiological responses to maximal levels, the time required to reach the
maximal levels are longer when wearing cooling vest. Cooling vest also
enhances thermoregulatory recovery. During recovery, it was observed that
rates of reduction of average Tc/HR/PSI with cooling vest were faster than
those without. This implies that reductions in these physiological responses to
comfortable levels are faster when wearing cooling vest. Additionally, the time
required for Tc, HR and PSI to return to comfortable levels are shorter with the
cooling vest. The cooling vest under scrutiny was found to be able to slow
down the rates of increase of Tc/HR/PSI during working period (6.69%),
but accelerate their rates of reduction during recovery (6.82%); hence its
effectiveness was demonstrated.
However, the selected cooling vest (Vest B) is not without limitations. The dark
colour will absorb heat from the sun, thus attracting more radiant heat load
onto outdoor workers. Some workers commented that the ice pads inserted
into Vest B have little cooling effect because of small size and limited coverage
on the body surface area. Moreover, the fan could draw hot air from the
surrounding environment. Vest B also requires constant replacement of gel
pads and batteries. A cooling vest with a lower total mass and greater cooling
capacity will be more acceptable (Webster et al., 2005). Some suggestions
have been made to the design of the cooling vest. For example, horticultural
and cleaning workers proposed that the fabric should be more durable and
anti-scratch, while kitchen and catering workers proposed that it should be
stain-resistant and fire-resistant to suit their job nature. Construction workers
and airport apron workers proposed that reflective strip should be a built-in
feature of the cooling vest to save them from wearing an extra reflective vest.
Furthermore, freezing of gel pads needs additional refrigerators and extra
space for preparation and storage. Maintenance and cleaning of cooling vests
also need further consideration. Therefore, a comprehensive implementation
plan should be in place before introducing the personal cooling equipment to
various industries at large.
Study on the Effectiveness of Personal Cooling Equipment for Protecting Workers from Heat Stroke while Working in a Hot Environment
Occupational Safety and Health Council 37
6. References
Babski-Reeves K, Tran G (2003) Performance evaluation of microclimate cooling
products. Final Report for ClimaTech Safety, Inc by Virginia Polytechnic Institute and
State University. Available online [URL]:
http://www.climatechsafety.com/pdf/final%20report%20to%20climatech_may%206.pd
f
Bennett BL, Hagan RD, Huey KA, Minson C, Cain D (1995) Comparison of two cool
vests on heat-strain reduction while wearing a firefighting ensemble. Eur J Appl
Physiol 70:322–328.
Carter JM, Rayson MP, Wilkinson DM, Richmond V, Blacker S (2007) Strategies to
combat heat strain during and after firefighting. J Therm Biol 32(2):109–116.
Chan, A.P.C., Yi, W., Wong, D.P., Yam, M.C.H. and Chan, D.W.M. (2012).
Determining an optimal recovery time for construction rebar workers after working to
exhaustion in a hot and humid environment. Building and Environment 58 (2012)
163-171.
Chi Y, Chin YC, Dimoski D, Kroll R, Low ACH (2008) Water cooling vest. Final Report
for UofM Cooled Vest. Available on line [URL]:
http://141.213.232.243/handle/2027.42/61923
Choi JW, Kim MJ, Lee JY (2008) Alleviation of heat strain by cooling different body
areas during red pepper harvest work at WBGT 33°C. Ind Health 46:620–628.
Chou C, Tochihara Y, Kim T (2008) Physiological and subjective responses to cooling
devices on firefighting protective clothing. Eur J Appl Physiol 104:369–374.
Fogleman M, Fakhrzadeh L, Bernard TE (2005) The relationship between outdoor
thermal conditions and acute injury in an aluminum smelter, International Journal of
Industrial. Ergonomics, Vol. 35 No. 1, pp. 47-55.
Furtado AL, Chard J, Zaloom VA, Chu H (2007) Cooling suits, physiological response,
and task performance in hot environments for the power industry. International journal
of occupational safety and ergonomics. 13 (3): 227-239.
Gao Chuansi, Kuklane K., Holmer I., 2010, Cooling vests with phase change material
packs: the effects of temperature gradient, mass and covering area, Ergonomics,
53(5): 716-723.
Gotshall RW, Dahl DJ, Marcus NJ (2004) Evaluation of a physiological strain index for
use during intermittent exercise in the heat. Journal of Exercise Physiology. 3: 22-29.
Study on the Effectiveness of Personal Cooling Equipment for Protecting Workers from Heat Stroke while Working in a Hot Environment
Occupational Safety and Health Council 38
Hadid A, Yanovich R, Erlich T, Khomenok G, Moran DS (2008) Effect of a personal
ambient ventilation system on physiological strain during heat stress wearing a
ballistic vest. Eur J Appl Physiol 104:311–319.
Hong Kong Observatory (2011). Monthly Weather Summary. Hong Kong Observatory
Publications. http://gb.weather.gov.hk/wxinfo/pastwx/mwsc.htm
Jetté FX, Dionne JP, Rose J, Makris A (2004) Effect of thermal manikin surface
temperature on the performance of personal cooling systems. Eur J Appl Physiol
92:669–672.
Kuklane K, Holmér I, Ohlsson G, Nilsson H (2000) Heat stress in ventilated airtight
coverall. In: Werner J, Hexamer M (eds) Proceedings of the 9th international
conference on environmental ergonomics, vol IX. Shaker Verlag, Dortmund, pp 361–
364. ISBN: 3-8265-7648-9.
McGuigan MR, Foster C. 2004. A new approach to monitoring resistance training.
Strength and Conditioning Journal, 26, pp42-47.
Menaker J, Farcy DA, Boswell SA, Stein DM, Dutton RP, Hess JR, Scalea TM (2011)
Cocaine-induced agitated delirium with associated hyperthermia: a case report. The
Journal of Emergency Medicine. 41 (3): e49-e53.
Moran DS, Montain SJ, and Pandolf KB (1998) Evaluation of different levels of
hypohydration using a new physiological strain index. Am. J. Physiol.
275(44):R854-R860.
Moran DS, Kenney WL, Pierzga, JM and Pandolf KB (2002) Aging and assessment of
physiological strain during exercise-heat stress. Am. J. Physiol. 282: In revision.
Moran DS, Shapiro Y, Laor A, Izraeli S, and Pandolf KB (1999a) Can gender
differences during exercise-heat stress be assessed by the physiological strain index?
Am. J. Physiol. 276(45):R1798-R1804.
Moran DS, A. Shitzer, and Pandolf KB (1999b) A physiological strain index (PSI) to
evaluate heat stress. In: Technical Report T99-10. Natick, MA: US Army Research
Institute of Environmental Medicine. 1-49.
Nunneley SA (1970) Water-cooled garments: a review, Space Life Science, 2, 335 –
360.
Pimental NA, Avellini BA (1989) Effectiveness of three portable cooling systems in
reducing heat stress, NCTRF Technical Report No. 176.

Study on the Effectiveness of Personal Cooling Equipment for Protecting Workers from Heat Stroke while Working in a Hot Environment
Occupational Safety and Health Council 39
Pimental NA, Avellini BA (1992) Effectiveness of a selected microclimate cooling
system in increasing tolerance time to work in the heat – application to Navy
physiological heat exposure limits (PHEL) curve V, Navy Clothing and Textile
Research Faculty, Technical Report No. NCTRF 181, Natick, Massachusetts.
Pimental NA, Avellini BA, Heaney JH (1992) Ability of a passive microclimate cooling
vest to reduce thermal strain and increase tolerance to work in the heat. In:
Proceedings of the fifth international conference on environmental ergonomics,
Maastricht, The Netherlands, 226–227.
Pimental NA, Avellini BA, Janik CR (1988) Microclimate cooling systems: a
physiological evaluation of two commercial systems. Technical Report No. NCTRF
164. Navy Clothing and Textile Research Facility, Natick.
Pimental NA., Teal WB, and Avellini BA (1990) Effectiveness of a Prototype
Microclimate Cooling System for Use with Chemical Protective Clothing. Technical
Report No. NCTRF 180. Navy Clothing and Textile Research Facility, Natick.
Pimental NA, Cosimini HM, Sawka MN, Wenger CB (1987) Effectiveness of an
air-cooled vest using selected air temperature and humidity combinations. Aviat
Space Environ Med 58:119–124.
Reinertsen RE, Farevik H, Holbo K, Nesbakken R, Reian J, Royset A, Thi MSL (2008)
Optimizing the performance of phase change material in personal protective clothing
systems. Int J Occup Saf Ergon 14:43–53.
Selkirk GA, McLellan TM, Wong J (2004) Active versus passive cooling during work in
warm environments while wearing firefighting protective clothing, Journal of
Occupational and Environmental Hygiene, 1:521-531.
Shapiro Y, Pandolf K, Sawka MN, Toner MM, Winsmann FR, Goldman RF (1982)
Auxiliary cooling: comparison of air-cooled vs. water-cooled vests in hot-dry and
hot-wet environments. Aviat Space Environ Med 53(8):785–789.
Shvartz E (1972) Efficiency and effectiveness of different water-cooled suits, a review,
Aerospace Medicine, 43: 488 - 491.
Vicario SJ, Okabajue R, Haltom T (1986) Rapid cooling in classic heatstroke: effect on
mortality rates. The American Journal of Emergency Medicine. 4 (5): 394-398.
Webster J, Holland EJ, Sleivert G, Laing RM, Niven BE (2005) A light-weight cooling
vest enhances performance of athletes in the heat. Ergonomics 48(7):821–837.
Study on the Effectiveness of Personal Cooling Equipment for Protecting Workers from Heat Stroke while Working in a Hot Environment
Occupational Safety and Health Council 40
Yu-Tsuan EK, Leslie DM, Hank CL, Bernadette L, Bruce WW (2000) Physiologic and
Functional Responses of MS Patients to Body Cooling, Am.J.Phys.Med.Rehabil.
79(5): 427-434.
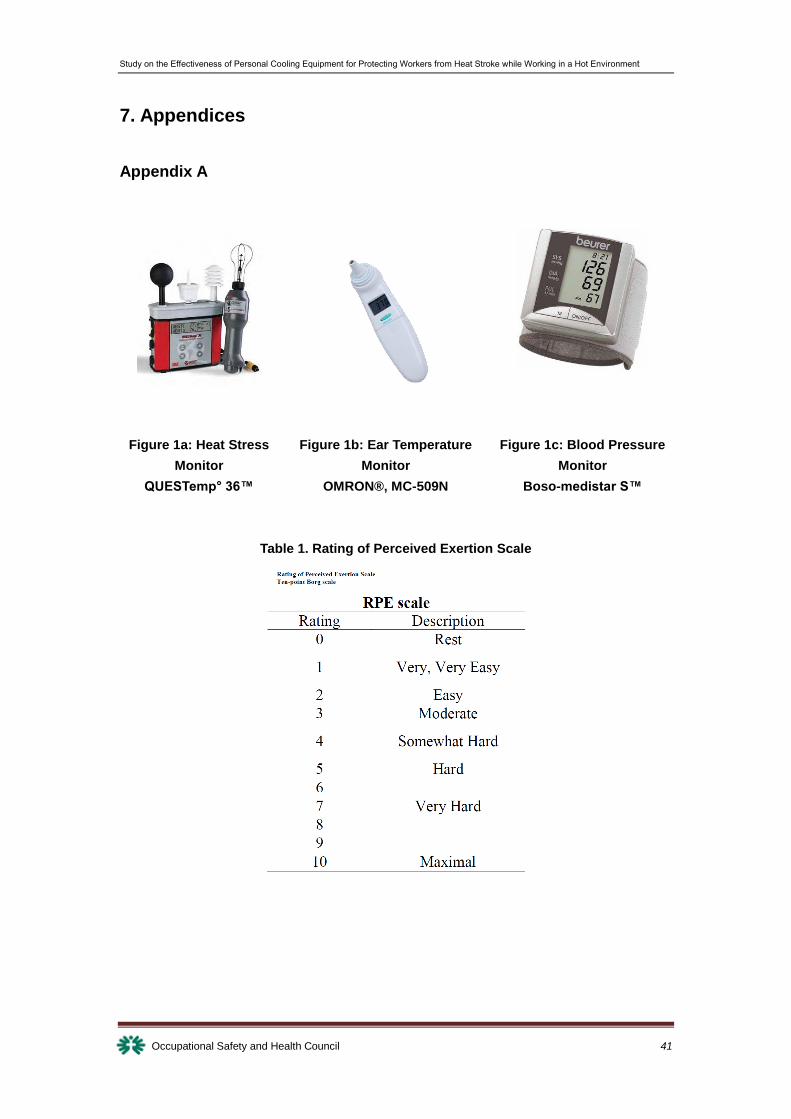
Study on the Effectiveness of Personal Cooling Equipment for Protecting Workers from Heat Stroke while Working in a Hot Environment
Occupational Safety and Health Council 41
7. Appendices
Appendix A
Figure 1a: Heat Stress
Monitor
QUESTemp° 36™
Figure 1b: Ear Temperature
Monitor
OMRON® , MC-509N
Figure 1c: Blood Pressure
Monitor
Boso-medistar S™
Table 1. Rating of Perceived Exertion Scale
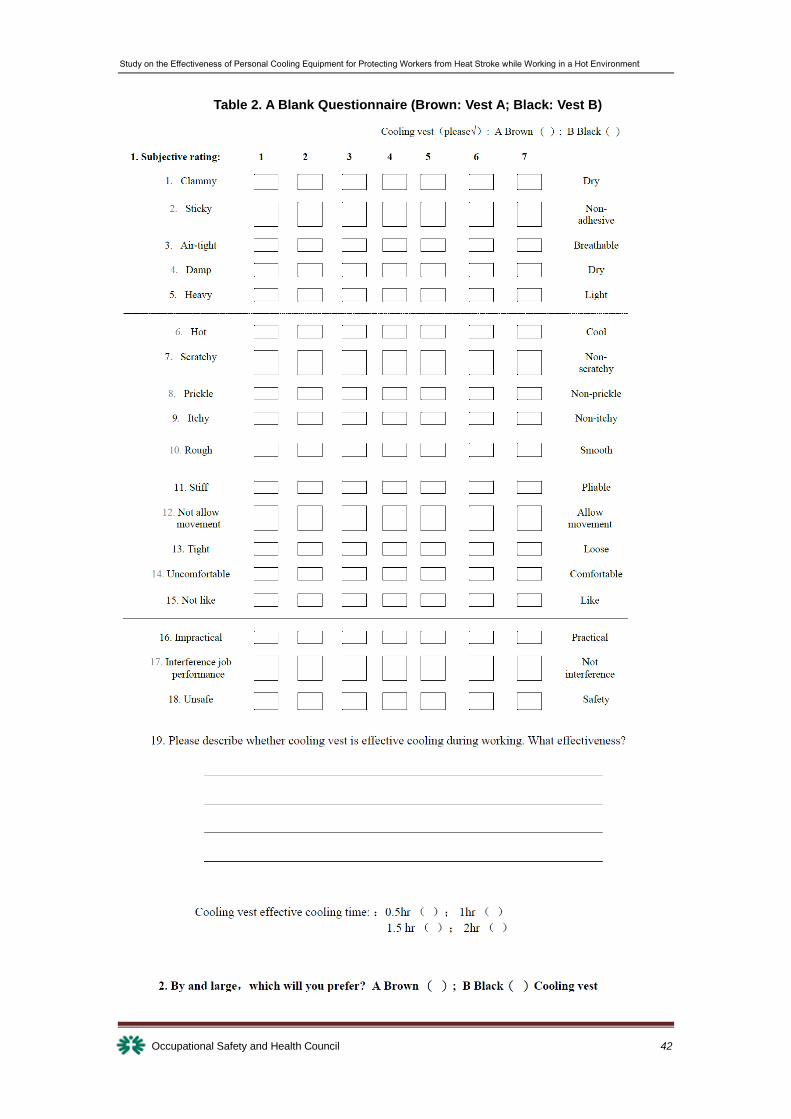
Study on the Effectiveness of Personal Cooling Equipment for Protecting Workers from Heat Stroke while Working in a Hot Environment
Occupational Safety and Health Council 42
Table 2. A Blank Questionnaire (Brown: Vest A; Black: Vest B)
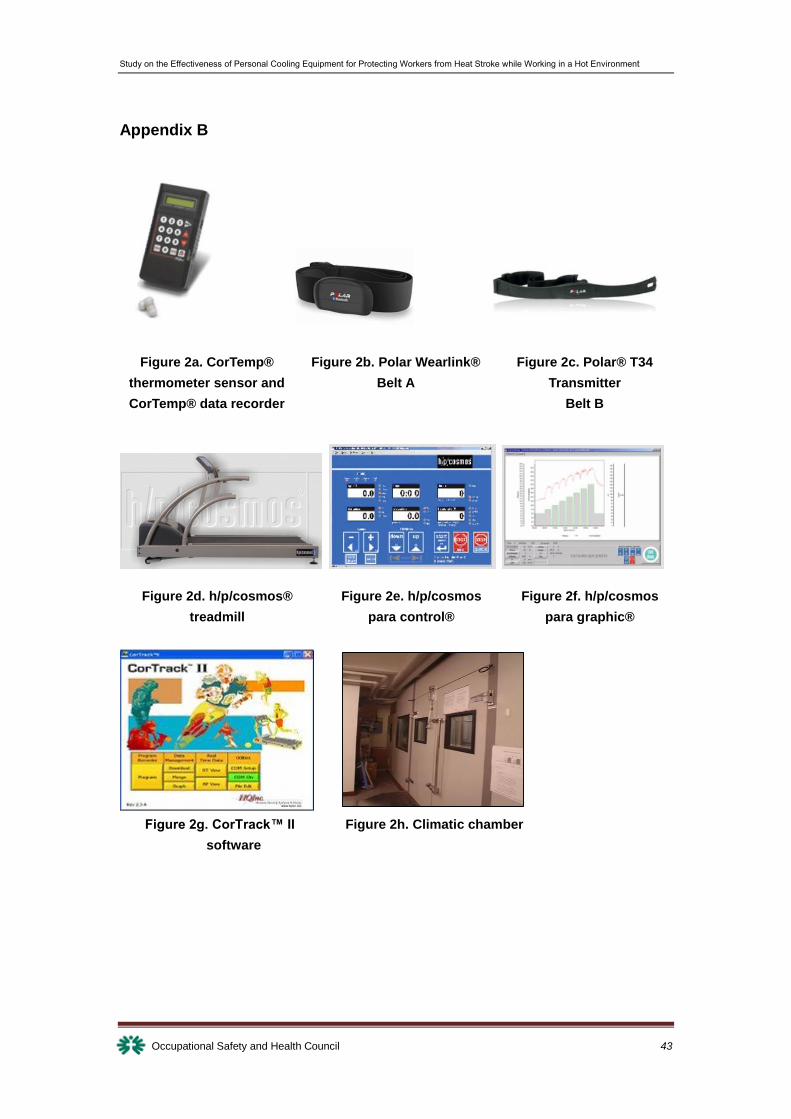
Study on the Effectiveness of Personal Cooling Equipment for Protecting Workers from Heat Stroke while Working in a Hot Environment
Occupational Safety and Health Council 43
Appendix B
Figure 2a. CorTemp®
thermometer sensor and
CorTemp® data recorder
Figure 2b. Polar Wearlink®
Belt A
Figure 2c. Polar® T34
Transmitter
Belt B
Figure 2g. CorTrack™ II
software
Figure 2h. Climatic chamber
Figure 2d. h/p/cosmos®
treadmill
Figure 2e. h/p/cosmos
para control®
Figure 2f. h/p/cosmos
para graphic®