Embed Size (px)
Citation preview

Instructions for use
Title Study on the ground thermal regimes under a forest-steppe mosaic in the area of discontinuous permafrost, Mongolia
Author(s) Avirmed, Dashtseren
Citation 北海道大学. 博士(環境科学) 甲第11787号
Issue Date 2015-03-25
DOI 10.14943/doctoral.k11787
Doc URL http://hdl.handle.net/2115/59332
Type theses (doctoral)
File Information Avirmed_Dashtseren.pdf
Hokkaido University Collection of Scholarly and Academic Papers : HUSCAP

Study on the ground thermal regimes under a
forest-steppe mosaic in the area of discontinuous
permafrost, Mongolia
DOCTORAL THESIS
BY
AVIRMED DASHTSEREN
Division of Earth System Science
Graduate School of Environmental Science
Hokkaido University
Sapporo, Japan
February 2015

II
Acknowledgments
First of all, I wish to express my deepest thank to my academic adviser, Associate Prof, Dr.
Mamoru ISHIKAWA for all of his academic guidance and comments on my study topic during
the course of my PhD. Also, thanks for your high level requirements in scientific working and
gave me a chance to study on the topic of this thesis.
Many thanks go to Associate Prof, Dr. Tomonori Sato for your useful discussions and
suggestions in my study, and your hopeful support for my sense. I would also like to extend my
gratitude to Dr. Yoshihiro Iijima (Research Institute for Global Change, Japan Agency for
Marine-Earth Science and Technology, Japan) for his valuable comments in the study. He
provided me all of the climate datasets that used in the current introducing study.
My room and other friends at Hokkaido University have also deserved to gain my
acknowledgement. They made me a lot of help and funny for daily life, thank you for all of your
friendships.
I would like to thank my family, especially my wife, T. Narangarav, and daughters, D.
Oyunbolor, D. Oyu-Undarga, and my mother, N. Purevjav for their ever-enduring support and
love, without which I could not have accomplished this thesis. This thesis is dedicated to my
father, M. AVIRMED, who was a righteous geographical-teacher in northwestern Mongolia.
Lastly, I greatly thank to the Education Fund Ministry of Education, Culture & Science,
Mongolia for financial assistance, which made me a comfortable life condition in Sapporo. My
thanks also go to researchers at the Institute of Geography of Mongolian Science Academy.

III
Abstract
In continental scales, the areas with the active-layer underlined by permafrost are hugely
overlapped with the biomes of tundra and boreal forest, while seasonally frozen ground is
principally distributed in the steppe biome. In northeastern Eurasia, natural transitional shift from
the Siberian boreal forest to the steppe is clearly seen in central and northern Mongolia, where
the landscapes are generally characterized by a mosaic-like distribution of forest and steppe, and
such mosaic region roughly lies on the southern edge of the Siberian discontinuous permafrost
zone. These situations would reflect complicated distribution of permafrost and seasonally frozen
ground, and their symbiotic features with local geographic settings such as topographic relief,
vegetation cover and micro-climate. In a warming climate, such mosaic regions are likely
sensitive and susceptible to environmental and climate changes. It is therefore important to
understand what determines the occurrence or absent of current permafrost in this region. To
better understand this, it is necessary to describe the physical interaction between the ground
thermal regime, vegetation cover, and local climate parameters using the intensive field
observations in various locations within the mosaic. Since the aim of this study is to examine
physically the interactive manners between the ground temperatures and site-specific factors,
using five-year records of comparable hydro-meteorological parameters obtained from
permafrost underlying forested slopes and its adjacent permafrost-free ground underlying steppe
slopes.
The local topography together with the forest cover was found to be the most important
factors that control the different amount of solar radiation on the ground surface at each site.
During the winter, the topographic effect on the solar radiation seems to be very important for

IV
the forested north-facing slopes, as it strongly reduces potential solar radiation (PSR) compared
with adjacent south-facing slopes. Inversely, the topography effect on solar radiation at each
slope is less, and the differences in PSRs among the sites are identical during the summer.
However, large differences in solar radiation at the ground surface between the sites were
observed. This indicates that the considerable differences in observed solar radiation at the
ground surface between the sites were caused mostly by forest cover, rather than the topography
effect during the summer. Significant reduction in the amount of solar radiation on the forest
floor probably caused lower ground surface temperature than air temperature. In contrast, the
mountain steppe on a dry south-facing slope receives a large amount of solar radiation, and
therefore the ground surface temperature exceeds air temperature during the summer, leading to
a warm soil profile.
During the summer, solar radiation is the dominant factor controlling magnitudes of the
energy budget, and the magnitudes of net radiation below the forest on north-facing slope was
considerably smaller than that on the south-facing slope. This difference in net radiation between
the sites was primarily contributed to differences in heat fluxes at each site, and the ground heat,
sensible heat and latent fluxes at the former slope was 2.3, 3.6 and 5.0 times-lower than those at
the later slope, respectively. These results indicate that the small amount of solar radiation
reduced by forest cover and slope on the north-facing slopes has also potential to reduce heat
exchanges between atmosphere and permafrost.
The thick organic layer within the forested slope impedes the effects of air temperature to
the deep ground during summer, and this is confirmed by the lower thawing ratios that computed
within active-layer at the forested north-facing slope. Consequently, the active-layer thaws
slowly, although the active-layer thickness (ALT) was determined during the summer warmth. In

V
winter, the surface temperature is warmer on the forested slopes than on the steppe slopes, owing
to the greater amount of accumulated snow cover and its low heat conductivity. However, the
thick organic layer beneath the snow cover and the ice-rich substrate at the forested slopes
greatly enhance the freezing rate, which leads to rapid refreezing of the active-layer. The
duration and thickness of snow cover at the mountain steppe have a considerable influence on
the seasonal development of seasonally frozen ground, and is inversely related to seasonally
frozen ground thickness (SFGT). Furthermore, despite of similar geographical conditions and
soil textures at the sites, there was a later onset of soil thawing in the forested area than in the
adjacent mountain steppe, even though soil freezing began simultaneously in both areas.
These results exhibit that forested slope and the underlying thick organic layer at the edge
of the Siberian forest are both important factors contributing to the ground cool and the existence
of permafrost in this region, which appears only beneath the forested north-facing slopes. In the
mosaic, climate warming is not only the problem facing the state of permafrost occurrence, but
also disturbances of vegetation cover could have considerable impact on the current permafrost
occurrence. Therefore, it is important to preserve the vegetation cover, particularly forest cover
and organic layer in Mongolia in order to protect further disturbances of permafrost and
ecosystem.

VI
List of Contents Page
№
Acknowledgements II
Abstract III
List of Contents VI
List of Tables VIII
List of Figures and Schemes IX
List of Photos X
List of Abbreviations XI
Charter 1. Introduction 1
1-1. General background 1
1-2. Distribution of permafrost and seasonally frozen ground in Mongolia 4
1-3. Research history 7
1-4. Purpose of the study 8
1-5. Structure of the thesis 9
Charter 2. Study area and observations 10
2-1. Study area 10
2-2. Hydrological-metrological observations 15
2-3. General meteorological condition of the study area 19
Charter 3. Solar radiation reallocations on the forested slope and steppe slope 21
3-1. Introduction 21
3-2. Methods 24
3-2.1. Estimation of solar radiation reallocation 24

VII
3-3. Results and Discussions 29
3-3.1. Potential solar radiation over the study area 29
3-3.2. Cloud effect on solar radiation 32
3-3.3. Forest effect on solar radiation in the forested area of the study area 34
3-4. Conclusions 37
Chapter 4. Influences of site-specific factors on thermal regimes of the active-layer
and seasonally frozen ground 38
4-1. Introduction 38
4-2. Method 40
4-2.1. Analytic procedures of the soil thawing and freezing processes 40
4-2.2.Calculation of heat fluxes 42
4-3. Results 44
4-3.1. Radiation fluxes 44
4-3.2. Summer energy budget at the sites 49
4-3.3. Hydro-meteorological variables 53
4-3.4. Dynamics of the active-layer and seasonal frozen ground 60
4-3.5. Comparison of ground temperature in forested and steppe areas 65
4-4. Discussion 68
4-5. Summary 71
Chapter 5. General discussion 73
Chapter 6. 6-1. General conclusions 77
6-2. References 80
VIII
List of Tables Page
№
Table 1.1 Detailed classifications of permafrost and seasonally frozen ground in
Mongolia.
6
Table 2.1 Summary of components by the automatic weather stations at the sites. 17
Table 2.2 Characteristics of general meteorological parameters at the mountain steppe on
the south-facing slope (SS) and on the forested north-facing slope (FN).
20
Table 3.1 The monthly potential solar radiation at the sites for 2006. 31
Table 3.2 Coefficients of cloud cover over the study area. 33
Table 3.3 Monthly coefficients of forest canopy for 2006. 35
Table 4.1 Comparisons of summer air and ground surface temperatures for mountain
steppe on the south-facing slope (SS) and the forested north-facing slope (FN).
55
Table 4.2 Comparisons of winter air and ground surface temperatures, snow cover for the
mountain steppe on the south-facing slope (SS) and the forested north-facing slope sites
(FN) during the winter period.
59
Table 4.3 The onset of spring thawing and fall freezing for plots F and S from 2004 to the
end of 2006.
67

IX
List of Figures and Schemes Page
№
Figure 1.1 The distribution of permafrost and seasonal frozen ground in the
Northern Hemisphere. 2
Figure 1.2 Vegetation zones in Mongolia. 3
Figure 1.3 Permafrost zones in Mongolia. 5
Figure 2.1 Study site location; (a) Permafrost distribution around Mongolia. (b) Field
site.
11
Figure 3.1The vegetation cover change over Mongolia for 1992-2002. 23
Figure 3.2 ASTER GDEM over the study area. 24
Scheme 3.1Steps followed to calculate potential solar radiation on DEM using ArcMap. 26
Scheme 3.2 Schematic illustration of the method of calculating solar radiation at each
site.
28
Figure 3.3 Monthly averages of potential solar radiation over the study area for 2006. 30
Figure 3.4 The monthly potential Ras↓ and observed solar radiation Rs↓ at SS for 2006. 32
Figure 3.5 The monthly potential (Rafc↓), calculated (Raf↓) and observed solar radiation
(Rbfc↓) at FN for 2006. 34
Figure 4.1 (a) Daily averages of downward shortwave radiation (Rs↓), (b) upward
shortwave radiation (Rs↑) at FN and SS for 2006. 47
Figure 4.2 (a) Daily averages of downward longwave radiation (RL↓) and upward
longwave radiation (RL↑) at FN and SS for 2006. 48
Figure 4.3 Five-day averages of net radiation (Rn), latent heat flux (LE), sensible heat
flux (Hs) and ground heat flux at FN (a) and SS (b) for 2006, respectively. 52
Figure 4.4 Daily averages of: (a) solar radiation; (b) air temperature; (c) ground surface
temperature; and (d) wind speed from September 1, 2003 to the end of 2007 measured
at the mountain steppe on the south-facing slope (SS) and on the forested north-facing
slope (FN).
54
Figure 4.5 Soil moisture content measured from September 1, 2003 to the end of 2007
at: (a) the forested north-facing slope (FN); and (b) the mountain steppe on the south-
facing slope (SS).
56

X
Figure 4.6 Thickness of snow cover on the mountain steppe on the south-facing slope
and the forested north-facing slope for winters of the study period. 58
Figure 4.7 Seasonal changes in daily average soil temperature at a depth of 3.2 m from
the ground’s surface at the forested north-facing slope (FN). 60
Figure 4.8 Seasonal variations in thermal conductivity for soil layers from 0.2 m to 1.2
m under the forested north-facing slope (FN) for winter and summer in 2006. 62
Figure 4.9 Seasonal changes in daily average soil temperatures at a depth of 6 m from
the surface at the mountain steppe on the south-facing slope (SS). 63
Figure 4.10 Seasonal variations in thermal conductivity for soil layers from 0.2 m to 1.2
m under the steppe on south-facing slope (SS) for winter and summer in 2006. 64
Figure 4.11 Monthly patterns of soil temperatures from September 1, 2003 to the end of
2007 at all observation sites: (a) surface temperatures; and (b) soil temperatures at a
depth of 1-m.
66
List of Photos
Photo 2.1 Photograph of the Shiljiree Basin is showing the landscape type of each study
observation site.
12
Photo 2.2 Photographs of the metrological instrument at the sites. 16
Photo 3.1 Hemispherical photos at FN. 36

XI
List of Abbreviations
ALT Active-layer thickness
ASTER Advanced space borne thermal emission and reflection radiometer
AWS Automatic weather station
DOY Day of year
FDD Freezing degree-days
GDEM Global digital elevation model
GPS Global Positioning System
IG Institute of Geography, Mongolia
JAMSTEC Japan Agency for Marine-Earth Science and Technology, Japan
MAAT Mean annual air temperature
m a.s.l Meter above the sea level
PSR Potential solar radiation
SFGT Seasonally frozen ground thickness
TDD Thawing degree-days
UB Ulaanbaatar station
Bo Bowen-ratio
G Ground heat flux
Hs Sensible heat flux
kc The coefficient of cloud cover
kf The coefficient of forest cover
LE Latent heat flux
Rn Net radiation
RS↑ Reflected shortwave radiation from the ground surface
RS↓ Downward shortwave radiation
RL↓ Incoming longwave radiation
RL↑ Reflected longwave radiation
Rafc↓ Computed the solar radiation above the forest canopy

XII
Raf↓ Potential solar radiation above the forest canopy
Ras↓ Potential solar radiation above the mountain steppe
Rbfc↓ Solar radiation observed below the forest canopy
Rs↓ Solar observed on the mountain steppe
γ The psychrometric constant

1
Chapter 1. Introduction
1-1. General background
Permafrost is soil, rock, sediment, or other earth material with a temperature that has
remained below 0ºC for two or more consecutive years (van Everdingen, 1998). The top ground
layer is subject to annually thawing and freezing in areas underlain by permafrost and is known
as the active-layer (Harris et al., 1988). In the present study, seasonally frozen ground is defined
as the top layer of ground that freezes annually in areas without permafrost. The active-layer
underlying by permafrost and seasonally frozen ground are the most widespread cryospheric
components in the world (Figure 1.1), and occupy approximately 57 percent of the land mass in
the Northern Hemisphere (Zhang et al., 2003). According to the common knowledge on
vegetation cover in continental scales, permafrost mostly forms in the areas of tundra and boreal
forest biomes, while seasonally frozen ground widely coincides with the area of steppe biome.
During the past several decades, studies on permafrost degradation have received much
attention worldwide. Such degradation can be manifested by deepening of the active-layer and
increase in permafrost temperature. Observed evidences show that active-layer thickness (ALT)
and seasonally frozen ground thickness (SFGT) are significantly changing with monotonous
trend in various regions of the Northern Hemisphere under the influence of climate change. For
example, Frauenfeld et al. (2004) evaluated comprehensively the long-term trend of ground
temperatures at hydro-meteorological stations over Russia and found that rate of decreases in
SFGT were even greater than that of the increase in ALT. SFGT has decreased by 4.5 cm/decade
from 1930 to 2000 in the Eurasian high latitudes (Frauenfeld and Zhang, 2011) while ALT
increased by 0.32 m between 1956 and 1990 in the Lena river basin (Zhang et al., 2005a), and by
0.2 m during the period of 1956-1990 in the Arctic regions (Frauenfeld et al., 2004). In the

2
Qinghai-Tibetan Plateau, mean ALT increased by 7.5 cm/year during 1995-2007 while
SFGT has reduced by 7.1 cm/decade since 1980 (Wu and Zhang, 2010).
The changes in ALT and SFTG have the potential to alter surface energy balance,
hydrologic cycle, carbon fluxes, ecosystem performance, which is one of the main driver
as feedback process to climate in high and middle latitudes (Brown et al., 2000; Jorgenson
et al., 2011), because heat and energy exchanges between atmosphere and ground occur
through these layers. Also, permafrost degradation can severely damage to ecosystem and
engineering infrastructure through activation of surface subsidence. Therefore, it is
Figure 1.1 The distribution of permafrost and seasonally frozen ground in the
Northern Hemisphere (Zhang et al., 2003).

3
important to understand the thermal regimes controlling variations in active-layer and seasonally
frozen ground, although they are determined by the various factors such as surface temperature,
snow cover, land cover, subsurface materials, and soil moisture (Brown et al., 2000; Zhang,
2005a; Walker et al., 2003; Iijima et al., 2010; Ishikawa et al., 2006; Shiklomanov et al., 2010).
In northeastern Asia around Mongolia, a vegetation transitional zone is found, where the
vegetation cover slowly change from forest to steppe and to desert along a north-south transect.
The northern part of Mongolia is covered by forested mountain ranges while the central part of
the country is characterized by steppe, and the southern part by desert zone (Figure 1.2). In
general, such natural zones roughly overlap with the zones of permafrost and seasonally frozen
ground in Mongolia (Figure 1.2 and 1.3). Furthermore, in the graduation of these main zones, it
is existed intermediate zones such as forest-steppe and desert-steppe. The general landscapes in
Vegetation zones in Mongolia
Figure 1.2 Vegetation zones in Mongolia (Batima and Dagvadorj, 2000).

4
forest-steppe zone are characterized by a mosaic-like distribution of forest and steppe, where
steppe prevail on exposed sunny south-facing slopes and forest predominantly grow on north-
facing slope. The forest-steppe zone includes the most general landscape type in northern central
Mongolia. Previous study noted that the steppe is one of the largest vegation zones in the country
(Batima and Dagvadorj, 2000), whereas the forest region covers 8.1 percent of the total land area
in Mongolia, composed mainly of the larch species Larix sibirica (Tsogtbaatar, 2004).
Climatological report in Mongolia (MARCC, 2009) indicated that current and projected
climate change within these natural zones in Mongolia, particularly air temperature and
precipitation will likely be enhanced, and will decrease the productivity of boreal forest
(Dulamsuren et al., 2011) and permafrost occurrence (Ishikawa et al., 2011). Such forest-steppe
boundary of natural zones, therefore, may be vulnerable against on-going climatic change.
However clarification of interaction between landscape and thermal regime of ground is still
hindered by the lack of reliable intensive observation and analyses.
1-2. Distribution of permafrost and seasonally frozen ground in Mongolia
Approximately 95 percent of permafrost in the earth is distributed within the five countries
of Russia, Canada, China, USA and Mongolia (Zhang et al., 2000). Mongolia is the fifth largest
country, consisting of permafrost. In terms of the thermal studies of the active-layer, permafrost
and seasonally frozen ground in Mongolia are special interesting topics due to (i) regional and
local location, (ii) vulnerability and resilience, (iii) distribution: (i) According to permafrost map
of Zhang et al. (2003), as shown Figure 1.1, the southern edge of Siberian continuous permafrost
zone is located in Mongolia with gradual change from continuous to discontinuous and sporadic

5
states. Permafrost regions occupy about 63 percent of Mongolian total territory or almost two-
thirds of Mongolia (Figure 1.3), predominately distributed in the Altai, Khangai, Khentii, and
Khuvsgul mountains in the northern part of Mongolia. The seasonally frozen ground is widely
found in the southern part of Mongolia, where the dominant natural zones are steppe and desert.
The lowest limit of sporadic permafrost is found at an altitude between 600 and 700 meters
above the sea level (m a.s.l). while the lower limit of continuous permafrost on south-facing
slopes ranges from 1,400 to 2,000 m a.s.l. in the Khuvsgul and Khentii mountains and from
2,200 to 3,200 m a.s.l. in the Altai and Khangai mountains (Sharhkuu et al., 2007). (ii) The
observation data of ground temperatures for covering the country indicate that the temperatures
of permafrost in Mongolia is closely to the melting point (0oC) and is therefore vulnerable to
climate warming and human activities in terms of vegetation disturbances, and in some locations
permafrost has already disappeared (Sharhkuu et al., 2007; Ishikawa et al., 2012).
Figure 1.3 Permafrost zones in Mongolia, based on (Brown et al., 1997).
Permafrost zones in Mongolia

6
(iii) The distribution of permafrost in Mongolia is known in numerous previous studies, from
local to country-wide scale (Gravis et al., 1987; Etzelmüller et al., 2006; Jambaljav and
Dashtseren, 2007). They showed that permafrost distribution in Mongolia illustrates an obvious
latitudinal shift from the northern to the southern territories on country-wide scale. While at local
scales, permafrost distribution is mosaic-like and it depends on the micro-climate associated with
topography, thermal properties of soils and vegetation cover. For example, in the discontinuous-
sporadic permafrost zone, permafrost can be found only under the forested north-facing slope
while permafrost-free ground can be found under the south-facing slope within a small mountain
basin (Ishikawa et al., 2006, 2008). In the northern territory with continuous permafrost region,
the thick active-layer occurs beneath the dry south facing slopes while thin active-layer lies
underneath immediately adjacent wet terrains (Heggem et al., 2006). The detailed classifications
of permafrost and seasonal frozen ground in Mongolia are given in Table 1.1.
Table 1.1 Detailed classifications of permafrost and seasonally frozen ground in Mongolia
(Sharkhuu et al., 2006).
Permafrost zone
Extent of
permafrost (%
of area)
Thickness,
(m)
Mean annual temperatures,
(oC)
Continuous 85> 250-500 -2.0 – -4.0
Discontinuous 50-85 50-120 -1.0 – -2.0
Sporadic 10-50 5-15 -0.2 – - 1.0
Seasonally frozen ground 1.7-3.2 Above 0.0
7
1-3. Research history
Several studies have already reported the thermal regimes of the active-layer and
permafrost in Mongolia. Most of these studies indicated that permafrost is warming, thawing and
degrading under climate change. Ishikawa et al. (2012) analyzed the thermal state of permafrost
on regional and national scales using 48 research boreholes. They found, the ratio of permafrost
warming ranges between 0.01-0.03 oC/year over Mongolia. Similarly, Sharkhuu et al. (2007)
noted that long-term increasing ratio was 0.2-0.4 oC/decade. Both studies agreed that recent
degradation of permafrost is generally more intensive in the Khuvsgul Mountains with
continuous permafrost region than in the Khentii and Khangai Mountains with discontinuous and
sporadic permafrost region. Furthermore, rapid ground warming in the Khentii Mountains has
resulted in permafrost degradation, although the warming ratio of Mongolian permafrost is not
only controlled by air temperature but it is largely controlled by temperature-independent soil
properties (Ishikawa et al., 2012). Overall, average trends of warming permafrost in Mongolia
are similar to those in Central Asia and in the European mountains but lower than those in
eastern Siberia and Alaska (Zhao et al., 2010).
The warming of Mongolian permafrost is leading the deepening of ALT, but it is also
depending on the permafrost zones. For example, the ratio of increase in ATL ranged from 0.3-
2.4 cm/year in the Khuvsgul Mountains with continuous permafrost zone and 0.2-1.5 cm/year in
the Khentii and Khangai Mountains with discontinuous and sporadic permafrost zones
(Sharkhuu et al., 2007). Compared to high latitude and artic regions, the active-layer and
seasonally frozen ground show large spatial interannual variations in their thicknesses, and are
relatively deep over Mongolia. In general, these studies are generally based on single-borehole

8
temperatures and clearly showed the thermal state of permafrost at local, regional and
national scales.
Other studies, in the northern territory with continuous permafrost region, modeling
results show that potential solar radiation (PSR), soil wetness and tree shading have
considerable control on permafrost distribution (Etzelmüller et al., 2006; Heggem et al.,
2006). In discontinuous permafrost zone, Ishikawa et al. (2006) examined the
hydrological-thermal regimes of the dry active-layer and its nonconductive heat transfer
dynamics and their connections to the atmosphere. They pointed out that the ground
moisture played dominant role on the fraction of total heat storage in active-layer. The
climate warming in this transitional zones in Mongolia is more intensive than most of the
regions in the world (MARCC, 2009). It will result in the decay of both the cryospheric
and natural transitional zones. However, few reports have partly described the interactions
between ground temperatures, vegetation cover, and the atmospheric conditions in
Mongolia, especially within the forest-steppe mosaic at discontinuous zone.
1-4. Purpose of the study
The general goal of this study is to evaluate the importance of site-specific factors
(topography, vegetation cover, snow cover, soil organic layer and soil moisture), which
influence the current permafrost occurrence in the forest-steppe mosaic in Mongolia to
better understand the ground temperature regimes and energy allocation at the southern
distribution limit of Eurasian continuous permafrost in the central Mongolia. The goal was
achieved through meeting two objectives:

9
1. To evaluate effects of topography and forest canopy occurrence on reaching solar
radiation at the ground surface at the forested slope and steppe slope.
2. To evaluate influences of the site-specific factors (topography, forest, snow cover and
organic layer) on developments of the active-layer and seasonal frozen ground using
by comparative observational hydro-meteorological variables.
1-5. Structure of the thesis
The structure of this dissertation is divided into six parts, which are as follows: Chapter 1
introduces general introductions of permafrost and its situation in Mongolia. Chapter 2 contains
overviews of the specifics of the study sites and used datasets. Chapter 3 examines the solar
radiation reallocations at both contrasted slope types using the Global Digital Elevation Model
(GDEM) data and measured solar radiation. Chapter 4 describes the summer energy fluxes at the
sites and the influences of site-specific factors on temperatures of the active-layer and seasonally
frozen ground based on the comparable hydro-meteorological parameters from September 2003
to the end of 2007. A general discussion is presented in Chapter 5. Finally, the conclusions of the
thesis are summarized in chapter 6.

10
Chapter 2. Study area and observations
2-1. Study area
The study area is situated in the Shiljiree River basin, near Terelj village, located
approximately 50 km northeast of Ulaanbaatar, the capital of Mongolia. The Shiljiree river basin
is a tributary of the Tuul River in the Khentii Range, north central Mongolia and it is
characterized by mountainous topography with 2799 m a.s.l. of the highest peak. The elevation
of the basin ranges from 1550 m a.s.l. in the river valley to 2195 m a.s.l. on the mountain top.
This basin has a typology of both permafrost and natural transitional zones as mentioned in
chapter 1, as it is the forest-steppe landscape. According to the map of permafrost distribution
around Mongolia (Brown et al., 1997), the study area is approximately located in the node of
discontinuous-sporadic permafrost zone (Figure 2.1a). The vegetation cover defferences at the
study area can be clearly seen in Photo 2.1. The Siberian boreal forest (Larix sibirica Ledeb and
Pinus sylvestrs) is predominant over the north-facing slopes (Dulamsuren et al., 2011; Sugita et
al., 2007). Permafrost is found under the most of these forested north-facing slopes (Ishikawa et
al., 2005), where Equisetum pretense and Fragaria orientalis are the dominant vegetation
species at the forest floor. Whereas south-facing slopes and valleys are generally covered by a
mountain steppe without underlying permafrost (Ishikawa et al., 2005), therefore, here is
seasonally frozen ground in winters. The dominant vegetation species on the south-facing slopes
are Artemisia frigida, Potentilla acaulis, Agropyron cristatum, and Carex duriuscula. Soil
textures of the north-facing slope is complex, consisting of humus and moss in the upper surface
layer, sand, gravel and silt in the lower part of the soil layer. The thicknesses of organic layer on
this forested slope are ranged from 0.2 to 0.4 m. In contrast, south-facing slopes are underlined

11
by a thin organic layer up to 0.05 m deep and the lower part of the soil is composed of sandy
gravels (Ishikawa et al., 2005).
Figure 2.1 Study site locations. (a) Permafrost distribution around Mongolia based on Brown
et al. (1997). (b) Field site: FN and SS are automatic meteorological stations; F and S are
shallow boreholes with temperature dataloggers. The black arrows show direction of
photograph was taken, corresponding to the black arrow in Photo 2.1. The meanings of FN,
SS, F and S are the forested north-facing slope, steppe south-facing slope, forest and steppe,
respectively.

12
Geologically, the Khentii Mountains mainly consists of sandstone, aleurolite, argillaceos,
siliceous shale, radiolarian chert, basalt, dolerite, mafic effusion tuff, gabbro and marbl. This
geological group is well-exposed along the Tuul River and its total thickness reaches
approximately 1100 m (Dorjsuren et al., 2006).
Photo 2.1 Photograph of the Shiljiree Basin is showing the landscape type of each study
observation site. The black arrow show direction of photograph was taken, corresponding to
the black arrow in Figure 2.1.

13
The study area was constructed in 2002 by researchers of Japan Agency for Marine-Earth
Science and Technology, Japan (JAMSTEC) and Institute of Geography (IG), Mongolian
Academy of Science, Mongolia. Since 2003 we have been continuously measuring the hydro-
meteorological parameters at these sites (Photo 2.1), aiming to delineate the different
hydrological characteristics between mountain steppe on south-facing and forested north-facing
slopes (Ishikawa et al., 2005, Iijima et al., 2012). Two automatic weather stations (AWS) were
installed at sites SS and FN at the end of summer in 2003 (Figure 2.1b and Photo 2.1). FN site on
the forested north-facing slope and SS site on the steppe south-facing slope were considered to
be representative for forest and steppe zones in Mongolia, respectively. Because one of the
important criteria that defines a natural zone is the vegetation cover type. As reported by Batima
and Dagvadorj. (2000), the forest zone in Mongolia is mostly covered by boreal forest (Larix
Sibirica, Pinus Sibirica, Pinus Sylvestric), while the steppe and desert zones in the country are
characterized by grasses, forbs and shrubs.
In order to evaluate the influences of topography and trees shading the solar radiation, and
influences of the site-specific factors on dynamics of the active-layer and seasonal frozen ground,
SS and FN sites were selected in this study. SS site is on the south-facing slope (1662 m a.s.l,
47°59'23"N and 107°25'19"E) and covered by a mountain steppe, on seasonally frozen ground.
While, FN site is on the north facing slope (1653 m a.s.l, 47°58'30"N and 107°25'30"E) covered
by a forest. The inclinations of these slopes are almost similar and are 11o–12
o, and the distance
between these sites is about 1.58 km. Based on a vegetation survey in 2004 of both slopes,
vegetation cover on the forest floor (below 1.3 m) was approximately 50 percent plant cover and
75±16 g/m2 (dry weight) of above-ground biomass. Plant cover on the south-facing grassland
was 60 percent with 167±95 g/m2 (dry weight) of above-ground biomass. This biomass shows

14
larger spatial variability than that of the forest floor due to density of livestock grazing (Iijima et
al., 2012). The average height and diameter at breast height of larch trees at the FN site were 16
m and 0.28 m, respectively, with a stand density of 0.15 trees/m2. The average age of larch tress
was 70–90 years and the maximum age of the larch trees was about 300 years old (Miyazaki et
al., 2014). At each AWS, two adjacent deep boreholes were excavated to collect soil temperature
and moisture data.
In addition, plots (F and S) for soil temperature measurement at 0.05 and 1.0 m depths
were set on the east-facing slope in the study area. These plots are situated at almost the same
altitudes (1780 m a.s.l), orientation, and vegetation cover (60–65 percent). F (47°59'27"N and
107°24'53"E) plot is on the small patch of forest and S (47°59'28"N and 107°24'54"E) is on
mountain steppe just 30 m apart from F plot (Figure 2.1b and Photo 2.1). The inclinations of
these plots are approximately 22o–25
o. According to the pit survey result (Ishikawa et al., 2005),
the soils in the upper layer at F and S plots are particularly identical, consisting of sand and
gravel. Moreover, volumetric soil water at the plots had similar amount in both summer and fall.
On the other hand, as described previously, SS and FN have antipodal aspects and ground
textures, which make difficult condition to exactly evaluate the influence of vegetation (forest vs.
steppe) on ground temperature regimes within the mosaic. However, F and S plots have very
similar slope direction, altitude, soil texture, and soil moisture contents but with different
vegetation cover. Hence, the major differences of ground temperature between two plots are
caused by the presence of forest cover, which is expected to affect ground thermal regime in this
area. By comparing the differences of ground temperature from F and S plots, it can determine
the forest effect on the ground temperature regimes in this mosaic.

15
2-2. Hydro-meteorological observations
The main stations at the study area are FN and SS, where we observed several atmospheric
parameters, including the ground temperatures and soil moisture in boreholes. Observation
components at the sites are listed in Table 2.1. The setup view of the meteorological instruments
at sites FN and SS is shown in Photo 2.2. The air temperatures at 1 and 2 m height were
measured using a shielded and ventilated sensor probe (model HMP35D, Vaisala Inc., Vantaa,
Finland). The shortwave (including direct and diffuse) and longwave radiations were measured
in both upward and downward directions at 1 m below the forest canopy at FN, and at 2 m above
the steppe at SS. The measurements of shortwave and longwave radiations were made using 4
components net radiometer (CNR-1, Kipp & Zonen, Delft, Netherlands; with two CM3
pyranometer sensors with a range of 0.3–3 μm and two infrared radiometer sensors (MS202,
EKO, Japan) with a range of 3–50 μm, respectively). Soil moisture at depths of 0.1–1.2 m was
measured using a frequency domain reflectometry sensor (EC-10, Decagon Devices, Pullman,
WA, USA), and rainfall at site SS was measured using a tipping-bucket rain gauge (Rain
Collector II, Davis Instruments, Hayward, CA, USA) on the ground surface. Relative humidity
was observed using hygrothermometer (HMD45D, Vaisala Oyj, Finland). The soil heat flux was
observed by heat flux plate (PHF01, REBS, Inc, USA) at 0.05 m depth in the soil. All of these
measurements were sampled at intervals of 30 sec (using a CR-10X data logger, Campbell
Scientific Instruments, Logan, UT, USA) and were averaged and totaled every 10 min at each
site. The soil temperature was measured at depths of 0, 0.1, 0.2, 0.4, 0.8, 1.0, 1.6, 2.4, and 3.25 m
at site FN and at 0, 0.1, 0.2, 0.4, 0.8, 1.0, 1.6, 2.4, 3.25, 4.0, and 6.0 m at site SS using 100-ohm
platinum resistance thermometers. Soil temperature data were stored at 30-min intervals by an

16
LS-3300 data logger (Hakusan, Tokyo, Japan). The daily average thickness of snow cover was
manually measured from five fixed poles with a centimeter range at each site, and the median of
these was used in the analysis. At F and S plots, two shallow (1 m) boreholes were also installed
with data-loggers (Logger TR52, T&D Corporation, Japan) in order to record ground
temperatures at the depths of 0.05 and 1 m. These ground temperature are recorded at 1 h
interval.
Photo 2.2 Photographs of the metrological instrument at SS (a) and FN (b). Photographs
were taken by author in the summer of 2007.
(b) (a)

17
Table 2.1 Summary of components by the automatic weather stations at FN and SS sites.
Observation
items Unit Sensor type
Station with heights
or depth
Record
interval
Above ground components
Air
temperature
oC HMP45D; Vaisala
FN (1, 2m), SS(0.5,
1, 2, 4m) 10 min
Relative
humidity %
Humidity and temperature
probe (HMD45D, Vaisala Oyj,
Finland) with ventilation pipe
(PVC-02, PREDE, Japan)
FN (1, 2m), SS(0.5,
1, 2, 4m) 10 min
Wind speed ms-1
Anemometer (AC750, Kaijo
Corporation, Japan)
FN (1, 2m), SS(0.5,
1, 2, 4m) 10 min
Shortwave
radiation /up
and downward/
Wm-2
CNR-1, Kipp&Zonen Delft,
Netherlands FN (1m), SS (2m) 10 min
Longwave
radiation /up
and downward/
Wm-2
Infrared radiometer (MS202,
EKO, Japan) FN (1m), SS (2m) 10 min
Rainfall mm RT-1E; Ikeda Keiki SS 10 min
Below ground components
Heat flux in the
soil
Heat flux plate (PHF01, REBS,
Inc, USA) FN & SS (0.05 m) 10 min
Soil
temperature
oC TS101; Hakusan Kougyo
FN & SS (0, 0.1, 0.2,
0.4 , 0.8, 1, 1.6, 2.4,
3.25 m)
30 min
Soil
temperature
oC TS101; Hakusan Kougyo
FN & SS (4, 6, 8, 10
m) 30 min
Volumetric
water content m
3m
-3 ECHO-10; Decagon
FN & SS (0.1, 0.2,
0.4, 0.8, 12 m) 10 min

18
As mentioned above, hydro-meteorological observations began in September 2003 and
have continued to the present day. However, because of data recording problems (e.g.
instrumental failure and gaps caused by sensor malfunction, power loss, rain and frost) and
missing datasets since 2008, in this thesis I only use datasets between 1 September 2003 and 31
December 2007. No gap filling in our datasets was performed for the study period, and all
recognizable faulty data were removed from the datasets before analyses (e.g. missing values and
obvious logger inaccuracies). In general, 1 April to 31 September was used as the summer cycle,
while 1 October to 31 March was used as the winter cycle, unless otherwise stated.

19
2-3. General meteorological condition of the study area
The general climate of Mongolia is continental with short summers, long cold winters. The
air temperature ranges between -40oC in winters and +40
oC in summers. The mean annual air
temperature (MAAT) of 0oC in Mongolia is around the 46
oN latitude which is the northern part
of Gobi desert region. Permafrost exists in the areas where MAAT is below -2oC. The amount of
precipitation in Mongolia is low and its distribution depends on both terrain-relief and seasons.
Annual mean precipitation ranges 250–300 mm in the Khangai, Khenteii and Khuvsgul
mountainous regions; 150–250 mm in the Altai mountainous and forest-steppe zone; 50-100 mm
in the steppe zone and in the desert zone (MARCC, 2009).
The climate of the Khentii Mountains is dominated by Asiatic anticyclones in winter,
which typically has its center southwest of Lake Baikal and causes dry and cold winters. In
summer, warm air masses from the south flow into northern Mongolia resulting in formation of
cyclones when they meet the cold air from Siberia (Dulamsuren et al., 2011). Generally, the area
has a continental climate which is characterized by large variation in air temperature and low
precipitation (Table 2.2). The warmest year of the study period was 2007, with a MAAT of -
1.7°C (resulting primarily from a dry hot summer), and the coldest year was 2006, with a MAAT
of -3.3 at the FN site. The maximum and minimum daily air temperatures ranged from 27.4°C to
-34.2°C at SS, and from 24.2°C to -36.3°C at FN. The snow-free periods observed at FN in 2005
and 2006 were longer than those of other years. Total precipitation from April to September
during the study period ranged from 223 mm in 2007 to 295 mm in 2005.
In order to assess the general meteorological conditions of our study period, we also used
data obtained from Ulaanbaatar station (UB). UB is one of the nearest permanent meteorological

20
stations, located 40 km west of the study site, where a long-term mean (1980–2010) air
temperature was -0.3°C. In the study period, MAAT at UB was 0.4°C, 0.3°C, -0.3°C, and 1.9°C
in 2004, 2005, 2006, and 2007, respectively. Therefore, it is inferred those MAATs over the
study period were generally higher than the long-term mean temperature at UB. Annual
precipitation at UB ranged from 166 mm to 395 mm (mean annual precipitation from 1980–2010
was 265 mm), of which approximately 90 percent occurred between April and September. The
mean annual total precipitation at UB was 260 mm, 193 mm, 256 mm, and 185 mm in 2004,
2005, 2006, and 2007, respectively. This indicates that the study period was dry and warm,
which is in agreement with the general warming tendency experienced throughout most of the
Mongolian territory (MARCC, 2009).
Variable Unites Site 2004 2005 2006 2007
Maximum air temperature oC SS/FN 23.3/22.6 na/21.7 21.1/17.8 27.4/24.2
Minimum air temperature oC SS/FN -28.4/-29.1 -30.2/-30.8 -34.2/-36.3 -23.9/-26.5
Mean annual air
temperature
oC SS/FN na/-2.1 na/-2.9 na/-3.3 na/-1.7
Rain (April-September) mm SS 243 295 227 223
Duration of snow-free
period day SS/FN 232/194 268/214 na/202 249/185
Table 2.2 Characteristics of general meteorological parameters at the mountain steppe on the south-
facing slope and on the forested north-facing slope. Note: non-available data is represented by “na”.

21
Chapter 3. Solar radiation reallocations on the forested slope and
steppe slope
3-1. Introduction
Solar radiation is the main energy of physical, biological and chemical processes on earth
surface (Dubayah and Rich, 1995). Incoming and net radiation from the Sun, through their role in
the surface energy and water balances, affect many environmental processes such as air and soil
heating, turbulent mixing of the atmosphere, air pressure, winds, photosynthesis,
evapotranspiration, and snowmelt (Dubayah, 1994; Eugster et al., 2000). The latitudinal gradient
in solar radiation caused by the orientation of the Earth relative to the Sun, and the response of
vegetation to this gradient at broad spatial and seasonal time scales, is well known (Dubayah,
1994; Hatzianastassiou et al., 2005). Significant variability in solar radiation can also occur at
spatial and temporal scales because of clouds and other types of atmospheric diverse. Variability
in elevation, slope inclination, slope orientation (aspect or exposure), and shadowing, among
other topographic effects, can lead to strong local gradients in solar radiation, which directly and
indirectly affect the of permafrost and its energy balance, especially in the margin permafrost
areas. For example, the southern boundaries of the discontinuous permafrost zones in
northwestern Canada and central Mongolia are characterized by tree-covered permafrost
(Ishikawa et al., 2005; Chasnmer et al., 2011). Chasnmer et al. (2011) also reported that the
increased solar radiation due to canopy cover reduced may result in augmented thawing of
permafrost and increased meltwater runoff, which further inhibits vegetation and permafrost
persistence. Moreover, Shur and Jorgenson. (2007) suggested that vertical degradation of

22
permafrost within the subarctic regions may occur where canopy cover does not protect
permafrost from a warmer climate, such as by trees canopy shadowing.
In the northern Mongolia with continuous permafrost zone, PSR is the one of main factors
controlling permafrost distribution, especially at the lower elevations (Etzelmüller et al., 2006;
Heggem et al., 2006). However, they did not consider the effects of forest shadowing on solar
radiation allocation reaching at the ground surface.
During the last several years, the migration of natural zones in Mongolia has been observed.
For instance, a comparison study of the 1992 and 2002, which were taken 10 years apart, reveals
that the land surface has changed significantly (Figure 3.1); desert and steppe area have
increased and forested area has decreased in Mongolia (MARCC, 2009). Moreover, that future
climate warming will decrease productivity of the Siberian larch (Dulamsuren et al., 2011) thus
affecting its existence within the forest-steppe mosaic of Mongolia. Sugita et al. (2007) reported,
if forest in this region is destroyed by human activates and forest fire, it will be not easy to
recover the forest again. These changes in vegetation cover can lead to changes in the surface
energy balance, soil temperature and moisture, which in turn affect the ground thermal regimes
as well as permafrost occurrence.
The objective of this chapter was to evaluate the influences of topography and trees
shadowing on the redistribution solar radiation within the forest-steppe mosaic in the
discontinuous permafrost region, which represents the most general landscape type in northern
central Mongolia.

23
.
Figure 3.1 The vegetation cover change over Mongolia for 1992 (a) and 2002 (b)
(MARCC, 2009).
(a)
(b)
Water body
Barren land
Desert (gobi)
Desert steppe
Dry steppe
Steppe (grassland)
Forested area
Permanent snow
Water body
Barren land
Desert (gobi)
Desert steppe
Dry steppe
Steppe (grassland)
Forested area
Permanent snow

24
3-2. Methods
3-2.1. Estimation of solar radiation reallocation
In this study, it was used PSR and in situ measurements of solar radiation at FN and SS
sites. Because we could not measure solar radiation above the forest canopy, we geometrically
estimated PSR above the forest canopy (site FN) and the mountain steppe (site SS) in order to
clarify the solar radiation reallocation at each site. GDEM provides useful data to describe the
solar radiation regime in complex topography (Tovar-Pescador et al., 2006; Huang and Fu, 2009).
Figure 3.2 ASTER GDEM over the study area.

25
The improved ASTER GDEM (Advanced Space borne Thermal Emission and Reflection
Radiometer; Global Digital Elevation Model) with 30 × 30 m resolution in the study area was
downloaded from the Japan Space System data portal developed by the Ministry of Economy,
Trade, and Industry of Japan and NASA. According to GDEM in the study area, the minimum
elevation level in the region is 1550 m a.s.l. and the maximum is 2195 m a.s.l. with 50 percent of
the points above 1850 m a.s.l. (Figure 3.2). The maximum surface slope is approximately 75o,
and 30 percent of the cells have a slope greater than 15o. As discussed in Tachikawa et al. (2011),
the average elevation error for area from 1000 m a.s.l. to 2500 m a.s.l. is reported to be less than
±5 m. GDEM generally maps the tops of dense land covers such as forest and urban areas
(Tachikawa et al., 2011). In relation to this reference, we can presume that PSRs in our study
only represent values above the forest and grassland but not below the forest canopy. Also, the
elevation of ASTER GDEM at FN site was 1662 m which is 9 m higher than the field or GPS
measurement at FN, and this difference could be related to forest cover. However, at the SS site
the elevation of ASTER GDEM was 1660 m, which is 2 m lower than the field or the Global
Positioning System (GPS) measurement at SS. In addition, a regional study in Japan showed that
ASTER GDEM differs from the 10-m national elevation grid by -0.7 meters over bare areas, and
by 7.4 meters over forested areas (Tachikawa et al., 2011). Therefore it is acceptable for use in
estimating the PSR over the forest and steppe in our study area.
This study used the solar radiation analysis tools in ArcGIS10.2® Spatial Analyst to
calculate PSR. This calculation requires some environmental parameters such as transmittivity, a
diffuse proportion, viewshed direction, zenith and azimuth divisions. According to ESRI (2011),
the present study used a transmissivity of 0.5 and diffused proportion of 0.3 in the calculation for
clear sky conditions. Other parameters were set to a sky size of 200 x 200, a skymap of eight

26
zenith divisions and eight azimuth divisions, and a sunmap of half-hour intervals throughout the
monthly intervals throughout the year.
The solar radiation analysis tools account for site latitude and elevation, steepness (slope)
and compass direction (aspect), sun angle shift, and topography shadows. These calculations,
which can be performed for point locations or entire geographic areas. The steps for using a
GDEM data to calculate PSR using ArcGIS are summarized in the following scheme (Huang and
Fu, 2009).
Scheme 3.1 Steps followed to calculate potential solar radiation on GDEM using ArcGIS.
Sunmap calculations
/Overlay of the viewshed on a direct
sunmap to estimate direct radiation/
Skymap calculations
/Overlay of the viewshed on a diffuse to
skymap estimate diffuse radiation/
Digital Elevation Model
/Raster/
Viewshed calculations
/The calculation of an upward-looking
hemispherical view based on topography/
Repeating the process for every location of interest to
produce potential solar radiation map
Overlay of viewshed with sunmap and skymap
/The viewshed is overlaid with the sunmap and skymap
rasters to calculate diffuse and direst radiation received
from each sky direction/

27
This simulated PSR contains the sum of direct and diffuse radiation, and represents the
influence of the topography on distribution of solar radiation but it do not include reflected
radiation and cloud effects (Huang and Fu, 2009; Tovar- Pescador et al., 2006). As mentioned in
chapter 2.2, a pyranometer is used to measure solar radiation falling on a horizontal surface at
each site with AWSs (FN and SS). Its sensor has a horizontal radiation-sensing surface that
absorbs solar radiation (including direct and diffuse) from the whole sky (i.e. a solid angle of
2πr) (Campbell Scientific, Inc., 2011). Therefore, it is considered satisfactory to estimate the
effects of cloud and forest on reallocation of solar radiation in the study area based on PSR and
measured solar radiation at each site. We here define and use hereafter four parameters (Scheme
3.2): PSR above the forest canopy (Raf↓), PSR above the mountain steppe (Ras↓), solar radiation
observed below the forest canopy (1 m) at site FN (Rbfc↓), and solar observed on the mountain
steppe (2 m) at site SS (Rs↓). It was therefore considered straightforward to calculate the
coefficient of cloud cover (kc) for a given time, and this was defined as 1 minus the ratio of solar
radiation at the surface (Rs↓) to the solar over the mountain steppe Ras↓ because there was no
forest cover at site SS:
kc = 1 - ( Rs↓/Ras↓) (1)
It is considered possible therefore to consider that values of kc at SS and FN are almost the
same, because the cloud frequencies at the two sites are almost identical owing to the short
distance between them (the distance between the two sites is only 1.58 km). Thus, it was also
possible to compute the solar radiation (Wm-2
) above the forest canopy (Rafc↓), which was
estimated by the following equation for site FN:
Rafc↓ = (Raf↓ - Raf↓*kc) (2)

28
An estimation of the coefficient of forest cover was then deduced as follows:
kf = 1 - (Rbfc↓/ Rafc↓) (3)
The magnitudes of the coefficient of cloud cover and forest ranges from 0 to 1 and can be
indicated by as the percentage. The subscripts f, a, b and c represents for forest, above, below
and canopy. Clear descriptions of the equations are also shown in Scheme 3.2.
Scheme 3.2 Schematic illustration of the method of calculating solar radiation at each site. Raf↓ -
PSR above the forest canopy, Ras↓- PSR above the mountain steppe, Rbfc↓- observed solar radiation
below the forest canopy (1 m) at site FN, Rs↓ - observed solar radiation on the mountain steppe (2
m) at site SS, kc - the coefficient of cloud cover, kf -the coefficient of forest cover, and Rafc↓-
computed solar radiation above the forest canopy.
29
3-3. Results and discussions
3-3.1. Potential solar radiation over the study area
Topography had fundamental effect on the solar radiation reallocation. Figure 3.3 illustrate
the spatial distribution of monthly PSR allocation over the study area through 2006. The
geographical distribution of solar radiation is greatly varied with heterogeneity of the study area
and seasonal shifts of the sun. The PSR in the study area for two coldest months of January and
December show that the area receives a low amount of solar radiation with a range of 0.5–160.0
Wm-2
approximately. During these months, the minimum PSRs were observed over the forested
north-facing slopes, ranging from 0.5 to 20.0 Wm-2
due to low angles of the sun and slope
shading. These small values, especially closely to 0 Wm-2
imply that the duration of sunshine is
very short somewhere in the study area. While, the higher values of 70.0–160.0 Wm-2
were
observed over the mountain chain with a forest and south-facing slopes. In June and July, the
hottest months, PSRs in the area reached its annual maximum values due to the higher sun
solstice of the year. During this period, the received average monthly solar radiation in this area
is varied between 340.0 and 440.0 Wm-2
. The higher PSRs of 420.0–440.0 Wm-2
were only
observed on the mountain chain while absolute values in solar radiations on the south-facing and
north-facing slopes were almost similar with a range of 400.0–420.0 Wm-2
. This small difference
between the south-facing and north-facing slopes indicates that the effect of topography on solar
radiation is less on the north-facing slope during summers, and both slopes have potential to
absorb similar amounts of solar radiation during the summer. In contrast, the considerable
differences on PSR between slopes in winter reveal that the effect on topography on solar
radiation on the north-facing is a large compared to the south-facing slopes.

30
Figure 3.3 Monthly averages of potential solar radiation over the study area for 2006.

31
These results are also confirmed by the simulated PSRs at sites SS and FA as summarized in
Table 3.1. For instance, the monthly differences between Ras↓ and Raf↓ ranged from 76.2 Wm-2
to 94.3 Wm-2
during the winter season, but they ranged only from 28.0 Wm-2
to 24.3 Wm-2
in
June and July. On an annual basis, the mean annual PSR was 2999.0 Wm-2
at SS site and 2160.3
Wm-2
at FN site, respectively.
Jan Feb Mar Apr May Jun Jul Aug Sep Oct Now Dec
Ras↓ 105.0 121.0 221.3 335.0 415.0 423.0 420.0 364.4 255.9 144.4 108 86
Raf↓ 11.5 28.2 136.8 265.2 373.3 395 395.7 301.2 174.4 55.5 13.7 9.8
Table 3.1 The monthly potential solar radiation (Wm-2
) at SS and FN site for 2006.

32
3-3.2 Cloud effect on solar radiation
Figure 3.4 compares the monthly PSRs (Ras↓) and measured solar radiations (Rs↓) at SS
site for 2006. The monthly values of Ras↓ were exhibited higher values than those of Rs↓ at the
site owing to effects such as clouds, precipitation and aerosols in atmosphere. However, the
seasonal variations in Ras↓ corresponded closely with those of Rs↓ (R2 = 0.96, p < 0.0001) during
the year.
Table 3.2 summarizes the effect of cloud cover (kc) on the monthly solar radiation at site
SS throughout the year. Smaller values of kc ranged from 0.03 to 0.15, and these valleys
occurred from November to March. Inversely, large values of kc (ranging from 0.13 to 0.38)
were found in the summer. These seasonal phenomena in kc could be related to the cloud
frequency over the study site. In general, Mongolia‟s climate is controlled by the westerlies,
Figure 3.4 The monthly potential Ras↓ and observed solar radiation Rs↓ at SS for 2006. Note:
there was no observed solar radiation data in October.

33
which bring a cloud with precipitation from the Atlantic and the Mediterranean in summer,
rather than by the South Asian monsoon (Gillespie et al., 2003). According to the hydro-
meteorological data at SS site, the total precipitation from April to September comprised 78–90
percent of total annual precipitation, which is consistent with previous studies. For example, in
central Mongolia, about 85 percent of annual precipitation falls from April to September
(MARCC, 2009). Furthermore, Sato et al. (2007) examined the temporal and spatial variations of
cloud distribution over arid and semiarid Asia. They summarized that the cloud frequency is high
near the top and northwest of the Khentii Mountain during summers. Therefore, in the vicinity of
study area has higher cloudy days during summer, which strongly affect the reallocation of the
solar radiation at reaching the ground surface as shown in Table 3.2.
Winter atmospheric conditions in Mongolia are dominated by the clear sky, less snow fall
and high anticyclone (Batima et al., 2005). Moreover, there are approximately 250 sunny days a
year, often with clear cloudless skies, the most of which occurs in winters (Batima et al., 2005).
These might be caused to smaller values of kc over the study area in winters.
Table 3.2 Coefficients of cloud cover over the study area (kc). Note: non-available data is
represented by “na”.
Date Jan Feb Mar Apr May Jun Jul Aug Sep Oct Now Dec
kc 0.03 0.04 0.15 0.23 0.33 0.31 0.38 0.24 0.13 na 0.04 0.04

34
3-3.3. Forest effect on solar radiation in the forested area of the study area
The shelter effect of forest canopy on monthly solar radiation was assessed by the values in
Table 3.3 and Figure 3.5. The comparison of Rafc↓ and Rbfc↓ in Figure 3.5 implies that the forest
canopy greatly reduce the penetration of solar radiation. Moreover, the monthly variations in
Rafc↓ and Rbfc↓ showed very different (R2 = 0.52 p < 0.04) patterns in their seasonal variation,
mainly due to the evolution of the forest canopy throughout the year. For example, the annual
maximum of solar radiation over the forest (Rafc↓) occurred in June, while the annual maximum
Rbfc↓ was in May or before leaf expansion begins. Thereafter, Rbfc↓ decreased due to the leaf
growth of trees.
The seasonal evolution of the forest canopy in north central Mongolia has been illustrated in
other studies (Iijima et al., 2012; Miyazaki et al., 2014), where it has been observed that leaves
Figure 3.5 The monthly potential (Rafc↓), calculated (Raf↓) and observed solar radiation (Rbfc↓)
at FN for 2006.

35
emerge in May, mature in July, and leaf senescence occurred in mid-September. These features
corresponded with the seasonal variation in kf as shown in Table 3.3. From January to August, kf
showed an increasing trend, which was followed by a decreasing trend that lasted until the end of
year. During the full-leaf period, especially in June, July, and August, kf was higher, ranging
0.78–0.86, owing to strong shading by the forest canopy. This means that 22–14 percent of the
solar radiation over the forest cover reaches the forest floor and that 78–86 percent of it is
sheltered by forest canopy. In winter season, kf was lower and ranged from 0.33–0.37 from
December to February. These results suggested that the solar radiation reaching the forest floor
was affected by not only forest leaf evolution in summers but also by defoliated trees in winters.
This is proved by Photo 3.1. Two hemispherical photographs at FN were taken from the forest
floor (Photo 3.1), which certainly illustrate the situations of forest canopy in winter and summer,
respectively. As viewed by these photographs, on 9 August 2007 for FN site, forest canopy was
well developed and the sky horizon was considerably occluded. It was strongly blocked the
penetration of solar radiation through forest. While on 20 February 2007, the forest canopy
completely disappeared and the sky horizon was wide-open, although defoliated trees have still
shade.
Table 3.3 Monthly coefficients of forest canopy (kf) at FN site for 2006. Note: non-available
data is represented by “na”.
Date Jan Feb Mar Apr May Jun Jul Aug Sep Oct Now Dec
kf 0.33 0.34 0.52 0.58 0.62 0.78 0.85 0.86 0.77 na 0.39 0.37

36
Compared with other stations in the boreal and subarctic zones (Eugster et al., 2000), Rbfc↓
usually showed a considerably smaller amount, but Rafc↓ and Rs↓as shown in Figure 3.4-5 were
obviously higher than those in subarctic and Arctic zones during summer. Overall, these results
indicate that the changes in vegetation cover within the forest-steppe mosaic have potential to
greatly modulate solar radiation, which further leads to differences on the surface energy balance,
thus ground temperature regimes. Furthermore, the reduced solar radiation on the ground within
the forested area at the edge of the Siberian forest is likely to limit the heat exchange between the
ground and the atmosphere.
Photo 3.1 Hemispherical photos at FN site were taken from the roughly same point; (a) at
11:00 on 9 of August in 2007, (b) at 15:00 on 20 of February in 2007, (photos by Ya.
Jambaljav).
a) b)

37
3-4. Conclusions
In a local mountain basin with complex topography and heterogeneous landscape,
measured and simulated solar radiation over two contrary slopes were used to evaluate the spatial
distribution of solar radiation reallocation. The following conclusions are synoptically drawn
from this chapter.
The PSR over the steppe site agrees well with measured solar radiation on the steppe site
(SS) at south-facing slope throughout the year, but no correlation was found between PSR and
measured solar radiation on the forest floor at the forested north-facing slope (FN) due to the
forest canopy. During the winter, the topography effect on solar radiation seems to be very
important for north-facing slopes, as it strongly reduces PSR compared with adjacent south-
facing slopes. Inversely, the topography effect on solar radiation at each slope is less, and the
difference in PSR among the site is practically identical during the summer. The results show
that the considerable differences in observed solar radiation between the sites were caused
mostly by forest cover during the summer. Of the amount of solar radiation above the forest
canopy, 33 – 86 percent is prevented from passing the forest canopy, and only the remnants
reach the forest floor throughout the year. Therefore, the small amount of solar radiation reduced
by forest cover and slope on the north-facing slopes has potential to reduce heat exchange
between atmosphere and permafrost, and may provide favorable conditions for permafrost
existence at FN site in the forest-steppe mosaic.

38
Chapter 4. Influences of site-specific factors on thermal regimes of
the active-layer and seasonally frozen ground
4-1. Introduction
Recent and even ongoing climate changes influencing on permafrost degradation have
been described from a huge number of sites in permafrost regions of Mongolia, Tibet, Siberia
and Alaska. Another factor that contributes permafrost degradation is anthropogenic disturbances,
including overgrazing, forest clear-cutting, forest fires, mining and engineering construction
(Yoshikawa et al., 2003; Iwahana et al., 2005; Sharkhuu et al., 2007; Jorgenson et al., 2011).
Disturbances of the soil surface layer, especially of the vegetation and snow cover alter the
thermal regime of ground, because of the thermal insulation effects of them. These thermal
insulation effects are considerably more important in the discontinuous-sporadic permafrost zone
than that in the continuous permafrost zone (Shur et al., 2007; Jorgenson et al., 2011). The
discontinuous-sporadic permafrost zone is one of the most sensitive areas to climate warming in
the world, the thermal condition of which is quite unstable, very closely to melting point
(Yoshikawa et al., 2003; Ishikawa et al. 2012). As mentioned earlier, Mongolia is located in the
permafrost shift zone from the Siberian continuous permafrost zone to the discontinuous-
sporadic permafrost zone. Therefore, the permafrost in the country could be most vulnerable to
both climate warming and disturbances of thermal insulation effect.
In Mongolia, the permafrost plays an important role in the hydrological cycle and water
supply due to the poor permeability of permafrost, which directly sustains the animal husbandry,
livelihoods of inhabitants and vegetation. For example, the most of rivers in Mongolia originate

39
from four large mountains such as Altai, Khangai, Khuvsgul and Khentii, where permafrost is
extensively developed. If we look at more locally, streams and rivers usually flow from the
forested north-facing slopes, especially in the forest-steppe mosaic. There is another evident
example on Figure 2.1, those all streams in our study area flow from the north-facing slope while
the south-facing slopes does not provide any water recourse to river. Also Iijima et al. (2012)
already found that precipitation and soil water on the north-facing slope can be partitioned to
evapotranspiration and river runoff. On the other hand, the mountain steppe on the south-facing
slope underlying permafrost-free has large evapotranspiration and therefore, both precipitation
and soil water were consumed entirely as evapotranspiration. Thus, the current permafrost
occurrence in Mongolia is one of the most important issues in water resources.
Since 2003 we have been continuously measuring the hydro-meteorological parameters at
the sites in northern Mongolia, aiming to delineate the different hydrological characteristics
between mountain steppe on south-facing and forested north-facing slopes (Ishikawa et al., 2006;
Iijima et al., 2012). The ground temperature measurement and direct resistivity surveys
(Ishikawa et al., 2003, 2005) have demonstrated that the permafrost develops only under the
forested north-facing slope, from which the river water comes entirely (Iijima et al., 2012).
However, few studies have documented the interplays between the ground temperature regime,
vegetation cover, and atmospheric parameters in such a mosaic region.
The purpose of this chapter is to describe five-year (2003-2006) records of comparable
hydro-meteorological parameters on these slopes, with special focus on the site-specific factors
controlling ground temperatures regime of the active-layer and seasonally frozen ground on these
contrasted slopes.

40
4-2. Methods
4-2.1. Analytic procedures of the soil thawing and freezing processes
An analysis of ground temperature regimes of the active-layer at FN site and seasonally
frozen ground at SS site was performed using thawing/freezing degree-days (TDD and FDD,
respectively), the thickness of the active-layer and seasonally frozen ground, the zero-curtain
effect, the freezing/thawing rate, and the onset of thawing/freezing for the period with available
datasets (because some datasets were missing as mentioned above reasons in chapter 2). ALT
and SFGT were the annual maximum depth reached by the 0°C isotherm during the soil thawing
and freezing, respectively. ALT was determined by a linear interpolation of the soil temperature
profiles between two neighboring measurements at the time of maximum thawing (Brown et al.,
2000), and SFGT was estimated by maximum freezing. The onsets of soil thawing and freezing
at the sites were determined by daily average ground surface temperatures that remained
consistently above and below 0°C, respectively. Soil freezing and thawing rates describe how
fast soils can freeze and thaw, and were defined by linear interpolation using the 0°C isotherm
penetration based on soil temperature data. TDD and FDD defined as the sum of degree days
above 0oC during the thawing season and the sum of degree days below 0
oC during the freezing
season, and were calculated using by following integrals.
∫
(4)
∫
(5)

41
where 1 and 365 represent the first and the last day of year and T is the temperature of air and
ground surface.
The daily average thickness of snow cover was manually measured at SS and FN sites
using five fixed poles with a centimeter range, and the median of these was used in analysis. This
was available during the winters of 2003/04 and 2004/05 but was only collected once per month
in the remaining winters. The exact duration of snow cover at each AWS site was calculated
from the surface albedo, using the ratio of the downward shortwave radiation to reflected
shortwave radiation, and it was assumed that an albedo above 0.4 magnitudes indicated the
existence of snow cover.
The thermal conductivity ( ) of soils at SS and FN sites can be estimated using Farouki's
equation (1981). This equation requires volumetric estimates of the soil compositions, soil
physical characteristic, volumetric water and ice contents at given depths.
(6)
where is the soil porosity of the ith layer (%/%), is volumetric water contents
(m3/m
3), ks is the thermal conductivity of soil (W/mk), ki is the thermal conductivity of ice
(W/mk), and kw is the thermal conductivity of water (W/mk). These parameters were described
by Ishikawa et al. (2005), and set; = {0.54, 0.4 0.4, 0.4 m3/m
3} at SS and
= {0.6, 0.4 0.4, 0.4 m3/m
3} at FN, and {ks,, ki, kw }={0.55, 2.2, 0.57 W/mk }at the
sites. As mentioned in chapter 2, was measured using a frequency domain reflectometry sensor
at each site. During the soil unfrozen period, can be estimated from soil moisture
measurements. However, the soil moisture measured by a frequency domain reflectometry
sensor during the freezing period is not efficient since it measures only unfrozen water in the soil

42
layers. While, during the freezing period when the soil temperature continuously below 0oC,
denote the soil volumetric soil liquid plus the solid water (ice content), which was assumed to be
the same as that observed the preceding fall just before the soil froze, as long as there was no
significant change in the data of frequency domain reflectometry. This assumption was applied
in the permafrost region of the Tibetan Plateau (Zhang et al., 2003).
In addition, given that the F and S plots are located in the same geographical situations and
that their soil‟s compositions are practically identical. Hence, the main differences in the ground
surface temperature between the F and S plots are likely to be attributed to differences in
vegetation cover (forest and steppe). By comparing the differences of ground temperature from F
and S plots, it can determine the forest effect on the ground temperature regimes in this mosaic.
4-2.2. Calculation of heat fluxes
To clarify the summer energy budget at FN and SS sites, it was used the following
components and equations. The net radiation (Rn) is the sum of downward shortwave radiation
mainly from the sun (RS↓), reflected shortwave radiation from the ground surface (RS↑),
downward longwave radiation emitted by clouds, aerosols and gases (RL↓), and upward
longwave radiation (RL↑). All of these radiation comments were measured at FN and SS sites. In
the current study, Rn (Wm-2
) is expressed as following equation:
(7)
The energy balance at each site can be described as follows:

43
(8)
where LE is the latent heat flux (Wm-2
), Hs is the sensible heat flux (Wm-2
) and G the ground
heat flux (Wm-2
). To clarify turbulent heat fluxes and its variations at the sites, it was used the
Bowen-ratio (Bo) method (Bowen, 1926), which is defined as the ratio of the gradients of
temperature (T) and water vapor pressure (e) between two heights.
(9)
Then, the computations of sensible and latent heats for summer period can be determined from
Bowen-ratio, energy balance equation and ground heat flux.
(10)
(11)
where γ is the psychrometric constant (hPa oC), and ∆T and ∆e are the temperature (
oC), water
vapor pressure (hPa) gradients, ∆T=Tz1-Tz2, ∆e=ez1-ez2, and z1 and z2 are the measurement
heights of air temperature and water vapor pressure, respectively. Before using Bo in final
analysis, a quality control of Bo was performed, according to the objective criteria as indicated
by Ohmura. (1982). This operation removed the values of Bo and that were very close to -1 and
those corresponding to flux direction the same as that of the gradient. This generally occurs at
the early morning and late afternoon (Ohmura, 1982). In this study, the G was estimated from the
observed values by a soil heat flux plate at 0.05 m depth in the soil.

44
4-3. Results
4-3.1. Radiation fluxes
In order to clarify the radiation balance and summer energy exchanges within the forest-
steppe mosaic, we only used data for the summer of 2006, due to the data-recording problems as
mentioned in chapter 2. As shown in Figure 4.1, the spatial variability of vegetation structure
along the forest-steppe mosaic profoundly alters the radiation regimes at the ground surface,
although they had similar patterns. During summer, the steppe (SS) site received more RS↓ than
the forest (FN) site, with a peak of 411 Wm-2
at the end of June at SS site. At FN site, the amount
of RS↓ below the forest canopy strongly related to the canopy density. The peak value of daily
RS↓ below the forest canopy reached 126.9 Wm-2
, and typically occurred at the end of May,
approximately one month earlier than at SS site. Thereafter, at the beginning of the leaf growing
period, RS↓ below the forest canopy began to decrease sharply between early June and July, due
to forest canopy expansion. From mid-July to mid-September, daily average of RS↓ below the
forest canopy was weak and ranged from 15 to 45 Wm-2
. Then, it increased slightly for a few
days during mid-September (Figure 4.1a) despite the seasonal decrease in RS↓ above the forest
canopy as described in the previous chapter, and this was attributed to initial leaf loss from the
forest canopy. Thereafter, at the end of September, RS↓ at the forest floor started to decline again,
and this decline in RS↓ also happened at SS site due to a gradual change in the sun angle. In
winter, downward RS↓ is low and remains almost stable at each site due to the lower solar angles.
The lowest RS↓ value (nearly zero) below the forest canopy at FN occurred between mid-
December and the beginning of January. These comparisons imply that the energy absorbed by
45
RS↓ on the ground is considerably low in forested areas than steppes areas, especially in warm
seasons.
In both areas, the seasonal variations in RS↓ were strongly modified by surface conditions
and RS↑ (Figure 4.1). For example, differences the relative magnitudes of RS↑ in relation to RS↓
at each site were found throughout the year (Figure 4.1a and b). In winter, RS↑ followed the
course of RS↓ at both sites, and it dropped suddenly at SS in mid-March and at FN early April,
the due to the disappearance of snow. During the full snow covered period from January to
February, the average RS↑ accounted for 80 percent (10.8 Wm-2
) of RS↓ at FN and 76 percent
(92.0 Wm-2
) of RS↓ at SS, due to the high albedo of snow cover. Inversely, it accounted for 20
percent (8.0 Wm-2
) of RS↓ at the former site and 18 percent (48.5 Wm-2
) of RS↓ at the latter site
from July to August, primarily owing to the low albedo of vegetation coverage at each site.
These percentages in RS↓ for the summer were consistent with percent of 21 for Mongolian
grassland (Li et al., 2006).
In general, RL↓ and RL↑ showed a similar temporal variations pattern at both sites, with the
lowest values in winter and the highest in summer at the area (Figure 4.2). However, it was
found that RL↑ in the year considerably exceeded RL↓ at the steppe site (SS). For example, at SS
site, RL↓ was averaged 284.1 Wm-2
and RL↑ was averaged 375.5 Wm-2
during the summer,
respectively. This difference may correspond to the surface feature, less clouds, low water vapor
pressure in the atmosphere and higher RS↓ (Zhang et al., 2010). While, at the forest floor (FN),
RL↑ was almost similar or somewhat large than RL↓, whit averages of 345.5 Wm-2
and 337.9
Wm-2
, respectively. This is likely caused by the strong shade of forest canopy during the summer.
It is also confirmed by those similar values of RL↓ and RL↑ that were observed during the full-
leaf period (Figure 4.2a and b). In winter, RL↑ at FA was 250.4 Wm-2
and RL↓ was 239.4 Wm-2
.

46
At the same time, RL↑ usually exceeded RL↓ at SS site, although no complete data were available
(Figure 4.2). These results indicate that the energy loss by RL↑ from the steppe is greater than
that of the forest floor.
On the whole, the average amount of radiation components in both directions at the steppe
was obviously larger throughout the year than at the forest floor. Hence, any differences in the
vegetation structure, for example a forest vs. a steppe, can significantly influence the shortwave
and longwave radiation regimes at the ground surface. These differences in radiatiave energy in
the study sites could lead to distinctly different heat fluxes. Summer energy exchanges at the
sites are examined in detail in the following sub-chapter.
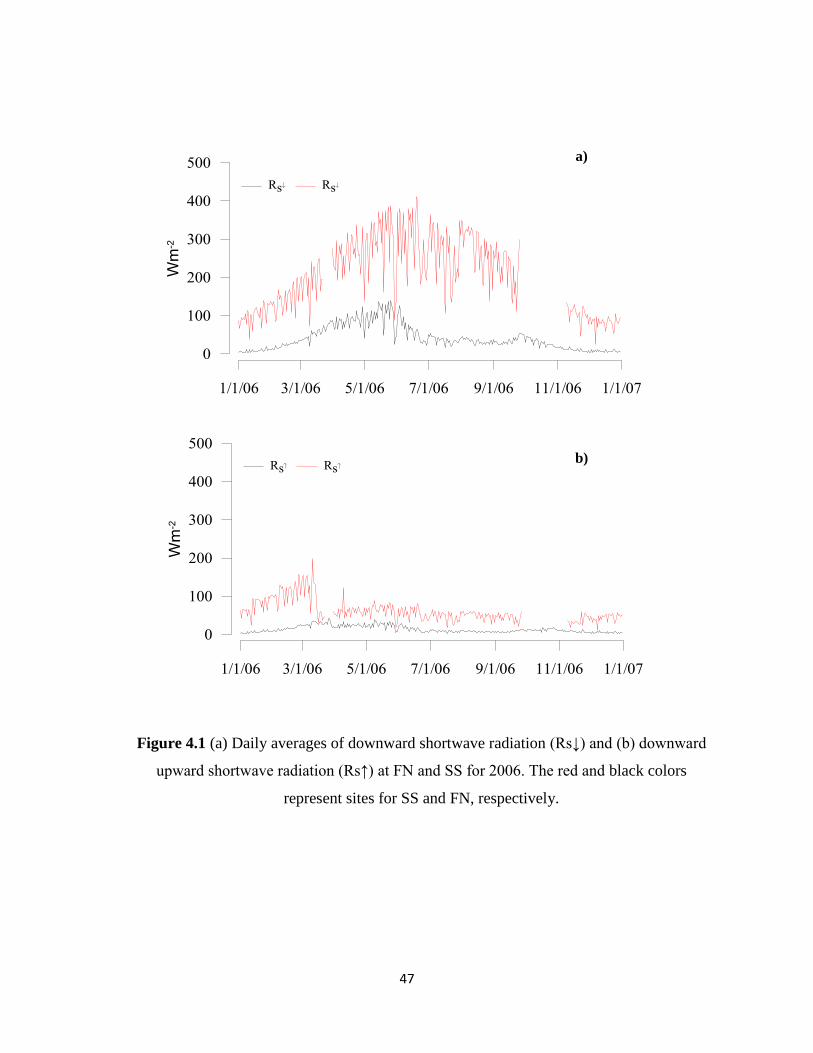
47
Figure 4.1 (a) Daily averages of downward shortwave radiation (Rs↓) and (b) downward
upward shortwave radiation (Rs↑) at FN and SS for 2006. The red and black colors
represent sites for SS and FN, respectively.
a)
b)

48
a)
b)
Figure 4.2 (a) Daily averages of downward longwave radiation (RL↓) and (b) upward
longwave radiation (RL↑) at FN and SS for 2006. The red and black colors represent
sites for SS and FN, respectively.

49
4-3.2. Summer energy budget at the sites
Figure 4.3 shows the variations of the five-day average values of summer energy fluxes at
the sites. The considerable differences in Rn between two sites were markedly affected by net
shortwave radiation, albedo and the net longwave radiation at each site. Ground surface albedos
varied between 0.18–0.28 at FN and 0.17–0.27 at SS for snow free seasons, respectively. The
magnitudes of lowest albedo at both sites were in August. The maximum peaks of Rn were
occurred at the end of May at FN and at the end of June for SS. These patterns are consistent
with the observed peaks of RS↑ at each site. During the growing sessions, Rn was approximately
70 percent greater over SS than that at FN. Indeed, from April through September 2006, Rn
averaged 27.9 Wm-2
at the latter site, and 112.3 Wm-2
at the former site, respectively. This
difference in Rn between the sites was primarily contributed to differences in heat fluxes at each
site.
A more Rn at SS site compared with FN site could lead to the higher amounts of LE, Hs
and G as shown in Figure 4.3. During the beginning of April, Rn was mostly converted to Hs,
that is, Hs was higher than LE during the period. From mid-April to the end of May Rn gradually
increased and led to increasing LE, but Hs tended to reduce, and LE was higher than Hs.
Thereafter, Rn began to decrease steadily together with LE and Hs from June to September.
These patterns are consistent with energy exchange observation at the forested area on
permafrost in northern Mongolia (Miyazaki et al., 2014) and a larch forest in eastern Siberia
(Ohta et al., 2001). Temporal variations in G were very similar to variations in Rn during the
summer time, and it was positive from the beginning of April to the end of September, indicating
heat loss from the ground to the air.

50
The patterns of summer energy fluxes at site SS (Figure 4.3b) were typically similar with
the above mentioned patterns on energy fluxes at site FN. However, the absolute values of
fluxes at the former site were much higher than at the latter, and the peak values of LE were
usually computed in the mid-summer. These results imply that the LE is dominant factor in
energy budget rather than Hs at each site. The main reasons for the temporal altering
characteristics of the turbulent fluxes among the study sites are mostly the summer precipitation,
the thawing-freezing of ground and plant activity (Liu et al., 2010; Miyazaki et al., 2014). As
mentioned earlier, the total precipitation from April to September comprised 80–90 percent of
total annual precipitation, which led to the significant increase of the subsurface soil moisture
content during the summer. Therefore, probably this is one of the important reasons why the LE
increased after mid-April and was much higher than Hs during the summer at both sites.
Furthermore, in the study area, the dense grass started to grow from early May in conjunction
with increasing evapotranspiration, especially at steppe (Iijima et al., 2012). In early summer, the
thawing of the ground, which acts as an impenetrable layer for ground water (Ishikawa et al.,
2005), making the ground water available to evaporation. Therefore, these combined facts at
sites likely cause that LE is higher than Hs at the sites.
On average over the summer period, the fractions of Rn that were conducted into LE (53
percent) and Hs (32 percent) at FN are comparable to values found by other studies in permafrost
area. Values of LE /Rn and Hs /Rn reported are 53 percent and 38 percent for on peat at larch
forest in Canada, 53 percent and 31 percent for a bog at the Siberia (Eugster et al., 2000). The
fraction 15 percent of Rn was partitioned into G for the same period at FN. This value is similar
to those reported in permafrost areas of Canada and central Siberia (Ohmura, 1982; Boike et al.,
1998). Whereas, at site SS, G, Hs and LE shared 8 percent, 28 percent and 63 percent of Rn,

51
respectively. These percent are similar to those observed at four steppe sites in central Mongolia
(Yamanaka et al., 2007).
A considerable difference in partitioning into G was computed between the sites. The
fraction of G in Rn at FN site was approximately two times higher compared with that SS site.
This variance probably mostly results from site differences in soil thermal regime. Permafrost,
which was only found at forested north-facing slope (Ishikawa et al., 2005, 2008), could also
have contributed to the large percent G by creating a strong thermal gradient between the ground
surface and soil deep. However, the absolute values of G at the SS site were much higher than at
FN. Indeed, G averaged 4.2 Wm-2
at the former site and 9.7 Wm-2
at the latter site during the
summer, respectively.
Since energy exchanges between the ground surface and the atmosphere drive local climate,
such computed differences in heat fluxes between the our study sites is one of important factors
that influence the temperature regimes of ground, as well as the current occurrence of permafrost
and seasonally frozen ground. The results presented in this sub-chapter indicate that gradating
forest to steppe in the forest-steppe mosaic is mostly to enhance the amount of solar radiation on
the ground surface, which may promote heat transmission between the ground surface and
atmosphere. Therefore, any disturbances of forest cover within the forest-steppe mosaic can
substantially alter the solar radiation regimes, which would lead to increased amounts of heat
fluxes at the ground surface. Consequently, permafrost in the mosaic will become vulnerable,
and it may start to thaw because the permafrost temperatures in this region are often at or near
0oC.

52
a)
b)
Figure 4.3 Five-day averages of net radiation (Rn), latent heat flux (LE), sensible heat flux
(Hs) and ground heat flux at FN (a) and SS (b) for 2006, respectively.

53
4-3.3. Hydro-meteorological variables
The basic factors affecting radiation regime and heat fluxes have been examined in
previous chapters. When the radiation regime and heat fluxes at the sites are inevitably
determined by some site-specific factors such as forest and heterogeneity of topography,
however, studies of the chapters only based on single year data and did not describe the interplay
between the site-specific factors and atmospheric parameters. In the following sub-chapters,
therefore, the interplay between the site-specific factors and atmospheric parameters are
discussed, together with the developments of the active-layer and seasonal frozen ground, using
by five-year records measuring comparable atmospheric parameters on these contrasting slopes.
Figure 4.4 shows the annual cycles of daily solar radiation above steppe and below the
forest canopy, and the air, surface temperatures and wind speed at sites SS and FN. The annual
variations of solar radiation at both sites were markedly affected by solar elevation, vegetation
cover, and weather conditions. During the summer period, the SS site received a higher amount
of solar radiation with peaks of 411 Wm-2
and 403 Wm-2
at the end of June 2006 and June 2007,
respectively, while the amount of received solar radiation below the forest canopy was
considerably related to the density of the forest canopy. Peak values of solar radiation below the
forest canopy at FN ranged from 126.9 Wm-2
to 155.2 Wm-2
, and these values typically occurred
at the end of May, approximately one month earlier than at site SS. Thereafter, at the beginning
of the leaf growing period, solar radiation below the forest canopy began to steadily decrease
between June and the end of September until the onset of leaf senescence. It was also found to
increase slightly again for a few days during the middle of September (Figure 4.4a), and this was
attributed to initial leaf loss from the forest canopy. The seasonal evolution of the forest canopy

54
in north central Mongolia has been illustrated in other studies (Iijima et al., 2012; Miyazaki et al.,
2014), where it has been observed that leaves emerge in May, mature in July, and die in mid-
September.
Figure 4.4 Daily averages of: (a) solar radiation; (b) air temperature; (c) ground surface
temperature; and (d) wind speed from September 1, 2003 to the end of 2007 measured at the
mountain steppe on the south-facing slope and on the forested north-facing slope.

55
In winter, solar radiation is low and remains almost stable at each site due to the lower solar
angels. The lowest solar radiation value (nearly zero) below the forest canopy at FN occurred
between the middle of December and the beginning of January for every year. The average solar
radiation from December to February was 95 Wm-2
, 96.8 Wm-2
, 108.5 Wm-2
, and 92.3 Wm-2
at
SS and 10.5 Wm-2
, 8.7 Wm-2
, 11.3 Wm-2
and 10.1 Wm-2
below the forest canopy at FN in the
winters of 2003/04, 2004/05, 2005/06 and 2006/07, respectively (Figure 4.4a).
Although similar patterns of daily air temperature were measured at both FN and SS, air
temperatures at FN were lower than those at SS during summer and winter (Figure 4.4b). For
example, it was possible to estimate the differences in air temperatures between the two sites
from May to August for the summers of 2004, 2006, and 2007, as 2.0°C, 2.6°C and 2.7°C,
respectively. However, the air temperature differences between the two sites from November to
February were lower, at 0.9°C, 0.6°C, and 2°C during the first three winters.
Table 4.1 Comparisons of summer air and ground surface temperatures for mountain steppe on
the south-facing slope and the forested north-facing slope. Note: non-available data is represented
by “na”.
Variable /unit/ Units Site 2004 2005 2006 2007
Mean air temperature
(May-Aug)
oC SS/FN 13.6/11.6 na/11.4 11.7/9.1 15.4/12.7
Mean surface temperature
(May-Aug)
oC SS/FN 15.6/10.2 na/9.5 14.5/9 20/na
TDDair oCdays SS/FN na/1753 na/1726 na/1495 2356/1866
TDDsur oCdays SS/FN 2495/1522 na/1436 na/1409 3453/na

56
The surface temperature in summer exceeded the air temperature at SS, and the opposite
occurred at FN (Table 4.1). In addition, as shown in Figure 4.4c, surface temperature fluctuations
were higher at SS throughout the year than that at FN, and the former site was considerably
warmer in summer and slightly colder in winter than the latter site. These seasonal differences in
ground surface temperatures between the two sites can be mostly explained by interannual
variations in solar radiations at the ground surface at each site, together with variations in snow
cover and soil moisture content. The soil moisture at SS (near-ground surface at 0.1 m) seldom
exceeded 20 percent after rainfall, and immediately started to decrease until the following
episode of rain (Figure 4.5b). Furthermore, there were only small seasonal variations in the soil
moisture content of deeper soil layers (0.4, 0.8, and 1.2 m), which did not exceed 12 percent
during the study period (Figure 4.5b), indicating that soil at the SS site is dry. It is therefore
considered likely that the higher solar radiation on the dry ground at SS causes a warm soil
profile during summer compared to the profile at FN.
Figure 4.5 Soil moisture content measured from September 1, 2003 to the end of 2007 at: (a)
the forested north-facing slope; and (b) the mountain steppe on the south-facing slope.

57
For example, the mean summer ground surface temperature (May–August) at SS was warmer by
5.4°C in 2004 and 5.5°C in 2006 than at FN, respectively (Table 4.1). Such differences in ground
surface temperatures between the sites were also evident in other summers (2005 and 2007);
however no complete temperature data were available for this period (Figure 4.4c).
Interannual variations of snow cover showed similar patterns between both the sites (Figure
4.6), although the thickness and duration of snow cover were greater at FN than that at SS. This
difference in snow cover between FN and SS sites is probably mainly due to different amounts of
sublimation and weaker wind. Strong wind decreased the thickness and duration of snow cover,
especially at SS. The daily wind speed during winter averaged 1.64 m/s for 2003/04 and 1.65 m/s
for 2005/06 (Figure 4.4d), which was sufficient to cause drifting of snow. Snow sublimation is
also an important factor that decreases the snow thickness at site SS, where Zhang et al., (2008)
estimated sublimation at 0.16 mm/day. Inversely, the wind speed during winter was considerably
lower at FN and ranged from 0.35 to 0.49 m/s (Figure 4.4d). Also, Zhang et al. (2008) pointed
out that sublimation from snow cover at FN was 0.08 mm/day, which is two times lower than
sublimation at site SS.
Owing to the thicker snow cover, the surface temperature at FN was quite warmer than at
SS during winter, despite the lower air temperature at FN (Table 4.2). In addition, the air
temperature was colder than the surface temperature at both sites, even though the different
values depended on snow thickness. As summarized in Table 4.2, the snow cover effect is seen
clearly in the interannual variations of ground surface temperatures at each site. For example,
during the cold winter of 2003/04, when average air temperatures from November–February
were -17.9°C at SS and -18.8°C at FN, the maximum thickness and duration of snow cover were
(17 cm and 141 days) at SS and (18.6 cm and 159 days) at FN, which resulted in large

58
differences in the seasonal evolution of air and surface temperature at each site. In contrast,
during the winter of 2005/06, when average air temperatures were -15.8°C at SS and -17.8°C at
FN, there was a reduced maximum thickness and duration of snow cover (5 cm and 85 days) at
SS and (8 cm and 140 days) at FN, respectively. As a result, differences in the seasonal evolution
of air and surface temperature at each site were small. Furthermore, despite the cold winter in
2003/04, both the ground surface temperature and freezing degree-days of surface (FDDsur) at
two sites were greater than in winter of 2005/06.
Figure 4.6 Thickness of snow cover on the mountain steppe on the south-facing slope (purple
circle) and the forested north-facing slope (brown triangle), measured during the winters of the
study period.

59
Table 4.2 Comparisons of winter air and ground surface temperatures, snow cover for the
mountain steppe on the south-facing slope and the forested north-facing slope sites during the
winter period. The last row is the seasonal frozen ground thickness at south-facing mountain
steppe. Note: non-available data is represented by “na”.
Variable Units Site 2003/04 2004/05 2005/06 2006/07
Mean air temperature (Nov-
Feb)
oC SS/FN -17.9/-18.8 -16.9/-17.5 -15.8/-17.8 na/-16.5
Mean surface temperature
(Nov-Feb)
oC SS/FN -11/-9.7 -11.4/na -11.8/-11.6 na/-9.4
FDDsur oCdays SS/FN -1635/-1504 na/na na/-1789 Na/-1427
Duration of snow cover day SS/FN 141/159 114/162 85/140 111/170
Maximum snow thickness cm SS/FN 17/18.6 6.8/8.9 5/8 10/17.5
Seasonal frozen ground
thickness
m SS 3.9 4 4.4 3.7

60
4-3.4. Dynamics of the active-layer and seasonal frozen ground
Figure 4.7 shows interannual variations in soil temperature at FN, from the surface to a
depth of 3.2 m. The active-layer usually begins to thaw at the end of April, with an average
thawing ratio of 0.022 m/day from the surface to a depth of 2 m (the average from the first three
summers). The maximum ALT was usually observed in mid-September, and was strongly related
to the thawing degree-days of air (TDDair) for FN (Table 4.1). In the period 2004–2006, the ALT
was at a maximum amount of 2.67 m in 2004 (the year in which the higher TDDair occurred), and
in the summer of 2005 and 2006 was 2.6 and 2.4 m respectively (at a time when TDDair was
moderately low). However, the hottest summer occurred in 2007, when TDDair was 1866°C days,
during which time ALT developed to more than 2.5 m in early September (thereafter further
developing) (Figure 4.7). Such results indicate that air temperature during summer is the
dominant factor controlling the thickness of the active layer.
Figure 4.7 Seasonal changes in daily average soil temperature at a depth of 3.2 m from the
ground‟s surface at the forested north-facing slope (FN). The gray or open areas indicate missing
data owing to instrument failure, and the ground temperature isoline interval is 1°C.

61
Refreezing of the active-layer usually begins in mid-October, and it is completely frozen
by the end of December. The depth of penetration of soil refreezing is inhibited by the latent heat
of fusion (Hinkel et al., 2001), and during some of this period soil temperatures remain close to
0°C; this is known as the zero-curtain effect (Outcalt et al., 1990). Soils at FN site are
characterized by the presence of abundant water, particularly in the deeper soil layers (Figure
4.5a), and as a result a freezing zero-curtain effect was observed at a depth of 1 m for a duration
of 20 days and 27 days in 2004 and 2005, respectively. In 2006, when soil water contents were
higher, a longer zero-curtain effect of 34 days was observed. However, in spite of the zero-
curtain effect and the thicker snow accumulation at this site compared to that at SS, soil freezing
penetrated rapidly at the rate of 0.043 m/day between the ground surface and a depth of 2 m
throughout all the recorded winters. The rates presented here imply that the refreezing of active-
layer is faster rather than the thawing of active layer, and it is evidently seen in Figure 4.7. This
might be primarily explained by the presence of thick organic layer and soil moisture at FN site,
which has an important influence on conductivity of soil at FN.
In summer, when the organic layer is usually dry because of evaporation, thus most of pore
spaces in the organic layer are filled with air, which has an extremely low thermal conductivity
at FN. Therefore, the warming of ground is inhibited. However, in winter the organic layer at FN
site could become quite moist because of reduced evaporation, and pores in the organic layer
could be filled with ice. The thermal conductivity of ice is approximately four and ninety times
larger than that of water and air (Williams and Smith, 1989). These mechanisms may be
attributed to the differences in soil conductivity as show in Figure 4.8. The figure presents the
calculated conductivity of soil at FN site under freezing and thawing conditions. It was found
that there was significant difference in conductivities of soil for both seasons. In summer, the

62
conductivity of soil were lower at the given depths, with mean ranges of 0.57-0.98 W/mK. In
winter, the mean ranges conductivity of soil were 0.80-1.14 W/mK. Thus, the thawing and
refreezing of active-layer at FN site is strongly influenced by the insulating ability of thick
organic layer.
As shown in Figure 4.9, seasonally frozen ground at SS began to thaw in early April
immediately after the disappearance of snow cover, and the thawing deepened quickly at rates of
0.057 m/day and 0.054 m/day to a depth of 2 m in 2004 and 2006, which is enough twice as fast
as the rate at site FN. The ground had thawed completely by June 30 in 2004 and by June 17 in
2005, but in 2006 it had only completely thawed by August 18 (Figure 4.9).
Figure 4.8 Seasonal variations in thermal conductivity for soil layers from 0.2 m to 1.2 m
under the forested north-facing slope (FN) for winter and summer in 2006.

63
Thermal insulation from snow cover was found to be predominant factor in controlling the
development of SFGT than air temperature. The SFGT at SS was 3.9 m in 2003/04 and 4.4 m in
2005/06, even though air temperature was lower during the former winter than during the latter
winter (Table 4.2). By examining subsequent records, it was found that the thickness and
duration of snow cover decreased from 2003/04 to 2005/06 and the SFGT increased (Figures 4.6,
4.9, and Table 4.2). However, this situation was reversed in the winter of 2006/07: the increased
thickness (10 cm) and duration (111 days) of snow cover resulted in a decreased SFGT of 3.7 m.
This demonstrates that thin snow cover with a shorter duration potentially leads to a deeper
thickness of seasonally frozen ground. The average freezing ratio from the surface to the soil
depth of 2 m was 0.037 m/day during the first three winters.
Figure 4.9 Seasonal changes in daily average soil temperatures at a depth of 6 m from the
surface at the mountain steppe on the south-facing slope (SS). The gray or open areas indicate
missing data owing to instrument failure, and the ground temperature isoline interval is 1°C.

64
Figure 4.10 presents the computed thermal conductivity of soils for SS site. During the
winter and summer, no significant differences in the thermal conductivity at the soil depths were
occurred due to steady moisture content. However, the absolute values of the thermal
conductivity were usually higher at SS than that of FN for both winter and summer. The average
thermal conductivity of soil at SS varied between 09.2 W/mK and 1.04 W/mK.
Figure 4.10 Seasonal variations in thermal conductivity for soil layers from 0.2 m to 1.2
m under the steppe on south-facing slope (SS) for winter and summer in 2006.

65
4-3.5. Comparison of ground temperature in forested and steppe areas
As shown in Figure 4.11a, plot S is colder than plot F during winter, but warmer in
summer. The average surface temperatures from June to September in the summer of 2004 were
10.8°C at F and 16.7°C at S, and 10.4°C and 15.0°C, respectively, in the summer of 2006. In
contrast, in winter the difference in surface temperature between these sites was small owing to
the snow insulation effect, and depended strongly on the interannual variation in snow
accumulation. In the winter of 2003/04 the snow cover was thick and the surface temperature
averaged from November to March was -8.7°C at F and -8.9°C at S, which are almost similar
values. However, for the same period during the winter of 2005/06 there was only a thin snow
cover, and the averaged surface temperatures were -11.4°C at F and -12.6°C at SS, respectively.
This is acknowledged that such seasonal differences in the ground surface temperature between
forested and steppe areas have also been demonstrated previously in this study.
The effects of vegetation cover and the soil organic layer on ground temperature are also
shown in Figure 4.11. The ground surface temperatures at sites F and FN were almost similar for
all summers (Figure 4.11a), which is considered likely to indicate that the low temperature on the
forest floor is usually related to forest cover and not to site location or soil composition. For the
summer ground surface temperature of steppe areas, site SS showed a slightly higher surface
temperature than site S (Figure 4.11a), and this variance is explained partly by the differences in
slope, aspect, and elevation mentioned earlier. For example, average surface temperatures during
June-August were 17.4°C, 18.2°C and 16.9°C at SS site and 15.4°C, 16.6°C and 13.6°C at S plot
for summers of 2004, 2005 and 2006, respectively.

66
Figure 4.11b suggests the importance of the organic layer on ground temperature at greater
depth. Despite similar ground surface temperatures at F and FN in summer, the ground
temperatures at 1 m showed large variations; the monthly ground temperature at F was 1.3°C–
2.3°C higher in the summers of 2004, 2005, and 2006 than that at FN. This is considered likely
to be attributed to differences in the soil organic layer. According to Ishikawa et al. (2005), the
thickness of the organic layer at site F was 0.1 m (which is twice as thin as that at site FN),
because the thickness of the organic layer along the north-facing slope ranges from 0.2 to 0.4 m,
as previously mentioned. However, the observed differences of monthly ground temperature at 1
m between F and FN sites ranged from 0.1°C to 1.4°C during the winters of 2005/06 and
2006/07.
Figure 4.11 Monthly patterns of soil temperatures from September 1, 2003 to the end of 2007 at
all observation sites: (a) surface temperatures; and (b) soil temperatures at a depth of 1-m.

67
These comparable results indicate that the dominant thermal insulator affecting ground surface
temperature within the mosaic throughout the year was mainly vegetation cover, rather than
snow cover. Also, a thick organic layer on forested slopes is favorable for the existence of
permafrost beneath.
Table 4.3 shows the onsets of thawing and freezing during the observation period, where it
is evident that the onset of thawing at the ground surface occurred earlier in the steppe sites than
in the forest sites. For example, in 2004 and 2006, the onset of thawing was noted on DOY (day
of year) 98 and 109 at site S, respectively, which is 9 and 13 days earlier, respectively, than at
the adjacent forested area F. In addition, the onset of thawing at site S at a depth of 1 m was
several days earlier than at site F. In contrast, the onset of freezing occurred approximately on
the same day at both sites, as shown in Table 4.3. Overall, the onset of thawing was earlier, but
the onset of freezing in our study area was later than those in evergreen conifer, larch, and tundra
at high northern latitude (Smith et al., 2004).
Table 4.3 The onset of spring thawing and fall freezing for plots F and S from 2004 to the end of
2006. Ot and Of represent the day of the year when the onset of thawing and freezing occurred.
Note: non-available data is represented by “na”.
Year Depth (cm) F S
Ot Of Ot Of
2004 0 107 294 98 295
100 146 na 123 334
2005 0 na 289 98 289
100 na 329 128 329
2006 0 122 290 109 na
100 162 325 134 326

68
4-4. Discussions
The studies in the chapter exhibit that the interannual variations in soil temperatures under
the forest floor are significantly different from those of the mountain steppe, and although the
locations are immediately adjacent, the temperatures in the forest are colder. These differences
are mainly associated with the behavior of the local climate, the vegetation cover, and the
thermal properties of the ground. In the following the dominant interplay and site-specific
characteristics are discussed for each site.
Mountain steppe: As shown in Figure 4.6, the disappearance of snow cover occurred
several days earlier at SS than at FN in spring, implying that the available heat storage on the
surface could be used efficiently in soil heating and turbulent heat fluxes, thereby causing a
much longer thawing session. As almost all summer precipitation was consumed by
evapotranspiration at SS (Iijima et al., 2012), soils were generally dry at SS during summer
(Figure 4.5b). Therefore, a higher amount of solar radiation on the dry ground surface at SS is
considered likely to cause a warm soil profile in summer. The soil texture beneath the south-
facing slope is simpler, characterized by sandy gravel (Ishikawa et al., 2005) which has higher
thermal conductivity (Williams and Smith, 1989) than the gravelly soil with a deeper organic
layer on north-facing slope. A lower amount of soil moisture in the ground also allows the
effective transfer of heat into the ground, because less energy is required for a phase change into
soil water, and this is confirmed by the lack of zero-curtain effects that were observed within the
soil upper layer during the entire observation period. These combined effects on the site could
therefore be responsible for driving the rapid soil warming at the SS site during spring and
summer, resulting in the rapid thawing of seasonally frozen ground.

69
Snow cover accumulation is one of the most important factors determining ground
temperature variations during the winter season because it limits heat exchanges between the
ground and the atmosphere owing to its low heat conductivity (Williams and Smith, 1989; Zhang
et al., 2005b). The smaller amount of snow cover at SS than at FN, and the shorter retention
period (Figure 4.6 and Table 4.2), is considered to be mainly due to the higher amount of
sublimation and wind scour. Zhang et al. (2008) reported sublimation from snow cover at SS as
0.16 mm/day, which is twice as high as that at FN. It is therefore evident that there is a weak
effect from snow insulation in the steppe areas, releasing more heat from dry ground to the
atmosphere, thereby enabling the development of deep seasonally frozen ground at SS.
Forested slope: The strong reduction in the amount of solar radiation on the forest floor
(Figure 4.4) is related to its modulation by the forest canopy and the slope, and is considered to
be one of the factors causing lower ground surface temperatures in summer in the forested areas
compared to the steppe areas (Figure 4.11b). Permafrost beneath north-facing slopes acts as an
impenetrable layer for ground water (Ishikawa et al., 2005), and on the other hand, a lower
amount of evapotranspiration from this slope (Iijima et al., 2012). This results in wet ground at
FN (Figure 4.5a), which generally has a higher thermal conductivity than that of dry soils
(Farouki, 1981; Hinzman et al., 1991) and should therefore contribute to heat transfer from the
ground surface to deep soil layers, enabling a warm soil profile. However, soil temperatures in
the deeper layers at FN are generally colder than at other sites during the summer, as shown in
Figure 4.11b, probably indicating that the thick organic layer at the site has an efficient
insulation of heat from the surface towards the deeper soil, and because of the low conductivity
of the organic layer in the unfrozen state (Williams and Smith, 1989). The cooling effect of thick
organic layers during summer has been reported in other boreal forested regions in Alaska and

70
Kamchatka, (Yoshikawa et al., 2003; Fukui et al., 2008). In addition, the longer lasting snow
cover at the forested site (FN) shortens the summer thawing period. Therefore, these combined
effects at FN considerably prevent the soil from warming during summer and lead to lower soil
temperatures in the soil substrate during summer compared with those at the SS site.
As shown in Figure 4.4c and Table 4.2, the insulation effect of low conductivity of snow
cover on the ground surface temperature is more significant at FN than at SS in winters, although
the thick organic layer at FN site probably contribute to heat loss from the ground due to their
high conductivity in the frozen state (Williams and Smith, 1989). It is likely that there could be a
considerably higher ice content within the upper ground layer at FN during winter, as the soil
moisture values were higher in this area during autumn. It is therefore considered that the ice
content within the upper frozen ground in winter also promotes a quick heat transfer, due to its
high conductivity and low heat capacity. Thus, the ground temperature decreases rapidly in
relation to the above-mentioned factors, which leads to quick refreezing of the active-layer at FN.

71
4-5. Summary
Five-year measurements of hydro-meteorological parameters over two slopes with
different vegetation covers were used to demonstrate the characteristics of temperature regimes
in active-layer and in seasonally frozen ground. These remarkably contrary environments
strongly showed variable thermal regimes at both of the two slope types. The following points
summarize the results presented in this chapter.
Changes in vegetation cover firstly influenced on the solar radiation amount on the
ground surface and thus on net radiation. Consequently, the seasonal variation in
energy energy flux at the two sites exhibited different features and amounts. During
the summer of 2006, net radiation averaged 27.9 Wm-2
at FN site and 112.3 Wm-2
at
FN, respectively. This difference in Rn between the sites was primarily contributed to
differences in heat fluxes at each site. The turbulent heat fluxes at the sites showed a
seasonal characteristic, and sensible fluxes were greater than latent heat fluxes in early
summer, but the opposite occurred throughout the summer. During the summer, about
15 percent of net radiation stored as ground heat flux at FN site due to the strong
temperature gradient, and it is approximately twice higher percent than at SS site.
However, the absolute value of ground heat flux at the latter was much greater than the
former.
In summer, the surface temperature exceeded the air temperature, mostly because of a
large amount of solar radiation, on the dry south-facing slope, which resulted in rapid
thawing of seasonally frozen ground and a warm soil profile. Inversely, forest cover
canopy on the north-facing slope significantly reduced air temperature and solar

72
radiation to the ground, thus the air temperature was higher than the surface
temperature. Moreover, a thick soil organic layer strongly limited heat transfer to the
ground deep.
In winter, the surface temperature was warmer at the forested slopes than at the steppe
slopes owing to greater accumulated snow cover. However, the thick organic layer
beneath the snow cover enhanced the freezing rate, especially at FN. The snow cover
duration and snow thickness at SS had a considerable influence on the development of
seasonally frozen ground and were inversely related with SFGT.
The effects of forest and an underlying thick organic layer at the edge of the Siberian
forest are both important factors for contributing the existence of permafrost in this
region, which appears only beneath forested north-facing slopes.

73
Chapter 5.
General discussion
On a global scale, climate is the main factor influencing permafrost occurrence, though
site-specific factors become increasingly important at the local scale. Shur and Jorgenson, (2007)
created a permafrost classification system to describe the interaction of climate and ecological
processes in permafrost formation and degradation that differentiates five patterns of formation:
„climate-driven‟; „climate-driven, ecosystem-modified‟; „climate-driven, ecosystem-protected‟;
„ecosystem-driven‟; and „ecosystem-protected‟ permafrost. According this classification, the
study site could be belonged to the ecosystem-driven permafrost, which forms in the
discontinuous permafrost zone in poorly drained, low-lying and north-facing landscape
conditions, and under strong ecosystem influence. Their study also confirmed that climate alone
is insufficient to cause permafrost formation in the discontinuous permafrost zone.
As the study sites located within the small basin, we can assume that general climate
conditions over the sites are similar and it can be neglected in the current study. The results of
this thesis reveal that three major factors influencing in differences of ground thermal regimes
between permafrost and seasonally frozen ground within the mosaic are topography, vegetation
and soil moisture. Firstly, the heterogeneity of topography plays a major role in modifying solar
radiation regime near the ground surface, although it depended on the seasons. The absolute
differences in average PSR between north-facing and south-facing were small during the summer,
probably indicating that the available heat storage could be similar. This implies that the ground
surface temperatures on the both slopes might be similar during summer. This agrees well with
other field study (Jorgenson et al., 2010), and they found south-north slopes had minor effects on

74
ground temperatures throughout the summer, but elevation had a large effect on ground
temperatures when compared within the similar vegetation structures. In contrast, topography
strongly affected the PSR over the study area in winter, and it can alter the soil thermal regimes
as described the following dominant phenomena. In the mosaic, north-facing slopes receive
small amounts of solar radiation compared with adjacent south-facing slopes. Consequently,
north-facing slopes typically have a thick snow cover, which has more thermal insulating effect
than south-facing slopes. Thus, it limits heat transform from the ground surface to the
atmosphere, resulting in higher ground surface temperature on the north-facing slopes than that
on the south-facing slopes. However, this situation would be opposite at the end of winter.
Because the duration of snow cover was longer on north-facing slopes, and thus the ground
surface temperature is generally lower on the north-facing slopes than that on the south-facing
slope.
As clarified in chapter 4, variations vegetation covers have a strong effect on the ground
thermal regime in the forest-steppe mosaic. Studies have described that the vegetation cover
changes are attributed to the variations of the surface energy balance (Yoshikawa et al., 2003;
Zhang et al., 2005; Genxu et al., 2012). In the study site, although PSR above the slopes were
nearly identical during the summer, the difference in observed solar radiation on the ground
surface between the sites was a large, mostly due to forest cover. These differences result in
differences in energy transmission and its amount, and thus soil temperatures at each site,
especially during the summer. For example, forested area resulted in cool ground surface during
summer, while adjacent steppe resulted in warm ground surface, and the ground heat flux at the
former was several-times greater than at the latter. In winter, the forest on the north-facing slope
reduces wind and solar radiation reaching on the forest floor that increases the snow

75
accumulation (Jean and Payette, 2014). As a result, the surface temperature was higher on the
forested north-facing slope than that on the south-facing slope. Changes in vegetation cover
directly alter the surface organic material distribution (Genxu et al., 2012). According to the field
study of Ishikawa et al. (2005), the thick organic layer within the mosaic was only found in
forested areas but not in steppe. Therefore, the thick organic layer cause cold ground and leads to
lower mean annual temperature in the substrate throughout year, due to the seasonal variations in
the thermal conductivity of soil organic (William and Smith, 1989).
Another factor that may influence the ground thermal regime over the forest-steppe mosaic
is soil moisture content. The soil moisture observation and computed thermal conductivity of
soils on both slopes indicated (Chapter 4), that the seasonal variations in soil moisture within the
active layer at the north-facing slope was a large, while there were minor seasonal variations in
soil moisture contents within the seasonally frozen ground at the south-facing slope. These
situations affect the freezing and thawing of soils at both slopes, and it could be confirmed by the
thermal conductivity of soils as shown in chapter 4. Moreover, as soil moisture was less at the
steppe slope, more ground heat can be used to a rapid increase and decrease of soil temperatures,
which strongly contributed to quick refreezing and thawing of seasonally frozen ground. On the
other hand, high soil moisture contents at the forested north-facing slope, indicating that the most
of ground heat is possible to use for phase change of soil water. For example, Iwahana et al.
(2005) and Boike et al. (1998) found that a large portion (70-100%) of ground heat was
transferred into the soil latent heat during the soil thawing period in boreal forest and tundra of
Siberia. This phenomenon may reduce effect on the energy available for soil heating,
contributing in lower substrate temperature during the thawing seasons on the forested north-
facing slope. Furthermore, it is likely that there could be a considerably higher ice content within

76
the upper ground layer on the forested slope during the winter, as the soil moisture values were
higher in this area during autumn. The higher ice content within the upper ground layer at
forested slope can contribute to the higher values of thermal conductivity of soil and it leads to
the rapid temperature drop in soil, which also help maintain permafrost in this area.
Permafrost and biomes are sensitive to climate change, and the modeling results showed
that both components are predicted to disturbance in the future (Yoshikawa et al., 2003;
Vygodskaya et al., 2007; McGuire et al., 2009; Wu and Zhang, 2010). These changes will
influence surface and subsurface physical, thermal and hydraulic properties, which are often
currently assumed to remain unchanged in most land and permafrost models (Genxu et al., 2012).
Therefore, the finding of this study may contribute to understanding interactions between ground
thermal regimes, vegetation, and the atmospheric conditions in different areas, namely the boreal
forest and steppe. If these interactions are well known, the prediction of permafrost models could
be refined. Currently, the boreal forest is one of the widespread biomes in the permafrost regions
of the northern hemisphere, while the steppe will occupy in the most of current boreal forest
areas of the northern hemisphere by the end of this century (Vygodskaya et al., 2007).

77
Chapter 6.
6-1. General conclusions
This thesis examined the interplay between the site-specific factors, atmospheric
parameters and ground thermal regimes, using hydro-meteorological records obtained from
permafrost underlying forested slopes and its adjacent permafrost-free ground underlying steppe
slopes within the forest-steppe mosaic. The mosaic represents the major landscape type in
northern central Mongolia, and located in both natural and permafrost transitional zones. These
remarkably contrary environments strongly showed variable ground thermal regimes at both of
the two landscape types despite their adjacent locations, mostly due to their distinct site-specific
factors. The current permafrost occurrence beneath the forested slope is maintained by the
combined effects of the forest cover and thick organic layer. On the other hand, more solar
radiation on the dry ground and the earlier melting of snow cover cause more energy available
for soil warming, which result in only seasonally frozen ground at the steppe. The mean
outcomes of the two main objectives of this thesis are as follows:
1. During the winter, the topography effect on solar radiation seems to be very important
for north-facing slopes, as it strongly reduces solar radiation compared with south-
facing slopes. Inversely, the topography effect on solar radiation at each slope is less,
and the difference in potential solar radiation among the site is practically identical
during the summer. The results show that the considerable differences in observed
solar radiation at the ground surface between the sites were caused mostly by forest
cover, rather than the topography effect during the summer. Of the amount of solar
radiation above the forest canopy, 33 – 86 percent is prevented from passing the forest

78
canopy, and only the remnants reach the forest floor throughout the year. The
partitioning of latent heat, sensible heat and ground heat during the summer at each
site is strongly related to the structure of net radiation, which is strongly controlled by
the solar radiation. Therefore, the small amount of solar radiation reduced by forest
cover and slope on the north-facing slopes has potential to reduce heat exchange
between atmosphere and permafrost, and may provide favorable conditions for
permafrost occurrence in the forest-steppe mosaic.
2. In summer, the surface temperature exceeded the air temperature, probably because of
a large amount of solar radiation on the dry south-facing slope, which resulted in rapid
thawing of seasonally frozen ground and a warm soil profile. Inversely, forest cover
canopy on the north-facing slope significantly reduced air temperature and solar
radiation to the ground, thus the air temperature was higher than the surface
temperature. Moreover, a thick soil organic layer strongly limited heat transfer to the
ground deep.
In winter, the surface temperature was warmer at the forested slopes than at the steppe
slopes owing to greater accumulated snow cover. However, the thick organic layer
beneath the snow cover enhanced the freezing rate, especially at the forested slope.
The snow cover duration and snow thickness at the steppe had a considerable
influence on the development of seasonally frozen ground.
Overall, the study shows the importance of forest cover and organic layer in keeping the
ground cool and retaining the existence of permafrost in this region. Even a small patch of forest
has a significant thermal insulation effect on the ground thermal regimes compared with an
adjacent steppe. The future climate scenario around Mongolia projected that a recession of forest

79
cover is observed due to increasing drought (IPCC, 2013), have the potential to suppress the
current existence of permafrost. Therefore, it is important to preserve the vegetation cover,
particularly forest cover and organic layer in Mongolia, in order to protect further degradation of
permafrost and ecosystems under the influence of climate warming. This study may help us in
understanding the physical interactions between ground temperatures and vegetation covers in
the edge of Siberian discontinuous permafrost and can roughly represent the vast land areas in
northern central Mongolia because the sites were properly representative of the forest and steppe
zones in Mongolia.

80
References
Batima P, Dagvadorj D. 2000. Climate change and its impacts in Mongolia. Ulaanbaatar.
Batima p, Natagdorj L, Gomboluudev P, Erdenetsetseg B. 2005. Observed climate change in
Mongolia assessments of impacts and adaptations to climate change (AIACC) working
papers, Nairobi.
Brown J, Ferrians OJ Jr, Heginbottom JA, Melnikov ES. 1997. Circum-Arctic Map of
Permafrost and Ground-Ice Conditions. U.S. Geological Survey, Map CP-45, U. S.
Department of the Interior.
Boike J, Roth K, Overduin PP. 1998. Thermal and hydrologic dynamics of the active layer at a
continuous permafrost site (Taymyr Peninsula, Siberia), Water Resour. Res. 34: 355–363.
Brown J, Hinkel KM, Nelson FE. 2000. The Circumpolar Active Layer Monitoring (CALM)
Program: Research designs and initial results. Polar Geography 24(3): 165–258.
Chasnmer L, Quinton W, Hopskin C, Petrone R, Whittington P. 2011. Vegetation canopy and
radiation controls on permafrost plateau evolution within the discontinuous permafrost zone,
Northwest Territories Canada. Permafrost and Periglacial Processes 22: 199-213, DOI:
10.1002/ppp724.
Dorjsuren B, Bujinlkham B, Minjin Ch, Tsukada K. 2006. Geological setting of the Ulaanbaatar
terrane in Khangai-Khentii zone of the Devonian accretionary comples, central Asian
orogenic belt, http://www.pdfio.net/k-211121.html.
Dulamsuren C, Hauck M, Leuschner HH, Leuschner C. 2011. Climate response of tree-ring with
in Larinx Sibirica growing in the drought-stressed forest-steppe ecotone of northern
Mongolia. Annals of Forest Science 68: 275-282. DOI:10.1007/s13595-011-0043-9.
Dubayah R. 1994. A solar radiation topoclimatology for the Rio Grande River Basin. Journal of
Vegetation Science 5, 627-640.
81
Dubayah R, Rich PM. 1995. Topographic solar radiation models for GIS. International Journal
of Geographic Information Systems 9: 405/413.
Etzelmüller B, Heggem ESF, Sharkhuu N, Frauenfelder R, Kääb A, Goulden, C. 2006. Mountain
permafrost distribution modeling using a multi-criteria approach in the Huvsgol Area,
Northern Mongolia. Permafrost and Periglacial Processes 17: 91-104, DOI: 10.1002/ppp554.
Eugster W, Rouse RW, Pielke Sr RA, McFadden JP, Baldocchi, DD, Kittel, TGF., ChapinIII FS,
Liston GE, Vidale PL, Vaganov E, Chambers S. 2000. Land–atmosphere energy exchange in
Arctic tundra and boreal forest: available data and feedbacks to climate. Global Change
Biology 6: 84–115. DOI: 10.1046/j.1365-2486.2000.06015.x.
ESRI. 2011. Area Solar Radiation (Spatial Analyst). Retrieved from
http://help.arcgis.com/en/arcgisdesktop/10.0/help.000.htm.
Farouki OT. 1981. Thermal properties of soils. CRREL Monograph: New Hampshire.
Frauenfeld OW, Zhang T, Barry RG, Gilichinsky D. 2004. Interdecadal changes in seasonal
freeze and thaw depths in Russia. Journal of Geophysical Research 109: D05101.
DOI:10.1029/2003JD004245.
Frauenfeld OW, Zhang T. 2011. An observational 71-year history of seasonally frozen ground
changes in the Eurasian high latitudes. Environmental Research Letters 6.
DOI:10.1088/1748-9326/6/4/044024.
Fukui K, Sone T, Yamagata K, Otsuki Y, Sawada Y, Vetrova V, Vyatkina M. 2008.
Relationships between permafrost distribution and surface organic layers near Esso, central
Kamchatka, Russian Far East. Permafrost and Periglacial Processes 19: 85–92. DOI:
10.1002/ppp.606.
Genxu W, Guangsheng L, Chunjie L, Yan Y. 2012. The variability of soil thermal and
hydrological dynamics with vegetation cover in a permafrost region. Agricultural and Forest
Metrology 162: 44-57.

82
Gravis GF, Zabolotnik SI, Lisun AM, Sukhodrovskiy VL. 1978. “Geocryological map of
Mongolia”. 8 thematic maps, (scale 1:1500000).
Harris SA, French HM, Heginbottom AJ, Johnston GH, Ladanyi B, Sego DC, van Everdingen
RO. 1988. Glossary of permafrost and related ground ice terms, Tech. Memo., 142, Natl. Res.
Counc.of Can.,Ottawa.
Hatzianastassiou N, Matsoukas C, Fotiadi A, Pavlakis KG, Drakakis E, Hatzidimitriou D,
Vardavas I. 2005. Global distribution of Earth‟s surface shortwave radiation budget. Atmos.
Chem. Phys 5: 2847–2867.
Heggem ESF, Etzelmüller B, Anarmaa S, Sharkhuu N, Goulden CE, Nadintsetseg B. 2006.
Spatial distribution of ground surface temperatures and active layer depths in the Hovsgol
Area, Northern Mongolia. Permafrost and Periglacial Processes 17: 357-369. DOI:
10.1002/ppp568.
Hinzman LD, Kane DL, Gleck RE, Everett KR. 1991. Hydrological and thermal properties of the
active layer in the Alaskan Arctic. Cold Region Science and Technology 19: 95–110.
Hinkel KM, Paetzold R, Nelson FE, Bockheim JG. 2001. Patterns of soil temperature and moisture
in the active layer and upper permafrost at Barrow, Alaska: 1993-1999. Global and Planetary
Change 29: 293-309.
Huang S, NASA Ames Researcher Center, and Fu P, ESRI. 2009. Modeling Small Areas Is a
Big Challenge Using the solar radiation analysis tools in ArcGIS Spatial Analyst, ArcUser.
www.esri.com.
Iijima Y, Fedorov AN, Park H, Suzuki K, Yabuki H, Maximov TC, Ohata T. 2010. Abrupt
increases in soil temperatures following increased precipitation in a permafrost region,
central Lena river basin, Russia. Permafrost Periglacial Processes 21: 30–41.
DOI:10.1002/ppp.662.
Iijima Y, Ishikawa M, Jambaljav Ya. 2012. Hydrological cycle in relation to permafrost
environment in forest-grassland ecotone in Mongolia. Journal of Japanese Association of
Hydrological Sciences 42: 119-130, (in Japanese with English abstract).

83
Ishikawa M, Sharkhuu N, Zhang Y, Kadota T, Ohata T. 2005. Ground thermal and moisture
conditions at the southern boundary of discontinuous permafrost, Mongolia. Permafrost and
Periglacial Processes 16: 209-216. DOI:10.1002/ppp483.
Ishikawa M, Zhang Y, Kadota T, Ohata T. 2006. Hydrothermal regimes of the dry active layer.
Water Resources Research 42(4). W04401. DOI:10.1029/2005WR004200.
Ishikawa M, Iijima Y, Zhang Y, Kadota T, Yabuki H, Ohata T, Battogtokh D, Sharkhuu N. 2008.
Comparable energy balance measurements on the permafrost and immediate adjacent
permafrost-free slopes at the southern boundary of Eurasian Permafrost, Mongolia. In
Permafrost, Proceeding of the Ninth International Conference on Permafrost, University of
Alaska Fairbanks, 29 June-3 July 2008, Kane DL, Hinkel KM (eds). Institute of Northern
Engineering, University of Alaska: Fairbanks; 1: 795-800.
Ishikawa M, Sharkhuu N, Jambaljav Y, Davaa D, Yoshikawa K, Ohata T. 2012. Thermal state of
Mongolian permafrost. In Proceedings of the Tenth International Conference on Permafrost,
25–29 June Salekhard, Yamal-Nenets Autonomous District, Russia, Hinkel KM, (eds) 1:
173-178.
IPCC. 2013. Climate Change 2013: The Physical Science Basis. Working Group I Contribution
to the Fifth Assessment Report of the intergovernmental Panel on Climate Change.
Cambridge University Press, New York, NY 10013-2473, USA.
Iwahana G, Machimura T, Kobayashi Y, Fedorov AN, Konstantinov PY, Fukuda, M. 2005.
Influence of forest clear‐cutting on the thermal and hydrological regime of the active layer
near Yakutsk, eastern Siberia. Journal of Geophysical Research 110. doi:
10.1029/2005JG000039. issn: 0148-0227.
Jambaljav Ya, Dashtseren A. 2007. “Permafrost distribution map of Areas Surrounding
Ulaanbaatar city” (scale 1:100000).
Jean M, Payette S. 2014. Effect of Vegetation Cover on the Ground Thermal Regime of Wooded
and Non-Wooded Palsas. Permafrost and Periglacial Processes 25: 281-294. DOI:
10.1002/ppp.1817.

84
Jorgenson, M. T, V. E. Romanovsky, J. Harden, Y. L. Shur, J. O‟Donnell, T. Schuur, and M.
Kanevskiy. 2010. Resilience and vulnerability of permafrost to climate change. Canadian
Journal of Forest Research 40: 1219-1236.
Li SG, Werner E, Asanuma, J, Kotani A, Davaa G, Dambaravjaa O, Michiaki S. 2006. Energy
partitioning and its biophysical controls above a grazing steppe in central Mongolia.
Agricultural Forest Meteorology 137:89-106.
Liu S, Li SG, Yu CR, Asanuma J, Sugita M, Zhang LM, HU ZM, Wei YF. 2010. Seasonal and
interannual variations in water vapor exchange and surface water balance over a grazed
steppe in central Mongolia. Agricultural Water Management 97: 857-864.
MARCC 2009. 2010. Mongolia: Assessment Report on Climate Change 2009, Ulaanbaatar,
Mongolia.
Miyazaki S, Ishikawa M, Baatarbileg N, Damdinsuren S, Ariuntuya N, Jambaljav Ya. 2014.
Interannual and seasonal variations in energy and carbon exchanges over the larch forests on
the permafrost in northeastern Mongolia. Polar Science (2014),
http://dx.doi.org/10.1016/j.polar.2013.12.004.
McGuire AD, Anderson LG, Christensen TR, Dallimore S, Gou L, Hayes AJ, Hiemann M,
Lorenson TD, Macdonald RW, Roulet N. 2009. Sensitivity of the carbon cycle in the Arctic
to climate change. Ecological Monographs, 79(4): 523–55.
Ohmura, A. 1982. Climate and energy balance on the Arctic tundra. J. Climatol 2: 65–84.
Ohta T, Hiyma T, Tanaka H, Kuwada T, Maximov C, Ohata T, Fukushima Y. 2001. Seasonal
variation in the energy and water exchanges above and below a larch forest in eastern Siberia.
Hydrological Processes 15: 1459-1476. DOI: 10.1002/hyp.219.
Outcalt SI, Nelson FE, Hinkel KM. 1990. The zero curtain effect: Heat and mass transfer across
an isothermal region in freezing soil. Water Resources Research 26(7), 1509-1516.
DOI:10.1029/WR026i007p01509.

85
Sato T, Kimura F, Hasegawa AS. 2007. Vegetation and topographic control of cloud activity
over arid/semiarid Asia, J. Geophys. Res., 112, D24109, DOI:10.1029/2006JD008129.
Sharkhuu A, Sharkhuu N, Etzelmüller B, Heggem ESF, Nelson FE, Shiklomanov NI, Goulden
CE, Brown J. 2007. Permafrost monitoring in the Hovsgol mountain region, Mongolia.
Journal of Geophysical Research 112. F02S06. DOI: 10.1029/2006JF000543.
Shiklomanov NI, Streletskiy DA, Nelson FE, Hollister RD, Romanovsky VE, Tweedie CE,
Bockheim JG, Brown J. 2010. Decadal variations of active-layer thickness in moisture-
controlled landscapes, Barrow, Alaska. Journal of Geophysical Research - Biogeosciences.
115. G00I04. DOI: 10.1029/2009JG001248.
Sugita M, Asanuma J, Tsujimura M, Mariko S, Lu M, Kimura F, Azzaya D, Adyasuren T. 2007.
An overview of the rangelands atmosphere-hydroshere-biosphere interation study experiment
in northeastern Asia (RAISE). Journal of Hydrology. 333: 3-20.
DOI:10.1016/j.jhydrol.2006.07.032.
Shur YL, Jorgenson MT. 2007. Patterns of permafrost formation and degradation in relation to
climate and ecosystems. Permafrost Periglacial Process. 18: 7-19. DOI:lO.l002ppp.
Smith VN, Saatchi SS, Randerson TJ. 2004. Trends in high northern latitude soil freeze and thaw
cycles from 1988 to 2000. Journal of Geophysical Research – Atmospheres 109. D12101.
DOI: 10.1029/2003DJ004472.
Tachikawa T, Kaku M, Iwasaki A, Gesch D, Oimoen M, Zhang Z, Danielson J, Krieger T, Curtis
B, Haase J, Abrams M, Crippen R, Carabajal C. 2011. ASTER Global Digital Elevation
Model Version 2 – Summary of Validation Results by the ASTER GDEM Validation Team,
August 31, 2011, http://www.jspacesystems.or.jp/ersdac/GDEM/E/1.html.
Tovar-Pescador J, Pozo-Vázquez D, Ruiz-Arias JA, Batlles J, López G, Bosh JL. 2006. On the
use of the digital elevation model to estimate the solar radiation in areas of complex
topography. Meteorological Applications 13: 279-287. DOI:10.1017/S1350482706002258.
Tsogtbaatar J. 2004. Deforestation and reforestations needs in Mongolia. Forest Ecology and
Management 201(1): 57-63.

86
van Everdingen RO. (ed.). 1998. Multi-language glossary of permafrost and related ground-ice
terms. National Snow and Ice Data Center/World Data Center for Glaciology: Boulder,
Colorado.
Vygodskaya NN, Groisman PA, Tchebakova MN, Kurbatova JA, Panfyorov O, Parfenova EI,
Sogachev AF. 2007. Ecosystems and climate interactions in the boreal zone of northern
Eurasia. Environ. Res. Lett.2. DOI:10.1088/1748-9326/2/4/045033.
Walker DA, Jia GJ, Epstein HE, Raynolds MK, Chapin IIIFS, Copass C, Hinzman LD, Knudson
JA, Maier HA, Michaelson GJ, Nelson F, Ping CL, Romanovsky VE, Shiklomanov N. 2003.
Vegetation-soil-thaw-depth relationships along a Low-Artic bio-climate gradient, Alaska:
Synthesis of information from the ATLAS studies. Permafrost and Periglacial Processes
14(2): 103-123. DOI:10.1002/ppp.452.
Williams P, Smith M. 1989. The frozen earth: Fundamentals of geocryology. Cambridge
University Press.
Wu Q, Zhang T. 2010. Changes in active layer thickness over the Qinghai-Tibetan Plateau from
1995 to 2007 Journal of Geophysical Research – Atmospheres 115. D09107.
DOI:10.29/2009JD012974.
Wu T, Zhao L, Li R, Xie Ch, Pang Q, Wang Q, Batkhishig O, Battogtokh B. 2012. Permafrost
degradation under abrupt warming in the Central Mongolia Plateau. In Proceedings of the
Tenth International Conference on Permafrost, 25–29 June Salekhard, Yamal-Nenets
Autonomous District, Russia, Drozdov DS (eds) 4: 589-590.
Yamanaka T, Kihotsu I, Oyunbaatar D.2007. Summertime soil hydrological cycle and surface
energy balance on the Mongolian steppe. Journal of Arid Environments. 6: 65-79.
Yoshikawa K, Bolton WR, Romanovsky VE, Fukuda M, Hinzman LD. 2003. Impacts of wildfire
on the permafrost in the boreal forests of Interior Alaska. Journal of Geophysical Research,
108: D1 8148, DOI: 10.1029/2001JD000438.
Zhang T, Heginbottom JA, Barry RG, Brown J. (2000), Further statistics on the distribution of
permafrost and ground-ice in the Northern Hemisphere, Polar Geogr 24 (2), 126–131.

87
Zhang T, Barry RG, Knowles K, Ling F, Armstrong RL. 2003. Distribution of seasonally and
perennially frozen ground in the Northern Hemisphere. In Permafrost, Proceedings of the
Eight International Conference on Permafrost, 21–25 July 2003, Zurich, Switzerland, Phillips
M, Springman SM, Arenson LU (eds). 1: 1289–1294.
Zhang T, Frauenfeld OW, Serreze MC, Etringer A, Oelke C, McCreight J, Barry RG,
Gilichinsky D, Yang D, Ye H, Ling F, Chudinova S. 2005a. Spatial and temporal variability
in active layer thickness over the Russian Arctic drainage basin. Journal of Geophysical
Research – Atmospheres 110. D16101. DOI:10.1029/2004JD005642.
Zhang T. 2005b. Influence of the seasonal snow cover on the ground thermal regime: an
overview, Reviews of Geophysics 43. RG4002. DOI:10.1029/2004RG000157.
Zhao L, Wu Q, Marchenko SS, Sharkhuu N. 2010. Thermal state of permafrost and active layer
in central Asia during the international polar year. Permafrost and Periglacial Processes 21:
198-207. DOI:10.1002/ppp688.