Embed Size (px)
Citation preview
Research ArticleStudy on Ultrasonic Response to Mechanical Structure of Coalunder Loading and Unloading Condition
Xiaofei Liu,1,2 Xiaoran Wang,1,2 Enyuan Wang,1,2 Zhentang Liu,2 and Xiaoyang Xu2
1Key Laboratory of Coal Mine Gas and Fire Prevention and Control of the Ministry of Education, China University of Mining andTechnology, Xuzhou, Jiangsu 221116, China2School of Safety Engineering, China University of Mining and Technology, Xuzhou, Jiangsu 221116, China
Correspondence should be addressed to Enyuan Wang; [email protected]
Received 25 June 2016; Revised 14 October 2016; Accepted 31 October 2016; Published 9 January 2017
Academic Editor: Vadim V. Silberschmidt
Copyright © 2017 Xiaofei Liu et al. This is an open access article distributed under the Creative Commons Attribution License,which permits unrestricted use, distribution, and reproduction in any medium, provided the original work is properly cited.
Ultrasonic technology can be applied to study the changes in the internal defects of coal under quantitative loading, which canprovide the theoretical basis for applying the technology to determine the structural stability of coal and predict disasters related tothe dynamics of coal or rock. In this paper, to investigate the propagation laws of ultrasonic signals through a coal material undervarious loading conditions, an ultrasonic test system for the deformation and fracture of coal rock was used and a cyclic loading andunloading pattern is adopted. In addition, changes in ultrasonic parameters such as amplitude, dominant frequency, and velocitywere analyzed. At the initial loading stage, the ultrasonic amplitude, amplitude of the dominant frequency, andwave velocity slightlydecrease as the loading process progresses, and these three ultrasonic parameters gradually increase to theirmaximawhen the stresslevel reaches approximately 46%. When it progresses from the linear elastic stage to the elastic plastic stage, the material inside thecoal distorts and fractures more drastically, the inner defects are fully developed, and the acoustic parameters decrease significantly.Therefore, the corresponding measures should be adapted to reduce the loading stress before the coal is loaded to its critical stresslevel.
1. Introduction
Coal, an anisotropic compound consisting of various naturalminerals, is formed naturally in geologic conditions. Theinner structure of coal is damaged to various extents andhas different forms. When load pressure is applied, differentdefects arise, causing changes in the structural pattern ofcoal [1, 2]. Thus, it is necessary to analyze the changes in theinternal structure of coal under load pressure using a specifictechnical measure [3–6].
In the past few years, various laboratory techniques [7–12] such as scanning electronmicroscopy (SEM) [7], infraredthermal imaging [8], computerized tomography (CT) [9,10], and acoustic emission (AE) [11, 12] have been used toobserve the damage process of coal or rock materials underload pressure. However, the application of these techniquesto practical situations is difficult owing to rigorous testconditions, expensive infrastructure, and facilities. Besides,the location accuracy of the AE source was not high because
of the effect of AE sensor array [13], P-wave velocity [14],and other factors. As a nondestructive, rapid, and simpledetection method, ultrasonic testing is increasingly usedin laboratory and field tests [15, 16]. Lokajıcek and Svitekdesigned and constructed a new high-pressure measuringhead to test longitudinal and transversal ultrasonic soundingof spherical rock samples in 132 independent directionsunder confining pressure between 0.1MPa and 60MPa andstudied the elastic anisotropy of loaded rocks [17]. Usingultrasonic P-wave reflection imaging technology, Coe andBrandenberg clearly observed the geometric features of theinternal structure of rock-soil samples. They determinedthat the higher the frequency of the transducer, the clearerthe observed result of the internal structure [18]. Peyraset al. used the amplitude of acoustic waves to determineand characterize the discontinuity openings of metamorphicrock mass [19]. In the process of loading, the internal strainof rock or coal samples will exhibit relaxation properties,and the ultrasonic velocity variation can be seen as an
HindawiShock and VibrationVolume 2017, Article ID 7643451, 12 pageshttps://doi.org/10.1155/2017/7643451
2 Shock and Vibration
1
2
3
4
5
6 7
8
9
10
AMP
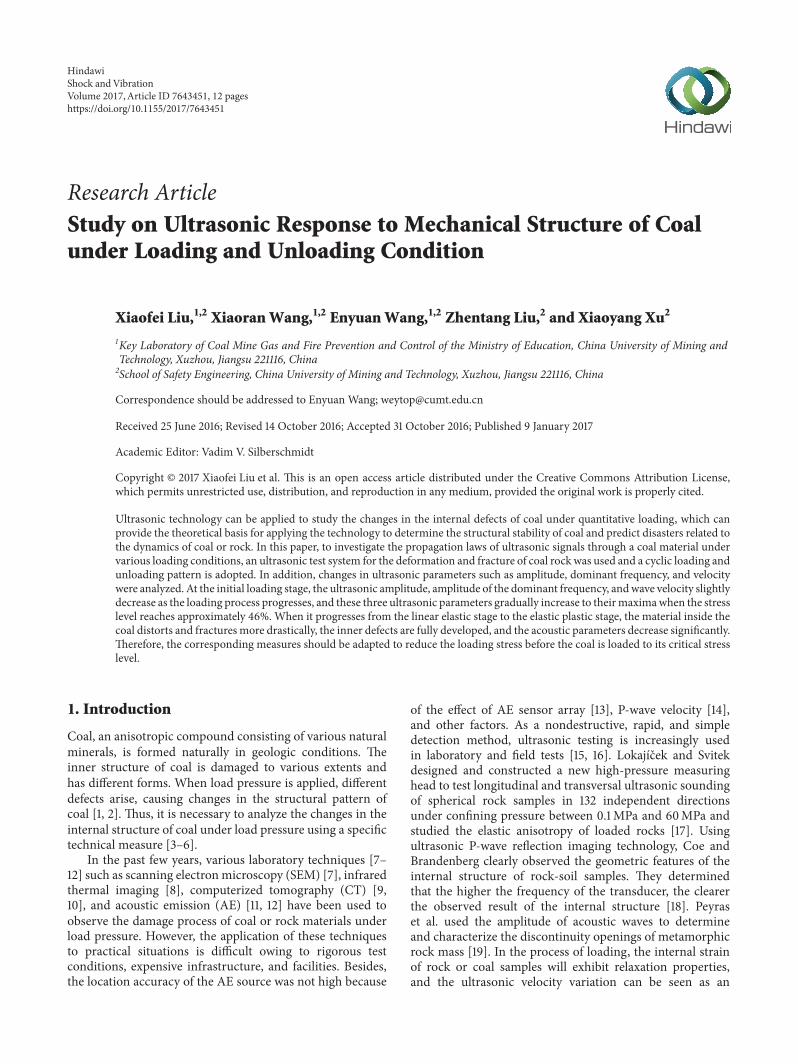
Figure 1: Schematic diagram for ultrasonic testing of coal samples. 1: compression testing machine, 2: support block, 3: sample, 4: ultrasonictransducer, 5: shielding system, 6: AE receiving probe, 7: preamplifiers, 8: loading control system, 9: ultrasonic signals emission and acquisitionsystem, and 10: electromagnetic shielding room.
Table 1: The coal type and composition.
Coal sample Ad/% Vadf/% Mad/% St.d/% Hardness TypeSanhejian 8.78–32.41 36.43–42.69 0.60–3.89 0.39–1.02 2-3 Gas coal
indicator of rock stress relaxation [20]. Engelder and Plumb[21] studied the changing pattern of ultrasonic wave velocityunder the condition of uniaxial loading, using wave tests todescribe the relation between wave velocity and stress. Nur[22] studied and discussed the response characteristics ofultrasonic wave velocity to the loading stress level. Zheng etal. [23] established a correspondence between wave velocityand rock damage variable during uniaxial compression.
Ultrasonic wave attenuation occurs during the processof ultrasonic wave transmission in media; the attenuation isthe loss of ultrasonic vibrational energy [24]. Xi et al. [25]determined the relations between the attenuation of the phasevelocity of elastic waves and many parameters such as elasticconstant of the solid phase, porosity, permeability, saturation,flow viscosity, compressibility, and frequency. Dvorkin andNur [26] derived the theoretical formulas for P-wave velocityand attenuation of sandstone samples under different pres-sure, and he carried out experiments to verify theoreticalformulas. Diallo et al. [27] used the ultrasonic of a certainfrequency to study the P-wave, S-wave, and the attenuationcharacteristics of sandstone and limestone samples, and heobtained the ultrasonic attenuation absorptionmechanism ofrock.
Research in this filed has included theoretical analyses,experimental studies, numerical simulations, and so forth,on the propagation/attenuation of elastic waves in differentmedia. However, overall, they have the following short-comings: (1) the attenuation of an elastic wave is closelycorrelated with the propagation media. Whereas studies onthe ultrasonic wave propagation patterns and characteristicsin anisotropic media such as coal are relatively rare, thereis a need to carry out more studies in this regard. (2) Atpresent, studies tend to analyze only the velocity of ultrasonicwaves to evaluate material defects. However, there is a lack ofstudies on sound parameters (e.g., amplitude and dominant
frequency), which are very sensitive to the level of defect.So, in the paper, we evaluated the propagation of ultrasonicwaves in coal under load pressure and collected various soundparameters of ultrasonic waves and analyzed the associationbetween ultrasonic wave propagation and stress strain of coal;in addition, the relation between themechanical properties ofcoal or rocks and their inner cracks was analyzed. Ultrasonicparameters can precisely reflect the inner changes in coalstructure, which can serve as a theoretical basis for usingultrasonic waves to predict the dynamic hazards of coal orrocks.
2. Experimental System of Ultrasonic Testing
2.1. Experimental System and Samples. The experimental sys-tem consists of the loading system (servocontrolled mechan-ical test equipment YAW4306), ultrasonic wave signals emis-sion (ARB-1410 cards), and acquisition system (the PCI-2 AEand ultrasonic data-acquisition systems). A schematic of theexperimental system is shown in Figure 1.
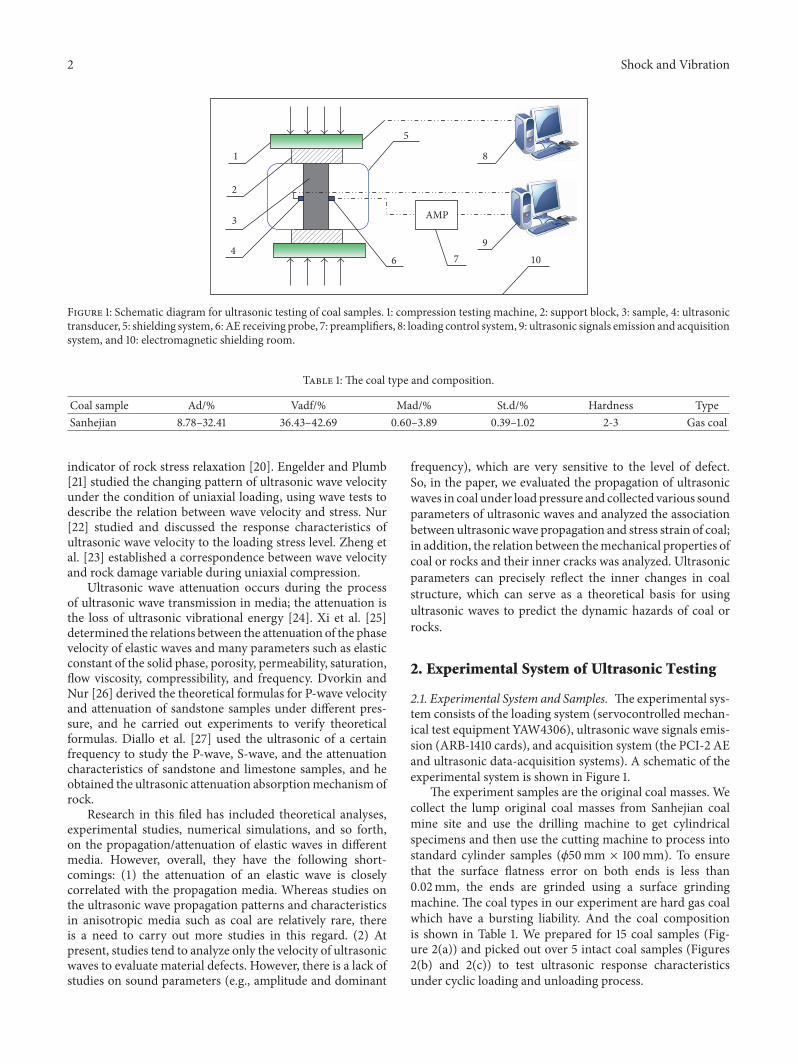
The experiment samples are the original coal masses. Wecollect the lump original coal masses from Sanhejian coalmine site and use the drilling machine to get cylindricalspecimens and then use the cutting machine to process intostandard cylinder samples (𝜙50mm × 100mm). To ensurethat the surface flatness error on both ends is less than0.02mm, the ends are grinded using a surface grindingmachine. The coal types in our experiment are hard gas coalwhich have a bursting liability. And the coal compositionis shown in Table 1. We prepared for 15 coal samples (Fig-ure 2(a)) and picked out over 5 intact coal samples (Figures2(b) and 2(c)) to test ultrasonic response characteristicsunder cyclic loading and unloading process.
Shock and Vibration 3
(a) (b) (c)
Figure 2: The physical figures of coal samples.
0 30 60 90 1200
3
6
9
12
15
Load
(kN
)
Time (s)
30
60
90
120
150
0
Load
AE counts
0 30 60 90 1200
3
6
9
12
15
Load
(kN
)
Time (s)
0
30
60
90
120
Load
AE energy
AE
coun
ts (103)
AE
ener
gy (1
03
mV·𝜇
s)
Figure 3: AE characteristics of coal samples under uniaxial compression.
2.2. Test Program. In the experiments, we mainly studiedthe relationship between the mechanical structures of thecoal samples and the ultrasonic wave parameters. When theforce acts on the coal samples during the loading process,the internal structure of coal will generate acoustic emission(AE) signals, which can seriously affect the reception ofultrasonic signals. To solve this problem, the cyclic loadingand unloading process was carried out in the experiments inorder to reduce the impact of the acoustic emission signals inthe loading process.
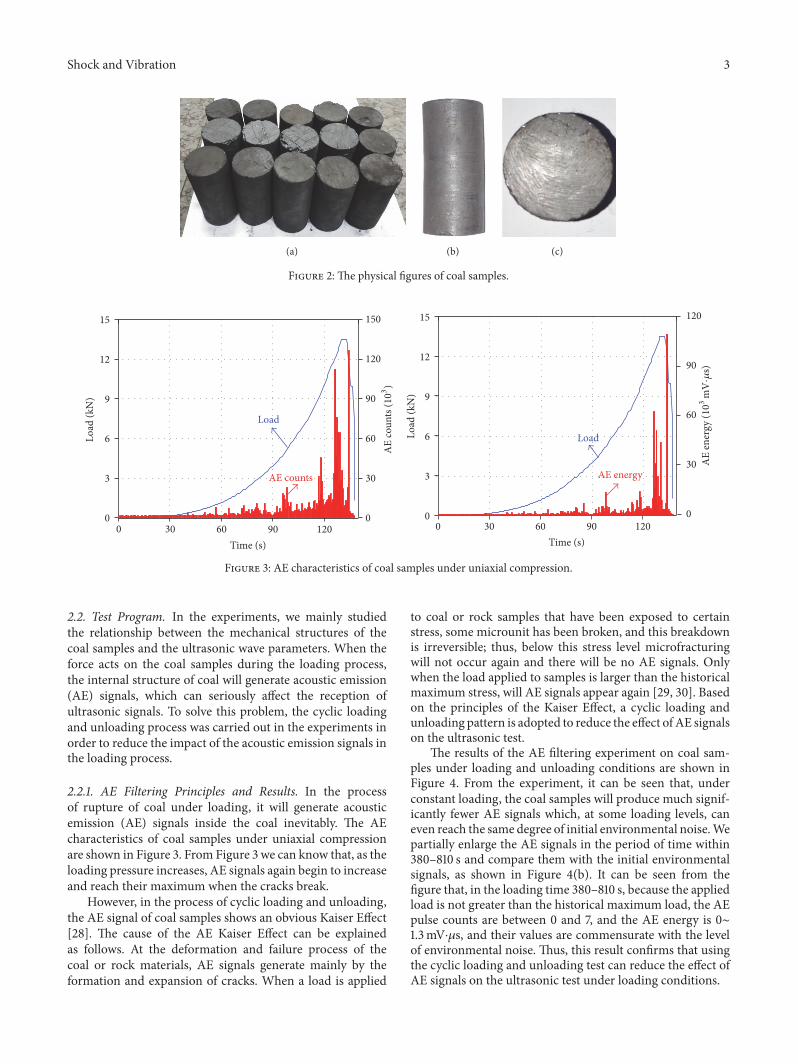
2.2.1. AE Filtering Principles and Results. In the processof rupture of coal under loading, it will generate acousticemission (AE) signals inside the coal inevitably. The AEcharacteristics of coal samples under uniaxial compressionare shown in Figure 3. From Figure 3 we can know that, as theloading pressure increases, AE signals again begin to increaseand reach their maximum when the cracks break.
However, in the process of cyclic loading and unloading,the AE signal of coal samples shows an obvious Kaiser Effect[28]. The cause of the AE Kaiser Effect can be explainedas follows. At the deformation and failure process of thecoal or rock materials, AE signals generate mainly by theformation and expansion of cracks. When a load is applied
to coal or rock samples that have been exposed to certainstress, some microunit has been broken, and this breakdownis irreversible; thus, below this stress level microfracturingwill not occur again and there will be no AE signals. Onlywhen the load applied to samples is larger than the historicalmaximum stress, will AE signals appear again [29, 30]. Basedon the principles of the Kaiser Effect, a cyclic loading andunloading pattern is adopted to reduce the effect ofAE signalson the ultrasonic test.
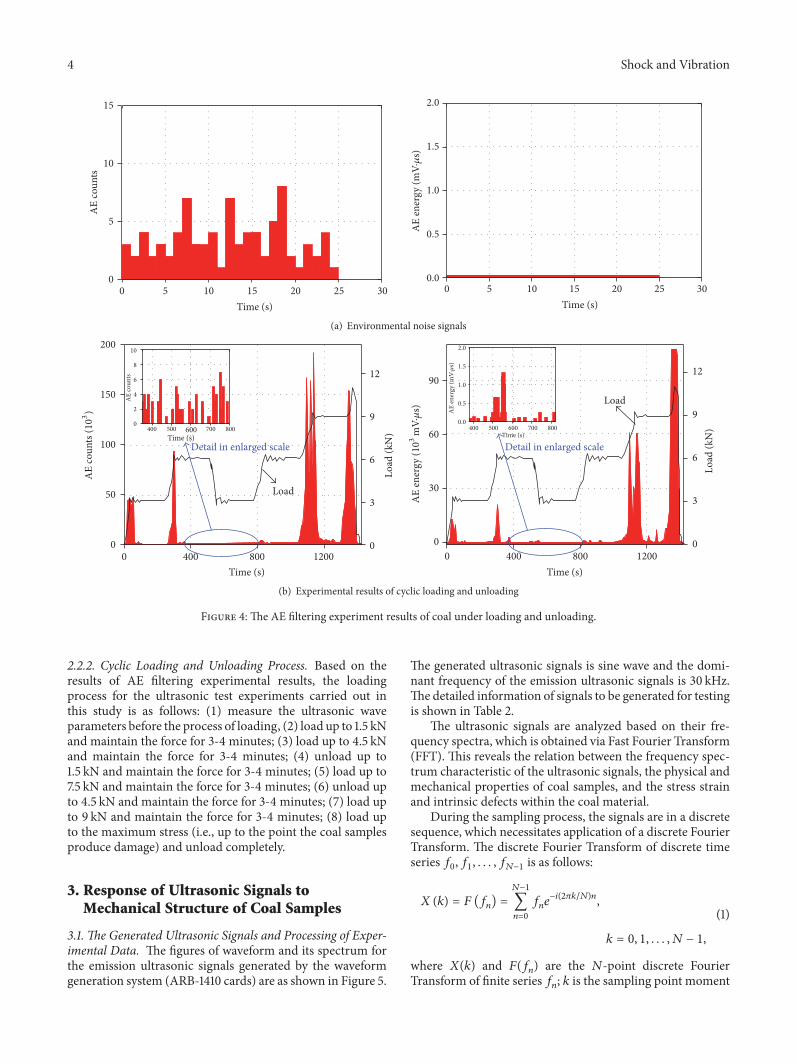
The results of the AE filtering experiment on coal sam-ples under loading and unloading conditions are shown inFigure 4. From the experiment, it can be seen that, underconstant loading, the coal samples will produce much signif-icantly fewer AE signals which, at some loading levels, caneven reach the same degree of initial environmental noise.Wepartially enlarge the AE signals in the period of time within380–810 s and compare them with the initial environmentalsignals, as shown in Figure 4(b). It can be seen from thefigure that, in the loading time 380–810 s, because the appliedload is not greater than the historical maximum load, the AEpulse counts are between 0 and 7, and the AE energy is 0∼1.3mV⋅𝜇s, and their values are commensurate with the levelof environmental noise. Thus, this result confirms that usingthe cyclic loading and unloading test can reduce the effect ofAE signals on the ultrasonic test under loading conditions.
4 Shock and Vibration
0 5 10 15 20 25 300
5
10
15A
E co
unts
Time (s)
0 5 10 15 20 25 300.0
0.5
1.0
1.5
2.0
Time (s)
AE
ener
gy (m
V·𝜇
s)
(a) Environmental noise signals
0 400 800 12000
50
100
150
200
Detail in enlarged scale
12
9
6
3
0
Load
(kN
)400 500 600 700 8000
2
4
6
8
10
Time (s)
AE
coun
ts
Time (s)
Load
0 400 800 12000
30
60
90
400 500 600 700 8000.0
0.5
1.0
1.5
2.0
Time (s)
Detail in enlarged scale
Time (s)
12
3
9
6
Load
(kN
)
0
Load
AE
ener
gy (m
V·𝜇
s)
AE
coun
ts (103)
AE
ener
gy (1
03
mV·𝜇
s)
(b) Experimental results of cyclic loading and unloading
Figure 4: The AE filtering experiment results of coal under loading and unloading.
2.2.2. Cyclic Loading and Unloading Process. Based on theresults of AE filtering experimental results, the loadingprocess for the ultrasonic test experiments carried out inthis study is as follows: (1) measure the ultrasonic waveparameters before the process of loading, (2) load up to 1.5 kNand maintain the force for 3-4 minutes; (3) load up to 4.5 kNand maintain the force for 3-4 minutes; (4) unload up to1.5 kN and maintain the force for 3-4 minutes; (5) load up to7.5 kN and maintain the force for 3-4 minutes; (6) unload upto 4.5 kN and maintain the force for 3-4 minutes; (7) load upto 9 kN and maintain the force for 3-4 minutes; (8) load upto the maximum stress (i.e., up to the point the coal samplesproduce damage) and unload completely.
3. Response of Ultrasonic Signals toMechanical Structure of Coal Samples
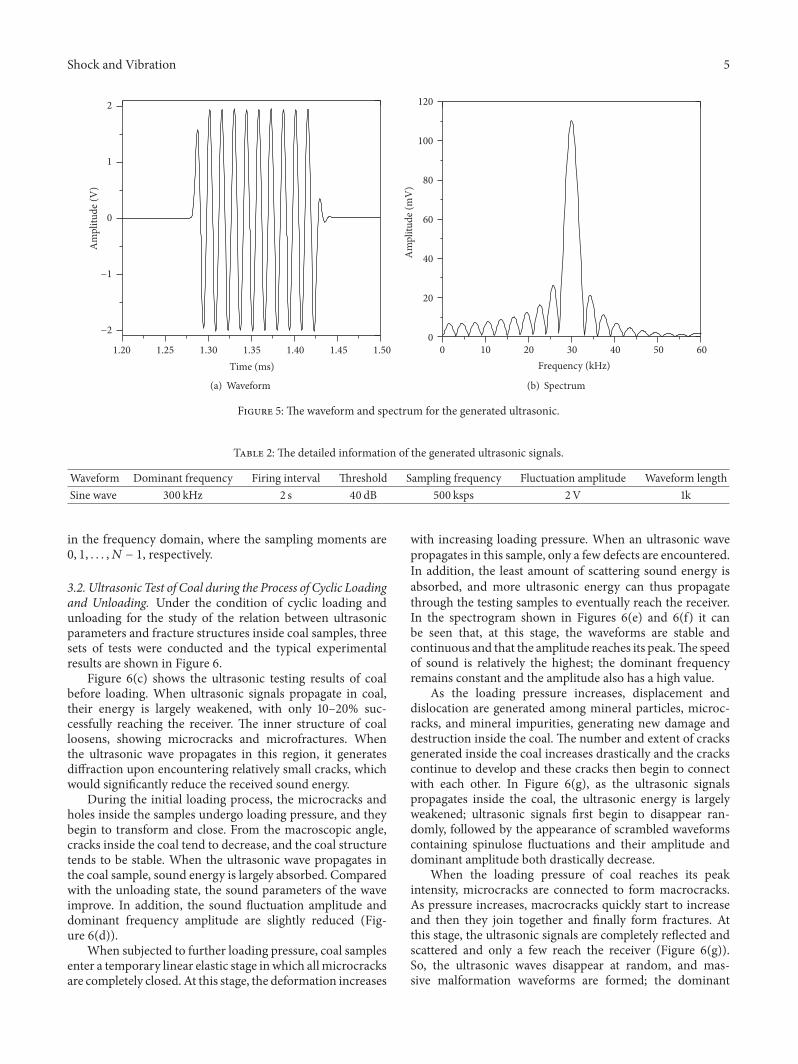
3.1. The Generated Ultrasonic Signals and Processing of Exper-imental Data. The figures of waveform and its spectrum forthe emission ultrasonic signals generated by the waveformgeneration system (ARB-1410 cards) are as shown in Figure 5.
The generated ultrasonic signals is sine wave and the domi-nant frequency of the emission ultrasonic signals is 30 kHz.The detailed information of signals to be generated for testingis shown in Table 2.
The ultrasonic signals are analyzed based on their fre-quency spectra, which is obtained via Fast Fourier Transform(FFT). This reveals the relation between the frequency spec-trum characteristic of the ultrasonic signals, the physical andmechanical properties of coal samples, and the stress strainand intrinsic defects within the coal material.
During the sampling process, the signals are in a discretesequence, which necessitates application of a discrete FourierTransform. The discrete Fourier Transform of discrete timeseries 𝑓0, 𝑓1, . . . , 𝑓𝑁−1 is as follows:
𝑋(𝑘) = 𝐹 (𝑓𝑛) =𝑁−1
∑𝑛=0
𝑓𝑛𝑒−𝑖(2𝜋𝑘/𝑁)𝑛,
𝑘 = 0, 1, . . . , 𝑁 − 1,
(1)
where 𝑋(𝑘) and 𝐹(𝑓𝑛) are the 𝑁-point discrete FourierTransform of finite series 𝑓𝑛; 𝑘 is the sampling point moment
Shock and Vibration 5
1.20 1.25 1.30 1.35 1.40 1.45 1.50
−2
−1
0
1
2A
mpl
itude
(V)
Time (ms)
(a) Waveform
0 10 20 30 40 50 600
20
40
60
80
100
120
Am
plitu
de (m
V)
Frequency (kHz)
(b) Spectrum
Figure 5: The waveform and spectrum for the generated ultrasonic.
Table 2: The detailed information of the generated ultrasonic signals.
Waveform Dominant frequency Firing interval Threshold Sampling frequency Fluctuation amplitude Waveform lengthSine wave 300 kHz 2 s 40 dB 500 ksps 2V 1k
in the frequency domain, where the sampling moments are0, 1, . . . , 𝑁 − 1, respectively.
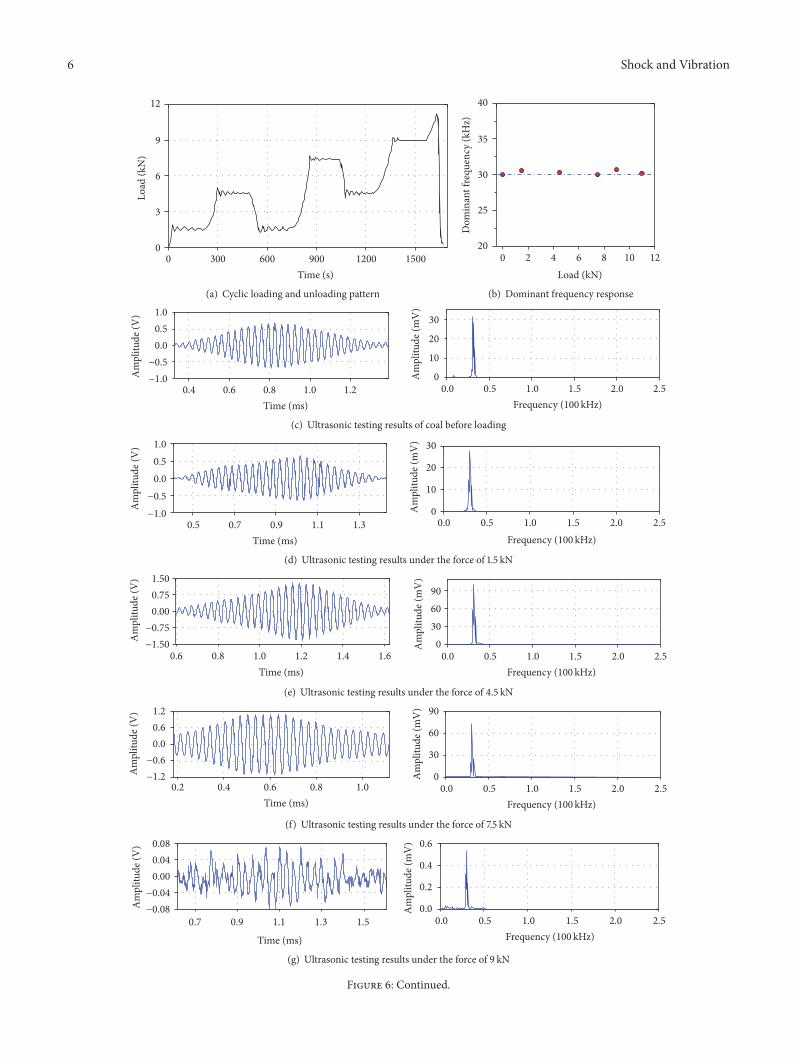
3.2. Ultrasonic Test of Coal during the Process of Cyclic Loadingand Unloading. Under the condition of cyclic loading andunloading for the study of the relation between ultrasonicparameters and fracture structures inside coal samples, threesets of tests were conducted and the typical experimentalresults are shown in Figure 6.
Figure 6(c) shows the ultrasonic testing results of coalbefore loading. When ultrasonic signals propagate in coal,their energy is largely weakened, with only 10–20% suc-cessfully reaching the receiver. The inner structure of coalloosens, showing microcracks and microfractures. Whenthe ultrasonic wave propagates in this region, it generatesdiffraction upon encountering relatively small cracks, whichwould significantly reduce the received sound energy.
During the initial loading process, the microcracks andholes inside the samples undergo loading pressure, and theybegin to transform and close. From the macroscopic angle,cracks inside the coal tend to decrease, and the coal structuretends to be stable. When the ultrasonic wave propagates inthe coal sample, sound energy is largely absorbed. Comparedwith the unloading state, the sound parameters of the waveimprove. In addition, the sound fluctuation amplitude anddominant frequency amplitude are slightly reduced (Fig-ure 6(d)).
When subjected to further loading pressure, coal samplesenter a temporary linear elastic stage inwhich allmicrocracksare completely closed. At this stage, the deformation increases
with increasing loading pressure. When an ultrasonic wavepropagates in this sample, only a few defects are encountered.In addition, the least amount of scattering sound energy isabsorbed, and more ultrasonic energy can thus propagatethrough the testing samples to eventually reach the receiver.In the spectrogram shown in Figures 6(e) and 6(f) it canbe seen that, at this stage, the waveforms are stable andcontinuous and that the amplitude reaches its peak.The speedof sound is relatively the highest; the dominant frequencyremains constant and the amplitude also has a high value.
As the loading pressure increases, displacement anddislocation are generated among mineral particles, microc-racks, and mineral impurities, generating new damage anddestruction inside the coal. The number and extent of cracksgenerated inside the coal increases drastically and the crackscontinue to develop and these cracks then begin to connectwith each other. In Figure 6(g), as the ultrasonic signalspropagates inside the coal, the ultrasonic energy is largelyweakened; ultrasonic signals first begin to disappear ran-domly, followed by the appearance of scrambled waveformscontaining spinulose fluctuations and their amplitude anddominant amplitude both drastically decrease.
When the loading pressure of coal reaches its peakintensity, microcracks are connected to form macrocracks.As pressure increases, macrocracks quickly start to increaseand then they join together and finally form fractures. Atthis stage, the ultrasonic signals are completely reflected andscattered and only a few reach the receiver (Figure 6(g)).So, the ultrasonic waves disappear at random, and mas-sive malformation waveforms are formed; the dominant
6 Shock and Vibration
0 300 600 900 1200 15000
3
6
9
12
Time (s)
Load
(kN
)
(a) Cyclic loading and unloading pattern
0 2 4 6 8 10 1220
25
30
35
40
Dom
inan
t fre
quen
cy (k
Hz)
Load (kN)
(b) Dominant frequency response
0.4 0.6 0.8 1.0 1.2−1.0−0.5
0.00.51.0
Am
plitu
de (V
)
Time (ms)0.0 0.5 1.0 1.5 2.0 2.5
0
10
20
30
Am
plitu
de (m
V)
Frequency (100 kHz)
(c) Ultrasonic testing results of coal before loading
Am
plitu
de (V
)
Am
plitu
de (m
V)
0.5 0.7 0.9 1.1 1.3−1.0−0.5
0.00.51.0
Time (ms)
0.0 0.5 1.0 1.5 2.0 2.50
10
20
30
Frequency (100 kHz)
(d) Ultrasonic testing results under the force of 1.5 kN
Am
plitu
de (V
)
Am
plitu
de (m
V)
0.6 0.8 1.0 1.2 1.4 1.6−1.50−0.75
0.000.751.50
Time (ms)0.0 0.5 1.0 1.5 2.0 2.5
0306090
Frequency (100 kHz)
(e) Ultrasonic testing results under the force of 4.5 kN
Am
plitu
de (V
)
Am
plitu
de (m
V)
0.2 0.4 0.6 0.8 1.0−1.2−0.6
0.00.61.2
Time (ms)0.0 0.5 1.0 1.5 2.0 2.5
0
30
60
90
Frequency (100 kHz)
(f) Ultrasonic testing results under the force of 7.5 kN
0.7 0.9 1.1 1.3 1.5−0.08−0.04
0.000.040.08
Time (ms)
Am
plitu
de (V
)
0.0 0.5 1.0 1.5 2.0 2.50.0
0.2
0.4
0.6
Am
plitu
de (m
V)
Frequency (100 kHz)
(g) Ultrasonic testing results under the force of 9 kN
Figure 6: Continued.
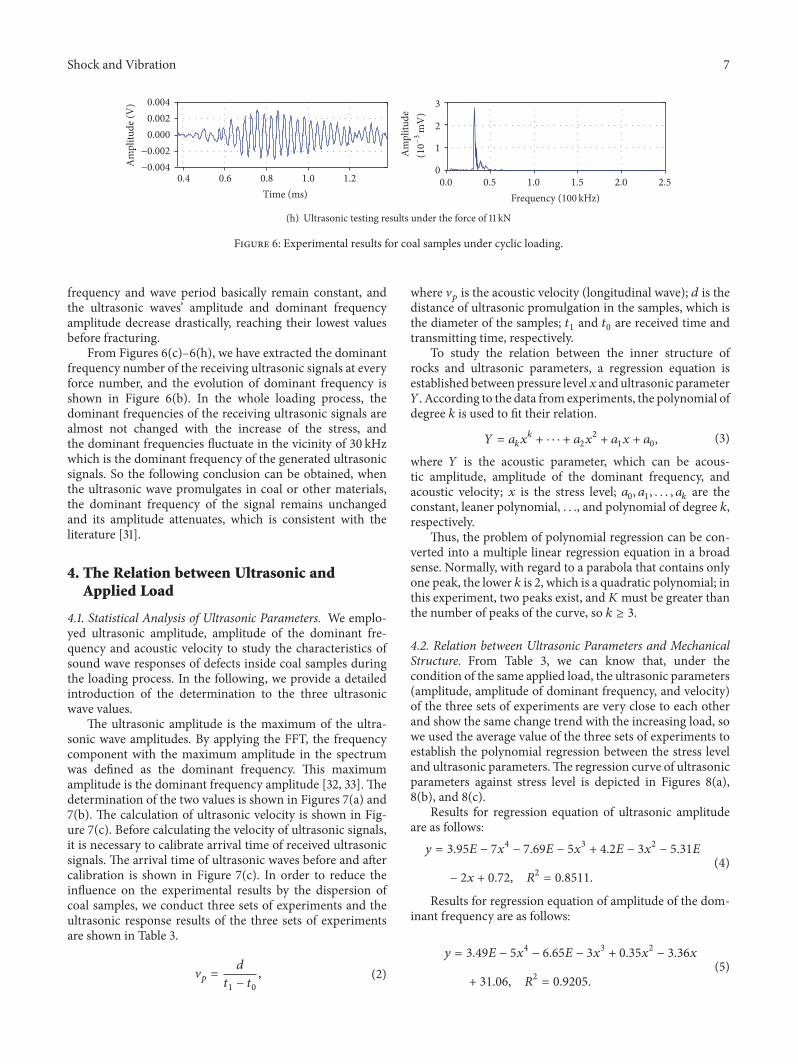
Shock and Vibration 7
0.4 0.6 0.8 1.0 1.2−0.004−0.002
0.0000.0020.004
Am
plitu
de (V
)
Time (ms)0.0 0.5 1.0 1.5 2.0 2.5
0
1
2
3
Frequency (100 kHz)
(10−3
mV
)A
mpl
itude
(h) Ultrasonic testing results under the force of 11 kN
Figure 6: Experimental results for coal samples under cyclic loading.
frequency and wave period basically remain constant, andthe ultrasonic waves’ amplitude and dominant frequencyamplitude decrease drastically, reaching their lowest valuesbefore fracturing.
From Figures 6(c)–6(h), we have extracted the dominantfrequency number of the receiving ultrasonic signals at everyforce number, and the evolution of dominant frequency isshown in Figure 6(b). In the whole loading process, thedominant frequencies of the receiving ultrasonic signals arealmost not changed with the increase of the stress, andthe dominant frequencies fluctuate in the vicinity of 30 kHzwhich is the dominant frequency of the generated ultrasonicsignals. So the following conclusion can be obtained, whenthe ultrasonic wave promulgates in coal or other materials,the dominant frequency of the signal remains unchangedand its amplitude attenuates, which is consistent with theliterature [31].
4. The Relation between Ultrasonic andApplied Load
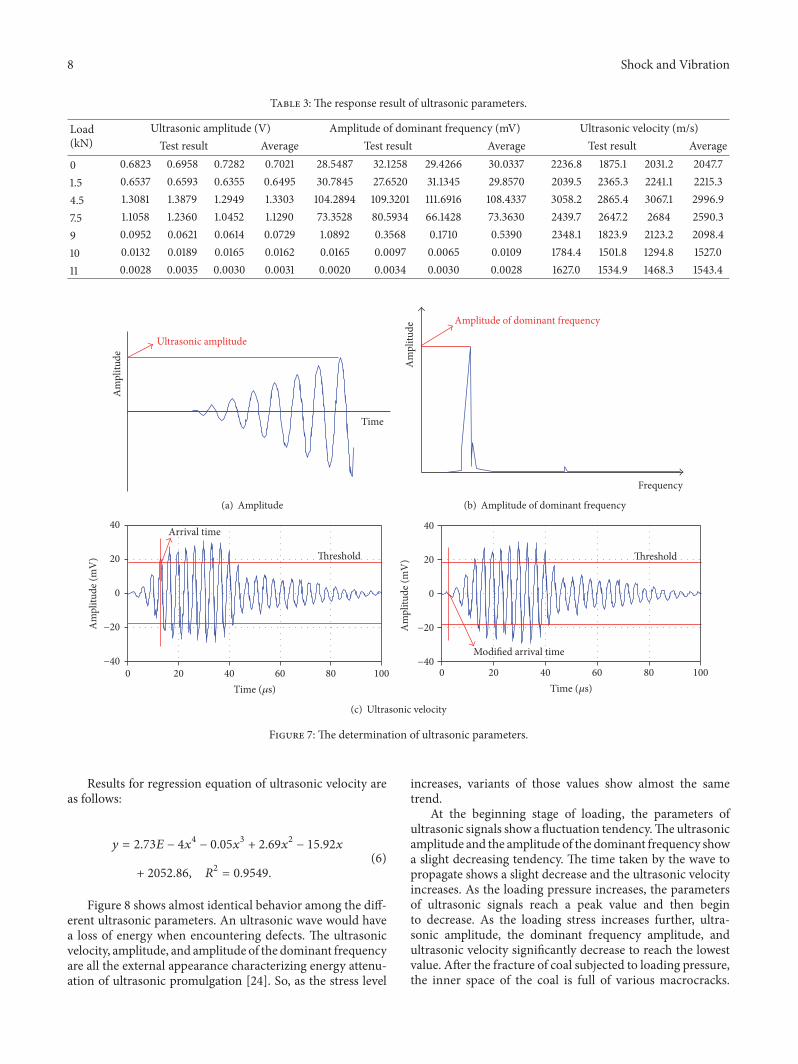
4.1. Statistical Analysis of Ultrasonic Parameters. We emplo-yed ultrasonic amplitude, amplitude of the dominant fre-quency and acoustic velocity to study the characteristics ofsound wave responses of defects inside coal samples duringthe loading process. In the following, we provide a detailedintroduction of the determination to the three ultrasonicwave values.
The ultrasonic amplitude is the maximum of the ultra-sonic wave amplitudes. By applying the FFT, the frequencycomponent with the maximum amplitude in the spectrumwas defined as the dominant frequency. This maximumamplitude is the dominant frequency amplitude [32, 33]. Thedetermination of the two values is shown in Figures 7(a) and7(b). The calculation of ultrasonic velocity is shown in Fig-ure 7(c). Before calculating the velocity of ultrasonic signals,it is necessary to calibrate arrival time of received ultrasonicsignals. The arrival time of ultrasonic waves before and aftercalibration is shown in Figure 7(c). In order to reduce theinfluence on the experimental results by the dispersion ofcoal samples, we conduct three sets of experiments and theultrasonic response results of the three sets of experimentsare shown in Table 3.
V𝑝 =𝑑𝑡1 − 𝑡0, (2)
where V𝑝 is the acoustic velocity (longitudinal wave); 𝑑 is thedistance of ultrasonic promulgation in the samples, which isthe diameter of the samples; 𝑡1 and 𝑡0 are received time andtransmitting time, respectively.
To study the relation between the inner structure ofrocks and ultrasonic parameters, a regression equation isestablished betweenpressure level𝑥 andultrasonic parameter𝑌. According to the data from experiments, the polynomial ofdegree 𝑘 is used to fit their relation.
𝑌 = 𝑎𝑘𝑥𝑘 + ⋅ ⋅ ⋅ + 𝑎2𝑥
2 + 𝑎1𝑥 + 𝑎0, (3)
where 𝑌 is the acoustic parameter, which can be acous-tic amplitude, amplitude of the dominant frequency, andacoustic velocity; 𝑥 is the stress level; 𝑎0, 𝑎1, . . . , 𝑎𝑘 are theconstant, leaner polynomial, . . ., and polynomial of degree 𝑘,respectively.
Thus, the problem of polynomial regression can be con-verted into a multiple linear regression equation in a broadsense. Normally, with regard to a parabola that contains onlyone peak, the lower 𝑘 is 2, which is a quadratic polynomial; inthis experiment, two peaks exist, and𝐾must be greater thanthe number of peaks of the curve, so 𝑘 ≥ 3.
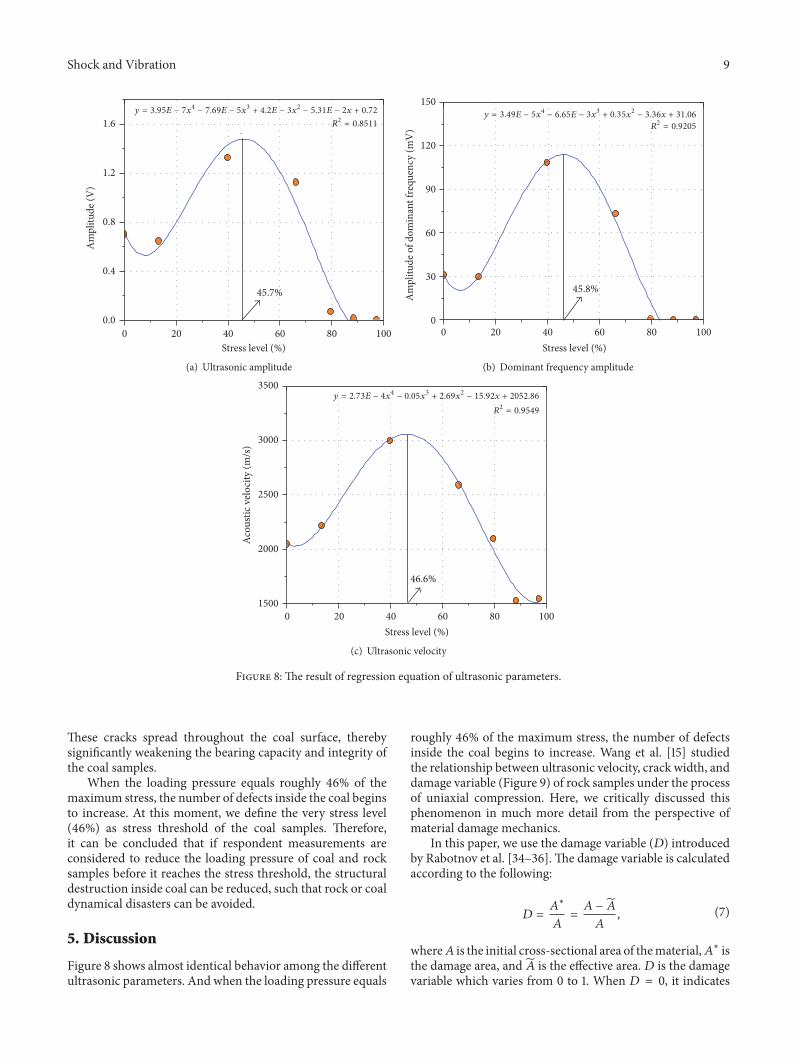
4.2. Relation between Ultrasonic Parameters and MechanicalStructure. From Table 3, we can know that, under thecondition of the same applied load, the ultrasonic parameters(amplitude, amplitude of dominant frequency, and velocity)of the three sets of experiments are very close to each otherand show the same change trend with the increasing load, sowe used the average value of the three sets of experiments toestablish the polynomial regression between the stress leveland ultrasonic parameters.The regression curve of ultrasonicparameters against stress level is depicted in Figures 8(a),8(b), and 8(c).
Results for regression equation of ultrasonic amplitudeare as follows:𝑦 = 3.95𝐸 − 7𝑥4 − 7.69𝐸 − 5𝑥3 + 4.2𝐸 − 3𝑥2 − 5.31𝐸
− 2𝑥 + 0.72, 𝑅2 = 0.8511.(4)
Results for regression equation of amplitude of the dom-inant frequency are as follows:
𝑦 = 3.49𝐸 − 5𝑥4 − 6.65𝐸 − 3𝑥3 + 0.35𝑥2 − 3.36𝑥
+ 31.06, 𝑅2 = 0.9205.(5)
8 Shock and Vibration
Table 3: The response result of ultrasonic parameters.
Load(kN)
Ultrasonic amplitude (V) Amplitude of dominant frequency (mV) Ultrasonic velocity (m/s)Test result Average Test result Average Test result Average
0 0.6823 0.6958 0.7282 0.7021 28.5487 32.1258 29.4266 30.0337 2236.8 1875.1 2031.2 2047.71.5 0.6537 0.6593 0.6355 0.6495 30.7845 27.6520 31.1345 29.8570 2039.5 2365.3 2241.1 2215.34.5 1.3081 1.3879 1.2949 1.3303 104.2894 109.3201 111.6916 108.4337 3058.2 2865.4 3067.1 2996.97.5 1.1058 1.2360 1.0452 1.1290 73.3528 80.5934 66.1428 73.3630 2439.7 2647.2 2684 2590.39 0.0952 0.0621 0.0614 0.0729 1.0892 0.3568 0.1710 0.5390 2348.1 1823.9 2123.2 2098.410 0.0132 0.0189 0.0165 0.0162 0.0165 0.0097 0.0065 0.0109 1784.4 1501.8 1294.8 1527.011 0.0028 0.0035 0.0030 0.0031 0.0020 0.0034 0.0030 0.0028 1627.0 1534.9 1468.3 1543.4
Ultrasonic amplitude
Am
plitu
de
Time
(a) Amplitude
Am
plitu
de
Frequency
Amplitude of dominant frequency
(b) Amplitude of dominant frequency
−40
−20
0
20
40
100806040
Arrival time
Threshold
0 20−40
−20
0
20
40
10080604020
Am
plitu
de (m
V)
Am
plitu
de (m
V) Threshold
Modified arrival time
0Time (𝜇s)Time (𝜇s)
(c) Ultrasonic velocity
Figure 7: The determination of ultrasonic parameters.
Results for regression equation of ultrasonic velocity areas follows:
𝑦 = 2.73𝐸 − 4𝑥4 − 0.05𝑥3 + 2.69𝑥2 − 15.92𝑥
+ 2052.86, 𝑅2 = 0.9549.(6)
Figure 8 shows almost identical behavior among the diff-erent ultrasonic parameters. An ultrasonic wave would havea loss of energy when encountering defects. The ultrasonicvelocity, amplitude, and amplitude of the dominant frequencyare all the external appearance characterizing energy attenu-ation of ultrasonic promulgation [24]. So, as the stress level
increases, variants of those values show almost the sametrend.
At the beginning stage of loading, the parameters ofultrasonic signals show a fluctuation tendency.The ultrasonicamplitude and the amplitude of the dominant frequency showa slight decreasing tendency. The time taken by the wave topropagate shows a slight decrease and the ultrasonic velocityincreases. As the loading pressure increases, the parametersof ultrasonic signals reach a peak value and then beginto decrease. As the loading stress increases further, ultra-sonic amplitude, the dominant frequency amplitude, andultrasonic velocity significantly decrease to reach the lowestvalue. After the fracture of coal subjected to loading pressure,the inner space of the coal is full of various macrocracks.
Shock and Vibration 9
0 20 40 60 80 1000.0
0.4
0.8
1.2
1.6
Am
plitu
de (V
)
45.7%
Stress level (%)
y = 3.95E − 7x4 − 7.69E − 5x3 + 4.2E − 3x2 − 5.31E − 2x + 0.72
R2 = 0.8511
(a) Ultrasonic amplitude
0 20 40 60 80 1000
30
60
90
120
150
Am
plitu
de o
f dom
inan
t fre
quen
cy (m
V)
Stress level (%)
45.8%
y = 3.49E − 5x4 − 6.65E − 3x3 + 0.35x2 − 3.36x + 31.06
R2 = 0.9205
(b) Dominant frequency amplitude
0 20 40 60 80 1001500
2000
2500
3000
3500
Acou
stic v
eloci
ty (m
/s)
Stress level (%)
46.6%
y = 2.73E − 4x4 − 0.05x3 + 2.69x2 − 15.92x + 2052.86
R2 = 0.9549
(c) Ultrasonic velocity
Figure 8: The result of regression equation of ultrasonic parameters.
These cracks spread throughout the coal surface, therebysignificantly weakening the bearing capacity and integrity ofthe coal samples.
When the loading pressure equals roughly 46% of themaximum stress, the number of defects inside the coal beginsto increase. At this moment, we define the very stress level(46%) as stress threshold of the coal samples. Therefore,it can be concluded that if respondent measurements areconsidered to reduce the loading pressure of coal and rocksamples before it reaches the stress threshold, the structuraldestruction inside coal can be reduced, such that rock or coaldynamical disasters can be avoided.
5. Discussion
Figure 8 shows almost identical behavior among the differentultrasonic parameters. And when the loading pressure equals
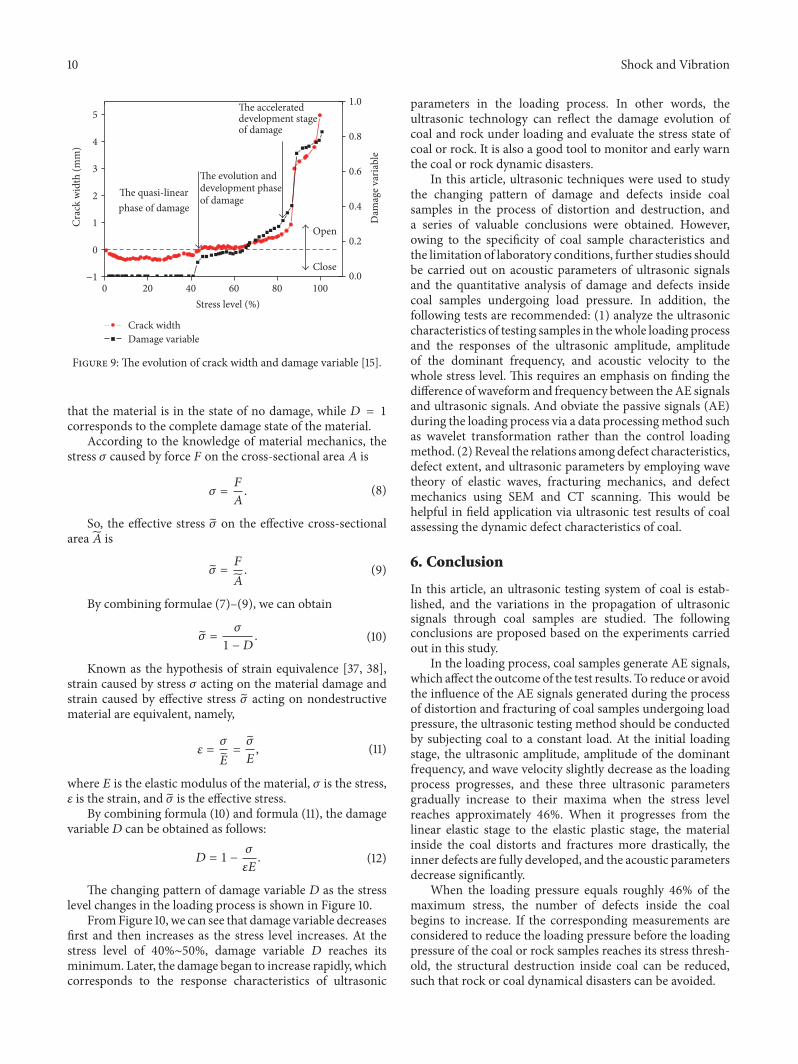
roughly 46% of the maximum stress, the number of defectsinside the coal begins to increase. Wang et al. [15] studiedthe relationship between ultrasonic velocity, crack width, anddamage variable (Figure 9) of rock samples under the processof uniaxial compression. Here, we critically discussed thisphenomenon in much more detail from the perspective ofmaterial damage mechanics.
In this paper, we use the damage variable (𝐷) introducedby Rabotnov et al. [34–36].The damage variable is calculatedaccording to the following:
𝐷 = 𝐴∗
𝐴= 𝐴 − ��𝐴, (7)
where𝐴 is the initial cross-sectional area of thematerial,𝐴∗ isthe damage area, and �� is the effective area. 𝐷 is the damagevariable which varies from 0 to 1. When 𝐷 = 0, it indicates
10 Shock and Vibration
0 20 40 60 80 100−1
0
1
2
3
4
5The accelerated development stageof damage
The evolution and development phaseof damage
Close
Crac
k w
idth
(mm
)
Stress level (%)
Crack widthDamage variable
Open
The quasi-linearphase of damage
0.0
0.2
0.4
0.6
0.8
1.0
Dam
age v
aria
ble
Figure 9: The evolution of crack width and damage variable [15].
that the material is in the state of no damage, while 𝐷 = 1corresponds to the complete damage state of the material.
According to the knowledge of material mechanics, thestress 𝜎 caused by force 𝐹 on the cross-sectional area 𝐴 is
𝜎 = 𝐹𝐴. (8)
So, the effective stress �� on the effective cross-sectionalarea �� is
�� = 𝐹��. (9)
By combining formulae (7)–(9), we can obtain
�� = 𝜎1 − 𝐷. (10)
Known as the hypothesis of strain equivalence [37, 38],strain caused by stress 𝜎 acting on the material damage andstrain caused by effective stress �� acting on nondestructivematerial are equivalent, namely,
𝜀 = 𝜎��= ��𝐸, (11)
where 𝐸 is the elastic modulus of the material, 𝜎 is the stress,𝜀 is the strain, and �� is the effective stress.
By combining formula (10) and formula (11), the damagevariable𝐷 can be obtained as follows:
𝐷 = 1 − 𝜎𝜀𝐸. (12)
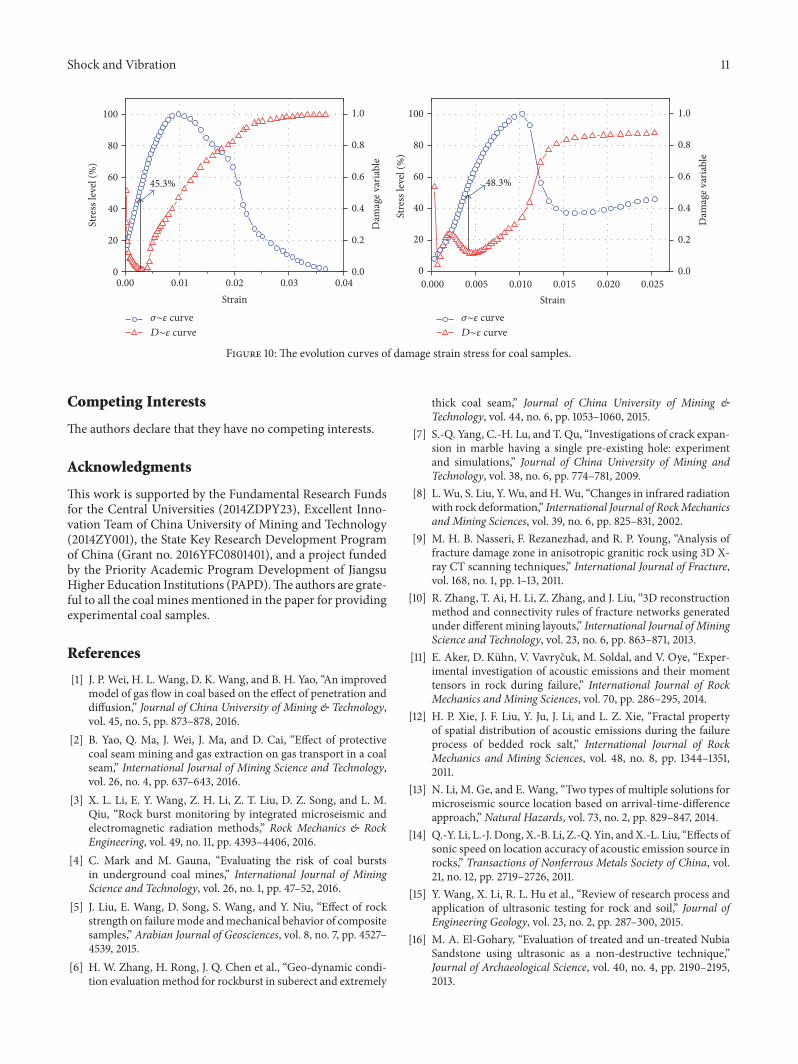
The changing pattern of damage variable 𝐷 as the stresslevel changes in the loading process is shown in Figure 10.
FromFigure 10, we can see that damage variable decreasesfirst and then increases as the stress level increases. At thestress level of 40%∼50%, damage variable 𝐷 reaches itsminimum. Later, the damage began to increase rapidly, whichcorresponds to the response characteristics of ultrasonic
parameters in the loading process. In other words, theultrasonic technology can reflect the damage evolution ofcoal and rock under loading and evaluate the stress state ofcoal or rock. It is also a good tool to monitor and early warnthe coal or rock dynamic disasters.
In this article, ultrasonic techniques were used to studythe changing pattern of damage and defects inside coalsamples in the process of distortion and destruction, anda series of valuable conclusions were obtained. However,owing to the specificity of coal sample characteristics andthe limitation of laboratory conditions, further studies shouldbe carried out on acoustic parameters of ultrasonic signalsand the quantitative analysis of damage and defects insidecoal samples undergoing load pressure. In addition, thefollowing tests are recommended: (1) analyze the ultrasoniccharacteristics of testing samples in thewhole loading processand the responses of the ultrasonic amplitude, amplitudeof the dominant frequency, and acoustic velocity to thewhole stress level. This requires an emphasis on finding thedifference of waveform and frequency between theAE signalsand ultrasonic signals. And obviate the passive signals (AE)during the loading process via a data processingmethod suchas wavelet transformation rather than the control loadingmethod. (2)Reveal the relations among defect characteristics,defect extent, and ultrasonic parameters by employing wavetheory of elastic waves, fracturing mechanics, and defectmechanics using SEM and CT scanning. This would behelpful in field application via ultrasonic test results of coalassessing the dynamic defect characteristics of coal.
6. Conclusion
In this article, an ultrasonic testing system of coal is estab-lished, and the variations in the propagation of ultrasonicsignals through coal samples are studied. The followingconclusions are proposed based on the experiments carriedout in this study.
In the loading process, coal samples generate AE signals,which affect the outcome of the test results. To reduce or avoidthe influence of the AE signals generated during the processof distortion and fracturing of coal samples undergoing loadpressure, the ultrasonic testing method should be conductedby subjecting coal to a constant load. At the initial loadingstage, the ultrasonic amplitude, amplitude of the dominantfrequency, and wave velocity slightly decrease as the loadingprocess progresses, and these three ultrasonic parametersgradually increase to their maxima when the stress levelreaches approximately 46%. When it progresses from thelinear elastic stage to the elastic plastic stage, the materialinside the coal distorts and fractures more drastically, theinner defects are fully developed, and the acoustic parametersdecrease significantly.
When the loading pressure equals roughly 46% of themaximum stress, the number of defects inside the coalbegins to increase. If the corresponding measurements areconsidered to reduce the loading pressure before the loadingpressure of the coal or rock samples reaches its stress thresh-old, the structural destruction inside coal can be reduced,such that rock or coal dynamical disasters can be avoided.
Shock and Vibration 11
0.00 0.01 0.02 0.03 0.040
20
40
60
80
100
Dam
age v
aria
ble
Stre
ss le
vel (
%)
Strain
45.3%
0.0
0.2
0.4
0.6
0.8
1.0
0.000 0.005 0.010 0.015 0.020 0.0250
20
40
60
80
100
Stre
ss le
vel (
%)
Strain
48.3%
0.0
0.2
0.4
0.6
0.8
1.0
Dam
age v
aria
ble
𝜎∼𝜀 curveD∼𝜀 curve
𝜎∼𝜀 curveD∼𝜀 curve
Figure 10: The evolution curves of damage strain stress for coal samples.
Competing Interests
The authors declare that they have no competing interests.
Acknowledgments
This work is supported by the Fundamental Research Fundsfor the Central Universities (2014ZDPY23), Excellent Inno-vation Team of China University of Mining and Technology(2014ZY001), the State Key Research Development Programof China (Grant no. 2016YFC0801401), and a project fundedby the Priority Academic Program Development of JiangsuHigher Education Institutions (PAPD).The authors are grate-ful to all the coal mines mentioned in the paper for providingexperimental coal samples.
References
[1] J. P. Wei, H. L. Wang, D. K. Wang, and B. H. Yao, “An improvedmodel of gas flow in coal based on the effect of penetration anddiffusion,” Journal of China University of Mining & Technology,vol. 45, no. 5, pp. 873–878, 2016.
[2] B. Yao, Q. Ma, J. Wei, J. Ma, and D. Cai, “Effect of protectivecoal seam mining and gas extraction on gas transport in a coalseam,” International Journal of Mining Science and Technology,vol. 26, no. 4, pp. 637–643, 2016.
[3] X. L. Li, E. Y. Wang, Z. H. Li, Z. T. Liu, D. Z. Song, and L. M.Qiu, “Rock burst monitoring by integrated microseismic andelectromagnetic radiation methods,” Rock Mechanics & RockEngineering, vol. 49, no. 11, pp. 4393–4406, 2016.
[4] C. Mark and M. Gauna, “Evaluating the risk of coal burstsin underground coal mines,” International Journal of MiningScience and Technology, vol. 26, no. 1, pp. 47–52, 2016.
[5] J. Liu, E. Wang, D. Song, S. Wang, and Y. Niu, “Effect of rockstrength on failuremode andmechanical behavior of compositesamples,” Arabian Journal of Geosciences, vol. 8, no. 7, pp. 4527–4539, 2015.
[6] H. W. Zhang, H. Rong, J. Q. Chen et al., “Geo-dynamic condi-tion evaluationmethod for rockburst in suberect and extremely
thick coal seam,” Journal of China University of Mining &Technology, vol. 44, no. 6, pp. 1053–1060, 2015.
[7] S.-Q. Yang, C.-H. Lu, and T. Qu, “Investigations of crack expan-sion in marble having a single pre-existing hole: experimentand simulations,” Journal of China University of Mining andTechnology, vol. 38, no. 6, pp. 774–781, 2009.
[8] L.Wu, S. Liu, Y.Wu, and H.Wu, “Changes in infrared radiationwith rock deformation,” International Journal of RockMechanicsand Mining Sciences, vol. 39, no. 6, pp. 825–831, 2002.
[9] M. H. B. Nasseri, F. Rezanezhad, and R. P. Young, “Analysis offracture damage zone in anisotropic granitic rock using 3D X-ray CT scanning techniques,” International Journal of Fracture,vol. 168, no. 1, pp. 1–13, 2011.
[10] R. Zhang, T. Ai, H. Li, Z. Zhang, and J. Liu, “3D reconstructionmethod and connectivity rules of fracture networks generatedunder different mining layouts,” International Journal of MiningScience and Technology, vol. 23, no. 6, pp. 863–871, 2013.
[11] E. Aker, D. Kuhn, V. Vavrycuk, M. Soldal, and V. Oye, “Exper-imental investigation of acoustic emissions and their momenttensors in rock during failure,” International Journal of RockMechanics and Mining Sciences, vol. 70, pp. 286–295, 2014.
[12] H. P. Xie, J. F. Liu, Y. Ju, J. Li, and L. Z. Xie, “Fractal propertyof spatial distribution of acoustic emissions during the failureprocess of bedded rock salt,” International Journal of RockMechanics and Mining Sciences, vol. 48, no. 8, pp. 1344–1351,2011.
[13] N. Li, M. Ge, and E. Wang, “Two types of multiple solutions formicroseismic source location based on arrival-time-differenceapproach,” Natural Hazards, vol. 73, no. 2, pp. 829–847, 2014.
[14] Q.-Y. Li, L.-J. Dong, X.-B. Li, Z.-Q. Yin, andX.-L. Liu, “Effects ofsonic speed on location accuracy of acoustic emission source inrocks,” Transactions of Nonferrous Metals Society of China, vol.21, no. 12, pp. 2719–2726, 2011.
[15] Y. Wang, X. Li, R. L. Hu et al., “Review of research process andapplication of ultrasonic testing for rock and soil,” Journal ofEngineering Geology, vol. 23, no. 2, pp. 287–300, 2015.
[16] M. A. El-Gohary, “Evaluation of treated and un-treated NubiaSandstone using ultrasonic as a non-destructive technique,”Journal of Archaeological Science, vol. 40, no. 4, pp. 2190–2195,2013.
12 Shock and Vibration
[17] T. Lokajıcek and T. Svitek, “Laboratory measurement of elasticanisotropy on spherical rock samples by longitudinal andtransverse sounding under confining pressure,”Ultrasonics, vol.56, pp. 294–302, 2015.
[18] J. Coe and S. J. Brandenberg, “P-wave reflection imaging of sub-merged soil models using ultrasound,” Journal of Geotechnicaland Geoenvironmental Engineering, vol. 136, no. 10, Article ID013010QGT, pp. 1358–1367, 2010.
[19] L. Peyras, P. Rivard, P. Breul, A. Millet, and G. Ballivy, “Charac-terization of rock discontinuity openings using acoustic waveamplitude—application to ametamorphic rockmass,”Engineer-ing Geology, vol. 193, pp. 402–411, 2015.
[20] L. Adam, K. van Wijk, T. Otheim, and M. Batzle, “Changesin elastic wave velocity and rock microstructure due to basalt-CO2-water reactions,” Journal of Geophysical Research: SolidEarth, vol. 118, no. 8, pp. 4039–4047, 2013.
[21] T. Engelder and R. Plumb, “Changes in in situ ultrasonicproperties of rock on strain relaxation,” International Journal ofRock Mechanics and Mining Sciences and, vol. 21, no. 2, pp. 75–82, 1984.
[22] A. Nur, “Effects of access on velocity anisotropy in rocks withcracks,” Rock Mechanics and Engineering Geology, vol. 76, no. 8,pp. 2002–2034, 1971.
[23] G.-P. Zheng, X.-D. Zhao, J.-P. Liu, and Y.-H. Li, “Experimentalstudy on change in acoustic wave velocity when rock is loading,”Journal of Northeastern University, vol. 30, no. 8, pp. 1197–1200,2009.
[24] K. Zhao, J.-F. Jin, X.-J. Wang, and K. Zhao, “Study on rock dam-age and acoustic emission based on ultrasonic velocity testof rock specimen under uniaxial compression,” Rock and SoilMechanics, vol. 28, no. 10, pp. 2105–2114, 2007.
[25] D. Xi, C. Zhang, and X. Liu, “Wave velocities, modulus, fatiguedamage of sandstone under low confining pressure and cyclicloading (II): mechanics characteristics of rock,” Chinese Journalof RockMechanics and Engineering, vol. 24, no. 13, pp. 2168–2171,2004.
[26] J. Dvorkin and A. Nur, “Dynamic poroelasticity: a unifiedmodel with the squirt and the Biot mechanisms,” Geophysics,vol. 58, no. 4, pp. 524–533, 1993.
[27] M. S. Diallo, M. Prasad, and E. Appel, “Comparison betweenexperimental results and theoretical predictions for P-wavevelocity and attenuation at ultrasonic frequency,”Wave Motion,vol. 37, no. 1, pp. 1–16, 2003.
[28] C.McCann and J. Sothcott, “Sonic to ultrasonicQ of sandstonesand limestones: laboratory measurements at in situ pressures,”Geophysics, vol. 74, no. 2, pp. WA93–WA101, 2009.
[29] A. Lavrov, “The Kaiser effect in rocks: principles and stress esti-mation techniques,” International Journal of Rock Mechanicsand Mining Sciences, vol. 40, no. 2, pp. 151–171, 2003.
[30] N. Li, E.-Y. Wang, E.-L. Zhao, Y.-K. Ma, F.-L. Xu, and W.-H.Qian, “Experiment on acoustic emission of rock damage andfracture under cyclic loading and multi-stage loading,” Journalof the China Coal Society, vol. 35, no. 7, pp. 1099–1103, 2010.
[31] R. Li andW. B. Jian, “Study on acoustic property in fatigue dam-age process of fractured rocklike materials,” Journal of WaterResources and Architectural Engineering, vol. 12, no. 3, pp. 115–120, 2014.
[32] Q.-Q. Ni andM. Iwamoto, “Wavelet transform of acoustic emis-sion signals in failure of model composites,” Engineering Frac-ture Mechanics, vol. 69, no. 6, pp. 717–728, 2002.
[33] W.Mao and I. Towhata, “Monitoring of single-particle fragmen-tation process under static loading using acoustic emission,”Applied Acoustics, vol. 94, pp. 39–45, 2015.
[34] Y. N. Robotnov, “Creep rupture in applied mechanics,” in Pro-ceedings of the 12th International Congress onAppliedMechanics,pp. 342–349, 1968.
[35] Y. N. Robotnov, Creep Problems in Structural Members, North-Holland, Amsterdam, The Netherlands, 1969.
[36] V. A. Robsman and G. N. Nikogosyan, “Changes in emissionspectra during crack development and rock failure,” Transac-tions (Doklady) of the USSR Academy of Sciences: Earth ScienceSections, vol. 306, no. 3, pp. 26–29, 1990.
[37] Y. Ju and H. P. Xie, “A variable condition of the damagedescription based on hypothesis of strain equivalence,” ChineseJournal of Applied Mechanics, vol. 15, no. 1, pp. 43–49, 1998.
[38] T.Wen, H.M. Tang, Y. R. Liu, Z. X. Zou, K.Wang, and C. Y. Lin,“Newly modified damage statistical constitutive model of rockbased on impact factor,” Journal of Chinese University of Mining& Technology, vol. 45, no. 1, pp. 141–149, 2016.

International Journal of
AerospaceEngineeringHindawi Publishing Corporationhttp://www.hindawi.com Volume 2014
RoboticsJournal of
Hindawi Publishing Corporationhttp://www.hindawi.com Volume 2014
Hindawi Publishing Corporationhttp://www.hindawi.com Volume 2014
Active and Passive Electronic Components
Control Scienceand Engineering
Journal of
Hindawi Publishing Corporationhttp://www.hindawi.com Volume 2014
International Journal of
RotatingMachinery
Hindawi Publishing Corporationhttp://www.hindawi.com Volume 2014
Hindawi Publishing Corporation http://www.hindawi.com
Journal ofEngineeringVolume 2014
Submit your manuscripts athttps://www.hindawi.com
VLSI Design
Hindawi Publishing Corporationhttp://www.hindawi.com Volume 2014
Hindawi Publishing Corporationhttp://www.hindawi.com Volume 2014
Shock and Vibration
Hindawi Publishing Corporationhttp://www.hindawi.com Volume 2014
Civil EngineeringAdvances in
Acoustics and VibrationAdvances in
Hindawi Publishing Corporationhttp://www.hindawi.com Volume 2014
Hindawi Publishing Corporationhttp://www.hindawi.com Volume 2014
Electrical and Computer Engineering
Journal of
Advances inOptoElectronics
Hindawi Publishing Corporation http://www.hindawi.com
Volume 2014
The Scientific World JournalHindawi Publishing Corporation http://www.hindawi.com Volume 2014
SensorsJournal of
Hindawi Publishing Corporationhttp://www.hindawi.com Volume 2014
Modelling & Simulation in EngineeringHindawi Publishing Corporation http://www.hindawi.com Volume 2014
Hindawi Publishing Corporationhttp://www.hindawi.com Volume 2014
Chemical EngineeringInternational Journal of Antennas and
Propagation
International Journal of
Hindawi Publishing Corporationhttp://www.hindawi.com Volume 2014
Hindawi Publishing Corporationhttp://www.hindawi.com Volume 2014
Navigation and Observation
International Journal of
Hindawi Publishing Corporationhttp://www.hindawi.com Volume 2014
DistributedSensor Networks
International Journal of