Embed Size (px)
Citation preview
ByDr. Yuan-Kuang Guu
Dr. Tzou-Chi Huang
Dr. Jia-Hsin GuoNukrob Narkprasom (Student)
1
Mathematical model of processing parameters for mycelia growth and polysaccharides production from
Ganoderma tsugae in Submerged Fermentation
6th Thailand-Taiwan Academic Cooperation Conference on“Food and Agricultural Innovation: Going Global” 15November 2010 at Kasetsart University, Bangkok, Thailand
CONTENT
• 1. Introduction
• 2. Objective
• 3. Materials and Methods
• 4. Results and Discussions
• 5. Conclusions
• 6. References
• 7. Acknowledgements
2
1. INTRODUCTION
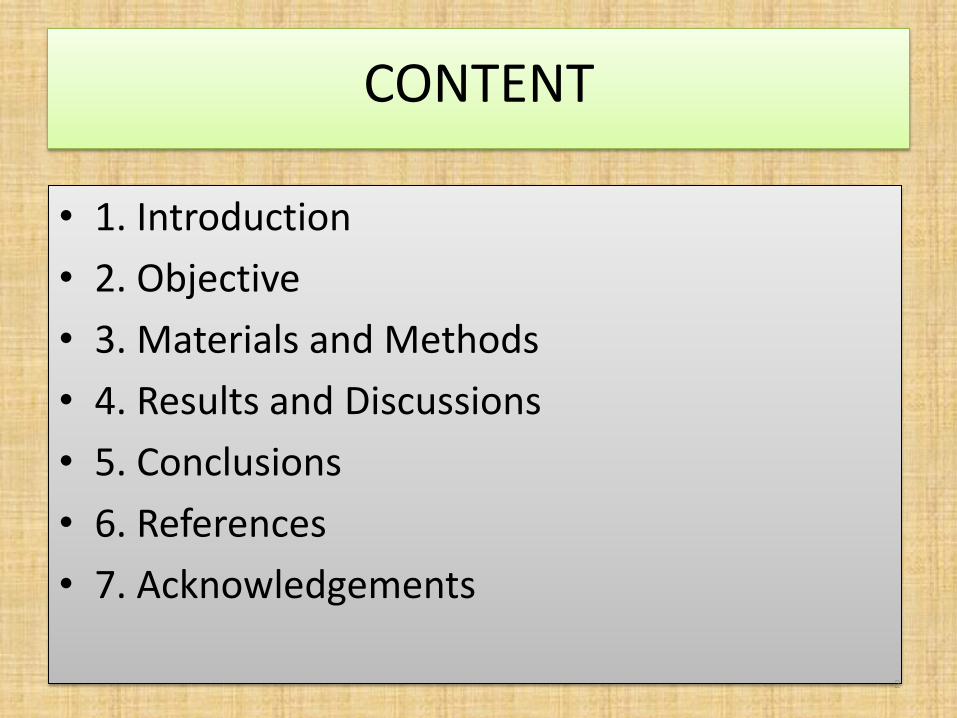
Ganoderma (Ganodermataceae) is a folk medicine and also a functional food due to its antitumor and certain physiological benefits. Several biologically active triterpenes and sterols have been isolated from this mushroom and been proved their effectiveness to be a cytotoxic, antiviral (e.g., anti HIV), or anti-inflammatory agent.
3
Introduction con’t
Ganoderma is also found to be active in several othertherapeutic effects, including anti-bacteria, anti-parasite, bloodpressure regulation, immunomodulation, kidney toning, liverprotection, nerve toning, sexual potentiating, etc.
Ganoderma tsugae Murrill, also called Song Shan Ling Chih,has been revered for centuries as a symbol of success and wellbeing, meaning “marvelous herbs” or “mushroom of immortality”(Mau et al., 2005; Tseng et al., 2008).
The metabolites of G. tsugae consist of mainlypolysaccharides and triterpenes, which have various applicationsin food, pharmaceutical industries (Russell and Paterson, 2006).
4
5
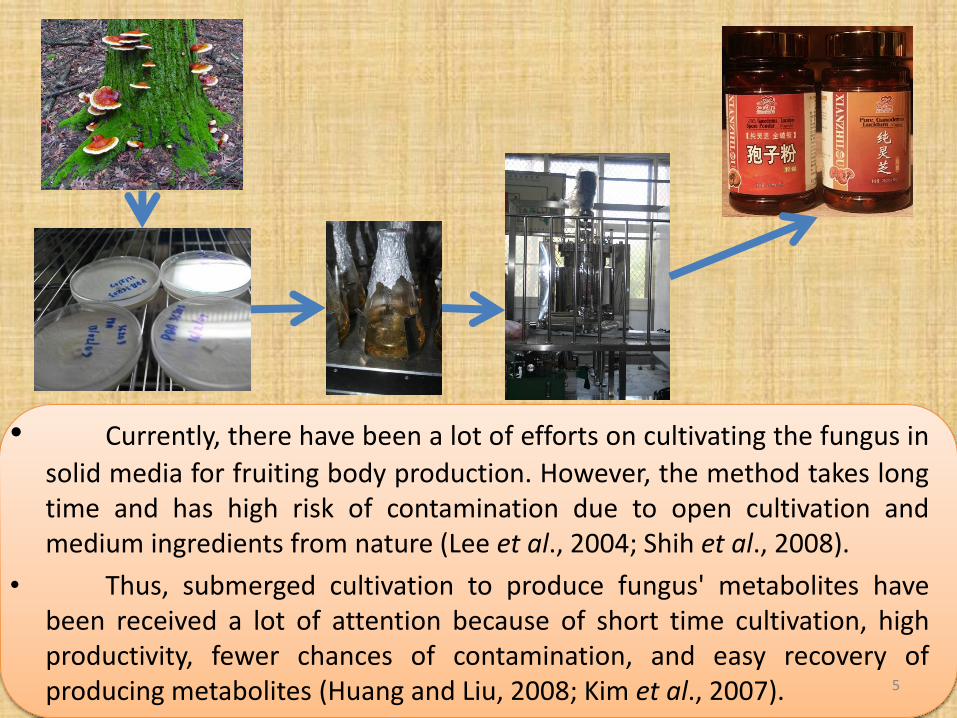
• Currently, there have been a lot of efforts on cultivating the fungus in
solid media for fruiting body production. However, the method takes longtime and has high risk of contamination due to open cultivation andmedium ingredients from nature (Lee et al., 2004; Shih et al., 2008).
• Thus, submerged cultivation to produce fungus' metabolites havebeen received a lot of attention because of short time cultivation, highproductivity, fewer chances of contamination, and easy recovery ofproducing metabolites (Huang and Liu, 2008; Kim et al., 2007).
6
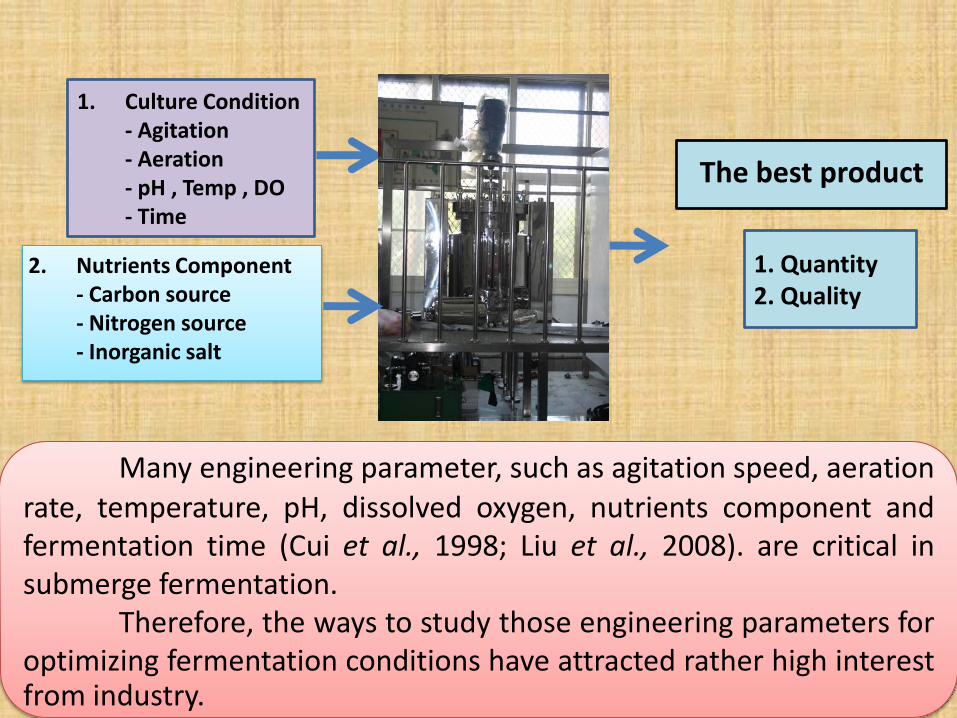
Many engineering parameter, such as agitation speed, aerationrate, temperature, pH, dissolved oxygen, nutrients component andfermentation time (Cui et al., 1998; Liu et al., 2008). are critical insubmerge fermentation.
Therefore, the ways to study those engineering parameters foroptimizing fermentation conditions have attracted rather high interestfrom industry.
The best product
1. Quantity 2. Quality
1. Culture Condition- Agitation- Aeration- pH , Temp , DO- Time
2. Nutrients Component- Carbon source- Nitrogen source- Inorganic salt
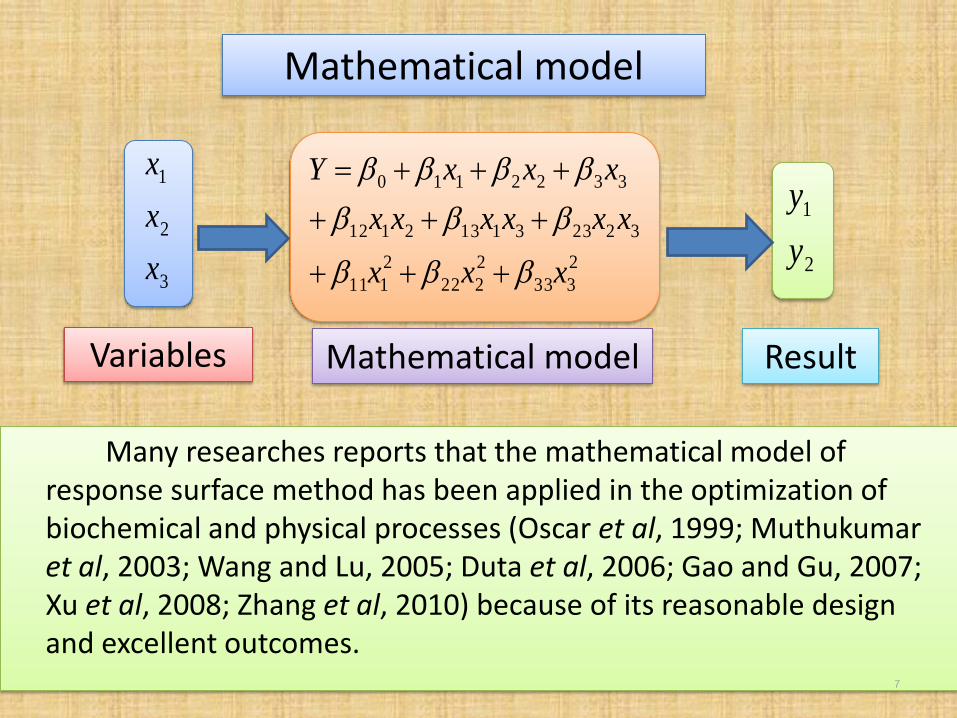
Many researches reports that the mathematical model of response surface method has been applied in the optimization of biochemical and physical processes (Oscar et al, 1999; Muthukumaret al, 2003; Wang and Lu, 2005; Duta et al, 2006; Gao and Gu, 2007; Xu et al, 2008; Zhang et al, 2010) because of its reasonable design and excellent outcomes.
7
2
333
2
222
2
111
322331132112
3322110
xxx
xxxxxx
xxxY
3
2
1
x
x
x
2
1
y
y
Variables Mathematical model Result
Mathematical model
8
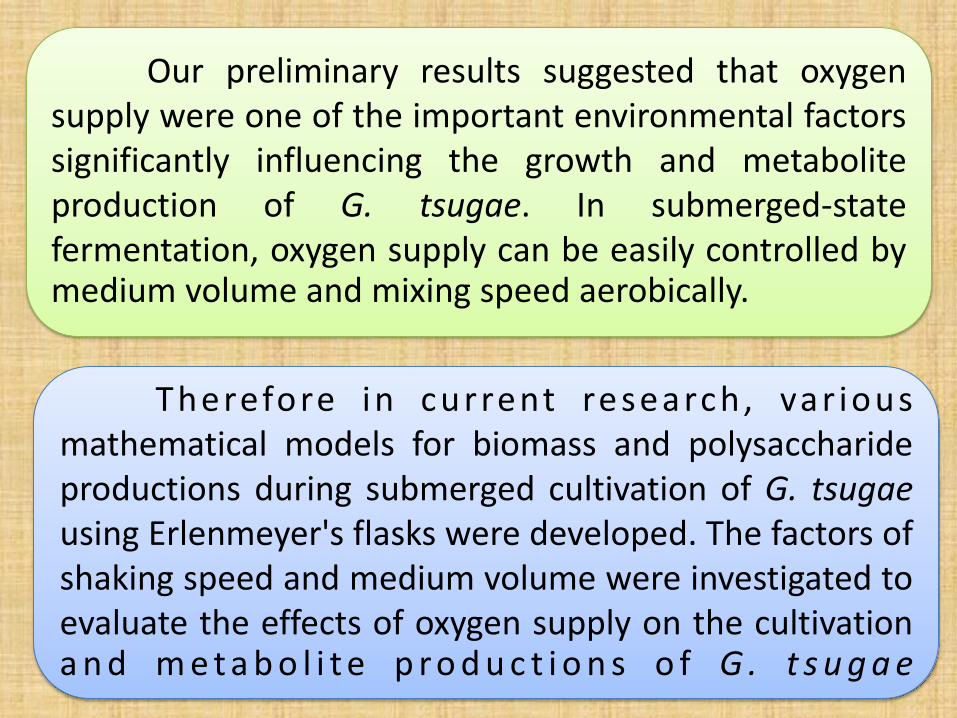
Our preliminary results suggested that oxygensupply were one of the important environmental factorssignificantly influencing the growth and metaboliteproduction of G. tsugae. In submerged-statefermentation, oxygen supply can be easily controlled bymedium volume and mixing speed aerobically.
Therefore in current research, var iousmathematical models for biomass and polysaccharideproductions during submerged cultivation of G. tsugaeusing Erlenmeyer's flasks were developed. The factors ofshaking speed and medium volume were investigated toevaluate the effects of oxygen supply on the cultivationa n d m e t a b o l i t e p r o d u c t i o n s o f G . t s u g a e
2.OBJECTIVE
To establish mathematical models of theoxygen supply parameters during culturedGanoderma tsugae in submerge fermentation forprediction of fermentation progression and fordesign of automation controls.
9
10
3. MATERIALS AND METHODS
• 3.1 Inoculum preparation and submerged culture
• 3.2 Response Surface Methodology
• 3.2 Experimental design (The factorial design)
11
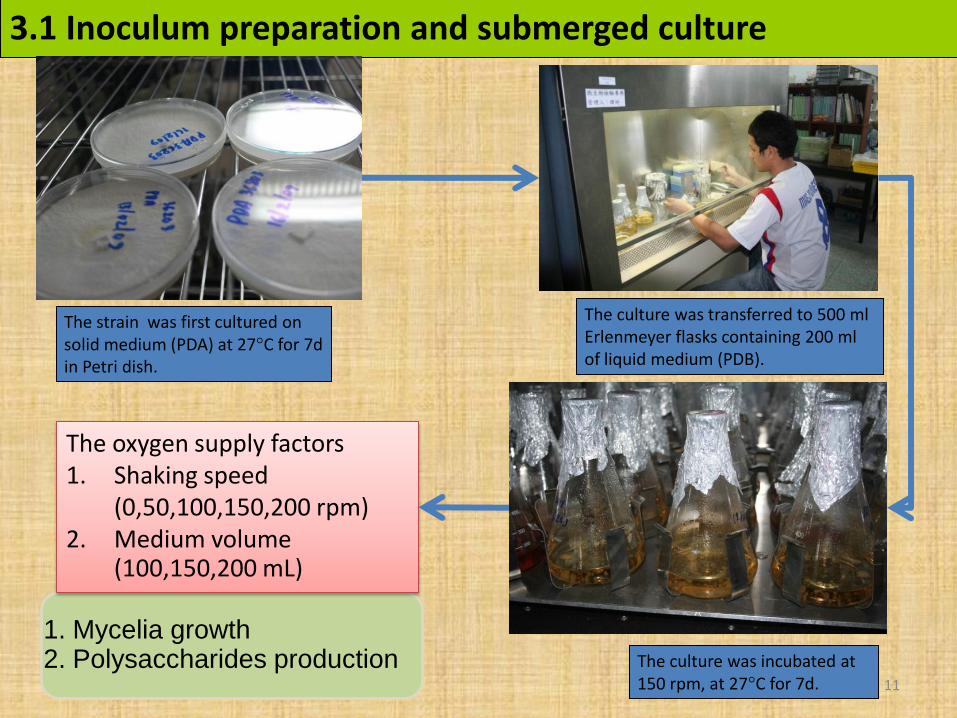
3.1 Inoculum preparation and submerged culture
The culture was incubated at 150 rpm, at 27°C for 7d.
The culture was transferred to 500 ml Erlenmeyer flasks containing 200 ml of liquid medium (PDB).
The strain was first cultured onsolid medium (PDA) at 27°C for 7d in Petri dish.
1. Mycelia growth2. Polysaccharides production
The oxygen supply factors1. Shaking speed
(0,50,100,150,200 rpm)2. Medium volume
(100,150,200 mL)
12
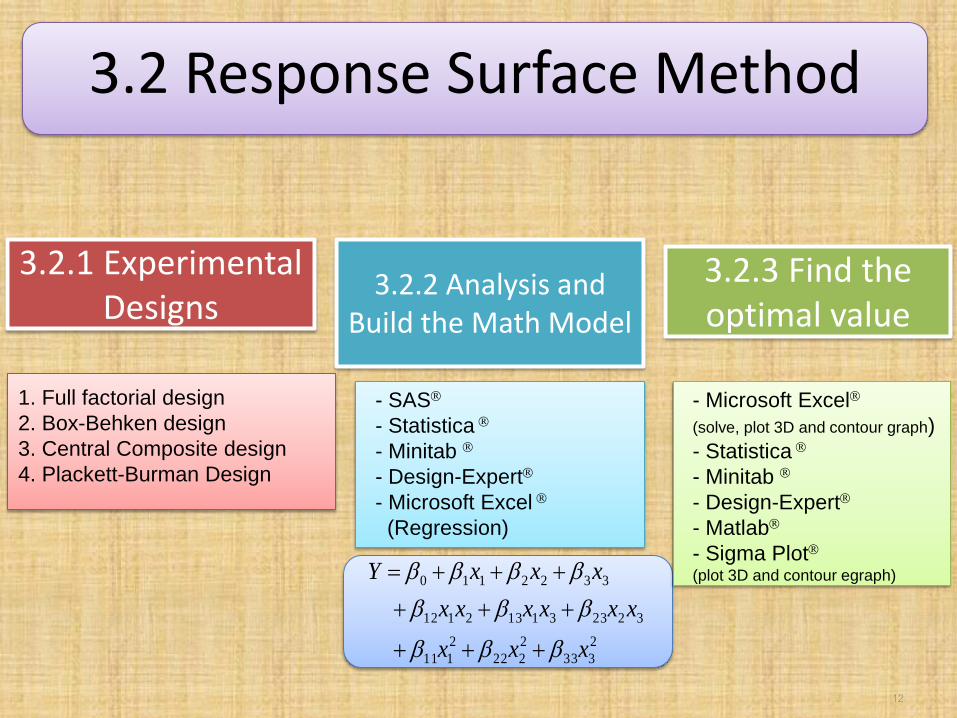
3.2 Response Surface Method
3.2.1 Experimental Designs
3.2.2 Analysis and Build the Math Model
3.2.3 Find the optimal value
1. Full factorial design
2. Box-Behken design
3. Central Composite design
4. Plackett-Burman Design
2
333
2
222
2
111
322331132112
3322110
xxx
xxxxxx
xxxY
- SAS
- Statistica
- Minitab
- Design-Expert
- Microsoft Excel
(Regression)
- Microsoft Excel
(solve, plot 3D and contour graph)
- Statistica
- Minitab
- Design-Expert
- Matlab
- Sigma Plot
(plot 3D and contour egraph)
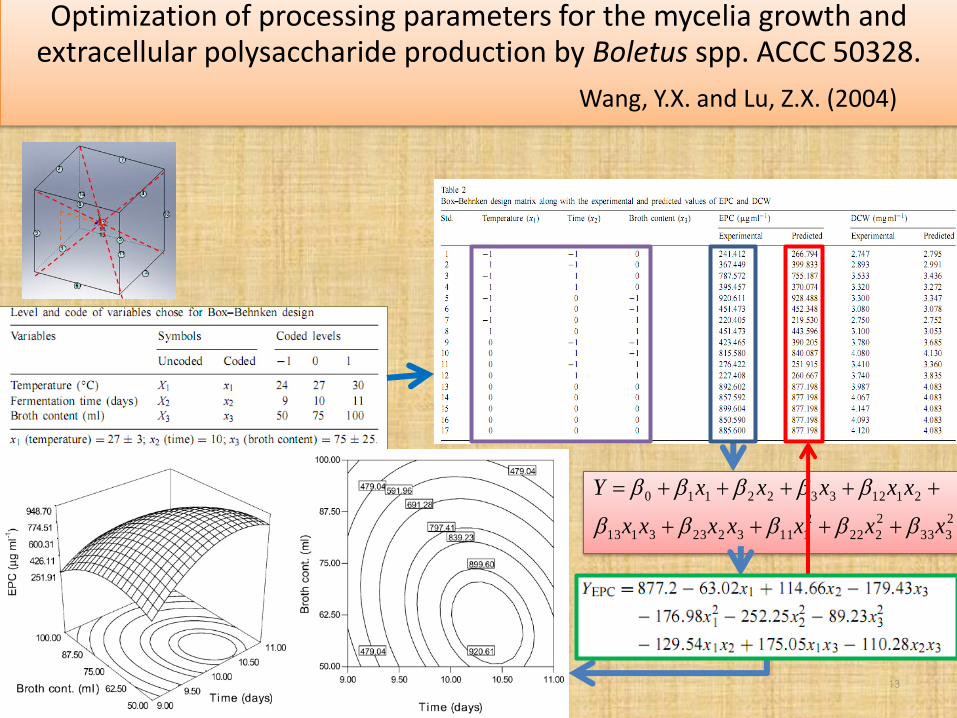
Optimization of processing parameters for the mycelia growth and extracellular polysaccharide production by Boletus spp. ACCC 50328.
13
Wang, Y.X. and Lu, Z.X. (2004)
2
333
2
222
2
11132233113
21123322110
xxxxxxx
xxxxxY
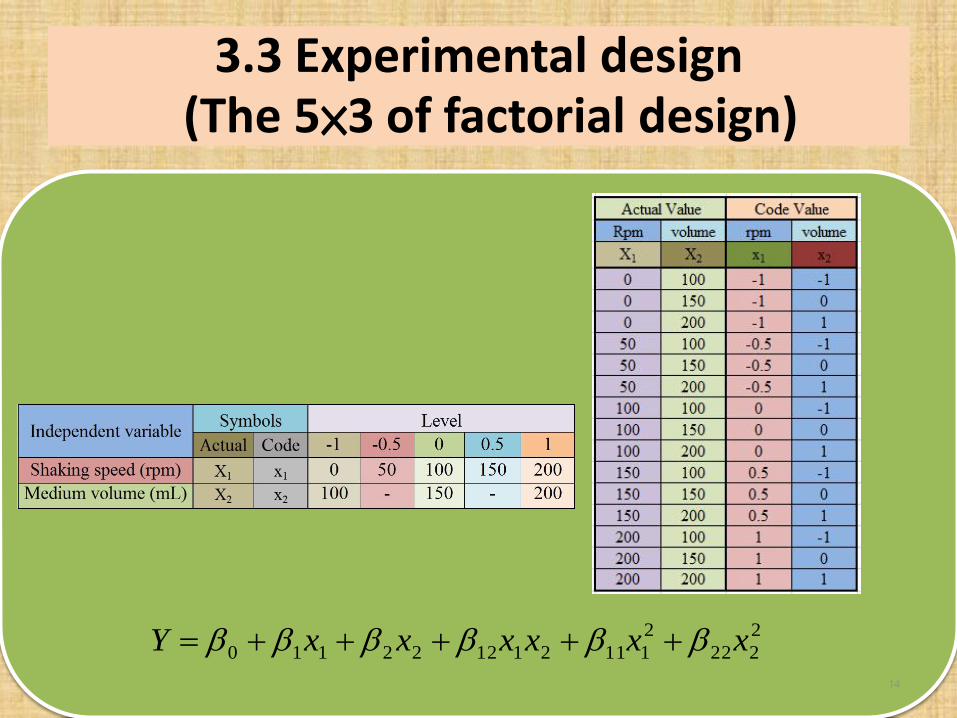
3.3 Experimental design(The 5×3 of factorial design)
14
2
222
2
111211222110 xxxxxxY
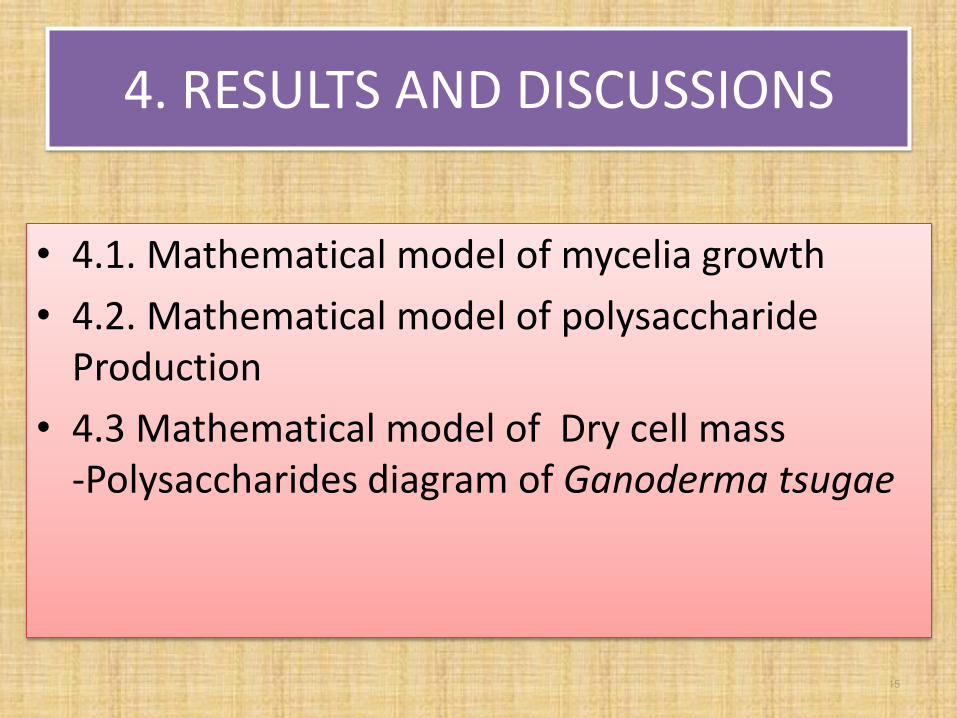
4. RESULTS AND DISCUSSIONS
• 4.1. Mathematical model of mycelia growth
• 4.2. Mathematical model of polysaccharide Production
• 4.3 Mathematical model of Dry cell mass -Polysaccharides diagram of Ganoderma tsugae
15
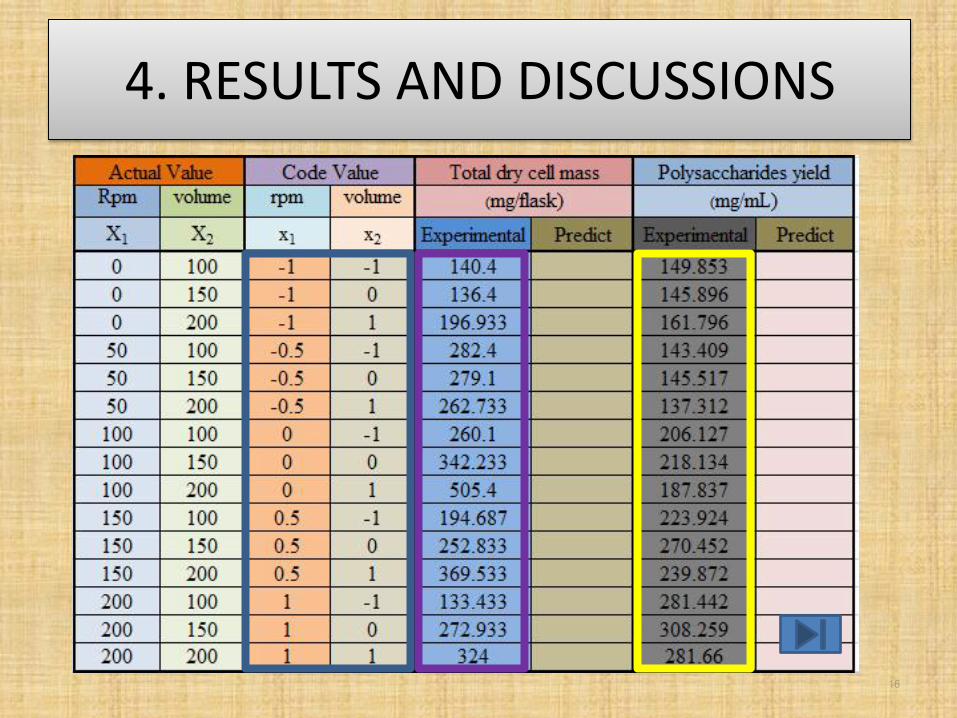
4. RESULTS AND DISCUSSIONS
16
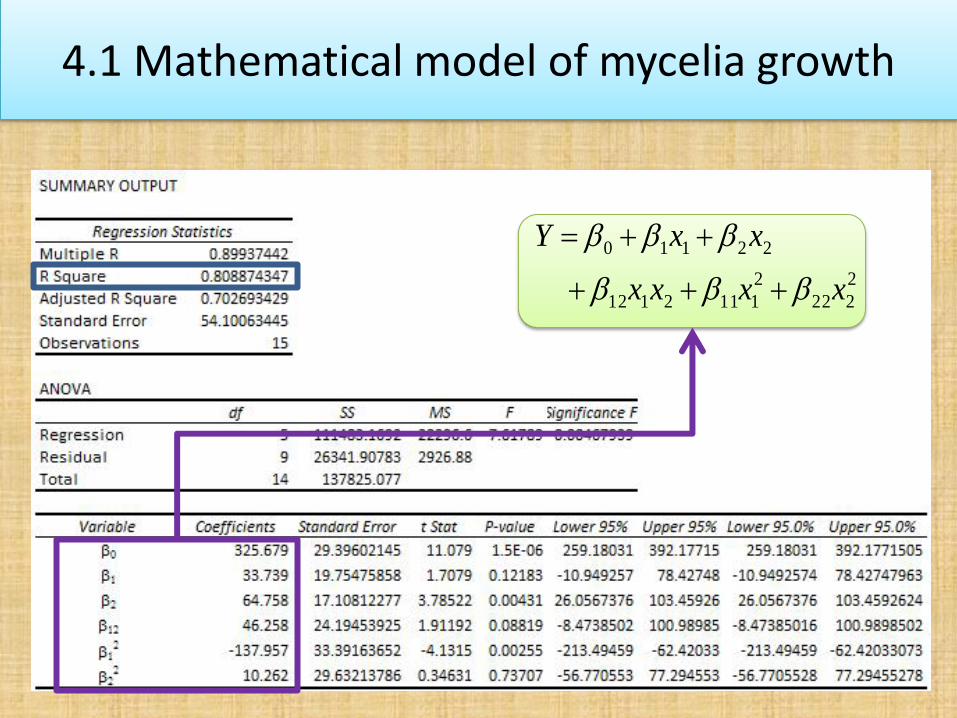
4.1 Mathematical model of mycelia growth
17
2
222
2
1112112
22110
xxxx
xxY
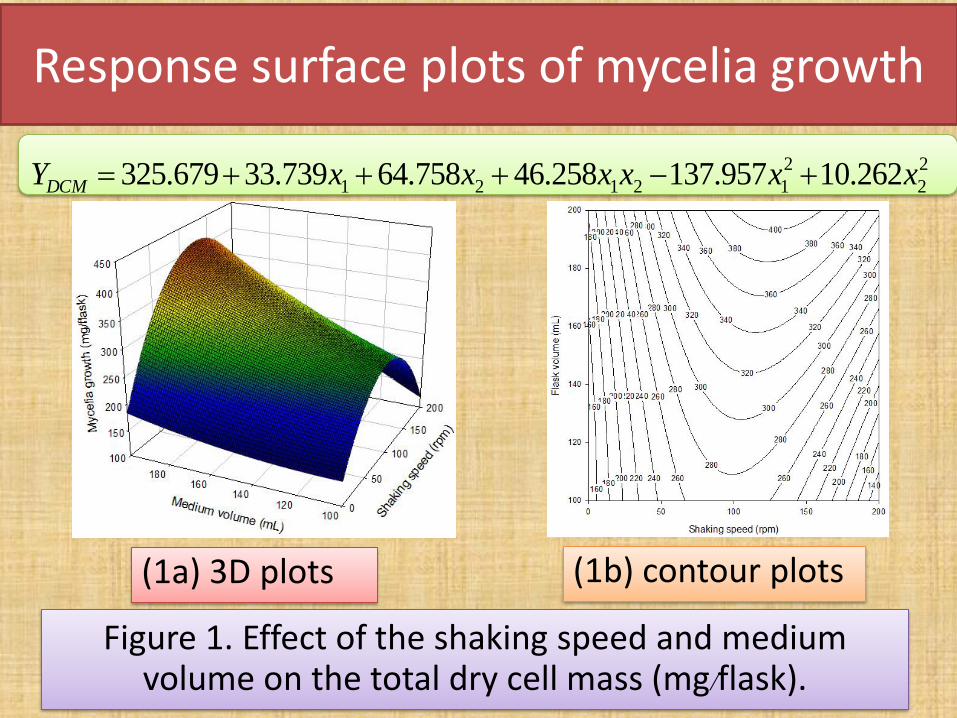
Response surface plots of mycelia growth
18
2
2
2
12121 262.10957.137258.46758.64739.33679.325 xxxxxxYDCM
Figure 1. Effect of the shaking speed and medium volume on the total dry cell mass (mg/flask).
(1a) 3D plots (1b) contour plots
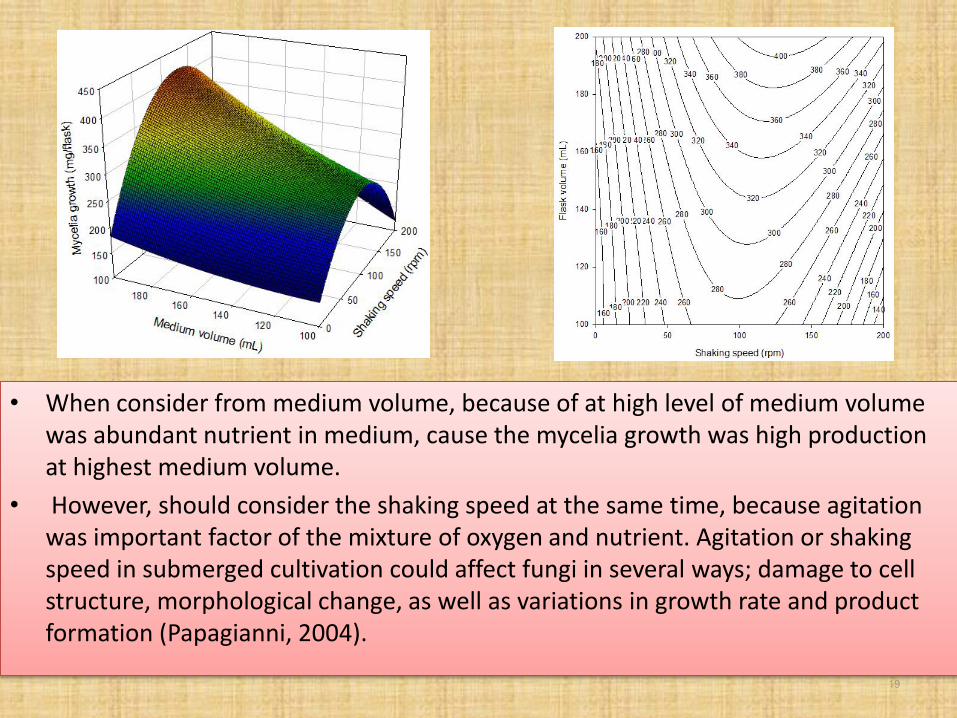
• When consider from medium volume, because of at high level of medium volume was abundant nutrient in medium, cause the mycelia growth was high production at highest medium volume.
• However, should consider the shaking speed at the same time, because agitation was important factor of the mixture of oxygen and nutrient. Agitation or shaking speed in submerged cultivation could affect fungi in several ways; damage to cell structure, morphological change, as well as variations in growth rate and product formation (Papagianni, 2004).
19
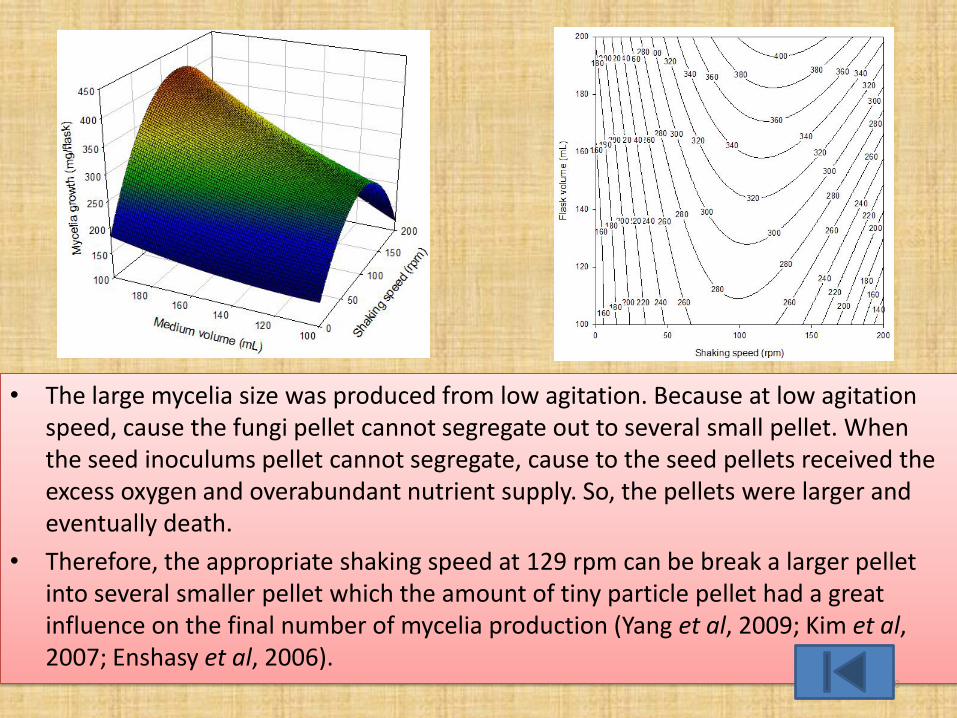
• The large mycelia size was produced from low agitation. Because at low agitation speed, cause the fungi pellet cannot segregate out to several small pellet. When the seed inoculums pellet cannot segregate, cause to the seed pellets received the excess oxygen and overabundant nutrient supply. So, the pellets were larger and eventually death.
• Therefore, the appropriate shaking speed at 129 rpm can be break a larger pellet into several smaller pellet which the amount of tiny particle pellet had a great influence on the final number of mycelia production (Yang et al, 2009; Kim et al, 2007; Enshasy et al, 2006).
20
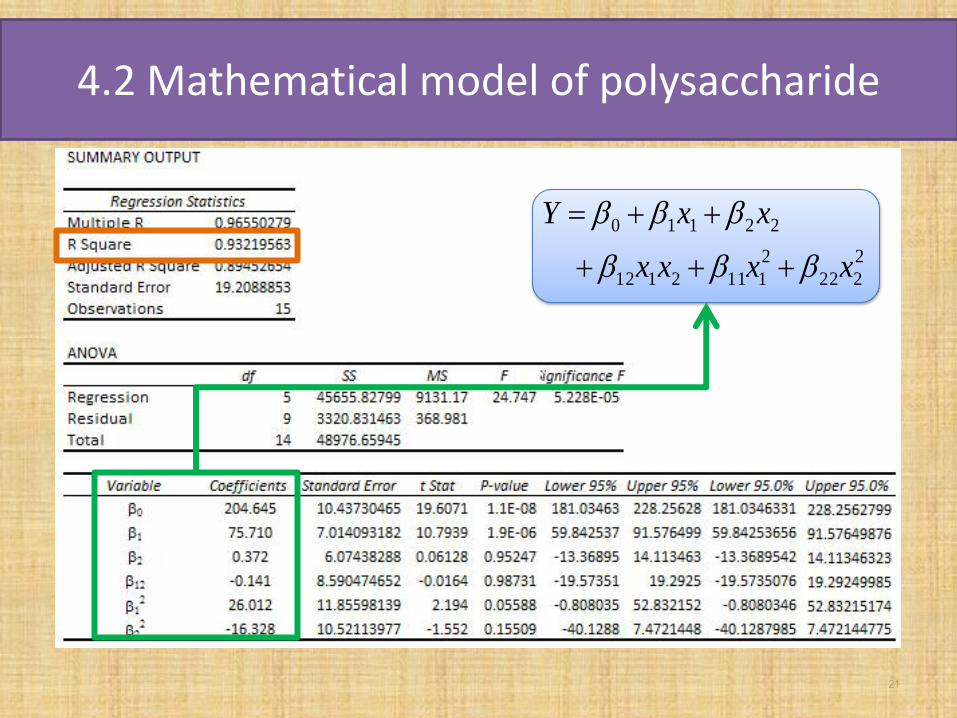
4.2 Mathematical model of polysaccharide
21
2
222
2
1112112
22110
xxxx
xxY
22
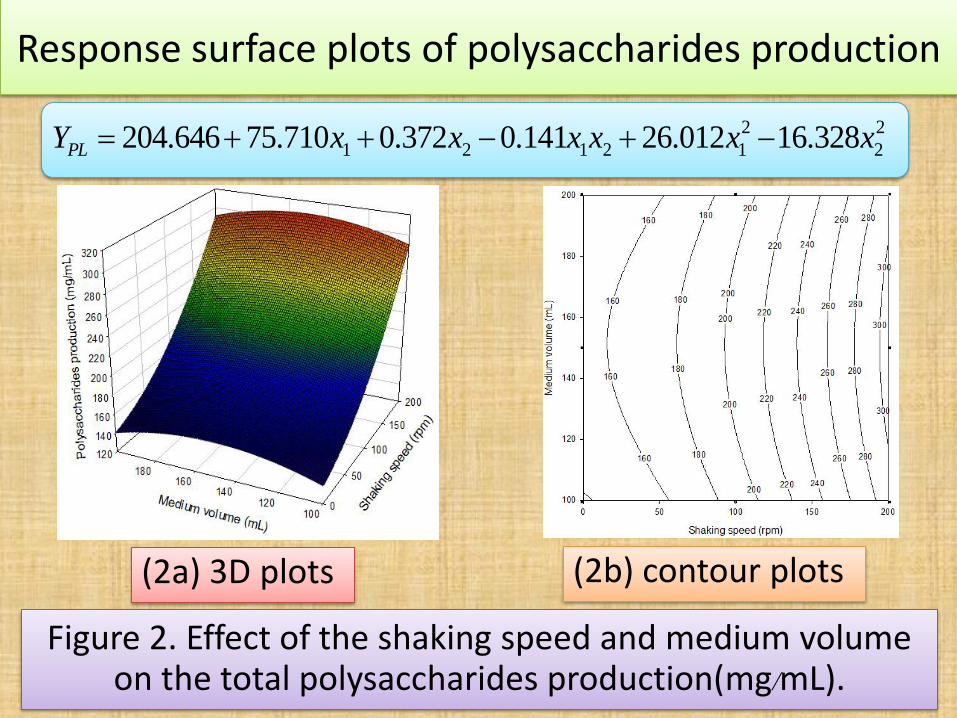
Response surface plots of polysaccharides production
2
2
2
12121 328.16012.26141.0372.0710.75646.204 xxxxxxYPL
(2a) 3D plots (2b) contour plots
Figure 2. Effect of the shaking speed and medium volume on the total polysaccharides production(mg/mL).
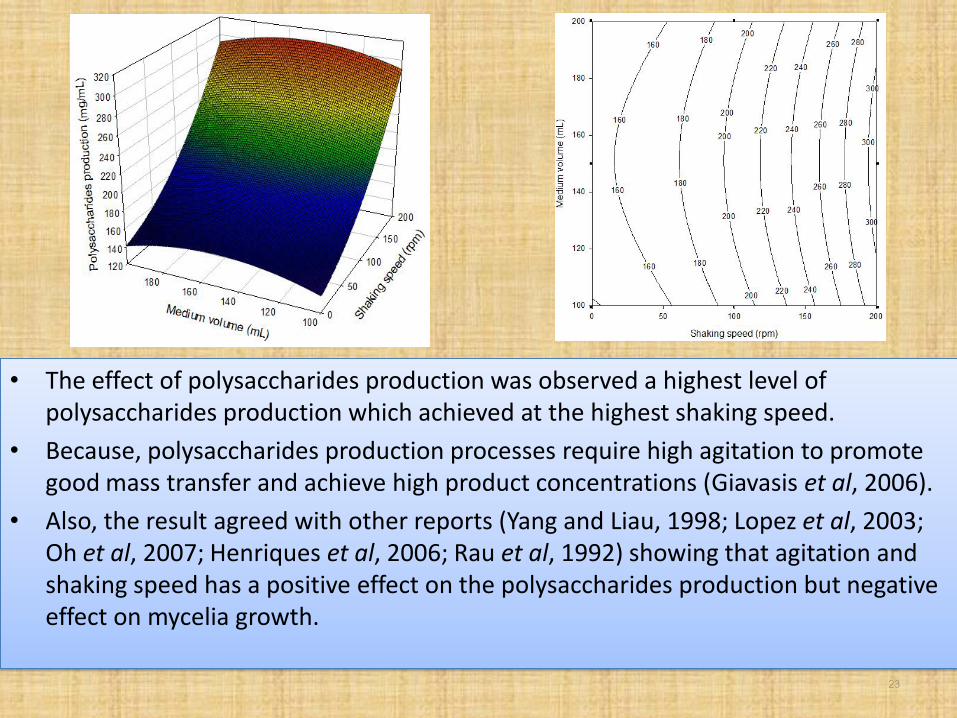
• The effect of polysaccharides production was observed a highest level of polysaccharides production which achieved at the highest shaking speed.
• Because, polysaccharides production processes require high agitation to promote good mass transfer and achieve high product concentrations (Giavasis et al, 2006).
• Also, the result agreed with other reports (Yang and Liau, 1998; Lopez et al, 2003; Oh et al, 2007; Henriques et al, 2006; Rau et al, 1992) showing that agitation and shaking speed has a positive effect on the polysaccharides production but negative effect on mycelia growth.
23
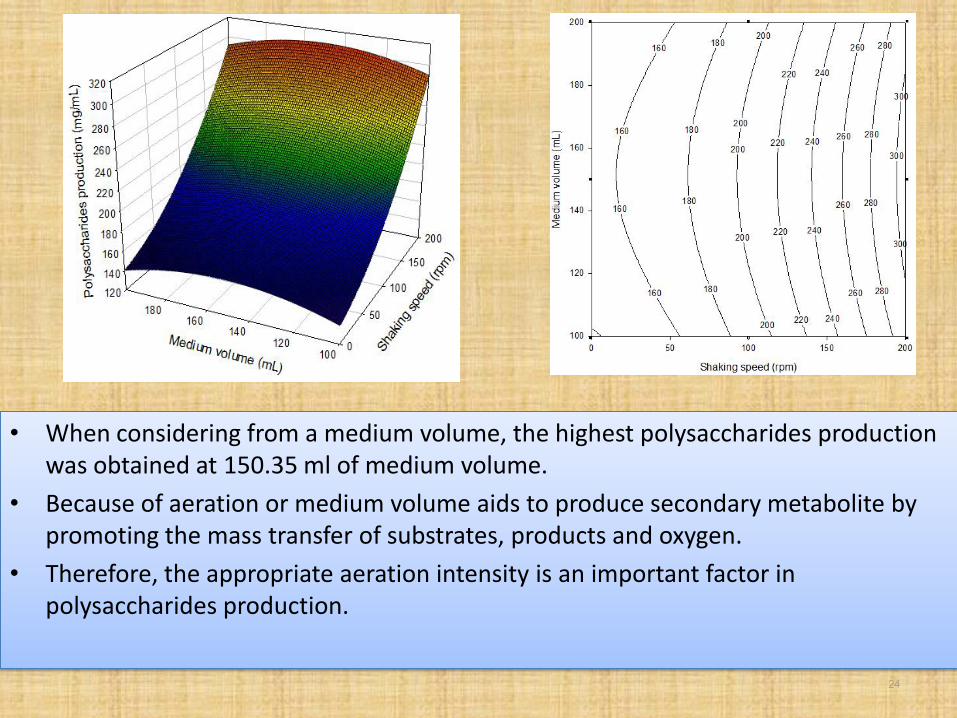
• When considering from a medium volume, the highest polysaccharides production was obtained at 150.35 ml of medium volume.
• Because of aeration or medium volume aids to produce secondary metabolite by promoting the mass transfer of substrates, products and oxygen.
• Therefore, the appropriate aeration intensity is an important factor in polysaccharides production.
24
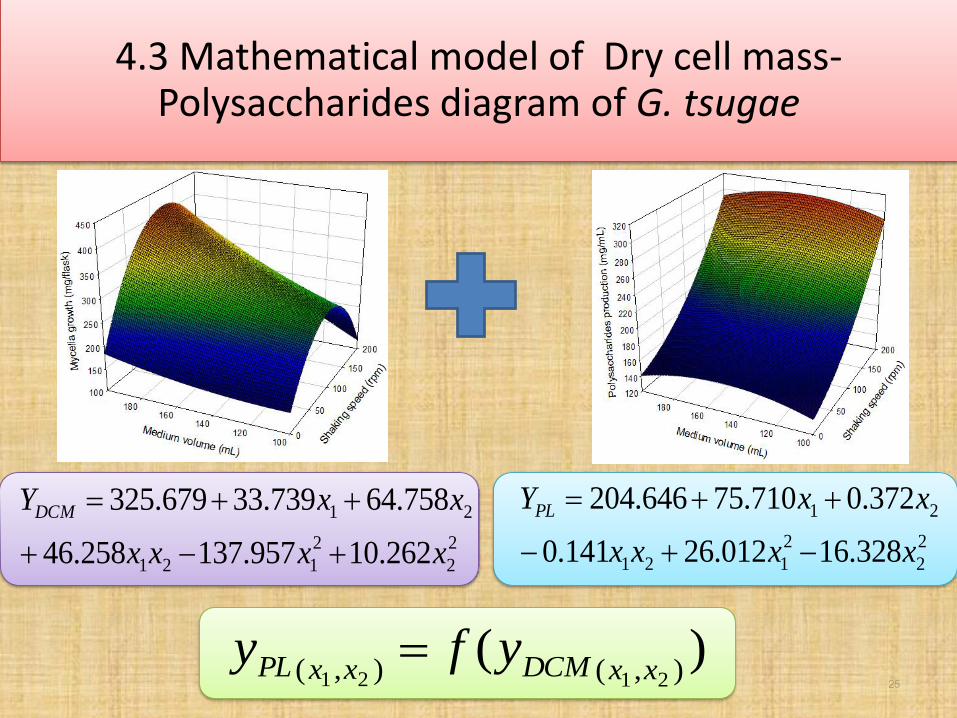
4.3 Mathematical model of Dry cell mass-Polysaccharides diagram of G. tsugae
25
2
2
2
121
21
262.10957.137258.46
758.64739.33679.325
xxxx
xxYDCM
2
2
2
121
21
328.16012.26141.0
372.0710.75646.204
xxxx
xxYPL
)(),(),( 2121 xxDCMxxPL yfy
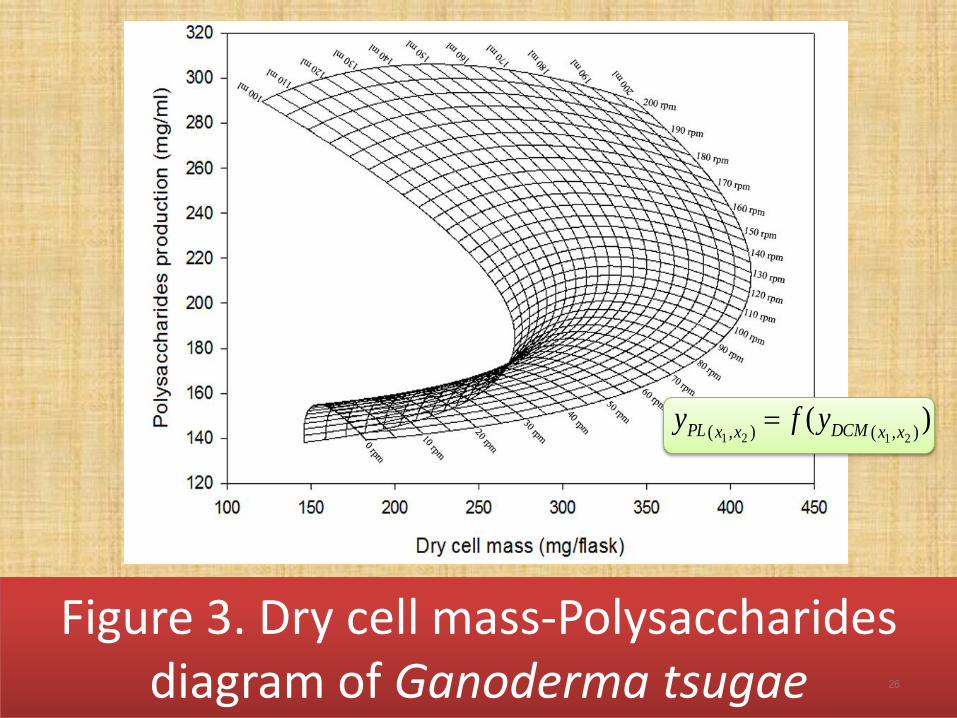
Figure 3. Dry cell mass-Polysaccharides diagram of Ganoderma tsugae 26
)(),(),( 2121 xxDCMxxPL yfy
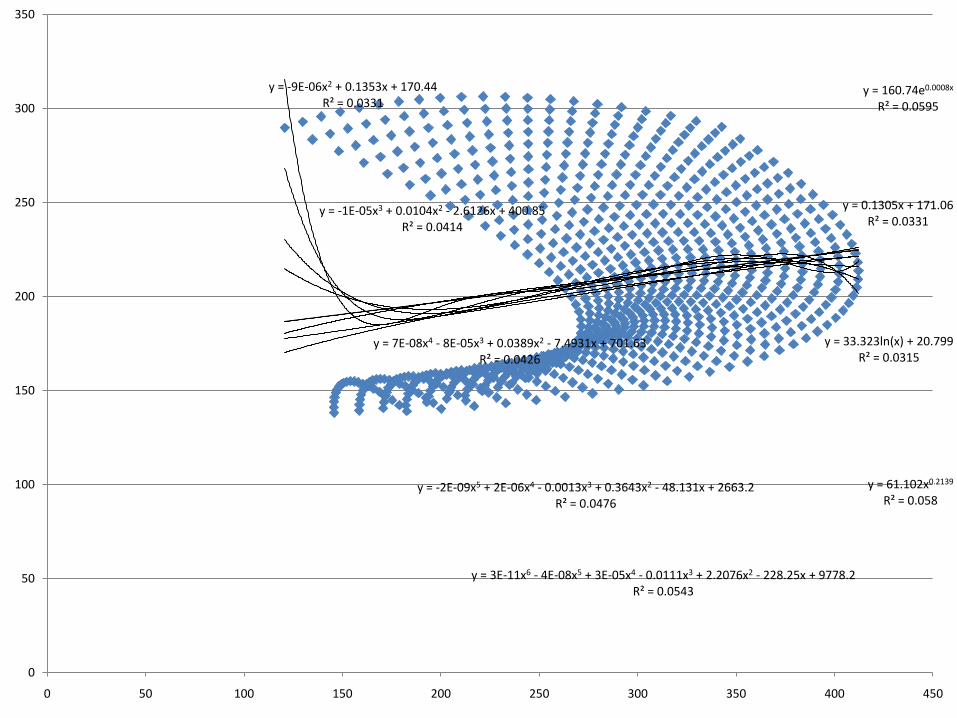
27
y = 160.74e0.0008x
R² = 0.0595
y = 0.1305x + 171.06R² = 0.0331
y = 33.323ln(x) + 20.799R² = 0.0315
y = -9E-06x2 + 0.1353x + 170.44R² = 0.0331
y = -1E-05x3 + 0.0104x2 - 2.6126x + 400.85R² = 0.0414
y = 7E-08x4 - 8E-05x3 + 0.0389x2 - 7.4931x + 701.63R² = 0.0426
y = -2E-09x5 + 2E-06x4 - 0.0013x3 + 0.3643x2 - 48.131x + 2663.2R² = 0.0476
y = 3E-11x6 - 4E-08x5 + 3E-05x4 - 0.0111x3 + 2.2076x2 - 228.25x + 9778.2R² = 0.0543
y = 61.102x0.2139
R² = 0.058
0
50
100
150
200
250
300
350
0 50 100 150 200 250 300 350 400 450
28
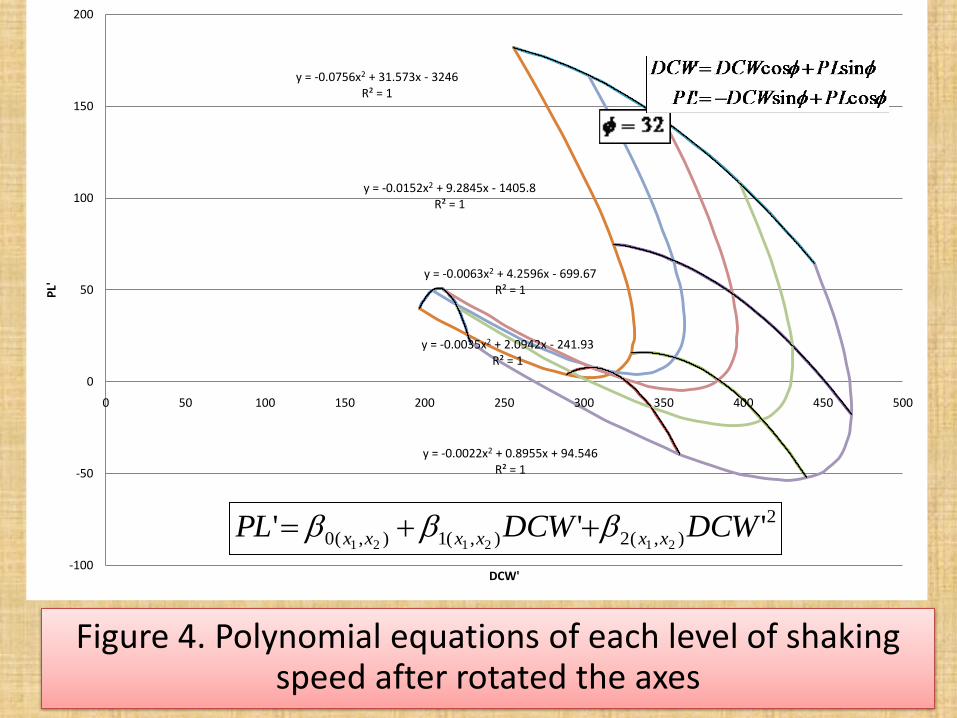
y = -0.0756x2 + 31.573x - 3246R² = 1
y = -0.0152x2 + 9.2845x - 1405.8R² = 1
y = -0.0063x2 + 4.2596x - 699.67R² = 1
y = -0.0035x2 + 2.0942x - 241.93R² = 1
y = -0.0022x2 + 0.8955x + 94.546R² = 1
-100
-50
0
50
100
150
200
0 50 100 150 200 250 300 350 400 450 500
PL'
DCW'
Figure 4. Polynomial equations of each level of shaking speed after rotated the axes
2
),(2),(1),(0 '''212121
DCWDCWPL xxxxxx
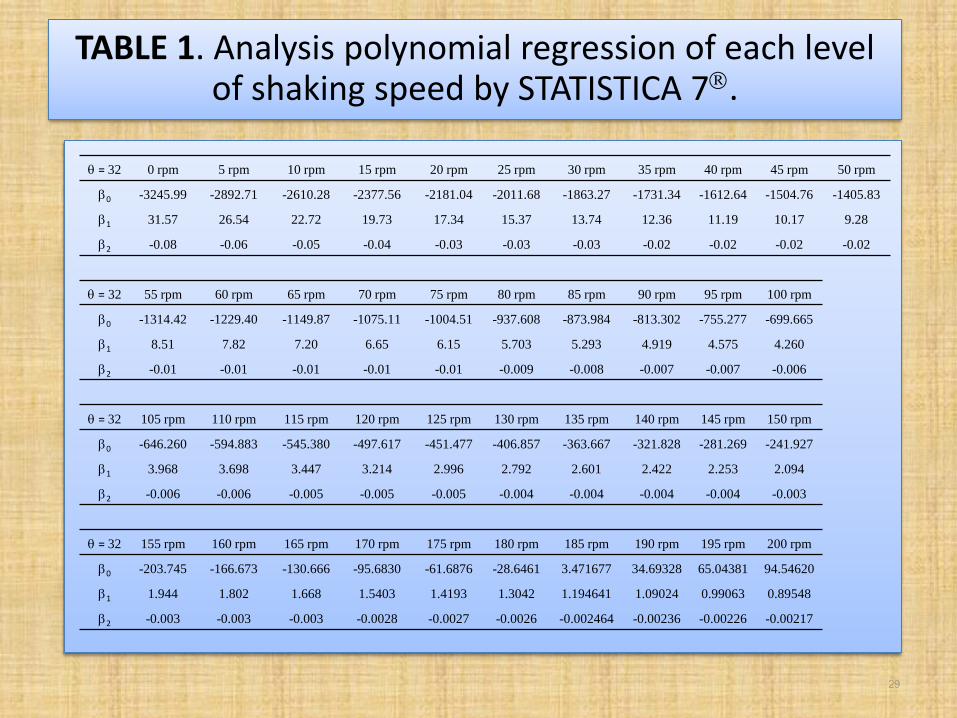
q = 32 0 rpm 5 rpm 10 rpm 15 rpm 20 rpm 25 rpm 30 rpm 35 rpm 40 rpm 45 rpm 50 rpm
0 -3245.99 -2892.71 -2610.28 -2377.56 -2181.04 -2011.68 -1863.27 -1731.34 -1612.64 -1504.76 -1405.83
1 31.57 26.54 22.72 19.73 17.34 15.37 13.74 12.36 11.19 10.17 9.28
2 -0.08 -0.06 -0.05 -0.04 -0.03 -0.03 -0.03 -0.02 -0.02 -0.02 -0.02
q = 32 55 rpm 60 rpm 65 rpm 70 rpm 75 rpm 80 rpm 85 rpm 90 rpm 95 rpm 100 rpm
0 -1314.42 -1229.40 -1149.87 -1075.11 -1004.51 -937.608 -873.984 -813.302 -755.277 -699.665
1 8.51 7.82 7.20 6.65 6.15 5.703 5.293 4.919 4.575 4.260
2 -0.01 -0.01 -0.01 -0.01 -0.01 -0.009 -0.008 -0.007 -0.007 -0.006
q = 32 105 rpm 110 rpm 115 rpm 120 rpm 125 rpm 130 rpm 135 rpm 140 rpm 145 rpm 150 rpm
0 -646.260 -594.883 -545.380 -497.617 -451.477 -406.857 -363.667 -321.828 -281.269 -241.927
1 3.968 3.698 3.447 3.214 2.996 2.792 2.601 2.422 2.253 2.094
2 -0.006 -0.006 -0.005 -0.005 -0.005 -0.004 -0.004 -0.004 -0.004 -0.003
q = 32 155 rpm 160 rpm 165 rpm 170 rpm 175 rpm 180 rpm 185 rpm 190 rpm 195 rpm 200 rpm
0 -203.745 -166.673 -130.666 -95.6830 -61.6876 -28.6461 3.471677 34.69328 65.04381 94.54620
1 1.944 1.802 1.668 1.5403 1.4193 1.3042 1.194641 1.09024 0.99063 0.89548
2 -0.003 -0.003 -0.003 -0.0028 -0.0027 -0.0026 -0.002464 -0.00236 -0.00226 -0.00217
29
TABLE 1. Analysis polynomial regression of each level of shaking speed by STATISTICA 7.
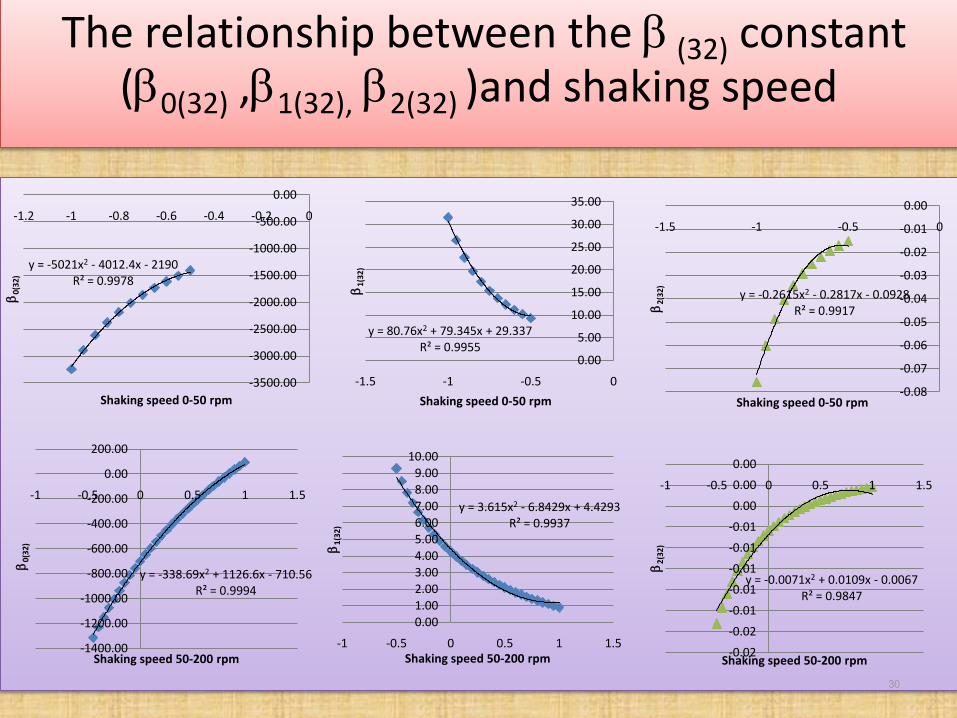
The relationship between the (32) constant(0(32) ,1(32), 2(32) )and shaking speed
30
y = -5021x2 - 4012.4x - 2190R² = 0.9978
-3500.00
-3000.00
-2500.00
-2000.00
-1500.00
-1000.00
-500.00
0.00
-1.2 -1 -0.8 -0.6 -0.4 -0.2 0
0
(32)
Shaking speed 0-50 rpm
y = -338.69x2 + 1126.6x - 710.56R² = 0.9994
-1400.00
-1200.00
-1000.00
-800.00
-600.00
-400.00
-200.00
0.00
200.00
-1 -0.5 0 0.5 1 1.5
0
(32)
Shaking speed 50-200 rpm
y = 80.76x2 + 79.345x + 29.337R² = 0.9955
0.00
5.00
10.00
15.00
20.00
25.00
30.00
35.00
-1.5 -1 -0.5 0
1(
32)
Shaking speed 0-50 rpm
y = 3.615x2 - 6.8429x + 4.4293R² = 0.9937
0.00
1.00
2.00
3.00
4.00
5.006.00
7.00
8.00
9.00
10.00
-1 -0.5 0 0.5 1 1.5
1(
32)
Shaking speed 50-200 rpm
y = -0.2615x2 - 0.2817x - 0.0928R² = 0.9917
-0.08
-0.07
-0.06
-0.05
-0.04
-0.03
-0.02
-0.01
0.00
-1.5 -1 -0.5 0
2(
32)
Shaking speed 0-50 rpm
y = -0.0071x2 + 0.0109x - 0.0067R² = 0.9847
-0.02
-0.02
-0.01
-0.01
-0.01
-0.01
-0.01
0.00
0.00
0.00
-1 -0.5 0 0.5 1 1.5
2
(32)
Shaking speed 50-200 rpm
31
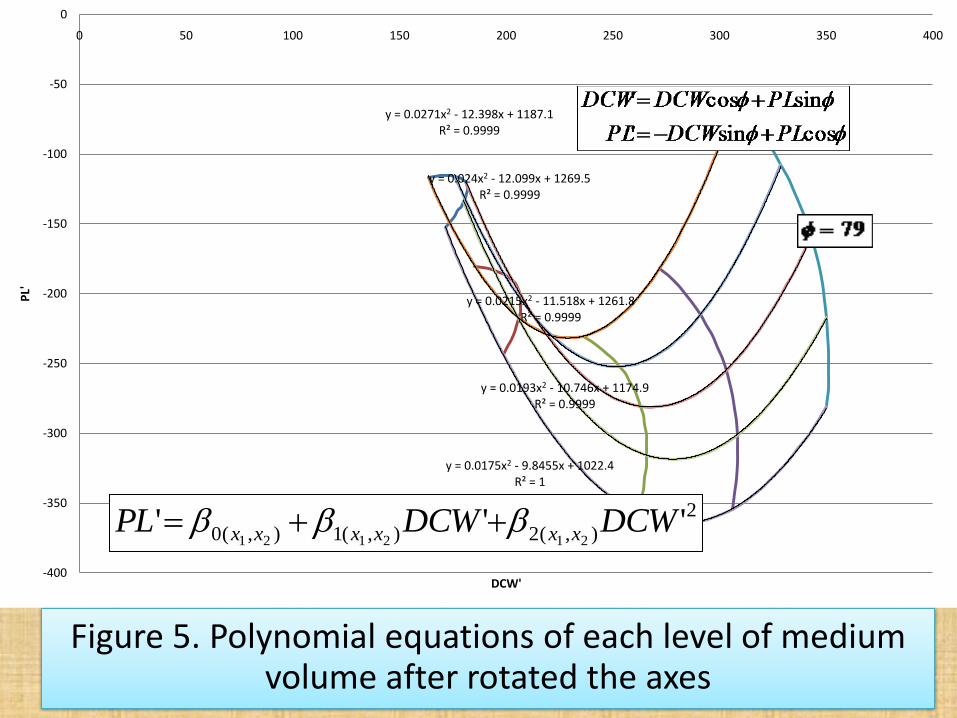
y = 0.0271x2 - 12.398x + 1187.1R² = 0.9999
y = 0.024x2 - 12.099x + 1269.5R² = 0.9999
y = 0.0215x2 - 11.518x + 1261.8R² = 0.9999
y = 0.0193x2 - 10.746x + 1174.9R² = 0.9999
y = 0.0175x2 - 9.8455x + 1022.4R² = 1
-400
-350
-300
-250
-200
-150
-100
-50
0
0 50 100 150 200 250 300 350 400P
L'
DCW'
2
),(2),(1),(0 '''212121
DCWDCWPL xxxxxx
Figure 5. Polynomial equations of each level of medium volume after rotated the axes
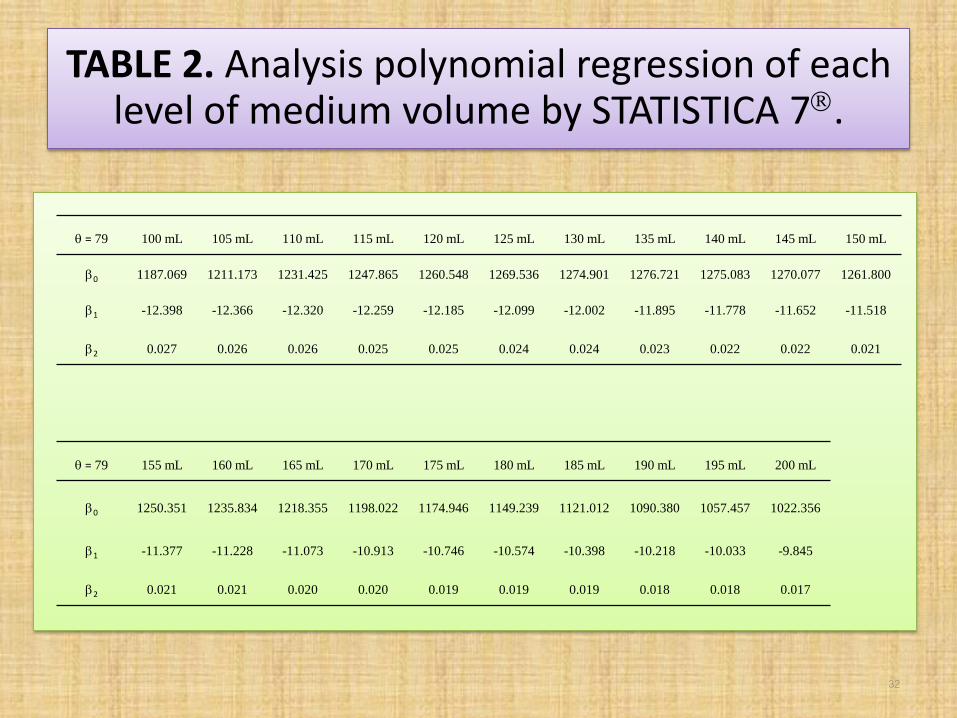
TABLE 2. Analysis polynomial regression of each level of medium volume by STATISTICA 7.
q = 79 100 mL 105 mL 110 mL 115 mL 120 mL 125 mL 130 mL 135 mL 140 mL 145 mL 150 mL
0 1187.069 1211.173 1231.425 1247.865 1260.548 1269.536 1274.901 1276.721 1275.083 1270.077 1261.800
1 -12.398 -12.366 -12.320 -12.259 -12.185 -12.099 -12.002 -11.895 -11.778 -11.652 -11.518
2 0.027 0.026 0.026 0.025 0.025 0.024 0.024 0.023 0.022 0.022 0.021
q = 79 155 mL 160 mL 165 mL 170 mL 175 mL 180 mL 185 mL 190 mL 195 mL 200 mL
0 1250.351 1235.834 1218.355 1198.022 1174.946 1149.239 1121.012 1090.380 1057.457 1022.356
1 -11.377 -11.228 -11.073 -10.913 -10.746 -10.574 -10.398 -10.218 -10.033 -9.845
2 0.021 0.021 0.020 0.020 0.019 0.019 0.019 0.018 0.018 0.017
32
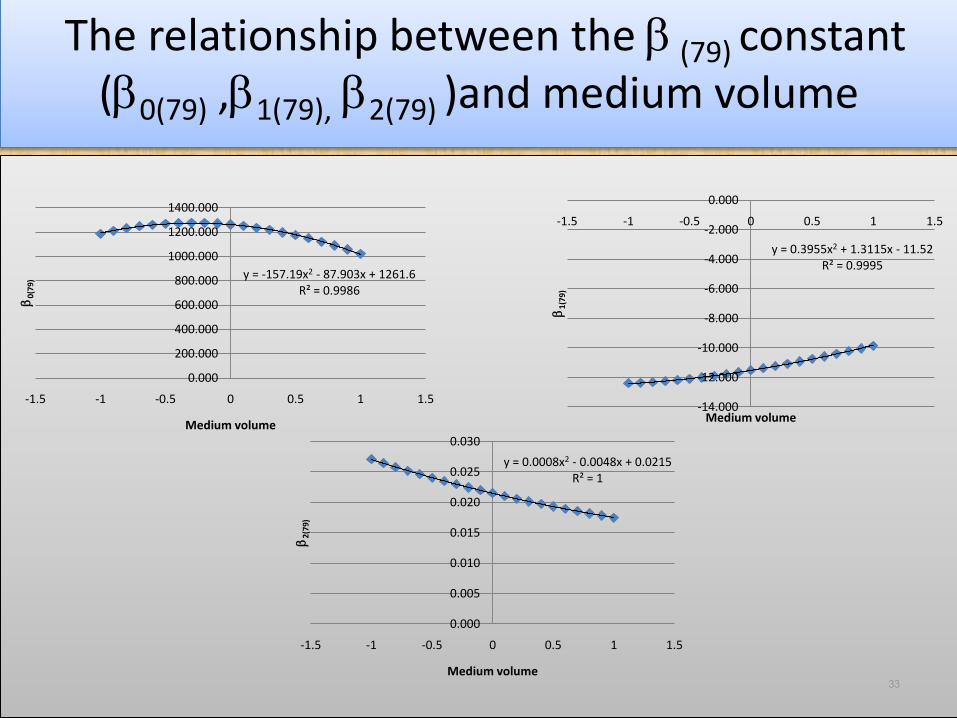
The relationship between the (79) constant(0(79) ,1(79), 2(79) )and medium volume
33
y = -157.19x2 - 87.903x + 1261.6R² = 0.9986
0.000
200.000
400.000
600.000
800.000
1000.000
1200.000
1400.000
-1.5 -1 -0.5 0 0.5 1 1.5
0
(79)
Medium volume
y = 0.3955x2 + 1.3115x - 11.52R² = 0.9995
-14.000
-12.000
-10.000
-8.000
-6.000
-4.000
-2.000
0.000
-1.5 -1 -0.5 0 0.5 1 1.5
1(
79)
Medium volume
y = 0.0008x2 - 0.0048x + 0.0215R² = 1
0.000
0.005
0.010
0.015
0.020
0.025
0.030
-1.5 -1 -0.5 0 0.5 1 1.5
2(
79)
Medium volume
34
1001,1
actualcode
rpmrpmx
503,2
actualcode
meMediumVolumeMediumVolux
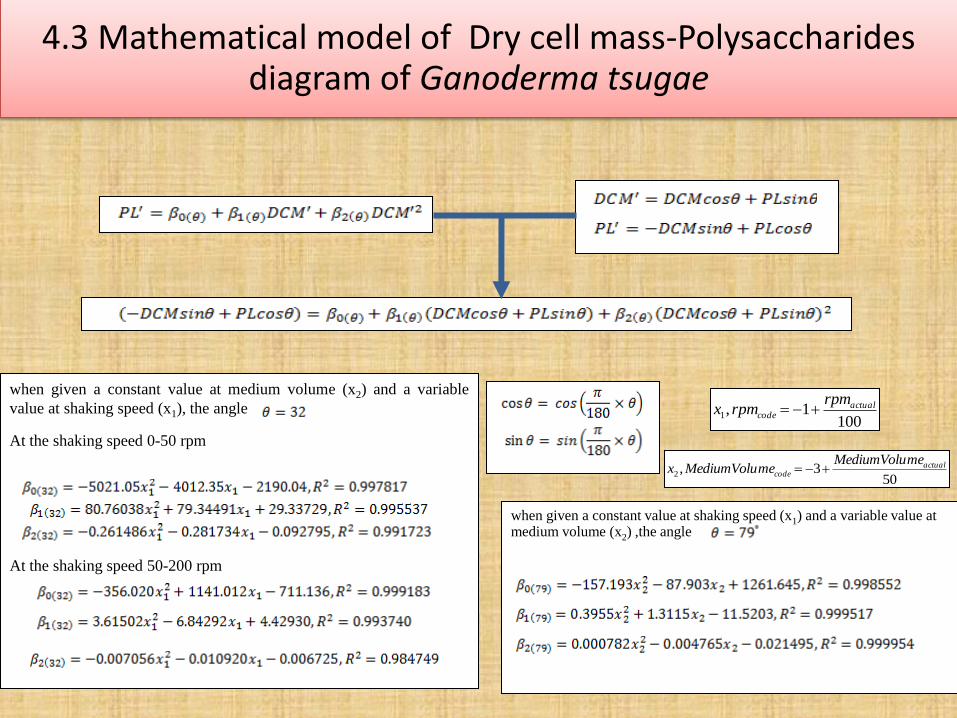
4.3 Mathematical model of Dry cell mass-Polysaccharides diagram of Ganoderma tsugae
when given a constant value at shaking speed (x1) and a variable value at medium volume (x2) ,the angle
when given a constant value at medium volume (x2) and a variable
value at shaking speed (x1), the angle
At the shaking speed 0-50 rpm
At the shaking speed 50-200 rpm
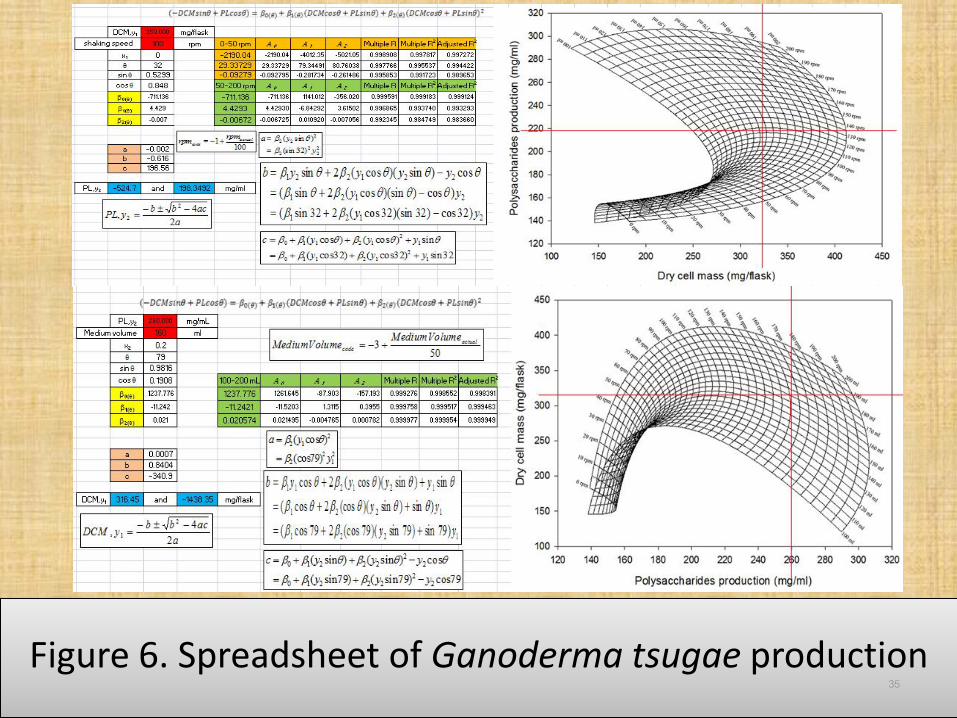
Figure 6. Spreadsheet of Ganoderma tsugae production35
5. CONCLUSIONS
• Mathematical model of the process parameters for controlling theGanoderma tsugae production by response surface methodology is anappropriate tool for evaluating those variable parameters to look for asuitable outcome from a submerge fermentation process mathematically andstatistically.
• Mycelia growth requires the appropriate agitation to break up the large pelletwhich the broken pellets were used to reseed the formation of new pellet forincreasing the mycelia production and highest medium volume to supply thenutrient consumption.
• Polysaccharides production requires the highest agitation and appropriateaeration for encourage the good mass transfer of substrates, products andoxygen.
36
5. CONCLUSIONS
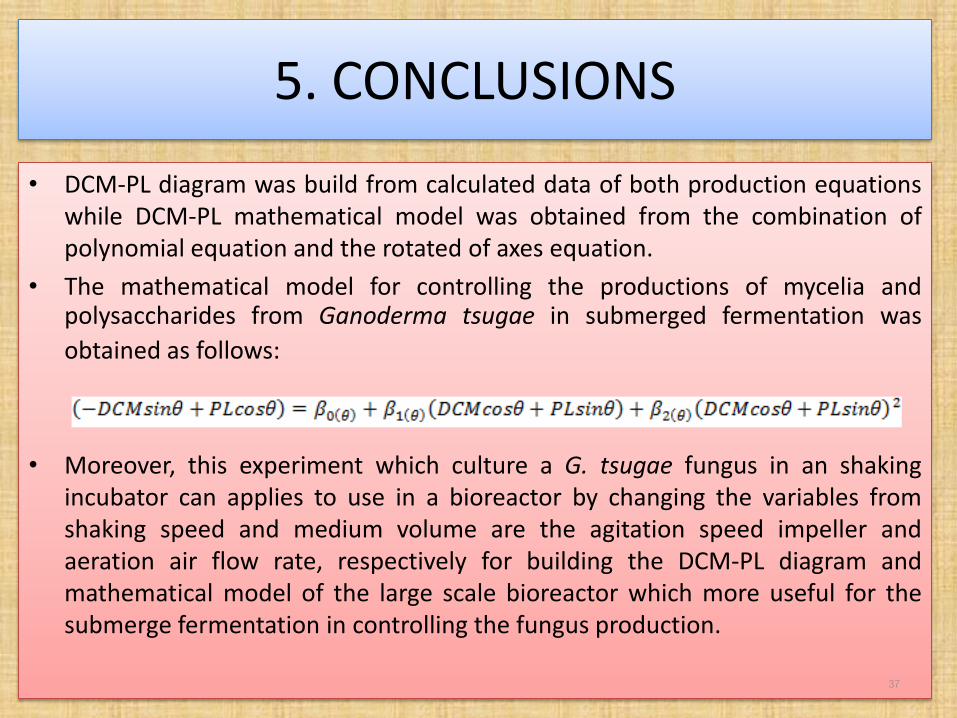
• DCM-PL diagram was build from calculated data of both production equationswhile DCM-PL mathematical model was obtained from the combination ofpolynomial equation and the rotated of axes equation.
• The mathematical model for controlling the productions of mycelia andpolysaccharides from Ganoderma tsugae in submerged fermentation was
obtained as follows:
• Moreover, this experiment which culture a G. tsugae fungus in an shakingincubator can applies to use in a bioreactor by changing the variables fromshaking speed and medium volume are the agitation speed impeller andaeration air flow rate, respectively for building the DCM-PL diagram andmathematical model of the large scale bioreactor which more useful for thesubmerge fermentation in controlling the fungus production.
37
• Cui, Y.Q., R.G.J.M. van der Lans and K.C.A.M. Luyben. 1997. Effect of agitation intensities on fungal morphology of submerged fermentation. Biotechnology and Bioengineering, 55: 715-6.
• Duta, F.P., F.P. Franca and L.M. Almeida. 2006. Optimization of culture conditions for exopolysaccharides production in Rhizobuim sp. using the response surface method. Electronic Journal of Biotechnology, ISSN: 0717-3458.
• Enshasy H.E., J. Kleine and U. Rinas. 2006. Agitation effects on morphology and protein productive fractions of filamentous and pelleted growth forms of recombinant Aspergillus niger. Process Biochemistry, 41: 2103-12.
• Gao, H. and W.Y. Gu. 2007. Optimization of polysaccharide and ergosterol production from Agaricus brasiliensis by fermentation process. Biochemical Engineering Journal, 33: 202-10.
• Giavasis, I., L.M. Harvey and B. McNeil. 2006. The effect of agitation and aeration on the synthesis and molecular weight of gellan in batch cultures of Sphingomonas paucimobilis. Enzyme and Microbial Technology, 38: 101-8.
• Henriques A.W.S., E. Jessouroun, E.L. Lima and T.L.M. Alves. 2006. Capsular polysaccharide production by Neisseria meningitidesserogroup C: Optimization of process variables using response surface methodology. Process Biochemistry, 41: 1822-8.
• Huang, H.C. and Y.C. Liu. 2008. Enhancement of polysaccharide production by optimization of culture conditions in shake flask submerged cultivation of Grifola umbellata. Journal of the Chinese Institute of Chemical Engineers, 39: 307-11.
• Kapat, A., Jung, J.K., Park, Y.H., Hong, S.Y. and Choi, H.K. 1998. Effect of agitation and aeration on the production of extracellular glucose oxidase from a recombinant Saccharomyces cerevisiae. Bioprocess Engineering, 18: 347-351.
• Kim S.W., H.J. Hwang, B.C. Lee and J.W. Yun. 2007. Submerged production and characterization of G. frondosa polysaccharides -a new application to cosmeceuticals. Food Technology and Biotechnology, 45: 295-305.
• Lee B.C., J.T. Bae, H.B. Pyo, T.B. Choe, S.W. Kim, H.J. Hwang and J.W. Yun. 2004. Submerged culture conditions for the production of mycelia biomass and exopolysaccharides by the edible Basidiomycete Grifola frondosa. Enzyme and Microbial Technology, 35: 369-76.
• Lopez E., I. Ramos and A. Sanroman. 2003. Extracellular polysaccharides production by Arthrobacter viscosus. Journal of Food Engineering, 60: 463-7.
• Liu, R.S., D.S. Li, H.M. Li and Y.J. Tang. 2008. Response surface modeling the significance of nitrogen source on the submerge cultivation of Chinese truffle Tuber sinense. Process Biochemistry, 43: 868-76.
• Mau, J.L., S.Y. Tsai, Y.H. Tseng and S.J. Huang. 2005. Antioxidant properties of hot extracts from Garnoderme tsugae Murrill. LWT Food Science and Technology, 38: 589-97. 38
6. REFERENCES
• Muthukumar M, D. Mohan and M. Rajendran. 2003. Optimization of mix proportions of mineral aggregates using Box-Behnkendesign of experiments. Cement and Concrete Composites, 25: 751-8.
• Oh J.Y., E.J. Cho, S.H. Nam, J.W. Choi and J.W. Yun. 2007. Production of polysaccharide–peptide complexes by submerged mycelial culture of an entomopathogenic fungus Cordyceps sphecocephala. Process Biochemistry, 42: 352–62.
• Oscar S.C., S.C. Gerardo, L.P.H. Jose, G.R. Mariano and F.T. Ernesto. 1999. Effect of substrate composition on the mycelial growth of Pleurotus ostreatus: an analysis by mixture and response surface methodologies. Process Biochemistry, 35: 127-33.
• Papagianni M. 2004. Fungal morphology and metabolite production in submerged mycelial processes. Biotechnology Advances, 22: 189-259.
• Rau U.,E. Gura, E. Olszewski and F. Wagner. 1992. Enhanced glucan formation of filamentous fungi by effective mixing, oxygen limitation and fed-batch processing. Journal of Industry Microbiology, 9: 19-26.
• Rusell R. and M. Paterson. 2006. Ganoderma - A therapeutic fungal biofactory. Phytochemistry, 67:1985-2001.
• Shih I.L., C.Y. Kuo, F.C. Hsieh, S.S. Kao and C. Hsiesh. 2008. Use of surface response methodology to optimize culture conditions for iturin A production by Bacillus subtilis in solid-state fermentation. Journal of the Chinese Institute of Chemical Engineers, 39: 635-43.
• Stephen A.M., G.O. Phillips and P.A. Williams. 2006. Food polysaccharides and their applications, p. 677-99. Taylor & Francis
Group, 2nd (ed.), New York.
• Tseng Y.H., J.H. Yang and J.L. Mau. 2008. Antioxidant properties of polysaccharides from Garnoderme tsugae. Food Chemistry, 107: 732-8.
• Wang Y.X. and Z.X. Lu. 2005. Optimization of processing parameters for the mycelia growth and extracellular polysaccharide production by Boletus spp. ACCC 50328. Process Biochemistry, 40: 1043-51.
• Xu H., L.P. Sun, Y.Z. Shi, Y.H. Wu, B. Zhang and D.Q. Zhao. 2008. Optimization of cultivation conditions for extracellular polysaccharide and mycelium biomass by Morchella esculenta As51620. Biochemical Engineering Journal, 39: 66-73.
• Yang F.C. and C.B. Liau. 1998. The influence of environmental conditions on polysaccharides formation by Ganoderma lucidum in submerged cultures. Process Biochemistry, 33: 533-47.
• Yang F.C., M.J. Yang and S.H. Cheng. 2009. A novel method to enhance the mycelia production of Ganoderma lucidum in submerged cultures by polymer additives and agitation strategies. Journal of the Taiwan Institute of Chemical Engineers, 40: 148-54.
• Zhang C., D. Fan, L. Shang, X. Ma, Y. Luo, W. Xue and P. Gao. 2010. Optimization of fermentation process for human-like collagen production of recombinant Escherichia coli using response surface methodology. Chinese Journal of Chemical Engineering, 18: 137-42.
39
7. ACKNOWLEDGMNTS
• This research work was financially supported byNational Pingtung University of Science andTechnology.
• The authors would like to thank Dr. Chiu-HsaiChiu to lend the shaking incubator of herlaboratory and Wei-Ting Tseng, Wen-Cheng Wu,Jessie Chin-Siang Tze and Lin-Cheng Chen forthem help in doing experimental work.
40

Thank you for your attention 41