Embed Size (px)
Citation preview

Study Relating to Used Cooking Oil
Generation and Biodiesel Production Incentives in the County of Hawai`i
Study conducted by the Solid Waste Division of the Department of Environmental Management, County of Hawai`i under a grant from the State of Hawai`i, Department of Business, Economic
Development and Tourism, Strategic Industries Division
December 2004

The United States Department of Energy provided funds for this report under Cooperative Agreement No. DE-FC51-02R021318. This report was prepared as an account of work sponsored by the United States Government. Neither the United States Government nor any agency thereof, nor any of its employees, makes any warranty, express or implied, or assumes any legal liability or responsibility for the accuracy, completeness, or usefulness of any information, apparatus, product, or process disclosed, or represents that its use would not infringe privately owned rights. Reference herein to any specific commercial product, process, or service by trade name, mark, manufacturer, or otherwise, does not necessarily constitute or imply its endorsement, recommendation, or favoring by the United States Government or any agency thereof. The views and opinions of the authors expressed herein do not necessarily state or reflect those of the United States Government or any agency thereof.

Table of Contents
Executive Summary ………………………………………………………... 1
Methodology ………………………………………………………... 4
Survey Responses ………………………………………………………... 6
Analysis ………………………………………………………... 20
Projection ………………………………………………………... 27
Appendices
Appendix A: Methodology
Appendix B: Survey
Appendix C: Recipients
Appendix D: Data Compilation
Appendix E: County Legislation - Kauai
Appendix F: County Legislation - Maui
Appendix G: County Legislation - Oahu
Appendix H: State Incentives
Appendix I: National Policy

Executive Summary:
With the assistance of University of Hawai`i at Hilo students, the Solid Waste Division of the Department of Environmental Management of the County of Hawai`i conducted a mail-telephone survey of food handling establishments to determine the overall disposal of used cooking oil on the island and if the market could support biodiesel production. The results of the survey showed that approximately 60% of respondents employ some method of recycling or re-use of their used cooking oil resulting in an estimated 5,600 gallons per month diverted from the County’s landfills. Approximately 21% of establishments, representing collection of 2,000 gallons per month, employ Pump Truck Services to dispose of their used cooking oil/grease trap waste. Approximately 15% of establishments either dispose of their used cooking oil directly into their solid waste trash or by dumping it into their septic/wastewater systems. While the number of establishments using these methods was substantial, the actual volume of oil disposed by these methods was small - approximately 300 gallons per month. Survey respondents, who were either recycling used cooking oil or willing to recycle if costs were comparable to or less than other forms of disposal, were the establishments that served the greatest number of meals and purchased the most cooking oil. Although 31% of non-recycling respondents perceived that recycling used cooking was too costly, the results of the research indicate that recycling of the used cooking oil is less expensive than permitted disposal at landfills. Another survey observation was that there is a small group of private recyclers responsible for diverting small amounts of used cooking oil from commercial establishments for use as fuel in their own vehicles.
The research presented in this report was compiled during the calendar year 2004. It represents a baseline of information regarding the generation of used cooking oil by commercial establishments in the County of Hawai`i, as well as a compilation of existing data on the land disposal and diversion of used cooking oil to the production of biodiesel. Also included is information about legislation passed by other Counties in Hawai`i, State of Hawai`i legislation, and Federal legislation directed at the promotion of a biodiesel industry as a mean of recycling waste oil.
The survey was conducted on commercial establishments and the data compiled under the oversight of the Solid Waste Division staff at the Department of Environmental Management, County of Hawai`i. University of Hawai`i at Hilo students, Brittany Smart and Christopher Chin Chance assisted with this research. C3 Consulting was contracted to assist with the compilation and reporting of the data. RESEARCH FINDINGS:
• Response rate for the survey of commercial eating establishments was 45.5%. The data procured from these establishments was provided voluntarily and no certified weight scales or other measurements were provided to verify quantities.
• It was reported that approximately 380 tons of used cooking oil a year are disposed
by the survey respondents. Although the results of the survey cannot be considered
1

statistically significant due to a variation in response rates for individual questions, given the overall response rate, we can estimate that more than 800 tons of waste oil a year are being generated by the target population.
• The businesses serving the most meals and purchasing the largest quantities of
cooking oil showed the greatest interest in recycling the oil provided the costs are less than other forms of disposal.
• Information collected from the industry indicated that the average price per gallon
paid by establishments to have used cooking oil collected and recycled into biodiesel was $1.13. The costs to businesses to have used cooking oil collected and delivered to the West Hawai`i Sanitary Landfill, which is the only facility on the Big Island to accept and properly process waste oil for land disposal, averaged $1.91 per gallon.
• Data collected from the County of Hawai`i’s diversion grant program, landfill
disposal records and data provided from off-island biodiesel production companies collecting direct from customers for off-island processing indicates 424 tons of waste oil were tracked to proper disposal and recycling methods for FY 2003-4.
• Data provided by the biodiesel industry operating in conjunction with diversion
programs in the County of Maui indicated that over 900 tons of used cooking oil were received in the last calendar year. Given that the 2003 population statistics for the Counties of Maui and Hawai`i were 135,605 and 158,423 respectively, and the fact that Maui County experiences a higher visitor count, it is presumed that the volume of used cooking oil in Hawai`i County would be similar to Maui County. Maui County has actively pursued the diversion of used cooking oil over the last five years and due to the maturity of the Maui diversion program, is likely capturing most of the used cooking oil generated in that County.
• Given the comparative data from Maui County and the estimates derived from our
survey, it is projected that somewhere between 320 to 475 tons of used cooking oil are being generated in Hawai`i County and are being improperly disposed. Recent anecdotal evidence of illegal disposal practices by two companies operating in Hawai`i County indicates that illegal land disposal of waste oil may be a significant problem.
ACTIONS TO PROMOTE BIODIESEL PRODUCTION:
• Conduct a request for proposals (RFP) to divert used cooking oil and other organics from the island’s waste stream. (Completed 2003)
• Increase the diversion grants from $40/ton to $60/ton based on information obtained
from the RFP process. (Completed 2004)
2

• As carried out in other counties, initiate legislation to waive the County fuel tax on diesel fuels containing 20% or greater biodiesel. (TBA)
• Pass legislation at the County level requiring the use of grease trap interceptors for
all waste oil generators and strictly monitor compliance. (TBA) • Implement receiving stations for used cooking oil drop-off on each side of the
island. (TBA) • Educate the population of Hawai`i County about the benefits of recycling used
cooking oil and the negative impacts to the environment of improper disposal. (Proposed 2nd round of funding from DBEDT)
• Educate the target population of waste oil generators about the costs and benefits of
recycling used cooking oil and grease trap waste. (Proposed 2nd round of funding from DBEDT)
3

Methodology:
The survey method employed a mail survey sent to the entire population of
commercial food handling establishments with a follow-up telephone interview to
increase the response rate and verify information written on returned surveys. We
obtained a population list from the State of Hawai`i Department of Health – Sanitation
and Food and Drug Branches on food handling establishments that were licensed in the
County of Hawai`i. Establishments that were omitted from the Department of Health
listing for purposes of our survey included: Gas/Convenience stations, school cafeterias,
coffee-only establishments, bars/liquor only establishments, public institutional (i.e.
hospitals, prisons, etc.) eating establishments. These establishments were omitted due to
a determination that their generation of used cooking oil was minimal. We submitted a
draft of our survey to the Department of Business, Economic Development & Tourism
(DBEDT) for approval along with a scope of our purpose. A cover letter explaining the
purpose of the survey, a stamped self addressed envelope and the DBEDT approved
survey were sent to all qualified establishments on our population listing. The final
population-recipient list after the qualified omissions contained 725 commercial food
handling establishments. Upon return of undeliverable surveys, analysis of surveys from
respondents who replied that their businesses were no longer in operation, and multiple
telephone contact attempts resulted in an additional 33 listings being eliminated as “Out-
of-Business” listings. The initial population listing obtained from the State of Hawai`i
Department of Health appeared to have been last updated two years ago and contained
establishments that were no longer in business and multiple wrong addresses; both factors
may have contributed to a higher than anticipated non-response rate to the survey.
4

Surveys were returned to our office and tracked as “complete” or “requiring” follow-up
as some responses lacked complete information. As incomplete surveys were returned,
the students commenced follow-up telephone calls to verify information and obtain more
complete survey responses. Upon reaching the deadline for submission of the surveys the
response rate was below the projected and desired 35% rate. Telephone interviews were
conducted of non-responding establishments and to obtain more complete survey
information from the surveys that had been returned. In order to obtain a relevant
baseline of data on used cooking oil generation, follow-up telephone interviews were
largely conducted on fast food establishments and resorts which were hypothesized to
generate the most used cooking oil. After final mail surveys were returned, initial and
follow-up telephone interviews were completed that resulted in an overall 45.5%
response rate, or 314 responses from a total qualified population of 692. Due to the
variation of response rates for particular questions on the survey instrument and the
uncertainty regarding characteristics of the non-respondents, the results cannot be
considered statistically accurate and are to be used for baseline information only.
5

Survey Responses:
Microsoft Excel and SPSS statistical/data functions were used to analyze the data
obtained from our survey. To more easily understand the following tables, please note
the following definitions and explanations.
1. Valid responses = Total number of responses to that question. (Excludes multiple
responses.)
2. Frequency = Number of records that match the various answer options for the
survey question.
3. Percent = Percentage rate of the valid sample responses to the question.
4. For the frequency distribution tables all Valid response options to the question are
listed on the left hand side and are tallied in rows.
5. For the cross tabulation tables, variables under comparison are listed in the title of
the table with the various response options listed on the left side and top row of
the table and the number of responses and their corresponding percentage rates
are shown for each Valid outcome.
6
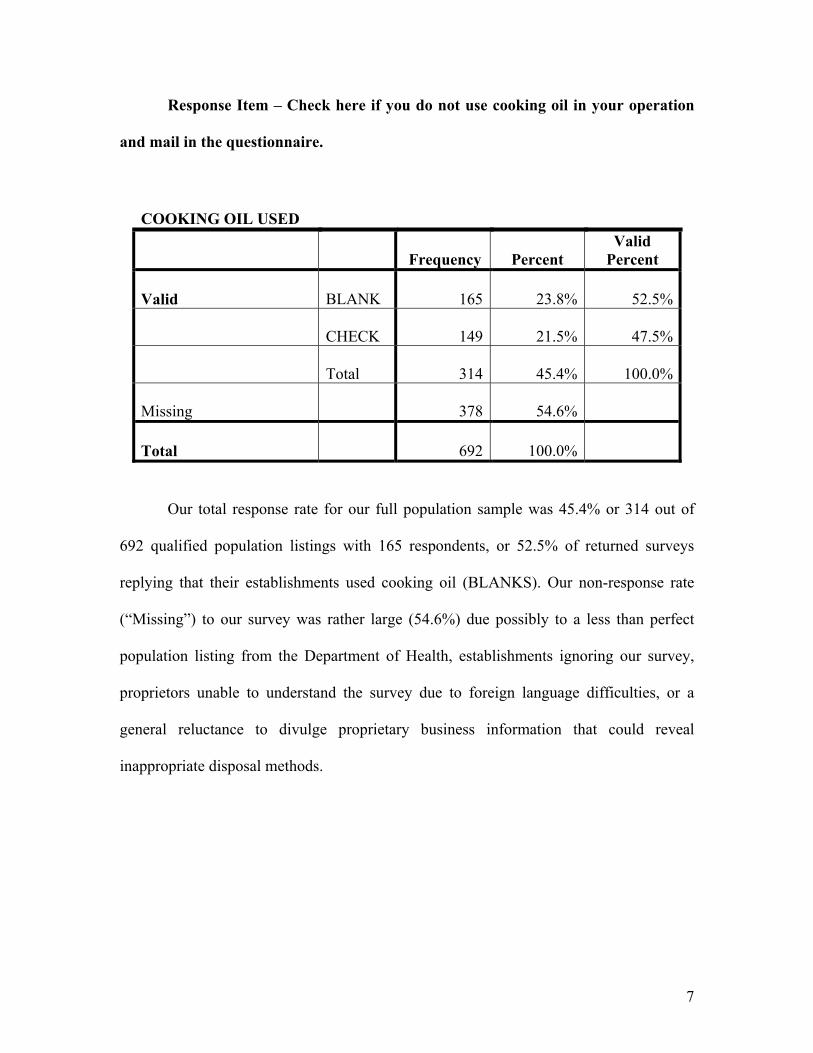
Response Item – Check here if you do not use cooking oil in your operation
and mail in the questionnaire.
COOKING OIL USED
Frequency Percent Valid
Percent
Valid BLANK
165 23.8% 52.5%
CHECK
149 21.5% 47.5%
Total
314 45.4% 100.0%
Missing
378 54.6%
Total
692 100.0%
Our total response rate for our full population sample was 45.4% or 314 out of
692 qualified population listings with 165 respondents, or 52.5% of returned surveys
replying that their establishments used cooking oil (BLANKS). Our non-response rate
(“Missing”) to our survey was rather large (54.6%) due possibly to a less than perfect
population listing from the Department of Health, establishments ignoring our survey,
proprietors unable to understand the survey due to foreign language difficulties, or a
general reluctance to divulge proprietary business information that could reveal
inappropriate disposal methods.
7

Question 1: What type of establishment is it?
EST. TYPE Frequency Percent
DINE-IN YES
110 66.7%
TAKEOUT/DELIVERY YES
88 53.3%
FOOD PRODUCT YES
28 17.0%
RESORT YES
9 5.5%
Total
235 142.4%
Valid
165
The large majority of the food handling establishments in the County of Hawai`i
were DINE-IN facilities, and TAKEOUT/DELIVERY operations were the second most
common response, with many establishments conducting both types of activities. Since
establishments had the option of marking more than one category, the total number of
responses exceeds the Valid number of total survey respondents who answered that they
used cooking oil in their operations.
Question 1A: How many meals does your establishment serve on average
per week?
MEALS/WK Frequency Percent
1 - 349
23 17.8%
350 - 1999
68 52.7%
≥ 2000
38 29.5%
Total
129 100.0%
8
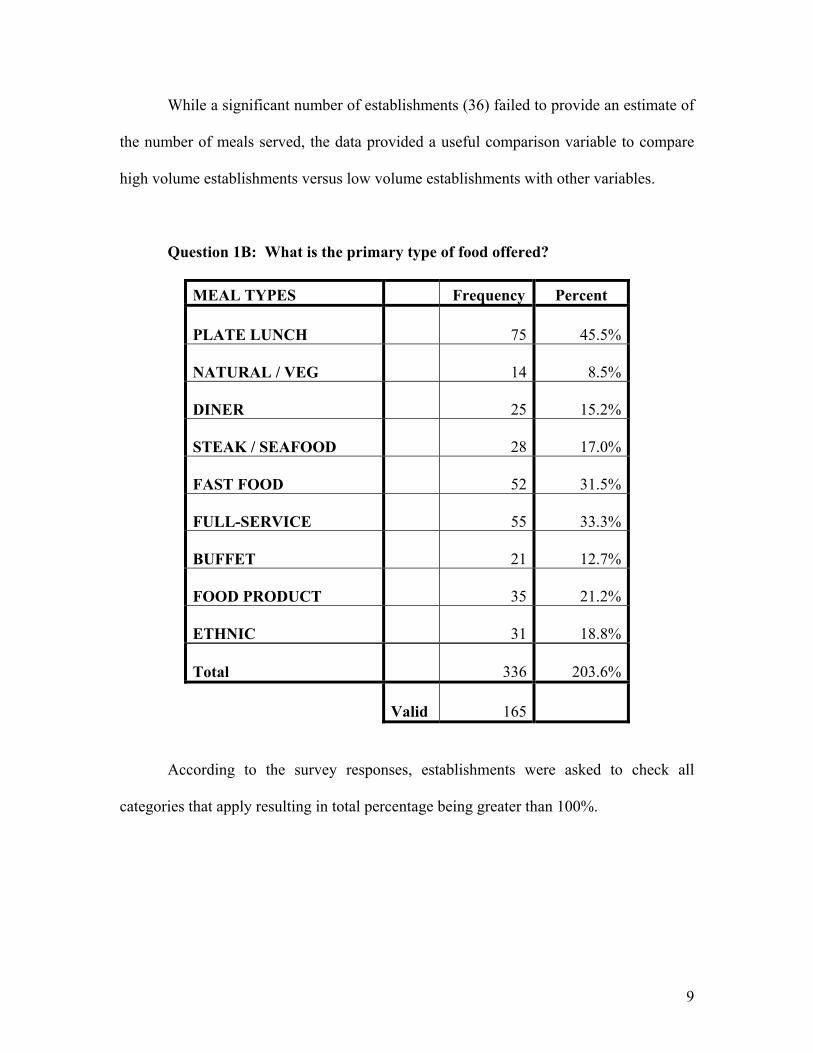
While a significant number of establishments (36) failed to provide an estimate of
the number of meals served, the data provided a useful comparison variable to compare
high volume establishments versus low volume establishments with other variables.
Question 1B: What is the primary type of food offered?
MEAL TYPES Frequency Percent
PLATE LUNCH YES
75 45.5%
NATURAL / VEG YES
14 8.5%
DINER YES
25 15.2%
STEAK / SEAFOOD YES
28 17.0%
FAST FOOD YES
52 31.5%
FULL-SERVICE YES
55 33.3%
BUFFET YES
21 12.7%
FOOD PRODUCT YES
35 21.2%
ETHNIC YES
31 18.8%
Total
336 203.6%
Valid
165
According to the survey responses, establishments were asked to check all
categories that apply resulting in total percentage being greater than 100%.
9

Question 1C: Does your establishment have a grease trap?
GREASE TRAP Frequency Percent
NO
26 16.3%
YES
134 83.8%
Total
160 100.0%
Even though there is no County mandate for food handling establishments that
requires a grease trap in their operations, the responses to our survey indicate most
(83.8%) businesses have one. Legislation proposing a required grease trap for such
establishments is under consideration to prevent costly maintenance of the County’s
wastewater system.
Question 2: How much cooking oil does your establishment purchase
monthly? (Gallons)
OIL – PURCHASED (Gallons/Mo.) Frequency Percent
< 50
88 55.7%
50 – 149
43 27.2%
≥ 150
27 17.1%
Total
158 100.0%
The majority (55.7%) of establishments report that they purchase less than 50
gallons of cooking oil per month, and only a small proportion (17.1%) use cooking oil in
volumes greater than 150 gallons per month.
10

Question 3: How much used cooking oil does your establishment dispose of
monthly? (Gallons)
OIL – DISPOSED (Gallons/Mo.) Frequency Percent
< 50
81 57.9%
50 - 149
45 32.1%
≥ 150
14 10.0%
Total
140 100.0%
As expected, the levels of cooking oil disposed by the establishments are less than
the purchased amount, and according to our survey respondents, over 3,000 gallons per
month are consumed in the food they prepare. Both the OIL-PURCHASED and OIL-
DISPOSED variables will be compared with other variables to extrapolate data that may
be relevant to survey non-responders.
11

Cooking Oil End Products(by volume)
CONSUMED31%
PUMP SVC17%
RECYCLE47%
LIVESTOCK FEED2%
OTHER3%
CONSUMEDPUMP SVCRECYCLEOTHERLIVESTOCK FEED
Question 4: How does your establishment dispose of its used cooking oil?
DISPOSAL METHODS Frequency Percent
RECYCLE CO. YES
59 37.3%
PRIVATE RECYCLE YES
18 11.4%
PIG FARMER, ETC YES
22 13.9%
SW TRASH YES
20 12.7%
DRAIN YES
3 1.9%
PUMP TRUCK YES
34 21.5%
OTHER METHOD YES
2 1.3%
Total
158 100.0%
Valid
165
12

Methods of disposing of an establishment’s used cooking oil varied widely but a
majority (60%) employ some type of recycling or reuse of the byproduct. The results of
this question can be compared to the various establishment types, number of meals
served, and establishment’s reasons for not recycling, to yield information that will
facilitate determination of appropriate incentives to encourage recycling.
Methods of Used Cooking Oil Disposal(by number of establishments)
RECYCLE CO.37%
PRIVATE RECYCLE11%
PIG FARMER & ETC14%
SW TRASH13%
DRAIN2%
PUMP TRUCK22%
OTHER METHOD1%
RECYCLE CO.PRIVATE RECYCLEPIG FARMER & ETCSW TRASHDRAINPUMP TRUCKOTHER METHOD
A critical factor to note here is that the 59 establishments that employ RECYCLE
COMPANIES represent approximately 83% of the actual number of establishments that
recycle by that method according to the RECYCLE COMPANIES’ internal business
records. These response rates indicate that self-selection was a significant factor for
establishments the use RECYCLE COMPANIES compared to establishments that may
employ other methods of disposal.
13

Question 5: If you dispose of your used cooking oil by means of a Pumping
Truck Service, which company is collecting the used cooking oil?
PUMP TRUCK SVC Frequency Percent
West HI Pump Truck Cos. (4)
33 100.0%
Total
33 100.0%
According to the survey responses most of the establishments that use a Pump
Truck Service reside on the Westside of Hawai`i County, and this has been confirmed
with internal Department data from the West Hawai`i Sanitary Landfill. Four Pump
Truck Companies service the Westside with 94% of the establishments utilizing two of
the companies. East Hawai`i Sanitary Landfill does not accept waste oil for disposal.
Question 5A: Do you pay a service fee for the collection of your used cooking
oil? If yes, approximately how much?
SVC FEE$ Frequency Percent PUMP TRUCK FEE < $ 1.00
1 3.0%
$ 1.00 - $ 1.99
22 66.7%
$ 2.00 - $ 2.99
7 21.2%
≥ $ 3.00
2 6.1%
N/E
(no estimate)
1 3.0%
Total
33 100.0%
The results of this question are compared to other disposal methods in the
“Cooking Oil Disposal Volume & Mean Disposal Cost” chart on page 25.
14

Question 6: If you don’t have a recycler pick up your used cooking oil what
are the reason(s) why?
REASONS Frequency Percent
TOO COSTLY YES
13 31.0% NOT ENOUGH STORAGE SPACE YES
7 16.7%
NO STORAGE CONTAINERS YES
8 19.0%
OTHER REASONS YES
30 71.4%
Total
58 138.1%
Valid
42
Establishments were able to answer “Yes” to more than one reason in response to
this question resulting in the greater than 100% cumulative response rate. Too many
surveys were blank in response to this question to make any statistically significant
conclusion as to why establishments did not employ a recycler to dispose of their used
cooking oil. The most common response was in the OTHER category where many of the
establishments were unaware of the opportunity to recycle their used cooking oil. This
lack of information will hopefully be addressed in the follow-up public education
campaign to inform the businesses as well as the public of the recycling opportunities
available to them. Many of the responders to our survey, who already were recycling
their used cooking oil, used this section of the survey to complain about the process of
recycling even though this question did not apply to them, and their responses were thus
not tallied in the above table. The number one complaint cited by establishments that
15
recycle was the cost of recycling. While many of the establishments’ eligible responses
were “Too Costly” to this question and many establishments who recycle complained of
the cost of their current service, it is worthwhile to note that proper disposal of fat, oil,
and grease (FOGs) by means of Pump Truck Services is actually about equal in price per
gallon, and in many cases more expensive, depending on which Recycle Company is
available to service them.
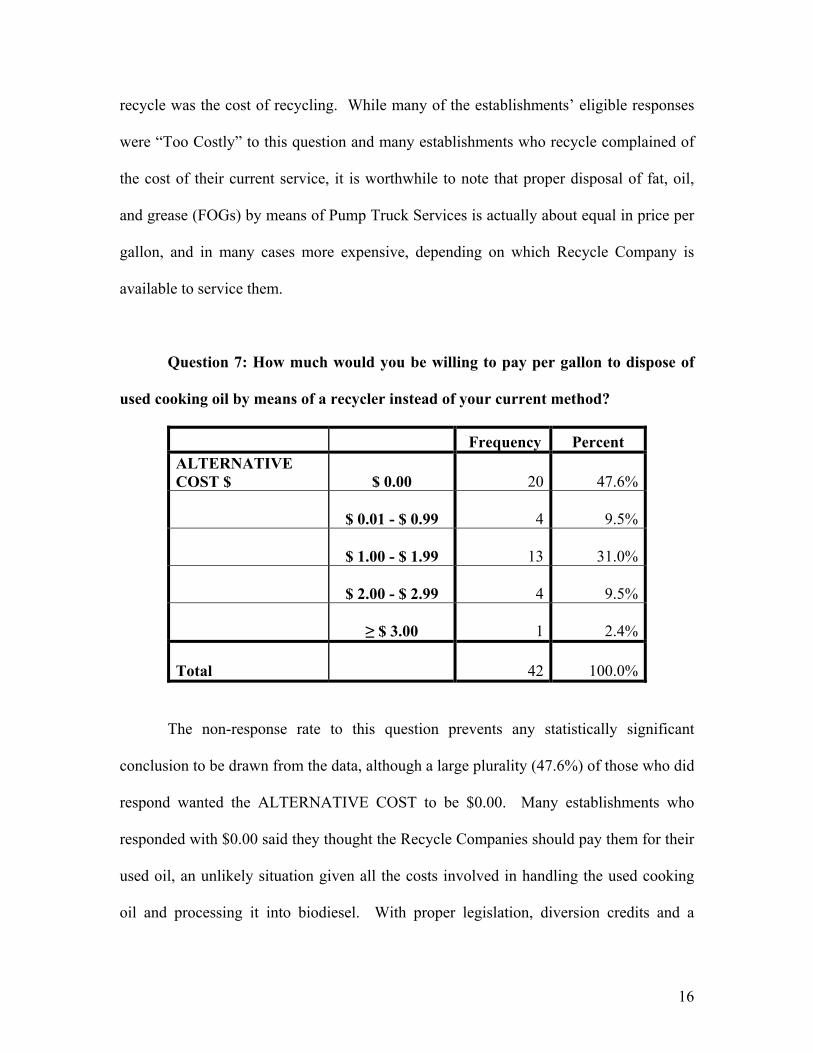
Question 7: How much would you be willing to pay per gallon to dispose of
used cooking oil by means of a recycler instead of your current method?
Frequency Percent ALTERNATIVE COST $ $ 0.00 20 47.6%
$ 0.01 - $ 0.99
4 9.5%
$ 1.00 - $ 1.99
13 31.0%
$ 2.00 - $ 2.99
4 9.5%
≥ $ 3.00
1 2.4%
Total
42 100.0%
The non-response rate to this question prevents any statistically significant
conclusion to be drawn from the data, although a large plurality (47.6%) of those who did
respond wanted the ALTERNATIVE COST to be $0.00. Many establishments who
responded with $0.00 said they thought the Recycle Companies should pay them for their
used oil, an unlikely situation given all the costs involved in handling the used cooking
oil and processing it into biodiesel. With proper legislation, diversion credits and a
16

biodiesel production facility on the Big Island, it may be possible to reduce the costs to
businesses to recycle their used cooking oil.
Question 8: Which reason(s) would convince you to consider recycling your
establishment’s used cooking oil?
REASONS Frequency Percent
ENVIRONMENT YES
44 81.5%
ALTERNATIVE FUEL YES
49 90.7%
LANDFILL SPACE YES
40 74.1%
ILLEGAL DRAIN YES
30 55.6%
Total
163 301.9%
Valid
54
The responses to this question yielded a fairly even distribution for the listed
reasons: It is environmentally friendly; it is used to produce locally made alternative
fuel, which reduces dependency on foreign oil; it conserves our declining landfill space;
it becomes illegal to dispose of used cooking oil down the drain. Many surveys cited
more than one reason which resulted in the Total exceeding the 54 survey responses to
this question, and the percentage exceeding 100%.
Question 9: If you dispose of your cooking oil by means of a recycling
company, which company is collecting the used cooking oil?
17

RECYCLERS Frequency Percent Diversion Grant Program Participants
42 54.5%
Biodiesel Producers
15 19.5%
Other/Private Individuals
14 18.2%
Unknown/No Name Given
6 7.8%
Total
77 100.0%
The companies that participate in the County of Hawaii’s Diversion Grant
Program together collect from 54.5% of the establishments that recycle. Another 19.5%
of establishments have their used cooking oil directly shipped to Biodiesel Producers.
The Diversion Grant Program Participants and the Biodiesel Producers together collect
approximately 82% of the recycled used cooking oil by volume. Another 18.2% of the
establishments responded that Other Users or Private Individuals collected their used
cooking oil for purposes of fuel oil; this represented a much smaller proportion by
volume of the used cooking oil recycled.
Question 9A: Do you pay a service fee for collection of your used cooking
oil? If yes, approximately how much?
18

SVC FEE$ Frequency Percent
RECYCLER FEE < $ 1.00
16 24.2%
$ 1.00 - $ 1.99
27 40.9%
$ 2.00 - $ 2.99
20 30.3%
≥ $ 3.00
1 1.5%
Varies
1 1.5%
N/E
1 1.5%
Total
66 100.0%
While many establishments were able to provide us with reliable costs of their
SERVICE FEES, others were unsure or unaware of the precise per-gallon cost and
provided an estimate. These cost estimates may be influenced by the amounts
respondents are “willing to pay” as ALTERNATIVE COSTS described in Question 7.
Question 10: Do you have any additional comments or suggestions regarding
used cooking oil?
The responses to this question varied with many of the respondents saying that
they supported the concept of recycling used cooking oil and they liked the idea of the
County conducting the survey to gauge the business and public interest. Some
respondents even asked where to obtain the used cooking oil or processed biodiesel for
use in their businesses or for personal use.
19

Analysis:
In order to make projections and discover trends for used cooking oil production
covering the non-respondents and the entire population of food handling establishments,
cross tabulations of variables of interest were attempted. By using the cross tabulation
tables we were able to determine a few trends with respect to volume of cooking oil
purchased/disposed, meals served, cooking oil disposal methods and types of
establishments.
Cross Tabulation of Number of Meals vs. Used Cooking Oil Purchased.
OIL PURCHASED MEALS (per week) Total (Gallons/mo.) 1 - 349 350 - 1999 ≥ 2000
< 50 Count 20 38 8 66 % 95% 57% 22% 53%
50 - 149 Count 1 26 13 40 % 5% 39% 35% 32%
≥ 150 Count 3 16 19 % 0% 4% 43% 15%
Total Count 21 67 37 125 % 100% 100% 100% 100%
Cross Tabulation of Number of Meals vs. Used Cooking Oil Disposed.
OIL DISPOSED MEALS (per week) Total (Gallons/mo.) 1 - 349 350 - 1999 ≥ 2000
< 50 Count 18 40 8 66 % 95% 63% 23% 56%
50 - 149 Count 1 21 17 39 % 5% 33% 49% 33%
≥ 150 Count 2 10 12 % 0% 3% 29% 10%
Total Count 19 63 35 117 % 100% 100% 100% 100%
20

In both cross tabulations of number of MEALS served per week vs. OIL
PURCHASED and DISPOSED, there is a correlation between an increasing number of
meals served and the volume of used cooking oil purchased and disposed.
Cross Tabulation of Number of Meals vs. Used Cooking Oil Disposal Methods.
METHODS OF MEALS Total DISPOSAL 1 - 349 350 - 1999 ≥ 2000
RECYCLE CO. Count 1 22 24 47 % 4% 32% 63% 36%PRIVATE RECYCLE Count 1 10 3 14 % 4% 15% 8% 11%PIG FARMER, ETC Count 3 14 1 18 % 13% 21% 3% 14%SW TRASH Count 8 5 13 % 35% 7% 10%DRAIN Count 1 1 2 % 4% 1% 2%PUMP TRUCK Count 7 15 10 32 % 30% 22% 26% 25%OTHER METHOD Count 2 2 % 9% 2%Total Count 23 67 38 128 % 100% 100% 100% 100%
In this tabulation there is a possible relationship whereby, as the number of
MEALS served increases, establishments are more likely to employ RECYCLE
COMPANIES and less likely to dispose of used cooking oil by means of SOLID WASTE
TRASH, pouring it down the DRAIN or OTHER METHODS.
21

Cross Tabulation of Purchased Cooking Oil Volume vs. Disposal Methods.
METHODS OF OIL PURCHASED
(gallons/month) Total DISPOSAL < 50 50 - 149 ≥ 150
RECYCLE CO. Count 18 19 21 58 % 22% 44% 78% 38%PRIVATE RECYCLE Count 9 7 2 18 % 11% 16% 7% 12%PIG FARMER & ETC Count 19 3 22 % 23% 7% 14%SW TRASH Count 16 3 19 % 19% 7% 12%DRAIN Count 2 2 % 2% 1%PUMP TRUCK Count 17 11 4 32 % 20% 26% 15% 21%OTHER METHOD Count 2 2 % 2% 1%Total Count 83 43 27 153 % 100% 100% 100% 100%
22

Cross Tabulation of Used Cooking Oil Volume vs. Disposal Methods.
METHODS OF OIL DISPOSED (gallons/month) Total
DISPOSAL < 50 50 - 149 ≥ 150 RECYCLE CO. Count 20 26 10 56 % 24% 57% 71% 39%PRIVATE RECYCLE Count 12 4 1 17 % 14% 9% 7% 12%PIG FARMER & ETC Count 16 0 0 16 % 19% 0% 0% 11%SW TRASH Count 15 3 0 18 % 18% 7% 0% 13%DRAIN Count 2 2 % 2% 0% 0% 1%PUMP TRUCK Count 16 13 3 32 % 19% 28% 21% 22%OTHER METHOD Count 2 2 % 2% 0% 0% 1%Total Count 83 46 14 143 % 100% 100% 100% 100%
In both the cross tabulation tables of OIL PURCHASED and OIL DISPOSED vs.
DISPOSAL METHODS a similar correlation between increasing volume of cooking oil
and a higher rate of usage of recycling companies to dispose of the used cooking oil is
observed. The options of disposal by means of SW TRASH, down the DRAIN and
OTHER METHODS showed a decline in usage as OIL PURCHASED and DISPOSED
increased.
23

Cross Tabulation of Recycling Method vs. Type of Establishment
METHODS OF DISPOSAL
DINE-IN
TAKEOUT
FOOD PRODUCT
RESORT
RECYCLE CO. Count 41 33 7 6 % 37.6% 37.5% 31.8% 66.7%PRIVATE RECYCLE Count 15 8 2 0 % 13.8% 9.1% 9.1% 0.0%PIG FARMER Count 15 14 5 0 % 13.8% 15.9% 22.7% 0.0%SW TRASH Count 9 9 6 0 % 8.3% 10.2% 27.3% 0.0%DRAIN Count 1 3 0 0 % 0.9% 3.4% 0.0% 0.0%PUMP TRUCK SVC Count 27 19 2 3 % 24.8% 21.6% 9.1% 33.3%OTHER Count 1 2 0 0 % 0.9% 2.3% 0.0% 0.0%TOTAL Count 109 88 22 9 % 100.0% 100.0% 100.0% 100.0%
RECYCLE COMPANIES was the top choice among all establishment types for
disposal of their used cooking oil with RESORTS employing their services at the highest
rate. FOOD PRODUCT manufacturers were the most likely to dispose of their used
cooking oil by means of PIG FARMERS and in their SOLID WASTE TRASH.
24

PUMP SVC
RECYCLE
OTHER
LIVESTOCK FEED
Volume
$ 1.91
$ 1.13
$0.19 $ 0.00
0
1000
2000
3000
4000
5000
6000
Vol
ume
(gal
lons
)
Methods Of Disposal(mean disposal cost per gallon)
Cooking Oil Disposal Volumes & Mean Disposal Costs
In the “Cooking Oil Disposal Volumes & Mean Disposal Costs” chart, we
summarize the average disposal costs for the various methods. The results according to
our survey showed that Recycling/Reuse of cooking oil was the method used to dispose
of the greatest volume of oil while Pump Truck Services was the most costly method of
disposal for the establishments. Disposal by use of the cooking oil as a livestock feed,
though very economical, may have limitations in the volume that can be disposed, and
may additionally be constrained by sanitation and livestock health impacts.
25

Cumulative Volume of Recycling Diversions & Landfilling of Used Cooking Oil
Tracked by the County of Hawai`i (tons)
FY2001 FY2002 FY2003 FY2004 July 0.00 22.29 49.71 33.99August 0.00 19.73 30.39 16.59September 0.00 12.60 16.63 32.82October 11.63 28.57 24.40 23.73November 12.60 14.64 15.62 23.94December 10.66 9.69 27.97 27.68January 7.75 16.78 22.65 24.74February 8.72 20.07 21.93 32.36March 10.66 36.15 22.89 40.77April 30.56 27.55 14.89 38.99May 12.60 19.95 20.72 31.41June 15.50 29.07 27.29 35.34FY Total 120.68 257.09 295.09 362.35 Est. direct shipments to Island Commodities 50.00Est. direct shipments to Pacific BioDiesel 12.00Total direct shipments to Off-Island Recyclers 62.00Estimated Total Cooking Oil Disposal for FY03-04 * 424.35
* Note: FY 2002, 2003 and 2004 tonnage adjusted to account for only used cooking oil disposal at the Pu`uanahulu Landfill based on estimates by Pump Truck Service companies. According to our survey, our respondents who employ Recyclers or Pump Truck
Services were responsible for approximately 353.32 tons (≈ 91,000 gallons) of the Total
Used Cooking Oil Disposed in Hawai`i County. Given that our internal Department
accounting of used cooking disposal by all establishments yielded an estimated 424.35
tons (≈ 110,000 gallons) in FY2004, the respondents to our survey seem to account for
about 83% of the volume generated. This observation could be the result of a strong self-
selecting response factor by those establishments with high volumes of used cooking oil
that already recycle and this factor may skew any extrapolation based on these results.
26

Projection:
In order to determine whether there is a sufficient used cooking oil volume market
for a biodiesel production facility on the Big Island of Hawai`i, an extrapolation based on
the survey results was calculated. Assumptions were applied to the survey non-
respondents to characterize their establishments and develop a projection of used cooking
oil generation in the County of Hawai`i. Similar qualifying criteria were applied to the
Department of Health listings of non-respondents to obtain only commercial food
handling establishments under consideration. Further, remaining establishments were
then characterized by Dine-In, Takeout/Delivery, Food Product and Resort facility types
or those that did not use cooking oil based on similarities to respondents to the survey
that marked the “do not use cooking oil” option. An average volume of used cooking oil
per type of establishment was then calculated from the survey respondents. An
extrapolation based on the number of survey non-respondents by establishment type
multiplied by the average used cooking oil generation per establishment was calculated
and the results are displayed in the following table.
Extrapolation of Used Cooking Oil Generation for Survey Non-Respondents
Dine-In Takeout Product Resort Survey Respondents 110 87 27 9Oil per Establishment Type (gallons/mo.) 5601 4558 902 1420Mean per Establishment 51 52 33 158Survey Non-Respondents 161 55 18 1Oil per Establishment Type (gallons/mo.) 8198 2882 602 158Extrapolated Mean 51 52 33 158
Note: Non-Respondents were categorized into a single Establishment Type to avoid double counting and simplify the extrapolation.
27

The Mean Used Oil per Establishment was calculated for the four types of food
handling establishments by dividing the Total Oil per Establishment Type by the number
of establishments. Establishments that marked multiple categories were tallied in those
columns. An interesting result of this calculation is that DINE-IN and TAKEOUT
establishments have similar per establishment used cooking oil generation while the
RESORTS had the highest volumes generated. Total used cooking oil generated by
survey respondents was 8,163 gallons per month, which translates into ≈ 380 tons per
year. The Mean per Establishment used cooking oil volumes were then multiplied by the
number of survey non-respondents that matched those establishment types to yield an
extrapolation of 11,839 gallons per month, which translates into ≈ 550 tons per year. An
estimate of the total generation of used cooking oil in the County of Hawai`i based on
this extrapolation would yield 20,002 gallons per month, which translates into ≈ 930 tons
per year.
This extrapolation is based on responses from the cooking oil survey and assumes
that the respondents and non-respondents had similar cooking oil usage characteristics.
Estimates for DINE-IN and TAKEOUT establishments could be affected by the above
average survey response rates from establishments generating larger amounts of used
cooking oil (e.g. Fast Food franchises categorized as both DINE-IN and TAKEOUT
facilities), self-reporting by respondents more concerned with recycling used cooking oil
or establishments not responding to our survey due to possible non-legal disposal or
perceived negligible amounts. The calculation was also dependent on the surveyor’s
assumptions of establishment characteristics of the non-respondents to the survey. The
surveyor was unable to determine if non-respondent establishments were out-of-business
28

based on the Department of Health listing. Given these factors and assumptions, the
extrapolation result should be considered a high estimate of the used cooking oil
generated by survey non-respondents.
Since this survey was not a simple random survey but a mix of a population and
purposive sampling, extrapolations based on survey data may be biased and could affect
the outcome. Statistical analysis of the results is not possible as a result of our
methodology, but the purposes of the survey were to gauge the interest in used cooking
oil recycling and provide a baseline estimate of the volume of used cooking oil generated
on the Big Island. As such, the survey yielded some interesting results and provided
insights with regard to amounts of used cooking oil generated, recycling costs, and local
recycling options. The information gathered in this survey will be helpful in developing
a public outreach/education program to promote the recycling of commercially generated
used cooking oil for use in the local production of biodiesel.
29