Embed Size (px)
Citation preview

STUDY REPORT No. 151(2006)
Leakage of
Smoke Control Door Assemblies
A.P.R. Edwards and C.A. Wade
The work reported here was jointly funded by Building Research Levy and The Department of Building and Housing.
IS
© BRANZ 2006
SN: 0113-3675


i
Preface This report was prepared as a result of a pilot study of leakage through door assemblies at ambient, medium and furnace temperatures and a review of available literature on methods used to control smoke hazards and tenability in protected and safe paths of buildings during a fire event. Acknowledgments This work was jointly funded by the Building Research Levy and The Department of Building and Housing. Civilian residential fire casualty statistics were supplied by the New Zealand Fire Service. Note This report is intended primarily for Regulators, Code Writers, Researchers, Fire Engineers and Architects.

ii
LEAKAGE OF SMOKE CONTROL DOOR ASSEMBLIES BRANZ Study Report SR 151 A.P.R. Edwards and C.A. Wade REFERENCE Edwards APR and Wade CA. 2006. ‘Leakage of Smoke Control Door Assemblies’. BRANZ Ltd Study Report SR 151, Judgeford, New Zealand. ABSTRACT This report is a summary of the results from the testing of the leakage of smoke control door assemblies in ambient, medium and high temperature conditions. The objective of the testing was to provide a comparison of the leakage results for the range of temperatures and to discuss current building regulations and standards associated with the leakage of smoke control door assemblies, with a view to providing a basis for recommendations as to the appropriateness of the current New Zealand Building Code requirements.
It is recommended that quantitative life safety levels be provided in the Compliance Document for the Fire Safety Clauses of the New Zealand Building Code (C/AS1), such as specifying a standard test method for determining leakage rates (e.g. AS/NZS 1530.7) in addition to criteria for maximum allowable leakage rates, clear signage, installation, etc (e.g. AS 1905.3) for smoke control doors.
KEYWORDS Smoke, smoke control doors, leakage, ambient temperature, medium temperature, high temperature, exitway, safe path, standards, regulations.

iii
Abbreviations
NZFS New Zealand Fire Service
STP Standard temperature (293.15 K) and pressure (101.325 kPa)
Nomenclature F flow rate or leakage rate (m3/h)
hr relative humidity (%)
P static pressure (Pa)
T temperature (K)
∆ refers to a difference
ρ density (kg/m3)
Subscripts air refers to dry air
amb refers to ambient temperature conditions
apparatus refers to test apparatus only, without any contribution from specimen
high refers to high temperature conditions
med refers to medium temperature conditions
specimen refers to test specimen

iv
Contents Page
1. INTRODUCTION ........................................................................................................ 1
1.1 Motivation................................................................................................................................... 1
1.2 Objective ..................................................................................................................................... 1
1.3 Summary of Topics..................................................................................................................... 1
2. BACKGROUND ........................................................................................................... 1
2.1 Summary of International Smoke Control Door Leakage Regulations ...................................... 1
2.2 Historical Smoke Inhalation Fatalities and Injuries .................................................................... 4
3. EXPERIMENTS ........................................................................................................... 6
3.1 Objective of Experiments............................................................................................................ 6 3.1.1 Scope of Experiments .................................................................................................. 6
3.2 General Description of Test Method........................................................................................... 6
3.3 Apparatus Description................................................................................................................. 7 3.3.1 Air-tight Enclosure ...................................................................................................... 8 3.3.2 Measurements............................................................................................................ 10
3.4 Test Procedure........................................................................................................................... 11
3.5 Test Conditions ......................................................................................................................... 12
3.6 Test Results ............................................................................................................................... 14
3.7 Discussion of Test Results ........................................................................................................ 19 3.7.1 Changes Recommended for Apparatus Design ......................................................... 19
4. CONCLUSIONS & RECOMMENDATIONS......................................................... 20
4.1 Recommendations for New Zealand Regulators....................................................................... 20
5. REFERENCES............................................................................................................ 21
5.1 Standards and Technical Reports .............................................................................................. 21
5.2 General References ................................................................................................................... 22
APPENDICES
APPENDIX A: EXPERIMENT APPARATUS DESIGN..................................................... 23 APPENDIX B: CALCULATING LEAKAGE OF DOORSET ............................................ 30 APPENDIX C: ADDITIONAL TEST RESULTS................................................................. 33

v
Figures Page Figure 1: (a) Numbers and (b) percentages of residential civilian fatalities, (c)
numbers, (d) percentages of life threatening residential civilian injuries, and (e) numbers and (f) percentages of non-life threatening residential civilian injuries (from analysis of NZFS statistics).......................................5
Figure 2: Schematic of the distribution of the cross-door pressure difference over the height of a doorset. ...........................................................................7
Figure 3: Schematic of the cross-sectional view of the leakage enclosure, specimen frame and 5-sided medium temperature box....................................8
Figure 4: Apparatus set-up for medium temperature test. ...............................9 Figure 5: An example of the leakage results of the apparatus only (with the specimen
sealed) at ambient temperature.......................................................14 Figure 6: An example of the results for leakage rate versus cross-apparatus pressure
difference for the apparatus (with the specimen part sealed) at ambient temperature.....................................................................................15
Figure 7: Flow measurements during ambient, medium and high temperature testing.........................................................................................................15
Figure 8: Specimen leakage estimates for ambient, medium and high temperature testing. ............................................................................................16
Figure 9: Estimated specimen leakage rate versus cross-specimen pressure difference for ambient, medium and high air temperatures.............................17
Figure 10: Estimated specimen leakage rate adjusted to standard temperature and pressure conditions (in accordance to AS 1530.7:1998) versus cross-specimen pressure difference for ambient, medium and high air temperatures. ..................................................................................17
Figure 11: Estimated specimen leakage rate versus cross-specimen pressure difference for high temperature test.................................................................18
Figure 12: The visible flow out of the apparatus at a cross-specimen pressure difference of approximately 25 Pa for the (a) medium temperature test (with an estimated specimen leakage rate of ~ 20 m3/h and ~ 13 m3/h @ STP) and (b) high-temperature test (with an estimated specimen leakage rate of ~ 40 m3/h or ~ 12 m3/h @ STP). .....................................................................18
Figure 13: Schematic of enclosure. ...................................................................23 Figure 14: Schematic of the locations at which deflections of the door leaf and frame
are to be measured..........................................................................24 Figure 15: Schematic of the locations at which temperatures within the enclosure are to
be measured....................................................................................24 Figure 16: Schematic of the locations at which pressures are to be measured.25 Figure 17: Schematic of the locations for view ports – for operator view (at back of the
enclosure) and smoke obscuration measurements (at sides of the enclosure).........................................................................................................25
Figure 18: Schematic of air tight enclosure. ....................................................26 Figure 19: Schematic of specimen frame. .........................................................27

vi
Figure 20: Schematic of 5-sided heat transfer box............................................28 Figure 21: Schematic of assembled test rig: air tight enclosure, specimen frame and 5-
sided heat transfer box....................................................................29 Figure 22: An example of the results for leakage rate versus cross-apparatus pressure
difference for the apparatus (with the specimen part sealed) at ambient temperature.....................................................................................31
Figure 23: Estimated flow out of the air-tight enclosure due to changes in temperature and pressure during medium and high temperature tests. ..............32
Figure 24: Cross-specimen pressure differences measured during an ambient temperature leakage test. ................................................................34
Figure 25: Cross-specimen pressure difference used to control ambient temperature leakage test. ....................................................................................34
Figure 26: Temperatures inside the 5-sided heat box during the medium temperature testing. ............................................................................................35
Figure 27: Temperatures inside of air-tight enclosure during a medium temperature test, where (a) shows the thermocouple readings closest to the specimen, (b) shows the thermocouple readings from the middle plane of the air-tight enclosure and (c) shows the thermocouple recordings furthest from the specimen.........................................................................................37
Figure 28: Cross-specimen pressure differences measured during the medium temperature leakage test. ................................................................37
Figure 29: Cross-specimen pressure difference used to control medium temperature leakage test. ....................................................................................38
Figure 30: Furnace temperatures (t = 0 min here, is the equivalent of t = 454 s in all other charts). ...................................................................................39
Figure 31: Temperature rise on unexposed side of specimen during high temperature testing. ............................................................................................39
Figure 32: Temperatures inside of air-tight enclosure during a high temperature test, where (a) shows the thermocouple readings closest to the specimen, (b) shows the thermocouple readings from the middle plane of the air-tight enclosure and (c) shows the thermocouple recordings furthest from the specimen.........................................................................................41
Figure 33: Cross-specimen pressure differences measured during the high temperature leakage test. ....................................................................................41
Figure 34: Cross-specimen pressure difference used to control high temperature leakage test. ....................................................................................42

vii
Tables Page Table 1: Summary of the Various Smoke Door Leakage Standards..............2 Table 2: Summary of selected current building code requirements for leakage and
sealing of smoke control doors.........................................................4 Table 3: Example of the test series for a single specimen, including apparatus leakage
measurement...................................................................................13 Table 4: Clearances between leaf edge and frame or sill of specimen tested
(measurements orientated from left to right or top to bottom).......14


1
1. INTRODUCTION
1.1 Motivation
Parts of escape routes in buildings such as stair shafts and corridor enclosures are commonly constructed as ‘safe paths’ and are intended to protect occupants from the hazards of fire and smoke originating elsewhere in the building. These ‘safe paths’ commonly rely on construction elements and particularly doors to protect against the entry of smoke. Furthermore, for example, the major proportion of fatalities in residential structure fires is attributable to inhalation of smoke and toxic gases (NFPA 105 2003; Cunningham 1999; Holburn 2001).
1.2 Objective
The objective of this report is to summarise high-temperature door assembly leakage testing, in addition to the current building regulations and standards associated with the leakage of smoke control door assemblies under ambient, medium or high temperatures, with a view to providing a basis for recommendations as to the appropriateness of the current New Zealand Building Code requirements.
1.3 Summary of Topics
The background includes a summary of selected international standard test methods and regulations, and a summary of the analysis of New Zealand residential statistics for civilian casualties attributed to smoke inhalation. The test method, apparatus and experiment results for high temperature leakage experiments are presented and compared to ambient and medium temperature experiment results. Recommendations for New Zealand regulations form part of the conclusions of this report.
2. BACKGROUND
2.1 Summary of International Smoke Control Door Leakage Regulations
A summary of standard test methods, previously discussed in BRANZ Study Report 148 (Edwards & Wade 2006) is presented in Table 1.
The current smoke leakage requirements, according to the building regulation documents for a range of countries including New Zealand, is summarised in Table 2.
Current drafts for public comment of the standards AS/NZS 1530.7 (DR 06279) and AS 1905.3 (DR 0634) have consistent maximum allowable leakage rates suggested. That is, the value corrected to Standard Reference Conditions at a cross-door pressure difference of 25 Pa does not exceed 25 and 40 m3/h for single and two leaf doorsets respectively when subjected to the test conditions of AS/NZS 1530.7. However these values are currently posed as suggestions rather than requirements within these documents, therefore performance criteria would also need to be identified in building code compliance documents in addition to specifying these two standards.

2
Table 1: Summary of the Various Smoke Door Leakage Standards
Standard Smoke Temp. Cross-door pressure differences
Leakage Criteria a (Max. for Apparatus)
Ratios for Adjustment of Leakage Rate b
Pre-test Information Post-test Information
(K) (Pa) AS/NZS 1530.7 1998 298 ±15
473 ± 20 10, 25, 50 - c
(7 m3/h @ 298 or 473 K) P, T Force to open and closing
moments. Apparatus leakage. d(Deformations during the test.)
NZS 4232 1988 Amd No. 1, 1991
298 ± 15
100 16 m 3/h/m P, T, hr ISO 5925/1 or BS 476: Section 31.1 is required
i
AS 1905.3 unpublished draft for public comment
298 ±15 473 ± 20 > 473
Up to 75 - g - Smoke Resistance Rating, SM25/X g
ISO 5925/1 1981 298 ± 15 (hr = 40 – 60%)
5, 10, 20, 30, 50 ,70, 100, then 5 and finally 100
- c (1 m3/h @ 100 Pa)
P, T, hr Apparatus leakage rate. Normal operation of doorset ensured. d
Apparatus leakage rate.
ISO 5925/1 future developments
298 ± 15 473 ± 20
10, 25 and 50 - c (7 m3/h @ 293 or 473 K)
NFPA 105 2003 297 477
25, 50 or 75 ± 1.25 54 m3/h.m2 - d “S” label for a max. leakage of 180 m3/h.m2
ASTM E283 1999 293.95 75, if not defined - m3/h.m ρair ASTM E783 2002 Field conditions ρair ASTM E1424 2000 internal side 295 ±
2, and external side warm 316 ± 2 and cold 256 ± 2
27, 75 and 300, if not defined
ρair
UL 1784 2004 297 477
- m3/h.m2 h - Closing forces. Clearances. Apparatus air leakage at ambient temperature.
Apparatus air leakage at ambient temperature.
UBC 7-2/2 1997 297 477
12.5, 25, 50 and 75 ± 1.25
54 m3/h.m2 @ 25 Pa - Apparatus air leakage
DIN 18095/1 1988 DIN 18095/2 1991 DIN 18095/3 1999
298 ± 15 477 ± 20
0 to 50 dependant on opening size e (5 m3/h @ 50 Pa)
P, T, hr Durability of specimen Deformations Operation ensured Name plate
BS 476:Section 31.1 1983 298 ± 15 5, 10, 25, 50, max, 5, max
- (7 m3/h @50 Pa) P, T, hr
EN 1634/2 2001 293 ± 10 473 ± 20
10, 25 and 50, if not defined
- (10 m3/h) - Operation of specimen
WFRA FSE 021 2000 at AS/NZS 1530.7 25 15 m3/h per leaf f P, T

3
Notes for Table 1: a Air leakage criteria are either presented in units of m3/h per unit area of door opening or m3/h per unit
length of gap, as listed. An absolute value for the maximum allowable air leakage of the test apparatus (in m3/h) is included in parentheses.
b Ratios used for adjustment of the measured air leakage rate, where p denotes pressure, T denotes temperature, hr denotes relative humidity, and ρair denotes air density.
c A general life safety limit of 20 – 25 m3/h is suggested, but is not required. d Doorsets are to be installed to the manufacturer’s specifications. Pre-test records are to show material,
dimensions and measurements of all gaps of the tested doorset. e The maximum air leakage rate is 20 m3/h and 30 m3/h for single- and double-leaf doors, respectively.
The maximum air leakage rate for an assembly of clear opening 3 – 7 m wide and 3 – 4.5 m high is a maximum of 50 m3/h, for an opening of 3 × 3 m is a maximum of 40 m3/h, for other sizes of openings the maximum leakage rate is to be calculated from the ratio of area opening compared to the 3 × 3 m case.
f measured between 65 and 70 minutes after the commencement of heating. g Smoke Resistance Rating, S = SM25/X, is based on the medium temperature test results of AS 1530.7
at a cross-door pressure difference of 25 Pa/measured air leakage rate in m3/h at the pressure stated after 30 minutes exposure to 200 ˚C. In addition, the maximum air leakage rates are recommended to be 25 and 40 m3/h for single and two leaf doorsets respectively correct to Standard Reference conditions for medium temperature testing at a cross-door pressure difference of 25 Pa after 30 minutes at 200 ˚C.
h The error of the air flow through the test sample must be no greater than ∆Q/Q = ± 5%, where Q ≈ Qmeasured – Qapparatus.
i These are the smoke stopping requirements for assemblies primarily denoted as fire doors. In the associated comment it is noted that, “…when other methods of smoke control are provided in building, e.g. pressurization, the smoke control criteria for doors may not be applicable…”. In addition, “… the test report shall record the information but the results shall not represent as failure criterion of the doorset…”. NZS 4232 was initially called in C/AS1, but has been replaced since with AS/NZS 1905.1 – this standard dose not have any leakage requirements – and this standard is only called for fire resistant doors, except for the required labelling of smoke control doors.
It should also be noted, that due to testing requirements overseas and a general industry perceived need for life safety, tested smoke control doors are currently available in the New Zealand market even though this level of testing is not currently required by the Compliance Documents (C/AS1, 2005).

4
Table 2: Summary of selected current building code requirements for leakage and sealing of smoke control doors
Country Description of Type of
Requirement
Maximum Leakage Rate
Details of Leakage Requirements
Performance – Qualitative
Impermeable to the passage of smoke
New Zealand
Prescriptive – Qualitative
Typically smoke seals are fitted at the head and all vertical edges Above the neutral plane, sills should not have a large gap
Performance – Qualitative
Impermeable to the passage of smoke
Australia
Deemed-to-Satisfy – Qualitative
Door leaves to resist smoke at 200 ºC for 30 min (Note: no standard test method is specified for this & “resist” is not defined as a maximum value.)
England & Wales
Performance – Quantitative
3 m3/h per metre of gap
Leakage measured at head and jambs, for a cross-door pressure difference of 25 Pa (BS 476: Section 31.1)
United States Performance – Quantitative
54 m3/h per m2 of door opening
Leakage measured for a cross-door pressure difference of 25 Pa (UL 1784)
2.2 Historical Smoke Inhalation Fatalities and Injuries
Simple analysis of residential fire casualties in New Zealand, from the New Zealand Fire Service, for the last 5 years indicates that between 40 and 70% of fire fatalities are attributed to smoke inhalation each year, as shown in Figure 1 (b). The average of fire fatalities, over the six years considered, attributed to smoke inhalation is just over half (52%). During the same period, smoke inhalation was reported to be the cause for between 33 and 60% of serious injuries, as shown in Figure 1 (d). The six-year average of life threatening fire injuries attributed to smoke inhalation is just under half (42%). Smoke inhalation was reported to be the cause for between 37 and 64% of non-life threatening injuries, as shown in Figure 1 (f). The six-year average of non-life threatening fire injuries attributed to smoke inhalation is just over half (52%).
It is noted that the location of the residential casualties represented by the statistics shown in Figure 1 are not included in the information gathered. However general information indicates that casualties located within the compartment of fire origin are attributed to burns and those casualties located remote from the compartment of fire origin have primarily attributed to smoke inhalation. That is, the intent of smoke control requirements are in protection of life remote from the compartment of fire origin. However detailed casualty statistics on the types of smoke control in place are not available.

5
0
5
10
15
20
25
30
2000 2001 2002 2003 2004 2005Year
No. F
atal
ities
OtherBurn from fireSmoke Inhalation
(a) (b)
0
2
4
6
8
10
12
14
16
18
2000 2001 2002 2003 2004 2005
Year
No.
Life
Thr
eate
ning
Inju
ries
Other
Burn from fire
Smoke Inhalation
(c) (d)
0
50
100
150
200
250
300
2000 2001 2002 2003 2004 2005
Year
No. N
on-L
ife T
hrea
teni
ng In
jurie
s
0%
10%
20%
30%
40%
50%
60%
70%
80%
90%
100%
2000 2001 2002 2003 2004 2005
Year
Perc
enta
ge o
f N
o. N
on-L
ife T
hrea
teni
ng In
jurie
s
(e) (f)
Figure 1: (a) Numbers and (b) percentages of residential civilian fatalities, (c) numbers, (d) percentages of life threatening residential civilian injuries, and (e) numbers and (f) percentages of non-life threatening residential civilian injuries (from analysis of NZFS statistics).
0%
10%
20%
30%
40%
50%
60%
70%
80%
90%
100%
2000 2001 2002 2003 2004 2005Year
Per
cent
age
of N
o. F
atal
ities
OtherBurn from fireSmoke Inhalation
0%
10%
20%
30%
40%
50%
60%
70%
80%
90%
100%
2000 2001 2002 2003 2004 2005
Year
Perc
enta
ge o
f N
o. L
ife T
hrea
teni
ng In
jurie
sOther
Burn from fire
Smoke Inhalation

6
3. EXPERIMENTS
3.1 Objective of Experiments
The objective of the set of experiments described in this report was to determine the leakage characteristics of a doorset during a standard fire resistance test at measured cross-door pressure difference distributions across the doorset (ambient < average ∆P < 100 Pa) and to compare these measurements to ambient and medium temperature (AS 1530.7) results.
3.1.1 Scope of Experiments
The scope of this set of tests is to characterise the leakage of various doorsets to improve fundamental understanding that could lead to design and application improvements to smoke doors and for use in modelling. The test method is not designed to simulate the actual behaviour or conditions that a doorset would be subjected to in a compartment of fire origin.
3.2 General Description of Test Method
The overall concept of the method is to include a doorset as part of a sealed enclosure, where the non fire-exposed side of the doorset is facing the inside of the enclosure, as shown in Figure 13. The space within the enclosure is intended to represent an area adjacent to a compartment of fire origin at a lower pressure than the compartment of fire origin.
For high temperature testing, the fire-exposed side of the doorset is subject to a standard time-temperature curve, which is, in principle, in accordance with AS 1530.4 or another appropriate standard. For ambient temperature testing, the enclosure with the mounted test specimen is to be used stand-alone, and the procedure is in accordance with AS/NZS1530.7 or ISO 5925/1. For medium temperature testing, the enclosure with the mounted test specimen is assembled with an additional section (a 5-sided medium temperature box) that is designed to act as a heat distribution volume between the specimen and the pilot furnace (as shown in the schematic of Figure 3 and photographs shown in Figure 4), and the procedure is in accordance with AS/NZS1530.7.
To create the cross-door pressure difference, air is withdrawn from the enclosure via a pump, so as to create a cross-door pressure difference. That is, the pressure is greater outside the enclosure (the ambient surrounds) than it is within the enclosure.
An orifice plate, in conjunction with pressure and temperature measurements are used to measure the outflow rate from the enclosure. This flow measurement is expected to be a combination of the leakage rate of the test specimen, the leakage rate of the apparatus and thermal expansion of the initially cool gases within the enclosure.
The cross-door pressure distribution was measured, and was expected to vary over the height of the test specimen when subjected to the furnace conditions.
The temperature distribution over the unexposed face of the leaf is to be measured, similar to standard practice in a standard fire resistance test. In addition, the temperature distribution within the enclosure is to be measured, for estimation of the influence of temperature on the internal pressure of the enclosure and subsequently the proportion of the outflow attributed to thermal effects, in addition to later use for modelling purposes.
The approach of installing top and bottom vents in the enclosure to maintain a quasi-steady-state temperature distribution over the unexposed surface of the doorset (as suggested by (Cooper 1980)) is not used, because this does not simulate a realistic situation of a doorset in the wall of a fire compartment (unless the doorset is expected to lead to the outside of the building

7
or a large room or atrium) and further complicates the design. Allowing the hot gases to be contained within the enclosure is closer to the situation of a door between a fire compartment and a relatively small adjacent compartment (e.g. lobby or corridor), which would be more representative of a worst-case-scenario). This situation would also be more useful for modelling purposes.
3.3 Apparatus Description
The overall concept of the method is to mount a single-leaf doorset into a sealed enclosure, where the unexposed side of the doorset is facing the inside of the enclosure, as shown in Figure 13. The doorset is then subjected to a standard fire resistance test, according to AS 1530.4, on the pilot furnacei. All required measurements for AS 1530.4 are taken (temperatures and deflections of leaf and frame), except for radiation measurements (which, if taken, would have to be modified to operate through a viewport or to be mounted within the air-tight enclosure). A cross-door pressure difference is imposed on the doorset by decreasing the pressure within the enclosure, using a pump/fan to withdraw air. The cross-door pressure difference imposed on the doorset results from the ambient/external pressure on the outside of the enclosure and the reduced pressure within the enclosure (as shown schematically in Figure 2). The pressure distribution over the door is chosen so that there is a positive pressure difference at the sill, so that the leakage rate is not underestimated due to recirculation.
Doo
rset
hei
ght
Cross-door pressure difference
Gap at Sill
Gap at Head
Neutral Plane
Increasing the average cross-door pressure difference
Cross-door pressure difference
Doo
rset
hei
ght
Leaf
Frame & Enclosure
Figure 2: Schematic of the distribution of the cross-door pressure difference over the
height of a doorset.
i The pilot furnace at BRANZ is a reduced scale facility allowing test specimens measuring up to 2.0 m high x 1.0 m wide to be subjected to a standard fire resistance test.

8
to furnace
to fan & orifice plate
radiation barrier
eye for crane
fan & motor
steel plate for heating
vent for make-up air
Specimen frame with
doorset to be tested
arms to secure radiation barrier
air-tight enclosure
5-sided heat transfer box
stand & fork-lift attachment points
4 insulated sides
mounting plate between specimen frame and air-tight enclosure
welded plate enclosure
Figure 3: Schematic of the cross-sectional view of the leakage enclosure, specimen frame and 5-sided medium temperature box.
3.3.1 Air-tight Enclosure
• The size of the enclosure was chosen to be close to the dimensions of the height and width of a representative corridor. The length of the enclosure (distance from the doorset to the back of the enclosure, where the rear viewport of Figure 15 is) is much shorter than a typical corridor would be. This is for practical reasons:
o In terms of the manageability of the general size of the entire apparatus,
o Doorsets intended for testing would be expected to have limited leakage (e.g. a maximum leakage of 54 m3/h per unit area (m2) of opening is required by NFPA 105 (NFPA 105 1999) and UL 1784:2004 (Rose 1997), and this rate at a cross-door pressure difference of 25 Pa is required by UBC 7-2 (UBCS 7-2/2 1997), 15 m3/h per leaf is recommended by WFRA in the Technical Specification for Air Leakage Testing in accordance with AS 1530.7:1998 (WFRA FSE 04.1 2003), or 20 – 25 m3/h is suggested by AS/NZS 1530.7 and ISO DIS 5925/1 (ISO DIS 5925/1 1981; AS/NZS 1530/7 1998)), and subsequently the cumulative amount of hot gases within the enclosure should also be limited, and
o During a fire event, it would be expected that the unexposed face of the doorset would be exposed to the hot gases that it allowed to leak through (unless the unexposed side was within a large room/atrium or lead to the outside of the building).

9
(a)
(b)
Figure 4: Apparatus set-up for medium temperature test.

10
• The enclosure materials were chosen to withstand exposure to hot furnace gases, which may leak through the doorset.
• All internal faces of the enclosure are non-reflective.
• Materials of the frame and infill/panels were chosen to have minimal deflections at operating temperatures to maintain leakage integrity of the enclosure.
• The location of the outflow to the orifice plate and fan is located near the top of the air-tight enclosure to remove the higher temperature gasses first. This is intended to reduce the additional heating of the specimen on the unexposed face caused by higher temperature gas leaked from the exposed side of the specimen.
• Location of the through-rods, for measuring the deflections of the leaf and frame, as shown in Figure 14.
• Location of the thermocouples, as shown in Figure 15. Thermocouples not located on the surface of the doorset/specimen (i.e. those measuring the temperature of the apparatus walls and gas temperature) are small to reduce interference of gas temperature measurements by radiation from the doorset.
• Location of the pressure transducers, as shown in Figure 16.
• Smoke obscuration measurements for additional information about the conditions within the enclosure. It is not expected that the gases leaking through the doorset would be carrying a significant amount of smoke (and the amount is not expected to be representative of a realistic situation), however these additional measurements of the environment within the enclosure may be useful for comparison with later modelling of the test and implementation.
• View ports are provided in the enclosure to allow visual access for the operators to the unexposed side of the doorset, as shown in Figure 17.
3.3.2 Measurements
Temperature Temperature measurements are made throughout the air-tight enclosure, on the unexposed side of the leaf, and within the 5-sided heat box with K-type thermocouples. Temperatures within the air-tight enclosure and on the leaf are recorded at 15 second intervals. Temperatures within the 5-sided heat box are recorded at 5 second intervals.
Pressure The 9 cross-specimen pressure differences are recorded at 5 second intervals.
Flow The flow rate out of the air-tight enclosure is measured using orifice plates with D and D/2 tappings. The pressure difference across the orifice plate and upstream temperature and static pressure are recorded at 5 second intervals.

11
3.4 Test Procedure
1. Apparatus Ambient Leakage Rate:
• Seal leakage gaps with a removable adhesive tape.
• Pressurise enclosure to 50 Pa relative to ambient conditions. Locate and seal any leakage points in apparatus.
• Depressurise enclosure (same as testing mode – ambient conditions outside of closure, lower pressure within enclosure) to average cross-door pressure differences of 10, 25, 50, 75 then 25 Pa (± 3 Pa). Each cross-apparatus pressure is maintained for a minimum of 3 min, within ± 3 Pa of the mean pressure difference. Measure and record leakage of apparatus at each of these cross-apparatus pressures at ambient temperatures.
2. Preparation of Doorset:
• Doorsets were stored identically before testing.
3. Doorset Ambient Temperature Leakage Rate (based on the test procedure outlined in ISO 5925/1 and AS/NZS 1530.7):
• Depressurise enclosure (ambient conditions outside of enclosure, lower pressure within enclosure) to average cross-door pressure differences of 5, 10, 25 and 50 Pa (to within ± 10% or 5 Pa, whichever is lower).
• Each cross-door pressure difference must be maintained for a minimum of 2 min, within ±5 % of the mean pressure. Measure and record leakage of apparatus at each of these cross-door pressure differences at ambient temperatures.
• Observations of the leaf and apparatus are to be recorded.
4. Doorset Medium Temperature Leakage Rate (based on the test procedure outlined in AS/NZS 1530.7):
• With no cross-door pressure difference, linearly increase the temperature within the 5-sided medium temperature box (on the fire exposed side of the specimen) from ambient temperature to 473 K ± 20 K over 30 min. When a gas temperature of 473 K is achieved over the fire exposed side of the specimen, this is maintained for the remainder of the medium temperature test.
• At 30 min, when the temperature of 473 K over the fire exposed side of the specimen is achieved, depressurise enclosure (ambient pressure outside of enclosure, lower pressure within enclosure) to average cross-door pressure differences of 5, 10, 25 and 50 Pa (to within ± 10% or 5 Pa, whichever is lower).
• Each cross-door pressure difference must be maintained for a minimum of 2 min, within ±5 % of the mean. Measure and record the flow rate out of the apparatus at each of these cross-door pressure differences.
• After 30 min at 473 K (i.e. 60 min from the start of the medium temperature test), depressurise enclosure (ambient pressure outside of enclosure, lower pressure within enclosure) to average cross-door pressure differences of 5, 10, 25 and 50 Pa (to within ± 10% or 5 Pa, whichever is lower) and again measure and record the flow rate out of the apparatus at each of these cross-door pressure differences.

12
• Detach the 5-sided medium temperature box at the completion of the second set of measured flow rates for cross-door pressure differences.
• At ambient temperature, determine the ambient apparatus leakage rate (See Step 1) again.
• Observations of the leaf and apparatus are to be recorded throughout the test.
5. Doorset High Temperature Leakage Rate:
• Furnace ignition, heating and control are to be in accordance with AS/NZS 1530.4 (Section 2.9). Note: Control of the neutral plane location for the applied cross-door pressure (by furnace conditions) would be expected to be different to a test in accordance with AS/NZS 1530.4, because of the imposed cross-door pressure difference.
• A single cross-door pressure difference is to be maintained for the entire duration of the high temperature test. Depressurise enclosure (same as testing mode – ambient conditions outside of enclosure, lower pressure within enclosure) to the appropriate average cross-door pressure (possibly 5, 10, 20, 25, 30 or 50 Pa, to within ± 10% or 5 Pa, whichever is lower). Maintain the cross-door pressure difference (measured at 1500 mm above the sill – ambient-to-enclosure vs. enclosure-to-furnace) by controlling the pump flow rate out of the enclosure to within ±5 % of the selected mean pressure difference value.
• Measurements of deflections of the leaf and frame taken from the protruding ends of the through-rods, at locations and time intervals in accordance with AS/NZS 1530.4 and AS/NZS 1530.7.
• Measurements of temperatures of the leaf and surrounds are to be recorded in accordance with AS/NZS 1530.4. Temperatures of the internal surface of the enclosure and the gas are measured and recorded at the same time interval as the doorset surface measurements.
3.5 Test Conditions
The controlled test variables are:
• General exposure of the door (ambient, medium and furnace temperature conditions),
• Average cross-door pressure,
• Furnace temperature and location of neutral plane relative to the specimen,
• Specimen (materials, opening orientation, seals).
The uncontrolled test variables are:
• Ambient conditions (This is limited by performing testing only within the specified limits listed in AS/NZS 1530.7.),
• Temperatures of the unexposed surface of the doorset and the inside of the enclosure (these are dependent on the characteristics of specimen being tested.),
• Distribution of the cross-door pressure over the leaf (this is dependent on the height and any local turbulence).

13
The test matrix used for this series of tests for each specimen is shown in Table 3.
Table 3: Example of the test series for a single specimen, including apparatus leakage measurement.
Temperature Flow Rate Measured
Pressure Difference
Across Door Assembly (Pa)
Time Held (min)
10 2 25 2 50 2 75 2
Apparatus Leakage Only
25 2 10 2 25 2 50 2 75 2
Ambient (298 ±15 K)
Apparatus & Specimen Leakage
25 2 Increase from ambient to 473 K linearly over 30 min
10 3 25 3 50 3 75 3
Apparatus & Specimen Leakage (between 30 min and 60 min from ambient)
25 3 10 3 25 3 50 3 75 3
Medium (473 ± 20 K)
Apparatus & Specimen Leakage (after 60 min from ambient)
25 3 10 2 25 2 50 2 75 2
Ambient (298 ±15 K) As soon after the medium temperature as possible
Apparatus Leakage Only
25 2 Standard Temperature-Time Curve
Apparatus & Specimen Leakage 25 15 min
10 2 25 2 50 2 75 2
Ambient (298 ±15 K) As soon as practical after furnace test
Apparatus Leakage Only
25 2
Specimen Description One doorset specimen was tested at the conditions shown in Table 3. The specimen had seals, in accordance with the C/AS1 (NZBC C/AS1 2005) requirements for a smoke door. The specimen was chosen to demonstrate the performance of the test apparatus and not the performance of a specific door system, therefore details of the tested materials are not included in this report.
The frame was double rebated steel. The leaf was medium density fibreboard (MDF). Silicon compression smoke seals were attached at the head and jamb. A silicon smoke seal was also attached at the threshold. The hardware consisted of a steel cylindrical lockset and 3 steel hinges per doorset. No closer was present for this series of tests. The door was orientated to open towards the higher pressure and temperature, as this had previously been determined to produce the worst leakage for a similar doorset set-up.

14
The clearances between the leaf and frame and the leaf and sill are presented in Table 4.
Table 4: Clearances between leaf edge and frame or sill of specimen tested (measurements orientated from left to right or top to bottom).
Clearance Locations Measurement at both ends and middle of each stile
(mm)
Latch-side Stile 3.0 \ 3.5 \ 3.5
Hinge-side Stile 2.5\ 1.7 \ 1.5
Head 2.5 \ 2.0 \ 2.5
Threshold 6.5 \ 7.0 \ 6.0
3.6 Test Results
An example of the ambient leakage results of the apparatus is shown in Figure 5.
An example of the results for leakage rate versus cross-apparatus pressure difference for the apparatus (with the specimen part sealed) at ambient temperature is shown in Figure 6.
An example of the flow rate measured when testing a specimen at ambient, medium and high air temperatures is shown in Figure 7.
0
20
40
60
80
100
120
0 200 400 600 800 1000 1200Time (s)
Cro
ss-S
peci
men
Pre
ssur
e Di
ffere
nce
(Pa)
0
5
10
15
20
25
Flow
Rat
e (m
3/h)
Cross-specimen pressure difference
Flow Rate
Figure 5: An example of the leakage results of the apparatus only (with the specimen sealed) at ambient temperature.

15
0
5
10
15
20
25
0 20 40 60 80 100 120Cross-Specimen Pressure Difference (Pa)
Flow
Rat
e (m
3/h)
Figure 6: An example of the results for leakage rate versus cross-apparatus pressure difference for the apparatus (with the specimen part sealed) at ambient temperature.
0
20
40
60
80
100
120
0 1000 2000 3000 4000 5000Time (s)
Spec
imen
Pre
ssur
e D
iffer
ence
(Pa)
0
50
100
150
200
250
Mea
sure
d Fl
ow R
ate
(m3/
h)
Ambient - cross-specimen pressure differenceMedium - cross-specimen pressure differenceHigh - cross-specimen pressure differenceAmbient - flow rateMedium - flow rateHigh - flow rate
Figure 7: Flow measurements during ambient, medium and high temperature testing.

16
Experimental Analysis - Leakage of Specimen The leakage of the specimen was estimated from the flow rate measured during testing, then subtracting the leakage of the apparatus measured at ambient conditions and the flow rate calculated from the temperature and pressure changes within the air-tight enclosure.
The estimated leakage rates attributed to the specimen for the three air-temperatures considered are shown in Figure 8. The estimated leakage rates attributed to the specimen versus cross-specimen pressure difference for the three air-temperatures considered are shown in Figure 9. Estimated specimen leakage rates adjusted to standard conditions, in accordance with AS1530.7:1998, versus cross-specimen pressure differences are shown in Figure 10.
The estimated specimen leakage rate significantly increased towards the end of the test (as shown in Figure 11) as the door started to flame at the top latch-side corner.
Figure 12 shows a comparison of the visible flow out of the apparatus at approximately the same cross-specimen pressure difference (~25 Pa) during the medium temperature (~ 20 m3/h and ~ 13 m3/h when adjusted to Standard Temperature and Pressure) and high temperature (~ 40 m3/h and ~ 22 m3/h when adjusted to Standard Temperature and Pressure) tests. The visible component of the flow out during the medium temperature test (Figure 12 (a)) was attributed to water vapour. The visible component of the flow out during the high temperature test (Figure 12 (b)) was predominantly attributed to smoke from burning the exposed side of the leaf.
0
20
40
60
80
100
120
0 1000 2000 3000 4000 5000Time (s)
Spe
cim
en P
ress
ure
Diffe
renc
e (P
a)
0
50
100
150
200
250
Est
imat
ed F
low
Rat
e (m
3/h)
Ambient - cross-specimen pressure differenceMedium - cross-specimen pressure differenceHigh - cross-specimen pressure differenceAmbient - flow rateMedium - flow rateHigh - flow rate
Figure 8: Specimen leakage estimates for ambient, medium and high temperature testing.

17
0
50
100
150
200
250
0 10 20 30 40 50 60 70 8Cross-Specimen Pressure Difference (Pa)
Estim
ated
Flo
w R
ate
(m3/
h)
0
High temperatureMedium temperature @ 30min from test startMedium temperature @ 60min from test startAmbient temperature
Figure 9: Estimated specimen leakage rate versus cross-specimen pressure difference for ambient, medium and high air temperatures.
0
10
20
30
40
50
60
70
80
90
100
0 10 20 30 40 50 60 70Cross-Specimen Pressure Difference (Pa)
Flo
w R
ate
Adj
uste
d to
STP
(m3/
h)
80
High temperatureMedium temperature @ 30min from start of testMedium temperature @ 60min from start of testAmbient temperature
Figure 10: Estimated specimen leakage rate adjusted to standard temperature and pressure conditions (in accordance to AS 1530.7:1998) versus cross-specimen pressure difference for ambient, medium and high air temperatures.

18
0
50
100
150
200
250
0 10 20 30 40 50 60Cross-Specimen Pressure Difference (Pa)
Estim
ated
Flo
w R
ate
(m3/
h)
Flow Rate vs Pressure Difference
time = 454 s
time = 500 s
time = 600 s
time = 700 s
time = 800 s
time = 900 s
time = 1000 s
time = 1100 s
time = 1200 s
time = 1300 s
time = 1400 s
time = 1500 s
Figure 11: Estimated specimen leakage rate versus cross-specimen pressure difference for high temperature test.
(a) (b)
Figure 12: The visible flow out of the apparatus at a cross-specimen pressure difference of approximately 25 Pa for the (a) medium temperature test (with an estimated specimen leakage rate of ~ 20 m3/h and ~ 13 m3/h @ STP) and (b) high-temperature test (with an estimated specimen leakage rate of ~ 40 m3/h or ~ 22 m3/h @ STP).

19
3.7 Discussion of Test Results
It is noted that the scope of the apparatus design was limited to pressure, temperature and flow rate measurements, taken in order to determine the leakage characteristics of a doorset and enclosure under the conditions, as far as practicable, of a fire resistance test. This is to allow for general comparison of results with AS 1530.4 (1997), BS 476: Section 22 (BS 476/22 1987) or ISO 3008 (ISO 3008 1976) and to provide more useful information for modelling purposes.
It should be noted that some components of the door systems tested here had been previously tested at ambient and medium temperature conditions as part of a similar doorset, and the leakage results here were significantly higher (up to approximately an order of magnitude higher) and would not have passed the suggested maximum leakage criteria of 20 – 25 m3/h at the cross-door pressure differences tested here (for general life safety in AS/NZS 1530.7:1998 or 25 m3/h the in current drafts for public comment of AS/NZS 1530.7 or AS 1905.3). This highlights that different seal, leaf and framing combinations can produce a range of leakage results because of the variation in temperature dependent behaviours between different materials and designs.
High temperature leakage results started in the ranges of estimated leakage rates for ambient and medium temperatures, however as the high temperature test progressed the leakage rate increased. This was attributed to increasing leakage gaps as the leaf and frame deflected and the leaf edges burnt away. This was expected, because of the combination of higher temperatures, burning of the specimen and direct exposure of the specimen to corrosive furnace gases. Standard (AS 1530.7) ambient and medium temperature leakage results are not expected to provide information on performance in high temperature conditions, however quantitative performance tests of a smoke control door assembly at ambient and medium temperatures are valuable in estimating the level of smoke protection afforded to the space adjacent to the fire compartment before the door is exposed to fire conditions, during pre-flashover or non-flashover conditions within the fire compartment, as well as spaces more remote from the fire compartment.
The visible component of the flow out during leakage testing was found to vary significantly, this is expected due to the variation of the components of the leakage gases. For example, the difference in leakage rate at the times of the photographs shown in Figure 12 was approximately 20 m3/h, however there is a marked difference between the visible component of the flow out of the apparatus. Therefore a maximum leakage rate criterion needs to be selected to balance the appropriate level of protection for the space adjacent to the fire compartment with a leakage rate that is achievable. Doorsets are currently available from a range of suppliers that have been tested according to AS 1530.7 and are reported to have achieved leakage rates of less than 10 m3/h.
3.7.1 Changes Recommended for Apparatus Design
Two changes currently being implemented for the apparatus design are:
• More central location of fan for mixing in the 5-sided heat box, and
• Different connections for the ductwork between the air-tight enclosure and orifice plate.
• Fittings to enable measurement of dynamic and static pressure differences across the specimen at each locations. This will enable the local velocities near to the door to be estimated.

20
4. CONCLUSIONS & RECOMMENDATIONS
Conclusions from the research conducted for this project:
• Smoke inhalation is attributed to the majority of NZ and international civilian fire casualties. The introduction of known levels of smoke protection of adjacent spaces may assist in reducing casualties remote from the room of fire origin.
• The current requirements for smoke control doors in C/AS1 (NZBC C/AS1 2005) are not quantitative.
• The current qualitative requirements for smoke control doors in C/AS1 (NZBC C/AS1 2005) do not result in provision of a consistent or known level of protection.
• Doorset leakage rates depend on the combination of components and their temperature dependent behaviour, therefore complete systems should be tested.
• The amount of smoke that passes through a doorset depends on the leakage rate and the concentration of smoke on the exposed-side of the doorset. Therefore simple visual inspection of the flow through a doorset may be misleading.
• Doorset leakage rates are temperature, time and component dependent, therefore results of smoke control door systems are not necessarily indicative of the performance of individual components in other systems.
• Actual performance of smoke control doors is a combination of the known leakage rates, installation and whether the smoke control door is operational (i.e. has not been wedged open or unwittingly modified).
4.1 Recommendations for New Zealand Regulators
For life safety, it is recommended that a standard test method for determining leakage rates, at ambient and medium temperatures such as AS/NZS 1530.7 “Methods for Fire Tests on Building Materials, Components and Structures - Smoke Control Door and Shutter Assemblies - Ambient and Medium Temperature Smoke Leakage Test Procedure” be specified in C/AS1.
In addition, for smoke control doors to be effective clear signage and other installation requirements are required, therefore criteria such as those specified in the latest draft for public comment of AS 1905.3 “Components for the protection of openings in fire resistant walls – Part 3: Smoke door assemblies” (DR 06346) are recommended.
When either AS/NZS 1530.7 or AS 1905.3 are specified, it is recommended that the maximum allowable leakage rates suggested in these documents be listed as required performance levels. That is, the measured leakage rate corrected to Standard Reference Conditions at a cross-door pressure difference of 25 Pa does not exceed 25 and 40 m3/h for single and two leaf doorsets respectively.
It is also recommended that New Zealand regulators and industry remain active on relevant joint standard committees and workgroups with Standards Australia to ensure appropriateness of technical content and foresight of possible impacts of up-coming changes.

21
5. REFERENCES
5.1 Standards and Technical Reports
1976. ISO 3008 Fire resistance tests – door and shutter assemblies. Switzerland, International Organization for Standardsization.
1981. ISO DIS 5925/1 Fire tests – evaluation of performance of smoke control door assemblies – Part 1: Ambient temperature test. Switzerland, International Organization for Standards. Switzerland, International Standards Organisation.
1987. BS 476: Section 22 Fire tests on building materials and structures – Part 22: Methods for determination of the fire resistance of non-loadbearing elements of construction. London, British Standards Institution.
1997. Uniform Building Code, Volume 3: Materials, testing and installation standards. UBC 7-2, Fire tests of door assemblies, Part II: Test standard for smoke- and draft-control assemblies of the international conference of building officials. Whitter, CA, International Conference of Building Officials.
1998. AS/NZS 1530.7 Methods for fire tests on building materials, components and structures – smoke control door and shutter assemblies – ambient and medium temperature smoke leakage test procedure. Homebush, NSW, Standards Australia.
1999. NFPA 105 Standard for the installation of smoke door assemblies. Quincy, MA, National Fire Prevention Association.
2000. Warrington Fire Research Standard FSE 021 Fire safety engineering test method for doorsets subject to simulated fully developed fires – Revision 1. Warrington Fire Research (Aust) Pty Ltd.
2003. NFPA 105 Standard for the installation of smoke door assemblies. Quincy, MA, National Fire Prevention Association.
2003. Technical Specification for air leakage testing in accordance with AS 1530.7:1998. Warrington Fire Research, Australia.
2005. Acceptable Solution, Approved Documents for New Zealand Building Code Fire Safety Clauses C1, C2, C3, C4. Wellington, Victoria University Book Centre.
2006. DR 06279 Draft for Public Comment: Methods for fire tests on building materials, components and structures – Part 7: Smoke control door and shutter assemblies – ambient and medium temperature smoke leakage test procedure (AS/NZS 1530.7:1998). Homebush, NSW, Standards Australia.
2006. DR 06346, Draft for Public Comment: Components for the protection of openings in fire-resistant walls, Part 3: Smoke door assemblies (AS 1905.3). Homebush, NSW, Standards Australia.
22
5.2 General References
Chow, W.K. 1997. Study on Smoke Movement and Control for Fires in Apartments. ASCE Journal of Architectural Engineering. 3(2):89-96. Cooper, L.Y. 1980. The Measurement of the Smoke Leakage of Door Assemblies During Standard Fire Exposures. NBSIR 80-2004. U.S. National Bureau of Standards, Washington, D.C. Cunningham, T.M. 1999. And the Children Slept - An Independent Investigative Study Concerning Reports of Non-arousal by Children to Activated Smoke Detection Alarms and Related Research. Canadian Fire Alarm Association. Accessed on 7 March 2005. http://www.cfaa.ca/Children.htm. Edwards, A.P.E. and Wade, C.A. 2006. Maintaining Tenability of Exitways in Buildings in the Event of Fire - Literature Review, BRANZ Study Report SR 148. BRANZ Ltd, Judgeford, New Zealand. Edwards, A.P.E. and Wade, C.A. 2006. Analysis of the flow rates measured by orifice plates for use with the air leakage apparatuses, BRANZ Internal Report FQ0641/1, BRANZ Ltd, Judgeford, New Zealand. Holburn, P.G. 2001. The Real Fire Library - Analysis of Fatal Fires 1996-2000. London Fire Brigade - Fire Investigation Group, London. Rose, H. 1997. Choosing Gasketing Products. The Construction Specifier. April:73-77.

23
APPENDIX A: EXPERIMENT APPARATUS DESIGN
To orifice plate and fan
To furnace
A A B B
Through-rods to measure deflection
Mounted test doorset
Rear viewport
Side viewports
Port for thermocouple wires
Pressure Transducer stand-offs (multiple)
To inside of sealed enclosure
Figure 13: Schematic of enclosure.

24
Through-rod Locations
Figure 14: Schematic of the locations at which deflections of the door leaf and frame are
to be measured.
Thermocouple Location
Figure 15: Schematic of the locations at which temperatures within the enclosure are to
be measured.

25
Pressure Transducer Locations
Figure 16: Schematic of the locations at which pressures are to be measured.
Figure 17: Schematic of the locations for view ports – for operator view (at back of the enclosure) and smoke obscuration measurements (at sides of the enclosure).

26
Figure 18: Schematic of air tight enclosure.

27
Figure 19: Schematic of specimen frame.

28
Figure 20: Schematic of 5-sided heat transfer box.

29
Figure 21: Schematic of assembled test rig: air tight enclosure, specimen frame and 5-sided heat transfer box.

30
APPENDIX B: CALCULATING LEAKAGE OF DOORSET
B.1 Calculation of flow rate from orifice plate measurements
The calculation of the flow rate out of the apparatus from orifice plate measurements are performed in accordance with ISO 5167 “Measurement of fluid flow by means of pressure differential devices inserted in circular cross-section conduits running full – Part 1: General principles and requirements” (2003) and “Part 2: Orifice Plates” (2003), and ISO 5221 “Air distribution and air diffusion – Rules to methods of measuring air flow rate in an air handling duct” (1984). Details of the specific dimensions used in this apparatus are included in the BRANZ Internal Report FQ0641/1, “Analysis of the Flow Rates Measured by Orifice Plates for use with the Air Leakage Apparatuses”.

31
B.2 Estimation of the flow rate associated with the apparatus leakage
Ambient tests of the apparatus leakage rates were measured when the leakage paths through the specimen were taped closed. An example of a curve fit to the ambient leakage rate versus cross-specimen/apparatus pressure difference results is shown in Figure 22. A good curve fit was found to be:
7.0, )(68.0 specimenambapparatus PF ∆=
Where refers to the leakage rate of the apparatus at ambient conditions, and ambapparatusF ,
refers to the cross-specimen/apparatus pressure difference. specimenP∆
The results for the ambient leakage rates for the apparatus were used as estimates of the leakage rates of the apparatus for each temperature condition investigated.
y = 0.6766x0.7276
R2 = 0.9945
0
5
10
15
20
25
0 20 40 60 80 100Cross-Specimen Pressure Difference (Pa)
Flow
Rat
e (m
3/h)
120
Figure 22: An example of the results for leakage rate versus cross-apparatus pressure difference for the apparatus (with the specimen part sealed) at ambient temperature.

32
B.3 Estimation of flow out of air-tight enclosure due to heating
The flow out of the air-tight enclosure due to expansion of heated gases within the enclosure was estimated assuming ideal gas behaviour. Thus the flow out of the air-tight enclosure attributed to the expansion of heated gases is,
⎟⎟⎠
⎞⎜⎜⎝
⎛∆∆
−∆∆
=∆∆
tP
PtT
TV
tV
111
11
Where , refers to the change in volume, 12 VVV −=∆
12 ttt −=∆ , refers to the change in time,
, refers to the change in temperature, 12 TTT −=∆
, refers to the change in pressure, and 12 PPP −=∆
subscripts 1 and 2 refer to sequential measurements in time.
These values and the estimated apparatus leakage rates were subtracted from the measured flow rates to estimate the leakage rates of the specimen.
0
10
20
30
40
50
60
70
80
90
100
0 1000 2000 3000 4000 5000Time (s)
Spec
imen
Pre
ssur
e D
iffer
ence
(Pa)
0
20
40
60
80
100
120
Cal
cula
ted
Flow
Rat
e (m
3/h)
Medium - cross-specimen pressure differenceHigh - cross-specimen pressure differenceMedium - flow rateHigh - flow rate
Figure 23: Estimated flow out of the air-tight enclosure due to changes in temperature and pressure during medium and high temperature tests.

33
APPENDIX C: ADDITIONAL TEST RESULTS
All layouts of thermocouples and pressure reading locations are orientated as though looking in at the unexposed side of the specimen. The numbering of the thermocouple reading locations are also orientated in the direction from the exposed side to the unexposed side of the specimen.

34
C.1 Additional results for ambient temperature leakage testing
0
20
40
60
80
100
120
140
0 500 1000 1500 2000 2500Time (s)
Cros
s-S
peci
men
Pre
ssur
e Di
ffere
nces
(Pa)
P1 P2 P3
P4 P5 P6
P7 P8 P9
Figure 24: Cross-specimen pressure differences measured during an ambient temperature leakage test.
0
20
40
60
80
100
120
140
0 500 1000 1500 2000 2500Time (s)
Cros
s-S
peci
men
Pre
ssur
e D
iffer
ence
s (P
a)
P5
Figure 25: Cross-specimen pressure difference used to control ambient temperature leakage test.
35
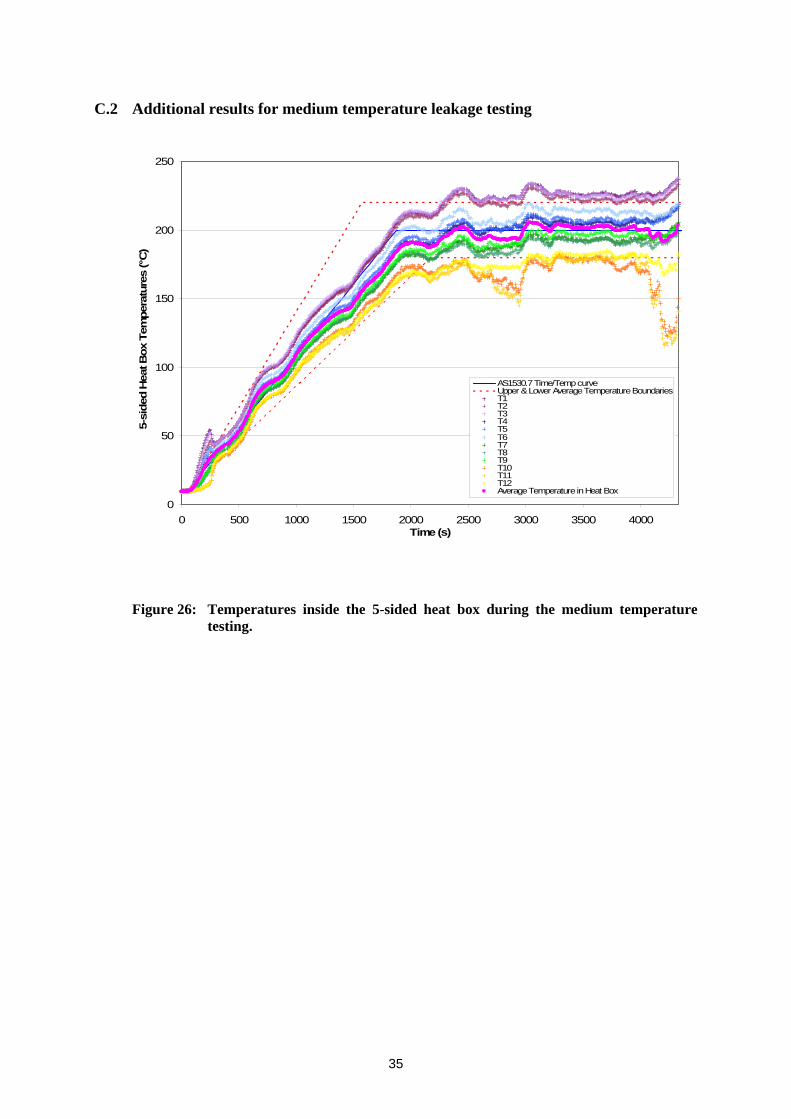
C.2 Additional results for medium temperature leakage testing
0
50
100
150
200
250
0 500 1000 1500 2000 2500 3000 3500 4000Time (s)
5-si
ded
Hea
t Box
Tem
pera
ture
s (°
C)
AS1530.7 Time/Temp curveUpper & Lower Average Temperature BoundariesT1T2T3T4T5T6T7T8T9T10T11T12Average Temperature in Heat Box
Figure 26: Temperatures inside the 5-sided heat box during the medium temperature testing.

36
0
20
40
60
80
100
120
0 1000 2000 3000 4000Time (s)
Air-
Tigh
t Enc
losu
re T
empe
ratu
res
(̊C)
T18 T19 T20
T21 T22 T23
T24 T25 T26
T27 T28 T29
(a)
0
20
40
60
80
100
120
0 500 1000 1500 2000 2500 3000 3500 4000 4500Time (s)
Air-
Tigh
t Enc
losu
re T
empe
ratu
res
(˚C
) T30 T31 T32
T33 T34 T35
T36 T37 T38
T39 T40 T41
(b)

37
0
20
40
60
80
100
120
140
0 500 1000 1500 2000 2500 3000 3500 4000 4500Time (s)
Air-
Tigh
t Enc
losu
re T
empe
ratu
res
(˚C
) T42 T43 T44
T45 T46 T47
T48 T49 T50
T51 T52 T53
(c)
Figure 27: Temperatures inside of air-tight enclosure during a medium temperature test, where (a) shows the thermocouple readings closest to the specimen, (b) shows the thermocouple readings from the middle plane of the air-tight enclosure and (c) shows the thermocouple recordings furthest from the specimen.
0
10
20
30
40
50
60
70
80
90
100
0 500 1000 1500 2000 2500 3000 3500 4000 4500Time (s)
Cros
s-Sp
ecim
en P
ress
ure
Diffe
renc
es (P
a)
P1 P2 P3
P4 P5 P6
P7 P8 P9
Figure 28: Cross-specimen pressure differences measured during the medium temperature leakage test.

38
0
10
20
30
40
50
60
70
80
90
100
0 500 1000 1500 2000 2500 3000 3500 4000 4500Time (s)
Cro
ss-S
peci
men
Pre
ssur
e D
iffer
ence
s (P
a)
P5
Figure 29: Cross-specimen pressure difference used to control medium temperature leakage test.

39
C.3 Additional results for high temperature leakage testing
0
100
200
300
400
500
600
700
800
900
0 2 4 6 8 10 12 14 16
Time (minutes)
Furn
ace
Tem
pera
ture
(°C
)
18
Mean
StandardStd -100
Std+100
Figure 30: Furnace temperatures (t = 0 min here, is the equivalent of t = 454 s in all other charts).
0
20
40
60
80
100
120
140
160
180
200
0 200 400 600 800 1000 1200 1400 1600
Time (s)
Spec
imen
Tem
pera
ture
Ris
e (°C
)
AverageMaximumT13T14T15T16T17
Figure 31: Temperature rise on unexposed side of specimen during high temperature testing.

40
0
100
200
300
400
500
600
700
800
0 200 400 600 800 1000 1200 1400 1600 1800Time (s)
Air-
Tigh
t Enc
losu
re T
empe
ratu
res
(˚C
) T18 T19 T20
T21 T22 T23
T24 T25 T26
T27 T28 T29
(a)
0
100
200
300
400
500
600
700
800
0 200 400 600 800 1000 1200 1400 1600 1800Time (s)
Air-
Tigh
t Enc
losu
re T
empe
ratu
res
(˚C
) T30 T31 T32
T33 T34 T35
T36 T37 T38
T39 T40 T41
(b)

41
0
100
200
300
400
500
600
700
800
0 200 400 600 800 1000 1200 1400 1600 1800Time (s)
Air-
Tigh
t Enc
losu
re T
empe
ratu
res
(˚C
) T42 T43 T44
T45 T46 T47
T48 T49 T50
T51 T52 T53
(c)
Figure 32: Temperatures inside of air-tight enclosure during a high temperature test, where (a) shows the thermocouple readings closest to the specimen, (b) shows the thermocouple readings from the middle plane of the air-tight enclosure and (c) shows the thermocouple recordings furthest from the specimen.
-40
-20
0
20
40
60
80
100
0 200 400 600 800 1000 1200 1400 1600 1800
Time (s)
Cro
ss-S
peci
men
Pre
ssur
e D
iffer
ence
s (P
a)
P1 P2 P3
P4 P5 P6
P7 P8 P9
Figure 33: Cross-specimen pressure differences measured during the high temperature leakage test.

42
-40
-20
0
20
40
60
80
100
0 200 400 600 800 1000 1200 1400 1600 1800
Time (s)
Cro
ss-S
peci
men
Pre
ssur
e D
iffer
ence
s (P
a)
P5
Figure 34: Cross-specimen pressure difference used to control high temperature leakage test.