Embed Size (px)
Citation preview

International Journal of Scientific & Engineering Research, Volume 7, Issue 8, August-2016 1790 ISSN 2229-5518
IJSER © 2016 http://www.ijser.org
Study the Stress Corrosion Cracking Susceptibility of Low Carbon Steel in
0.1M of Sulfuric Acid Solution Using U-Bend Test
Kamal Hameed1, Dr. Harith I. Ja’afer2, Dr. Abdul-Kareem M. Ali3 1Al-Turath University College - Computer Science Department - Baghdad
2 University of Baghdad - College of Science – Department of Physics , 3 University of Baghdad - College of Science - Department of Chemistry
Abstract: The commercial low carbon steel was used for studying stress corrosion cracking phenomena. The aim of this work is to investigate this. To study SCC susceptibility, U-bend testing method was carried out on the U-shape specimens of Low Carbon Steel. A guided bend test jig that uses a male and female former was used to prepare specimens. The applied stress effect was obtained by using bolts and suitable nuts through the two holes and plastic insulator in the two legs of specimen. The sulfuric acid solution with 0.1M concentration was prepared to use it as an environment solution. Instron 1122 machine was used to study the behavior of U-shape specimen under compression stress. Two cases were studied for the test, stress effect with immersion in solution and without immersion. A comparison study for the specimen behavior for these two cases was studied. Necessary graphs were plotted according to the data measuring during the test time. As a result, Sulfuric Acid solution is a corrosive media for Low Carbon Steel was obtained. The stress effect and acidic solution accelerate the failure or fracture points because of increasing of cracks propagation. Keywords: Stress Corrosion Cracking, Corrosion rate, Acidic environments, Low Carbon Steel, Weight Loss Method.
—————————— —————————— 1. Introduction
One of the definitions of corrosion is: “the destructive attack of a material by reaction with its environment” [1, 2]. There are many basic forms of corrosion that metallic materials may be subject to (Uniform, galvanic, crevice, pitting, erosion, stress corrosion cracking) [3, 4]. Metals, whether they are attacked uniformly or pit or crack in corrosion, are all corroded by the same basic mechanisms, which are quite different from those of other materials [5]. Corrosion of metals in aqueous environments is almost always electrochemical in nature. It occurs when two or more electrochemical reactions take place on a metal surface. As a result, some of the elements of the metal or alloy change from a metallic state into a nonmetallic state.
Rusting is a term reversed for steel and iron corrosion, although many other metals form their oxides when corrosion occurs [6]. Rusting of steel is the best known example of conversion of a metal (iron) into a nonmetallic corrosion product (rust).
The change in the energy of the system is the driving force for the corrosion process and is a subject of thermodynamics [7]. Iron and steels are the most versatile, least expensive and most widely applied of the engineering metals. They are unequaled in the range of mechanical and physical properties with which they can be endowed by alloying and heat-treatment [8]. 1.1 Stress Corrosion Cracking (SCC)
Stress corrosion cracking (SCC) is a process by which cracks propagate in a metal or alloy by the concurrent action of a stress (residual and/or applied) and a specific corrosive environment [9], or it’s a type of Environmentally-Assisted Cracking (EAC) where the material experiences a brittle fracture failure due to the combined effect of corrosive environment and tensile stresses.
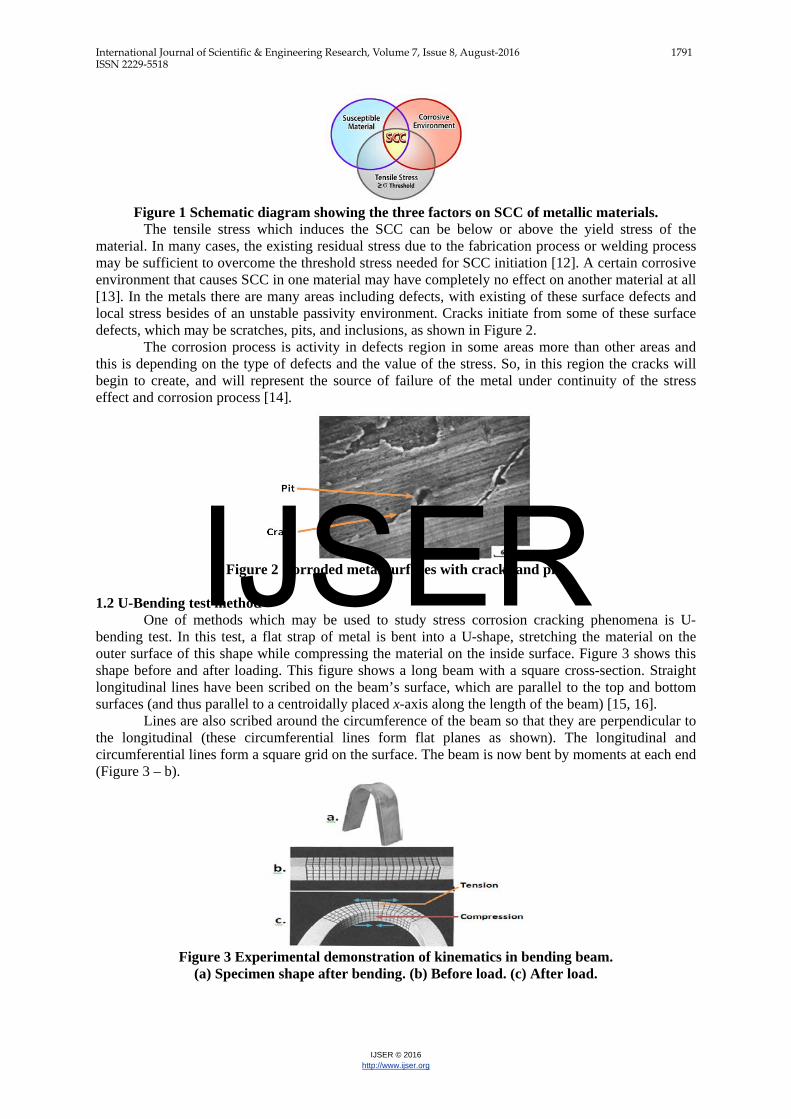
Environmental species are often specific to the alloy system and may not have an effect on other alloys of different type. Not all environments cause cracking of any particular alloy, but new alloy-environment combinations resulting in SCC are being discovered on a regular basis [10]. The three groups of major factors affecting SCC susceptibility are schematically represented in Figure 1. Material variables are uniquely important in determining SCC resistance. Compositional differences even within a class of alloys could have a remarkable effect [11].
IJSER
International Journal of Scientific & Engineering Research, Volume 7, Issue 8, August-2016 1791 ISSN 2229-5518
IJSER © 2016 http://www.ijser.org
Figure 1 Schematic diagram showing the three factors on SCC of metallic materials.
The tensile stress which induces the SCC can be below or above the yield stress of the material. In many cases, the existing residual stress due to the fabrication process or welding process may be sufficient to overcome the threshold stress needed for SCC initiation [12]. A certain corrosive environment that causes SCC in one material may have completely no effect on another material at all [13]. In the metals there are many areas including defects, with existing of these surface defects and local stress besides of an unstable passivity environment. Cracks initiate from some of these surface defects, which may be scratches, pits, and inclusions, as shown in Figure 2.
The corrosion process is activity in defects region in some areas more than other areas and this is depending on the type of defects and the value of the stress. So, in this region the cracks will begin to create, and will represent the source of failure of the metal under continuity of the stress effect and corrosion process [14].
Figure 2 Corroded metal surfaces with cracks and pits
1.2 U-Bending test method
One of methods which may be used to study stress corrosion cracking phenomena is U-bending test. In this test, a flat strap of metal is bent into a U-shape, stretching the material on the outer surface of this shape while compressing the material on the inside surface. Figure 3 shows this shape before and after loading. This figure shows a long beam with a square cross-section. Straight longitudinal lines have been scribed on the beam’s surface, which are parallel to the top and bottom surfaces (and thus parallel to a centroidally placed x-axis along the length of the beam) [15, 16].
Lines are also scribed around the circumference of the beam so that they are perpendicular to the longitudinal (these circumferential lines form flat planes as shown). The longitudinal and circumferential lines form a square grid on the surface. The beam is now bent by moments at each end (Figure 3 – b).
Figure 3 Experimental demonstration of kinematics in bending beam.
(a) Specimen shape after bending. (b) Before load. (c) After load.
IJSER

International Journal of Scientific & Engineering Research, Volume 7, Issue 8, August-2016 1792 ISSN 2229-5518
IJSER © 2016 http://www.ijser.org
The U-bend specimen is generally a rectangular strip which is bent 180° around a predetermined radius and maintained in this constant strain condition during the stress corrosion test. Bends slightly less than or greater than 180° are sometimes used. U-bend specimens usually contain both elastic and plastic strain [17]. 1.3 Corrosion Rate Calculation Method
One of the corrosion rate calculation methods is weight loss. Its depending on the weights (before immersion in the solution and after W1 and W2 respectively) and the weight loss (∆W=W1-W2) will measured. The relation (1) bellow used for this purpose [18, 19].
Where:
K=8.76x10⁴ ∆W = Weight loss in (g). D = Metal density in (g /cm3). A = Exposure area to corrosion in (cm2). T =Immersion time or time of exposure in (hours).
2. Experimental work 2.1 Materials and Specimen’s Preparation
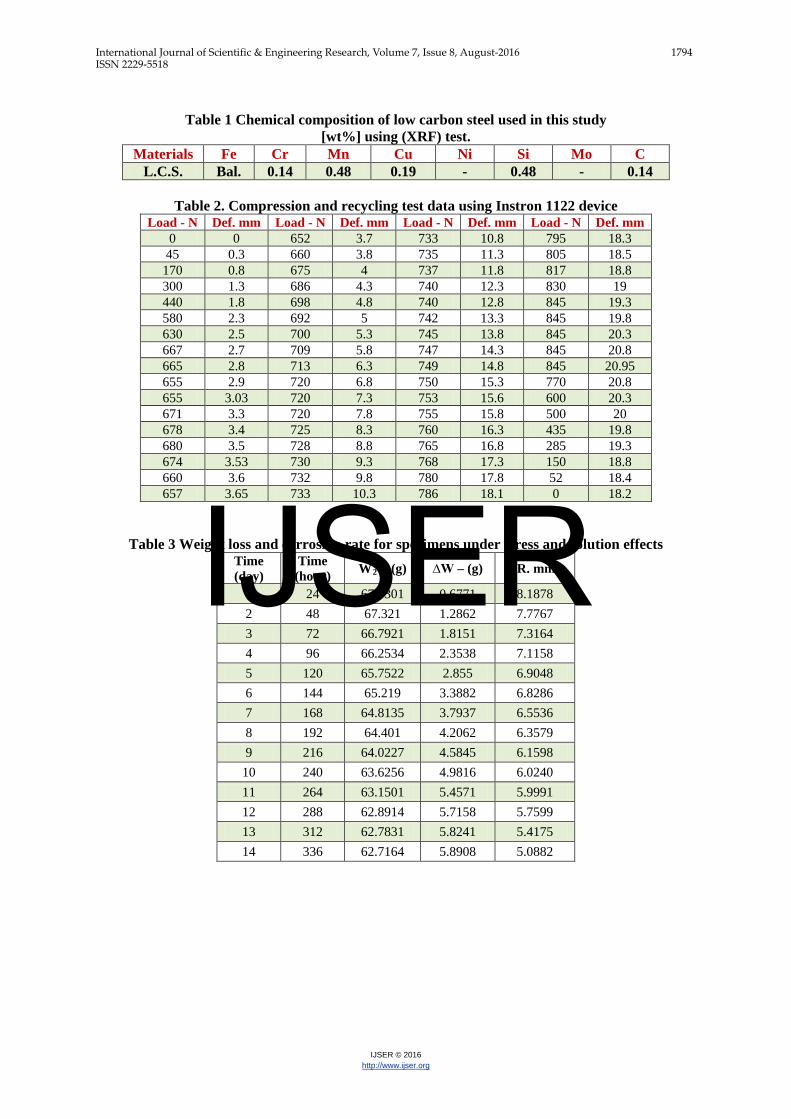
The materials used in this work were commercial low carbon steel with chemical compositions as shown in Table 1, which obtained by using (XRF) test, 0.1M of Sulfuric Acid was used as a corrosive environment, 10% HCL solution and distilled water for cleaning the specimen after removing it from the acid solution and release the corrosion contamination from the surface of specimens, and 2% Natal solution for Etching process in order to take an optical photos.
In order to prepare the U-Shape specimen, a rectangular shape plate was prepared according to ASTM G30, and then grinding with Silicon Carbide (SiC) emery paper with grit size of 320, 400, 800, 1000 and 1200 successively then polished to obtain a mirror finish surface, free from scratches.
A guided bend test jig that uses a male and female former as shown in Figure 4 was used as a method for bending this plate.
After preparing U-Shape specimens the Istron 1122 device was used to obtain the stress-strain curve for these specimens to determine its behavior under compression load. Table 2 illustrates the data for this test and the graph as shown in Figure 6.
Figure 4 Guided bend test jig that uses a male and female former to prepare U-shape specimen
Two cases were taken in this work. The first is for specimen under applied stress effect only without immersion in acidic solution and the second is with stress effect and immersion in order to study the differences of stress effect with and without immersion on strength of specimen and the corrosion effect on it, so two specimens were prepared for this purpose.
The digital caliper was used to determine the distance between the two specimen’s legs, and sensitive balance with accuracy of 0.0001g was used to determine the weights of specimens through the test time for corrosion rate calculation using weight loss method. 2.2 Test Procedure
The procedure of the test including the following steps: 1- Preparing two specimen of U-shape, using the equipment shown in Figure 4.
……………………………….. (1)
IJSER

International Journal of Scientific & Engineering Research, Volume 7, Issue 8, August-2016 1793 ISSN 2229-5518
IJSER © 2016 http://www.ijser.org
2- The distance between their legs (d) was determined which represent the reference for comparing as an initial value for each one.
3- Specimen’s initial weights (W1) for each one were determined. 4- Using bolts passing through the two holes with a plastic insulator and nut to get the applied stress
for a fixed value for each one. 5- Immersing the first specimen in a plastic container with 0.1M of Sulfuric Acid solution to the
level under bolt axis as shown in Figure 5, and the second placed in container without solution at room temperature.
6- After 24 hours, the first specimen removed from solution and removing the stress effect for the two specimens, then cleaning it using the solution of Hydrochloric Acid with smooth brush to remove any corrosion contaminations and then cleaning it by distilled water and drying it using suitable electrical oven.
7- The distances between the two legs after stress removing (d1 for the first one and d2 for the second) were determined which depends on the flexibility of the specimen to compare it with the initial value and study the effect of corrosion on it.
8- Using Natal solution for etching specimen’s surface to make it ready to get optical photos for convex surface to notice the effect of corrosion through 24 hours.
9- Repeating the previous steps every day along 14 days. Using the weight loss method, the corrosion rate was determined every day. This data were
illustrated in Table 3 in order to plot a necessary graphs and using it for discussion. According to the data in this table, two graphs can be obtained, the first is the relation between weight losses vs. immersion time as shown in Figure 7, and the second is the relation between corrosion rates vs. immersion time as shown in Figure 8.
The distances between the specimen’s legs (d1 for immersion case) and (d2 for non-immersion case) and the distance variance (∆d) between the two specimen’s legs before and after stress for each case are illustrated in Table 4. From this table a plot between the time and the distances for non-immersed specimen can be shown in Figure 9 and for immersed specimen in Figure 10.
Figure 5. U-bend specimen before and after applying stress with plastic container of sulfuric
acid solution and the distances (d1), (d2)
3. Results and Discussion The specimen’s initial weight equal to (69.1072 g) and the distance between its legs (d) which
determined every day using digital caliper were representing the following: d1R and d2R - the distance before stress and any environment effect which we can call it the
reference distance. d1S - the distance under stress effect for non-immersed specimen in any environment solution. d2S - the distance under stress effect for immersed specimen in acidic environment solution. d1 - the distance after removing the stress effect for the non-immersed specimen in any
environment solution. d2 - the distance after removing stress effect for immersed specimen in acidic environment
solution.
IJSER
International Journal of Scientific & Engineering Research, Volume 7, Issue 8, August-2016 1794 ISSN 2229-5518
IJSER © 2016 http://www.ijser.org
Table 1 Chemical composition of low carbon steel used in this study
[wt%] using (XRF) test. Materials Fe Cr Mn Cu Ni Si Mo C
L.C.S. Bal. 0.14 0.48 0.19 - 0.48 - 0.14
Table 2. Compression and recycling test data using Instron 1122 device Load - N Def. mm Load - N Def. mm Load - N Def. mm Load - N Def. mm
0 0 652 3.7 733 10.8 795 18.3 45 0.3 660 3.8 735 11.3 805 18.5 170 0.8 675 4 737 11.8 817 18.8 300 1.3 686 4.3 740 12.3 830 19 440 1.8 698 4.8 740 12.8 845 19.3 580 2.3 692 5 742 13.3 845 19.8 630 2.5 700 5.3 745 13.8 845 20.3 667 2.7 709 5.8 747 14.3 845 20.8 665 2.8 713 6.3 749 14.8 845 20.95 655 2.9 720 6.8 750 15.3 770 20.8 655 3.03 720 7.3 753 15.6 600 20.3 671 3.3 720 7.8 755 15.8 500 20 678 3.4 725 8.3 760 16.3 435 19.8 680 3.5 728 8.8 765 16.8 285 19.3 674 3.53 730 9.3 768 17.3 150 18.8 660 3.6 732 9.8 780 17.8 52 18.4 657 3.65 733 10.3 786 18.1 0 18.2
Table 3 Weight loss and corrosion rate for specimens under stress and solution effects Time (day)
Time (hour) W2 – (g) ∆W – (g) C.R. mm/y
1 24 67.9301 0.6771 8.1878 2 48 67.321 1.2862 7.7767 3 72 66.7921 1.8151 7.3164 4 96 66.2534 2.3538 7.1158 5 120 65.7522 2.855 6.9048 6 144 65.219 3.3882 6.8286 7 168 64.8135 3.7937 6.5536 8 192 64.401 4.2062 6.3579 9 216 64.0227 4.5845 6.1598
10 240 63.6256 4.9816 6.0240 11 264 63.1501 5.4571 5.9991 12 288 62.8914 5.7158 5.7599 13 312 62.7831 5.8241 5.4175 14 336 62.7164 5.8908 5.0882
IJSER

International Journal of Scientific & Engineering Research, Volume 7, Issue 8, August-2016 1795 ISSN 2229-5518
IJSER © 2016 http://www.ijser.org
Figure 6 Load-deflection curve of Low Carbon Steel specimen test using Instron 1122
Figure 7 Weight losses vs. immersion time
Figure 8 Corrosion rate vs. immersion time
Table 4 Distances between the two specimen’s legs for the two cases
IJSER

International Journal of Scientific & Engineering Research, Volume 7, Issue 8, August-2016 1796 ISSN 2229-5518
IJSER © 2016 http://www.ijser.org
(with immersion in the solution and without)
Immersion time – t (day)
without immersion in solution
Immersion in 0.1M sulfuric acid solution
d1R (mm)
d1S (mm)
d1 (mm)
d2R (mm)
d2S (mm)
d2 (mm)
1 50 27.1 42.51 50 27.1 35.19 2 42.51 23.16 36.59 35.19 25.24 29.5 3 36.59 20.09 33.11 29.5 22.12 25.18 4 33.11 17.24 29.52 25.18 19.6 21.5 5 29.52 14.18 26.08 21.5 17.06 18.6 6 26.08 12.21 23.14 18.6 14.12 16.09 7 23.14 10.05 20.64 16.09 12.23 13.32 8 20.64 8.34 18.53 13.32 10.11 11.51 9 18.53 7.29 16.89 11.51 8.21 9.52
10 16.89 6.51 15.17 9.52 7.14 8.44 11 15.17 6.08 13.31 8.44 6.39 7.52 12 13.31 5.52 12.44 7.52 6.05 6.82 13 12.44 5.17 11.67 6.82 5.6 6.54 14 11.67 5.06 11 6.54 5.11 6.18
Figure 9 Distance (d) vs. time (t) for non-immersed L.C.S. specimen
Figure 10 Distance (d) vs. immersion time (t) for L.C.S. specimen
immersed in 0.1M Sulfuric Acid solution
IJSER

International Journal of Scientific & Engineering Research, Volume 7, Issue 8, August-2016 1797 ISSN 2229-5518
IJSER © 2016 http://www.ijser.org
Figure 11 Optical photos (100X) of specimen’s surface shows the corrosion steps every day along test time
Fracture Line
1 2 3
4 5 6
7 8 9
10 11 12
13 14 15
IJSER

International Journal of Scientific & Engineering Research, Volume 7, Issue 8, August-2016 1798 ISSN 2229-5518
IJSER © 2016 http://www.ijser.org
Figure 12 Optical photos (100X) for the fracture line in the last day before fracture
IJSER

International Journal of Scientific & Engineering Research, Volume 7, Issue 8, August-2016 1799 ISSN 2229-5518
IJSER © 2016 http://www.ijser.org
Figure 13 Optical photos (100X) for the fracture surfaces last day after fracture
U-bend specimens usually contain both elastic and plastic strain. The applied strain is estimated from the bend conditions [20]. The stress of principal interest in the U-bend specimen is circumferential. It is not uniform because:
a) There is a stress gradient through the thickness varying from a maximum tension on the outer surface to a maximum compression on the inner surface.
b) The stress varies from zero at the ends of the specimen to a maximum at the center of the bend. c) The stress may vary across the width of the bend.
When the bending stress affected on the specimen’s legs, the surface of the convex region will represent a region of stress concentration, so the micro cracks will occur in this region more than the other. When the stressed specimens were exposed to the environment solution, the time required for cracks to develop must be noticed. This cracking initiation time was used as an estimate of the stress corrosion resistance of the material immersed in the environment, and it’s represent an indication for SCC susceptibility of this specimen to the used solution.
So with the sulfuric acid solution effects on this region by corrosion process phenomena will cause more micro pits initiation and their circumference will increased rapidly with the environment solution effects.
The cracks will initiate near or from the circumference of these pits and under the stresses concentration effect, and these cracks will propagate in any direction has a weakness resistance to the corrosion process or through the region which has more defects or residual cracks, and as a result, this
Frac
ture
Sur
face
s IJSER

International Journal of Scientific & Engineering Research, Volume 7, Issue 8, August-2016 1800 ISSN 2229-5518
IJSER © 2016 http://www.ijser.org
reaction will accelerate the specimen’s convex region to fracture as soon as possible with stress effects continuity.
In other hand, when we repeat the bending stress every day, the cracks will be increasing as a number and size with assistant of corrosion process which will be more effecting, and that will accelerate the failure time because of fatigue stress corrosion cracking process.
When the distance between specimen’s legs (d) was decreased by stress effect using the nut and bolt, a deformation may be happened in the bending surface which depends on the stress value. After removing this stress the new value of (d) will not be the same because of this deformation and the value of distance variance (∆d) is small, but with environment effect or with corrosion process, the value of (∆d) will be more than the previous because of cracks propagation effect which make the material’s flexibility down and down.
That’s mean the corrosion process affected the mechanical properties of the specimen metal. This is very clear from the Figures 9 and 10.
Figure 11 shows that the effect of stress and corrosion process began clearly from the third day of the test. The first day show a rough surface and then many pits were initiates gradually along or near the fracture line on the convex region of the specimen.
The material began loss its flexibility and strength more and more from fifth day until fracture happened because of increasing of the cracks which caused the beginning of failure process.
The corrosion rate of the specimen decreasing with increasing of immersion time because of the weight losses values (∆W) has a little variance when it compared with the immersion time increasing, and that is very clear from Figures 7 and 8. Figures 7 shows that the weight loss nearly is very little or approaches to constant value in the time interval 12<t<14 because the specimen approximately out of flexible region, or the stress effect was less than the previous days. In the Table 4 too, the distance variance (∆d) nearly stay constant in this interval for the same reason.
Figure 11 shows that the differences of corrosion surface (like pits and cracks size) between any two consecutive days were very clear especially between immersion time t=3 and the last day.
The cleaning process for the specimen’s surface every day and etching process removes the corrosion contaminations, and makes the surface ready for corrosion process more than if we don’t do that. This may be the main reason for acceleration the fracture of specimen.
There are two distinctive modes of crack propagation according to the path followed by the cracks. Cracks are intergranular when they propagate along grain boundaries and are transgranular if they run across the grains [16], in some cases following preferential crystallographic planes (cleavage planes), as illustrated in the fractographs shown in Figure 14. When we notice the corrosion and fracture surfaces shown in this figures, it seems that the crack propagation for this specimens in this test is intergranular, and this occurred according to specimen machining and structure.
Figure 14 Fractographs showing the typical appearance of: (a) Intergranular stress corrosion
cracking; and (b) Transgranular stress corrosion cracking. 4. Conclusion
The sulfuric acid solution is a high and more effectiveness corrosive media for low carbon steel metals because the value of Iron (Fe) percentage is high more than 90% which is the main factor for corrosion and the little percentage of the two elements (Cr and Mo) which make the specimen’s surface exposure to acidic solution was suffer from corrosion process. If the percentage of (Cr, Mo) elements is more than (8), it will make a thin film as soon as possible on the surface of the metal
IJSER

International Journal of Scientific & Engineering Research, Volume 7, Issue 8, August-2016 1801 ISSN 2229-5518
IJSER © 2016 http://www.ijser.org
immediately after the immersion process, and this will protect it from corrosion effects which occurred in stainless steel.
The stress effects accelerates the failure or fracture point because it’s increasing the cracks speed propagation, and is the same effect for the acidic solution. The micro cracks will occurred near the pits which may initiate as a result of acidic solution effect, so because of stress effect continuity these cracks will propagates and make more regions which represent a new corrosion surfaces, and this will caused the fracture.
The flexibility of specimen was decreased when it immersed in acidic solution comparing with stress effect only because of corrosion effect as an additional factor, especially in the immersion time interval (3 ≤ t ≤ 14 days), which is clear from the graphs.
The weight loss value is depending on immersion time because of corroded surfaces will be more area as a result of corrosion process.
References 1- Samuel A. Bradford, Corrosion Control, 2nd edition, Alberto, Canada, 2001. 2- Howard S. Bean, “Materials of Engineering”, National Bureau of Standards, USA, p 97. 3- Philip A. Schweitzer, Fundamentals of Metallic Corrosion, 2nd edition, USA , 2007. 4- Philip A. Schweitzer, P. E., “Metallic Materials, Physical, Mechanical, and Corrosion
Properties”, CRC Press, USA, 2003, P 13. 5- R.Winston Revie, Herbert H. Uhlig, Corrosion and Corrosion Control, an Introduction to
Corrosion Science and Engineering, 4th Edition, Wiley Publication, 2008. 6- Roberge PR. “Corrosion Basic – An Introduction”, 2nd Edition, Houston, Tex: NACE
International, 2006, p 35. 7- J. R. Davis, Corrosion, Understanding the Basics, ASM International, Ohio, 2000. 8- ASM International, Handbook, Corrosion, vol13 , 1992. 9- Mars G. Fontana, Corrosion Engineering, 3rd Edition, Ohio, 1987. 10- Pierre R. Roberge, Corrosion Engineering , Principles and Practice, USA, 2008. 11- Talbot David , James , Corrosion Science and Technology , CRC Series , New York , 1998. 12- Pierre R. Roberge, Handbook of Corrosion Engineering, 1999 , USA. 13- Denny A. Jones, Principles and Prevention of Corrosion, 2nd , University of Nevada, 1996. 14- Robert Baboian, “Corrosion Tests and Standards”, 2nd , ASTM, USA, 2005. 15- Subramanian R., "Strength of Materials", Oxford University Press, Oxford Higher Education
Series, 2007 16- J. N. Reddy, “Principles of Continuum Mechanics”, Cambridge University Press, USA, 2010. 17- ASTM G30-97(2003) standard practice for making and using u-bend stress-corrosion test
specimens. 2003, West Conshohocken: ASTM International. 18- ASTM, G1, “Standard Practice for Preparing, Cleaning, and Evaluating corrosion Test
Specimens”. 19- ASTM, G31, “Standard Practice for Laboratory Immersion Corrosion Testing of Metals”. 20- Lietai Yang, Techniques for Corrosion Monitoring, Woodhead publishing limited, England,
2008.
IJSER