Embed Size (px)
Citation preview
Claremont CollegesScholarship @ Claremont
CMC Senior Theses CMC Student Scholarship
2019
Studying Geometric Optical Illusions through theLens of a Convolutional Neural NetworkNick LaBergeClaremont McKenna College
This Open Access Senior Thesis is brought to you by Scholarship@Claremont. It has been accepted for inclusion in this collection by an authorizedadministrator. For more information, please contact [email protected].
Recommended CitationLaBerge, Nick, "Studying Geometric Optical Illusions through the Lens of a Convolutional Neural Network" (2019). CMC SeniorTheses. 2265.https://scholarship.claremont.edu/cmc_theses/2265
Studying Geometric Optical Illusions through the Lens of a
Convolutional Neural Network
A Thesis Presented by
Nick LaBerge
To the Keck Science Department
Of Claremont McKenna, Pitzer, and Scripps Colleges
In partial fulfillment of
The degree of Bachelor of Arts
Senior Thesis in Physics
28 April 2019
Table of Contents
Abstract 2
1. Introduction 3
1.1 Geometric Optical Illusions 3
1.2 Convolutional Neural Networks 6
1.3 Neural Networks and Optical Illusions 10
1.4 Motivation 11
2. Project Design 12
2.1 Illusion Data 12
2.2 Network Architecture and Hyperparameters 13
2.3 Image Variability 14
2.4 Training 16
3. First Iteration 17
3.1 Results 17
3.2 Discussion 17
4. Second Iteration 19
4.1 Design 19
4.2 Results 19
3.3 Discussion 20
5. Conclusion 21
6. Works Cited 23
1
Abstract
Geometrical optical illusions such as the Muller Lyer illusion and the Ponzo illusion have been
widely researched over the past 100+ years, yet researchers have not reached a consensus on why
human perception is deceived by these illusions or which illusions are the results of the same
effects. In this paper, I study these illusions through the lens of a convolutional neural network.
First, I successfully train the network to correctly classify how a human would perceive a
particular class of illusion (such as the Muller Lyer illusion), then I test the network’s ability to
generalize to illusions that it was not trained on (like the Ponzo illusion). I do not find that these
networks generalize effectively. Tests to better understand how the network learns to classify
these illusions suggest the networks are checking for image data in specific ‘activation regions’
in order to make classifications rather than analyzing the entire illusions.
2
1. Introduction
1.1 Geometric Optical Illusions
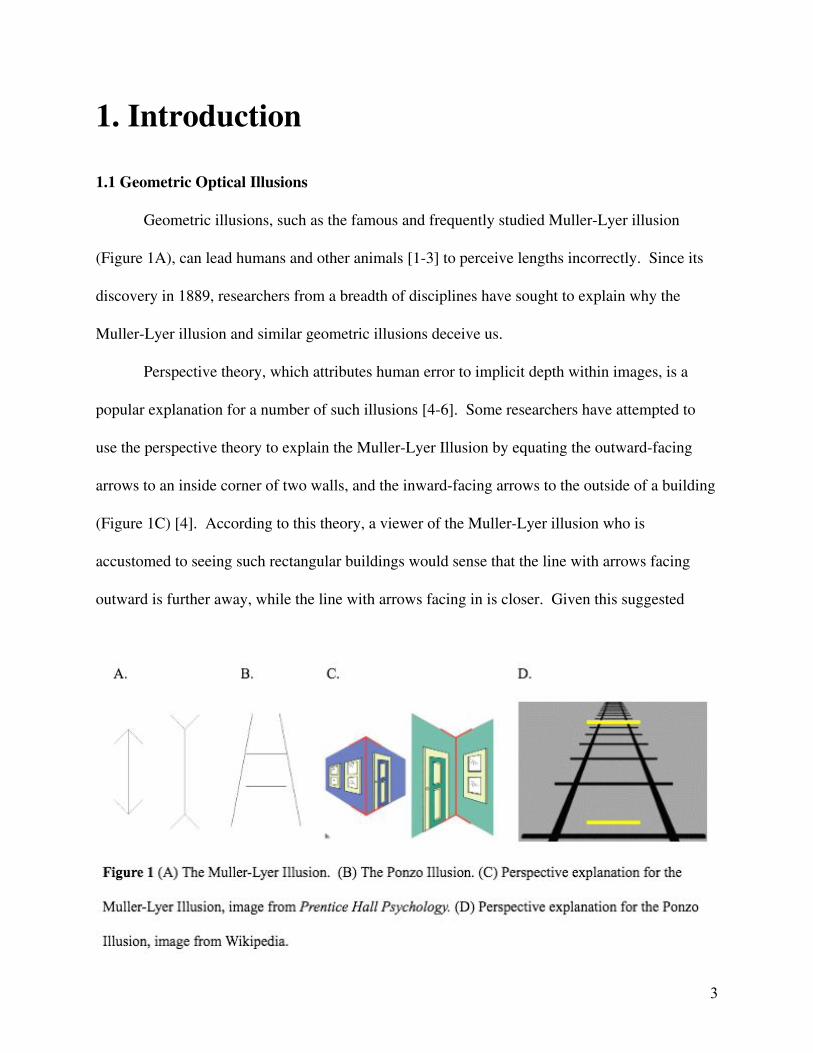
Geometric illusions, such as the famous and frequently studied Muller-Lyer illusion
(Figure 1A), can lead humans and other animals [1-3] to perceive lengths incorrectly. Since its
discovery in 1889, researchers from a breadth of disciplines have sought to explain why the
Muller-Lyer illusion and similar geometric illusions deceive us.
Perspective theory, which attributes human error to implicit depth within images, is a
popular explanation for a number of such illusions [4-6]. Some researchers have attempted to
use the perspective theory to explain the Muller-Lyer Illusion by equating the outward-facing
arrows to an inside corner of two walls, and the inward-facing arrows to the outside of a building
(Figure 1C) [4]. According to this theory, a viewer of the Muller-Lyer illusion who is
accustomed to seeing such rectangular buildings would sense that the line with arrows facing
outward is further away, while the line with arrows facing in is closer. Given this suggested
3
depth, the line that is further away would appear shorter if the lines really were the same length
because apparent size decreases with distance. Because the parallel lines in the image are the
same length, the viewer’s three-dimensional understanding of the image leads them to mistake
the further line as longer than the closer line in order to compensate for the effects of distance on
apparent size. Similarly, observers of the Ponzo illusion shown in Figure 1B could equate the
contextual lines to parallel train-tracks such that the top line is perceived to be further away,
leading the observer to the conclusion that the further line is longer as in Figure 1D. [4]. This
theory suggests that only individuals familiar with the situations that trigger a sense of depth
would perceive the illusion. For example, individuals who live in urban settings with a lot of
rectangular buildings would be expected to experience the illusion to a greater extent than
individuals living in rural settings with round cornerless buildings if the perspective explanation
is a leading cause of the illusion. Segall, Campbell and Herskovits [5] tested this hypothesis and
found support for the perspective theory; however, others failed to replicate the findings [6] .
Howe and Purves [7] similarly hypothesized that humans are fooled by the Muller-Lyer
illusion due to what humans are accustomed to observing, but their explanation looks purely to
natural settings. They computationally filtered a data set of pictures of nature to find instances
resembling the Muller-Lyer illusion. For each match of the illusion, they recorded the length of
the shaft and whether the arrows pointed inward or outward. Then, they ran statistics on the
results, finding that the shaft was more likely to be longer in the cases that the arrows point
outward, and shorter in the cases that the arrows point inward. They replicated these findings for
a number of variations on the Muller-Lyer illusion as well. They conclude that humans likely
evolved to see the discrepancy in lengths based on this probabilistic phenomena in nature. The
4
finding that outward facing arrows tend to be further apart in nature than inward facing arrows is
very curious and cannot be readily explained, and it seems unlikely that this explanation would
extend to other geometrical optical illusions. Accordingly, It would be worthwhile to replicate
these findings on additional data.
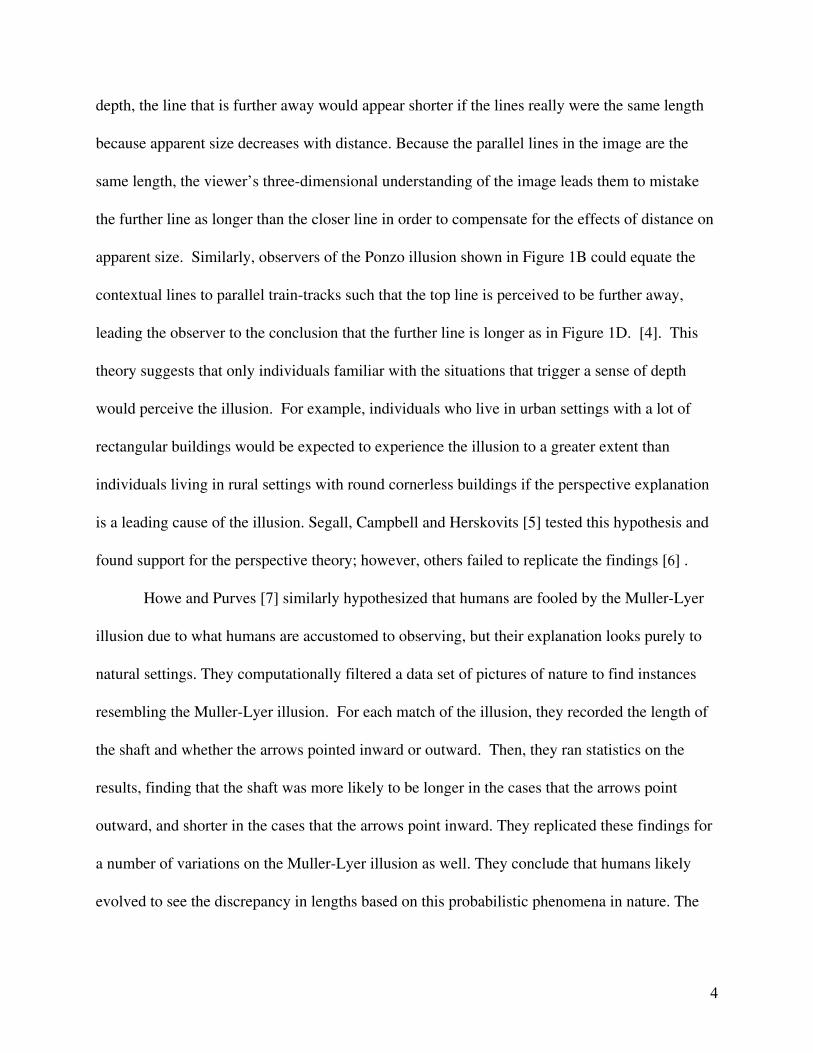
Another explanation for a number of these
geometric optical illusions including the Muller-Lyer
illusion is that our sensory system looks to the centroid (the
center of mass) of the context-lines in order to determine
where lines start and end. Searleman, Porac, Alvin, and
Peaslee [8] place bold dots in various locations of the
Muller-Lyer, Ponzo, and Vertical Horizontal illusions in
order to shift the centers of mass of the lines’ endpoints as
demonstrated in Figure 2. Their findings show that lines
with contextual mass shifted outward are perceived to be
longer, which lends support to the centroid explanation.
However, it was not always found that the widest dots had
the most dramatic effects on perception, suggesting that
other effects may be at play. Also, the addition of these dots may give rise to an independent
illusion that complements the Muller-Lyer, Ponzo, and Vertical Horizontal illusions core effects
but is not fundamentally related to the cause of the original illusions. Bulatov, Bertulis,
Mickiene, Surkys, and Bielevicius [9] test the centroid theory by rotating the context arrows such
that the centers of mass shift as depicted in Figure 3. They find that the extent to which humans
5
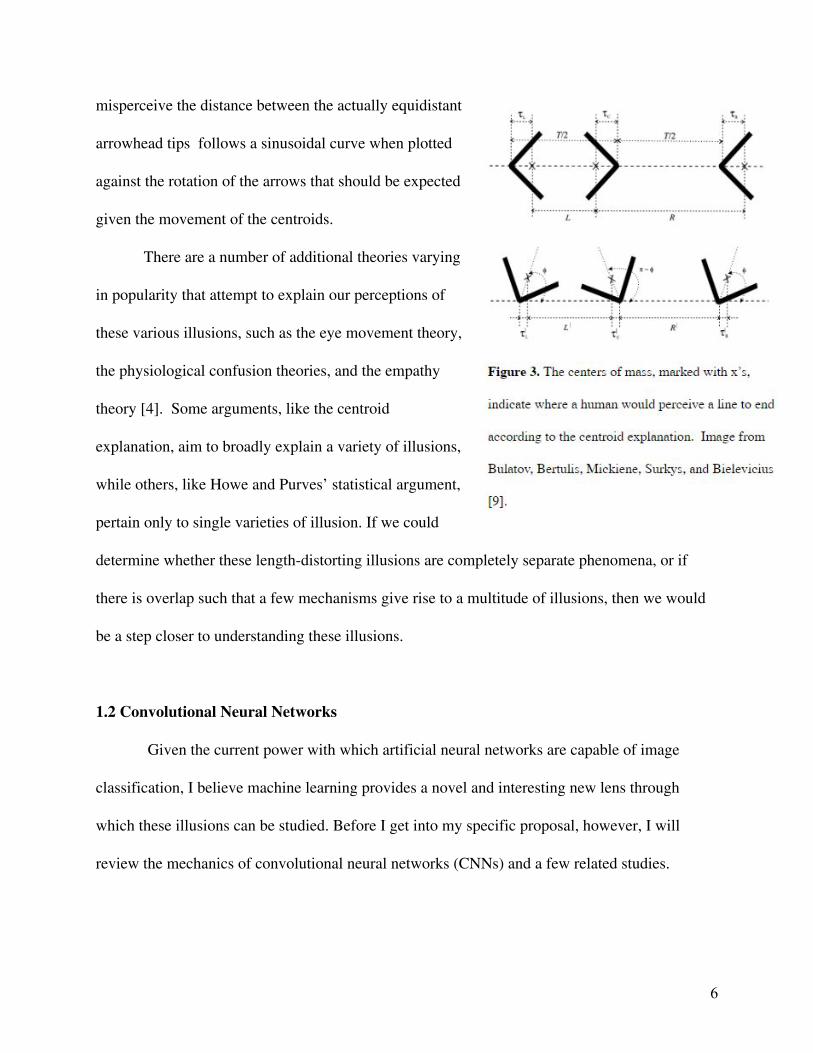
misperceive the distance between the actually equidistant
arrowhead tips follows a sinusoidal curve when plotted
against the rotation of the arrows that should be expected
given the movement of the centroids.
There are a number of additional theories varying
in popularity that attempt to explain our perceptions of
these various illusions, such as the eye movement theory,
the physiological confusion theories, and the empathy
theory [4]. Some arguments, like the centroid
explanation, aim to broadly explain a variety of illusions,
while others, like Howe and Purves’ statistical argument,
pertain only to single varieties of illusion. If we could
determine whether these length-distorting illusions are completely separate phenomena, or if
there is overlap such that a few mechanisms give rise to a multitude of illusions, then we would
be a step closer to understanding these illusions.
1.2 Convolutional Neural Networks
Given the current power with which artificial neural networks are capable of image
classification, I believe machine learning provides a novel and interesting new lens through
which these illusions can be studied. Before I get into my specific proposal, however, I will
review the mechanics of convolutional neural networks (CNNs) and a few related studies.
6
CNNs are computational models that can be trained for image recognition and
classification. While there are a large number of components that can be incorporated into a
CNN, the three most common elements are convolutional layers, pooling layers, and dense
layers. Each layer takes in a multidimensional array as an input, executes various functions on
the input, then outputs a modified array such that these layers can be linked together as
necessary. If an input color image is 100 pixels wide and 100 pixels high, then its dimensions as
it is passed to the first layer of the network would be 100x100x3; the depth of 3 comes from the
red, green, and blue components of the color image. These components are referred to as
channels, and they can be thought of as being stacked on top of each other as inputs to the
network. In this project, however, I will be working with grayscale images so my image inputs
have a depth of 1 (one channel) and happen to be shaped 112x112x1.
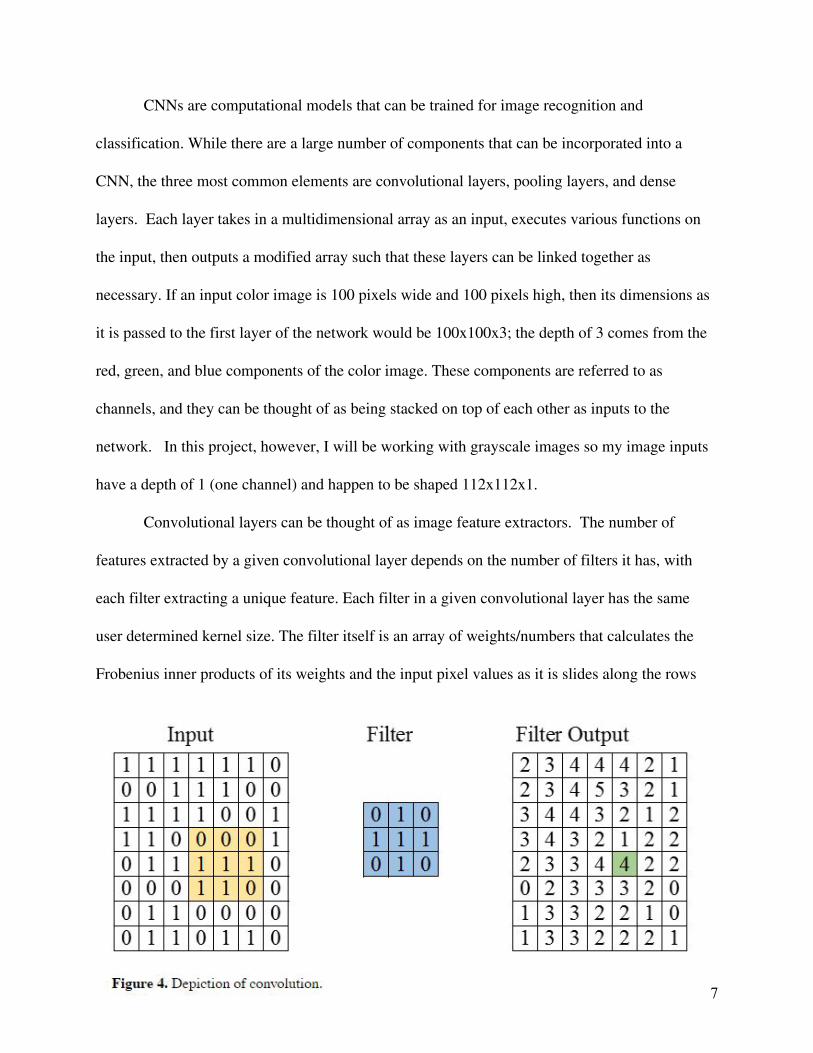
Convolutional layers can be thought of as image feature extractors. The number of
features extracted by a given convolutional layer depends on the number of filters it has, with
each filter extracting a unique feature. Each filter in a given convolutional layer has the same
user determined kernel size. The filter itself is an array of weights/numbers that calculates the
Frobenius inner products of its weights and the input pixel values as it is slides along the rows
7
and columns of the layer’s inputs. This process is depicted in Figure 4 with an input image size
of 7x7x1 and a filter kernel size of 3x3. The features that each filter extracts depends upon the
filter’s weights, and these weights are optimized with gradient descent as the neural network is
trained. The convolutional layer can also take an activation function as an input in order to
introduce non-linearity to the network. The rectified linear unit function (ReLU) is a very
popular and simple activation function for convolutional layers that sets any negative potential
outputs to zero and leaves positive outputs the same. Put mathematically, ReLU(x)=max(0, x).
The number of filters, the kernel size of the filters, and the activation function used in the layer
can be varied to optimize feature extraction and are examples of network ‘hyperparameters.’
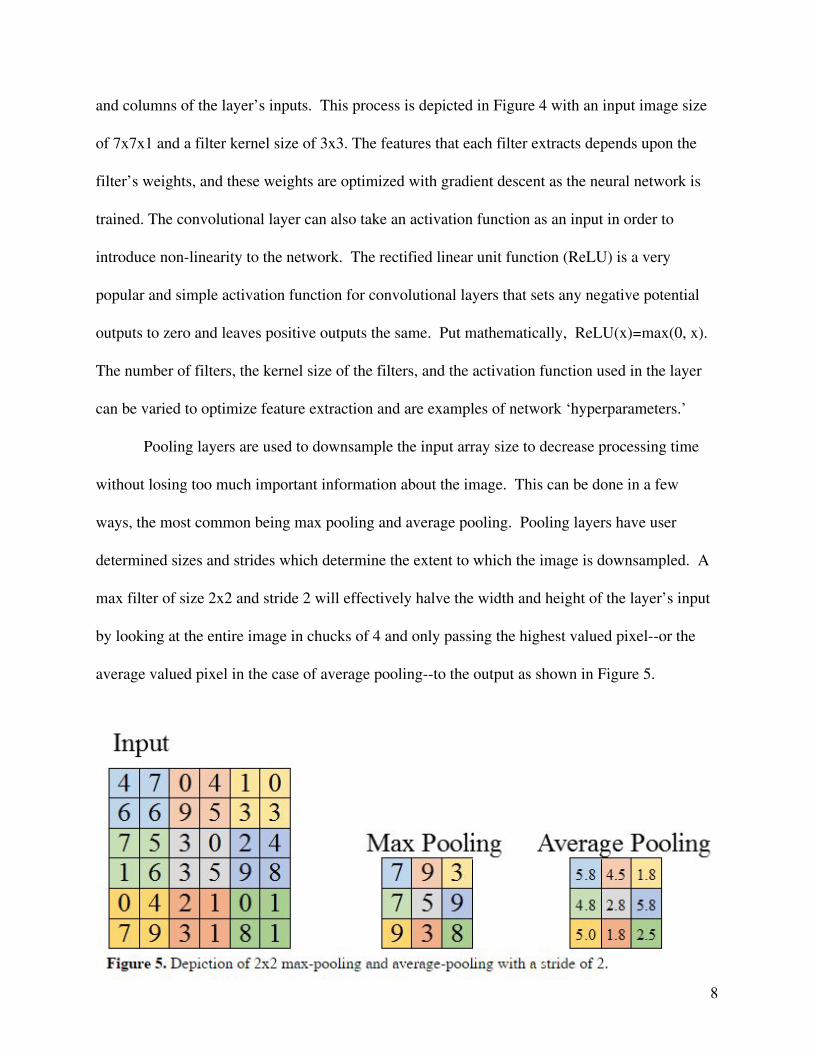
Pooling layers are used to downsample the input array size to decrease processing time
without losing too much important information about the image. This can be done in a few
ways, the most common being max pooling and average pooling. Pooling layers have user
determined sizes and strides which determine the extent to which the image is downsampled. A
max filter of size 2x2 and stride 2 will effectively halve the width and height of the layer’s input
by looking at the entire image in chucks of 4 and only passing the highest valued pixel--or the
average valued pixel in the case of average pooling--to the output as shown in Figure 5.
8
The dense layers in the neural network use the features that are extracted by the
convolutional layers and downsampled by the pooling layers to execute the actual image
classification. Dense layers are made up of a given number of neurons, and each neuron is
connected to every element of the input. These neurons each have weights that are optimized
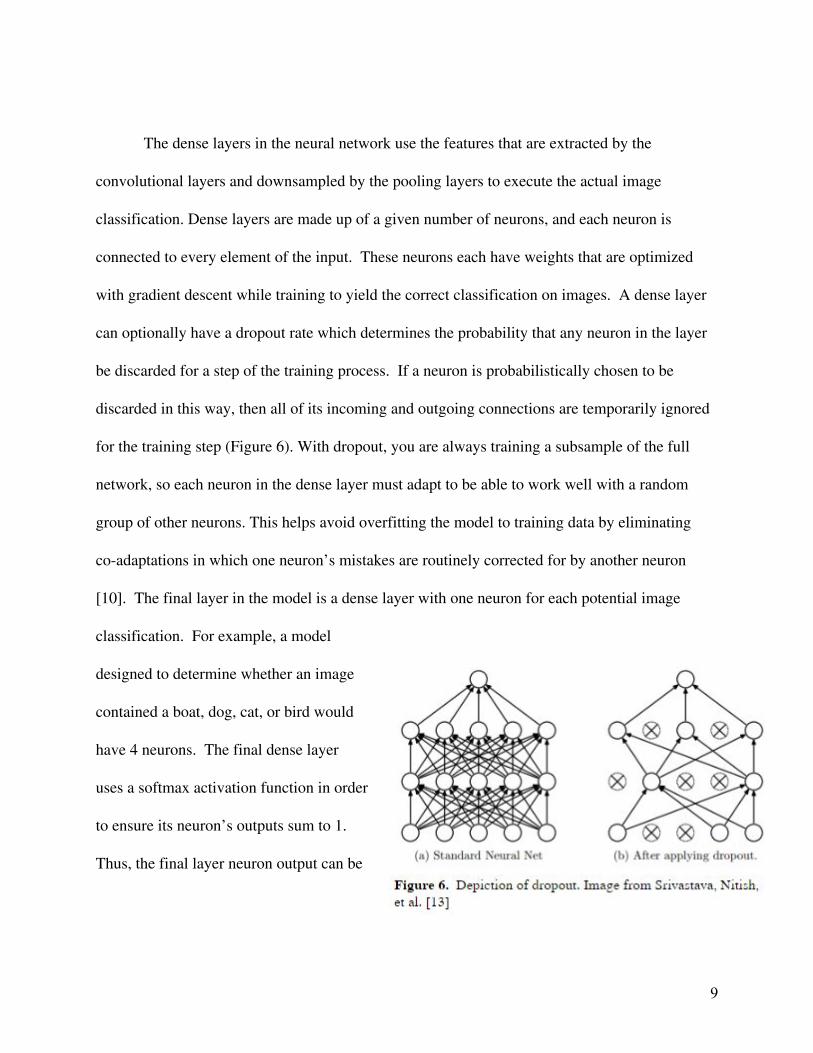
with gradient descent while training to yield the correct classification on images. A dense layer
can optionally have a dropout rate which determines the probability that any neuron in the layer
be discarded for a step of the training process. If a neuron is probabilistically chosen to be
discarded in this way, then all of its incoming and outgoing connections are temporarily ignored
for the training step (Figure 6). With dropout, you are always training a subsample of the full
network, so each neuron in the dense layer must adapt to be able to work well with a random
group of other neurons. This helps avoid overfitting the model to training data by eliminating
co-adaptations in which one neuron’s mistakes are routinely corrected for by another neuron
[10]. The final layer in the model is a dense layer with one neuron for each potential image
classification. For example, a model
designed to determine whether an image
contained a boat, dog, cat, or bird would
have 4 neurons. The final dense layer
uses a softmax activation function in order
to ensure its neuron’s outputs sum to 1.
Thus, the final layer neuron output can be
9
interpreted as the model’s percentage confidence in its classification prediction.
A trained model can take in images that it was not trained on and (hopefully) be able to
generalize beyond its training set to make image classifications. Input images for classification
undergo a similar process to what occurs in training the model. First, the image goes through a
series of convolutional layers and pooling layers as features are extracted and downsampled.
Then, the neurons in the dense layers take in the features and output the product of the features
and the neurons’ weights. The neuron in the final dense layer of the model with the highest
value represents the models guess at what category the input image falls into. While conducting
this research, I relied on course material from Stanford University’s Convolutional Neural
Networks for Visual Recognition course for an in depth and technical explanation of
convolutional neural networks [11].
1.3 Neural Networks and Optical Illusions
Zeman, Obst, Brooks and Rich [12] examined the effects of the Muller-Lyer illusion on a
biologically plausible computational neural network. First, they trained their network to execute
a categorical classification of line length. After the network was capable of classifying lines of
varying lengths into the categories ‘longer’ and ‘shorter’ to 90% accuracy, they introduced the
Muller-Lyer illusion and found that their machine learning algorithm misclassified the lengths of
the illusion similarly to how a human would misclassify the images. They used these findings to
suggest the Muller-Lyer illusion can influence an observer without taking into account any real
world contexts, as their model was not trained on any real world images. Their network,
however, did not have any means of differentiating between the contextual lines (the arrows) and
10
the shafts. Accordingly, it is possible that the network was classifying short vs. long based on
lengths of the entire illusion, which is not how the illusion is intended to be perceived.
More recently, Williams, and Yampolskiy [13] described efforts to train a generative
adversarial network (GAN) to generate novel optical illusions. They trained their network with a
data set of 6,436 images they gathered from a number of online resources. Their generative
network did not create any interesting images, and they made their image set available to others
in hopes to help future researchers. Upon inspection, their image set was not ideal as some of the
included images were not optical illusions and the content of each image varied widely. Hence it
it not surprising that their attempt largely failed.
1.4 Motivation
In this thesis, I test the hypothesis that a number of length-distortion geometric optical
illusions share underlying commonalities that an artificial neural network would be able to detect
which are not immediately obvious to the human observer. Like Zeman, Obst, Brooks and Rich,
I use a neural network in my experiment; however, I do not train the network to gauge varying
line lengths but rather to gauge how a human would perceive line lengths in the context of
optical illusions. Then, I introduce the network to a geometric illusion that it was not trained on.
If the network successfully determines which lines a human would perceive as longer or shorter
in the new variation of illusion, it would suggest that the training set of optical illusions share
underlying commonalities with the new illusion.
11
2. Project Design
2.1 Illusion Data
I chose to test potential relationships between the Muller-Lyer and Ponzo illusions
because they are both length-distortion geometric optical illusions comprised of straight lines and
can be geometrically varied and still exhibit the same illusions. This should help the neural
network learn generalizations of how the optical illusions work rather than learning a few
specific examples of each illusion (overfitting). For example, the Muller-Lyer illusion persists
when rotated at angles, when arrows are long, when arrows are short, when arrows are in a wide
variation of spreads, and when the illusion is configured into a single line. Also, there are various
situations in which there is no illusion, and a human would perceive both lines as equally
lengthed. This permits me to train the neural network to identify images in which there is no
optical illusion present. The same is true for the Ponzo illusion.
Because there are not any public data sets available containing highly varied images of
the Muller-Lyer and Ponzo illusions, I created my own data set. I algorithmically created these
images in conjunction with labels that indicate how a human would perceive each illusion. The
images are grayscale, such that each pixel can take on a value between 0 (black) and 255 (white).
The lines in each image are divided into three categories, Line A, Line B, and Context Lines,
each consistently specified by a different greyscale value. Line A is made up of pixels of
brightness 10, Line B is made up of pixels of brightness 20, and the context lines are made from
pixels of brightness 1. This way, the network is able to differentiate between which lines it is
12
comparing and which lines serve as context. Accordingly, each image was assigned one of three
different possible labels: Line A appears longer than Line B to the human eye, Line B appears
longer than Line A to the human eye, or Line A and Line B appear to be the same length to the
human eye. These labels are determined as the images are created
based on the type of illusion in the image. For example, an
Muller-Lyer image in which line A has inward facing lines and line
B has outward facing lines would label line B as appearing longer
than line A. I varied the angles, locations, and lengths of the
image context lines as discussed and kept the lines A and B fixed
for all images. I chose to make the images 112 pixels in width and
height in order to balance resolution with size.
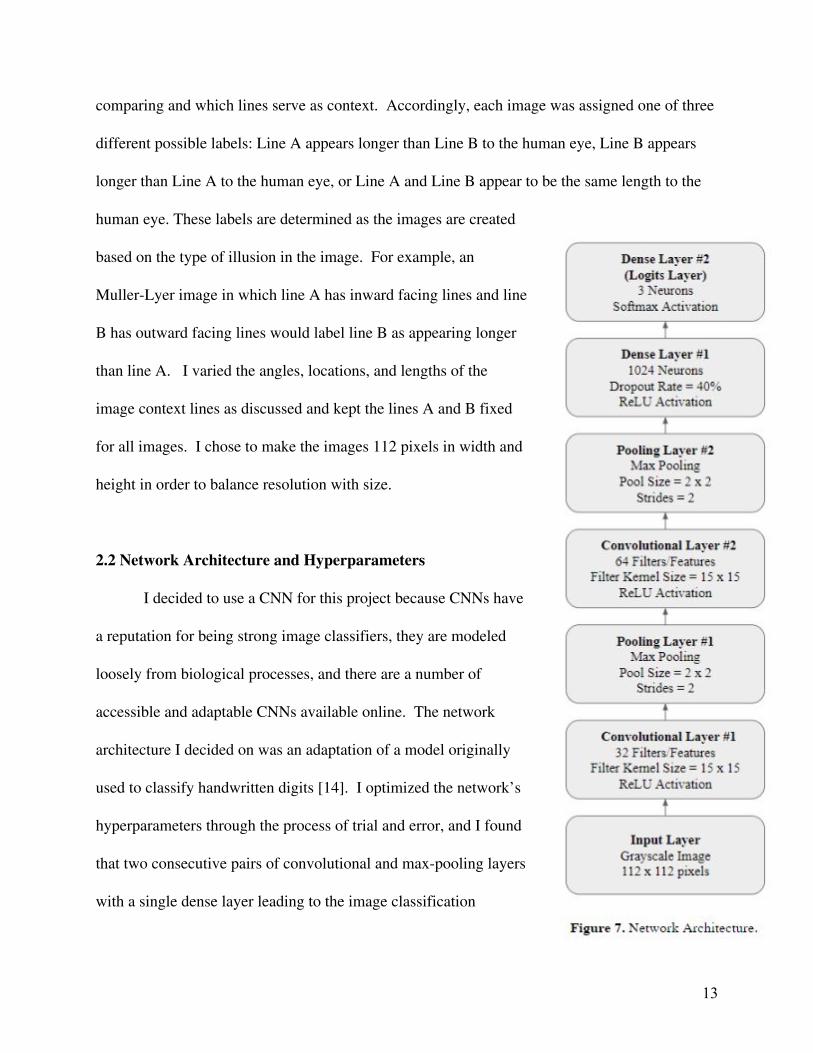
2.2 Network Architecture and Hyperparameters
I decided to use a CNN for this project because CNNs have
a reputation for being strong image classifiers, they are modeled
loosely from biological processes, and there are a number of
accessible and adaptable CNNs available online. The network
architecture I decided on was an adaptation of a model originally
used to classify handwritten digits [14]. I optimized the network’s
hyperparameters through the process of trial and error, and I found
that two consecutive pairs of convolutional and max-pooling layers
with a single dense layer leading to the image classification
13
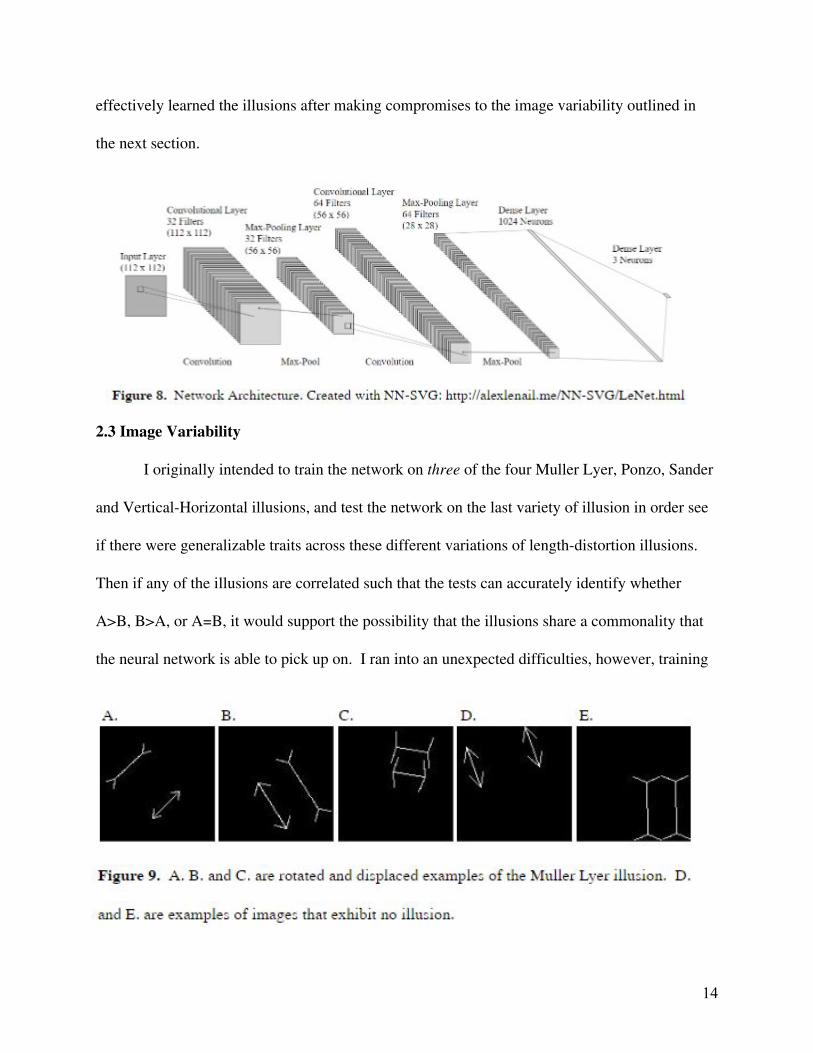
effectively learned the illusions after making compromises to the image variability outlined in
the next section.
2.3 Image Variability
I originally intended to train the network on three of the four Muller Lyer, Ponzo, Sander
and Vertical-Horizontal illusions, and test the network on the last variety of illusion in order see
if there were generalizable traits across these different variations of length-distortion illusions.
Then if any of the illusions are correlated such that the tests can accurately identify whether
A>B, B>A, or A=B, it would support the possibility that the illusions share a commonality that
the neural network is able to pick up on. I ran into an unexpected difficulties, however, training
14
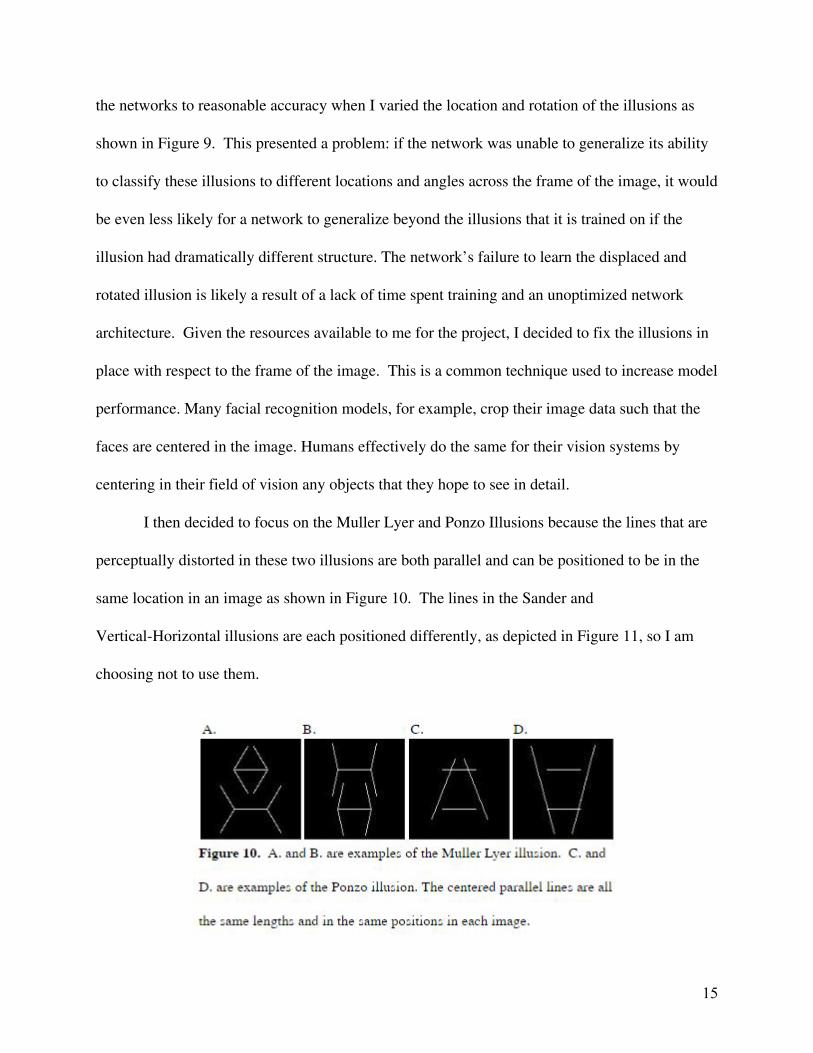
the networks to reasonable accuracy when I varied the location and rotation of the illusions as
shown in Figure 9. This presented a problem: if the network was unable to generalize its ability
to classify these illusions to different locations and angles across the frame of the image, it would
be even less likely for a network to generalize beyond the illusions that it is trained on if the
illusion had dramatically different structure. The network’s failure to learn the displaced and
rotated illusion is likely a result of a lack of time spent training and an unoptimized network
architecture. Given the resources available to me for the project, I decided to fix the illusions in
place with respect to the frame of the image. This is a common technique used to increase model
performance. Many facial recognition models, for example, crop their image data such that the
faces are centered in the image. Humans effectively do the same for their vision systems by
centering in their field of vision any objects that they hope to see in detail.
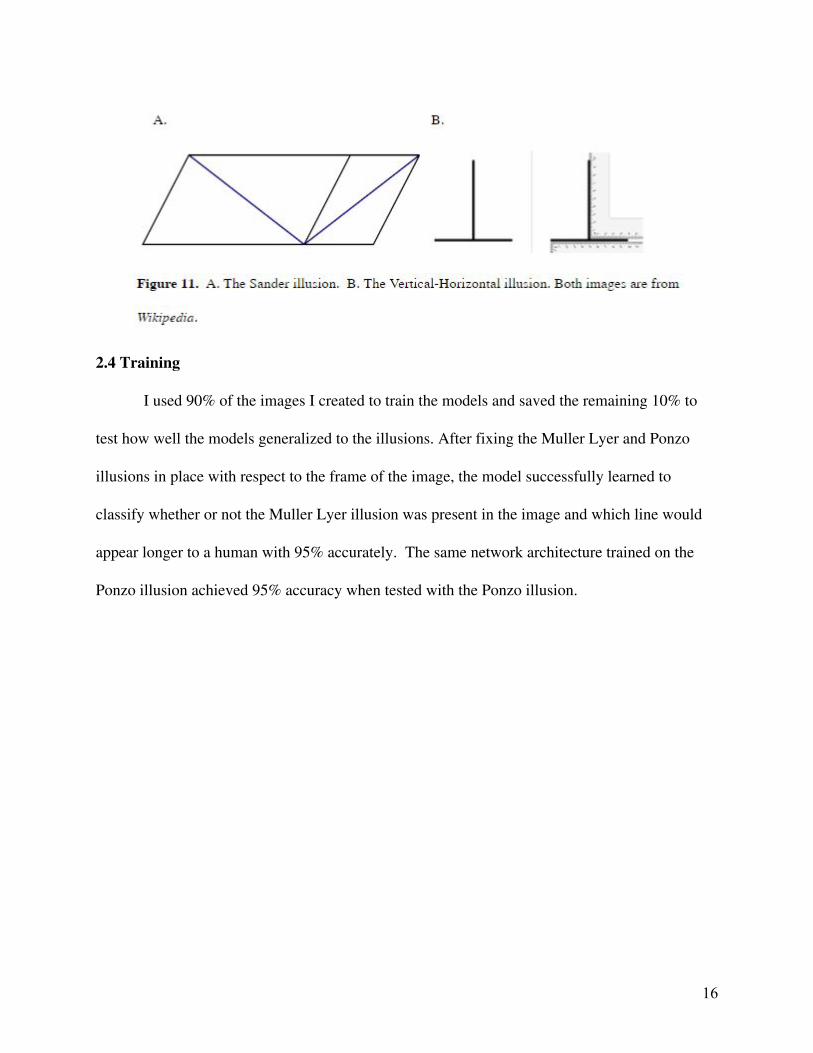
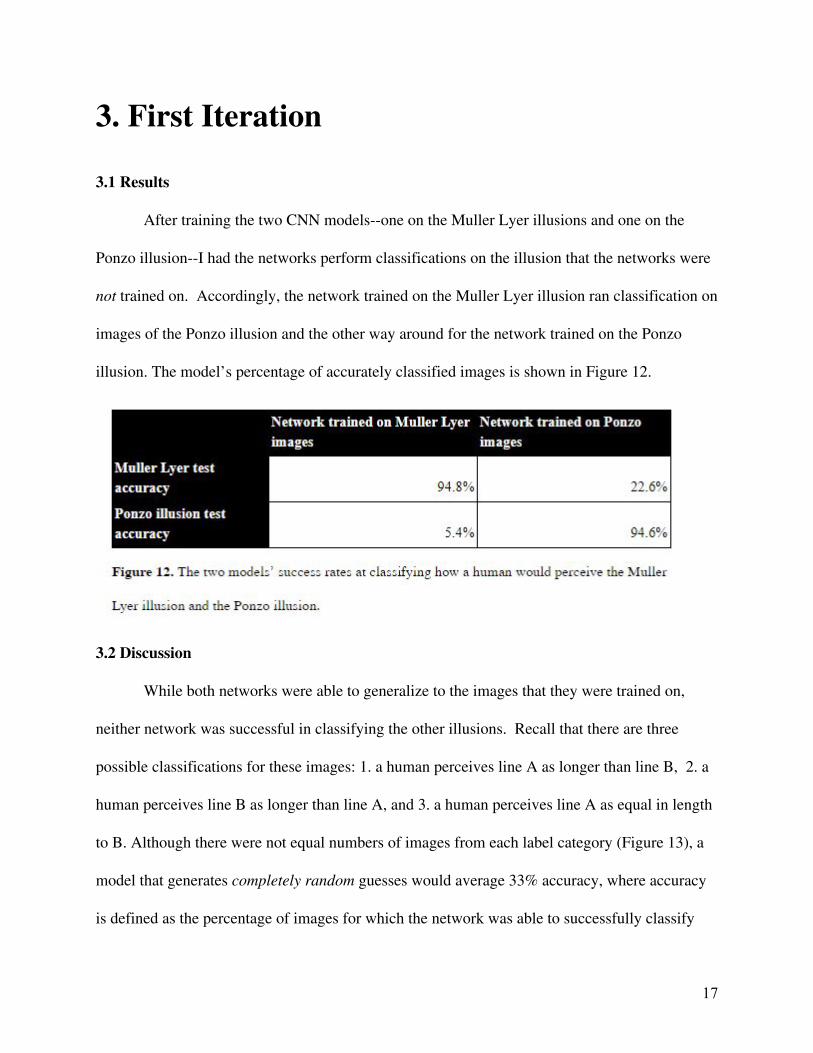
I then decided to focus on the Muller Lyer and Ponzo Illusions because the lines that are
perceptually distorted in these two illusions are both parallel and can be positioned to be in the
same location in an image as shown in Figure 10. The lines in the Sander and
Vertical-Horizontal illusions are each positioned differently, as depicted in Figure 11, so I am
choosing not to use them.
15
2.4 Training
I used 90% of the images I created to train the models and saved the remaining 10% to
test how well the models generalized to the illusions. After fixing the Muller Lyer and Ponzo
illusions in place with respect to the frame of the image, the model successfully learned to
classify whether or not the Muller Lyer illusion was present in the image and which line would
appear longer to a human with 95% accurately. The same network architecture trained on the
Ponzo illusion achieved 95% accuracy when tested with the Ponzo illusion.
16
3. First Iteration
3.1 Results
After training the two CNN models--one on the Muller Lyer illusions and one on the
Ponzo illusion--I had the networks perform classifications on the illusion that the networks were
not trained on. Accordingly, the network trained on the Muller Lyer illusion ran classification on
images of the Ponzo illusion and the other way around for the network trained on the Ponzo
illusion. The model’s percentage of accurately classified images is shown in Figure 12.
3.2 Discussion
While both networks were able to generalize to the images that they were trained on,
neither network was successful in classifying the other illusions. Recall that there are three
possible classifications for these images: 1. a human perceives line A as longer than line B, 2. a
human perceives line B as longer than line A, and 3. a human perceives line A as equal in length
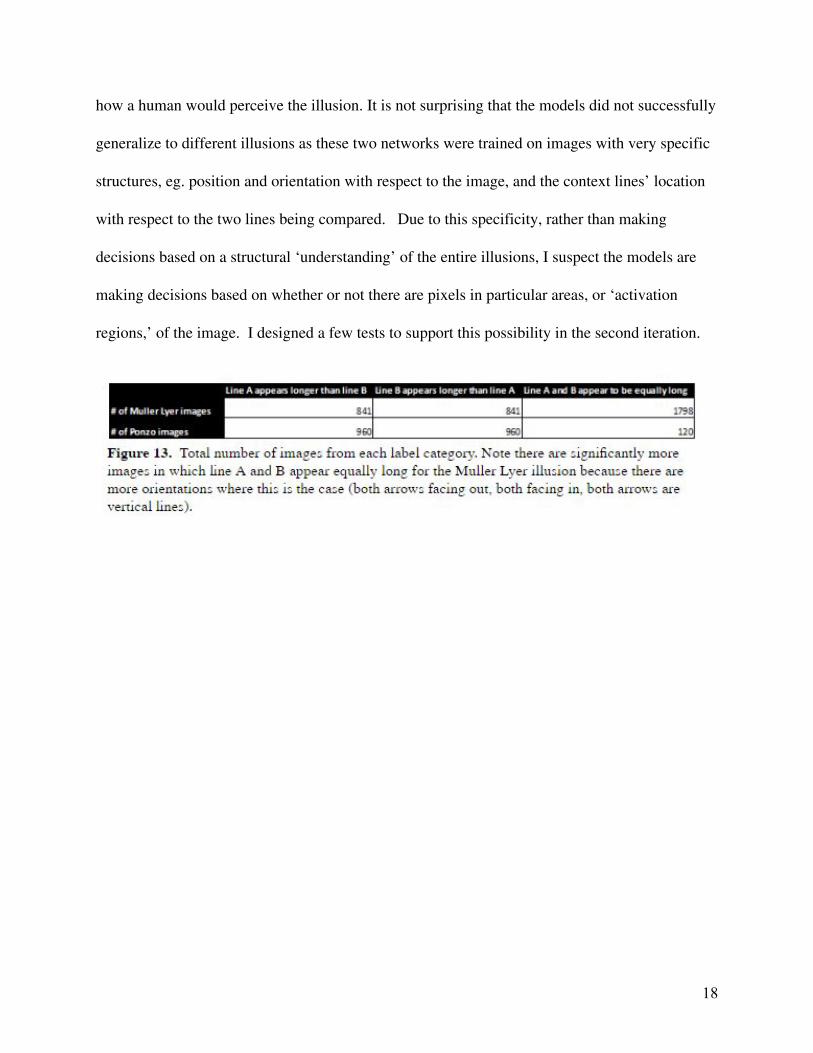
to B. Although there were not equal numbers of images from each label category (Figure 13), a
model that generates completely random guesses would average 33% accuracy, where accuracy
is defined as the percentage of images for which the network was able to successfully classify
17
how a human would perceive the illusion. It is not surprising that the models did not successfully
generalize to different illusions as these two networks were trained on images with very specific
structures, eg. position and orientation with respect to the image, and the context lines’ location
with respect to the two lines being compared. Due to this specificity, rather than making
decisions based on a structural ‘understanding’ of the entire illusions, I suspect the models are
making decisions based on whether or not there are pixels in particular areas, or ‘activation
regions,’ of the image. I designed a few tests to support this possibility in the second iteration.
18
4. Second Iteration
4.1 Design
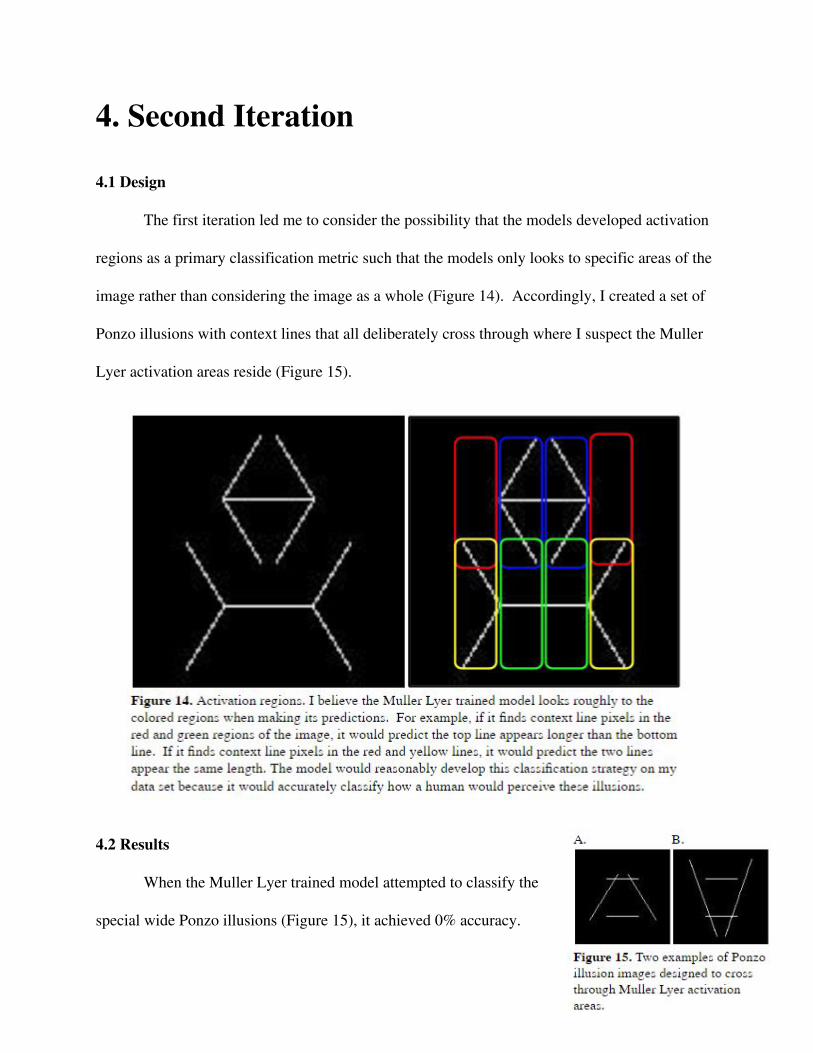
The first iteration led me to consider the possibility that the models developed activation
regions as a primary classification metric such that the models only looks to specific areas of the
image rather than considering the image as a whole (Figure 14). Accordingly, I created a set of
Ponzo illusions with context lines that all deliberately cross through where I suspect the Muller
Lyer activation areas reside (Figure 15).
4.2 Results
When the Muller Lyer trained model attempted to classify the
special wide Ponzo illusions (Figure 15), it achieved 0% accuracy.
19
4.3 Discussion
The finding that the Ponzo image set designed to cross through the Muller Lyer activation
areas was 100% misclassified by the Muller Lyer trained model is an expected result of the
activation area hypothesis for the network’s classification strategy. Consider image A from
Figure 15; a human observer perceives the top line as longer than the bottom line. Thus the
image is labeled: top line > bottom line. From the perspective of the Muller Lyer trained model,
however, there are pixels crossing predominantly through the blue and yellow activation regions,
signalling that the top line likely has inward facing arrows (shorter in appearance) and the
bottom line has outward facing arrows (longer in appearance) such that the Muller Lyer trained
model would predict the image should be classified: top line < bottom line. While this test does
not definitively establish the Muller Lyer trained method image classification, it does support the
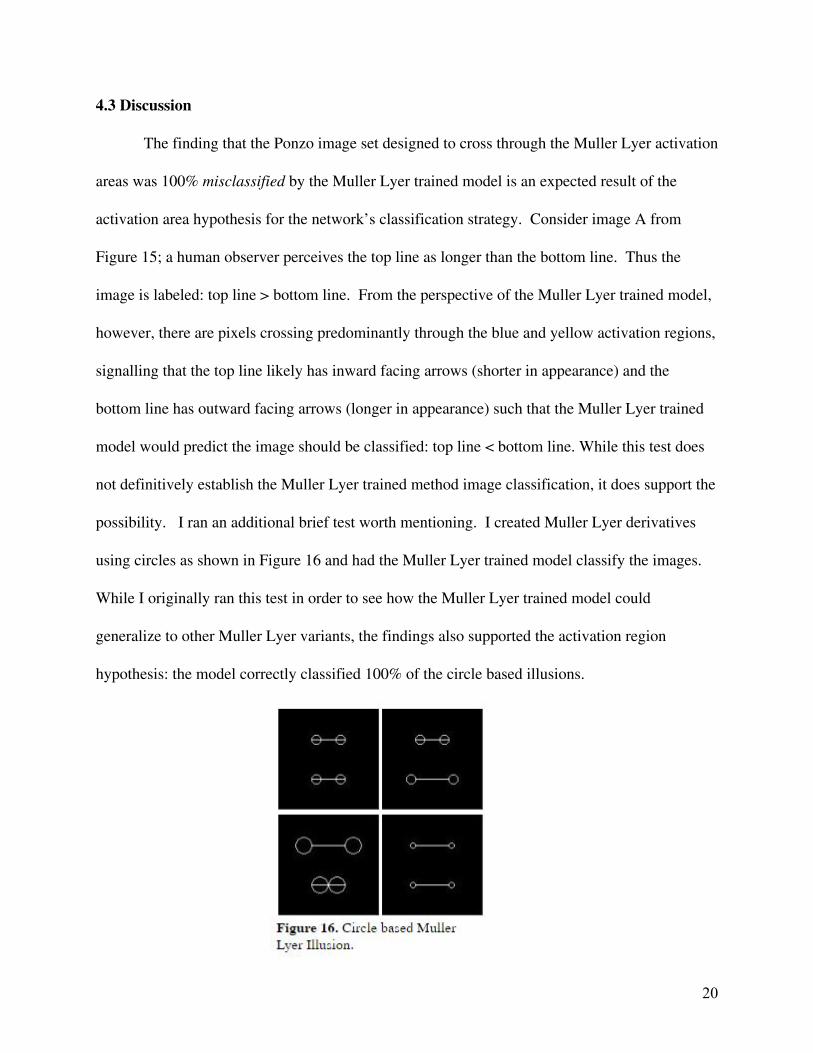
possibility. I ran an additional brief test worth mentioning. I created Muller Lyer derivatives
using circles as shown in Figure 16 and had the Muller Lyer trained model classify the images.
While I originally ran this test in order to see how the Muller Lyer trained model could
generalize to other Muller Lyer variants, the findings also supported the activation region
hypothesis: the model correctly classified 100% of the circle based illusions.
20
5. Conclusion
While the CNN models I created for the illusion classification problem failed to
generalize in a manner that would suggest unintuitive similarities between the illusions as they
may pertain to humans, it is still interesting to analyze the artificial neural networks in their own
right. The CNN tests that I have conducted have lead me to believe the models look to specific
activation regions when making their classifications. With this information, we can take the
some of the explanations for why humans perceive these illusions incorrectly and consider how
how these explanations may pertain to how the neural network model ended up classifying the
images.
When considering the Muller Lyer trained network, the centroid explanation--the
explanation for the Muller Lyer illusion which suggested that humans look to the center of mass
when determining the Figures’ endpoints--does not contradict the activation region
understanding of the model’s classification criteria. In fact, the two explanations are closely
associated; if the two context arrow’s centroids are wide outside of the line, then there must be
context lines wide outside the lines in the outer activation area. This tells the Muller Lyer trained
network that a particular line appears long. The converse is also true for the case where the
context arrow’s centroids are within the line’s endpoints. On the other hand, the centroid
explanation is in direct contradiction with the Ponzo trained model if the Ponzo trained model
also relies on activation regions for its image classification. This is because the Ponzo illusion’s
context lines reside within the length of the line that is perceived as longer, and well outside of
the line that is perceived as shorter.
21
With more time and computational power, it would be interesting to try again at training
a CNN to generalize a larger variety of geometrical optical illusions spatially with respect to the
frame of the image. If proper precautions were taken to make sure the model does not overfit to
the data set, I think it is still possible that such a model could yield surprising accuracy on
variations of illusions that the model was not trained on. While even then such a finding would
not definitively prove anything about human perceptions of these illusions, the lens of neural
networks and artificial intelligence for discovery has yet to be fully explored, especially in the
realm of optical illusions.
22
Works Cited
[1] Pepperberg, Irene M., Jennifer Vicinay, and Patrick Cavanagh. "Processing of the
Müller-Lyer illusion by a Grey parrot (Psittacus erithacus)." Perception 37.5 (2008):
765-781.
[2] Suganuma, Elisa, et al. "Perception of the Müller–Lyer illusion in capuchin monkeys (Cebus
apella)." Behavioural brain research 182.1 (2007): 67-72.
[3] Warden, Carl John, and Jacob Baar. "The Müller-Lyer illusion in the ring dove, Turtur
risorius." Journal of Comparative Psychology 9.4 (1929): 275.
[4] Gregory, R. L. Eye and Brain: the Psychology of Seeing. Princeton University Press, 2015.
[5] Segall, Marshall H., Donald T. Campbell, and Melville J. Herskovits. "Cultural differences in
the perception of geometric illusions." Science 139.3556 (1963): 769-771.
[6] Jahoda, Gustav. "Geometric illusions and environment: A study in Ghana." British Journal of
Psychology 57.1-2 (1966): 193-199.
[7] Howe, Catherine Q., and Dale Purves. "The Müller-Lyer illusion explained by the statistics
of image–source relationships." Proceedings of the National Academy of Sciences 102.4
(2005): 1234-1239.
[8] Searleman, A., Porac, C., Alvin, J., & Peaslee, K. "Manipulating the strength of the Ponzo
and horizontal–vertical illusions through extraction of local cue information." The
American journal of psychology (2009): 383-394.
[9] Bulatov, Aleksandr, et al. "Contextual flanks’ tilting and magnitude of illusion of extent."
Vision research 51.1 (2011): 58-64.
23
[10] Srivastava, Nitish, et al. "Dropout: a simple way to prevent neural networks from
overfitting." The Journal of Machine Learning Research 15.1 (2014): 1929-1958.
[11] CS231n Convolutional Neural Networks for Visual Recognition. Stanford University course
material. https://cs231n.github.io/convolutional-networks/
[12] Zeman, Astrid, et al. "The Müller-Lyer illusion in a computational model of biological
object recognition." Plos One 8.2 (2013): e56126.
[13] Williams, Robert Max, and Roman V. Yampolskiy. "Optical Illusions Images Dataset."
arXiv preprint arXiv:1810.00415 (2018).
[14] “Build a Convolutional Neural Network Using Estimators | TensorFlow.” TensorFlow.
24