Embed Size (px)
Citation preview

Studying on the protein stress response
in Staphylococcus aureus
inaugural dissertation
in fulfilment of the academic grade
doctor rerum naturalium (Dr. rer. nat.)
at the Faculty of Mathematics and Natural Sciences
of Ernst Moritz Arndt University Greifswald
presented by
Le Thi Nguyen Binh
born on 31.07.1980, in Hanoi, Vietnam
Greifswald, November 2008

2
Dean: .......................................................................
1. Reviewer: .......................................................................
2. Reviewer: .......................................................................
Date of defence: .......................................................................

Contents
Summary 6
Abbreviation 9
1 Introduction 11
1.1 An overview of Staphylococcus aureus and its proteomics . . . . . 11
1.1.1 S.aureus-one of the most important pathogenic bacteria . . 11
1.1.2 Proteomics of S.aureus . . . . . . . . . . . . . . . . . . . . 12
1.2 Environmental stimuli and proteomic signatures . . . . . . . . . . 13
1.3 Function and regulation of stress response . . . . . . . . . . . . . 15
1.3.1 Heat stress response . . . . . . . . . . . . . . . . . . . . . 15
1.3.2 Puromycin stress response . . . . . . . . . . . . . . . . . . 19
1.3.3 Salt stress response . . . . . . . . . . . . . . . . . . . . . . 21
2 Materials and Methods 28
2.1 Cell culture . . . . . . . . . . . . . . . . . . . . . . . . . . . . . . 28
2.1.1 Strains used in this study . . . . . . . . . . . . . . . . . . 28
2.1.2 Glycerol culture . . . . . . . . . . . . . . . . . . . . . . . 28
2.1.3 Cultivation . . . . . . . . . . . . . . . . . . . . . . . . . . 28
2.1.4 Media for cell cultivation . . . . . . . . . . . . . . . . . . 29
3

CONTENTS 4
2.1.5 Stress experiment . . . . . . . . . . . . . . . . . . . . . . 30
2.2 Protein preparation . . . . . . . . . . . . . . . . . . . . . . . . . 30
2.2.1 Preparation of cytoplasmic proteins . . . . . . . . . . . . 30
2.2.2 Preparation of cytoplasmic protein extracts labeled with
[35S]-L-methionine (pulse-labelling reaction) . . . . . . . . 31
2.2.3 Determination of the labelling efficiency of radioactively
labelled protein extract . . . . . . . . . . . . . . . . . . . 31
2.2.4 Determination of protein concentration . . . . . . . . . . . 32
2.3 Two dimensional protein gel electrophoresis . . . . . . . . . . . . 32
2.3.1 Isoelectric focussing (IEF) . . . . . . . . . . . . . . . . . . 32
2.3.2 SDS PolyAcrylamide Gel Electrophoresis (PAGE) . . . . . 33
2.3.3 Protein detection . . . . . . . . . . . . . . . . . . . . . . . 36
2.3.4 Protein identification by mass spectrometry . . . . . . . . 37
2.3.5 Quantitation and bioinformatic approaches . . . . . . . . 39
2.3.6 RNA preparation . . . . . . . . . . . . . . . . . . . . . . . 40
2.3.7 Northern Blot analysis . . . . . . . . . . . . . . . . . . . . 41
2.3.8 DNA-microarray analyses . . . . . . . . . . . . . . . . . . 41
3 Results 44
3.1 Heat stress response . . . . . . . . . . . . . . . . . . . . . . . . . 44
3.1.1 Growth under heat stress conditions in synthetic medium . 44
3.1.2 Global gene expression analyses of S.aureus during heat stress 45
3.1.3 Protein synthesis profiles in response to heat stress . . . . 58
3.1.4 Detailed transcriptional analysis of heat shock genes . . . . 63
3.2 Puromycin stress response . . . . . . . . . . . . . . . . . . . . . . 68
3.2.1 Growth behavior of S.aureus in response to puromycin . . 68
3.2.2 The influence of puromycin on gene transcription of S.aureus. 69

3.2.3 Protein expression profile of S.aureus in response to puromycin 70
3.2.4 Detailed transcriptional analyses of some genes under puromycin
stress condition . . . . . . . . . . . . . . . . . . . . . . . . 77
3.3 Salt stress response . . . . . . . . . . . . . . . . . . . . . . . . . 79
3.3.1 Bacterial growth . . . . . . . . . . . . . . . . . . . . . . . 79
3.3.2 Protein synthesis profile . . . . . . . . . . . . . . . . . . . 80
3.3.3 Detailed transcriptional analyses of genes under NaCl stress 90
4 Discussion 92
4.1 Heat stress response . . . . . . . . . . . . . . . . . . . . . . . . . 92
4.2 Puromycin stress . . . . . . . . . . . . . . . . . . . . . . . . . . . 96
4.3 Salt stress . . . . . . . . . . . . . . . . . . . . . . . . . . . . . . . 98
References 102

Summary
Being one of the most important pathogenic bacteria and due to the widespread
emergence of antibiotic resistance, Staphylococcus aureus became a topic of sev-
eral studies mainly addressing its pathophysiology and virulence. During in-
fection,S.aureus is subjected to various environmental changes. Understanding
of the regulatory mechanisms controlling stress gene expression of S.aureus in
response to environmental stress is very essential in studying its fitness and vir-
ulence.
In this work, the changes in protein expression profiles as well as the gene tran-
scription of S.aureus after heat exposure, osmotic stress and in response to the
antibiotic puromycin were studied in order to provide detailed insights into the
response of S.aureus to various kinds of environmental stress under in vitro con-
ditions, namely:
(1) to investigate the global response of S.aureus to heat stress conditions using
transcriptomic and proteomic analyses.
(2) to study the transcriptome and proteome of S.aureus in response to antibiotic
substance puromycin.
(3) to define the proteome signatures of S.aureus under NaCl stress condition.
(4) to complete the proteome map of cytoplasmic proteins of S.aureus by identi-
fying proteins exclusively synthesized during the exposure to stress.
Firstly, the high resolution 2-D protein gel electrophoresis technique combined
with MALDI-TOF-MS and a DNA array approach were used to investigate the
cellular response of S.aureus to heat stress. A switch from normal growth tem-
perature to high temperature condition revealed complex changes in the protein
expression pattern as well as the genes expression profile. In particular, both
6

SUMMARY 7
transcriptome and proteome analysis revealed the induction of main cellular chap-
erone machineries GroE and DnaK, the ATP-dependent proteases ClpB, ClpP .
S.aureus cells showed that the heat shock repressor protein CtsR was highly up-
regulated after heat exposure . In contrast to B. subtilis ,the groES/L and dnaK -
operon are regulated by both heat shock regulators, HrcA and CtsR. They act
together synergistically to maintain low basal levels of expression of these oper-
ons in the absence of stress. Surprisingly, the members of the σB -dependent
response, strongly heat-inducible in B. subtilis are not induced in heat-stressed
cells of S.aureus grown in synthetic medium. Other proteins involved in protein
folding, refolding, and degradation, as well as DNA repair systems, and inter-
mediary metabolism were also found to be up-regulated. Heat stress treatment
also resulted in a strong synthesis level of genes belonging to the SOS response
such as uvrA and urvB indicated the relevance of heat stress response and SOS
response. According to the microarrays analysis data, among the heat-induced
transcripts were several bacteriophage replication/packaging genes such as inter-
grase SACOL0318, transcriptional regulator of the RinA family SACOL0364 as
well as the small and large subunit of the terminase SACOL0366 and SACOL0367.
The effect of puromycin stress on S.aureus cells was analyzed, using a gel-based
proteomic approach and transcriptomic analyses with DNA microarrays. We
compared the protein synthesis pattern as well as the transcription data of S.aureus
in response to puromycin stress with that in response to heat shock. The results
demonstrated that both stress conditions induced specific, overlapping and gen-
eral responses. We recognized overlapping responses between heat and puromycin
stress. The proteomic and transcriptomic results did show induction of DnaK,
GroEL, GrpE as well as ClpB and ClpP. Exposure to puromycin stress mediated
a significant increase of DNA repair enzymes, as well as affected proteins involved
in protein repair and degradation.
Finally, the protein expression profile of S.aureus in response to NaCl stress was
analyzed with 2D gel based proteomic approach. The synthesis of some enzymes
belonging to amino acid synthesis pathways was elevated after stress, for example,
enzymes of the metabolism of glutamate, an amino acid which was probably
required in higher concentration after salt stress. Our result also suggested that

SUMMARY 8
osmotic stress induced the expression of Asp23, which encodes an alkaline shock
protein. Our proteome analyses also revealed the repression of the synthesis of
many enzymes belong to different metabolism pathways such as DNA metabolism,
purin/pyrimidin metabolism or energy metabolism. Interestingly, in S.aureus, the
northern blot analysis revealed no significant induction of opuA, B or C of the
osmoprotectant transport system which play an essential role in salt adaptation
of the model Gram-positive bacteria B. subtilis. In this study, the level of their
transcripts remained almost unaltered.
In summary, the signatures for stress or starvation stimuli can be used as di-
agnostic tools for the prediction of the mode of action of new antibiotics or for
studying the physiological state of cells grown. Expression of the respective genes
under in vivo conditions could provide some ideas on the environmental signals
that specifically influence the survival of S.aureus within and outside the host.

Abbreviation
Abbreviation Fullname
2D two-dimensional
2DE two-dimensional electrophoresis
2D-PAGE two-dimensional polyacrylamide gel electrophoresis
ATP adenosine-5-triphosphate
B.subtilis Bacillus subtilis
BMM Belitsky minimal medium
CBB Coomassie Brilliant Blue
cDNA complementary deoxyribonucleic acid
CFU colony forming unit
CHAPS 3-[(3-cholamidopropyl)dimethyl ammonio]-1-propane sulfonate
DNA deoxyribonucleic acid
DTT dithiolthreitol
E. coli Escherichia coli
EDTA ethylenediamine tetra acetic acid
GTP guanosine triphosphate
IEF isoelectric focusing
IPG non-linear immobilized pH gradients
kb kilo bases
kDa kilo Daltons
L.monocytogenes Listeria monocytogenes
LB Luria Bertani broth medium
MIC minimal inhibitory concentration
Mr molecular weight
MALDI-TOF matrix assisted laser desorption/ ionisation time of flight
MS mass spectrometry
9
ABBREVIATION 10
nm nanometer
OD optical density
ORF open reading frame
PCR polymerase chain reaction
pI isoelectric point
PMSF phenylmethylsulphonylfluoride
RNA ribonucleic acid
rpm rounds per minute
S.typhimurium Salmonella typhimurium
S.aureus Staphylococcus aureus
SDS-PAGE sodium dodecyl sulfate polyacrylamide gel electrophoresis
U unit
V voltage
v/v volume per volume
w/v weight per volume

Chapter 1
Introduction
1.1 An overview of Staphylococcus aureus and
its proteomics
1.1.1 S.aureus-one of the most important pathogenic bac-
teria
Figure 1.1: Electromicroscopic view of S.aureus
S.aureus is a spherical Gram-
positive, catalase positive bac-
terium which appears in pairs,
short chains or bunched, grape
like yellow cluster when viewed
in the microscope (Figure 1.1).
Most isolated S.aureus strains
are covered by polysaccharide
capsule. Beneath the cap-
sule, S. aureus harbours a
cell wall which lacks the outer
membrane with a thick and
highly crosslinked peptidogly-
can layer (Anthony et al., 1988; Beveridge et al., 1999 ; Popescu et al.,1996 ; Van
11

CHAPTER 1. INTRODUCTION 12
Wely et al., 2001) (Figure 1.2).
S.aureus causes a wide variety of diseases, from mild skin infections to severe life
threatening systemic infections. S.aureus is commonly associated with wound
infections, catheter-related infections, toxic shock syndrome (TSS) and food poi-
soning (Bennett et al., 2001; Todar, 2004).
Figure 1.2: Schematic presentation of
S.aureus cell wall
Being one of the most important
pathogenic bacteria, S.aureus has an
increasing importance as a result of
the spread of antibiotic resistance. Be-
cause of its adaptability and resistance
to environmental stresses, S. aureus
can survive extremely well outside the
host and is one of the major causes of
community acquired infections. The
pathogenesis of S.aureus is very com-
plex and involves the highly coordi-
nated synthesis of cell wall- associated
proteins and extracellular toxins.
1.1.2 Proteomics of S.aureus
With the publication of the first complete genome sequence of a living organism
in 1995, new fields in molecular genetics such as phylogenomics or comparative
genomics have emerged. However, the genome sequence of an organism predicts
the number of coding sequences and represents only the ”blue-print of life”, not
”life itself”.The post genomic era of S. aureus began with the publication of
the genome sequence of two reference strains (Kuroda et al., 2001). This pro-
vided the experimental basis for bringing the ”blue print into real life”, namely
”the genome sequence of S. aureus to life” by an application of experimental
tools encompassed under the term ”functional genomics”. Transcriptomic and
proteomic approaches are the major tools for functional genomics. Transcrip-
tomics, relying on DNA arrays that may cover the complete genome, provides
CHAPTER 1. INTRODUCTION 13
information on the global gene expression pattern of a cell while proteomics pro-
vides additional information on the expression levels, stabilization, localization,
interaction and post-translational modifications of the proteins (e.g. phosphory-
lation, glycosylation). To obtain this global view of the synthesis and distribution
of many S.aureus proteins in the cell, the highly sensitive two dimensional gel
electrophoresis (2-DE) separation technique is a well established technique. It
has to be complemented with protein identification, relying on tryptic peptide
mass mapping via matrix assisted laser desorption ionization time of flight mass
spectrometry (MALDI-TOF-MS) (Hecker et al., 2003). With the creation of cy-
toplasmic and extracellular protein maps, an experimental tool is available for
more sophisticated physiological studies. Such studies can be addressed by pro-
teomics, thus generating new information on regulatory systems and enzymatic
pathways involved in particular cellular responses. Two major classes of proteins
synthesized at different growth conditions can be distinguished:
- Vegetative proteins synthesized during growth and cell cycle with many house
-keeping functions
- Proteins synthesized only in response to environmental stimuli with mainly
adaptive function against stress or starvation.
Many proteins of these different groups are involved in the fitness of S.aureus. In
addition to proteins having the function of damaging the host, these proteins are
essential for survival outside and within the host that may contribute indirectly
to pathogenicity (Hecker et al., 2003).
1.2 Environmental stimuli and proteomic signa-
tures
Environmental stimuli and starvation are typical conditions in most natural
ecosystems, including many different micro habitats in the host that limit bac-
terial growth. The adaptation to stress or starvation is crucial for survival in
nature. As a result of this longstanding interaction of bacteria with a continu-
ously changing set of environmental stimuli, a very complex adaptational network
has evolved. Analysing this network forms the basis for understanding the cell

CHAPTER 1. INTRODUCTION 14
physiology in natural ecosystem (Hecker and Volker, 2001). The stress and star-
vation genes are more or less silent in growing cells, but are strongly activated by
defined environmental stimuli. To define the genes induced by a single stimulus,
to identify the corresponding proteins and to understand their adaptive function
are the most important steps in exploring adaptional networks. As a good tool
for elucidating these networks and their modules, proteomics can be used:
- To define single stimulons, i.e. the entire set of proteins/ genes induced or
repressed by one stimulus. For this ”stimulon approach” the protein pattern of
stressed cells has to be analysed and compared to that of untreated cells to iden-
tify the induced or repressed proteins.
- To dissect each stimulon into single regulons, i.e. the basic modules of global
gene expression. For this ”regulon approach” the protein pattern of the wild type
has to be compared with that of the respective regulatory mutant under condi-
tions that activate the regulators
- To analyse overlapping regions between single regulons because these do not ex-
ist independently but are tightly connected and form a complicated adaptational
network
- To analyse the kinetics of gene expression programmes (Hecker et al., 2003).
In S.aureus, a comprehensive exploration of the adaptational network will not
only provide basic knowledge on S.aureus physiology, but will also give many
clues on the function of still unknown proteins indicated by the induction profile
of genes by environmental stimuli. Relying on the fact that environmental stimuli
such as heat, oxidative or anaerobic stress might be essential cellular signals in
the host environment which controll the expression of virulence genes, proteomics
has been used as an excellent experimental tool to visualize changes in the protein
synthesis pattern of living cells and to define the structure and function of the
single stimulons or regulons in response to different stresses (Fuchs et al., 2007,
Wolf et al., 2008, Hochgrafe et al., 2008).

CHAPTER 1. INTRODUCTION 15
1.3 Function and regulation of stress response
1.3.1 Heat stress response
Heat stress response is a rapid reaction of bacteria to temperature up-shift. It is
presumed that damaged proteins, such as unfolded and denatured proteins are de-
tected by cellular systems which induce a large set of so called heat shock proteins
(HSP). (Boorstein et al., 1994; Gupta,1995). The heat shock response is found
in all living cells studied so far (Craig, 1985). Many of the HSPs are molecular
chaperones (e.g., GroEL, GroES. DnaK, DnaJ) and ATP-dependent proteases
(e.g.,ClpP, ClpC) (Sherman and Goldberg, 1992, 1996, Kandror et al., 1996) play
a critical role in the refolding of denatured proteins and in protein degradation
under normal and stress conditions. Reports studying heat shock proteins in the
Gram-positive bacterium Bacillus subtilis and in the Gram-negative bacterium
Escherischia coli indicated that heat shock proteins are also important for the
protection against other environmental stresses such as high salt concentration
or heavy metal stress (VanBogelen and Neidhardt, 1987; Inbar and Ron, 1993;
Hecker and Volker, 1998).
1.3.1.1 Regulation of heat stress response in Gram-positive bacteria
The model organism for studying the heat shock response in Gram-positive bac-
teria was B. subtilis. The heat shock response of this bacterium includes the in-
duction of proteins from several regulatory groups (Zuber and Schumann, 1994;
Hecker and Volker, 1998).
Class I heat shock genes encode classical chaperones (DnaK, GroES, GroEL).
The dnaK and groESL operons controlled by the HrcA repressor recognizing the
highly conserved CIRCE operator (Zuber and Schumann, 1994) were identified
at elevated levels in B. subtilis on 2D gel after heat shock (Hecker and Volker.,
1990). The HrcA regulon consists of the dnaK and groE operons that are pre-
ceded by a σA type promoter and a CIRCE element (controlling IR of chaperone
expression) (TTAGCACTC-N9-GAGTGCTAA) which was shown to be involved
in the regulation of the heat shock response (Zuber and Schumann, 1993). The
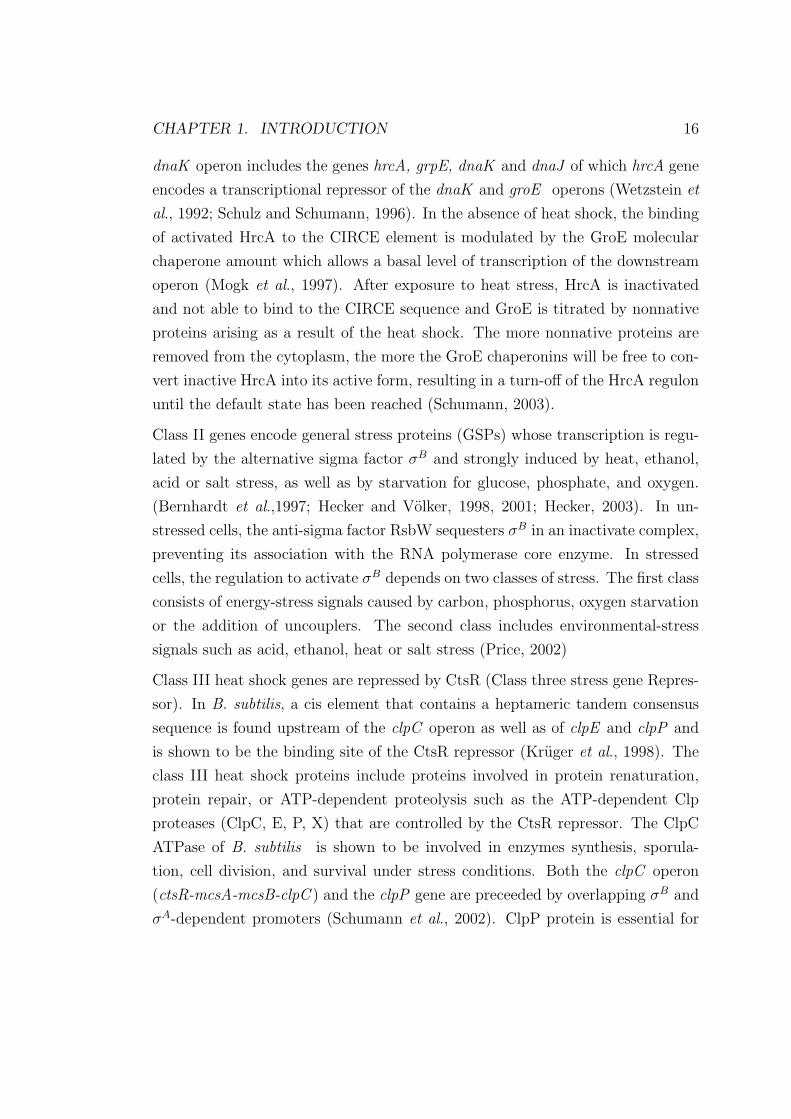
CHAPTER 1. INTRODUCTION 16
dnaK operon includes the genes hrcA, grpE, dnaK and dnaJ of which hrcA gene
encodes a transcriptional repressor of the dnaK and groE operons (Wetzstein et
al., 1992; Schulz and Schumann, 1996). In the absence of heat shock, the binding
of activated HrcA to the CIRCE element is modulated by the GroE molecular
chaperone amount which allows a basal level of transcription of the downstream
operon (Mogk et al., 1997). After exposure to heat stress, HrcA is inactivated
and not able to bind to the CIRCE sequence and GroE is titrated by nonnative
proteins arising as a result of the heat shock. The more nonnative proteins are
removed from the cytoplasm, the more the GroE chaperonins will be free to con-
vert inactive HrcA into its active form, resulting in a turn-off of the HrcA regulon
until the default state has been reached (Schumann, 2003).
Class II genes encode general stress proteins (GSPs) whose transcription is regu-
lated by the alternative sigma factor σB and strongly induced by heat, ethanol,
acid or salt stress, as well as by starvation for glucose, phosphate, and oxygen.
(Bernhardt et al.,1997; Hecker and Volker, 1998, 2001; Hecker, 2003). In un-
stressed cells, the anti-sigma factor RsbW sequesters σB in an inactivate complex,
preventing its association with the RNA polymerase core enzyme. In stressed
cells, the regulation to activate σB depends on two classes of stress. The first class
consists of energy-stress signals caused by carbon, phosphorus, oxygen starvation
or the addition of uncouplers. The second class includes environmental-stress
signals such as acid, ethanol, heat or salt stress (Price, 2002)
Class III heat shock genes are repressed by CtsR (Class three stress gene Repres-
sor). In B. subtilis, a cis element that contains a heptameric tandem consensus
sequence is found upstream of the clpC operon as well as of clpE and clpP and
is shown to be the binding site of the CtsR repressor (Kruger et al., 1998). The
class III heat shock proteins include proteins involved in protein renaturation,
protein repair, or ATP-dependent proteolysis such as the ATP-dependent Clp
proteases (ClpC, E, P, X) that are controlled by the CtsR repressor. The ClpC
ATPase of B. subtilis is shown to be involved in enzymes synthesis, sporula-
tion, cell division, and survival under stress conditions. Both the clpC operon
(ctsR-mcsA-mcsB-clpC ) and the clpP gene are preceeded by overlapping σB and
σA-dependent promoters (Schumann et al., 2002). ClpP protein is essential for

CHAPTER 1. INTRODUCTION 17
growth at high temperature and for stress tolerance (Gerth et al., 1998; Msadek
et al., 1998).
Class IV heat shock genes: Only one class IV heat shock gene, the htpG gene,
has been identified so far in B. subtilis (Schumann, 2003). The regulatory site
for htpG (GAAAGG) has been identified immediately downstream of its σA-
dependent promoter (Versteeg et al., 2003). This gene, which is assumed to code
for a molecular chaperone, is induced about ten-fold after a heat shock of 48◦ C,
both at the level of transcription and translation (Schulz et al., 1997).
Class V heat shock genes: This group has been described quite recently and
consist of two members, htrA and htrB (Darmon et al., 2002), encoding putative
membrane-anchored proteases. Both genes are preceded by a -10 region of σA-
type promoters but lack an obvious -35 region. Instead, the control regions have
a 4-fold-repeated octameric consensus sequence (TTTTCATA) positioned close
to the -35 regions (Noone et al., 2001). Both genes are under the positive control
of the CssRS two-component signal transduction system (for control of secretion
stress regulator and sensor), which responds not only to heat but also to secretion
stress (Darmon et al., 2002).
Class VI heat shock gene: Class VI summarizes genes whose expression is also
responsive to heat stress, but the mechanism of induction is not affected by any
one of the previously mentioned regulators (Schumann, 2003). Ten class VI heat
shock genes have been reported previously in B. subtilis, where four are arranged
in monocistronic transcriptional units (ftsH, clpX, ykoZ, and sacB) (Gerth et al.,
1996; Deuerling et al., 1997; Schumann et al., 2002; Zuber et al., 2001) and six
in bicistronic units (lonA-orfX, ahpC-ahpF, and nfrA-ywcH ) (Riethdorf et al.,
1994; Antelmann et al., 1996; Moch et al., 2000).
1.3.1.2 Heat stress response in S.aureus
The ubiquitous nature of S.aureus derives mostly from its ability to survive in a
great variety of environmental extremes, such as nutrient starvation, a wide range
of pH and growth temperatures, restriction of metal ions, high salt concentration
or desiccation. An increasing amount of data indicates that the capacity to

CHAPTER 1. INTRODUCTION 18
survive stress conditions is highly correlated with virulence in S.aureus (Clements
and Foster, 1999). Analyses of the complete S.aureus genome sequence (Kuroda
et al., 2001) indicate that, at least four different types of heat shock response
regulatory mechanisms may co-exist (Clements and Foster, 1999, review):
Class I, which includes the dnaK operon, are regulated by the HrcA repressor,
which recognizes CIRCE operator (Ohta et al., 1994)
Class II genes encode general stress proteins whose expression requires the stress
sigma factor (Gertz et al., 2000).
Figure 1.3: Dual regulation by CtsR and HrcA of the dnaK and groESL operonis present in several Gram positive bacteria
Class III heat shock genes, are negatively regulated by CtsR, which recognizes
a directly repeated heptanucleotide operator sequence (A /GGTCAAA NAN
A/GGTCAAA) (Derre et al., 1999). While in B. subtilis and in other bacte-
ria of the Bacillus group, the dnaK and groESL operons are only controlled by
HrcA, in the Staphylococcus group both operons are dually regulated by CtsR
and HrcA . These two repressor control the expression of dnaK and groESL
operon by binding directly and specifically to their promoter regions (Chastanet
et al., 2003) (Figure 1.3).
The entire HcrA regulon is embedded within the CtsR regulon, with the syn-
CHAPTER 1. INTRODUCTION 19
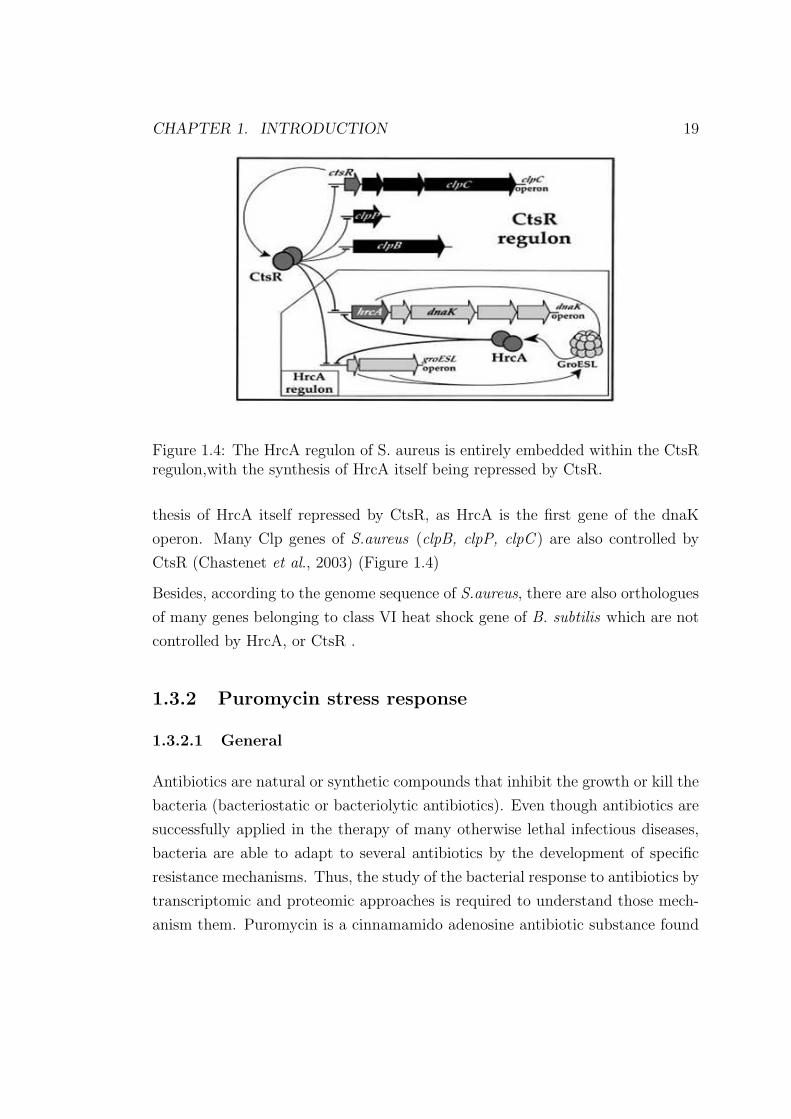
Figure 1.4: The HrcA regulon of S. aureus is entirely embedded within the CtsRregulon,with the synthesis of HrcA itself being repressed by CtsR.
thesis of HrcA itself repressed by CtsR, as HrcA is the first gene of the dnaK
operon. Many Clp genes of S.aureus (clpB, clpP, clpC ) are also controlled by
CtsR (Chastenet et al., 2003) (Figure 1.4)
Besides, according to the genome sequence of S.aureus, there are also orthologues
of many genes belonging to class VI heat shock gene of B. subtilis which are not
controlled by HrcA, or CtsR .
1.3.2 Puromycin stress response
1.3.2.1 General
Antibiotics are natural or synthetic compounds that inhibit the growth or kill the
bacteria (bacteriostatic or bacteriolytic antibiotics). Even though antibiotics are
successfully applied in the therapy of many otherwise lethal infectious diseases,
bacteria are able to adapt to several antibiotics by the development of specific
resistance mechanisms. Thus, the study of the bacterial response to antibiotics by
transcriptomic and proteomic approaches is required to understand those mech-
anism them. Puromycin is a cinnamamido adenosine antibiotic substance found

CHAPTER 1. INTRODUCTION 20
in Streptomyces alboniger which inhibits protein synthesis by binding to RNA.
It is an antineoplastic and antitrypanosomal agent and is used in research as an
inhibitor of protein synthesis. Puromycin is structural analog of the aminoacyl-
tRNAs. One of the most striking differences between the two molecules is the
adenine moiety carrying two methyl groups on its amino nitrogen, and the tyrosyl
residue, which forms the amino acid residue, is also methylated in its phenolic
oxygen group (Ingram et al., 1972). Another important difference is that instead
of an ester linkage attaching the amino acyl groups, puromycin uses an amide
grouping. Puromycin inhibits protein synthesis by prematurely terminating a
peptide chain. In simple terms, the part of puromycin that resembles an aminoa-
cyl end of tRNA can bind to the A site of a ribosome (forming a peptide bond),
but the end product will not participate in translocation to the P site (Fig.1.5).
This lack of participation in translocation results in the dissociation of unfinished
polypeptide chains from the ribosome and early peptide termination. This early
termination results in an accumulation of truncated, nonfunctional polypeptides
in the cell.
Figure 1.5: Antibiotic action of puromycin. (Garret, R.; Grisham, C. Biochem-istry. Austin: Saunders College Publishing; 1995)

CHAPTER 1. INTRODUCTION 21
1.3.2.2 Puromycin stress response in Gram-positive bacteria
Treatment with puromycin have been reported to induce the heat shock response
in B. subtilis (Hecker et al., 1996, Bandow et al.,2003), although no class II
general stress protein were induced after puromycin stress in B. subtilis (Mogk
et al., 1998; Movahedi and Waites, 2002 ) An enhanced transcription of htrA
was also seen in Lactobacillus cells as well as in Listeria monocytogenes cells
after exposure to puromycin (Smeds et al., 1998; Wilson et al., 2006). It was
also indicated that the same stress proteins induced after heat shock were also
induced after puromycin stress in in Streptococcus pneumonia (Wai-Leung Ng et
al., 2002).
1.3.3 Salt stress response
1.3.3.1 General
The exposure of organisms to conditions of high salinity results in a decrease of
their cytoplasmic water activities. This phenomenon consequently brings about a
reduction in the turgor pressure and a shrinkage of the cytoplasmic volume. called
plasmolysis. Sudden plasmolysis results in the inhibition of a variety of physio-
logical processes, ranging from nutrient uptake to an increase in the adenosine
triphosphate (ATP) levels of the cells (Ohwada and Sagisaka, 1988). Generally,
two basic schemes of bacterial adaptation to high osmolality have been identified:
1. The accumulation of intracellular ions, a strategy followed frequently by ex-
treme halophilic archaea and by halotolerant bacteria whose entire physiology has
been adapted to a high-saline environment (Galinski and Truper, 1994; Ventosa
et al., 1998).
2. The intracellular amassing of osmotically active compounds that are highly
appropriate with cellular functions, the so-called compatible solutes since their
molecules that are accumulated during conditions of osmotic stress are not greatly
inhibitory to cellular processes (Brown 1972, 1980). These organic solutes are
accumulated by many microorganisms through synthesis or uptake from the en-
vironment to counteract the outflow of water under hypertonic growth conditions

CHAPTER 1. INTRODUCTION 22
(Galinski and Truper, 1994; Csonka and Epstein, 1996; Miller and Wood, 1996).
Osmoprotectants are operationally defined as exogenously provided organic so-
lutes that enhance bacterial growth in media of high osmolarity. These substances
may be compatible solutes themselves, or they may act as precursor molecules
that can be enzymatically converted into these compounds. The intracellular
amassing of compatible solutes is not restricted to the prokaryotic world but is
also widely used as an adaptive strategy in fungal, plant, animal, and even human
cells to offset the deleterious effects of high osmolarity and high ionic strength
(Rhodes and Hanson, 1993; Burg et al., 1997; Hohmann, 1997).
The prominent compatible solutes found in bacteria are K+ ions, the amino
acids glutamate, glutamine, proline, choline, alanine and γ- aminobutyrate, the
quaternary amines glycine betaine and other fully N-methylated amino acid
derivatives, as well as the sugars sucrose, trehalose (α-D-glucopyranosyl- α-D-
glucopyranoside), and glucosylglycerol (Flowers et al., 1977; Reed et al.,1986;
Yancey et al., 1982). Among them, proline, choline and glycine betaine were
considered as important osmoprotective compounds (Reed et al., 1985; Landfald
and Strom, 1986; Christian,1955 ; Strom et al., 1986).
Studies with E. coli and Salmonella typhimurium revealed that initially large
amounts of K+ are rapidly taken up from the environment via turgor-responsive
transport systems . Concomitantly, glutamate synthesis is increased to provide
counterions for the strong increase in positive charges. Glutamate synthesis is
dependent on the prior uptake of K+, and glutamate is required to maintain the
steady-state K+ pool (McLaggan et al., 1994; Yan et al.,1996). High intracellu-
lar concentrations of K+, however, have negative effects on protein function and
DNA-protein interactions in non-halophilic bacteria; thus, the massive accumu-
lation of K+ is an inadequate strategy for coping with prolonged high osmolarity.
Instead, the initial increase in cellular K+ content is followed by the accumula-
tion of compatible solutes, which allows the cell to discharge large amounts of
K+ through specific and nonspecific efflux systems (Csonka and Epstein, 1996;
Stumpe et al., 1996). Two transporters are primarily responsible for the uptake of
osmoprotectants across the cytoplasmic membrane of these enteric bacteria: ProP
and ProU. These transporters were originally identified as osmotically stimulated

CHAPTER 1. INTRODUCTION 23
Figure 1.6: Osmostress response systems of E. coli. GB : glycine betaine, Glc: glucose, Glc-6-P: glucose-6-phosphate, Tre : trehalose, Tre-6-P: trehalose-6-phosphate UDP-Glc: uridine disphosphate-glucose
uptake systems for proline, but subsequent studies established their pivotal role
in the uptake of a wide spectrum of osmoprotectants, of which glycine betaine
and proline betaine are transported with high affinity (Csonka and Epstein, 1996).
Permeation of osmoprotectants across the E. coli and S. typhimurium outer mem-
brane is accomplished by passive diffusion through the nonspecific porins OmpC
and OmpF.
As a model of Gram-positive bacteria, B.subtilis initiates a two-step adaptation
response to cope with the unfavourable osmotic conditions (Bremer and Kramer,
2000; Kempf and Bremer, 1998). Initially, K+ is rapidly taken up (Whatmore
and Reed, 1990) and subsequently replaced in part by proline (Whatmore et al.,
1990). These osmolytes can be accumulated to high levels through either de novo
synthesis or uptake of osmoprotectants from the environment without interfering

CHAPTER 1. INTRODUCTION 24
Figure 1.7: Osmostress response systems of B. subtilis
with central cellular functions.
In addition, B. subtilis can efficiently scavenge a wide variety of compatible so-
lutes such as choline, proline or glycine betaine from environmental sources by
means of five osmoregulated transport systems (OpuA to OpuE) (Kappes et al.,
1996; Kappes et al., 1999; Kempf and Bremer, 1995; von Blohn et al., 1997)
and can aquire choline for the production of the osmoprotectant glycine betaine
(Kappes et al., 1999) In B.subtilis, the accumulation of compatible solutes offsets
the detrimental effects of high osmolarity on cell physiology and permits growth
over a wide range of osmotic conditions (Boch et al., 1994). Proteomic and tran-
scriptomic approaches have shown that in B. subtilis salt stress triggers generally
the induction of the SigB regulon (Petersohn et al., 2001; Steil et al., 2003; Hoper
et al., 2006). This non-specific stress protection also includes protection against
osmotic stress. Membrane proteins such as OpuD and OpuE are involved in the
uptake of osmoprotectants. The immediate response to salt stress is followed by
the induction of the sigmaW regulon (Hoper et al., 2006). The σW -dependent
proteins seem to be involved in the maintenance of cell integrity during cell sur-

CHAPTER 1. INTRODUCTION 25
face or alkaline stress (Cao et al., 2002). Furthermore, salt stress seems to cause
oxidative stress in the cells as indicated by the induction of the PerR-dependent
catalase KatA, the alkyl hydroperoxide reductase subunits AhpC and AhpF, the
glutamyl tRNA reductase HemA as well as enzymes involved in cysteine biosyn-
thesis and the formation of [4Fe-4S] clusters (CysC, YurU) (Hoper et al., 2006)
and those induced also by iron limitation (Hoffmann et al., 2002). Transcriptomic
analysis revealed a strong induction of the proJH genes which are involved in the
regulation of proline synthesis in response to osmotic shock (Belitsky et al., 2001).
1.3.3.2 Salt stress response in S.aureus
S.aureus is one of the most osmotolerant bacteria of the nonhalophilic eubacteria
and is able to grow at low water activities (equivalent to hight salt concentra-
tion). Although there are some studies on osmoregulation in S.aureus (Christian
and Waltho, 1964) very little is known about mechanisms conferring the high salt
tolerance of this bacterium. Osmoregulation in this organism is therefore inher-
ently interesting for several reasons. Unlike many other organisms which grow
in environments of elevated osmolarity, S.aureus can also perfectly grow at low
osmolarities, suggesting an efficient means of regulating cytoplasmic osmolarity
(Graham et al., 1992)
In contrast to enteric bacteria, cytoplasmic levels of K+ do not change strikingly
in S.aureus grown in media of increasing osmolarity (Graham and Wilkinson,
1992; Kunin and Rudy, 1991. Choline, glycine betaine, proline, and taurine act
as osmoprotectants for S.aureus (Miller et al., 1991; Graham and Wilkinson,
1992). Transport systems for glycine betaine (Pourkomailian and Booth 1992,
1994; Bae et al.,1993; Stimeling et al., 1994), choline (Kaenjak et al.,1993) and an
osmotically activated, low-affinity transport system for proline have been already
described in S.aureus (Bae and Miller, 1991; Townsend and Wilkinson, 1992).
However, some of the mechanisms S.aureus utilizes to survive under osmotic
stress are similar to those of Gram-negative enteric bacteria such as E.coli and
S.typhimurium, both of which accumulate compatible solutes including proline
and glycine betaine via transport (Stewart et al., 2005.). There are, however,
several major differences, as enterics have a two-phase process in which they adapt

CHAPTER 1. INTRODUCTION 26
to osmotic stress, this process first allows the co-transport and rapid accumulation
of potassium and glutamate ions, followed by the activation of transport systems
that lead to the accumulation of compatible solutes (Booth, 1998). In contrast
under osmotic stress conditions, S.aureus cells increase the compatible solute
pools in the cytoplasm and inhibit the transport of potassium and glutamate
(Pourkomailian and Booth, 1992).
Among a series of compatible solutes, glycine betaine and proline are the principal
ones of S.aureus, with glycine betaine being the most potent osmoprotectant
(Bae and Miller, 1991). Transport of these osmolytes is mediated by three basic
systems: an osmotically sensitive, low affinity glycine betaine/proline transport
system (BPII) and two osmotically insensitive, high affinity transport systems;
one specific for proline (PPI) and the other specific for glycine betaine (BPI)
(Bae and Miller, 1992; Pourkomailian and Booth, 1992, 1994; Townsend and
Wilkinson, 1992; Pourkomailian, 1998).
The active transport of glycine betaine and proline in S.aureus is achieved by
sodium-dependent transport, and thus is energized by sodium motive force. To
date, regulation of gene expression in S.aureus in response to salt stress has not
yet been well characterized.
Aim of thesis
Our approach was to analyse protein/genes of S.aureus whose expression is highly
stimulated under different environmental stress conditions as well as antibiotic
stress , in order to identify specific proteins for these conditions.
In this work, the changes in protein expression profiles as well as the gene tran-
scription of S.aureus after heat exposure, osmotic stress and in response to the
antibiotic puromycin were studied in order to provide detailed insights into the
response of S.aureus to various kinds of environmental stress under in vitro con-
ditions, namely:
(1) to investigate the global response of S.aureus to heat stress conditions using
transcriptomic and proteomic analyses.
(2) to study the transcriptome and proteome of S.aureus in response to antibiotic
substance puromycin.
(3) to define the proteome signatures of S.aureus under NaCl stress condition.

CHAPTER 1. INTRODUCTION 27
(4) to complete the proteome map of cytoplasmic proteins of S.aureus by identi-
fying proteins exclusively synthesized during the exposure to stress.

Chapter 2
Materials and Methods
2.1 Cell culture
2.1.1 Strains used in this study
The S.aureus strain used in this study was the clinical isolate Staphylococcus
aureus COL, which is highly resistant against methicillin (MRSA) (Shafer and
Iandolo, 1979)
2.1.2 Glycerol culture
S.aureus COL was spreaded on LB-Agar plates. Single colonies were picked
up, then inoculated and grown in LB medium. This culture was incubated and
shaken at 37◦ C for about 16-18 hours. 1.8 ml steril glycerol was added to 4.2 ml
overnight culture and kept at -80◦ C.
2.1.3 Cultivation
The synthetic medium was inoculated with exponentially growing cells of S.aureus
COL grown over night in the same medium to an initial OD500 of 0.07 to 0.1.
Cells were cultivated with vigorous agitation at 37◦ C.
28
CHAPTER 2. MATERIALS AND METHODS 29
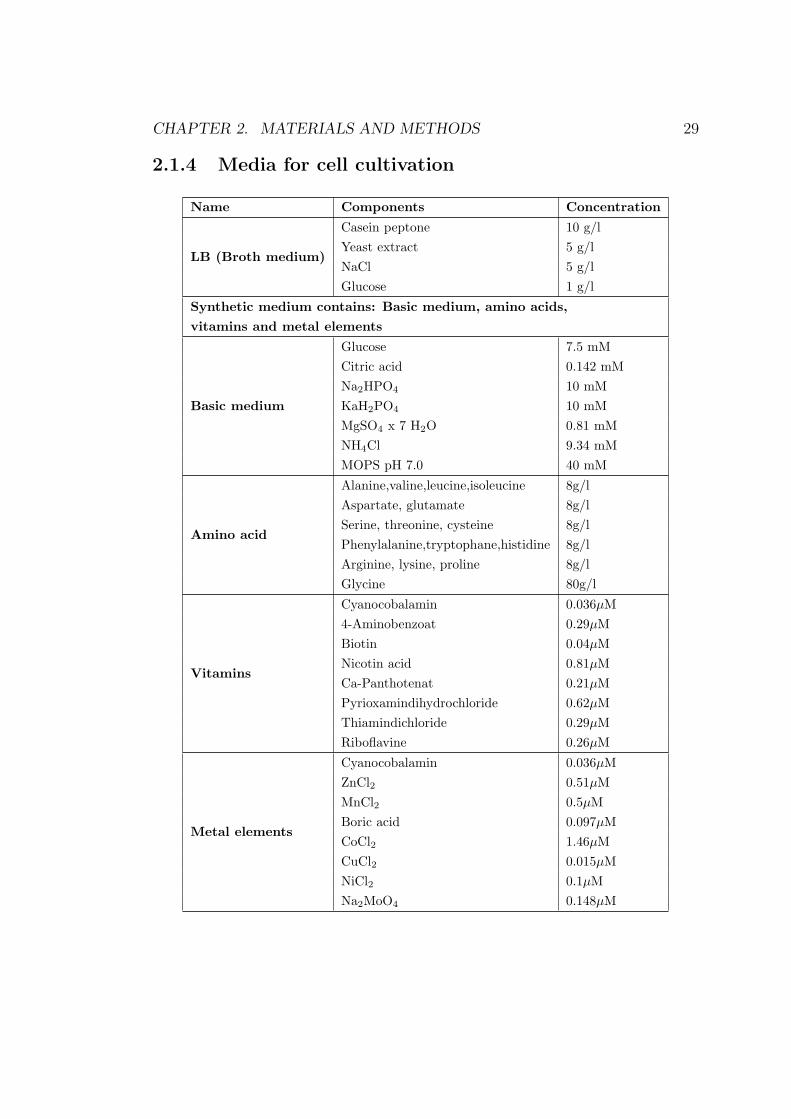
2.1.4 Media for cell cultivation
Name Components Concentration
LB (Broth medium)
Casein peptone 10 g/lYeast extract 5 g/lNaCl 5 g/lGlucose 1 g/l
Synthetic medium contains: Basic medium, amino acids,vitamins and metal elements
Basic medium
Glucose 7.5 mMCitric acid 0.142 mMNa2HPO4 10 mMKaH2PO4 10 mMMgSO4 x 7 H2O 0.81 mMNH4Cl 9.34 mMMOPS pH 7.0 40 mM
Amino acid
Alanine,valine,leucine,isoleucine 8g/lAspartate, glutamate 8g/lSerine, threonine, cysteine 8g/lPhenylalanine,tryptophane,histidine 8g/lArginine, lysine, proline 8g/lGlycine 80g/l
Vitamins
Cyanocobalamin 0.036µM4-Aminobenzoat 0.29µMBiotin 0.04µMNicotin acid 0.81µMCa-Panthotenat 0.21µMPyrioxamindihydrochloride 0.62µMThiamindichloride 0.29µMRiboflavine 0.26µM
Metal elements
Cyanocobalamin 0.036µMZnCl2 0.51µMMnCl2 0.5µMBoric acid 0.097µMCoCl2 1.46µMCuCl2 0.015µMNiCl2 0.1µMNa2MoO4 0.148µM

CHAPTER 2. MATERIALS AND METHODS 30
All components of the basic medium (except glucose and MOPS) were autoclaved
for 20 minutes at 120◦ C. Glucose and MOPS were separately autoclaved only for
10 minutes at 120◦ C. Amino acids, vitamins and metal elements were filtrated
for sterilization.
2.1.5 Stress experiment
For stress kinetic experiments, 10 to 50 ml of cell culture at an optical density at
500 nm of 0.5 were transferred to new preheated Erlenmeyer flasks and exposed
to stress conditions. Cells were harvested at fixed time intervals after imposition
of stress. As a control 20 to 50 ml of the untreated culture were harvested
immediately before and at the end of the stress experiment ( Engelmann and
Hecker, 2008).
2.2 Protein preparation
2.2.1 Preparation of cytoplasmic proteins
For preparation of cell extracts, at an optical densities OD500=0.5 of different
time points after exposure to stress, cells of 50 ml culture were separated from
the supernatant by centrifugation (7,000 x g) for 10 min at 4◦ C. Cell pellets
were washed twice with 1 ml ice cold TE buffer, resuspended in 1 ml TE buffer
and transferred into screw top tubes containing 500 µl glass beads. Cells were
disrupted by homogenization with glass beads using the Ribolyser (Thermo Elec-
tron Corporation) for 30 seconds at 6.5 m/s. The lysate was centrifuged for 25
min at 21,000 x g at 4◦ C so that cell debris is removed and the supernatant
is transferred to a new tube. In order to remove insoluble and aggregated pro-
teins which disturbed the isoelectric focusing of the proteins, the supernatant was
centrifuged once again for 45 min at 21,000 x g at 4◦ C. Protein concentration
was determined using Roti-Nanoquant (Roth, Karlsruhe, Germany).The protein
solution was stored frozen at -20◦ C.
CHAPTER 2. MATERIALS AND METHODS 31
2.2.2 Preparation of cytoplasmic protein extracts labeled
with [35S]-L-methionine (pulse-labelling reaction)
Cells were grown in synthetic medium at 37◦ C to an optical density of 0.5. Then
10 ml of the culture volume were transferred to a new Erlenmeyer flask and 10
µl (100 Ci) L-[35S]-methionine were added to the culture. The labeling reaction
was stopped after 5 min by adding 1 ml stop solution and by transferring the
flask to ice. Afterwards, cells were pelleted by centrifugation (8,000 x g) for 5
min at 4◦ C. Cell pellets were washed twice with 1 ml ice cold TE buffer and
were resuspended in 400 µl TE buffer. For cell lysis 10 µl lysostaphin solution
(10 mg/ml) were added to the cell suspension. After incubation on ice for 10
min, cells were disrupted by sonication. For this step a breaker of ice water was
placed around the sample tube to keep it cold. The samples were sonicated for 1
min (0.5 s−1, low) followed by a 1 min cooling break. This process was repeated
three times. Sonication was complete when the solution appeared noticeably less
cloudy than the starting solution. After sonication, the sample was centrifuged
at 21,000 x g for 10 min at 4◦ C. The supernatant was removed to a new tube and
the centrifugation process was repeated for 30 min. Protein concentration was
determined using ROTI-Nanoquant (Roth, Karlsruhe Germany). The protein
solution was stored frozen at -20◦ C.
2.2.3 Determination of the labelling efficiency of radioac-
tively labelled protein extract
10 µl of the protein extract were dropped on filter paper plates. The paper
plates were dried and incubated in 10% (v/v) ice cold TCA for 10 minutes, then
incubated in 5% (v/v) ice cold TCA for 10 minutes and finally the plates were
washed two times in 96% (v/v) ethanol at room temperature. The filter papers
were dried under red light and then were transferred into Scintillation cuvette,
covered with 1ml Toluene.

CHAPTER 2. MATERIALS AND METHODS 32
2.2.4 Determination of protein concentration
10 µl of each protein solution was used. Otherwise an appropriate volume of the
protein extract was diluted prior to measurement. The mixture of protein solution
together with ROTI-Nanoquant was measured at 590 nm and 450 nm (Ultraspec
3000, Pharmacia Biotech). The protein amount (m Protein) was calculated using
the following formula:
mProtein[µg] =E590E450
− 0.3846
0.054945
CProtein[µg/µl] =mProtein ·D
SV
D : Dilution range of samples. SV : Sample volume.
The ratio E590nm/E450nm must always be the same for each protein extract. Pro-
tein extracts in TE or water should be frozen at -20◦ C before measuring the
protein concentration.
2.3 Two dimensional protein gel electrophoresis
2.3.1 Isoelectric focussing (IEF)
1. Protein samples (80-100 µg of radioactively labeled proteins, 350-600 µg of
unlabeled proteins for Colloidal Coomassie staining) were made up to 360 µl
with 8 M urea/2 M thiourea. If the volume containing the desired amount of
cytoplasmic proteins exceeds 40 µl the volume should be reduced by using a
speed vac.
2. Subsequently 40 µl 10x rehydration buffer were added and the solution was
mixed by shaking at room temperature for 30 min. The rehydration mix was
centrifuged for 5 min at 21,000 x g (-20◦ C) to remove insoluble proteins.
3. The supernatant was equally dispensed in one slot of the rehydration chamber.
The IPG strips were positioned with the gel side down. Rehydration occured over

CHAPTER 2. MATERIALS AND METHODS 33
night for at least 15 h and no longer than 24 h.
4. The isoelectric focusing was performed with the Multiphor II unit at -20◦ C.
The strips were positioned in the DryStrip Aligner in adjacent grooves and all
strips were aligned so that the anodic gel edges were lined up. The electrode
strips which already soaked with distilled water were placed across the cathodic
and anodic ends of the aligned IPG strips. The electrode strips must at least
partially contact the gel surface of each IPG strip. The IPG strips were covered
with mineral oil.
5. The isoelectric focusing was performed by using the following voltage profile:
Step 1: 500V (gradient), 2mA, 5W, 2Vh. Step 2: 3500 V (gradient), 2mA, 5W,
3kVh. Step 3: 3500 V, 2mA, 5W, 23.5 kVh.
6. After IEF the second-dimension was performed immediately or the IPG strips
could be stored at -20◦ C .
Rehydration solution
2,4 g Urea
760 mg Thiourea
50 mg Chaps
15 mg DTT
52 µl Pharmalyte 3-10
ad. 5 ml distilled water
2.3.2 SDS PolyAcrylamide Gel Electrophoresis (PAGE)
1. The separation of the focused proteins according to their molecular weight was
done in 12.5% acrylamide and 2.6% bis-acrylamide polyacrylamide gels using the
Tris-glycine system
2. For preparing 12 slab gels 335.3 ml of 40% acrylamide, 179 ml 2% bis-
acrylamide, 272.54 ml 1.5 M Tris-HCL (pH 8.8), 11.48 ml 10% SDS, and 300
ml deionized water were mixed while stirring on a magnetic stirrer. 2.8 ml 10%
APS and 0.55 ml TEMED were added to this solution and mixed by stirring.
The gels were poured immediately by filling the gel cassette about 1 cm below

CHAPTER 2. MATERIALS AND METHODS 34
the top of the glass plates. The gels were overlayed immediately after pouring
with a thin layer (1 ml) of water-saturated n-butanol or water immediately after
pouring the gels to minimize the gel exposure time to oxygen and to create a
flat gel surface. Polymerization takes at least 3 h. Each gel should be inspected
and the top of surface of each gel should be straight and flat. The butanol was
completely removed and the gel surface was rinsed with deionized water.
3. The stacking gel was prepared by mixing 10.8 ml 40% acrylamide, 3.4 ml 2%
bisacrylamide, 30 ml upper buffer (4x), and 74 ml deionized water. Afterwards
0.3 ml 10% APS and 0.05 ml TEMED were added to the solution while stirring.
An appropriate amount of the stacking gel solution was used to quickly rinse the
top of each gel and was overlaid with a thin layer (1 ml) of water. The stacking
gel should polymerize within 1 hour.
4. Equilibration buffer A and B were prepared. Each IPG strips was placed with
the gel side up in one slot of an equilibration chamber and 4-5 ml Equilibration
buffer A were added to each slot. The IPGs were equilibrated for at least 15
min with gently shaking. The equilibration solution A was decanted and 4-5 ml
equilibration solution B were added to each slot. The IPGs were equilibrated
again for at least 15 min while shaking. Equilibration solution B was decanted
and the IPG strips were placed on filter paper so that they rest on an edge to
help drain the equilibration solution.
5. Running buffer (1x) was added to the gel system. Gels were put in the gel
system filled with running buffer (1x).
6. The IPG strips were placed between the plates on the surface of the stacking
gel by gently pushing the IPG strip down so that the entire lower edge of the
IPG strip was in contact with the top surface of the stacking gel. No air bubbles
should be trapped between the IPG strips and the stacking gel.
7. Electrophoresis was performed at constant power (2 W per gel) at 12◦ C.
A constant temperature during electrophoresis is very important for gel to gel
reproducibility. When starting electrophoresis the buffer temperature should be
at 12◦ C .
8. After electrophoresis, gels were removed from their glass plates in preparation
CHAPTER 2. MATERIALS AND METHODS 35
for staining. Each gel should be marked to identify the acidic end of the first
dimension preparation.
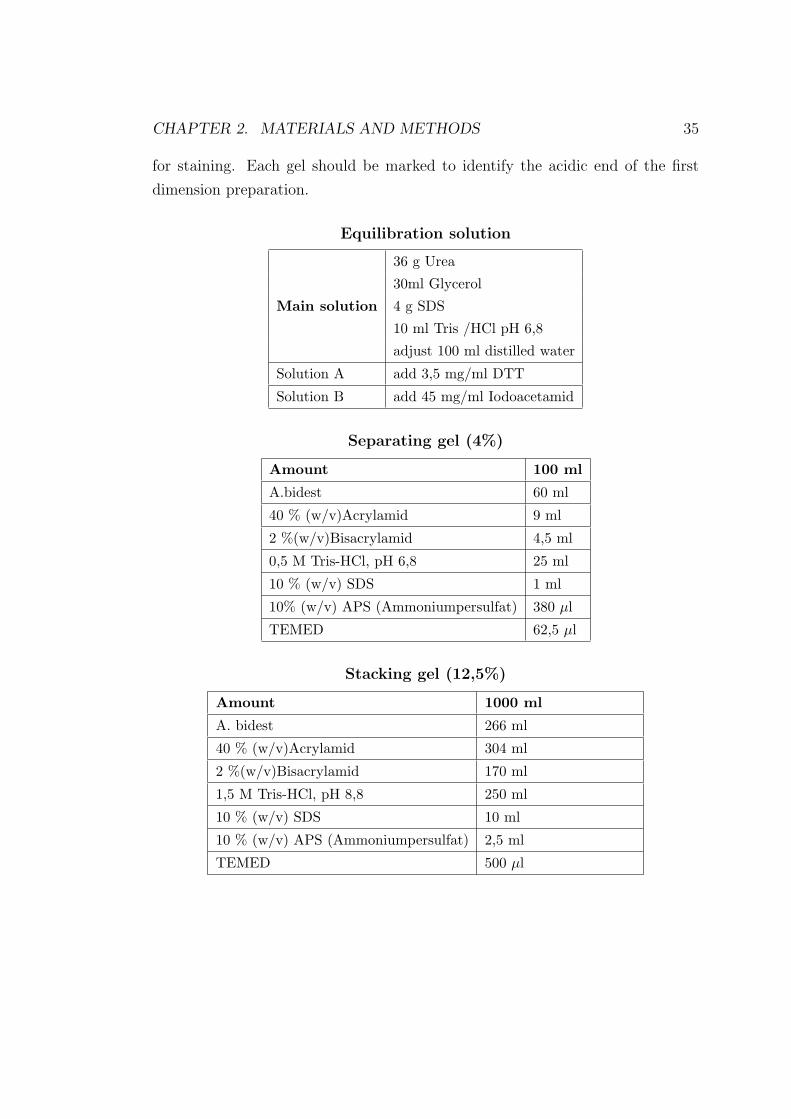
Equilibration solution
Main solution
36 g Urea
30ml Glycerol
4 g SDS
10 ml Tris /HCl pH 6,8
adjust 100 ml distilled water
Solution A add 3,5 mg/ml DTT
Solution B add 45 mg/ml Iodoacetamid
Separating gel (4%)
Amount 100 ml
A.bidest 60 ml
40 % (w/v)Acrylamid 9 ml
2 %(w/v)Bisacrylamid 4,5 ml
0,5 M Tris-HCl, pH 6,8 25 ml
10 % (w/v) SDS 1 ml
10% (w/v) APS (Ammoniumpersulfat) 380 µl
TEMED 62,5 µl
Stacking gel (12,5%)
Amount 1000 ml
A. bidest 266 ml
40 % (w/v)Acrylamid 304 ml
2 %(w/v)Bisacrylamid 170 ml
1,5 M Tris-HCl, pH 8,8 250 ml
10 % (w/v) SDS 10 ml
10 % (w/v) APS (Ammoniumpersulfat) 2,5 ml
TEMED 500 µl

CHAPTER 2. MATERIALS AND METHODS 36
2.3.3 Protein detection
2.3.3.1 Colloidal Coomassie staining
250 ml Coomassie staining solution were added to each gel and the gels were
incubated for 24 h on a stirrer.
1. After removing Coomassie staining solution the gels were rinsed with deionized
water for several times.
2. After staining, the gels were sealed in foil.
3. Gels were scanned with a Scanner X finity ultra (Quato Graphic) in transmis-
sion mode at a resolution of 200 dpi.
4. Gels could be stored at 4 ◦ C.
2.3.3.2 Silver Staining
The resulting 2D gels were treated with fixing solution for silver staining (200-250
ml per gel) for 1 to 2 h.
1. Gels were washed three times with 200 to 250 ml 50% (v/v) ethanol for 20
min and pretreated with 200 to 250 ml sodium thiosulfate solution for 1 min.
2. The gels were rinsed three times with deionized water for 20 seconds.
3. Gels were incubated with 200 to 250 ml silver nitrate solution for 20 min.
4. After removing the silver nitrate solution the gels were rinsed twice with
deionized water for 20 s.
5. For developing, gels were incubated in 200 to 250 ml potassium carbonate
solution for 2 to 10 min. The developing reaction was stopped by incubating the
gels with 200 to 250 ml 1% (w/v) glycine for 20 s, rinsing with deionized water
for 20 s and stopping again with 200 to 250 ml 1% (w/v) glycine for 20 min.
6. Gels were washed two times with deionized water for 20 min and sealed in foil.
7. Gels were scanned with a Scanner X finity ultra (Quato Graphic) in transmis-
sion mode at a resolution of 200 dpi.

CHAPTER 2. MATERIALS AND METHODS 37
8. Gels could be stored at 4◦ C.
2.3.3.3 Detection of L-[35S]-methionine labelled proteins
1. After silver staining and scanning, gels were placed on Whattman paper,
covered with cellophane sheets and dried on a vacuum dryer at 75◦ C for at least
2 to 4 hours
2. The dried gels were exposed to ”Storage Phosphor Screens” for 2 h to several
days (depending on signal intensity). Storage Phosphor Screens were scanned
with a Storm 840 Phosphor Imager at a resolution of 200 m and a color depth of
16 bit (65536 gray scay levels)
2.3.4 Protein identification by mass spectrometry
For identification of proteins by MALDI-TOF-MS, Coomassie stained protein
spots were cut from gels using a spot cutter (Proteome WorkTM) with a picker
head of 2 mm and transferred into 96-well microtiter plates.
1. Digestion with trypsin and subsequent spotting of peptide solutions onto the
MALDI targets were performed automatically in the Ettan Spot Handling Work-
station (GE Healthcare, Little Chalfont, United Kingdom) using the following
standard procedure: The gel pieces were washed twice with 100 µl 50 mM am-
monium bicarbonate/ 50% (v/v) methanol for 30 min and once with 100 µl 75%
(v/v) acetonitrile for 10 min. After 17 min drying, 10 µl trypsin solution con-
taining 20 ng/µl trypsin were added and the mixture was incubated at 37◦ C for
120 min. For peptide extraction gel pieces were covered with 60 µl 50% (v/v)
acetonitrile / 0.1% (w/v) TFA and incubated for 30 min at 37◦ C. The super-
natant containing the peptides was transferred into a new microtiter plate and
the extraction was repeated with 40 µl of the same solution. The supernatants
were dried completely at 40◦ C for 220 min completely and the peptides were
dissolved in 2.2 µl of 0.5% (w/v) TFA / 50% (v/v) acetonitrile.
2. 0.7 µl of this solution was directly spotted onto the MALDI target. Then, 0.4
µl of matrix solution was added and mixed with the sample solution by aspirating

CHAPTER 2. MATERIALS AND METHODS 38
the mixture five times. Prior to the measurement in the MALDI-TOF instrument
the samples were dried on the target for 10 to 15 min.
3. MALDI-TOF-MS analyses of spotted peptide solutions was carried out on
a Proteome-Analyzer 4700 (Applied Biosystems, Foster City, CA, USA). The
spectra were recorded in a reflector mode in a mass range from 900 to 3700
Da. For one main spectrum 25 subspectra with 100 spots per sub spectrum were
accumulated using a random search pattern. If the autolytical fragment of trypsin
with the monoisotopic (M+H)+ m/z at 2211.104 reaches a signal to noise ratio
(S/N) of at least 10, an internal calibration was automatically performed using
the peak for one point calibration. The peptide search tolerance was 50 ppm but
the actual standard deviation was between 10 and 20 ppm.
4. Calibration was performed manually for the less than 1% samples for which
automatic calibration fails. After calibration the peak lists were created using
the ”peak to mascot” script of the 4700 ExplorerTM software with the following
settings: mass range from 900 to 3700 Da; peak density of 50 peaked per range of
200 Da, minimal area of 100 and maximal 200 peaks per protein spot and minimal
S/N ratio of 6. The resulting peak lists were compared with organism specific
sequence databases by using the mascot search engine (Matrix Science, London,
UK). Peptide mixtures that yielded at least twice a Mowse score of at least 64
(depending on the size and quality of the database) and a sequence coverage of
at least 30% were regarded as positive identifications.
5. Proteins that fail to exceed the 30% sequence coverage cut-off were subjected
to MALDI-MS/MS. MALDI-TOF-TOF analysis was performed for the three
strongest peaks of the TOF spectrum. For one main spectrum 20 sub-spectra
with125 shots per sub-spectrum were accumulated using a random search pattern.
The internal calibration was automatically performed as one-point calibration if
the mono-isotopic arginine (M+H)+ m/z at 175.119 or lysine (M+H)+ m/z at
147.107 reaches an S/N of at least 5. The peak lists were created using the ”peak
to mascot” script of the 4700 ExplorerTM software with the following settings:
mass range from 60 Da to a mass that was 20 Da lower than the precursor mass;
peak density of 5 peaks per 200 Da; minimal area of 100 and maximal 20 peaks per
precursor and a minimal S/N ratio of 5. Database searches were performed using

CHAPTER 2. MATERIALS AND METHODS 39
the GPS explorer software with the organism specific databases. Proteins with a
Mowes score of at least 64 in the reflector mode that was confirmed by subsequent
peptide/fragment identifications of the strongest peaks (MS/MS) were regarded
as identified. MS/MS analysis was particularly useful for the identification of
spots containing more than one protein.
Materials and Chemicals for MALDI-TOF MS
Washing solution 150 mM ammoniumbicarbonate
50% (v/v)methanol
Washing solution 2 75% (v/v) Acetonnitril (ACN)
Trypsine solution20 ng/mL trypsin
20 mMammoniumbicarbonate
Gel digestion solution50% (v/v) ACN
0.1% (w/v) TFA (Trifloroacetic acid)
Diffusion solution0.5% (w/v) TFA
50% (v/v) ACN
Matrix solution
50% (v/v) ACN
0.5% (w/v) TFA
cyano-4-hydroxycinnamic acid
2.3.5 Quantitation and bioinformatic approaches
Evaluating high resolution 2-D gels by manual comparison of two gels was not al-
ways possible, consequently, an image evaluation software ”Delta 2D” (Decodon
GmbH, Greifswald, Germany) was applied. By means of this program, it was
possible to display the dual channel imaging of the 2-D gel pair in red and green
color, and to warp the protein spots as well. At least two different data sets of each
experiment had to be analyzed in order to screen for differences in the amount
or synthesis of the proteins identified on 2D gels. The dual channel imaging
technique is an excellent tool for identifying all proteins induced or repressed by
growth-restricting stimuli. In this technique, two digitized images of 2D gels were
generated and combined in alternate additive dual-color channels. The first one
(densitogram), showing protein levels visualized by various staining techniques,
was false-colored green. The second image (autoradiograph), representing pro-
teins synthesized and radioactively labeled during a 5-min pulse-labeling with

CHAPTER 2. MATERIALS AND METHODS 40
L-[35S]-methionine, was false-colored red. When the two images were combined,
proteins accumulated and synthesized in growing cells were colored yellow. How-
ever, proteins not previously accumulated in the cell but newly synthesized after
the imposition of a stress or starvation stimulus were colored red. Looking for such
red-colored proteins was a simple approach for visualizing all proteins induced by
a single stimulus, thereby defining the entire stimulon. Proteins repressed by the
stimulus can also be visualized by this powerful technique. Green-colored pro-
teins that were no longer synthesized (no longer red) but still present in the cell
were the candidates for repression by the stimulus.
2.3.6 RNA preparation
Total RNA from S.aureus was isolated using the acid-phenol method (Fuchs et
al., 2007) with some modifications. Samples (20 ml) from exponentially grow-
ing cultures (OD500 of 0.5) and stressed culures at different times after the
shift were treated with 10 ml of ice-cold killing buffer (20 mM Tris-HCl [pH
7.5], 5 mM MgCl2, 20 mM NaN3). The cells were immediately separated from
the supernatant by centrifugation (for 5 min at 7,155 g at 4◦ C, washed with
ice-cold killing buffer, and resuspended in lysis buffer (3 mM EDTA, 200 mM
NaCl). For mechanical disruption, the cell suspension was transferred into screw-
top tubes containing glass beads (reach the 500 µl line on the screw top) (di-
ameter of glass beads 0.1 to 0.11 mm; Sartorius, Goettingen, Germany) and
500 µl of water-saturated phenol-chloroform-isoamyl alcohol (25:24:1, v/v/v).
Cells were then disrupted by homogenisation using a Ribolyser (Thermo Elec-
tron Corporation) for 30 s at 6.5 m/s. Afterwards, the resulting RNA solu-
tion was extracted once with water-saturated phenol-chloroform-isoamylalcohol
(25:24:1,v/v/v), twice with chloroform-isoamyl alcohol (24:1, v/v), and once with
water-saturated ether. RNA was precipitated by using 70% ethanol and resus-
pended in deionised water. The quality of RNA was ensured by gel electrophoresis
and by analysis with a Bioanalyzer (Agilent Technologies, Palo Alto, CA).

CHAPTER 2. MATERIALS AND METHODS 41
2.3.7 Northern Blot analysis
Digoxigenin-labeled RNA probes were prepared by in vitro transcription with
T7 RNA polymerase by using PCR fragments as templates (Gertz et al.,1999)
The PCR fragments were generated by using chromosomal DNA of S.aureus COL
isolated with a chromosomal DNA isolation kit (Promega, Madison, WI), accord-
ing to the manufacturers recommendations, and the respective oligonucleotides.
Northern blot analyses were carried out as previously described (Wetzstein et
al.,1992). The digoxigenin-labeled RNA marker I (Roche, Indianapolis, IN) was
used to calculate the sizes of the transcripts. The hybridisation signals were de-
tected using a Lumi-Imager (Roche Diagnostics, Mannheim, Germany) and ana-
lyzed using the software package Lumi-Analyst (Roche Diagnostics, Mannheim,
Germany).
2.3.8 DNA-microarray analyses
After isolation , RNA for the DNA-microarray experiments was further purified in
order to eliminate traces of contaminating DNA. Briefly, the RNA was incubated
with 7 U RNase-free DNase (Qiagen) for 10 minutes at room temperature followed
by two phenol-chloroform-isoamyl alcohol and two chloroform-isoamyl alcohol
extraction steps in order to remove the DNase.
The integrity of the RNA was checked with the Bioanalyzer (Agilent Technologies,
Palo Alto, CA) and the concentration and purity were assessed using a NanoDrop
ND-1000 spectrophotometer(NanoDrop Technologies, Inc.,Rockland, DE). Syn-
thesis of Cy5-dCTP or Cy3-dCTP (Perkin-Elmer) labeled cDNA was done with
10 µg of total RNA as template by direct reverse-transcription using Superscript
II (Invitrogen) and random hexamers (Promega) according to the manufacturer’s
instructions. To degrade the RNA after cDNA synthesis the reaction mix was
incubated for 30 minutes at room temperature with E. coli RNase H (Invitro-
gen). Labeled cDNA was then purified with the QIAquick PCR Purification Kit
(Qiagen). The Cy-dye incorporation was analysed with a NanoDrop ND-1000
spectrophotometer (NanoDrop Technologies, Inc., Rockland, DE). A sample vol-
ume corresponding to 30 pmol incorporated dye of the labeled cDNA was used

CHAPTER 2. MATERIALS AND METHODS 42
for two-colour competitive hybridization experiments. In total four independent
hybridization experiments with each representing a biological replicate including
a control and a treated sample were carried out. To account for the dye bias two
of the four replicates were dye swapped.
The design and evaluation of the customized StaphChip oligoarray manufactured
by Agilent Technologies (Palo Alto, CA) used in this study has been described
below (Charbonnier et al., 2005). The StaphChip used in this study was based
on the whole genome sequences of S.aureus strains: COL, MRSA252, MSSA476,
Mu50, MW2, N315, USA300, and 8325.
Hybridization and washing of slides was carried out as described by Charbon-
nier and colleagues (Charbonnier et al., 2005). The slides were scanned with an
Agilent scanner. Spot intensity values were extracted with the ”Feature Extrac-
tion” software provided by Agilent (Palo Alto, CA). Visualization and analyses of
expression data were done in GeneSpringGX 7.3.1 (Agilent) and with the Cyber-
T program for the analysis of paired expression data (Baldi and Long, 2001)
(http://www.cybert.microarray. ics.uci.edu) . The parameters for the Bayesian
Standard Deviation Estimation applied in the Cyber-T analysis were: sliding
window size = 101 and confidence value for the Bayesian variance estimate =
12. Genes with a p-value p<0.001 associated with the Bayesian t-statistic and a
mean fold change of two in the four hybridization experiments were considered
as biologically significant expression changes.
Hybridization and scanning parameters.
Unless specified, equivalent amounts of cDNA (or genomic DNA) labelled with
Cyanine-3 or Cyanine-5, were diluted in 250 µl Agilent hybridization buffer, and
hybridized at a temperature of 60◦ C for 17 hours in a dedicated hybridization
oven (Robbins Scientific). For comparative genome hybridization, genomic DNA
from each individual S.aureus strain was labelled with Cy3 and cohybridized
with equivalent amounts of Cy5-labelled genomic DNA pooled from N315, Mu50
and COL (Charbonnier et al., 2005). Slides were washed, dried under Nitrogen
flow and scanned (Agilent) using 100% PMT power for both wavelengths. Data
were extracted and processed using Feature Extraction software (version 5.0,
Agilent). For gene expression analysis, saturated spots were excluded from sub-

CHAPTER 2. MATERIALS AND METHODS 43
sequent analysis. Local background subtracted signals were corrected for unequal
dye incorporation or unequal load of labelled product. The algorithm consisted
of a rank consistency filter and a curve fit using the default LOWESS (locally
weighted linear regression) method. Spots showing a reference signal lower than
background plus two standard deviations were also excluded from subsequent
analyses. For comparative genome hybridization, local background-subtracted
data were expressed as Log ratios and 10 analyzed by two-way clustering using
GeneSpring 6.1 (SiliconGenetics).

Chapter 3
Results
3.1 Heat stress response
3.1.1 Growth under heat stress conditions in synthetic
medium
Figure 3.1: Growth curve of S. aureus COL S.aureus was grown in syntheticmedium to an OD500 of 0.5 and shifted to 48◦ C, 50◦ C and 52◦ C. The timepoint of the shift was set to zero which indicated by arrow.
In order to select an optimal temperature for the heat shock experiments, the
growth rates of S.aureus COL grown at different temperatures in synthetic medium
44

CHAPTER 3. RESULTS 45
Figure 3.2: Growth rates of S.aureus COL grown at different temperatures
were examined. 37◦ C was chosen as the standard growth temperature. The cells
were grown in synthetic medium to an optical density of 0.5 at OD500 and heat
stress was performed by shifting the cells to 48◦ C, 50◦ C, and 52◦ C for two
hours. Meanwhile, the cell density was measured every 10 minutes. When shift-
ing the cells to 48◦ C the growth rate of the cells decreased from 0.359 to 0.151
(Figure 3.2). At 52◦ C the cells seemed to stop growing after the temperature
upshift. To obtain a less severe depression of the physiology, we wanted to ap-
ply a stress level which would result in a reduction of approximately 50% of the
growth rate. Therefore, we chose 48◦ C as the appropriate temperature for heat
stress experiments.
3.1.2 Global gene expression analyses of S.aureus during
heat stress
In order to get a global view on the influence of high temperature on gene reg-
ulation, transcriptomic studies were carried out by using full-genome DNA mi-
croarrays. In order to guarantee high RNA quality for DNA microarray, total
RNA was checked for induction of marker genes by Northern blot analysis first.
Additionaly, to establish appropriate time points for cell sampling for DNA array
analyses, total RNA was extracted from exponentially growing and heat treated

CHAPTER 3. RESULTS 46
Figure 3.3: Northern blot analyses of genes whose transcription was induced byheat stress. For RNA preparation, cells were grown in synthetic medium to anOD500 of 0.5 and shifted to heat stress conditions. RNA was isolated before and3, 6, 9, 12 minutes after shift to 48◦ C.
cells at different time points (3, 6, 9 and 12 minutes). Transcription of groEL
was analyzed as marker for HrcA-dependently regulated genes, and clpB and
clpP as markers for CtsR-regulated genes. Using a groEL probe, a transcript was
detected whose transcription was increased after heat stress. As shown in Fig
3.3, this major signal with a size of about 2.0 kb appeared only slightly in the
control and was strongly induced after stress and corresponds to the bicistronic
operon groEL-groES. In the case of clpB, a transcript of approximately 2.6 kb was
detected to be strongly increased after different time of exposure to heat stress.
The transcription of clpP was also increased 3, 6, 9, and 12 minutes after heat
stress. In this experiment, besides the transcript of about 0.6 kb corresponding
to clpP, we also observed other transcripts of about 2.0 kb and 3.5 kb which were
induced by heat stress as well. According to the region view of clpP, it can be
suggested that SACOL0830, SACOL0831 and SACOL0832 might transcribed to-
gether and might be induced by heat shock as well. These results indicated that
groEL-groES, clpB and clpP were expressed at increased levels after heat stress.
According to these data, we chose 10 minute shift to 48◦ C as an appropriate
time point for DNA microarrays experiments.

CHAPTER 3. RESULTS 47
By comparing gene transcription under control and stress conditions, we were able
to identify differently expressed genes. For each gene the ratios of the transcript
levels were calculated. All genes showing an at least two fold induction or re-
pression of transcription in both experiments were considered to be differentially
expressed under heat stress.
Accordingly, the transcription of 310 genes was increased while the transcription
of 266 genes was decreased under heat shock conditions. The expression profiles of
up and down regulated genes are shown in Table 3.1 and 3.2. The transcriptomics
analyses have shown the induction of many HrcA-CIRCE controlled genes. The
transcription of seven genes possibly regulated by HrcA was strongly increased
after heat stress: dnaK-dnaJ- grpE- hrcA with an induction factor that varied
from 15.11 fold to 20.67 fold and groEL -groES with an induction ratio of 7.7 to
8 fold.
Moreover, the transcription genes belonging to the CtsR regulon was also induced
by high temperature e.g.s clpB and clpP encoding proteins involved in repair
and degradation of damaged proteins were strongly induced at the transcriptome
level (135 fold and 10 fold, respectively). Transcriptome analysis also showed the
induction of the transcription factor CtsR at a very high level of 61,6 fold after 10
minute heat exposure. Besides, the DNA arrays data revealed a light induction
of the genes SACOL0830, SACOL0831 and SACOL0832(as shown in fig.3.3) at
an average ratio of 2.1, 1.8 and 1.7 respectively, indicating that these genes might
by induced by heat stress as well.
After heat exposure, we could not detect any induction of sigmaB-dependent
genes. The alternative sigma factor σB B has been found in some pathogenic
gram-positive bacteria, including S.aureus (Wu et al., 1996; Kullik and Giachino,
1997). In B. subtilis, sigma B-dependent genes have been described to be strongly
induced by heat and other environmental stresses as well as starvation condition
(Hecker and Volker, 1998). In S.aureus, σB-dependent induction of sigma B by
heat stress in complex medium has been described previously( Kullik and Giachi-
ano., 1997 ). In this study, we looked for sigB-dependent induction after heat
stress in cells grown in synthetic medium. Surprisingly, after heat exposure, we
could not detect any response of sigma B-dependent proteins. The transcrip-

CHAPTER 3. RESULTS 48
tome analysis revealed the induction of alkyl hydroperoxide reductase, subunit
C (ahpC ) and alkyl hydroperoxide reductase, subunit F (ahpF ) at 3.1 and 3.16
fold, respectively. These two genes were defined as such that controlled neither
by HrcA, nor by CtsR and σB( Derre et al., 1999).
Among the genes induced by heat shock were some putative virulence factors
including five pathogenicity island genes SACOL0893, SACOL0898, SACOL0903,
SACOL0904, SACOL0905 with an induction rate that varied from 2.2 to 8.4 fold
and members of the urease system ureA-ureG which were upregulated 5.24, 4.58,
3.68, 3.48, 3.66 and 3,26 fold, respectively.
As shown in Table 3.1, the heat treatment also resulted in the induction of en-
zymes involved in purine and pyrimidine biosynthesis. Among them were pyrB,
pyrC, pyrE, and pyrF forming an operon as well as the regulator pyrR with the
induction factors of 5.6, 4.2, 3.4, 3,2 and 6.1 fold , respectively. The deoD1 gene
encoding a purine nucleoside phosphorylase was also induced.
The transcriptome experiments also suggested the induction of genes whose func-
tion in heat resistance was still unknown. For example, frp gene encoding NAD(P)
H-flavin-dependent oxidoreductase (4.5 fold) or the SACOL0453 gene encoding
a NAD(P)H flavinoxidoreductase (2.96 fold) which could contribute to specific
degradation are induced by heat treatment. Furthermore, the array data also
showed that genes involved in the metabolism of alternative carbon sources
such as 6-phospho-beta-glucosidase (bglA) (Zhang et al.,1994), glycerate kinase
(SACOL0805) and glycosyl transferase (SACOL1498) were highly transcribed
under heat shock conditions.
Surprisingly, the transcription of genes localized on prophage L54a was also up-
regulated, for instant, genes encoding a repressor protein (SACOL0321), an an-
tirepressor protein (SACOL0325), replicative DNA helicase (SACOL0343), N-6-
adenine-methyltransferase ( SACOL0346), deoxyuridine 5’-triphosphate nucleoti-
dohydrolase (SACOL0357), and transcriptional regulator of the RinA family
SACOL0364 as well as the small and large subunit of the terminase ( SACOL0366
and SACOL0367) (Table 3.1).

CHAPTER 3. RESULTS 49
Table 3.1: Genes whose transcription was induced under heat stress condition
ID COL Locus Function Average Ratio
Amino acid biosynthesis
SACOL0502 SACOL0502 cysteine synthase/cystathionine beta-synthase family protein 3.55
vraS SACOL1943 ornithine–oxo-acid transaminase 3.10
cysE SACOL0575 sensor histidine kinase VraS 6.70
rocD SACOL0960 serine acetyltransferase 2.22
SACOL0503 SACOL0503 trans-sulfuration enzyme family protein 3.09
Biosynthesis of cofactors, prosthetic groups and carriers
entB SACOL0172 isochorismatase 2.83
SACOL1051 SACOL1051 isochorismate synthase family protein 2.53
SACOL1640 SACOL1640 coproporphyrinogen III oxidase 2.31
ribH SACOL1817 riboflavin synthase, beta subunit 3.00
coaBC SACOL1223 phosphopantothenoylcysteine decarboxylase/phosphopantothenate–
cysteine ligase
2.76
moaA SACOL2261 molybdenum cofactor biosynthesis protein A 2.38
hutH SACOL0008 histidine ammonia-lyase 2.92
Cellular processes
ahpC SACOL0452 alkyl hydroperoxide reductase, C subunit 3.16
ahpF SACOL0451 alkyl hydroperoxide reductase, subunit F 3.10
SACOL1645 SACOL1645 comE operon protein 2 2.35
SACOL0813 SACOL0813 comf operon protein 1, putative 3.91
betB SACOL2628 betaine aldehyde dehydrogenase 2.76
SACOL1644 SACOL1644 competence protein ComEC/Rec2, putative 2.79
SACOL0814 SACOL0814 competence protein F 3.98
SACOL1004 SACOL1004 competence protein, putative 3.31
SACOL1003 SACOL1003 adaptor protein 2.74
kataA SACOL1368 catalase 2.88
ebh SACOL1472 Cell wall associated fibronectin-binding protein 2.22
lytN SACOL1264 cell wall hydrolase 7.10
SACOL1657 SACOL1657 enterotoxin type A, putative 3.86
sspA SACOL1057 V8 Protease 2.44
trmE SACOL2738 tRNA modification GTPase 2.90
SACOL2131 SACOL2131 Dps family protein 10.89
SACOL1781 SACOL1781 cell wall surface anchor family protein 2.73
Cell envelope
fnbB SACOL2509 fibronectin binding protein B 14.18
SACOL1762 SACOL1762 thiol peroxidase, putative 2.52
SACOL0985 SACOL0985 surface protein, putative 3.66
mreC SACOL1704 rod shape-determining protein MreC 2.89
SACOL0414 SACOL0414 lipoprotein, putative 2.37
SACOL2439 SACOL2439 lipoprotein, putative 6.13
SACOL1220 SACOL1220 fibronectin/fibrinogen binding-related protein 3.29
DNA metabolism
gyrA SACOL0006 DNA gyrase, A subunit 2.31
gyrB SACOL0005 DNA gyrase, B subunit 2.97
polA SACOL1737 DNA polymerase I 2.41
dnaG SACOL1619 DNA primase 2.26
radA SACOL0572 DNA repair protein RadA 12.75
SACOL1493 SACOL1493 DNA replication protein DnaD, putative 4.66
vraR SACOL1942 DNA-binding response regulator VraR 2.95
dinP SACOL1955 DNA-damage-inducible protein P 2.74
recG SACOL1241 ATP-dependent DNA helicase RecG 2.18
nth SACOL1492 endonuclease III 4.35
uvrB SACOL0823 excinuclease ABC subunit B 3.64
uvrA SACOL0824 excinuclease ABC, A subunit 2.81
SACOL1954 SACOL1954 exonuclease 6.27
SACOL0004 SACOL0004 recombination protein F 3.00
SACOL1154 SACOL1154 recombination and DNA strand exchange inhibitor protein 2.15
rpoB SACOL0588 DNA-directed RNA polymerase beta subunit 2.22
Energy metabolism
ipdC SACOL0173 indole-3-pyruvate decarboxylase 2.99
SACOL0981 SACOL0981 isopropylmalate synthase-related protein 44.87
zwf SACOL1549 glucose-6-phosphate 1-dehydrogenase 2.48
gidA SACOL2737 glucose-inhibited division protein A 2.40
murI SACOL1161 glutamate racemase 4.75
gltX SACOL0574 glutamyl-tRNA synthetase 9.43

CHAPTER 3. RESULTS 50
SACOL0805 SACOL0805 glycerate kinase family protein 2.30
SACOL1498 SACOL1498 glycosyl transferase, group 1 family protein 2.49
SACOL1207 SACOL1207 glyoxalase family protein 4.31
menD SACOL1052 2-succinyl-6-hydroxy-2,4-cyclohexadiene-1-carboxylic acid
synthase/2-oxoglutarate decarboxylase
2.45
ribBA SACOL1818 3,4-dihydroxy-2-butanone-4-phosphate synthase/GTP cyclohydro-
lase II
2.25
bglA SACOL0251 6-phospho-beta-glucosidase 5.66
SACOL2278 SACOL2278 acyl-CoA dehydrogenase-related protein 2.59
SACOL0111 SACOL0111 acetoin reductase 2.45
acuA SACOL1784 acetoin utilization protein AcuA 2.58
SACOL2178 SACOL2178 alcohol dehydrogenase, zinc-containing 2.66
SACOL2177 SACOL2177 alcohol dehydrogenase, zinc-containing 3.06
cydA SACOL1094 cytochrome d ubiquinol oxidase, subunit I 4.02
cydB SACOL1095 cytochrome d ubiquinol oxidase, subunit II 3.16
frp SACOL2534 NAD(P)H-flavin oxidoreductase 4.28
SACOL0453 SACOL0453 NAD(P)H-flavin oxidoreductase, putative 2.96
SACOL0959 SACOL0959 NADH-dependent flavin oxidoreductase, Oye family 5.43
trxB SACOL0829 thioredoxin-disulfide reductase 2.81
fdhD SACOL2273 formate dehydrogenase accessory protein 6.82
SACOL1952 SACOL1952 ferritins family protein 12.87
acs SACOL1783 acetyl-coenzyme A synthetase 3.05
Fatty acid and phospholipid metabolism
SACOL1814 SACOL1814 lysophospholipase, putative 2.24
Pathogenicity island protein
SACOL0898 SACOL0898 pathogenicity island protein 2.16
SACOL0893 SACOL0893 pathogenicity island protein 2.52
SACOL0903 SACOL0903 pathogenicity island protein 3.79
SACOL0904 SACOL0904 pathogenicity island protein 5.70
SACOL0905 SACOL0905 pathogenicity island protein 8.38
Protein fate
groES SACOL2017 chaperonin, 10 kDa 7.74
groEL SACOL2016 chaperonin, 60 kDa 8.06
dnaJ SACOL1636 dnaJ protein 18.91
dnaK SACOL1637 dnaK protein 15.46
clpB SACOL0979 ATP-dependent Clp protease, ATP-binding subunit ClpB 135.49
grpE SACOL1638 heat shock protein GrpE 15.11
hrcA SACOL1639 heat-inducible transcription repressor HrcA 20.67
clpP SACOL0833 ATP-dependent Clp protease, proteolytic subunit ClpP 10.09
SACOL1419 SACOL1419 oligoendopeptidase F, putative 2.48
def SACOL1100 peptide deformylase 2.09
SACOL1555 SACOL1555 peptidase, M20/M25/M40 family 2.47
secA SACOL0816 translocase 2.41
Protein synthesis
SACOL0578 SACOL0578 RNA methyltransferase, TrmH family 4.60
cysS SACOL0576 cysteinyl-tRNA synthetase 7.70
Prophage L54a
SACOL0325 SACOL0325 prophage L54a, antirepressor, putative 13.83
dut SACOL0357 prophage L54a, deoxyuridine 5’-triphosphate nucleotidohydrolase 8.07
int SACOL0318 prophage L54a, integrase 8.06
SACOL0346 SACOL0346 prophage L54a, N-6-adenine-methyltransferase 22.81
SACOL0368 SACOL0368 prophage L54a, portal protein, HK97 family 2.51
SACOL0343 SACOL0343 prophage L54a, replicative DNA helicase, putative 23.75
SACOL0321 SACOL0321 prophage L54a, repressor protein, putative 14.10
ssb1 SACOL0339 prophage L54a, single-stranded DNA binding protein 8.07
SACOL0367 SACOL0367 prophage L54a, terminase, large subunit, putative 3.95
SACOL0366 SACOL0366 prophage L54a, terminase, small subunit, putative 6.72
SACOL0364 SACOL0364 prophage L54a, transcriptional regulator, RinA family 11.90
Purines, pyrimidines, nucleosides, and nucleotides
pyrB SACOL1212 aspartate carbamoyltransferase catalytic subunit 5.67
pyrC SACOL1213 dihydroorotase 4.20
deoD1 SACOL0121 purine nucleoside phosphorylase 4.26
SACOL0569 SACOL0569 putative ATP:guanido phosphotransferase 56.14
SACOL1520 SACOL1520 pyridine nucleotide-disulfide oxidoreductase 2.52
SACOL0640 SACOL0640 pyridine nucleotide-disulfide oxidoreductase 8.64
pyrR SACOL1210 pyrimidine regulatory protein PyrR 6.15
pdp SACOL2128 pyrimidine-nucleoside phosphorylase 2.11
carB SACOL1215 carbamoyl-phosphate synthase large subunit 2.99

CHAPTER 3. RESULTS 51
carA SACOL1214 carbamoyl-phosphate synthase small subunit 3.55
pyrE SACOL1217 orotate phosphoribosyltransferase 3.43
pyrF SACOL1216 orotidine 5’-phosphate decarboxylase 3.21
thiD2 SACOL2085 phosphomethylpyrimidine kinase 2.77
Putative virulence factor
ureD SACOL2286 urease accessory protein UreD 3.48
ureE SACOL2283 urease accessory protein UreE 3.66
ureF SACOL2284 urease accessory protein UreF 3.84
ureG SACOL2285 urease accessory protein UreG 3.26
ureC SACOL2282 urease, alpha subunit 3.68
ureB SACOL2281 urease, beta subunit 4.58
ureA SACOL2280 urease, gamma subunit 5.24
Regulatory functions
ccpA SACOL1786 catabolite control protein A 4.67
SACOL1393 SACOL1393 transcriptional antiterminator LicT, putative 2.78
ctsR SACOL0567 transcriptional regulator CtsR 61.64
czrA SACOL2137 transcriptional regulator CzrA 9.21
SACOL1550 SACOL1550 transcriptional regulator, AraC family 2.38
SACOL0890 SACOL0890 transcriptional regulator, Cro/CI family 2.21
SACOL0420 SACOL0420 transcriptional regulator, Cro/CI family 2.91
SACOL0563 SACOL0563 transcriptional regulator, GntR family 8.59
SACOL2256 SACOL2256 transcriptional regulator, MarR family 2.84
SACOL2531 SACOL2531 transcriptional regulator, MarR family 4.29
SACOL2189 SACOL2189 transcriptional regulator, Sir2 family 2.89
SACOL2086 SACOL2086 transcriptional regulator, TenA family 2.25
SACOL2593 SACOL2593 transcriptional regulator, TetR family 2.78
SACOL2374 SACOL2374 transcriptional regulator, TetR family. putative 2.95
sarV SACOL2258 staphylococcal accessory regulator V 2.45
SACOL2035 SACOL2035 redox-sensing transcriptional repressor Rex 2.37
rnpA SACOL2739 ribonuclease P 3.03
gltC SACOL0513 transcriptional regulatory protein GltC 4.06
Ribosomal protein
rpsN1 SACOL1370 30S ribosomal protein S14 2.65
prmA SACOL1635 ribosomal protein L11 methyltransferase 18.88
rpmG1 SACOL1369 ribosomal protein L33 2.30
Transport and binding proteins
SACOL2138 SACOL2138 cation efflux family protein 7.58
SACOL0997 SACOL0997 oligopeptide ABC transporter, ATP-binding protein 2.09
SACOL0998 SACOL0998 oligopeptide ABC transporter, ATP-binding protein 2.20
SACOL0996 SACOL0996 oligopeptide ABC transporter, oligopeptide-binding protein 2.08
SACOL1000 SACOL1000 oligopeptide ABC transporter, permease protein 2.61
SACOL0999 SACOL0999 oligopeptide ABC transporter, permease protein 2.69
SACOL2375 SACOL2375 transporter, CorA family 2.61
SACOL2279 SACOL2279 transporter, putative 3.02
uraA SACOL1211 uracil permease 7,16
SACOL1096 SACOL1096 TrkA potassium uptake family protein 2.48
SACOL0122 SACOL0122 tetracycline resistance protein, putative 4.17
SACOL0250 SACOL0250 PTS system, IIA component 7.30
SACOL0781 SACOL0781 osmoprotectant ABC transporter, ATP-binding protein, putative 2.24
SACOL2257 SACOL2257 drug transporter, putative 3.26
SACOL2523 SACOL2523 drug transporter, putative 3.27
SACOL2356 SACOL2356 ABC transporter, ATP-binding protein 2.31
Unknown function
SACOL0220 SACOL0220 flavohemoprotein, putative 2.55
SACOL0976 SACOL0976 hydrolase, haloacid dehalogenase-like family 2.39
SACOL1162 SACOL1162 HAM1 protein 3.27
SACOL1683 SACOL1683 HesA/MoeB/ThiF family protein 2.78
SACOL1400 SACOL1400 ImpB/MucB/SamB family protein 4.34
SACOL0820 SACOL0820 LysM domain protein 2.61
SACOL0191 SACOL0191 M23/M37 peptidase domain protein 3.77
SACOL0064 SACOL0064 metallo-beta-lactamase family protein 2.50
SACOL0418 SACOL0418 mttA/Hcf106 family protein 6.36
SACOL0417 SACOL0417 MttB family protein 6.47
SACOL2722 SACOL2722 N-acetyltransferase family protein 2.73
SACOL1669 SACOL1669 O-methyltransferase family protein 2.19
SACOL1669 SACOL1669 O-methyltransferase family protein 2.19
SACOL1771 SACOL1771 OsmC/Ohr family protein 2.53
SACOL2594 SACOL2594 oxidoreductase, short chain dehydrogenase/reductase family 3.01

CHAPTER 3. RESULTS 52
SACOL0498 SACOL0498 PAP2 family protein 2.32
SACOL1967 SACOL1967 PcrB-like protein 4.11
SACOL2529 SACOL2529 phospholipase/carboxylesterase family protein 2.08
SACOL0573 SACOL0573 PIN/TRAM domain protein 11.27
rarD SACOL2719 rarD protein 2.74
SACOL0921 SACOL0921 CBS domain protein 2.72
SACOL2245 SACOL2245 acetyltransferase, GNAT family 2.66
SACOL2366 SACOL2366 acetyltransferase, GNAT family 3.00
SACOL2012 SACOL2012 acetyltransferase, GNAT family 4.41
SACOL1678 SACOL1678 bacterial luciferase family protein 3,53
SACOL1833 SACOL1833 crcB family protein 3.43
crcB SACOL1832 crcB protein 3.63
SACOL0982 SACOL0982 Sua5/YciO/YrdC/YwlC family protein 28.27
ypfP SACOL1022 ypfP protein 2.69
SACOL0714 SACOL0714 acetyltransferase, GNAT family 4.46
Hypothetical protein
SACOL0613 SACOL0613 hypothetical protein 2.05
SACOL2040 SACOL2040 hypothetical protein 2.07
SACOL2041 SACOL2041 hypothetical protein 2.12
SACOL1616 SACOL1616 hypothetical protein 2.15
SACOL1539 SACOL1539 hypothetical protein 2.16
SACOL2127 SACOL2127 hypothetical protein 2.16
SACOL0710 SACOL0710 hypothetical protein 2.21
SACOL0924 SACOL0924 hypothetical protein 2.23
SACOL0496 SACOL0496 hypothetical protein 2.24
SACOL1099 SACOL1099 hypothetical protein 2.25
SACOL0614 SACOL0614 hypothetical protein 2.29
SACOL0466 SACOL0466 hypothetical protein 2.34
SACOL0354 SACOL0354 hypothetical protein 2.34
SACOL1953 SACOL1953 hypothetical protein 2.36
SACOL0715 SACOL0715 hypothetical protein 2.36
SACOL0129 SACOL0129 hypothetical protein 2.36
SACOL1643 SACOL1643 hypothetical protein 2.40
SACOL0324 SACOL0324 hypothetical protein 2.42
SACOL0897 SACOL0897 hypothetical protein 2.42
SACOL0922 SACOL0922 hypothetical protein 2.44
SACOL0822 SACOL0822 hypothetical protein 2.50
SACOL2503 SACOL2503 hypothetical protein 2.51
SACOL1009 SACOL1009 hypothetical protein 2.51
SACOL2502 SACOL2502 hypothetical protein 2.52
SACOL2547 SACOL2547 hypothetical protein 2.54
SACOL2440 SACOL2440 hypothetical protein 2.57
SACOL1050 SACOL1050 hypothetical protein 2.58
SACOL0974 SACOL0974 hypothetical protein 2.60
SACOL0615 SACOL0615 hypothetical protein 2.66
SACOL2354 SACOL2354 hypothetical protein 2.67
SACOL0465 SACOL0465 hypothetical protein 2.69
SACOL0463 SACOL0463 hypothetical protein 2.73
SACOL0848 SACOL0848 hypothetical protein 2.75
SACOL2596 SACOL2596 hypothetical protein 2.77
SACOL0512 SACOL0512 hypothetical protein 2.80
SACOL1761 SACOL1761 hypothetical protein 2.80
SACOL0467 SACOL0467 hypothetical protein 2.82
SACOL1153 SACOL1153 hypothetical protein 2.89
SACOL2520 SACOL2520 hypothetical protein 2.93
SACOL1190 SACOL1190 hypothetical protein 2.97
SACOL0063 SACOL0063 hypothetical protein 2.98
SACOL1658 SACOL1658 hypothetical protein 3.00
SACOL1163 SACOL1163 hypothetical protein 3.00
SACOL1499 SACOL1499 hypothetical protein 3.00
SACOL0978 SACOL0978 hypothetical protein 3.05
SACOL0074 SACOL0074 hypothetical protein 3.06
SACOL1656 SACOL1656 hypothetical protein 3.11
SACOL2033 SACOL2033 hypothetical protein 3.24
SACOL0219 SACOL0219 hypothetical protein 3.27
SACOL1944 SACOL1944 hypothetical protein 3.37
SACOL1945 SACOL1945 hypothetical protein 3.38
SACOL1438 SACOL1438 hypothetical protein 3.50

CHAPTER 3. RESULTS 53
SACOL2034 SACOL2034 hypothetical protein 3.51
SACOL0769 SACOL0769 hypothetical protein 3.51
SACOL2550 SACOL2550 hypothetical protein 3.54
SACOL0942 SACOL0942 hypothetical protein 3.56
SACOL1218 SACOL1218 hypothetical protein 3.58
SACOL0218 SACOL0218 hypothetical protein 3.64
SACOL0003 SACOL0003 hypothetical protein 3.74
SACOL1526 SACOL1526 hypothetical protein 3.84
SACOL1815 SACOL1815 hypothetical protein 3.89
SACOL0965 SACOL0965 hypothetical protein 3.96
SACOL2715 SACOL2715 hypothetical protein 3.99
SACOL1059 SACOL1059 hypothetical protein 4.08
SACOL1491 SACOL1491 hypothetical protein 4.14
SACOL2551 SACOL2551 hypothetical protein 4.14
SACOL2179 SACOL2179 hypothetical protein 4.44
SACOL0316 SACOL0316 hypothetical protein 4.55
SACOL0579 SACOL0579 hypothetical protein 4.59
SACOL0072 SACOL0072 hypothetical protein 4.66
SACOL0580 SACOL0580 hypothetical protein 4.70
SACOL1705 SACOL1705 hypothetical protein 5.30
SACOL0419 SACOL0419 hypothetical protein 5.51
SACOL0577 SACOL0577 hypothetical protein 5.57
SACOL2013 SACOL2013 hypothetical protein 5.66
SACOL1633 SACOL1633 hypothetical protein 5.88
SACOL0984 SACOL0984 hypothetical protein 6.52
SACOL1634 SACOL1634 hypothetical protein 7.24
SACOL0323 SACOL0323 hypothetical protein 7.68
SACOL0329 SACOL0329 hypothetical protein 8.24
SACOL0356 SACOL0356 hypothetical protein 9.76
SACOL0641 SACOL0641 hypothetical protein 10.02
SACOL0319 SACOL0319 hypothetical protein 10.03
SACOL0341 SACOL0341 hypothetical protein 10.09
SACOL0811 SACOL0811 hypothetical protein 10.32
SACOL0983 SACOL0983 hypothetical protein 10.50
SACOL2571 SACOL2571 hypothetical protein 10.60
SACOL0320 SACOL0320 hypothetical protein 11.00
SACOL0348 SACOL0348 hypothetical protein 11.41
SACOL0327 SACOL0327 hypothetical protein 11.68
SACOL0568 SACOL0568 hypothetical protein 11.74
SACOL0355 SACOL0355 hypothetical protein 12.64
SACOL0326 SACOL0326 hypothetical protein 12.69
SACOL0361 SACOL0361 hypothetical protein 12.95
SACOL0342 SACOL0342 hypothetical protein 13.48
SACOL0333 SACOL0333 hypothetical protein 14.49
SACOL0331 SACOL0331 hypothetical protein 14.75
SACOL0347 SACOL0347 hypothetical protein 16.11
SACOL0335 SACOL0335 hypothetical protein 17.99
SACOL0340 SACOL0340 hypothetical protein 18.73
SACOL0350 SACOL0350 hypothetical protein 20.20
SACOL0337 SACOL0337 hypothetical protein 20.39
SACOL0338 SACOL0338 hypothetical protein 21.71
SACOL0334 SACOL0334 hypothetical protein 22.52
SACOL0362 SACOL0362 hypothetical protein 23.30
SACOL0336 SACOL0336 hypothetical protein 24.77
SACOL0358 SACOL0358 hypothetical protein 25.92
SACOL0359 SACOL0359 hypothetical protein 26.59
SACOL0352 SACOL0352 hypothetical protein 28.90
SACOL0344 SACOL0344 hypothetical protein 28.92
SACOL0363 SACOL0363 hypothetical protein 29.02
SACOL0353 SACOL0353 hypothetical protein 29.54
SACOL0345 SACOL0345 hypothetical protein 30.65
SACOL0351 SACOL0351 hypothetical protein 32.63

CHAPTER 3. RESULTS 54
Table 3.2: Genes whose transcription was repressed under heat stress condition
ID COL Locus Function Average Ratio
Amino acid biosynthesis
SACOL1360 SACOL1360 aspartate kinase 0.39
metE SACOL0428 5-methyltetrahydropteroyltriglutamate–homocysteine methyl-
transferase
0.39
argG SACOL0964 argininosuccinate synthase 0.34
pheS SACOL1148 phenylalanyl-tRNA synthetase, alpha subunit 0.43
pheT SACOL1149 phenylalanyl-tRNA synthetase, beta subunit 0.30
serA SACOL1773 D-3-phosphoglycerate dehydrogenase 0.28
SACOL0430 SACOL0430 trans-sulfuration enzyme family protein 0.34
SACOL0431 SACOL0431 trans-sulfuration enzyme family protein 0.41
trpB SACOL1408 tryptophan synthase subunit beta 0.48
thrC SACOL1363 threonine synthase 0.36
hisI SACOL2696 phosphoribosyl-ATP pyrophosphatase/phosphoribosyl-AMP cyclo-
hydrolase
0.48
hisA SACOL2698 phosphoribosylformimino-5-aminoimidazole carboxamide ribotide
isomerase
0.36
hisF SACOL2697 hisF protein (cyclase) 0.41
hisD SACOL2702 histidinol dehydrogenase 0.42
hom SACOL1362 homoserine dehydrogenase 0.41
thrB SACOL1364 homoserine kinase 0.32
hisH SACOL2699 imidazole glycerol phosphate synthase, glutamine amidotransferase
subunit
0.40
hisB SACOL2700 imidazoleglycerol-phosphate dehydratase 0.42
putA SACOL1816 proline dehydrogenase 0.30
SACOL0429 SACOL0429 bifunctional homocysteine S-methyltransferase/5,10-
methylenetetrahydrofolate reductase protein
0.30
Biosynthesis of cofactors
SACOL0564 SACOL0564 pyridoxine biosynthesis protein 0.35
ctaB SACOL1125 protoheme IX farnesyltransferase 0.40
SACOL2579 SACOL2579 phytoene dehydrogenase 0.13
Cell envelope
cap5M SACOL0148 capsular polysaccharide biosynthesis galactosyltransferase Cap5M 0.29
cap5A SACOL0136 capsular polysaccharide biosynthesis protein Cap5A 0.18
cap5B SACOL0137 capsular polysaccharide biosynthesis protein Cap5B 0.17
cap5C SACOL0138 capsular polysaccharide biosynthesis protein Cap5C 0.12
cap5D SACOL0139 capsular polysaccharide biosynthesis protein Cap5D 0.23
cap5E SACOL0140 capsular polysaccharide biosynthesis protein Cap5E 0.24
cap5F SACOL0141 capsular polysaccharide biosynthesis protein Cap5F 0.16
cap5H SACOL0143 capsular polysaccharide biosynthesis protein Cap5H 0.17
cap5I SACOL0144 capsular polysaccharide biosynthesis protein Cap5I 0.17
cap5J SACOL0145 capsular polysaccharide biosynthesis protein Cap5J 0.22
cap5K SACOL0146 capsular polysaccharide biosynthesis protein Cap5K 0.29
cap5L SACOL0147 capsular polysaccharide biosynthesis protein Cap5L 0.46
cap5N SACOL0149 capsular polysaccharide biosynthesis protein Cap5N 0.41
cap5O SACOL0150 capsular polysaccharide biosynthesis protein Cap5O 0.47
SACOL0119 SACOL0119 cell wall surface anchor family protein 0.38
SACOL1043 SACOL1043 glycosyl transferase, group 1 family protein 0.33
SACOL2578 SACOL2578 glycosyl transferase, group 2 family protein 0.07
lrgB SACOL0248 antiholin-like protein LrgB 0.34
cap5G SACOL0142 UDP-N-acetylglucosamine 2-epimerase Cap5G 0.13
lrgA SACOL0247 murein hydrolase regulator LrgA 0.29
atl SACOL1062 bifunctional autolysin 0.25
dltD SACOL0938 DltD protein 0.48
Cellular processes
agrA SACOL2026 accessory gene regulator protein A 0.21
agrB SACOL2023 accessory gene regulator protein B 0.18
argC2 SACOL2025 accessory gene regulator protein C 0.18
sarS SACOL0096 staphylococcal accessory regulator S 0.29
sarY SACOL2289 staphylococcal accessory regulator Y 0.29
arlS SACOL1450 sensor histidine kinase ArlS 0.48
kdpD SACOL2070 sensor histidine kinase KdpD 0.45
rsbW SACOL2055 serine-protein kinase RsbW 0.35
rpoF SACOL2054 sigma factor B 0.31
SACOL2581 SACOL2581 staphyloxanthin biosynthesis protein 0.39
sdrE SACOL0610 sdrE protein 0.39

CHAPTER 3. RESULTS 55
epiG SACOL1871 epidermin immunity protein F 0.41
epiE SACOL1872 epidermin immunity protein F 0.44
mscL SACOL1383 large conductance mechanosensitive channel protein 0.34
clfB SACOL2652 clumping factor B 0.29
SACOL0861 SACOL0861 cold shock protein, CSD family 0.30
DNA metabolism
hup SACOL1513 DNA-binding protein HU 0.36
kdpE SACOL2071 DNA-binding response regulator KdpE 0.42
SACOL0201 SACOL0201 DNA-binding response regulator, AraC family 0.44
SACOL0678 SACOL0678 integrase/recombinase, phage integrase family 0.34
Energy metabolism/Central metabolism
malA SACOL1551 alpha-glucosidase 0.43
SACOL2484 SACOL2484 alkylhydroperoxidase, AhpD family 0.21
SACOL0517 SACOL0517 alpha-amylase family protein 0.40
atpH SACOL2098 ATP synthase F1, delta subunit 0.50
atpC SACOL2094 ATP synthase F1, epsilon subunit 0.40
atpG SACOL2096 ATP synthase F1, gamma subunit 0.46
atpA SACOL2097 ATP synthase subunit A 0.50
atpD SACOL2095 ATP synthase subunit B 0.41
folC SACOL1709 folylpolyglutamate synthase/dihydrofolate synthase 0.42
pflB SACOL0204 formate acetyltransferase 0.25
SACOL2301 SACOL2301 formate dehydrogenase, alpha subunit, putative 0.29
hutG SACOL2327 formiminoglutamase 0.31
fumC SACOL1908 fumarate hydratase, class II 0.37
glk SACOL1604 glucokinase 0.38
gntP SACOL2514 gluconate transporter, permease protein 0.30
gntK SACOL2515 gluconokinase 0.15
SACOL1912 SACOL1912 glucosamine-6-phosphate isomerase, putative 0.35
gltB SACOL0514 glutamate synthase, large subunit 0.28
gltD SACOL0515 glutamate synthase, small subunit 0.24
femC SACOL1329 glutamine synthetase FemC 0.38
glnR SACOL1328 glutamine synthetase repressor 0.48
sdhA SACOL1159 succinate dehydrogenase 0.36
sdhC SACOL1158 succinate dehydrogenase, cytochrome b558 subunit 0.41
qoxA SACOL1069 quinol oxidase, subunit I 0.34
qoxB SACOL1070 quinol oxidase, subunit II 0.40
qoxC SACOL1068 quinol oxidase, subunit III 0.38
qoxD SACOL1067 quinol oxidase, subunit IV 0.25
crtN SACOL2576 dehydrosqualene desaturase 0.10
crtM SACOL2577 dehydrosqualene synthase 0.25
glmS SACOL2145 D-fructose-6-phosphate amidotransferase 0.33
pckA SACOL1838 phosphoenolpyruvate carboxykinase 0.45
mtlD SACOL2149 mannitol-1-phosphate 5-dehydrogenase 0.47
manA1 SACOL2135 mannose-6-phosphate isomerase, class I 0.32
SACOL1602 SACOL1602 metallo-beta-lactamase family protein 0.38
SACOL0638 SACOL0638 phosphomevalonate kinase 0.41
SACOL2293 SACOL2293 NAD/NADP octopine/nopaline dehydrogenase family protein 0.27
metK SACOL1837 S-adenosylmethionine synthetase 0.21
pflA SACOL0205 pyruvate formate-lyase-activating enzyme 0.42
sucA SACOL1449 2-oxoglutarate dehydrogenase, E1 component 0.44
SACOL0607 SACOL0607 azoreductase 0.42
Fatty acid metabolism
accC SACOL1571 acetyl-CoA carboxylase 0.49
SACOL1662 SACOL1662 acetyl-CoA carboxylase, biotin carboxyl carrier protein, putative 0.36
SACOL1661 SACOL1661 acetyl-CoA carboxylase, biotin carboxylase, putative 0.40
SACOL0213 SACOL0213 acyl-CoA dehydrogenase family protein 0.41
glpF SACOL1319 glycerol uptake facilitator protein 0.27
SACOL0962 SACOL0962 glycerophosphoryl diester phosphodiesterase GlpQ, putative 0.45
geh SACOL2694 lipase 0.44
Purines, pyrimidines, nucleosides, and nucleotides
purD SACOL1083 phosphoribosylamine–glycine ligase 0.24
purK SACOL1074 phosphoribosylaminoimidazole carboxylase, ATPase subunit 0.20
purE SACOL1073 phosphoribosylaminoimidazole carboxylase, catalytic subunit 0.28
purM SACOL1080 phosphoribosylaminoimidazole synthetase 0.20
purH SACOL1082 phosphoribosylaminoimidazolecarboxamide formyltrans-
ferase/IMP cyclohydrolase
0.21
purQ SACOL1077 phosphoribosylformylglycinamidine synthase I 0.16
purL SACOL1078 phosphoribosylformylglycinamidine synthase II 0.22

CHAPTER 3. RESULTS 56
purS SACOL1076 phosphoribosylformylglycinamidine synthase, PurS protein 0.19
purN SACOL1081 phosphoribosylglycinamide formyltransferase 0.20
purB SACOL1969 adenylosuccinate lyase 0.42
purF SACOL1079 amidophosphoribosyltransferase 0.17
xpt SACOL0458 xanthine phosphoribosyltransferase 0.26
nrdE SACOL0792 ribonucleotide-diphosphate reductase alpha subunit 0.36
nrdF SACOL0793 ribonucleotide-diphosphate reductase beta subunit 0.26
guaA SACOL0461 bifunctional GMP synthase/glutamine amidotransferase protein 0.34
guaB SACOL0460 inosine-5’-monophosphate dehydrogenase 0.31
Protein metabolism
valS SACOL1710 valyl-tRNA synthetase 0.50
SACOL1803 SACOL1803 pseudouridine synthase, family 1 0.51
serS SACOL0009 seryl-tRNA synthetase 0.39
glyS SACOL1622 glycyl-tRNA synthetase 0.39
Regulatory functions
rsbV SACOL2056 anti-anti-sigma factor RsbV 0.42
SACOL2147 SACOL2147 transcriptional antiterminator, BglG family/DNA-binding protein 0.41
SACOL2290 SACOL2290 transcriptional regulator, AraC family 0.21
norR SACOL0746 transcriptional regulator, MarR family 0.45
Ribosomal protein
rplM SACOL2207 50S ribosomal protein L13 0.39
rplJ SACOL0585 ribosomal protein L10 0.45
rpsR SACOL0439 ribosomal protein S18 0.47
rpsI SACOL2206 ribosomal protein S9 0.36
Transport and binding proteins
SACOL0882 SACOL0882 ABC transporter, ATP-binding protein 0.09
SACOL0306 SACOL0306 ABC transporter, ATP-binding protein 0.22
SACOL1427 SACOL1427 ABC transporter, ATP-binding protein 0.30
SACOL0690 SACOL0690 ABC transporter, ATP-binding protein 0.42
SACOL0883 SACOL0883 ABC transporter, permease protein 0.08
SACOL0305 SACOL0305 ABC transporter, permease protein 0.27
SACOL0689 SACOL0689 ABC transporter, permease protein 0.40
SACOL0884 SACOL0884 ABC transporter, substrate-binding protein 0.06
SACOL0688 SACOL0688 ABC transporter, substrate-binding protein 0.37
SACOL0506 SACOL0506 ABC transporter, substrate-binding protein 0.39
SACOL1915 SACOL1915 amino acid ABC transporter, ATP-binding protein 0.27
SACOL1916 SACOL1916 amino acid ABC transporter, permease/substrate-binding protein 0.35
SACOL0630 SACOL0630 amino acid permease 0.06
SACOL1743 SACOL1743 amino acid permease 0.28
SACOL1728 SACOL1728 amino acid permease 0.37
SACOL1367 SACOL1367 amino acid permease 0.42
SACOL2169 SACOL2169 aerobactin biosynthesis protein, IucA/IucC family 0.34
oppF SACOL0994 oligopeptide ABC transporter, ATP-binding protein 0.20
oppD SACOL0993 oligopeptide ABC transporter, ATP-binding protein 0.22
SACOL0995 SACOL0995 oligopeptide ABC transporter, oligopeptide-binding protein 0.20
oppC SACOL0992 oligopeptide ABC transporter, permease protein 0.27
opuD2 SACOL2176 osmoprotectant transporter, BCCT family 0.06
oppB SACOL0991 oligopeptide ABC transporter, permease protein 0.33
SACOL2473 SACOL2473 peptide ABC transporter, ATP-binding protein 0.45
SACOL2472 SACOL2472 peptide ABC transporter, ATP-binding protein 0.47
SACOL2476 SACOL2476 peptide ABC transporter, peptide-binding protein 0.36
SACOL2474 SACOL2474 peptide ABC transporter, permease protein 0.37
SACOL2475 SACOL2475 peptide ABC transporter, permease protein, putative 0.38
SACOL2663 SACOL2663 PTS system, fructose-specific IIABC components 0.30
SACOL2552 SACOL2552 PTS system, IIABC components 0.08
SACOL0175 SACOL0175 PTS system, IIABC components 0.13
SACOL0516 SACOL0516 PTS system, IIBC components 0.23
SACOL2148 SACOL2148 PTS system, mannitol-specific IIA component 0.15
SACOL2319 SACOL2319 Na+/H+ antiporter family protein 0.46
nhaC SACOL2292 Na+/H+ antiporter NhaC 0.34
SACOL0682 SACOL0682 Na+/H+ antiporter, MnhD component, putative 0.43
SACOL0685 SACOL0685 Na+/H+ antiporter, MnhF component, putative 0.44
SACOL0686 SACOL0686 Na+/H+ antiporter, MnhG component, putative 0.46
nupC SACOL0566 nucleoside permease NupC 0.39
pbuX SACOL0459 xanthine permease 0.21
SACOL2242 SACOL2242 xanthine/uracil permease family protein 0.46
SACOL2483 SACOL2483 transporter, putative 0.31
SACOL1114 SACOL1114 Mn2+/Fe2+ transporter, NRAMP family 0.39

CHAPTER 3. RESULTS 57
SACOL0088 SACOL0088 Na/Pi cotransporter family protein 0.38
SACOL2314 SACOL2314 sodium/bile acid symporter family protein 0.42
SACOL1979 SACOL1979 sodium-dependent transporter 0.30
SACOL0788 SACOL0788 proton-dependent oligopeptide transporter family protein 0.42
SACOL0093 SACOL0093 L-lactate permease 0.36
SACOL2707 SACOL2707 cobalt transport family protein 0.45
Unknown function/Others
SACOL1847 SACOL1847 conserved domain protein, putative 0.24
SACOL1365 SACOL1365 hydrolase, haloacid dehalogenase-like family 0.33
isaA SACOL2584 immunodominant antigen A 0.28
SACOL0388 SACOL0388 prophage L54a, holin, SPP1 family 0.46
SACOL0770 SACOL0770 radical activating enzyme family protein 0.47
SACOL1606 SACOL1606 rhomboid family protein 0.50
SACOL1941 SACOL1941 ribonuclease BN, putative 0.29
SACOL1607 SACOL1607 5-formyltetrahydrofolate cyclo-ligase family protein 0.47
SACOL1187 SACOL1187 antibacterial protein (phenol soluble modulin) 0.32
SACOL0740 SACOL0740 decarboxylase family protein 0.36
SACOL0777 SACOL0777 urea amidolyase-related protein 0.38
spoVG SACOL0541 spoVG protein 0.38
SACOL1663 SACOL1663 urea amidolyase-related protein 0.38
SACOL0399 SACOL0399 oxidoreductase, putative 0.28
SACOL2321 SACOL2321 oxidoreductase, short chain dehydrogenase/reductase family 0.29
SACOL2053 SACOL2053 S1 RNA binding domain protein 0.46
SACOL0723 SACOL0723 LysM domain protein 0.42
Hypothetical protein
nrdI SACOL0791 hypothetical protein 0.41
SACOL2175 SACOL2175 hypothetical protein 0.09
SACOL2174 SACOL2174 hypothetical protein 0.10
SACOL0599 SACOL0599 hypothetical protein 0.13
SACOL0427 SACOL0427 hypothetical protein 0.18
SACOL2580 SACOL2580 hypothetical protein 0.19
SACOL2621 SACOL2621 hypothetical protein 0.19
SACOL2720 SACOL2720 hypothetical protein 0.20
SACOL1090 SACOL1090 hypothetical protein 0.20
SACOL2168 SACOL2168 hypothetical protein 0.22
SACOL2164 SACOL2164 hypothetical protein 0.23
SACOL0673 SACOL0673 hypothetical protein 0.24
SACOL1848 SACOL1848 hypothetical protein 0.26
SACOL0741 SACOL0741 hypothetical protein 0.27
SACOL1850 SACOL1850 hypothetical protein 0.28
SACOL0866 SACOL0866 hypothetical protein 0.28
SACOL2461 SACOL2461 hypothetical protein 0.28
SACOL2379 SACOL2379 hypothetical protein 0.30
SACOL1802 SACOL1802 hypothetical protein 0.30
SACOL2681 SACOL2681 hypothetical protein 0.30
SACOL1846 SACOL1846 hypothetical protein 0.31
SACOL2300 SACOL2300 hypothetical protein 0.31
SACOL0092 SACOL0092 hypothetical protein 0.33
SACOL1849 SACOL1849 hypothetical protein 0.33
SACOL1978 SACOL1978 hypothetical protein 0.34
SACOL0565 SACOL0565 hypothetical protein 0.34
SACOL0787 SACOL0787 hypothetical protein 0.34
SACOL1836 SACOL1836 hypothetical protein 0.34
SACOL0862 SACOL0862 hypothetical protein 0.35
SACOL0863 SACOL0863 hypothetical protein 0.36
SACOL2093 SACOL2093 hypothetical protein 0.36
SACOL0272 SACOL0272 hypothetical protein 0.36
SACOL2705 SACOL2705 hypothetical protein 0.38
SACOL2625 SACOL2625 hypothetical protein 0.41
SACOL0444 SACOL0444 hypothetical protein 0.41
SACOL0864 SACOL0864 hypothetical protein 0.42
SACOL0274 SACOL0274 hypothetical protein 0.42
SACOL1664 SACOL1664 hypothetical protein 0.43
SACOL0273 SACOL0273 hypothetical protein 0.43
SACOL1020 SACOL1020 hypothetical protein 0.43
SACOL1605 SACOL1605 hypothetical protein 0.43
SACOL2704 SACOL2704 hypothetical protein 0.43
SACOL1126 SACOL1126 hypothetical protein 0.43

CHAPTER 3. RESULTS 58
SACOL0372 SACOL0372 hypothetical protein 0.43
SACOL0275 SACOL0275 hypothetical protein 0.44
SACOL1042 SACOL1042 hypothetical protein 0.44
SACOL0849 SACOL0849 hypothetical protein 0.44
SACOL1017 SACOL1017 hypothetical protein 0.45
SACOL1603 SACOL1603 hypothetical protein 0.45
SACOL2479 SACOL2479 hypothetical protein 0.45
SACOL1789 SACOL1789 hypothetical protein 0.46
SACOL0381 SACOL0381 hypothetical protein 0.46
SACOL0865 SACOL0865 hypothetical protein 0.46
SACOL2706 SACOL2706 hypothetical protein 0.46
SACOL1361 SACOL1361 hypothetical protein 0.46
SACOL0628 SACOL0628 hypothetical protein 0.47
SACOL1660 SACOL1660 hypothetical protein 0.48
SACOL2052 SACOL2052 hypothetical protein 0.49
SACOL1899 SACOL1899 hypothetical protein 0.49
SACOL0380 SACOL0380 hypothetical protein 0.49
3.1.3 Protein synthesis profiles in response to heat stress
In the present approach, quantification of the synthesis of cytoplasmic proteins
before and at different times after shifting the cells to high temperature con-
dition was performed. To study changes in the synthesis rate of each protein,
two-dimensional polyacrylamide gel electrophoresis (2-D PAGE) of radioactively
labeled protein extracts was used (O’Farrell, 1975 , Eymann et al ., 1996).
The 2D gels were stained, dried, and exposed to PhosphorImager screens. The
resulting autoradiograms represent the synthesized proteins at the respective time
points. Proteins synthesized only upon heat treatment appeared in red, whereas
spots which appeared in green represent proteins the synthesis of which was
switched off under these conditions.
Interesting protein spots were identified by MALDI-TOF/MS and Mascot soft-
ware. Proteins whose synthesis was significantly induced in at least 3 experiments
were shown in table 3.3 and proteins whose synthesis was repressed by heat stress
were shown in table 3.4. As a result, the synthesis rate of at least 29 protein spots
was induced, whereas at the same time the synthesis rate of at least 116 protein
spots seemed to be repressed.
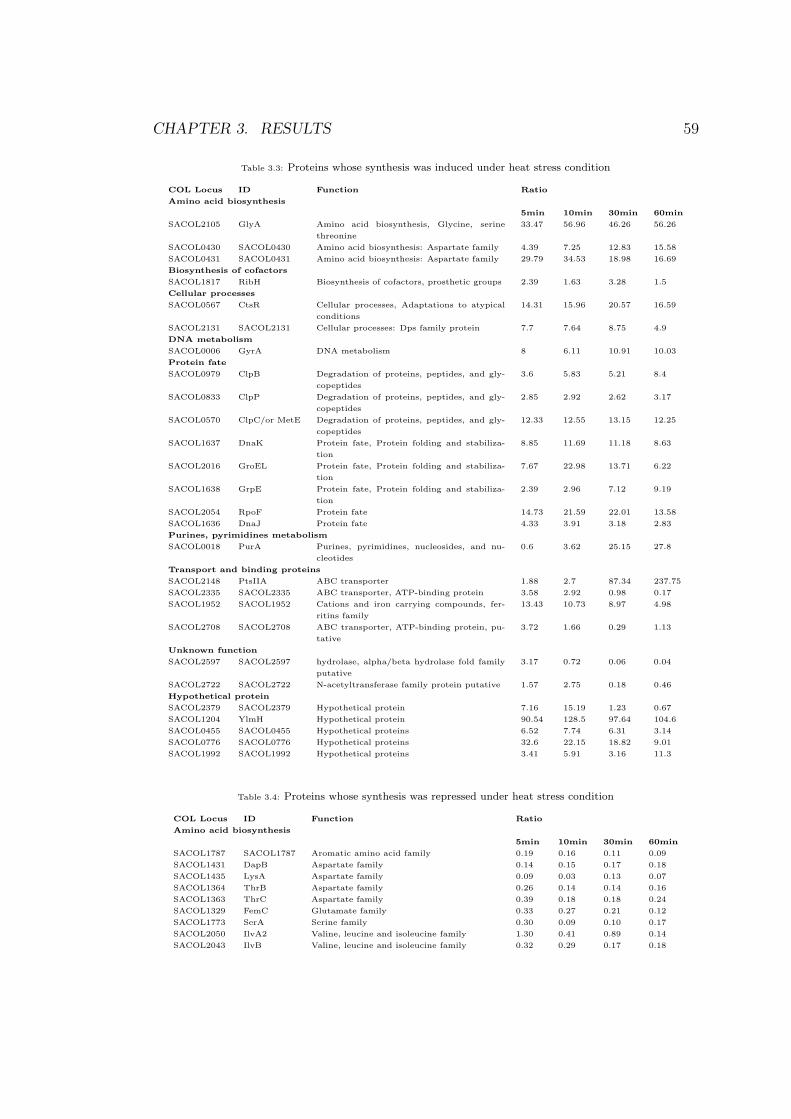
CHAPTER 3. RESULTS 59
Table 3.3: Proteins whose synthesis was induced under heat stress condition
COL Locus ID Function Ratio
Amino acid biosynthesis
5min 10min 30min 60min
SACOL2105 GlyA Amino acid biosynthesis, Glycine, serine
threonine
33.47 56.96 46.26 56.26
SACOL0430 SACOL0430 Amino acid biosynthesis: Aspartate family 4.39 7.25 12.83 15.58
SACOL0431 SACOL0431 Amino acid biosynthesis: Aspartate family 29.79 34.53 18.98 16.69
Biosynthesis of cofactors
SACOL1817 RibH Biosynthesis of cofactors, prosthetic groups 2.39 1.63 3.28 1.5
Cellular processes
SACOL0567 CtsR Cellular processes, Adaptations to atypical
conditions
14.31 15.96 20.57 16.59
SACOL2131 SACOL2131 Cellular processes: Dps family protein 7.7 7.64 8.75 4.9
DNA metabolism
SACOL0006 GyrA DNA metabolism 8 6.11 10.91 10.03
Protein fate
SACOL0979 ClpB Degradation of proteins, peptides, and gly-
copeptides
3.6 5.83 5.21 8.4
SACOL0833 ClpP Degradation of proteins, peptides, and gly-
copeptides
2.85 2.92 2.62 3.17
SACOL0570 ClpC/or MetE Degradation of proteins, peptides, and gly-
copeptides
12.33 12.55 13.15 12.25
SACOL1637 DnaK Protein fate, Protein folding and stabiliza-
tion
8.85 11.69 11.18 8.63
SACOL2016 GroEL Protein fate, Protein folding and stabiliza-
tion
7.67 22.98 13.71 6.22
SACOL1638 GrpE Protein fate, Protein folding and stabiliza-
tion
2.39 2.96 7.12 9.19
SACOL2054 RpoF Protein fate 14.73 21.59 22.01 13.58
SACOL1636 DnaJ Protein fate 4.33 3.91 3.18 2.83
Purines, pyrimidines metabolism
SACOL0018 PurA Purines, pyrimidines, nucleosides, and nu-
cleotides
0.6 3.62 25.15 27.8
Transport and binding proteins
SACOL2148 PtsIIA ABC transporter 1.88 2.7 87.34 237.75
SACOL2335 SACOL2335 ABC transporter, ATP-binding protein 3.58 2.92 0.98 0.17
SACOL1952 SACOL1952 Cations and iron carrying compounds, fer-
ritins family
13.43 10.73 8.97 4.98
SACOL2708 SACOL2708 ABC transporter, ATP-binding protein, pu-
tative
3.72 1.66 0.29 1.13
Unknown function
SACOL2597 SACOL2597 hydrolase, alpha/beta hydrolase fold family
putative
3.17 0.72 0.06 0.04
SACOL2722 SACOL2722 N-acetyltransferase family protein putative 1.57 2.75 0.18 0.46
Hypothetical protein
SACOL2379 SACOL2379 Hypothetical protein 7.16 15.19 1.23 0.67
SACOL1204 YlmH Hypothetical protein 90.54 128.5 97.64 104.6
SACOL0455 SACOL0455 Hypothetical proteins 6.52 7.74 6.31 3.14
SACOL0776 SACOL0776 Hypothetical proteins 32.6 22.15 18.82 9.01
SACOL1992 SACOL1992 Hypothetical proteins 3.41 5.91 3.16 11.3
Table 3.4: Proteins whose synthesis was repressed under heat stress condition
COL Locus ID Function Ratio
Amino acid biosynthesis
5min 10min 30min 60min
SACOL1787 SACOL1787 Aromatic amino acid family 0.19 0.16 0.11 0.09
SACOL1431 DapB Aspartate family 0.14 0.15 0.17 0.18
SACOL1435 LysA Aspartate family 0.09 0.03 0.13 0.07
SACOL1364 ThrB Aspartate family 0.26 0.14 0.14 0.16
SACOL1363 ThrC Aspartate family 0.39 0.18 0.18 0.24
SACOL1329 FemC Glutamate family 0.33 0.27 0.21 0.12
SACOL1773 SerA Serine family 0.30 0.09 0.10 0.17
SACOL2050 IlvA2 Valine, leucine and isoleucine family 1.30 0.41 0.89 0.14
SACOL2043 IlvB Valine, leucine and isoleucine family 0.32 0.29 0.17 0.18

CHAPTER 3. RESULTS 60
SACOL2045 IlvC Valine, leucine and isoleucine family 0.47 0.18 0.20 0.61
SACOL0600 IlvE Valine, leucine and isoleucine family 0.10 0.05 0.04 0.03
SACOL2047 LeuB Valine, leucine and isoleucine family 0.19 0.17 0.12 0.44
Biosynthesis of cofactors, prosthetic groups, and carriers
SACOL0918 SufB FeS assembly protein 0.35 0.17 0.15 0.19
SACOL0915 SufD FeS assembly protein 0.39 0.17 0.20 0.29
SACOL0914 SufC Biosynthesis of cofactors, prosthetic groups 0.28 0.26 0.19 0.75
SACOL0916 SACOL0916 Biosynthesis of cofactors, prosthetic groups 0.25 0.20 0.19 0.23
SACOL1735 CoaE Pantothenate and coenzyme A 0.07 0.04 0.05 0.09
SACOL2615 PanB Biosynthesis of cofactors, prosthetic groups, 0.14 0.20 0.21 0.18
SACOL0626 ThiD1 Biosynthesis of cofactors, prosthetic groups 0.29 0.18 0.18 0.13
Cell envelope
SACOL2092 MmurAA Biosynthesis and degradation of murein sac-
culus and peptidoglycan
0.13 0.12 0.16 0.11
SACOL1411 SACOL1411 Biosynthesis and degradation of murein sac-
culus and peptidoglycan
0.49 0.20 0.18 0.16
SACOL0142 Cap5G Biosynthesis and degradation of surface
polysaccharides
0.14 0.14 0.21 0.13
Cellular processes
SACOL1624 Era Adaptations to atypical conditions 0.40 0.21 0.14 0.27
SACOL2173 SACOL2173 Adaptations to atypical conditions 0.09 0.08 0.10 0.09
SACOL1199 FtsZ Cellular processes, Cell division 0.28 0.22 0.22 0.17
SACOL1368 KatA Cellular processes, Detoxification 0.33 0.26 0.12 0.23
SACOL0118 SodA1 Cellular processes, Detoxification 0.12 0.07 0.13 0.10
DNA metabolism
SACOL2737 GidA DNA replication, recombination, and repair 0.26 0.19 0.21 0.19
SACOL0534 SACOL0534 DNA replication, recombination, and repair 0.18 0.22 0.19 1.20
SACOL0438 Ssb2 DNA replication, recombination, and repair 0.25 0.18 0.25 0.20
Energy metabolism
SACOL1800 Dat Energy metabolism, Amino acids and amines 0.30 0.19 0.23 0.15
SACOL1430 DapA Energy metabolism, Amino acids and
amines. Aspartate family
0.23 0.27 0.23 0.35
SACOL0961 GluD Energy metabolism, Amino acids and
amines, Glutamate
0.20 0.10 0.10 0.07
SACOL1593 SACOL1593 Energy metabolism, Amino acids and
amines, Glycine, serine and threonine
0.25 0.25 0.30 0.25
SACOL1562 SACOL1562 Energy metabolism, Amino acids and
amines, Valine, leucine and isoleucine
0.06 0.10 0.09 0.09
SACOL2095 AtpD Energy metabolism, ATP-proton motive
force interconversion
0.71 0.40 0.20 0.24
SACOL2096 AtpG ATP-proton motive force interconversion 0.39 0.44 0.26 0.12
SACOL2098 AtpH ATP-proton motive force interconversion 0.18 0.13 0.08 0.06
SACOL0944 SACOL0944 Electron transport, respiration chain 0.10 0.08 0.05 0.04
SACOL2618 Ldh2 Energy metabolism, Fermentation, lactate 0.07 0.06 0.03 0.09
SACOL2535 SACOL2535 Energy metabolism, Fermentation, lactate 0.27 0.23 0.20 0.12
SACOL1321 GlpD Energy metabolism, Glycerol metabolism 0.04 0.33 0.41 0.39
SACOL1514 GpsA Energy metabolism, Glycerol metabolism 1.60 1.64 0.73 0.09
SACOL2117 FbaA Glycolysis/gluconeogenesis 0.15 0.19 0.18 0.36
SACOL2415 Gpm Glycolysis/gluconeogenesis 0.27 0.22 0.23 0.46
SACOL1746 PfkA Glycolysis/gluconeogenesis 0.11 0.07 0.08 0.11
SACOL1123 Pyc Glycolysis/gluconeogenesis 0.20 0.11 0.11 0.08
SACOL1745 Pyk Glycolysis/gluconeogenesis 0.07 0.08 0.21 0.06
SACOL1554 Gnd Pentose phosphate pathway 0.05 0.05 0.04 0.05
SACOL1549 Zwf Pentose phosphate pathway 0.12 0.15 0.14 0.29
SACOL0617 SACOL0617 Energy metabolism, Sugars 0.11 0.09 0.21 0.14
SACOL1385 AcnA Energy metabolism, TCA cycle 0.10 0.12 0.10 0.07
SACOL1308 SACOL1308 Energy metabolism, TCA cycle 0.26 0.14 0.16 0.11
SACOL1159 SdhA Energy metabolism, TCA cycle 0.16 0.27 0.21 0.08
SACOL0975 SACOL0975 Energy metabolism: Electron transport 0.59 0.36 0.23 0.32
Fatty acid and phospholipid metabolism
SACOL1245 FabG1 Fatty acid and phospholipid metabolism 0.14 0.12 0.12 0.22
SACOL0987 FabH Fatty acid and phospholipid metabolism 0.24 0.34 0.12 0.23
SACOL1016 FabI Fatty acid and phospholipid metabolism 2.27 0.40 0.38 0.35
SACOL1243 PlsX Fatty acid and phospholipid metabolism 0.28 0.18 0.14 0.20
Protein fate
SACOL1801 SACOL1801 Degradation of peptides 0.55 0.23 0.20 0.42
SACOL0957 SACOL0957 Protein folding and stabilization 0.10 0.05 0.10 0.07
SACOL1591 SACOL1591 Protein modification and repair 0.13 0.10 0.12 0.17

CHAPTER 3. RESULTS 61
Protein synthesis
SACOL0663 ArgS Protein synthesis, tRNA aminoacylation 0.11 0.14 0.20 0.13
SACOL1685 AspS Protein synthesis, tRNA aminoacylation 0.39 0.28 0.45 1.74
SACOL1206 IleS Protein synthesis, tRNA aminoacylation 0.17 0.14 0.29 0.27
SACOL0562 LysS Protein synthesis, tRNA aminoacylation 0.08 0.11 0.09 0.22
SACOL1149 PheT Protein synthesis, tRNA aminoacylation 0.14 0.16 0.15 0.12
SACOL1282 ProS Protein synthesis, tRNA aminoacylation 0.26 0.16 0.30 0.56
SACOL1778 TyrS Protein synthesis, tRNA aminoacylation 0.14 0.10 0.06 0.13
SACOL1676 TrmU Protein synthesis, tRNA and rRNA base
modification
0.28 0.23 0.11 0.13
Purines, pyrimidines, nucleosides, and nucleotides
SACOL0792 NrdE 2’-Deoxyribonucleotide metabolism 0.33 0.27 0.21 0.40
SACOL0793 NrdF 2’-Deoxyribonucleotide metabolism 0.11 0.10 0.17 0.20
SACOL1277 PyrH Nucleotide and nucleoside interconversions 0.11 0.19 0.29 0.31
SACOL0603 SACOL0603 Nucleotide and nucleoside interconversions 0.36 0.31 0.75 2.74
SACOL1221 Gmk Purine ribonucleotide biosynthesis 0.25 0.28 0.22 0.42
SACOL0461 GuaA Purine ribonucleotide biosynthesis 0.18 0.23 0.49 0.72
SACOL0460 GuaB Purine ribonucleotide biosynthesis 0.16 0.15 0.48 0.36
SACOL0544 PrsA Purine ribonucleotide biosynthesis 0.27 0.30 0.24 0.16
SACOL1969 PurB Purine ribonucleotide biosynthesis 0.15 0.22 0.18 0.15
SACOL1075 PurC Purine ribonucleotide biosynthesis 0.14 0.10 0.05 0.13
SACOL1074 PurK Purine ribonucleotide biosynthesis 0.42 0.24 0.12 0.13
SACOL1077 PurQ Purine ribonucleotide biosynthesis 0.24 0.20 0.28 0.36
SACOL1215 CarB Pyrimidine ribonucleotide biosynthesis 0.28 0.16 0.14 0.13
SACOL2119 PyrG Pyrimidine ribonucleotide biosynthesis 0.20 0.18 0.14 0.23
SACOL2104 Upp Salvage of nucleosides and nucleotides 0.07 0.11 0.05 0.07
Other
SACOL1898 Cbf1 Mobile and extrachromosomal element func-
tions, Plasmid functions
0.45 0.30 0.21 0.14
SACOL2055 RsbW Regulatory functions, Protein interactions 0.58 0.27 0.27 0.26
SACOL0731 SACOL0731 Regulatory functions, Protein interactions 0.33 0.31 0.16 0.10
SACOL0825 HprK Signal transduction, PTS 0.43 0.12 0.15 0.13
0.47 0.08 0.05 0.05
SACOL1427 SACOL1427 ABC transporter 0.11 0.13 0.11 0.10
SACOL2519 SACOL2519 Hypothetical proteins: Conserved 0.14 0.10 0.11 0.06
SACOL2535 SACOL2535 Central intermediary metabolism: Other 0.20 0.15 0.17 0.20
SACOL0976 SACOL0976 Hydrolase, haloacid dehalogenase-like family 0.03 0.04 0.09 0.05
SACOL1560 SACOL1560 Amino acids and amines 0.32 0.29 0.27 0.19
SACOL1677 SACOL1677 Aminotransferase, class V, putative 0.23 0.19 0.14 0.08
SACOL2000 SACOL2000 aminotransferase, putative 0.19 0.10 0.34 0.17
Hypothetical protein
SACOL0467 SACOL0467 hypothetical proteins 0.23 0.14 0.13 0.25
SACOL0456 SACOL0456 hypothetical protein 0.14 0.22 0.29 0.43
SACOL0597 SACOL0597 hypothetical protein 0.30 0.30 0.21 0.21
SACOL0613 SACOL0613 hypothetical protein 0.08 0.05 0.06 0.05
SACOL0789 SACOL0789 hypothetical protein 0.12 0.11 0.11 0.09
SACOL1365 SACOL1365 hypothetical protein 0.26 0.13 0.12 0.35
SACOL1772 SACOL1772 hypothetical protein 0.12 0.07 0.23 0.10
SACOL1792 SACOL1792 hypothetical protein 0.06 0.04 0.05 0.03
SACOL2133 SACOL2133 hypothetical protein 0.12 0.08 0.05 0.14
SACOL2519 SACOL2519 hypothetical protein 0.17 0.21 0.21 0.44
SACOL0918 SufB hypothetical protein 0.21 0.18 0.27 0.23
SACOL0915 SufD hypothetical protein 0.37 0.41 0.13 0.09
SACOL1936 SACOL1936 hypothetical protein 0.24 0.18 0.23 0.17
SACOL2518 SACOL2518 hypothetical protein 0.36 0.35 0.25 0.52
SACOL1543 SACOL1543 hypothetical protein, aldo/keto reductase 0.11 0.41 0.27 0.18
SACOL0241 SACOL0241 hypothetical protein, Fermentation 0.05 0.02 0.04 0.06
SACOL2114 SACOL2114 hypothetical protein, Fermentation 0.44 0.48 0.26 0.37
SACOL0596 SACOL0596 hypothetical protein, Glycine. serine threo-
nine metabolism
0.24 0.21 0.26 0.18
SACOL0602 SACOL0602 hypothetical protein, haloacid dehalogenase-
like hydrolase
0.10 0.07 0.07 0.06
SACOL0607 SACOL0607 NADPH-dependent FMN reductase 0.18 0.24 0.20 0.17
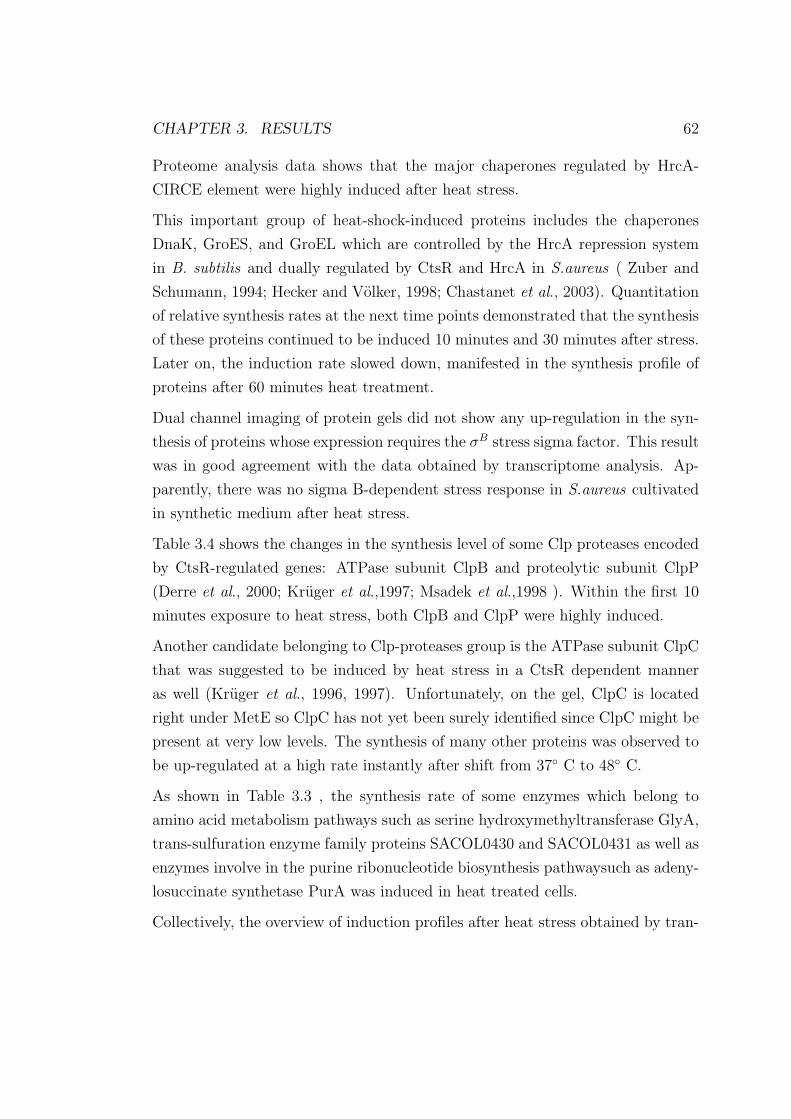
CHAPTER 3. RESULTS 62
Proteome analysis data shows that the major chaperones regulated by HrcA-
CIRCE element were highly induced after heat stress.
This important group of heat-shock-induced proteins includes the chaperones
DnaK, GroES, and GroEL which are controlled by the HrcA repression system
in B. subtilis and dually regulated by CtsR and HrcA in S.aureus ( Zuber and
Schumann, 1994; Hecker and Volker, 1998; Chastanet et al., 2003). Quantitation
of relative synthesis rates at the next time points demonstrated that the synthesis
of these proteins continued to be induced 10 minutes and 30 minutes after stress.
Later on, the induction rate slowed down, manifested in the synthesis profile of
proteins after 60 minutes heat treatment.
Dual channel imaging of protein gels did not show any up-regulation in the syn-
thesis of proteins whose expression requires the σB stress sigma factor. This result
was in good agreement with the data obtained by transcriptome analysis. Ap-
parently, there was no sigma B-dependent stress response in S.aureus cultivated
in synthetic medium after heat stress.
Table 3.4 shows the changes in the synthesis level of some Clp proteases encoded
by CtsR-regulated genes: ATPase subunit ClpB and proteolytic subunit ClpP
(Derre et al., 2000; Kruger et al.,1997; Msadek et al.,1998 ). Within the first 10
minutes exposure to heat stress, both ClpB and ClpP were highly induced.
Another candidate belonging to Clp-proteases group is the ATPase subunit ClpC
that was suggested to be induced by heat stress in a CtsR dependent manner
as well (Kruger et al., 1996, 1997). Unfortunately, on the gel, ClpC is located
right under MetE so ClpC has not yet been surely identified since ClpC might be
present at very low levels. The synthesis of many other proteins was observed to
be up-regulated at a high rate instantly after shift from 37◦ C to 48◦ C.
As shown in Table 3.3 , the synthesis rate of some enzymes which belong to
amino acid metabolism pathways such as serine hydroxymethyltransferase GlyA,
trans-sulfuration enzyme family proteins SACOL0430 and SACOL0431 as well as
enzymes involve in the purine ribonucleotide biosynthesis pathwaysuch as adeny-
losuccinate synthetase PurA was induced in heat treated cells.
Collectively, the overview of induction profiles after heat stress obtained by tran-

CHAPTER 3. RESULTS 63
scriptomics and proteomics reveals that members of protein fate processes are the
largest group which can be detected by both DNA arrays and 2D gel approach
suggesting protein damage is a priority under heat stress( Fig 3.4, 3.5 and 3.6).
3.1.4 Detailed transcriptional analysis of heat shock genes
The influence of high temperatures on the transcription of selected genes was
subsequently confirmed by Northern blotting experiments to validate the data
obtained from proteome and DNA microarray analyses.
We selected codY, which acts as a global regulator involved in the adaptation of
bacterium to starvation. The expression of CodY was suggested to be induced
by heat stress ( Frees et al., 2005).
According to the gene region view (Fig 3.7), we predicted that the genes clpY,
clpQ and xerC might form an operon together with codY, therefore Northern blot
analysis using probes corresponding to codY, clpY, clpQ and xerC, respectively,
were performed as well. From the proximity of the xerC, clpQ, clpY and codY
genes, we expected that they form an operon with a size of approximately 3,7
kb, and this notion was confirmed by the size of the transcript detected with the
codY as well as clpY, clpQ and xer C probes. This transcript was present in
cells grown at normal condition and showed a slightly increasing amount in heat
shocked cells (Fig 3.7).
Besides, we also detected two other transcripts of 2.5kb and 1.4kb respectively.
But these transcripts might be the products of RNA degradation.

CHAPTER 3. RESULTS 64
Figure 3.4: Details of dual channel images of selected marker proteins induced inresponse to heat stress. Protein synthesis pattern of unstressed S. aureus cells wascompared with protein synthesis patterns at different time points after exposureto heat shock . The bar graphs on the right displayed relative synthesis rates ofthe individual proteins at the different time points

CHAPTER 3. RESULTS 65
Figure 3.5: The dual-channel image of the protein synthesis pattern of S.aureusCOL before (green image) and 10 min after the exposure to 48◦ C (red image).Cytoplasmic proteins were labeled with L-35[ S]methionine and separated by 2D-PAGE as described in Section 2. Image analysis of the autoradiograms wasperformed using the Decodon Delta 2D software. Proteins that were synthesizedat increased/decreased levels in response to heat stress were identified and listedin Table 3.3 and Table 3.4.

CHAPTER 3. RESULTS 66
Figure 3.6: The dual-channel image of the protein synthesis pattern of S.aureusCOL before (green image) and 60 min after the exposure to 48◦ C (red image ).

CHAPTER 3. RESULTS 67
Figure 3.7: Transcript analyses of codY, clpQ, clpY and xerC in response to heatshock. Relevant probes which had been used in each Northern blot experimentswere indicated by star. 10 µg RNA each were applied isolated from S.aureusCOL before and at different times (3, 6, 9, 12 min) after the exposure to heatstress.

CHAPTER 3. RESULTS 68
3.2 Puromycin stress response
3.2.1 Growth behavior of S.aureus in response to puromycin
Firstly, the minimal inhibitory concentration (MIC) was determined for the an-
timicrobial substance puromycin. The MIC of the antimicrobial substance were
defined as the lowest concentration resulting visibly inhibited bacterial growth.In
this case the MIC of puromycin corresponded to 2 µg/ml.
Figure 3.8: Growth of S.aureus COL in the presence of different concentrationsof puromycin. S. aureus was grown in synthetic medium to an OD500 of 0.5 andtreated with different concentrations of puromycin.
To investigate global changes in gene expression of S.aureus in response to puromy-
cin, cells were treated with sublethal but growth-inhibitory concentrations. For
anaylsing the growth behaviour of S. aureus COL in response to puromycin, dif-
ferent concentrations of the antibiotic (1xMIC; 2xMIC; 4xMIC; 8xMIC; 16xMIC)
were added to exponentially growing cultures (OD500 of 0.5). As reflected in the
growth curves, 16 µg/ml of puromycin (8xMIC) are required to inhibit the growth
rate, results in a reduction of approximately 50% (Fig.3.9).
For further experiments, cells were treated with 8xMIC ( 16 µg/ml )puromycin.
After exposure to puromycin, samples were harvest at 3, 6, 9, 12 minutes for RNA
preparation. For proteome analysis experiments, samples were labelled with L-[
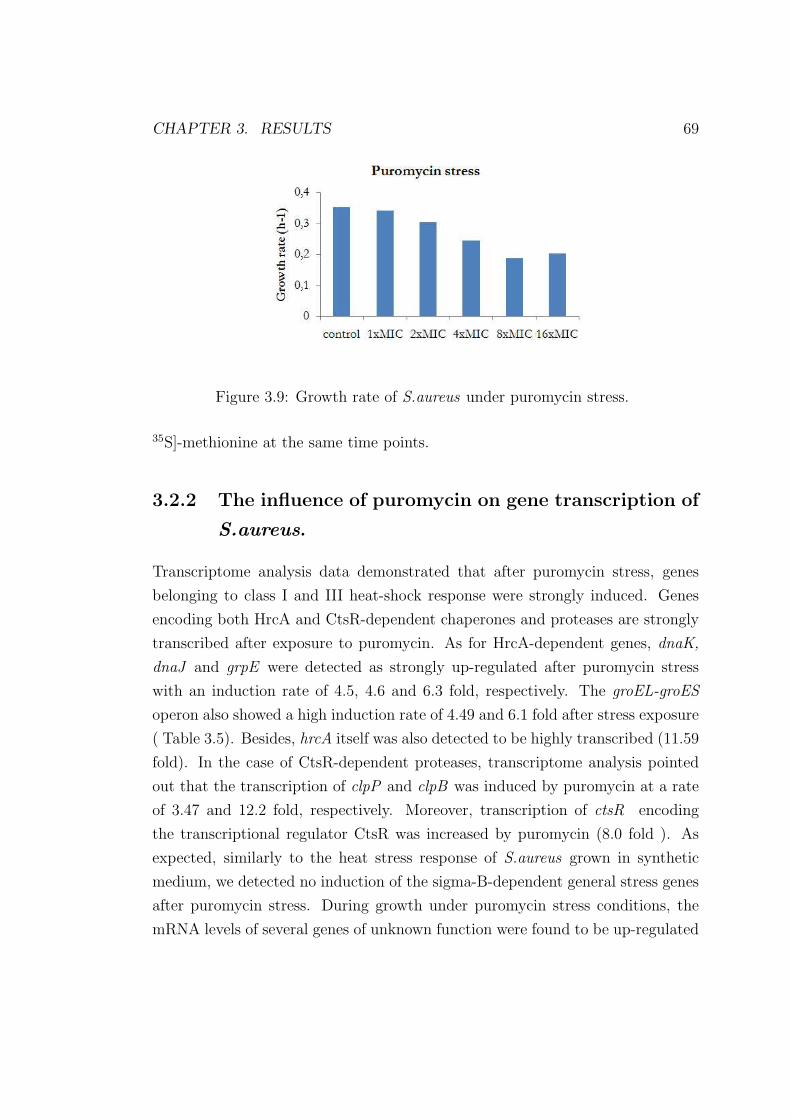
CHAPTER 3. RESULTS 69
Figure 3.9: Growth rate of S.aureus under puromycin stress.
35S]-methionine at the same time points.
3.2.2 The influence of puromycin on gene transcription of
S.aureus.
Transcriptome analysis data demonstrated that after puromycin stress, genes
belonging to class I and III heat-shock response were strongly induced. Genes
encoding both HrcA and CtsR-dependent chaperones and proteases are strongly
transcribed after exposure to puromycin. As for HrcA-dependent genes, dnaK,
dnaJ and grpE were detected as strongly up-regulated after puromycin stress
with an induction rate of 4.5, 4.6 and 6.3 fold, respectively. The groEL-groES
operon also showed a high induction rate of 4.49 and 6.1 fold after stress exposure
( Table 3.5). Besides, hrcA itself was also detected to be highly transcribed (11.59
fold). In the case of CtsR-dependent proteases, transcriptome analysis pointed
out that the transcription of clpP and clpB was induced by puromycin at a rate
of 3.47 and 12.2 fold, respectively. Moreover, transcription of ctsR encoding
the transcriptional regulator CtsR was increased by puromycin (8.0 fold ). As
expected, similarly to the heat stress response of S.aureus grown in synthetic
medium, we detected no induction of the sigma-B-dependent general stress genes
after puromycin stress. During growth under puromycin stress conditions, the
mRNA levels of several genes of unknown function were found to be up-regulated

CHAPTER 3. RESULTS 70
compared to cells grown under control conditions. For example, prmA encoding
the ribosomal protein L11 which was also induced by heat stress or SACOL0569
encoded guanido phosphotransferase,and SACOL0981 encoded isopropylmalate
synthase-related protein.
Table 3.5: Genes whose transcription was induced after puromycin stress
COL Locus ID Function Average Ratio
Protein fate
SACOL1636 dnaJ dnaJ protein 4.95
SACOL1637 dnaK dnaK protein 4.54
SACOL1638 grpE heat shock protein GrpE 6.3
SACOL1639 hrcA heat-inducible transcription repressor HrcA 11.59
SACOL2016 groEL chaperonin, 60 kDa 4.49
SACOL2017 groES chaperonin, 10 kDa 6.01
SACOL0833 clpP ATP-dependent Clp protease, proteolytic 3.47
SACOL0979 clpB ATP-dependent Clp protease, ATP-binding 12.22
SACOL0567 ctsR transcriptional regulator CtsR 8
Protein synthesis
SACOL1635 prmA ribosomal protein L11 methyltransferase 5.18
Others
SACOL0569 SACOL0569 putative ATP:guanido phosphotransferase 7.69
SACOL0811 SACOL0811 hypothetical protein 4.04
SACOL0981 SACOL0981 isopropylmalate synthase-related protein 2.76
SACOL1634 SACOL1634 hypothetical protein 2.16
SACOL0568 SACOL0568 hypothetical protein 2.78
Table 3.6: Genes whose transcription was repressed after puromycin stress
COL Locus ID Function Average Ratio
Amino acid metabolism
SACOL0505 gltD Glutamate synthase, subunit 0.48
Protein fate
SACOL0165 SACOL0165 4-phosphopantetheinyl transferase 0.46
3.2.3 Protein expression profile of S.aureus in response
to puromycin
Proteome analyses were performed after exposure to puromycin. Proteins syn-
thesis with induction ratios of at least two fold in two biological replicates were
considered as significantly up-regulated.
Accordingly, in response to puromycin stress, approximately the synthesis of 20
proteins was up-regulated and the synthesis of 35 proteins was down-regulated
(Table 3.7 and 3.8).
The strongest induction of these 20 proteins was found after 10 min of puromycin
stress. The most strongly induced proteins belong to the class I heat-specific
chaperones which are regulated by HrcA and CtsR, and and class III proteins

CHAPTER 3. RESULTS 71
which are only regulated by CtsR (Chastanet et al., 2003).
Thereby, the protein synthesis rate of DnaK and GrpE of class I heat shock
proteins was highly increased during 60 minutes after exposure to stress at a rate
varying from three to nine fold.
Similarly, GroEL and GroES were also strongly induced with the highest induc-
tion rate at 30 and 60 minutes after stress. In the case of Clp proteases, on 2D
protein gels, ClpP and ClpB were detected to be induced strongly indicating that
cells suffer from damaged proteins in to the presence of puromycin (Fig 3.10, 3.11
and 3.12).
The proteome data revealed no significant induction of the sigmaB-dependent
general stress response after puromycin treatment. This result has consolidated
the data obtained by proteome analysis of S.aureus grown in synthetic medium
under heat stress condition.
Table 3.7: Proteins whose synthesis was induced after puromycin stress
COL Locus ID Function Ratio
Amino acid biosynthesis
5min 10min 30min 60min
SACOL1363 ThrC threonine synthase 1.90 2.36 2.10 1.78
SACOL1506 AroC chorismate synthase 1.10 2.35 1.91 2.81
DNA metabolism
SACOL0016 DnaB replicative DNA helicase 1.50 1.66 2.13 2.89
Energy metabolism
SACOL0842 Eno enolase 1.68 2.20 1.81 2.49
SACOL2151 GlmM phosphoglucosamine mutase 0.99 1.78 2.71 3.57
SACOL1104 PdhC pyruvate dehydrogenase complex E2 compo-
nent, dihydrolipoamide acetyltransferase
1.32 1.91 1.90 4.23
SACOL1277 PyrH uridylate kinase 1.56 1.55 2.78 3.72
Others
SACOL0932 SACOL0932 D-isomer specific 2-hydroxyacid dehydroge-
nase family protein
0.93 1.46 1.89 2.16
SACOL1297 SACOL1297 conserved hypothetical protein 0.65 0.80 0.66 0.45
SACOL1902 SACOL1902 conserved hypothetical protein 0.63 1.82 2.37 2.32
SACOL2486 SACOL2486 conserved hypothetical protein 0.63 0.66 0.49 0.34
SACOL0594 Tuf translation elongation factor Tu 1.46 1.71 1.98 2.26
Protein fate
SACOL0833 ClpP ATP-dependent Clp protease, proteolytic
subunit
2.01 2.60 4.61 7.97
SACOL1637 DnaK dnaK protein 2.36 4.88 8.72 8.68
SACOL2016 GroEL chaperonin, 60 kDa 2.19 3.86 6.80 6.55
SACOL2017 GroES chaperonin, 10 kDa 3.45 4.41 5.02 6.19
SACOL1638 GrpE heat shock protein GrpE 3.81 5.28 6.65 6.98
SACOL0979 ClpB ATP-dependent Clp protease 1.72 3.53 3.57 3.09

CHAPTER 3. RESULTS 72
Table 3.8: Proteins whose synthesis was repressed after puromycin stress
COL Locus ID Function Ratio
Amino acid biosynthesis
5min 10min 30min 60min
SACOL2105 GlyA serine hydroxymethyltransferase 0.69 1.02 0.64 0.50
SACOL2048 LeuC 3-isopropylmalate dehydratase, large sub-
unit
0.56 0.54 0.47 0.53
SACOL0428 MetE 5-methyltetrahydropteroyltriglutamate-
homocysteine methyltransferase
0.55 0.29 0.34 0.41
SACOL0430 SACOL0430 trans-sulfuration enzyme family protein 0.61 0.93 0.48 0.42
GcvP GcvP glycine dehydrogenase 0.57 0.87 0.54 0.50
Biosynthesis of cofactors, prosthetic groups, and carriers
SACOL2266 MoeA molybdopterin biosynthesis MoeA protein 1.28 1.00 1.14 0.41
SACOL0918 SufB FeS assembly protein SufB 0.69 0.57 0.48 0.42
SACOL0915 SufD FeS assembly protein SufD 0.75 0.74 0.53 0.44
Energy metabolism
SACOL2273 Fdh formate dehydrogenase accessory protein 0.24 0.10 0.19 0.08
SACOL1838 PckA phosphoenolpyruvate carboxykinase (ATP) 0.64 0.52 0.46 0.46
SACOL0841 Pgm phosphoglycerate mutase, 2,3-
bisphosphoglycerate-independent
0.71 0.55 0.32 0.18
SACOL1123 PyC pyruvate carboxylase 0.39 0.25 0.27 0.11
SACOL1745 Pyk pyruvate kinase 0.53 0.50 0.37 0.28
SACOL1449 SucA 2-oxoglutarate dehydrogenase, E1 compo-
nent
0.22 0.16 0.21 0.12
SACOL1263 SucD succinyl-CoA synthase, alpha subunit 0.88 0.83 0.66 0.49
Protein synthesis
SACOL1288 InfB translation initiation factor IF-2 0.40 0.44 0.60 0.47
SACOL0533 MetS methionyl-tRNA synthetase 0.49 0.39 0.35 0.26
SACOL0816 SecA preprotein translocase, SecA subunit 0.39 0.47 0.57 0.36
SACOL0009 SerS seryl-tRNA synthetase 0.68 0.40 0.69 0.41
SACOL1729 ThrS threonyl-tRNA synthetase 0.55 0.75 0.54 0.34
Purine, pyrimydine metabolism
SSACOL1214 CarA carbamoyl-phosphate synthase, small sub-
unit
0.77 0.68 0.50 0.58
SACOL0461 GuaA GMP synthase 0.67 0.70 0.55 0.47
SA0686 NrdE ribonuceloside diphosphate reductase major
subunit
0.50 0.24 0.28 0.21
SACOL1083 PurD phosphoribosylamine-glycine ligase 0.57 0.56 0.47 0.45
SACOL1082 PurH phosphoribosylaminoimidazolecarboxamide
formyltransferase/IMP cyclohydrolase
0.51 0.68 0.51 0.40
Others
SACOL1571 AccC Acetyl-CoA carboxylase, biotin carboxylase 0.59 0.84 0.44 0.34
SACOL1411 FemB femB protein 0.72 0.44 0.51 0.47
SACOL1198 FtsA cell division protein FtsA 0.69 0.29 0.78 1.41
SACOL2737 GidA glucose inhibited division protein A 0.51 0.52 0.33 0.34
SACOL1206 IleS isoleucyl-tRNA synthetase 0.47 0.12 0.38 0.12
SACOL0761 NagA N-acetylglucosamine-6-phosphate deacety-
lase
0.85 0.49 0.59 0.65
SACOL1737 PolA DNA polymerase I 0.40 0.15 0.77 0.23
SACOL0588 RpoB DNA-directed RNA polymerase. beta sub-
unit
0.30 0.08 0.18 0.13
SACOL1361 SACOL1361 hypothetical protein 0.20 0.11 0.24 0.08
SACOL0438 Ssb2 single-stranded DNA-binding protein 0.68 0.74 0.49 0.58
SACOL0597 SACOL0597 conserved hypothetical protein 0.52 0.33 0.25 0.45
SACOL0934 SACOL0934 conserved hypothetical protein 0.93 0.46 0.39 0.35
SACOL1011 SACOL1011 conserved hypothetical protein 0.62 0.90 0.47 0.65

CHAPTER 3. RESULTS 73
Figure 3.10: Details of dual channel images of selected marker proteins induced inresponse to puromycin stress. Protein synthesis pattern of unstressed S. aureuscells was compared with protein synthesis patterns at different time points afteradding puromycin . The bar graphs on the right displayed relative synthesis ratesof the individual proteins at the different time points .
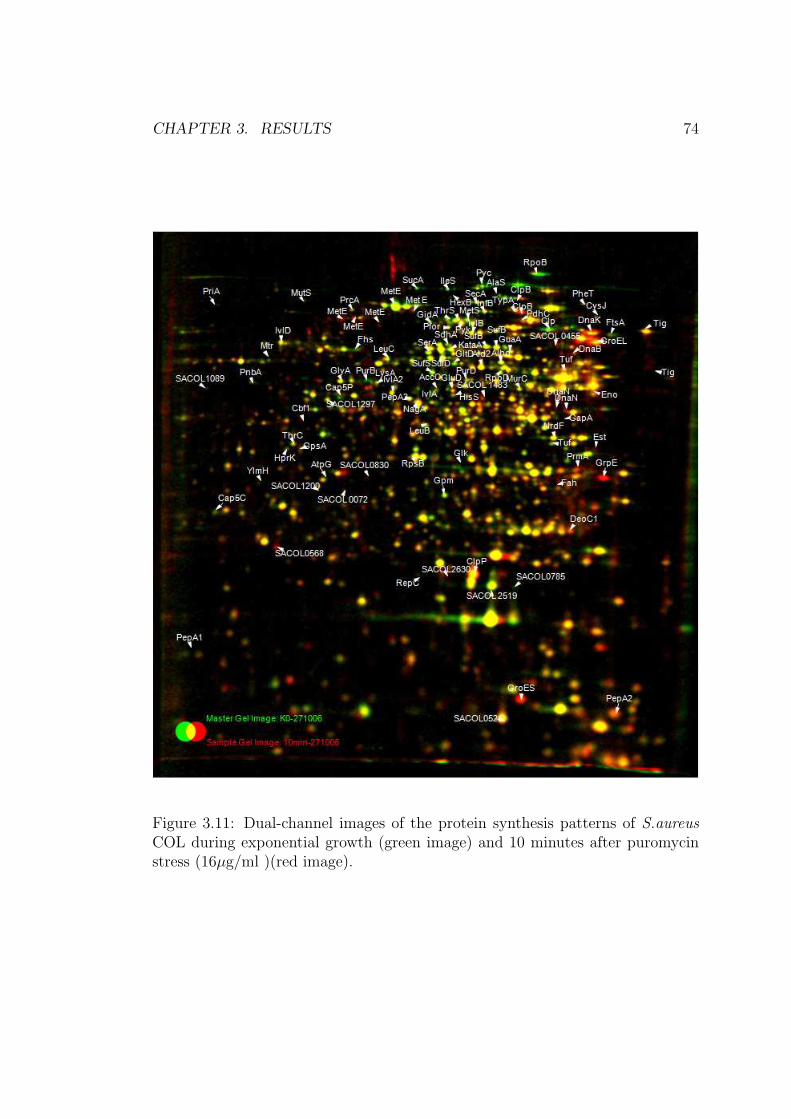
CHAPTER 3. RESULTS 74
Figure 3.11: Dual-channel images of the protein synthesis patterns of S.aureusCOL during exponential growth (green image) and 10 minutes after puromycinstress (16µg/ml )(red image).

CHAPTER 3. RESULTS 75
Figure 3.12: Dual-channel images of the protein synthesis patterns of S.aureusCOL during exponential growth (green image) and 60 minutes after puromycinstress (16µg/ml )(red image).

CHAPTER 3. RESULTS 76
It could be speculated that both heat and puromycin stress cause an accumulation
of denatured proteins within the cytoplasm which is indicated by an increased syn-
thesis of protease and chaperones such as the HrcA-and CtsR-regulated proteins
such as DnaK, GrpE, GroEL, GroES, ClpP, ClpB by both heat and puromycin
stress.
The results of the transcriptome and proteome analyses after puromycin stress
revealed a large overlap with the results obtained by heat stress. There are 11 out
of 20 puromycin induced proteins which are indicative for a heat-shock signature.
The repression profile of proteins after puromycin stress also has a similarity with
heat stress. After puromycin stress, 14 proteins whose expression was decreased
was also detected to be repressed by heat stress.
Figure 3.13: Overview of the number of commonly shared (generally in-duced/repressed) and unique (specifically induced/repressed) proteins in the pro-teome of S.aureus after heat and puromycin stress.
The proteome analysis also showed the induction of proteins involved in glycol-
ysis such as pyruvate dehydrogenase PdhC and enolase Eno, with the highest
induction after 60 minutes exposed to puromycine stress. Besides, some en-
zymes belonging to the amino acid synthesis pathways such as threonine synthase
ThrC and chorismate synthase AroC were also induced by puromycin stress. In
addition, some proteins required for the protein synthesis, for example glycyl-
tRNA synthetase GlyS or translation elongation factor Tuf were up-regulated af-
ter adding puromycin to the medium. The proteome experiments also suggested
the induction of many genes whose functions that might contribute to puromycin
resistance are still unknown. These are the D-isomer specific 2-hydroxyacid de-
hydrogenase family protein SACOL0932 or the uridylate kinase PyrH of the nu-
CHAPTER 3. RESULTS 77
cleotide and nucleoside interconversions pathway.
As shown in Table 3.8, the protein synthesis of four enzymes taking part in glycol-
ysis was down regulated- PfkA, Pgm, Pyc as well as Pyk and two enzymes of the
TCA cycle SucA and Suc were also repressed after puromycin stress. Data shown
in table 3.8 also demonstrated that many enzymes involve in purine, pyrimidine
synthesis were repressed by puromycin. The synthesis of GuaA, NrdE, PurD and
PurH was switched off when puromycin was added to the medium. The decrease
of some other metabolic proteins might be linked to the slower growth rate in
response to puromycin stress.
In addition, other proteins involve in growth-phase-related functions such as fatty
acid and phospholipid metabolism; amino acid metabolism; biosynthesis of co-
factors, prosthetic groups, and carriers, cell envelope as well as cell division were
among the repressed proteins.
3.2.4 Detailed transcriptional analyses of some genes un-
der puromycin stress condition
The regulatory effect of puromycin on the transcription of selected genes was
subsequently confirmed by Northern blotting experiments to complement the
data obtained by DNA microarrays analyses.
We selected the transcriptional regulator encoding gene codY which was already
analyzed after heat stress, in order to examine what happened in the case of
puromycin stress. Northern blot analyses using clpQ, clpX, and xerC probes
were performed as well since these genes were demonstrated to be transcribed
together as a four-cistronic operon ( Frees et al., 2005 ). We were interested if
there is also an induction of those genes under puromycin stress condition.
But unfortunately after stress exposure, no detectable induction could be ob-
served. The transcripts were present in mRNA extracted from normal grown
cells as the same level as in mRNA extracted from cells grown under stress con-
dition.

CHAPTER 3. RESULTS 78
Figure 3.14: Northern blot analyses of codY, clpY, clpQ, xerC under puromycinstress conditions. For RNA preparation, cells were grown in synthetic medium toan OD500 of 0.5 and were treated with puromycin. RNA was isolated before (Co)and 3, 6, 9, 12 min after adding puromycin. To ensure that the mRNA levels of therespective genes remained unchanged during the course of the experiment in anaerobically grown culture, RNA was also prepared from a non treated culture 12min after the stress (C1). Relevant probes which had been used in each Northernblot experiment were indicated by star. Relevant transcripts were indicated byarrows .

CHAPTER 3. RESULTS 79
3.3 Salt stress response
3.3.1 Bacterial growth
Firstly, the ability of S.aureus to grow in the presence of salt was tested. S.aureus
was grown in synthetic medium to an OD500 of 0.5 and then different amount of
NaCl were added to the medium to determine the appropriate concentration of
salt for stress experiment. Growth experiments were carried out with synthetic
medium and synthetic medium supplemented with 2%, 4%, 6%, and 8% w/v
NaCl.
Figure 3.15: Growth curves of S.aureus in the presence of NaCl S. aureus COLwas grown in synthetic medium to an OD500of 0.5 and exposed to different con-centrations of NaCl (2, 4, 6, and 8%(w/v) NaCl).
Figure 3.16: Growth rate of S. aureus COL during NaCl stress.

CHAPTER 3. RESULTS 80
The growth curves and growth rate (Fig.3.15 and 3.16 ) indicated that, growth
rate of cells after adding 2%, 4% and 6% NaCl to synthetic medium was slightly
reduced during stress. In this growth experiments, we determined that a reduc-
tion in the growth rate of approximately 50% required the addition of 6% w/v
NaCl to the growth medium. To obtain a less severe stress to the cell but strong
enough to enhance the protein synthesis, 6% w/v salts were considered as the
appropriate concentrations in the present study.
3.3.2 Protein synthesis profile
Our study focused on the cytosolic proteins in a pI range of 4 to 7. Protein
expression was determined using protein extract of cells grown in the absence
of salt under standard conditions and was compared with the synthesis pattern
of cells grown in the presence of 6 % NaCl. In this study, we identified only
protein spots which were considered to be up- or down-regulated by a factor of
greater than two in the presence of salts. Figure 3.17, 3.18 and 3.19 shows 2D
gels of protein extracts of S.aureus grown either in the absence or the presence of
6% salt. Comparison of synthesis patterns in the presence and absence of NaCl
revealed that 101 spots displayed different synthesis rates. Among these proteins,
35 proteins were identified to be significantly up-regulated after salts stress and
76 of them to be significantly down regulated at under salt stress conditions and
could be identified on 2D gel.
3.3.2.1 The induction of proteins of some metabolic pathways after
addition of NaCl
Figure 3.17 showed the changes in synthesis pattern of enzymes involved in the
purine/pyrimidine metabolism. The regulatory protein PyrR was down regu-
lated during the first 10 minutes after addition of NaCl. Afterwards the protein
synthesis was slightly increased.
Whereas dihydroorotase PyrC were induced immediately after salt stress at and
2.9 fold. The protein synthesis rate was then decreased after 30 minutes stress.
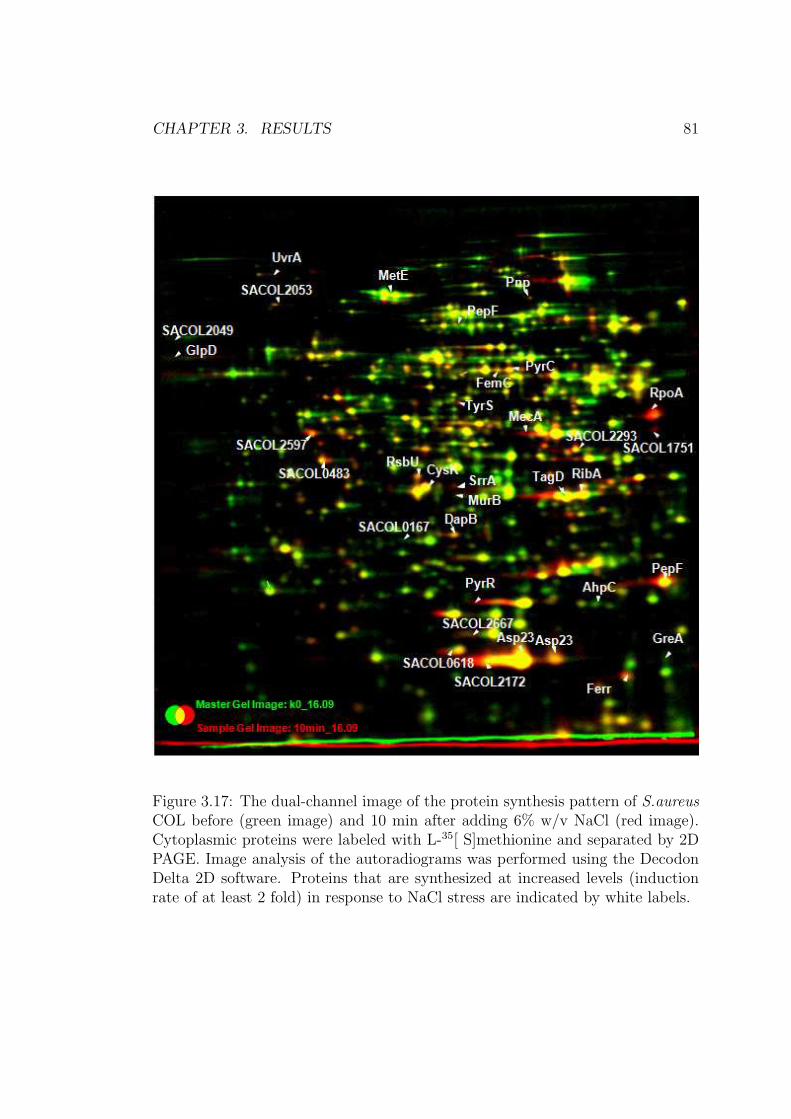
CHAPTER 3. RESULTS 81
Figure 3.17: The dual-channel image of the protein synthesis pattern of S.aureusCOL before (green image) and 10 min after adding 6% w/v NaCl (red image).Cytoplasmic proteins were labeled with L-35[ S]methionine and separated by 2DPAGE. Image analysis of the autoradiograms was performed using the DecodonDelta 2D software. Proteins that are synthesized at increased levels (inductionrate of at least 2 fold) in response to NaCl stress are indicated by white labels.

CHAPTER 3. RESULTS 82
Figure 3.18: The dual-channel image of the protein synthesis pattern of S. au-reus COL before (green image) and 10 min after adding 6% w/v NaCl (redimage).Proteins that are synthesized at decreased levels (synthesis rate of ≤ 0.5)in response to NaCl stress are indicated by white labels.

CHAPTER 3. RESULTS 83
Figure 3.19: The dual-channel image of the protein synthesis pattern of S. aureusCOL before (green image) and 60 min after adding 6% w/v NaCl (red image).Cytoplasmic proteins were labeled with L-35[ S]methionine and separated by 2DPAGE Image analysis of the autoradiograms was performed using the DecodonDelta 2D software.

CHAPTER 3. RESULTS 84
The synthesis of some enzymes belonging to amino acid synthesis pathways was
elevated after stress. For example enzymes of the metabolism of glutamate, an
amino acid which was probably required in higher concentration after salt stress
(Hoperet al.,2005) were slightly induced. The synthesis rate of glutamine syn-
thetase FemC and acetylglutamate kinase SACOL0167 was also increased after
30 minutes and 60 minutes salt stress at 2.2 and 2.1 fold, respectively.
In case of other amino acid metabolism pathways, some enzymes which belong
to these pathways were also induced. Cysteine synthase CysK catalyzing the
synthesis of cysteine was immediately induced after 5 and 10 minutes stress at
2.9 and 2.6 fold but after 30 and 60 minutes the induction rate reduced and
reached the original level. Dihydrodipicolinate reductase DapB which belong to
the aspartate metabolism also followed the same pattern. The induction peaked
at 5 and 10 minutes after stress and then decreased at 30 and 60 minutes.
As for the proteins involved in the energy metabolism, SACOL0617, a putative
hexulose-6-phosphate synthase was strongly induced right after salt stress. How-
ever, the synthesis rate of SACOL0617 was declined at 30 minutes and reached
the normal level at 60 minutes.
Another enzyme of the energy metabolism pathway, the aerobic glycerol-3-phosphate
dehydrogenase GlpD showed a temporal induction at 30 minutes after stress. It
might be considered that GlpD was enhancedly synthesized to serve S.aureus
growth on glycerol.
Table 3.9: Proteins whose synthesis was induced under salt stress condition
COL Locus ID Function Ratio
Amino acid biosynthesis
5min 10min 30min 60min
SACOL0167 SACOL0167 acetylglutamate kinase 0.09 0.42 1.81 2.03
SACOL0428 MetE 5-methyltetrahydropteroyltriglutamate-
homocysteine methyltransferase
3.38 1.19 2.86 1.04
SACOL0557 CysK cysteine synthase 2.96 2.64 1.47 1.42
SACOL2049 SACOL2049 3-isopropylmalate dehydratase, small sub-
unit
1.55 1.32 4.59 0.56
SACOL1329 FemC glutamine synthetase FemC 1.64 2.23 1.65 1.53
SACOL1431 DapB dihydrodipicolinate reductase 2.75 2.54 1.28 1.00
Energy metabolism
SACOL1321 GlpD aerobic glycerol-3-phosphate dehydrogenase 1.61 1.88 3.51 1.04
SACOL0617 SACOL0617 hexulose-6-phosphate synthase, putative 3.75 2.81 1.59 0.80
Cell envelope
SACOL0698 TagD glycerol-3-phosphate cytidylyltransferase 2.38 1.71 1.15 0.99
SACOL0801 MurB UDP-N-acetylenolpyruvoylglucosamine
reductase
0.52 0.90 2.45 1.23
Regulatory function
SACOL1210 PyrR pyrimidine operon regulatory protein 0.62 1.69 2.53 1.64
SACOL1535 SrrA DNA-binding response regulator SrrA 1.70 1.72 2.17 2.68

CHAPTER 3. RESULTS 85
SACOL2057 RsbU sigma factor B regulator protein 2.00 2.01 0.94 1.01
Transcription
SACOL1665 GreA Transcription elongation factor 0.89 0.48 2.13 1.24
SACOL1293 Pnp polyribonucleotide nucleotidyltransferase 3.04 2.19 1.19 1.36
SACOL2213 RpoA DNA-directed RNA polymerase alpha sub-
unit
6.01 6.27 2.43 2.59
Others
SACOL0452 AhpC alkyl hydroperoxide reductase 1.16 0.84 2.08 2.40
SACOL1984 Asp23 alkaline shock protein 23 3.25 2.34 1.53 1.36
SA2457 Ferr ferritins family protein 0.55 0.48 2.18 2.60
SACOL1213 PyrC dihydroorotase 2.90 2.43 1.08 1.06
SA1587 RibA riboflavin biosynthesis protein 2.08 2.13 1.66 1.05
SACOL0033 MecA penicillin-binding protein 2 0.10 1.04 2.01 1.72
SACOL1005 PepF oligoendopeptidase F 3.69 3.07 3.14 2.37
SACOL1952 SACOL1952 ferritins family protein 1.18 0.75 2.84 2.49
SACOL2172 SACOL2172 IS1272-related, transposase, degenerate 0.93 2.88 1.86 1.07
SACOL0778 TyrS tyrosyl-tRNA synthetase 2.34 2.42 1.17 1.44
SACOL0824 UvrA excinuclease ABC, A subunit 0.88 1.07 2.38 0.65
SACOL0618 SACOL0618 SIS domain protein 2.08 1.85 1.48 1.52
SACOL1751 SACOL1751 DHH subfamily 1 protein 4.72 3.63 3.42 3.10
SACOL2053 SACOL2053 S1 RNA binding domain protein 1.27 1.67 3.30 1.07
SACOL2293 SACOL2293 NAD/NADP octopine/nopaline dehydroge-
nase family protein
2.56 2.08 1.87 1.75
SACOL2459 PnbA para-nitrobenzyl esterase 3.44 2.25 4.35 1.17
SACOL2597 SACOL2597 hydrolase, alpha/beta hydrolase fold family 2.06 2.32 0.97 1.18
SACOL2667 SACOL2667 isochorismatase family protein 0.03 1.36 2.25 0.68
3.3.2.2 The induction of σB- dependent general stress protein
σB which has been shown to be important for survival under extreme conditions
in B. subtilis has also been identified in S. aureus ( Chan et al., 1998, Kullik et
al., 1998, Nicolas et al., 1999. ). In response to salt tress, some σB-dependent
proteins were detected to be induced. For instance, the alkaline shock protein
Asp23 which was identified as a σB-dependent protein (Gertz et al.,1999 ) was
up regulated during the first 5 and 10 minutes after stress at 3.2 and 2.3 fold,
respectively (Table 3.9). The 2D gel quantitation data also showed the induction
of some other proteins which were classified to be σB dependent (Pane-Farre et
al., 2005) such as the putative hexulose-6-phosphate synthase SACOL0617 or the
SIS domain protein SACOL0618. In the case of NAD/NADP octopine/nopaline
dehydrogenase SACOL2293 and hydrolase SACOL2597, their synthesis was in-
creased, but it was an undurable induction that only took place in the first 10
minutes after stress. As for para-nitrobenzyl esterase PnbA, the protein synthesis
induction was virtually stable during 30 minutes of stress experiment.

CHAPTER 3. RESULTS 86
3.3.2.3 The synthesis of many proteins is down regulated by salt stress
The presence of 6% NaCl in the growth medium not only induced but also re-
pressed the the synthesis of proteins. In this experiment, we could identified 76
proteins whose synthesis was decreased after NaCl stress.
Table 3.10: Proteins whose synthesis was repressed under salt stress condition
COL Locus ID Function Ratio
Amino acid biosynthesis
5min 10min 30min 60min
SACOL2046 LeuA 2-isopropylmalate synthase, Pyruvate family 0.45 0.50 0.86 1.09
SACOL2048 LeuC 3-isopropylmalate dehydratase, Pyruvate
family
0.31 0.36 1.58 0.15
SACOL1148 PheS phenylalanyl-tRNA synthetase, alpha sub-
unit
0.30 0.48 0.68 0.91
SACOL1149 PheT phenylalanyl-tRNA synthetase, beta subunit 0.40 0.30 0.42 0.47
SACOL1123 Pyc pyruvate carboxylase, catalyzes the ATP de-
pendent carboxylation of pyruvat to form ox-
aloacetat ( aspartate synthesis)
0.88 0.45 0.62 0.57
SACOL2043 ivlB valine, leucine and isoleucine biosynthesis 0,48 0.64 0.63 0.93
SACOL2045 ivlC acetolactate synthase, large subunit, biosyn-
thetic type , Valine, leucine and isoleucine
biosynthesis
0.26 0.30 0.50 0.81
SACOL2042 ivlD ketol-acid reductoisomerase, Valine, leucine
and isoleucine biosynthesis
0.42 0.51 0.97 0.80
SACOL0167 SACOL0167 acetylglutamate kinase 0.09 0.42 1.81 2.03
Cell envelope
SAO126 GlyC glycocardiolipin , Cell envelope: Biosynthe-
sis and degradation of surface polysaccha-
rides and lipopolysaccharides(S.a MU50)
0.48 1.94 1.28 0.88
SACOL1762 SACOL1762 t hiol peroxidase, putative 0.53 0.40 1.82 1.11
SACOL1199 FtsZ cell division protein, Cell division 0.58 0.46 0.64 0.64
SACOL0935 DltA D-alanine-activating enzyme/D-alanine-
D-alanyl carrier protein ligase, Cellular
processes Toxin production and resistance
0.39 0.42 0.34 0.47
Cofactor biosynthesis
SACOl0236 SACOL0236 diphosphocytidyl-2C-methyl-D-erythritol
synthase, putative
0.48 0.45 1.18 1.63
SACOL1715 HemB delta-aminolevulinic acid dehydratase, por-
phyrin biosynthesis
0.47 0.64 0.66 1.20
SACOL1717 HemC Biosynthesis of cofactors, prosthetic groups,
and carrier
0.45 0.95 0.93 0.99
DNA metabolism, DNA replication, recombination, and repair
SACOL2737 GidA glucose inhibited division protein A 0.20 0.49 0.82 0.85
SACOL0002 DnaN DNA polymerase III, beta subunit, DNA
replication
0.45 0.61 0.81 0.72
SACOL0006 GyrA DNA gyrase, A subunit , Tpe II of Topiiso-
merase
0.35 0.41 0.55 0.63
SACOL0005 GyrB DNA gyrase, B subunit, DNA replication 0.53 0.58 0.56 0.49
SACOL1154 SACOL1154 DNA mismatch repair MutS2 family protein 0.48 0.64 1.57 0.46
Energy metabolism
SACOL2097 AtpA ATP synthase F1, alpha subunit, ATP syn-
thase
0.37 0.58 1.13 0.48
SACOL2095 AtpD ATP synthase F1, beta subunit, ATP syn-
thase
0.47 0.38 0.60 0.59
SACOL2096 AtpG ATP synthase F1, gamma subunit, ATP syn-
thase
0.26 0.50 0.54 0.68
SACOL0842 Eno enolase, Glycolysis 0.65 0.55 0.49 0.96
SACOL1016 FabI fructose-bisphosphate aldolase, class II ,
Glycolysis
0.46 0.58 0.64 0.81
SACOL2117 FbaA fructose-bisphosphate aldolase, class II ,
Glycolysis
0.92 0.56 0.56 0.47
SA2457 Ferr ferritins family protein , Iron storage pro-
tein, possible glutamate synthase(S.a Mu50)
0.55 0.48 2.18 2.60

CHAPTER 3. RESULTS 87
SACOL2151 GlmM phosphoglucosamine mutase, Aminosugars
metabolism
0.30 0.31 0.46 0.43
SACOL2623 Mqo2 malate:quinone oxidoreductase, TCA 0.53 0.57 0.43 1.15
SACOL1103 PdhB pyruvate dehydrogenase complex E1 compo-
nent, beta subunit , Transform pyruvat in to
acetyl coA
0.56 0.37 0.69 0.88
SACOL1105 PdhD pyruvate dehydrogenase complex E3 compo-
nent, lipoamide dehydrogenase, Glycolysis
1.00 0.68 0.47 0.83
SACOL1149 PfkA 6-phosphofructokinase , Glycolysis and glu-
coneogenesis
0.81 0.98 0.46 0.64
SACOL1149 PfkA 6-phosphofructokinase , Glycolysis and glu-
coneogenesis
0.58 0.66 0.39 0.77
SACOL0966 PgI Pentose phosphate pathway 0,52 0.44 0.51 0.57
SACOL1902 PstI phosphoenolpyruvate-protein phosphotrans-
ferase , pyruvat metabolism
0.39 0.47 0.65 0.56
SACOL1745 Pyk pyruvate kinase, Convert phosphoenol pyru-
vate to pyruvate in the glycolysis
0.48 0.85 1.38 0.99
SACOL1263 SucD succinyl-CoA synthase, alpha subunit, TCA 0.37 0.59 1.02 1.01
SACOL1666 Udk uridine kinase, Purines, pyrimidines, nucleo-
sides, and nucleotides: Salvage of nucleosides
and nucleotides
0.46 0.58 1.10 1.02
SACOL2301 SACOL2301 formate dehydrogenase, alpha subunit, puta-
tive
0.45 0.83 1.16 0.64
Protein fate: Degradation of proteins, peptides, and glycopeptides
SACOL1005 PepF oligoendopeptidase F 0.38 0.56 0.62 0.99
SACOl2563 SACOL2563 ATP-dependent Clp protease, putative 0.25 0.32 0.72 0.50
SACOL0816 SecA preprotein translocase, SecA subunit ,
Translocase
0.52 0.26 0.84 0.42
SACOL0556 SACOL0556 chaperonin, 0.23 0.80 1.11 1.08
SACOL0957 SACOL0957 peptidyl-prolyl cis-trans isomerase,
cyclophilin-type
0.73 0.46 0.79 0.77
SACOL1722 Tig trigger factor, stringent control 0.60 0.38 1.15 1.30
Protein synthesis: Ribosomal proteins: synthesis and modification
SACOL1277 RpsA ribosomal protein S1 0.72 0.38 0.66 0.82
SACOL1287 SACOL1287 30S ribosomal protein L7 Ae 0.41 0.61 0.79 1.24
SACOL0593 FusA translation elongation factor G , Translation
elongation factor
0.26 1.84 1.85 0.53
SACOL0594 Tuf translation elongation factor Tu, Translation
elongation factor
0.58 0.57 0.45 0.91
SACOL0576 CysS cysteinyl-tRNA synthetase, Protein synthe-
sis: tRNA aminoacylation
0.74 0.55 0.50 0.71
Purine/ Pyrimidin metabolism
SACOL1083 PurD phosphoribosylamine-glycine ligase, Purine/
Pyrimidin metabolism, Purine ribonu-
cleotide biosynthesis
0.49 0.51 0.77 0.51
SACOL1077 PurQ phosphoribosylformylglycinamidine syn-
thase I. Purine/ Pyrimidin metabolism,
Purine ribonucleotide biosynthesis
0.78 0.49 1.31 1.13
SACOL1212 PyrB aspartate carbamoyltransferase, Purine/
Pyrimidin metabolism, Pyrimidine ribonu-
cleotide biosynthesis
0.25 0.29 0.88 0.62
SACOL1216 PyrF orotidine 5-phosphate decarboxylase,
Purine/ Pyrimidin metabolism, Pyrimidine
ribonucleotide biosynthesis
0.36 0.39 0.81 1.00
SACOL2218 Adk adenylate kinase, Phosphotranferase that
catalyse the reversible reaction convert ATP
to ADP
0.47 0.40 0.89 0.81
SACOL1277 PyrH uridylate kinase, Nucleotide and nucleoside
interconversions
0.47 0.56 0.71 0.95
Regulatory functions: DNA interactions
SACOL1786 CcpA catabolite control protein A , Signal trans-
duction pathway
0.47 0.62 0.81 1.06
SACOL1272 CodY transcriptional regulator CodY, Regulatory
functions: DNA interactions
0.47 0.33 0.81 1.01
Transcription: DNA-dependent RNA polymerase
SACOL0588 RpoB DNA-directed RNA polymerase, beta sub-
unit
0.70 0.37 0.52 0.85

CHAPTER 3. RESULTS 88
SACOL0589 RpoC DNA-directed RNA polymerase, beta sub-
unit
0.42 0.32 1.71 0.40
SACOL1665 GreA transcription elonggation factor 0.89 0.48 2.13 1.24
SA1206 NusA N utilization substance protein A, Transcrip-
tion termination process ( S.a Mu50)
0.46 0.53 0.85 1.10
Other
SACOL1415 SACOL1415 Transport and binding proteins: Amino
acids, peptides and amines
0.29 1.76 1.15 1.10
SACOL2667 SACOL2667 isochorismatase family protein 0.03 1.36 2.25 0.68
SACOL2156 SACOL2156 ATP-binding protein, Mrp/Nbp35 family 0.49 0.74 0.48 0.68
SACOL0379 SACOL0379 prophage L54a, tail tape measure protein,
TP901 family
0.49 0.57 0.55 0.66
Hypothetical protein
SACOL0051 SACOL0051 Hypothetical protein 0.36 0.84 0.48 1.27
SACOL0328 SACOL0328 peptide ABC transporter, ATP-binding pro-
tein
0.69 0.47 0.58 1.23
SACOL1793 SACOL1793 Hypothetical protein 0.53 0.31 0.51 0.49
SACOL2247 SACOL2247 Hypothetical protein 0.35 0.50 0.92 0.92
SACOL0737 SACOL0737 Hypothetical protein 0.46 0.42 0.49 0.65
SACOL1200 SACOL1200 Hypothetical protein 0.29 0.49 0.77 0.82
The synthesis of the enzymes that catalyse almost all steps of the glycolytic
pathway or tricarboxylic cycle such as Eno, FbaA, PdhB, PdhD, PfkA, PgI,
Pyc and Pyk was down regulated (Fig. 3.15,3.16, Table 3.10) indicating a strong
repression of the gene in the non growing-cell in response to NaCl stress. However,
as show in figure 3.20, those enzymes are present in green color, indicated that
they are still present in the cell but their synthesis has been switched off. Figure
3.20 also showed that after NaCl stress, many proteins are strongly synthesized
but not yet accumulated (present in red color).
The synthesis of several proteins of amino acid metabolism pathways was down
regulated by salt stress. For examples, IvlC, IvlD, IvlS of valine, leucine and
isoleucine biosynthesis pathways or PheT and PheS of phenylalanine, tyrosine and
tryptophan biosynthesis pathways were repressed under NaCl stress condition.
Except some transient induction of several enzymes catalysing the purine, pyrim-
idine metabolism mentioned above, the synthesis of PurD and PurQ enzymes of
the purine ribonucleotide biosynthesis as well as the synthesis of PyrD, PyrF,
PyrH enzymes of the pyrimidine ribonucleotide biosynthesis were switched off in
response to salt stress.

CHAPTER 3. RESULTS 89
Figure 3.20: Overview of the intracellular proteome of S.aureus before and afterchallenge with 6% w/v NaCl. Figure displays false colored dual channel imagesof the accumulation of proteins as revealed by silver staining (colored green) andsynthesis of proteins as revealed by radioactive labeling (colored red). Yellowspots are synthesized and accumulated at the same time, green spots are stillpresent but no longer synthesized, red spots are only synthesized and not yetaccumulated. Enzymes belong to TCA cycle and glycolysis were indicated bywhite circle.

CHAPTER 3. RESULTS 90
3.3.3 Detailed transcriptional analyses of genes under NaCl
stress
Northern blotting experiments for selected genes were performed to validate the
data obtained from proteome analyses. RNA were isolated from cell grown at
normal condition and 3, 6, 9 minutes after shift to high salt concentration condi-
tions.
We selected especially gene encodes protein which present to be induced under
high salt concentration conditions but for some reason could not be identified on
2D gels, for instance,sodA gene encodes superoxide dismutase.
Besides, we also selected opuA, opuB, opuC of the osmoprocetant transport sys-
tem which play an essential role in salt adaptation in B. subtilis (Kappes et al.,
1999; Steil et al., 2003 ) but were not covered in 2D gel analysis because of their
nature as membrane proteins.
Northern Blots performed using a sodA specific probe revealed a slight induction
of sodA transcript under salt stress. A transcript of 0.6 kb already present under
control conditions was slightly increased after exposure to salt stress ( 3, 6, 9
minutes, figure 3.21 ). In the case of opuA, a large transcript of 3.4 kb and a
small transcript of 1.6kb were detected (Fig.3.21).
The same two transcripts were detected using opuB and opuC probes indicating
that opuA, opuB and opuC are co-transcribed.
Unfortunately, no significant induction of opuA, B or C could be demonstrated
after salt stress. The level of transcripts remained almost unaltered in mRNA
extracted from cell grown under control conditions as well as from cells after
exposure to salt stress.

CHAPTER 3. RESULTS 91
Figure 3.21: Transcript analysis of sodA and the opuABC operon in response tosalt stress.Relevant probes which have been used in each Northern blot experi-ment were indicated by star. Relevant transcripts are indicated by arrows.

Chapter 4
Discussion
Studies on the mechanisms of the response of S.aureus to environmental stimuli
have become one center of attention during the last few years because of the
resistance to environmental stress of S.aureus .
4.1 Heat stress response
As a model organism for studying the heat shock response in Gram-positive
bacteria, differences in the proteome of heat shocked B.subtilis cells and the
mechanisms of heat shock response of this organism have been examined quite
throughout (Schulz et al., 1996; Bernhardt et al., 1997; Movadehi et al., 2000). In
B.subtilis, at least four classes of heat shock genes encoding cytoplasmic proteins
have been identified (Hecker et al., 1996; Schumann et al., 1996 ; Schumann,
2003).
In the case of pathogenic bacteria, heat-shock proteins might play an impor-
tant role, as sera from infected patients contain antibodies to several heat-shock
proteins and they are induced early in infection of human epithelial cells with
S.aureus ( Qoronfleh et al.,1998).
In this study, effects of heat stress on S.aureus cells was analyzed, using a gel-
based proteomic approach and transcriptomic analyses with DNA microarrays
.
92
CHAPTER 4. DISCUSSION 93
Unlike the model organisms B.subtilis, little was known until recently about the
regulation of stress response in S.aureus. Analysis of the complete genome se-
quence (Kuroda et al., 2001) and several recent reports indicate the existence of
the σB (Gertz et al., 2000) and HrcA (Kuroda et al., 1999) in S.aureus. Moreover,
an orthologue of the CtsR stress regulator was defined as well as several poten-
tial target genes (Derr et al., 1999). In S.aureus, there seems to be a regulatory
overlap between class I and class III genes, with dual heat shock regulation by
CtsR and HrcA.
In our work, the combination of proteomics with transcriptomics approach offers
the opportunity to find genes/proteins of S.aureus whose transcription/synthesis
was increased or decreased after stress such as heat stress. Two groups of interest-
ing proteins/gene have been identified: Those whose synthesis/transcription was
induced after heat stress and those whose synthesis/transcription was repressed
at certain time points after heat stress.
In general, our result suggested that there is a high degree of similarity between
the response of S.aureus and B.subtilis to heat stress. The obtained proteomic
and transcriptomic analysis data indicated that under heat stress conditions,
S.aureus cells showed the induction of three classes of heat inducible genes.
Among them were genes which encode the chaperones DnaK, GroEL, GroES,
and GrpE. In B.subtilis, groEL and dnaK are regulated by the HrcA repressor
and transcribed during heat shock by the vegetative sigma factor σA (Schulz
et al., 1996; Yuan and Wong, 1995). In S.aureus, the expression of dnaK and
groEL/groES is controlled by both HrcA and CtsR repressor, which act to-
gether synergistically to maintain low levels of expression in the absence of stress
( Chastanet et al., 2003). In this work, transcriptome and proteome analysis data
showed that in S.aureus, the transcription of genes belong to dnaK and groESL
operon as well as the synthesis of the chaperones DnaK, GroEL, GroES and GrpE
were up regulated with an induction factor of at least three fold under stress con-
dition. Moreover, the transcription profile showed the high induction of HrcA ,
one of the main regulators of the heat shock response, which could not be identi-
fied on the 2D gels. The transcription profile also showed that the gene encodes
ribosomal protein L11 was up regulated by heat exposure. The ribosomal protein

CHAPTER 4. DISCUSSION 94
L11 exhibits significant homology to the deduced amino acid sequence of orf35
in B.subtilis, which is one part of the heptacistronic dnaK operon (Schumann,
2003).
The exposure to heat stress condition leads to the accumulation of misfolded
proteins, resulting in an increased demand for not only the chaperones but also
for the proteases which are typically induced under heat shock conditions. For
example, among the heat induced proteins are also proteins belonging to the
Clp machinery: the proteolytic component ClpP and the chaperone ClpB. Clp-
proteases belong to class III heat shock protein that regulated by CtsR repressor
which were showed to be highly induced by heat stress in B. subtillis (Kruger and
Hecker, 1998; Derre et al., 2000; Schumann et al., 2002). In our work, ClpP and
ClpB were also found to be induced by the temperature up shift by proteomics
and transcriptomic analyses. Frees and colleagues demonstrated that the action
of a ClpP proteolytic complex is essential for staphylococci to grow under heat-
shock conditions (Frees et al., 2004 ). Our Northern blot result figured out that
the transcription of ClpB was highly induced, in support of this notion ClpB
was recently shown to be required for growth at very high temperatures (Frees et
al., 2004). In the case of SACOL0568 and SACOL0569 which were suggested to
be co-transcribed and formed a tetracistronic with ctsR and clpC in S.aureus (
Wang et al., 2004), trancriptomic analysis data also revealed a highly induction
rate of both gene after heat stress at 11.46 and 54.07 fold, respectively.
Both transcriptome and proteome analysis revealed that the heat shock repressor
protein CtsR was highly up-regulated after heat exposure. Frees and colleagues
observed the same phenomenon and suggested that CtsR may need a cofactor for
repressor function (Frees et al., 2004; Anderson et al., 2006). The proteomic and
transcriptomic analysis data showed no induction of ClpC protease, which is also
regulated by CtsR repressor and is observed to be required for S.aureus to grow
at high temperature condition (Frees et al. 2004, Anderson et al., 2006). This
result is caused by the fact that clpC probe did not exist in the S.aureus COL
arrays which were used in this study. As for the proteome analysis, ClpC protein
might be present at very low levels and thus could not be surely identified on
2D-gels.

CHAPTER 4. DISCUSSION 95
Interestingly, in this work, we have detected the induction of ahpC-ahpF in
S.aureus after exposing to heat shock. In B.subtilis, these genes belong to a
group of genes whose expression is also responsive to stress, but the mechanism
of induction is not affected by any of the previously mentioned regulators (Schu-
mann, 2003). Therefore, ahpC-ahpF are controlled by one or more unknown
mechanisms.
In the present study, under heat shock condition, no induction of proteins which
are controlled by sigma B factor (Gerzt et al., 1999) could be detected. Sigma B
was indicated to control a stress/ starvation regulon that comprises a very large
set of general stress genes in B.subtilis (Hecker and Volker,1996). In B.subtilis,
this σB dependent genes are strongly induced by heat, ethanol, acid or salt stress,
as well as by starvation for a carbon source, phosphate, and oxygen (Bernhardt
et al., 1997, 1999; Hecker and Volker, 1998; Buttner et al., 2001). In our study,
S.aureus cells were inoculated in synthetic medium, however the sigma B activity
was increased by heat stress only when the cells were grown in a complex medium
(Kullik et al., 1997; Gertz et al., 2000). In synthetic medium, sigma B was highly
active but could not be further activated by heat stress (Gertz et al., 2000).
Heat stress treatment also resulted in a strong expression level of genes belonging
to the SOS response such as uvrA and urvB, which were also induced by the
antibiotic mitomycine (Anderson et al., 2006). That indicated the relevance of
heat stress response and SOS response .
We also observed number of proteins with high synthesis rate which are involved
in the biosynthesis of purine/ pyrimidine implicating that the cell needed more
nucleoside precursor for DNA metabolism.
According to the microarrays analysis data, among the heat-induced transcripts
were several bacteriophage replication/ packaging genes such as intergrase SACOL
0318, replicative DNA helicase SACOL0343, N-6-adenine- methyltransferase SAC
OL0346, deoxy-uridine 5’-triphosphate nucleotido-hydrolase SACOL0357, tran-
scriptional regulator of the RinA family SACOL0364 as well as the small and
large subunit of the terminase SACOL0366 and SACOL0367 (Table 3.1). Ander-
son and colleagues have shown that SOS induction also activates the expression
of numerous bacteriophage genes in S.aureus. The concerted functions of these

CHAPTER 4. DISCUSSION 96
factors may account, in part, for the observation that SOS induction results in
phage-mediated pathogenicity island dissemination among staphylococci (Maz-
manian et al., 1999; Maiques et al., 2006). In the current work, as heat shock
cause DNA damage and consequently bring about an induction of DNA repair
and DNA synthesis, heat shock might lead the phages into the lysis cycle but the
mechanism of that process has not been well examined.
The transcriptomic data also showed the induction of genes encoding urease en-
zyme (urea, B, C, D, E, G), which were strongly upregulated in S.aureus biofilms
(Beenken et al., 2004). The thermo dependent protein denaturating properties of
urea have been well documented (Bennion et al., 2003)
Taken together, heat shock lead to an up-regulation of enzymes involved in DNA
metabolism, protection, and repair. Consequently, it can be concluded that under
heat shock conditions, the DNA damage occur in S.aureus. Another indication for
this conclusion is the induction of phage genes. Under oxidative stress conditions,
similar phenomena have been observed in S.aureus( Wolf et al., 2008)
4.2 Puromycin stress
The ribosome is the target of many antibiotics, that interfere with translation
via different molecular mechanisms of action. Aminoglycosides interfere with the
ribosomal proofreading activity and cause an increase in mistranslation. The
resulting accumulation of mistranslated and, therefore, misfolded proteins leads,
just as the increase in growth temperature, to the induction of chaperons and
proteases. Similarly, puromycin- a protein synthesis inhibitor that causes abortive
translation and leads to the accumulation of truncated and misfolded proteins,
thereby also induces the heat-shock signature (Brotz-Oesterhelt et al., 2004).
We compared the protein synthesis pattern as well as the transcription data of
S.aureus in response to heat shock with that in response to puromycin stress.
In general, our results suggest that, there is an overlap of the induced /repressed
proteins profiles under heat stress and puromycin stress in S.aureus. According
to the proteome analyses, the protein synthesis level of GroEL/GroES increased

CHAPTER 4. DISCUSSION 97
not only after heat shock but also after exposure to puromycin stress, similar
induction pattern was also observed for DnaK and GrpE. In B.subtilis, it was
also shown that puromycin stress stimulated heat shock protein production, the
response was rapid, treatment with puromycin most probably produced nonnative
proteins and thereby titrated the GroE chaperonin system, this in turn may
lead to an accumulation of inactive HrcA repressor and induction of the CIRCE
regulon ( Hecker et al.,1996, Mogk et al., 1997).
The microarray analysis also suggested the induction of the groESL operon as well
as the dnaK-dnaJ-grpE operon. Under heat shock conditions, these chaperones
were also highly induced, indicating that similar signalling pathways played their
roles in adaptation of S.aureus to heat and puromycin stress. This data were
in good agreement with the result gathered in Streptococcus pneumonia by Wai-
Leung and colleagues which showed that hrcA-grpE-dnaK-dnaJ, and groEL-groES
operons was highly induced by puromycin (Wai-Leung Ng et al., 2002)
Similar to heat stress, after puromycin stress, the proteomic and transcriptomic
results did not show any induction of genes which is belong to the σB-dependent
stress response. Beside the fact that synthetic medium was used in this study,
it has also been proposed that because puromycin inhibits the de novo synthesis
of σB, which in turn reduces the induction of σB-dependent genes(Moch et al.,
2000).
As expected, genes belonging to the CtsR regulon such as clpB, clpP were highly
induced. The CtsR repressor which was supposed to be inactivated and removed
during several stresses such as heat shock, puromycin in B.subtilis (Kruger et al.,
1998, Gerth et al., 1998) was also up regulated after S.aureus cells were exposed
to puromycin stress .The same phenomenon was observed in heat stress response.
Puromycin stress might lead to an accumulation of misfolded proteins therefore
might cause an increase in the synthesis of proteases and chaperones (Azzam
and Algranati, 1973) which is similar to heat stress response. However, treat-
ment with this antibiotic also brought about an additional response that is not
observed during the shift to high growth temperature such as the induction of
replicative DNA helicase DnaB. Puromycin, which is also a strong inhibitor of
protein synthesis (Azzam and Algranati, 1973), therefore leads to a decreased

CHAPTER 4. DISCUSSION 98
synthesis of enzymes belonging to amino acid synthesis pathway such as SerS,
ThrS.
4.3 Salt stress
Although osmoadaptation of S.aureus has been studied fairly extensively in the
past, it remains unclear why this organism is considerably more osmotolerant
than other bacteria (Vilhelmsson and Miller, 2002). From studies in E. coli,
Lactococcus lactis or L.monocytogenes, it was supposed that salt stress might
induce a set of proteins related to heat stress (Kilstrup et al., 1997, Duch et al.,
2002). In B.subtilis, it was indicated that a diverse range of environmental stresses
such as heat shock, salt stress, or starvation stress such as oxygen limitation
induced the same set of proteins, called general stress proteins (Hecker et al.,
1996).
In this work, we compared the protein synthesis pattern in response to salt stress
and heat stress in order to examine what happened in the case of S.aureus, and
furthermore to get some insights to high salt tolerance of S.aureus.
Surprisingly, there is only a small overlap of proteins induced by heat and salt
stress implying that different signalling pathways did play a role in adaptation to
these various kinds of environmental stress. The proteomic data also showed that
osmotic stress induces the expression of AhpC which was shown to be unspecifi-
cally induced by heat stress in B.subtilis ( Schumann, 2003). In this work, AhpC
has also been detected to be up-regulated by heat stress in S.aureus . Our results
are in good agreement with Hoper and colleagues who reported that AhpC was
induced after salt stress in B.subtilis as well (Hoper et al., 2006).
In B.subtilis, proline is the most prominent compatible solute synthesized in os-
motically stressed cells when no compatible solutes are provided exogenously
(Whatmore et al.,1990 ; Kuhlmann et al., 2002). Therefore, in B.subtilis, gluta-
mate as the precursor for proline, is probably required in higher concentrations
after salt stress when extracellular compatible solutes are not available in the
growth medium (Whatmore et al.,1990, Kuhlmann et al., 2002). In the case of

CHAPTER 4. DISCUSSION 99
S.aureus, the cells accumulate the compatible solutes glycine, proline and be-
taine within the cytoplasm, without inhibiting cellular processes (Townsend and
Wilkinson, 1992). Osmotic stress does not affect glutamate levels in S.aureus
cells, but rather results in dramatic increases in glutamine (and/or alanine) (An-
derson and Witter, 1982; Killham and Firestone, 1984; Miller and Leschine, 1984).
Therefore, as show in table 3.9, it was reasonable that the synthesis rate of glu-
tamine synthetase FemC was induced after salt stress.
Our result suggested that osmotic stress induced the expression of Asp23, which
encodes an alkaline shock protein, and the gene was shown to be preceded by
a σB-dependent promoter (Gertz et al.,1999). We additionaly observed that the
expression of some other proteins belonging to the σB-dependent proteins was
induced by high osmolarity such as hexulose-6-phosphate synthase SACOL0617,
the SIS domain protein SACOL0618 and the hydrolase SACOL2597, indicating
that could be part of a general environmental-response mechanism.
The observed results agreed well with the fact that acclimation to NaCl influences
several metabolic pathways. For instance, the induction of CysK, which catalyzes
the last step in cysteine biosynthesis. Duche and colleagues also found the same
result in L. monocytogenes after exposure to high salinity (Duche et al., 2002).
CysK was shown to be induced after oxidative stress in B.subtilis as well as in
S.aureus (Antelmann et al., 1997, Wolf et al., 2008). Besides, in B.subtilis, salt
stress seems to cause oxidative stress response in the cells as well, indicated by the
induction of the PerR regulon ( Horper et al., 2005). In S.aureus, the mechanism
that caused the induction of CysK during oxidative stress might be a decreased
availability of free cysteine, an sulfur containing amino acid which is low molecular
weight thiol and is suggested to play a crucial role as antioxidants (Lithgow et
al., 2004). But the regulation and function that CysK might play in S.aureus
under NaCl stress as well as the relation between salt stress and oxidative stress
is still unknown.
We additionaly detected the induction of some enzymes involved in the purine/pyri-
midine biosynthesis such as PyrR and PyrC, reflecting a particular need for DNA
precursor. The gene pyrR was also suggested to be induced by salt stress in
B.subtilis in a transcriptional profiling analysis by Steil and colleagues (Steil et

CHAPTER 4. DISCUSSION 100
al., 2003).
Our proteome analyses revealed that NaCl caused the significant repression of 76
proteins that could be identified on 2D gels. Among them are the enzymes of the
sugar metabolism pathways such as GapA, Eno, FbaA, PdhB, PdhD, PfkA, PgI,
Pyc and Pyk or IvlC, IvlD, IvlS , PheT, and PheS which belong to amino acid
metabolism pathways their synthesis rate was decreased in response to salt stress
and increased when growth processes resume again. This results were similar to
those previously obtained by Hoper et al., 2006 and Steil et al., 2003 in a series
of proteomic and transcriptomic experiments in B.subtilis.
The 2D gel- based proteomics allows a rapid visual overview of the most essential
physiological responses of the cell but does not cover intrinsic membrane pro-
teins that might play an essential role in salt adaptation. For instance, the ABC
transporter systems for the uptake of compatible solutes such as membrane pro-
teins OpuA, OpuB, OpuC, OpuD, and OpuE which play a crucial function in
the adaptation to osmotic stress in B.subtilis (Bremer et al., 2003 ), but in our
gel-based proteome analysis, those membrane proteins were not covered on the
proteomics main window pI 4-7.
Northern blot analysis with total mRNA from NaCl stressed S.aureus cells and
opuA, opuB, and opuC probes was carried out in order to get some insights
into the regulator mechanism of those ABC transporter system in S.aureus. Our
result suggested, that as in B.subtilis (Kempf and Bremer , 1995) opuA, opuB, and
opuC form a four cistronic operon together with opuD in S.aureus. Surprisingly,
no significant induction of opuA, B or C could be demonstrated after salt stress.
The level of transcripts remained almost unaltered. This might be due to the fact
that our stress condition was not severe enough to activate the ABC transporter
systems for the uptake of the compatible solutes or the genes were probably
constitutively expressed , which could be an explanation for the high salt tolerance
of S.aureus.
Taken together, the transcriptome and proteome analyses of S.aureus under
heat, puromycin, and NaCl shock might help us to understand the physiology
of S.aureus under different stress conditions and could provide some ideas about
the environmental signals that could specifically influence protein synthesis in dif-
CHAPTER 4. DISCUSSION 101
ferent tissues. A combination of proteomics with transcriptomics is probably one
of the best choice to come to a comprehensive understanding of stress adaptation.

References
Anderson, C. B., and WitterL. D. , 1982. Glutamine and proline accu-
mulation by Staphylococcus aureus with reduction in water activity. Journal of
Bacteriology, 143:1501-1503.
Anderson K.L., Roberts C., Disz T., Vonstein V., Hwang K., Over-
beek R., Olson P.D., Projan S.J., and Dunman P.M., 2006. Character-
ization of the Staphylococcus aureus Heat Shock, Cold Shock, Stringent, and
SOS Responses and Their Effects on Log-Phase, Journal of bacteriology, Vol.
188( 19):6739-6756.
Antelmann H., Engelmann S., Schmid R., Hecker M., 1996. General and
oxidative stress responses in Bacillus subtilis: cloning, expression, and mutation
of the alkyl hydroperoxide reductase operon. Journal of Bacteriology ,178: 6571-
6578.
Antelmann H., Bernhardt J., Schmid R., Mach H., Volker U. , and
Hecker M. 1997. First steps from a two-dimensional protein index towards a
response-regulation map for Bacillus subtilis. Electrophoresis 18:1451-1463.
Anthony B. F., and Hill H. R., 1988. Gram-positive bacteria: an overview
and summary of session. Rev Infect Dis 10: 345-50.
Azzam M.E. and Algranati I.D., 1973. Mechanism of Puromycin Action:
Fate of Ribosomes after Release of Nascent Protein Chains from Polysomes, Proc.
Nat. Acad. Sci. USA Vol. 70 (12, II) : 3866-3869.
Bae J. H. and Miller K. J., 1991. Identification of two proline transport sys-
tems in Staphylococcus aureus and their possible roles in osmoregulation. Appl.
Environ. Microbiol. 58:471-475.
102

REFERENCES 103
Baldi P. and Long A. D., 2001. A Bayesian framework for the analysis of
microarray expression data: regularized t -test and statistical inferences of gene
changes. Bioinformatics Vol. 17 (6): 509-519 .
Bardwell J.C.A., Craig E.A., 1988. Ancient heat shock gene is dispensable.
J Bacteriol. 170(7): 2977-2983.
Beenken K. E., Dunman P. M., McAleese F., Macapagal D., Murphy
E., Projan S J., Blevins J. S., and Smeltzer M. S., 2004. Global gene
expression in Staphylococcus aureus biofilms. Journal of Bacteriology 186:4665-
4684.
Belitsky B.R., Brill J., Bremer E., Sonenshein A.L., 2001. Multiple genes
for the last step of proline biosynthesis in Bacillus subtilis. J Bacteriol 183:
4389-92.
Bennett R.W., Lancette G.A., 2001.Bacteriological Analytical Manual On-
line , Chapter 12.
Bennion B.J. and Daggett V., 2003. The molecular basis for the chemi-
cal denaturation of proteins by urea. Proceedings of the National Academy of
Sciences.
Bernhardt J., Buttner K., Scharf C., Hecker M., 1999. Dual channel imag-
ing of two-dimensional electropherograms in Bacillus subtilis. Electrophoresis 20:
2225-40.
Bernhardt J., Vlker U., Vlker A., Antelmann H., Schmid R., Mach
H., Hecker M., 1997. Specific and general stress proteins in Bacillus subtilis–a
two-dimensional protein electrophoresis study. Microbiology, 43: 999-1017.
Beveridge T. J., 1999. Structures of gram-negative cell walls and their derived
membrane vesicles. J. Bacteriol 181, 4725-33.
Booth I.R.,1998. Bacterial responses to osmotic stress: diverse mechanisms to
achieve a common goal. In The Properties of Water in Foods: ISOPOW 6 ed.
Reid, D.S.,456-485.
Bremer E., in: Sonenshein, A. L., Hoch, J. A., Losick, R.(Eds.),2002. Bacillus
subtilis and its Closest Relatives: From Genes to Cells, ASMPress, 385-391.

REFERENCES 104
Brown A. D. and Simpson J. R., 1972. Water relations of sugar-tolerant
yeasts: the role of intracellular polyols. J. Gen.Microbiol. 72:589-591.
Brown A. D. and Edgley M., 1980. Osmoregulation in yeast. Genetic engi-
neering of osmoregulation: impact on plantproductivity for food, chemicals and
energy. Plenum Press: 75-90.
Brotz-Oesterhelt H., Bandow J .E. and Labischinski H., 2004. Bacte-
rial proteomics and its role in antibacterial drug discovery. Mass Spectrometry
Reviews, Volume 24, Issue 4: 549-565.
Cao M., Kobel P.A., Morshedi M.M., Wu M.F., Paddon C., Helmann
J.D., 2002. Defining the Bacillus subtilis sigma(W) regulon: a comparative
analysis of promoter consensus search, run-off transcription/macroarray analysis
(ROMA), and transcriptional profiling approaches. J Mol Biol 316: 443-57.
Charbonnier Y., Gettler B., Franois P., Bento M.,Renzoni A., Vau-
daux P., Schlegel W. and Schrenzel J.,2005. A generic approach for the
design of whole-genome oligoarrays validated for genomotyping, deletion map-
ping and gene expression analysis on Staphylococcus aureus. BMC Genomics
2005, 6,10.1186/1471-2164-6-95.
Chan P. F., Foster S. J., Ingham E. and Clements M. O., 1998. The
Staphylococcus aureus alternative sigma factor σB controls the environmental
stress response but not starvation survival or pathogenicity in a mouse abscess
model. Journal of Bacteriology. 180:6082-6089.
Christian J. H. B., 1955. The influence of nutrition on the water relations of
Salmonella oranienburg. Aust. J. Biol. Sci. 8:75-82.
Christian J. H. B., and Waltho J. A., 1964. The composition of Staphy-
lococcus aureus in relation to the water activity of thegrowth medium. J. Gen.
Microbiol. 35:205-218.
Csonka L. N., 1989. Physiological and Genetic Responses of Bacteria to Os-
motic Stress, Micro. rev. 121-147 .
Darmon E., Noone D., Masson A., Bron S., Kuipers O.P., Devine
K.M., Van Dijl J.M., 2002. A novel class of heat and secretion stressresponsive

REFERENCES 105
genes is controlled by the autoregulated CssRS twocomponent system of Bacillus
subtilis. Journal of Bacteriology 184: 5661-5671.
Deuerling E., Mogk A., Richter C., Purucker M., Schumann W., 1997.
The ftsH gene of Bacillus subtilis is involved in major cellular processes such as
sporulation, stress adaptation and secretion. Mol Microbiol 23: 921933.
Duche O., Tremoulet F., Glaser P., and Labadie J., 2002. Salt Stress
Proteins Induced in Listeria monocytogenes, Applied and environmental micro-
biology. 1491-1498 .
Engelmann S., Hecker M., 2008. Proteomic Analysis to Investigate Regula-
tory Networks in Staphylococcus aureus , Bacterial Pathogenesis Methods and
Protocols, Methods in Molecular Biology, Volume 431, pp.25-45.
Eymann C., Mach H., Harwood C.R., Hecker M., 1996. Phosphate-
starvation-inducible proteins in Bacillus subtilis: a two-dimensional gel elec-
trophoresis study. Microbiology 142, 3163-70.
Flowers T. J., Troke P. R., and Yeo A. R., 1977. The mechanism of salt
tolerance in halophites. Annu. Rev. Plant Physiol. 28:89-121.
Frees D., Chastanet A., Qazi S., Sorensen K., Hill P., Msadek T., and
Ingmer H., 2004. Clp ATPases are required for stress tolerance, intracellular
replication and biofilm formation in Staphylococcus aureus. Mol. Microbiol.54:
1445-1462.
Fuchs S., Jan Pane-Farre J., Kohler C., Hecker M., and Engelmann
S., 2007. Anaerobic Gene Expression in Staphylococcus aureus. J.Bacteriology:
4275-4289.
Galinski E. A., 1995 : Osmoadaptation in bacteria. Adv. Microb. Physiol., 37,
273-328 .
Garret R. and Grisham C., 1995. Biochemistry. Austin: Saunders College
Publishing.
Gerth U., Kruger E., Derr I., Msadek T. and Hecker M., 1998 .Stress
induction of the Bacillus subtilis clpP gene encoding the proteolytic component
of the Clp protease and involvement of ClpP and ClpX in stress tolerance. Mol
REFERENCES 106
Microbiol, 28: 787-802.
Gertz S., Engelmann S., Schmid R., Ohlsen K., Hacker J., and Hecker
M., 1999. Regulation of sigmaB-dependent transcription of sigB and asp23 in
two different Staphylococcus aureus strains. Mol. Gen. Genet. 261:558-566.
Gertz S., Engelmann S., Schmid R., Ziebandt A.K., Tischer K., Scharf
C., Hacker J., and Michael Hecker M., 2000.Characterization of the sigma
B Regulon in Staphylococcus aureus.Journal of Bacteriology, 182(24): 6983-6991.
Gilman S. and Saunders V.A., 1986. Uptake of gentamicin by Staphylo-
coccus aureus possessing gentamicin-modifying enzymes: enhancement of up-
take by puromycin and N-N-dicydohexylcarbodiimide, Journal of Antimicrobial
Chemotherapy 8,301-306.
Gof S. A. and Goldberg A. L., 1985. Production of abnormal proteins in E.
coli stimulates transcription of lon and other heat shock genes. Cell 41:587-595.
Graham J. E., and Wilkinson B. J., 1992. Staphylococcus aureus osmoreg-
ulation: roles for choline, glycine betaine, proline, and taurine. Journal of Bac-
teriology, 174:2711-2716.
Grossman A. D., Taylor W. E., Burton Z. F., Burgess R. R., and
Gross C. A.,1985. Stringent response in Escherichia coli induces expression of
heat shock protein. J. Mol. Biol. 186: 357-365.
Hecker M., Schumann W. and Volker U.,1996. Heat-shock and general
stress response in Bacillus subtilis. Mol Microbiol. 19(3):417-28.
Hecker M, Volker U., 1998. Non-specific, general, and multiple stress resis-
tance of growth-restricted Bacillus subtilis cells by the expression of the sigmaB
regulon.MolMicrobiol29: 1129-1136.
Hecker M. , Engelmann S. and Cordwell S. J., 2003. Proteomics of Staphy-
lococcus aureus-current state and future challenges. Journal of Chromatography
B, 787, 179-195.
Hoffmann T., Schutz A., Brosius M., Volker A., Volker U., Bremer E.,
2002. High-salinity-induced iron limitation in Bacillus subtilis. J Bacteriol 184,
718-27.

REFERENCES 107
Holtmann G., Bakker E.P. Uozumi, N. and Bremer E., 2003. KtrAB
and KtrCD: Two K+ uptake systems from Bacillus subtilis and their role in
adaptation to hypertonicity. J. Bacteriol. 185: 1289-1298.
Hoper D., Bernhardt J., and Hecker M., 2006. Salt stress adaptation of
Bacillus subtilis: A physiological proteomics approach, Proteomics 2006,6.
Hurwitz C., Braun C. B. and Rosano C. L.,1981. Role of ribosome recycling
in the uptake of dihydrostreptomycin by sensitive and resistant Escherichia coli.
Biochimica et Biophysica Acta 652,168-76.
Inbar O. and Ron E.Z., 1993. Induction of cadmium tolerance in E. coli K-12.
FEMS Letters, 113:197-200.
Ingram V., 1972 Biosynthesis of macromolecules. Menlo Park, California: W.A.
Benjamin Inc.
Kaenjak A., Graham J.E., Wilkinson B.J., 1993 Choline transport activity
in Staphylococcus aureus induced by osmotic stress and low phosphate concen-
trations. J Bacteriol 175:2400-2406.
Kappes R. M., Kempf B., Kneip S., Boch J., Gade J., Meier-Wagner
J., and Bremer E., 1999. Two evolutionarily closely related ABC transporters
mediate the uptake of choline for synthesis of the osmoprotectant glycine betaine
in Bacillus subtilis. Mol. Microbiol. 32:203-216
Kempf B. , Bremer E. , 1995. OpuA, an Osmotically Regulated Binding
Protein-dependent Transport System for the Osmoprotectant Glycine Betaine in
Bacillus subtilis , J. Biol. Chem, Volume 270, Number 28, Issue of July 14,
16701-16713.
Killham K., and Firestone M. K., 1984. Salt stress control of intracellular
solutes in streptomycetes indigenous to saline soils. Appl. Environ. Microbiol.
47:301-306.
Kilstrup M., Jacobsen S., Hammer K., and Vogensen F.,1997. Induction
of heat shock proteins DnaK, GroEL, and GroES by salt stress in Lactococcus
lactis, Appl Environ Microbiol. 63(5): 1826-1837.
Kruger E., Msadek T., and Hecker M., 1996. Alternate promoters direct

REFERENCES 108
stress induced transcription of the Bacillus subtilis clpC operon. Mol Microbiol,
20, 713-723.
Kuhlmann A. U. and Bremer E., 2002.Osmotically regulated synthesis of the
compatible solute ectoine in Bacillus spasteurii and related Bacillus spp. Appl.
Environ. Microbiol., 68, 772-783.
Kullik I. and Giachino P., 1997.The alternative sigma factor s in Staphylococ-
cus aureus: regulation of the sigB operon in response to growth phase and heat
shock, Arch Microbiol 167:151-159.
Kullik I., Giachino P., and Fuchs T., 1998. Deletion of the alternative sigma
factor sigmaB in Staphylococcus aureus reveals its function as a global regulator
of virulence genes. J. Bacteriol. 180:4814-4820.
Kunin C. M., and Rudy J., 1991. Effect of NaCl-induced osmotic stress on
intracellular concentrations of glycine betaine and potassium in Escherichia coli,
Enterococcus faecalis, and staphylococci. J. Lab. Clin. Med. 118:217-224.
Landfald B., and Strom A. R., 1986. Choline-glycinebetaine pathway confers
a high level of osmotic tolerance in Escherichia coli. J. Bacteriol. 165:849-855.
Lithgow J. K., Hayhurst E., Cohen G., Aharonowitz Y., Foster S. J.,
2004. Role of a cysteine synthase in Staphylococcus aureus. J. Bacteriol., 186:
1579-1590.
Maiques E., C. Ubeda S. ,Campoy N., Salvador I., Lasa, Novick R.
P., Barbe J. and Penades J. R., 2006. -Lactam antibiotics induce the SOS
response and horizontal transfer of virulence factors in Staphylococcus aureus.
Journal of Bacteriology 188:2726-2729.
Mazmanian S. K., Liu G., Ton-That H., and Schneewind O., 1999.
Staphylococcus aureus sortase, an enzyme that anchors surface proteins to the
cell wall. Science 285:760-763.
Measures J. C., 1975. Role of amino acids in osmoregulation of non-halophilic
bacteria15:324-332. Nature (London) 257:398-400.
Meury J., 1988. Glycinebetaine reverses the effects of osmotic stress on DNA
replication and cellular division in Escherichia coli. Arch. Microbiol. 149:232-239.

REFERENCES 109
Michel A., F., Hauck C.R., Herrmann M. ,Joachim Ullrich J., Jorg
Hacker J. and Ohlsen K.,2006. Global Regulatory Impact of ClpP Protease
of Staphylococcus aureus on Regulons Involved in Virulence, Oxidative Stress
Response, Autolysis, and DNA Repair. Journal of Bacteriology: 5783-5796.
Miller K. J. and Leschine S. B., 1984. A halotolerant Planococcus from
Antarctic Dry Valley soil. Curr. Microbiol. 11:205-210.
Miller K.J., Zelt S.C. and Bae J., 1991. Glycine betaine and proline are the
principal compatible solutes of Staphylococcus aureus. Current Microbiology 23:
131-137.
Missiakas D., Schwager F., Betton J.M., Georgopoulos C., Raina S.,
1996 Identification and characterization of HslV HslU (ClpQClpY) proteins in-
volved in overall proteolysis of misfolded proteins in Escherichia coli. EMBO J,
15:6899-6909.
Mogk A., Homuth G., Scholz C., Kim L., Schmid F.X. and Schumann
W., 1997. The GroE chaperonin machine is a major modulator of the CIRCE
heat shock regulon of Bacillus subtilis, The EMBO Journal, 15 (16) : 4579-4590.
Moch C., Schrogel O., and Allmansberger R., 2000. Transcription of the
nfrA-ywcH operon from Bacillus subtilis is specifically induced in response to
heat. J. Bacteriol. 182:4384-4393.
Mogk A., Volker A., Engelmann S., Hecker M., Schumann W., and
Volker U., 1998. Nonnative proteins induce expression of the Bacillus subtilis
CIRCE regulon. J. Bacteriol. 180:2895-2900.
Mogk A., Homuth G., Scholz C., Kim L., Schmid F. X., and Schumann
W., 1997. The groE chaperonin machine is a major modulator of the CIRCE
heat shock regulon of Bacillus subtilis. EMBO J. 16:4579-4590.
Molle V., Nakaura Y., Shivers R.P., Yamaguchi H., Losick R., Fujita
Y. and Sonenshein A.L., 2003.Additional targets of the Bacillus subtilis global
regulator CodY identified by chromatin immunoprecipitation and genome-wide
transcript analysis, J Bacteriol 185: 1911-1922.
Movahedi S., Waites W., 2002. Cold Shock Response in Sporulating Bacillus

REFERENCES 110
subtilis and Its Effect on Spore Heat Resistance. J. Bacteriol. 184. 5275-5281.
Msadek T., Dartois V., Kunst F., Herbaud M.-L., Denizot F. and
Rapoport G., 1998. ClpP of Bacillus subtilis is required for competence devel-
opment, motility, degradative enzyme synthesis, growth at high temperature and
sporulation. Mol Microbiol 27: 899-914.
Murray L., and Hartman P. E., 1972. Overproduction of hisH and hisF gene
products leads to inhibition of cell division in Salmonella. Can. J. Microbiol.
18:671-681.
Nagata S., Maekawa Y., Ikeuchi T., Wang Y. B., and Ishida A., 2002:
Effect of compatible solutes on the respiratory activity and growth of Escherichia
coli K-12 under NaCl stress. J. Biosci. Bioeng. 94, 384-389.
Nicholas R. O., Li T., McDevitt D., Marra A., Sucoloski S., Demarsh
P. L. and Gentry D. R., 1999. Isolation and characterization of a sigB deletion
mutant of Staphylococcus aureus. Infect. Immun. 67:3667-3669.
Noone D., Howell A., Collery R. and Devine K.M. ,2001. YkdA and YvtA,
HtrA-like serine proteases in Bacillus subtilis, engage in negative autoregulation
and reciprocal cross-regulation of ykdA and yvtAgene expression. J Bacteriol
183: 654-663.
O’Farrell P.H., 1975.High resolution two-dimensional electrophoresis of pro-
teins. J Biol Chem. 1975 May 25; 250 (10) :4007-21.
Ohta T., Nettikadan S., Tokumasu F., Ideno H., Abe Y., Kuroda M.,
Hayashi H. and Takeyasu K., 1996. Atomic force microscopy proposes a novel
model for stem-loop structure that binds a heat shock protein in the Staphylo-
coccus aureus HSP70 operon. Biochem. Biophys. Res. Commun. 226:730-734.
Ohta T., Saito K., Kuroda M., Honda K., Hayashi H., 1994. Molecular
cloning of two new heat shock genes related to the hsp70 genes in Staphylococcus
aureus, Journal of Bacteriology, 4779-4783.
Ohwada T. and Sagisaka S., 1988. An immediate and steep increase in ATP
concentration in response to reduced turgor pressure in Escherichia coli B. Arch.
Biochem. Biophys. Chem. 263:1008-1012. 259:157-163.

REFERENCES 111
Oren A., 1999. Bioenergetic aspects of halophilism. Microbiol. Mol. Biol. Rev.,
63, 334-348.
Pane-Farre J., Jonas B., Forstner K., Engelmann S., Hecker M., 2006.
The σB-regulon in Staphylococcus aureus and its regulation. Int J Med Microbiol,
296:237-258.
Porter S. E., Leckie N.I. P., Porter B. E., and Dietzler D. N., 1985.
Restoration of cell volume aindi the reversal of carbohydrate transport and growth
inhibition of osmotically upshocked Eschrichia coli. Biochem. Biophys. Res.
Commun. 126:442-449.
Pourkomailian B. and Booth I., 1992. Glycine betaine transport by Staphy-
lococcus aureus: evidence for two transport systems and for their possible roles
in osmoregulation. Journal of General Microbiology 138, 2515-2518.
Pourkomailian B. and Booth I., 1994 Glycine betaine transport by Staphylo-
coccus aureus :evidence for feed back regulation of the activity of the two trans-
port systems. Microbiology 140, 3131-3138.
Pourkomailian B., 1998. Possible link between a 35 kDa membrane protein and
osmolyte transport in Staphylococcus aureus. Letters in Applied Microbiology
26, 149-152.
Price C.W., 2002. General stress response. In Sonenshein AL, Hoch JA, Losick
R (eds) Bacillus subtilis and its closest relatives: from genes to cells. ASM Press
369-384.
Qoronfleh M.W., Weraarchakul W. and Wilkinson B. J., 1998. Antibod-
ies to a range of Staphylococcus aureus and Escherichia coli heat shock proteins
in sera from patients with S. aureus endocarditis. Infect. Immun. 66 : 3024-3027.
Reed R. H. and Stewart W. D. P., 1985. Evidence for turgor-sensitive K’ influx
in the Anabaena variabilis ATCC29413 and Synechococcus PCC6714. Biochem.
Biophys. Acta 812:155-162
Reed R. H., Borowitzka L. J., Mackay M. A., Chudek J. A., Foster R.,
Warr S. C. R., Moore D. J. and Stewart W. D. P., 1986. Organic solute
accumulation in osmotically stressed cyanobacteria. FEMS Microbiol. Rev. 39:
51-56.

REFERENCES 112
Record T., Elizabeth S. Courtenay E.S., Cayley D.S. and Guttman H
.J., 1998. Responses of E. coli to osmotic stress: large changes in amounts of
cytoplasmic solutes and water , Trends in Biochemical Sciences, 23(4): 143-148.
Rigoulay C., Entenza J.M., Halpern D., Widmer E., Moreillon P.,
Poquet I. and Gruss A., 2005. Comparative Analysis of the Roles of HtrA-
Like Surface Proteases in Two Virulent Staphylococcus aureus Strains, Infection
and Immunology: 563-572.
Riethdorf S., Vo lker U., Gerth U., Winkler A., Engelmann S., Hecker
M., 1994. Cloning, nucleotide sequence, and expression of the Bacillus subtilis
lon gene. J Bacteriol 176: 65186527
Roth W. G., Leckie M. P. and Dietzler I. N., 1985. Osmotic stress dras-
tically inhibits active transport of carbohydrates by Escherichia coli. Biochem.
Biophys. Res. Commun. 126:434-441.
Schulz A. and Schumann W., 1996. hrcA, the First Gene of the Bacillus
subtilis dnaK Operon Encodes a Negative Regulator of Class I Heat Shock Genes,
Journal of Bacteriology , 178 (4): 1088-1093.
Schumann W., 2003, The Bacillus subtilis heat shock stimulon, Cell Stress and
Chaperones 8 (3): 207-217.
Shafer W. M. and Iandolo J.J.,1979.Genetics of staphylococcal enterotoxin
B in methicillin-resistant isolates of Staphylococcus aureus. Infect Immun, 25(3):
902911.
Shivers R.P. and Sonenshein A.L.,2004. Activation of the Bacillus subtilis
global regulator CodY by direct interaction with branched-chain amino acids,
Mol Microbiol 53: 599-611.
Smeds A., Varmanen P. and Palva A., 1998. Molecular Characterization of
a Stress-Inducible Gene from Lactobacillus helveticus, Journal of Bacteriology,
180(23): 6148-6153.
Steil L., Hoffmann T., Budde I., Volker U. and Bremer E., 2003. Genome-
Wide Transcriptional Profiling Analysis of Adaptation of Bacillus subtilis to High
Salinity. J. Bacteriol., 185: 6358-6370.

REFERENCES 113
Stewart C.M., Cole M.B., Legan J.D., Slade L. and Schaffner D.W.,
2005. Solute-specific effects of osmotic stress on Staphylococcus aureus, Journal
of Applied Microbiology 98: 193-202.
Strom A. R., Falkenberg P. and Landfald B., 1986. Genetics of osmoreg-
ulation in Escherichia coli: uptake and biosynthesis of organic osmolytes. FEMS
Microbiol. Rev. 39:79-86.
Todar K. , 2004. Online text book of Bacteriology .
Townsend D.E. and Wilkinson B.J ., 1992 .Proline transport in Staphy-
lococcus aureus: a high-affinity system and a low-affinity system involved in
osmoregulation. J Bacteriol 174:2702-2710.
Van Wely K. H., Swaving J., Freudl R. and Driessen A. J., 2001. Translo-
cation of proteins across the cell envelope of Gram-positive bacteria. FEMS Mi-
crobiol Rev 25: 437-54.
Vazquez D., 1979. Inhibitors of Protein Biosynthesis, Springer-Verlag, Berlin.
Versteeg S., Escher A., Wende A., Wiegert T.and Schumann W., 2003.
Regulation of the Bacillus subtilis heat shock gene htpG is under positive control.
J Bacteriol 185: 466-474.
Vijarankul U., 1995. Journal of Bacteriology 177, 5116-512.
Vilhelmsson O. and Miller K. J., 2002. Synthesis of Pyruvate Dehydroge-
nase in Staphylococcus aureus Is Stimulated by Osmotic Stress. Applied and
environmental microbiology, 2353-2358.
Velculescu V.E., Zhang L., Zhou W., Vogelstein J., Basrai M.A., Bas-
sett Jr. D.E., Hieter P., Vogelstein B. and Kinzler K.W., 1997. Charac-
terization of the yeast transcriptome. Cell, 88: 243-251.
Volker U., Engelmann S., Maul B., Riethdorf S., Volker A., Schmid
R., Mach H., and Hecker M., 1994. Analysis of the induction of general stress
proteins of Bacillus subtilis. Microbiology 140:741-752.
Wai-Leung Ng, Kazmierczak K.M., Robertson G.T., Gilmour R. and
Winkler M.E. ,2003. Transcriptional Regulation and Signature Patterns Re-
vealed by Microarray Analyses of Streptococcus pneumoniae R6 Challenged with

REFERENCES 114
Sublethal Concentrations of Translation Inhibitors, Journal of Bacteriology, 359-
370.
Walter R. P., Morris J. G. and Kell D. B., 1987. The roles of osmotic
stress and water activity in the inhibition of the growth, glycolysis and glucose
phosphotransferase system of Clostridium pasteurianum. J. Gen. Microbiol. 133:
259-266
Wang L., Trawick J.D., Yamamoto R. and Zamudio C.,2004. Genome-
wide operon prediction in Staphylococcus aureus.Nucleic Acids Research, 2004,
Vol. 32, No. 12: 36893702
Wetzstein M., Voelker U., Dedio J., Loenau S., Zuber U., Schiesswohl
M., Herget C., Hecker M,. and Schumann W., 1992. Cloning, sequenc-
ing and molecular analysis of the dnaK locus from Bacillus subtilis. Journal of
Bacteriology 174: 3300-3310.
Whatmore A. M., Chudek J. A.and Reed R. H., 1990. J. Gen. Micro-
biol.,136: 2527-2535.
Wilson R.L., Brown L., Kirkwood-Watts D., Warren T. K., Lund S.A.,
King D.S., Jones K.F. and Hruby D.E., 2006. Listeria monocytogenes
10403S HtrA Is Necessary for Resistance to Cellular Stress and Virulence , Infec-
tion and Immunity, 74 (1): 1765-768.
Wook C., Small D.A., Toghrol F., and Bentley W.E., 2006. Global Tran-
scriptome Analysis of Staphylococcus aureus Response to Hydrogen Peroxide,
Journal of Bacteriology, 1648-1659.
Wolf C., Hochgrfe F., Kusch H., Albrecht D., Hecker M. and Engel-
mann S., 2008. Proteomic analysis of antioxidant strategies of Staphylococcus
aureus: Diverse responses to different oxidants. Proteomics , 8: 3139-3153.
Wu S., de Lencastre H. and Tomasz A., 1996. A Sigma-B, a putative
operon encoding alternate sigma factor of Staphylococcus aureus RNA poly-
merase: molecular cloning and DNA sequencing. J Bacteriol 178:6036-6042.
Yancey P. H., Clark M. E., Hand S. C., Bowlus R. D. and Somero
G. N., 1982. Living with water stress: evolution of osmolyte systems. Science

REFERENCES 115
217:1214-1227.
Yamamoto N. and Droffner M., 1985. Mechanisms determining aerobic or
anaerobic growth in the facultative anaerobe glycolysis, and glucose phospho-
transferase system of Clositridiium pasteurianum. J. Gen. Microbiol. 133: 2077-
2081.
Zhang J.K. and Aronson A., 1994. A Bacillus subtilis bglA gene encoding
phospho-glucosidase is inducible and closely linked to a NADH dehydrogenaseen-
coding gene. Gene 140:85-90.
Zuber U.and Schumann W., 1994. CIRCE, a novel heat-shock element in-
volved inregulation of heat-shock operon dnaK of Bacillus subtilis. Journal of
Bacteriology 176:1359-1363.

CURRICULUM VITAE
Personal information:
Name Le, Thi Nguyen Binh
Sex Female
Date of birth 31 Juli, 1980
Place of birth Hanoi
Nationality Vietnam
Marital status Married
Education and work experience:
2005 - 2008Ph.D. student, Institute of Microbiology, Faculty of
Mathematics-Natural science,
Ernst-Moritz-Arndt University of Greifswald, Germany.
10/2002 - 3/2005Diploma of science in Biology, Faculty of Mathematics-
Natural science,
Ernst-Moritz-Arndt University of Greifswald, Germany.
16/2002 - 10/2002Researcher in Institute of Biotechnology,
Vietnam Academy of Science and Technology.
1998 - 2002 Bachelor of science in Biology, Faculty of Biology, Hanoi
National University, Vietnam .
116

Acknowledgements
First and foremost, I would like to express my sincere gratitude to my supervisor,
Prof. Michael Hecker for giving me a special opportunity to work in the scientific
atmosphere at Microbiology institute, for his continuous guidance and valuable
support during this study.
I heartily appreciate my great advisor and lab supervisor, Dr. Susanne Engel-
mann for all of her support, patience, care and encouragement. You were always
there whenever I was in need through out my studying time in Greifswald. Thank
you very much for your excellent suggestions, helpful advices and invaluable com-
ments guiding me through the work. Thanks for everything you have done for
me.
I am much obliged to Stephan Fuchs and Dr. Daniela Zuhlke for their helps in
2D-gel experiment and their great support in Delta2D analysis.Thank you very
much for your cooperation in the heat stress proteome evaluation.
I would like to express my thankfulness to Dr. Jan Pane-Farre and Swantje Reiß
for their support in the microarrays works. Thank you for all your help and
suggestions.
I am also highly appreciated Patrice Francois and colleagues at Genomic Re-
search Laboratory, Department of Internal Medicine, Geneva University Hospi-
tals, Switzerland for their microarrays performance.
I gratefully acknowledge Dr. Dirk Albrecht, Dr. Birgit Voigt and the MS group
for the protein identification and mass spectrometry work .
My special appreciation is expressed to Thomas Meier, Mrs Anita Harang and
Mrs Anke Arelt for their great experimental support.
117

ACKNOWLEDGEMENTS 118
I would like to say many thanks to all the members in S2-laboratory for their
company, friendship and help during the years. It was so nice being with such a
great team .
I am grateful to all members of Microbiology institute for the friendly working
atmosphere.
I am also highly appreciated the financial supporting from German Federal Min-
istry for Education and Research as well as from Ernst Moritz Arndt University
during my studying years in Greifswald.
I am especially grateful to all my friends in Greifswald, especially family Witt
and family Kasbohm who always encourage me with their deep sentiments, for
their motivation when ever I felt depressed and for helping me so much whatever
I need through my time here.
Finally, I express my heartfelt thanks to my family. To my parent and my sister
who are always supporting me all the while with constant care and love. To my
husband Tung, who is always beside me every step of the way, for his love, his
patience and care, for sharing thoughts with me and for helping me keep my life
in proper perspective and balance.

Erklarung
Hiermit erklare ich, dass diese Arbeit bisher von mir wieder an der Mathematisch-
Naturwissenschaftlichen Fakultat der Ernst-Moritz-Arndt-Universitt Greifswald
noch einer anderen wissenschaftlichen Einrichtung zum Zwecke der Promotion
eingereicht wurde.
Ferner erklare ich, dass ich diese Arbeit selbstandig verfasst und keine anderen
als die darin angegebenen Hilfsmittel benutzt habe.
119