Embed Size (px)
Citation preview

STYLIZED FACTS ON SECURITY RETURNSadopted from Heinz Zimmermann, Elmar Mertens
2
AGENDA
We will look at how security returns behave . . .
. . . across asset classes
. . . compared with their "risk"
. . . once they are grouped into baskets
. . . in relation to the macroeconomy
. . . depending on firm characteristics
. . . with regard to prior performance
. . . when there is new information
. . . and what investment managers get out of them
3
AGENDA
We will look at how security returns behave . . .
. . . across asset classes
. . . compared with their "risk"
. . . once they are grouped into baskets
. . . in relation to the macroeconomy
. . . depending on firm characteristics
. . . with regard to prior performance
. . . when there is new information
. . . and what investment managers get out of them

4
AVERAGE RETURNS ON FINANCIAL AND PHYSICAL ASSETSPercent p.a. in U$, average over the 1980s
Source: Malkiel (1996), p. 383
Zero returnin real terms
Historical returns on various asset classes differ considerably

5
TODAY‘S VALUE OF 1$ INVESTED IN 1972Including reinvestment of interests and dividends
$0
$5
$10
$15
$20
$25
1972 1976 1980 1984 1988 1992 1996
S&P 500 (w/Dividends) US Government Bonds (long term) US Government Bonds (1 year)Source: Mertens, Data from Ibbotson Associates
Exponentialgrowth of stock
prices
1y-Bonds earnedless, but grewvery smoothly
Stockaccountdipping
below $1
The long-term gains from the stock market have been astounding
6
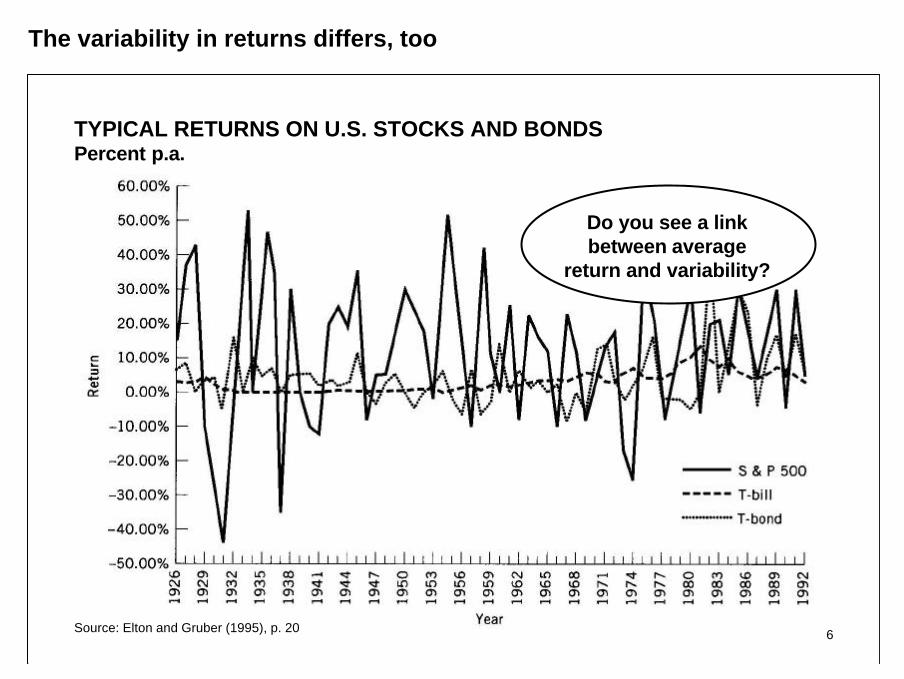
TYPICAL RETURNS ON U.S. STOCKS AND BONDSPercent p.a.
Source: Elton and Gruber (1995), p. 20
Do you see a linkbetween average
return and variability?
The variability in returns differs, too
7
AGENDA
We will look at how security returns behave . . .
. . . across asset classes
. . . compared with their "risk"
. . . once they are grouped into baskets
. . . in relation to the macroeconomy
. . . depending on firm characteristics
. . . with regard to prior performance
. . . when there is new information
. . . and what investment managers get out of them
8
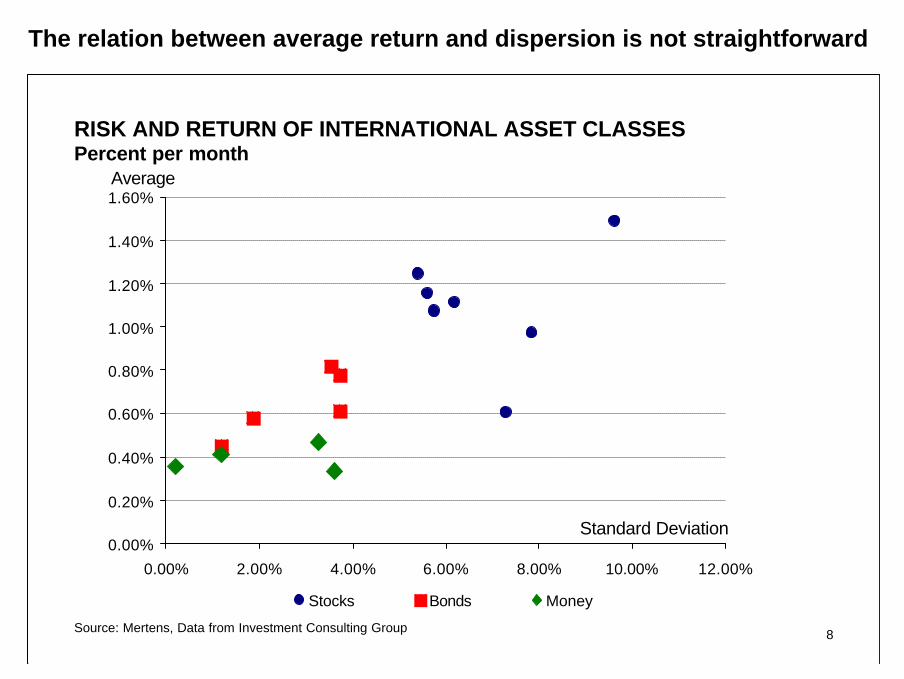
RISK AND RETURN OF INTERNATIONAL ASSET CLASSESPercent per month
0.00%
0.20%
0.40%
0.60%
0.80%
1.00%
1.20%
1.40%
1.60%
0.00% 2.00% 4.00% 6.00% 8.00% 10.00% 12.00%
Stocks Bonds Money
Source: Mertens, Data from Investment Consulting Group
Average
Standard Deviation
The relation between average return and dispersion is not straightforward

9
RISK AND RETURN OF SOME U.S. STOCK PORTFOLIOSPercent per month
Source: Mertens, Data from Fama and French (1992)
0.6%
0.8%
1.0%
1.2%
1.4%
1.6%
1.8%
4.0% 4.5% 5.0% 5.5% 6.0% 6.5% 7.0% 7.5% 8.0%
Average
Standard Deviation
BACKUP
Could a negativerelationship make
any sense?
For a single asset class, like stocks, there is almost no relationship
10
AGENDA
We will look at how security returns behave . . .
. . . across asset classes
. . . compared with their "risk"
. . . once they are grouped into baskets
. . . in relation to the macroeconomy
. . . depending on firm characteristics
. . . with regard to prior performance
. . . when there is new information
. . . and what investment managers get out of them

11
ADDING STOCKS IN ALPHABETIC ORDER TO A PORTFOLIOVolatility of portfolio returns (dispersion around mean) in percent p.a.
15%
17%
19%
21%
23%
25%
27%
ABB
+ Alus
uisse
+ Balo
ise+ C
iba
+ Clar
iant
CS Hold
ing+ E
ms
+ Hold
erban
k
+ Nes
tlé
+ Nov
artis I
+ Nov
artis N
+ Swiss
Life
+ Roc
he
+ SAir
Group
+ Swiss
Re+ S
GS
+ SMH N
+ SMH I
+ Sulz
er+ U
BS
+ Zuri
ch Al
lied
Relationshipnot monotone
Source: Zimmermann
Even a naïve mix of just a few stocks reduces risk considerably
12
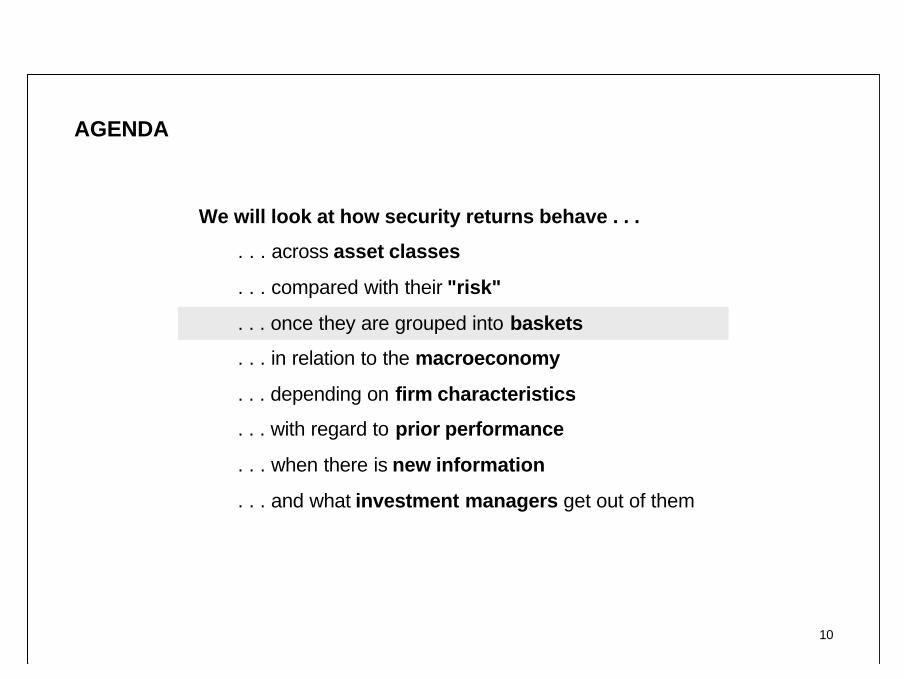
COMOVEMENT OF STOCKS WITH MARKETReturns in percent per month
-40%
-30%
-20%
-10%
0%
10%
20%
30%
40%
-20% -10% 0% 10% 20%
SGS vs Market (x-axis)
-50%
-40%
-30%
-20%
-10%
0%
10%
20%
30%
40%
50%
-20% -10% 0% 10% 20%
Credit Suisse vs Market (x-axis)
Correlation:0.3
Correlation:0.8
Source: Mertens
Some stocks move more, other less closely with the market

13
AGENDA
We will look at how security returns behave . . .
. . . across asset classes
. . . compared with their "risk"
. . . once they are grouped into baskets
. . . in relation to the macroeconomy
. . . depending on firm characteristics
. . . with regard to prior performance
. . . when there is new information
. . . and what investment managers get out of them

14
RECESSIONS AND THE U.S. STOCK MARKET SINCE 1926Indexed S&P 500 (with dividends), logarithmic scale
Most recessionsaccompanied by falls
in stock market.Which causation?
Source: Mertens, Data from NBER and Ibbotson Associates
There is a well established link between business cycles and stockmarket returns
15
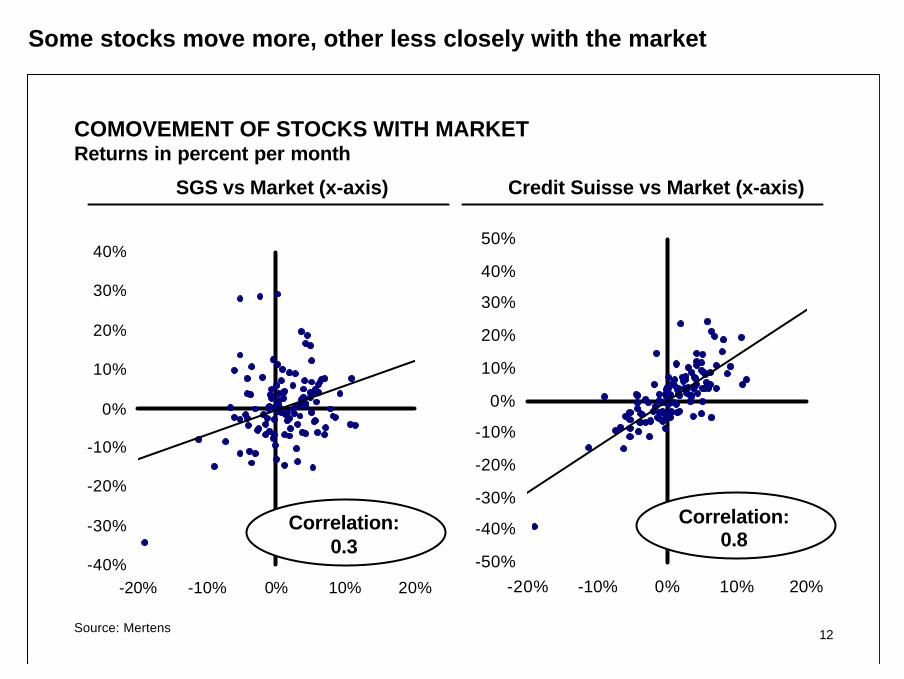
U.S. STOCK MARKET AND THE MACROECONOMYPatterns of yearly returns / changes (different scales)
Annual returnon S&P 500
Yearly averageof 1-monthT-Bill rates
BACKUP
Change inannual GDP
Source: Mertens, Data from Investment Consulting Group
The relation between stock market, GDP and short rates is notstraightforward
16
AGENDA
We will look at how security returns behave . . .
. . . across asset classes
. . . compared with their "risk"
. . . once they are grouped into baskets
. . . in relation to the macroeconomy
. . . depending on firm characteristics
. . . with regard to prior performance
. . . when there is new information
. . . and what investment managers get out of them
17
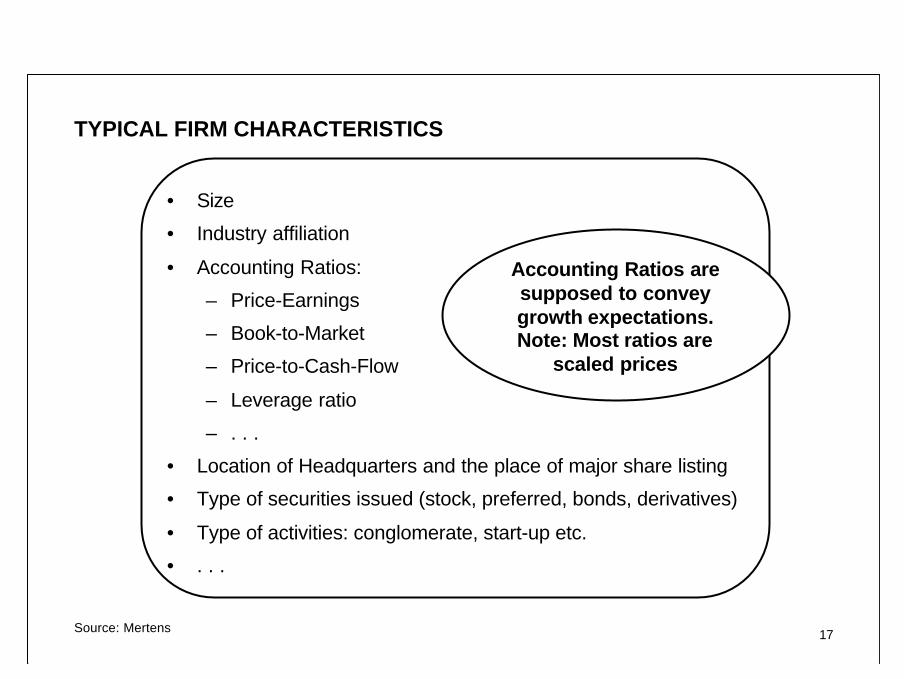
TYPICAL FIRM CHARACTERISTICS
• Size
• Industry affiliation
• Accounting Ratios:
– Price-Earnings
– Book-to-Market
– Price-to-Cash-Flow
– Leverage ratio
– . . .
• Location of Headquarters and the place of major share listing
• Type of securities issued (stock, preferred, bonds, derivatives)
• Type of activities: conglomerate, start-up etc.
• . . .
Accounting Ratios aresupposed to conveygrowth expectations.Note: Most ratios are
scaled prices
Source: Mertens
18
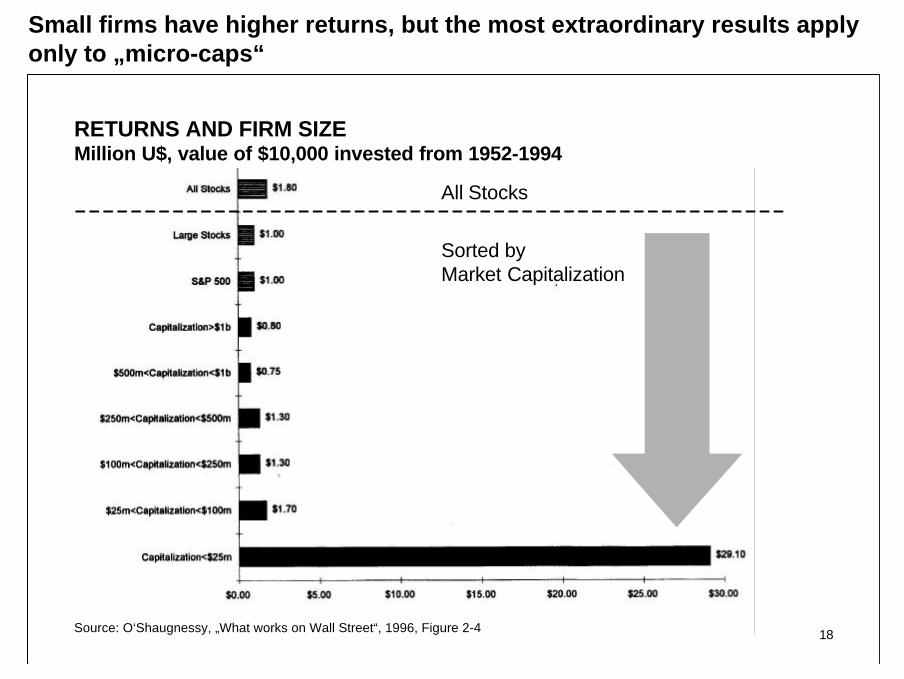
RETURNS AND FIRM SIZEMillion U$, value of $10,000 invested from 1952-1994
Source: O‘Shaugnessy, „What works on Wall Street“, 1996, Figure 2-4
All Stocks
Sorted by Market Capitalization
Small firms have higher returns, but the most extraordinary results applyonly to „micro-caps“
20
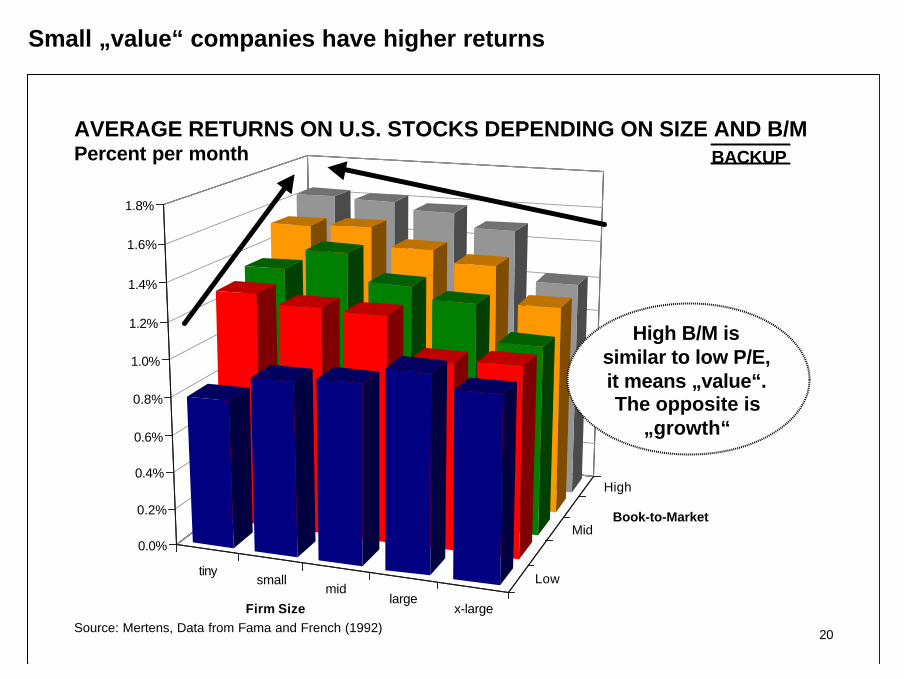
AVERAGE RETURNS ON U.S. STOCKS DEPENDING ON SIZE AND B/MPercent per month
Source: Mertens, Data from Fama and French (1992)
tinysmall
midlarge
x-large
Low
Mid
High
0.0%
0.2%
0.4%
0.6%
0.8%
1.0%
1.2%
1.4%
1.6%
1.8%
Firm Size
Book-to-Market
High B/M issimilar to low P/E,it means „value“.The opposite is
„growth“
BACKUP
Small „value“ companies have higher returns

21
PORTFOLIO OF BUYING „VALUE“ AND SELLING „GROWTH“ ´68-´90Percent p.a., U.S. Stocks BACKUP
Source: Lakonishok, Shleifer and Vishny (1994)
R: RecessionD: Down Market
A crash- andrecession-proof
strategy?
For a long time, the performance of buying „value“ companies seemedvery persistent
22
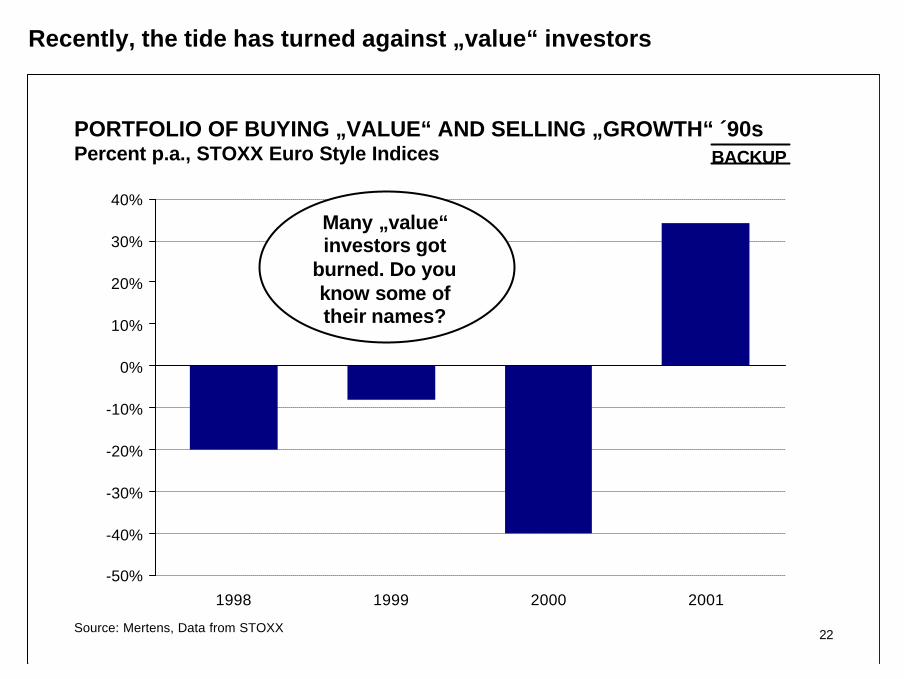
PORTFOLIO OF BUYING „VALUE“ AND SELLING „GROWTH“ ´90sPercent p.a., STOXX Euro Style Indices BACKUP
Source: Mertens, Data from STOXX
-50%
-40%
-30%
-20%
-10%
0%
10%
20%
30%
40%
1998 1999 2000 2001
Many „value“investors got
burned. Do youknow some oftheir names?
Recently, the tide has turned against „value“ investors
23
AGENDA
We will look at how security returns behave . . .
. . . across asset classes
. . . compared with their "risk"
. . . once they are grouped into baskets
. . . in relation to the macroeconomy
. . . depending on firm characteristics
. . . with regard to prior performance
. . . when there is new information
. . . and what investment managers get out of them
24
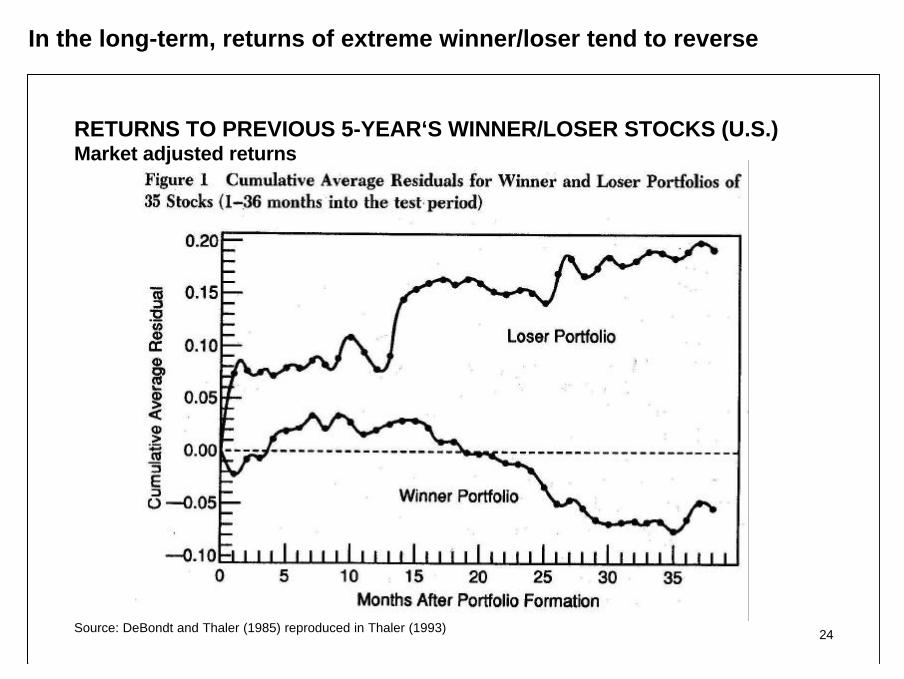
RETURNS TO PREVIOUS 5-YEAR‘S WINNER/LOSER STOCKS (U.S.)Market adjusted returns
Source: DeBondt and Thaler (1985) reproduced in Thaler (1993)
In the long-term, returns of extreme winner/loser tend to reverse
25
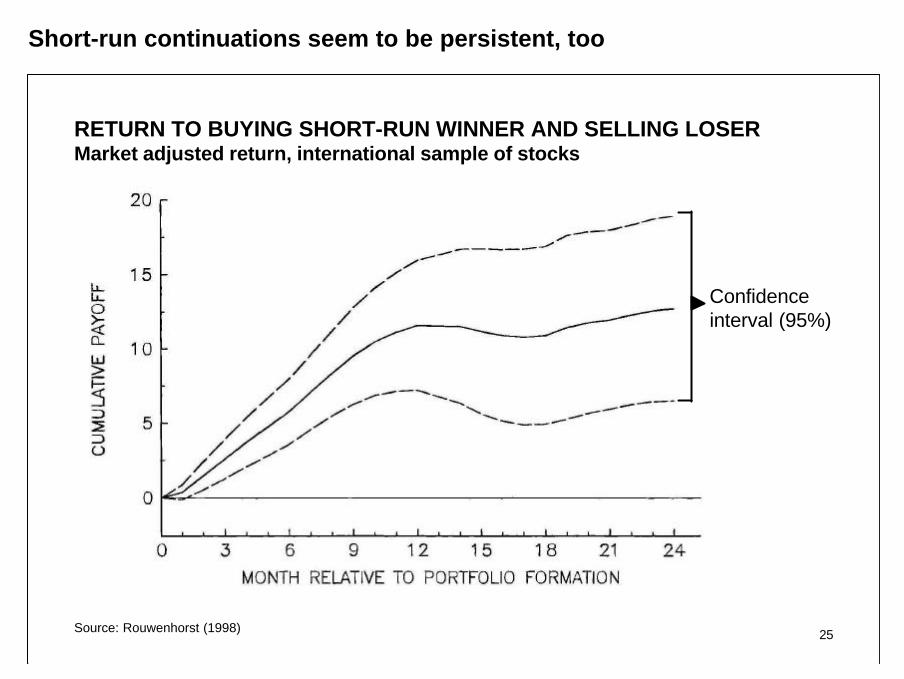
RETURN TO BUYING SHORT-RUN WINNER AND SELLING LOSERMarket adjusted return, international sample of stocks
Confidenceinterval (95%)
Source: Rouwenhorst (1998)
Short-run continuations seem to be persistent, too
26
AGENDA
We will look at how security returns behave . . .
. . . across asset classes
. . . compared with their "risk"
. . . once they are grouped into baskets
. . . in relation to the macroeconomy
. . . depending on firm characteristics
. . . with regard to prior performance
. . . when there is new information
. . . and what investment managers get out of them
27
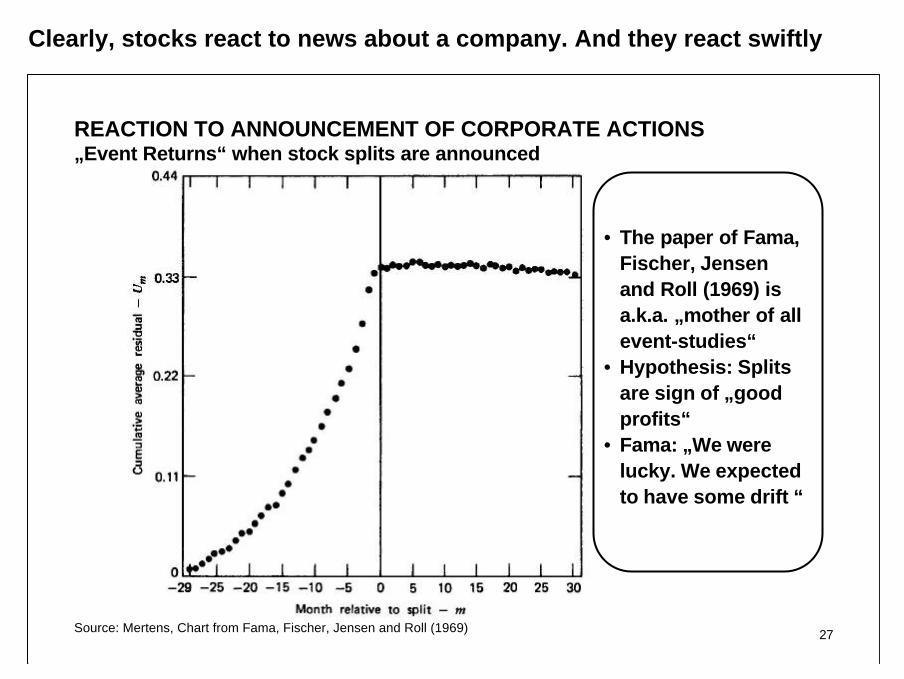
REACTION TO ANNOUNCEMENT OF CORPORATE ACTIONS„Event Returns“ when stock splits are announced
Source: Mertens, Chart from Fama, Fischer, Jensen and Roll (1969)
• The paper of Fama,Fischer, Jensenand Roll (1969) isa.k.a. „mother of allevent-studies“
• Hypothesis: Splitsare sign of „goodprofits“
• Fama: „We werelucky. We expectedto have some drift “
Clearly, stocks react to news about a company. And they react swiftly
28
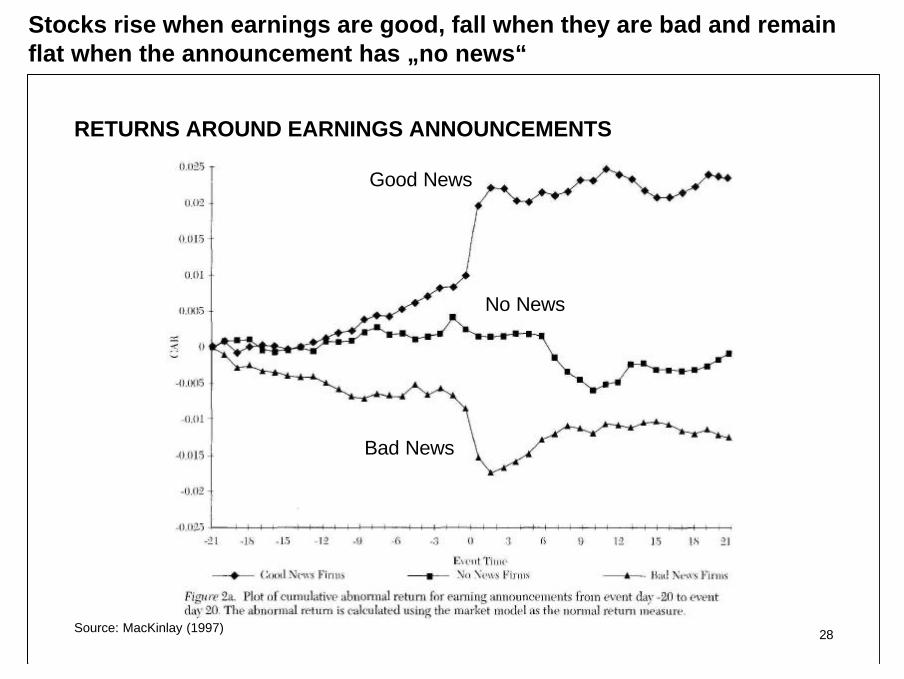
RETURNS AROUND EARNINGS ANNOUNCEMENTS
Source: MacKinlay (1997)
Good News
Bad News
No News
Stocks rise when earnings are good, fall when they are bad and remainflat when the announcement has „no news“
29
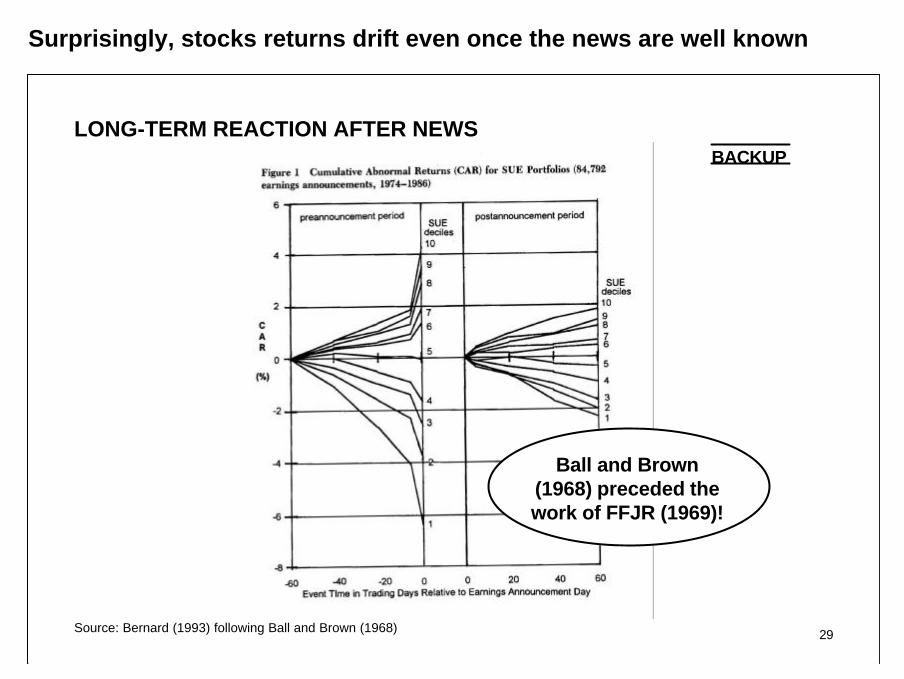
LONG-TERM REACTION AFTER NEWSBACKUP
Source: Bernard (1993) following Ball and Brown (1968)
Ball and Brown(1968) preceded thework of FFJR (1969)!
Surprisingly, stocks returns drift even once the news are well known
30
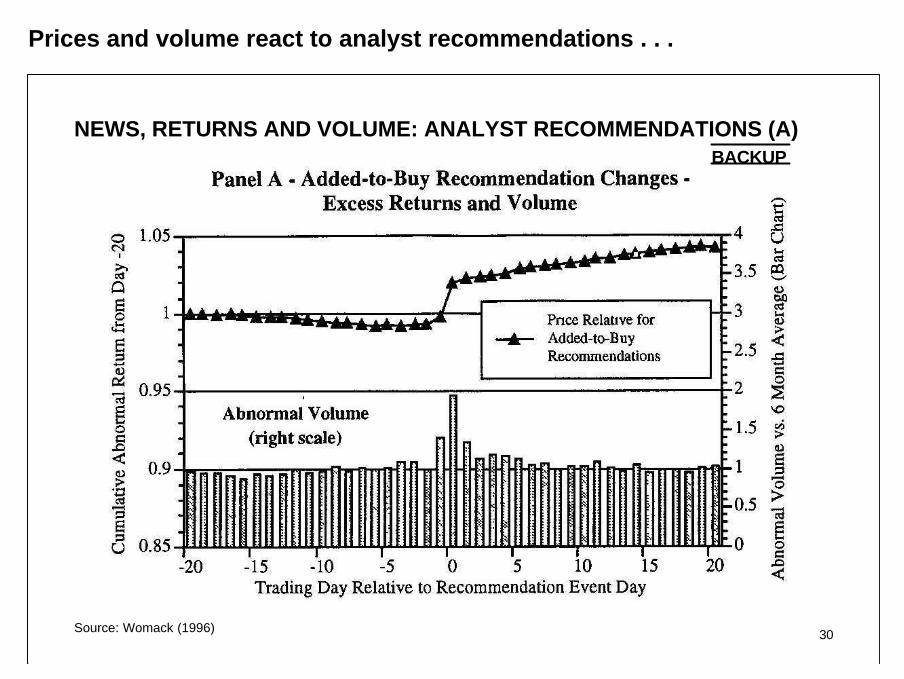
NEWS, RETURNS AND VOLUME: ANALYST RECOMMENDATIONS (A)BACKUP
Source: Womack (1996)
Prices and volume react to analyst recommendations . . .
31
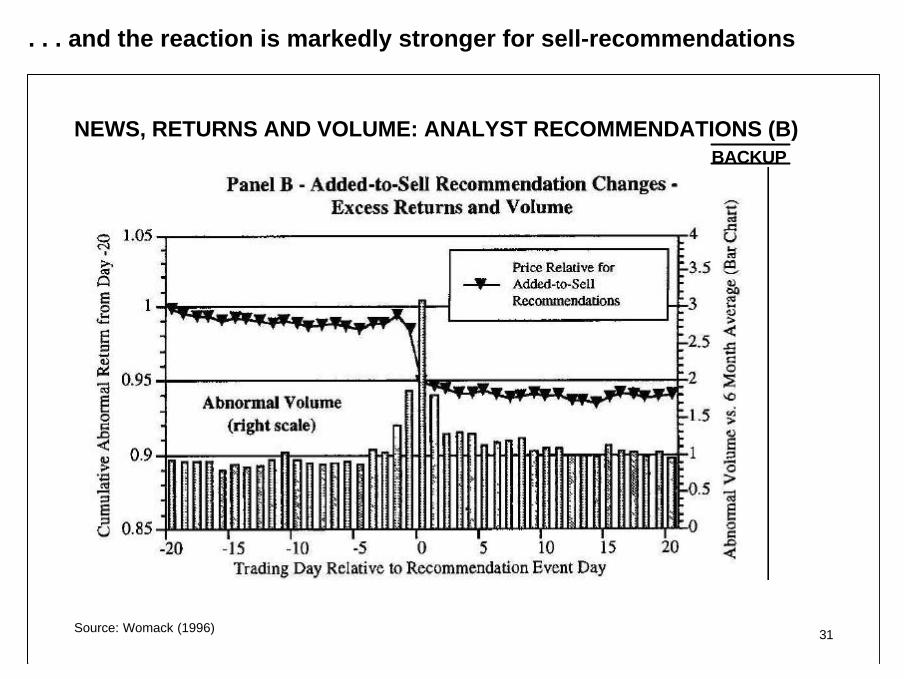
NEWS, RETURNS AND VOLUME: ANALYST RECOMMENDATIONS (B)BACKUP
Source: Womack (1996)
. . . and the reaction is markedly stronger for sell-recommendations
32
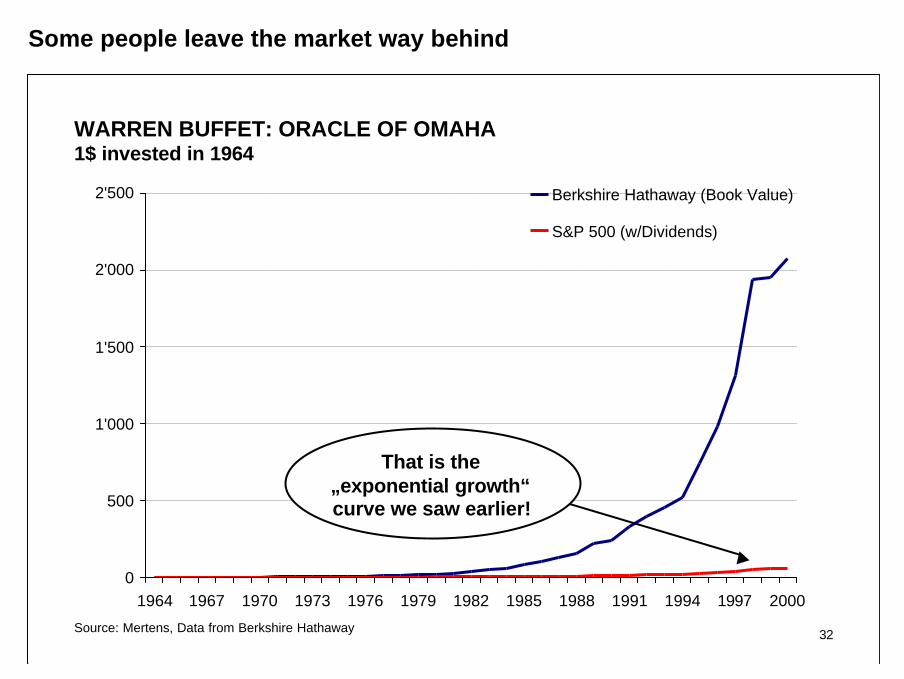
WARREN BUFFET: ORACLE OF OMAHA1$ invested in 1964
0
500
1'000
1'500
2'000
2'500
1964 1967 1970 1973 1976 1979 1982 1985 1988 1991 1994 1997 2000
Berkshire Hathaway (Book Value)
S&P 500 (w/Dividends)
That is the„exponential growth“curve we saw earlier!
Source: Mertens, Data from Berkshire Hathaway
Some people leave the market way behind

33
FUNDS UNDERPERFORMING WILSHIRE 5‘000 INDEXPercent of total U.S. general equity funds
Source: Malkiel (1996), p. 215
50%
Only in 8 out of 22years lower than 50%
For the average fund, the odds of beating the market are less than even
34
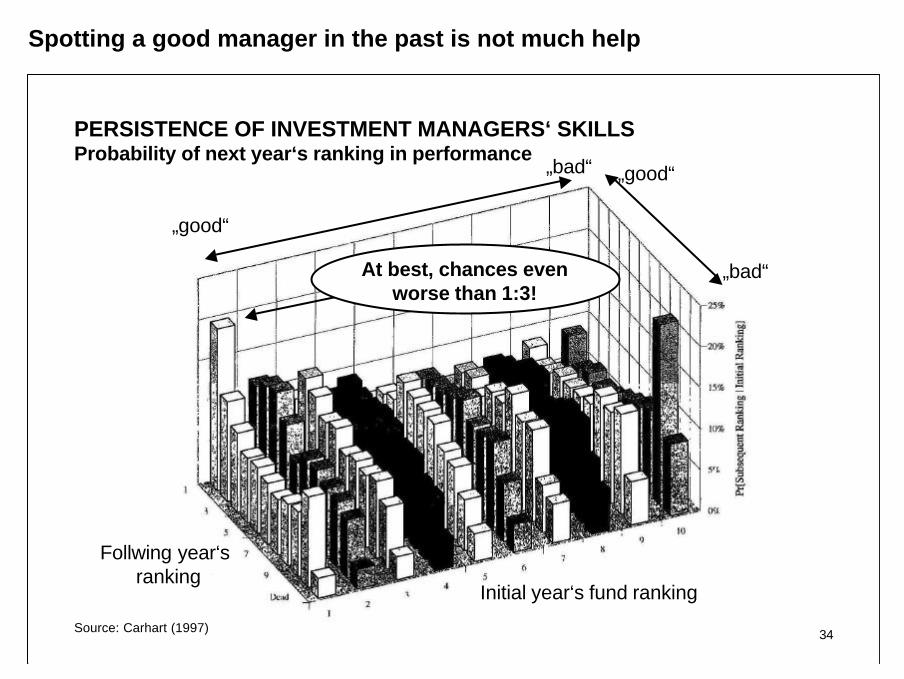
PERSISTENCE OF INVESTMENT MANAGERS‘ SKILLSProbability of next year‘s ranking in performance
At best, chances evenworse than 1:3!
Initial year‘s fund ranking
Follwing year‘s ranking
„good“
„bad“
„good“
„bad“
Source: Carhart (1997)
Spotting a good manager in the past is not much help
35
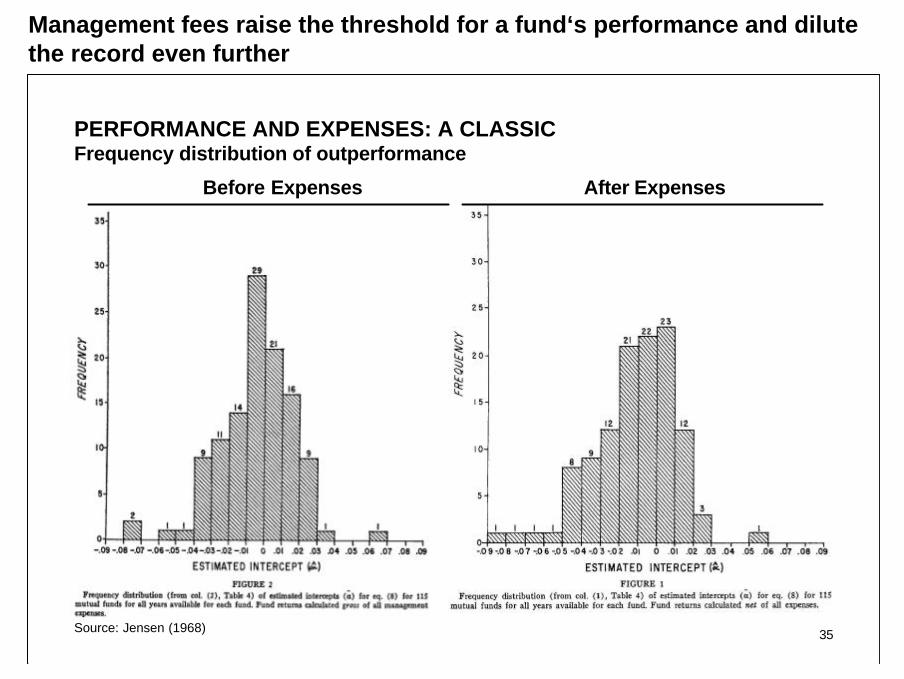
PERFORMANCE AND EXPENSES: A CLASSICFrequency distribution of outperformance
Before Expenses
Source: Jensen (1968)
After Expenses
Management fees raise the threshold for a fund‘s performance and dilutethe record even further
36
SUMMING UP: KEY QUESTIONS
• What determines asset prices?
• What is risk and where does it come from?
• Which factors influence the stock market and how?
• What information do we need for pricing?
• How shall we invest?
STYLIZED FACTS ON SECURITY RETURNSby Heinz Zimmermann, Elmar Mertens
37
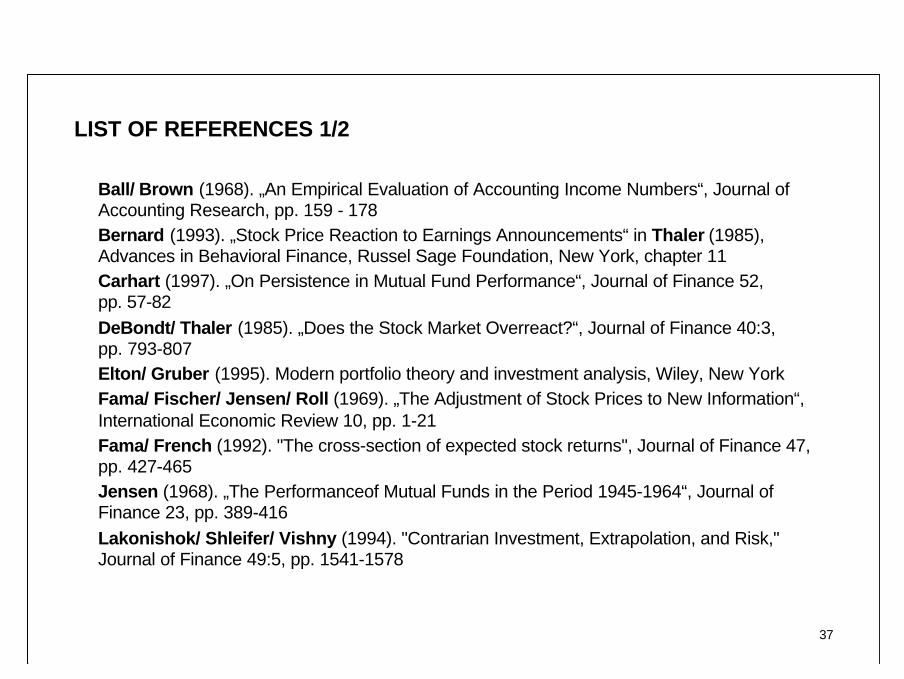
LIST OF REFERENCES 1/2
Ball/ Brown (1968). „An Empirical Evaluation of Accounting Income Numbers“, Journal ofAccounting Research, pp. 159 - 178Bernard (1993). „Stock Price Reaction to Earnings Announcements“ in Thaler (1985),Advances in Behavioral Finance, Russel Sage Foundation, New York, chapter 11Carhart (1997). „On Persistence in Mutual Fund Performance“, Journal of Finance 52,pp. 57-82DeBondt/ Thaler (1985). „Does the Stock Market Overreact?“, Journal of Finance 40:3,pp. 793-807Elton/ Gruber (1995). Modern portfolio theory and investment analysis, Wiley, New YorkFama/ Fischer/ Jensen/ Roll (1969). „The Adjustment of Stock Prices to New Information“,International Economic Review 10, pp. 1-21Fama/ French (1992). "The cross-section of expected stock returns", Journal of Finance 47,pp. 427-465Jensen (1968). „The Performanceof Mutual Funds in the Period 1945-1964“, Journal ofFinance 23, pp. 389-416Lakonishok/ Shleifer/ Vishny (1994). "Contrarian Investment, Extrapolation, and Risk,"Journal of Finance 49:5, pp. 1541-1578

38
LIST OF REFERENCES 2/2
bLowenstein (1995). Buffet - The Making of an American Capitalist, Random HouseMacKinlay (1997). „Event Studies in Economics and Finance“, Journal of Economic Literature35, pp. 13-39bMalkiel (1996). A Random Walk Down Wall Street, Norton, New YorkbO‘Shaugnessy (1996). What works on Wall Street, McGraw-Hill, New YorkRouwenhorst (1998). „International Momentum Strategies“, Journal of Finance 53:1,pp. 267-284Thaler (1993). Advances in Behavioral Finance, Russel Sage Foundation, New YorkWomack (1996). „Do Brokerage Analyst Recommendations Have Investment Value?“,Journal of Finance 51, pp. 137-167
b : „bed-time“ reading (and still useful in daylight)