Embed Size (px)
Citation preview
Technical Note
Sub-Millimeter Isotropic MRI for Segmentation ofSubcortical Brain Regions and Brain Visualization
Ying Wu, MD,1,2* Ann B. Ragin, PhD,3 Hongyan Du, MS,4 Shawn Sidharthan, BS,1
Eugene E. Dunkle, RN,1 Ioannis Koktzoglou, PhD,1,2 and Robert R. Edelman, MD1,2
Purpose: To evaluate a rapid sub-millimeter isotropicspoiled gradient-echo (nonselective SPGR) to facilitate thebrain subcortical segmentation and the visualization ofbrain volume compared with the commonly acceptedinversion recovery-prepared SPGR (SPGR-IR) technique.
Materials and Methods: The feasibility of the nonselec-tive SPGR was evaluated for two segmentation algorithms.FAST was used to segment the brain into constituent tis-sue classes (white matter, gray matter, cerebrospinalfluid) and FreeSurfer was used to segment specific sub-cortical structures (hippocampus, caudate, putamen, andthalamus). Localized apparent signal-to-noise ratio (SNR)and contrast-to-noise ratio (CNR) values for nonselectiveSPGR and the SPGR-IR were compared for the studiedsubcortical regions. The three-dimensional volume ren-dering was generated to evaluate the nonselective SPGRand the SPGR-IR for brain visualization.
Results: In basal ganglia regions, nonselective SPGR allowsfor consistent segmentation results for both FAST and Free-Surfer. This sequence also better differentiated gray/whitematter compared with SPGR-IR. An approximate two-foldimprovement of image quality in apparent SNR and CNR wasindicated for subcortical brain anatomical structures withnonselective SPGR versus SPGR-IR. The nonselective SPGRimproved clarity and yielded a more realistic depiction of thebrain surface for visualization compared with SPGR-IR.
Conclusion: Compared with SPGR-IR, nonselective SPGRallows for consistent segmentation results for basal gan-glia regions and improved clarity for visualization of thebrain.
Key Words: segmentation; visualization; subcorticalbrain; high resolution MRI; isotropic MRIJ. Magn. Reson. Imaging 2010;31:980–986.VC 2010 Wiley-Liss, Inc.
THREE-DIMENSIONAL (3D) high resolution structuralimages have become increasingly imperative for com-puter-assisted postprocessing for brain segmentationand visualization. Segmentation algorithms have beenused to generate volumetric brain measurements forprobing changes associated with neurological disor-ders in vivo. Segmentation-derived hippocampal vol-ume measurements have shown promise for early di-agnosis of Alzheimer’s disease (1,2). Subcorticalatrophy in diagnostic and prediagnostic Huntington’sdisease have shown in segmentation results (3). More-over, 3D brain rendering allows for visualization offMRI activation maps and provides critical guidancefor neurosurgery (4).
To obtain high resolution structural images for ei-ther brain segmentation or visualization, typically aT1-weighted 3D inversion recovery-prepared spoiledgradient-echo (SPGR-IR) is used (e.g., SPGR-IR GEHealthcare, Milwaukee, WI or MP-RAGE, SiemensMedical systems, Erlangen, Germany). Normally, theanisotropic resolution prescribed with the through-plane resolution (1–1.2 mm) exceeds the in-plane re-solution (e.g., 0.9375 � 0.9375 mm3) such as in thewidely adapted Alzheimer’s Disease Neuroimaging Ini-tiative (ADNI) protocol (5,6). Higher isotropic resolu-tion could theoretically reduce partial volume arti-facts, affording better precision/accuracy in derivingvolumetric measurements and reducing systematicerrors in registration (7). This is beneficial for detect-ing atrophic changes in small, anatomically eloquentsubcortical brain structures (e.g., hippocampus) andfor serial imaging studies (8,9).
An alternate approach for acquisition of high reso-lution structural images has been reported that usesa nonselective minimum phase hard pulse, whicheliminates inversion recovery (10). This approachallows for isotropic, sub-millimeter resolution of thewhole brain within 5 min. This is considerably shorterthan the 7–10 min typically required with SPGR-IR. Ithas been suggested that the relative slice thickness
1Radiology, Northshore University HealthSystem, Evanston, Illinois,USA.2Radiology, Pritzker School of Medicine, The University of Chicago,Chicago, Illinois, USA.3Radiology, Feinberg School of Medicine, Northwestern University,Chicago, Illinois, USA.4Center on Outcomes, Research and Education, Northshore UniversityHealthSystem Research Institute, Evanston, Illinois, USA.
Contract grant sponsor: NorthShore Clinical Collaborative Program;Contract grant numbers: EH08-125, ISOA-271222; Contract grantsponsor: NIH; Contract grant number: 1R01MH080636-01A2.
*Address reprint requests to: Y.W., Center for Advanced Imaging, Ra-diology Department, Northshore University HealthSystem, PritzkerSchool of Medicine, The University of Chicago, 2650 Ridge Avenue,Walgreen G555, Evanston, IL 60201. E-mail: [email protected]
Received August 25, 2009; Accepted January 7, 2010.
DOI 10.1002/jmri.22120Published online in Wiley InterScience (www.interscience.wiley.com).
JOURNAL OF MAGNETIC RESONANCE IMAGING 31:980–986 (2010)
VC 2010 Wiley-Liss, Inc. 980
that can be obtained with SPGR-IR within reasonablescan times could also be reduced with the nonselec-tive SPGR (10). In this investigation, nonselectiveSPGR was further evaluated, with particular focus onthe utility for brain visualization and segmentation ofsubcortical regions.
In this investigation, nonselective SPGR was comparedwith the more commonly used SPGR-IR for brain seg-mentation and visualization. For the purpose of this com-parison, SPGR-IR was also acquired with sub-millimeter,isotropic resolution, identical to that of the nonselectiveSPGR sequence. Localized apparent SNR and CNR valuesfor the two sequences were compared in brain regions ofinterest in hippocampus and basal ganglia. To furtherevaluate the nonselective SPGR sequence for derivationof volumetric measurements, images acquired with thetwo different sequences were also submitted to segmenta-tion algorithms. FAST (FMRIB’s Automated SegmentationTool) (Analysis Group, FMRIB, Oxford, UK.) was used tosegment the brain into constituent tissue classes (whitematter, gray matter, CSF) (11). FreeSurfer (Martinos Cen-ter for Biomedical Imaging, MA) was used to segment spe-cific subcortical structures (hippocampus, caudate,putamen and thalamus) (12). Visualization results forboth sequences are presented.
MATERIALS AND METHODS
Image Acquisition
Whole brain images of nine healthy subjects (sevenmales, two females; mean age, 41.7 years; age range,17–56 years) were obtained using an 8-channel phasedarray coil (MRI Devices, Gainesville, FL) on a 3 Tesla (T)General Electric (Waukesha, WI) HDx system. Two 3Dimage acquisitions, nonselective SPGR and SPGR-IRwere performed on each subject. Standard SPGR-IR andSPGR sequences were used (13). To obtain nonselectiveSPGR, a spatially nonselective (‘‘hard’’) excitation wasapplied using an 800-ms RF pulse. Other parametersincluded repetition time (TR): 7.1 ms, echo time (TE): 3.0ms using a full echo readout, 12� flip angle, samplingbandwidth of 31.25 kHz with 320 frequency samples;320 phase-encoding lines, field of view: 22 cm � 18 cm,
and slice thickness: 0.8 mm resulting in an isotropicvoxel volume of 0.8 mm � 0.8 mm � 0.8 mm ¼ 0.51mm3 with 252 contiguous slices covering the wholebrain. Half-Fourier analysis was applied in the phase-encoding direction resulting in scan time of 4 min 42 s.For the purpose of this comparison, SPGR-IR wasacquired with sub-millimeter, isotropic resolution, iden-tical to the nonselective SPGR sequence. Other parame-ters included: TR/TE/inversion time (TI)/bandwidth/flip angle: 7.9 ms/3.2 ms/450/31.25 kHz/12 degrees,also with half-Fourier analysis and 252 contiguous sli-ces covering the whole brain. The scan time for thissequence was 6 min 17 s (approximately 33% longerthan for nonselective SPGR). The study was approved bythe Institutional Review Board.
Image Analysis
Images were transferred offline to a Linux workstationfor post processing. To evaluate the utility of the nonse-lective SPGR relative to the SPGR-IR, for segmentationof subcortical regions, FreeSurfer was implemented tosegment hippocampus, caudate, putamen, and thala-mus. Another widely used segmentation algorithm,FAST, was used for global tissue segmentation to clas-sify brain into gray matter, white matter and CSF. Vol-view 2.0 (Kitware, NY) was used for 3D volume render-ing to examine the quality of images generated withnonselective SPGR versus the SPGR-IR (14). A two-steppreprocessing including BET-premask and BET wereexecuted to automatically remove skull and extracra-nial tissues (15,16) before FAST segmentation, andbefore generating the 3D volume rendering.
Quantitative Analyses
Segmentation generated with FreeSurfer was used toderive volumes of four subcortical brain structuresincluding hippocampus, caudate, putamen, and thal-amus. The segmentated brain structural masks gen-erated with FreeSurfer were also used to derive vol-umes of interest (VOIs) for image quality assessmentas follows: The segmentation masks were first regis-tered to original gray scale images. After realignment,
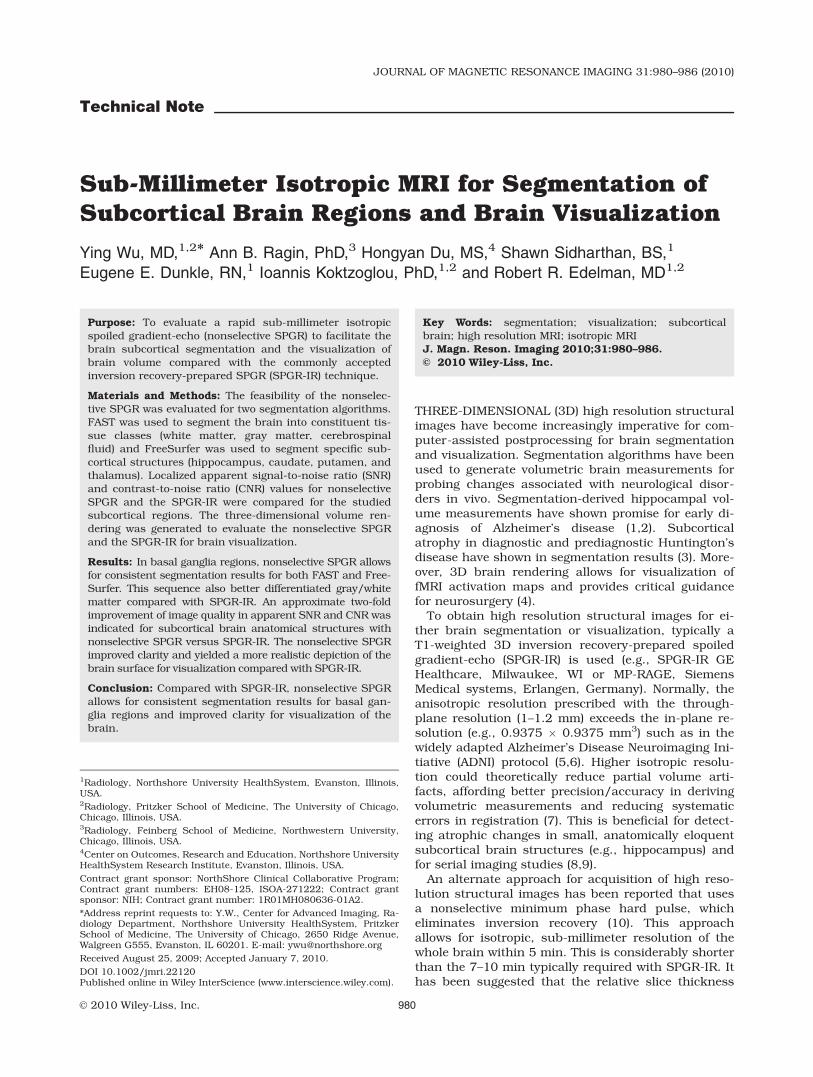
Table 1
Comparison of the Mean of nonselective SPGR and SPGR-IR
Left Right
Nonselective
SPGR SPGR-IR
Nonselective
SPGR SPGR-IR
Region Mean SD Mean SD Mean SD Mean SD
Apparent SNR Hippocampus 38.45\\\ 4.49 22.77 3.69 38.22\\\ 4.82 23.87 3.66
Caudate 43.54\\\ 4.93 23.98 3.39 46.57\\\ 5.77 22.27 3.18
Putamen 45.41\\\ 5.12 25.40 3.55 46.27\\\ 5.57 25.29 4.09
Thalamus 46.08\\\ 5.70 29.02 4.39 45.99\\\ 6.04 29.04 4.40
White matter 59.74\\\ 6.06 31.12 4.10 59.89\\\ 6.96 32.30 4.35
Apparent CNR Hippocampus 21.29\\\ 3.28 8.35 1.44 21.67\\\ 2.70 8.43 1.19
Caudate 16.2\\\ 2.02 7.15 0.84 13.33\\ 1.75 10.02 1.54
Putamen 14.33\\\ 1.35 5.72 1.10 13.62\\\ 1.98 7.01 1.08
Thalamus 13.66\\\ 1.18 2.10 1.03 13.9\\\ 1.38 3.26 0.97\\\p <0.0001; \\p < 0.001.
Segmentation and Visualization: MRI 981
segmented masks were refined with 1 pixel erosion toeliminate possible partial volume artifacts and align-ment error at edges. The mean signal intensity (SI)was then calculated for each of the studied subcorti-cal brain structures by averaging the signal intensityof the voxels extracted from the original gray scaleimages based on the segmentation defined VOIs. It isdifficult to perform exact SNR measurement in thesetting of parallel imaging because noise is spatiallyheterogeneous and accurate estimation requires care-ful postprocessing of the acquired complex k-spacedata. Apparent SNR estimates were calculated usingsignal measurements from similarly positionedregions, to eliminate any potential bias across sequen-ces. Apparent signal-to-noise ratio (apparent SNR)and apparent gray matter-white matter contrast-to-noise ratio (apparent CNR) were determined accordingto standard equations: apparent SNR ¼ Mean SI/SDnoise and apparent CNR ¼ (Mean SIwm - Mean SIgm)/SD noise (where SDnoise indicates standard deviation(SD) of noise in the air along the phase-encodingdirection in extra-cranial space). The mean SIgm wascalculated for each of the bilateral subcortical graymatter regions (hippocampus, caudate, putamen, andthalamus). The mean SIwm were derived using whitematter masks generated from the automated segmen-tation, the average signal was calculated for bilateralhemispheric white matter regions.
Statistical Methods
Primary variables for analysis included the meanapparent SNR and CNR for each subcortical region for
the different sequences. Statistical methods includedrepeated measures analysis of variance, t-tests, andsummary statistics. Intraclass correlation coefficients(ICC) were used to examine agreement between volu-metric measurements derived with nonselective SPGRand SPGR-IR. All statistical tests were 2-tailed andwere executed in SAS 9.1 using a significance level of0.05.
RESULTS
Quantitative Evaluation
Means and standard deviations for apparent SNR andCNR values are presented in Table 1. Significantlyhigher values, indicative of greater image quality,were observed for the nonselective SPGR in all regionsexamined, including hippocampus (left (L): 38.5 ver-sus 22.8; right (R): 38.2 versus 23.9), caudate (L:43.5 versus 24.0; R: 46.6 versus 22.3), putamen (L:45.4 versus 25.4; R: 46.3 versus 25.3), and thalamus(L: 46.1 versus 29.0; R: 46.0 versus 29.0), all P <0.0001. A similar pattern was indicated for apparentCNR in all regions examined. Significantly higher val-ues with P < 0.001 were obtained for nonselectiveSPGR in hippocampus (L: 21.3 versus 8.3; R: 21.7versus 8.4), caudate (L: 16.2 versus 7.1; R: 13.3 ver-sus 10.0), putamen (L: 14.3 versus 5.7; R: 13.6 ver-sus 7.0), and thalamus (L: 13.7 versus 2.1; R: 13.9versus 3.3).
Volumetric measurements derived with FreeSurferbased on nonselective SPGR showed a high degree ofagreement with measurements based on SPGR-IR,with intraclass correlation coefficients (ICCs) rangingfrom 0.89 to 0.98 for the subcortical regions of inter-est. ICC values greater than 0.7 are generally consid-ered to represent a high degree of correlation. Table 2presents the mean volume difference between nonse-lective SPGR and SPGR-IR by location with 95% confi-dence limits and the ICC.
Visual Inspection of Segmentation Results
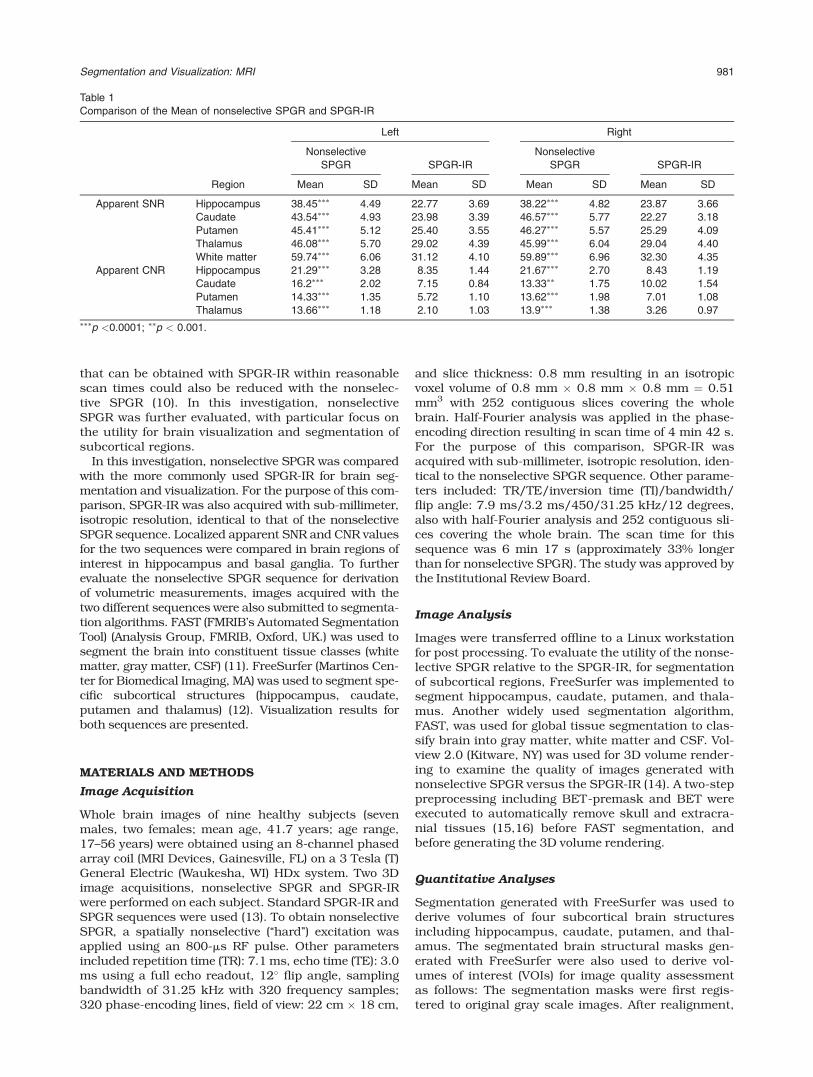
FreeSurfer segmentation: Compared with SPGR-IR,nonselective SPGR produced more precise segmenta-tion results for subcortical regions and generatedmore clearly defined boundaries at caudate nucleiand thalamus (Fig. 1, left). SPGR-IR segmentation
Table 2
Volume Difference (Nonselective SPGR versus SPGR-IR) by
FreeSurfer Segmentation*
Location Mean diff. 95% CL ICC
Left caudate �410.1 �696.2, �124.1 0.90
Left hippocampus �281.3 �407.9, �154.6 0.96
Left putamen �413.6 �645.8, �181.5 0.97
Left thalamus proper �870.5 �1158, �582.8 0.98
Right caudate 137.9 �68.36, 344.11 0.94
Right hippocampus �42.0 �250.1, 166.14 0.89
Right putamen �365.1 �666.2, �64.1 0.96
Right thalamus proper �1488.0 �1737, �1240 0.97
Diff. ¼ difference; CL ¼ confidence limits; ICC ¼ intraclass correla-
tion coefficient.
Figure 1. Segmentation results of nonselective SPGR (left) and SPGR-IR (right) using the automated segmentation programFreeSurfer. Nonselective SPGR produced clearer results than did SPGR-IR. In the SPGR-IR image, lesion misclassifications(small arrows) and misclassifications at caudate and putamen borders (arrow heads) can be observed (black arrowheads),and in addition, cortical gray matter misclassifications (white arrow) are seen.
982 Wu et al.
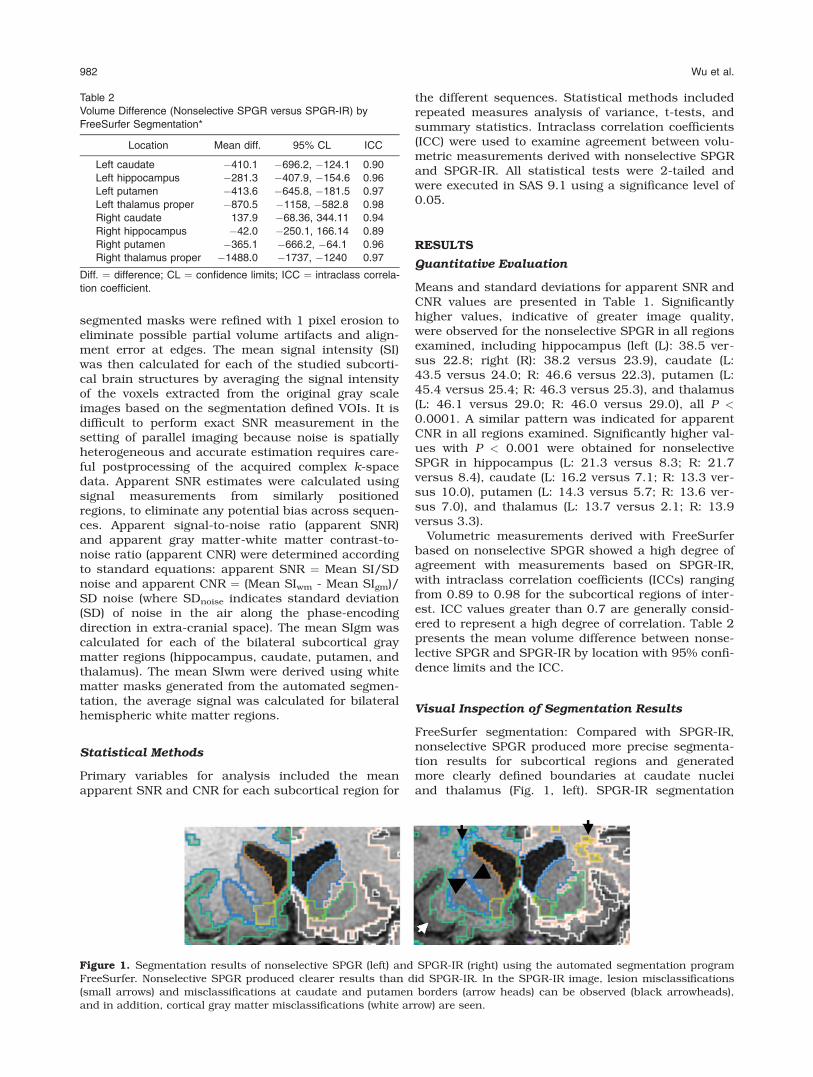
was associated with misclassifications at the edges ofcaudate and putamen (Fig. 1, right, arrow heads) andmisclassifications of lesions in normal white matterareas (Fig. 1, right, small arrows). For the hippocam-pus, comparable segmentation results were observedfor both SPGR methods (Fig. 2).
FAST Segmentation
Segmentation based on nonselective SPGR generatedbetter-defined basal ganglia structures compared withSPGR-IR. The segmented putamen and caudate nuclei
on nonselective SPGR images represented the originalgray scale structural image accurately (Fig. 3a1 and3a2). Nonselective SPGR yielded more distinct borderlines between gray matter (caudate nucleus, thalamusand putamen) and white matter (internal capsule,external capsule) tissues. Moreover, only segmenta-tion based on the nonselective SPGR sequencedepicted claustrum, a thin layer of gray matterbetween the extreme capsule and external capsule inthe brain (Fig. 3a3). FAST segmentation based onSPGR-IR failed to segment basal ganglia structures(particularly at the putamen and caudate) with
Figure 2. The results of the FreeSurfer segmentation based on Nonselective SPGR (upper) and SPGR-IR (lower). The segmen-tation performances for hippocampus (arrows) are comparable.
Figure 3. Segmentation withFAST using nonselective SPGR(a1) and SPGR-IR. Represen-tative regions magnified toillustrate details (a3 and a3,respectively). NonselectiveSPGR segmentation (upper)delineates caudate (longarrow), putamen (short arrow),as well as the more diminutiveclaustrum (hollow arrow).Caudate and putamen aremissing in the segmentationbased on SPGR-IR (b2-b3).
Segmentation and Visualization: MRI 983
misclassification of the two gray matter masses aswhite matter (Fig. 3b1–3).
Volume Rendering
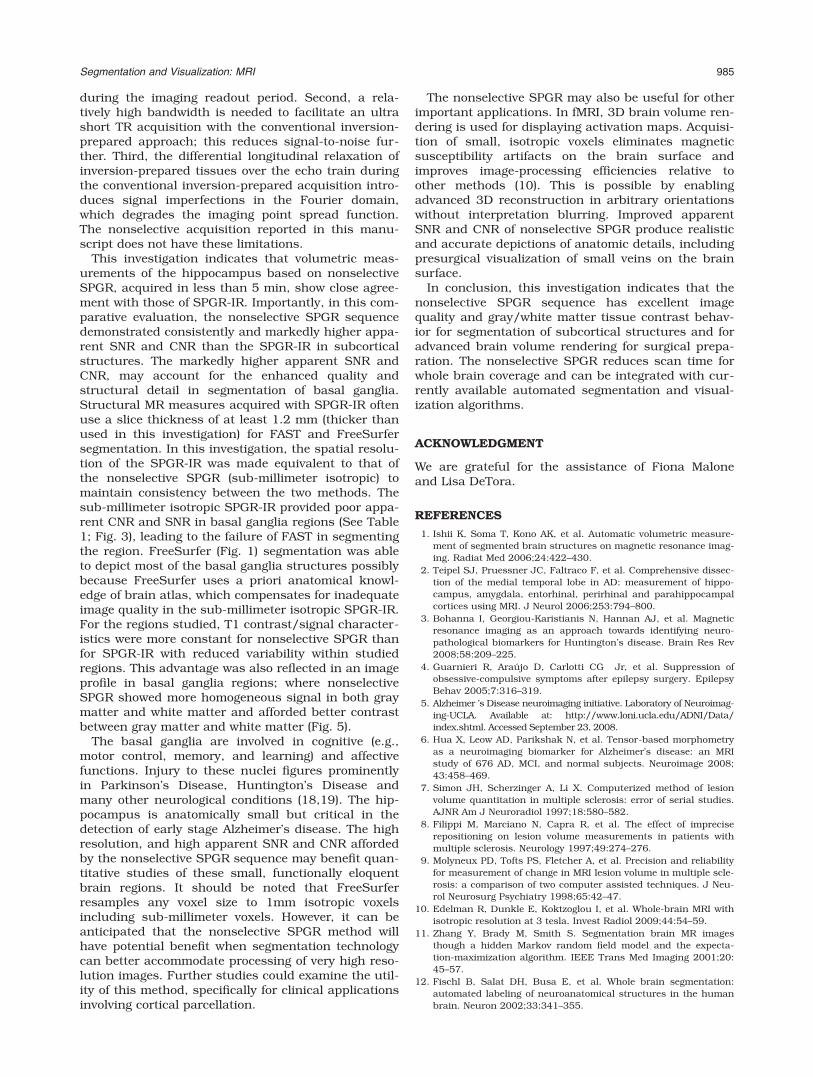
Compared with volume rendering derived by means ofSPGR-IR, the conspicuity of brain structures is sub-
stantially improved when nonselective SPGR is used(Fig. 4). The 3D volume rendering based on the nonse-lective SPGR showed realistic brain anatomy; the gyri,sulci, and small veins are clearly represented, smoothand without distortion. Structural details are lessprominent in the SPGR-IR rendering, in which manyblurred areas obscure anatomical structures.
DISCUSSION
Brain segmentation is becoming increasingly impor-tant as a research and clinical diagnostic tool. Thisapproach is the basis for tissue type extraction inquantitative image analysis and also for deriving volu-metric measurements of atrophy in neurological dis-orders such as Alzheimer’s disease (17). Generally,segmentation of subcortical brain structures relies onSPGR-IR, a method that produces reliable and rea-sonably clear images in approximately 7–10 min.However, inversion prepared acquisition has severaldetrimental features. First, the inversion pulsereduces the longitudinal magnetization of brain mat-ter, which serves to reduce the signal-to-noise ratio
Figure 4. The 3D volume rendering of brain generated fornonselective SPGR (left) and SPGR-IR with isotropic sub-millimeter. Anatomical details are best illustrated by nonse-lective SPGR compared with standard SPGR-IR sequences.Note even small veins on the brain surface are well-repre-sented with nonselective SPGR. Blurring of brain gyri andsulci are evident for the SPGR-IR sequences.
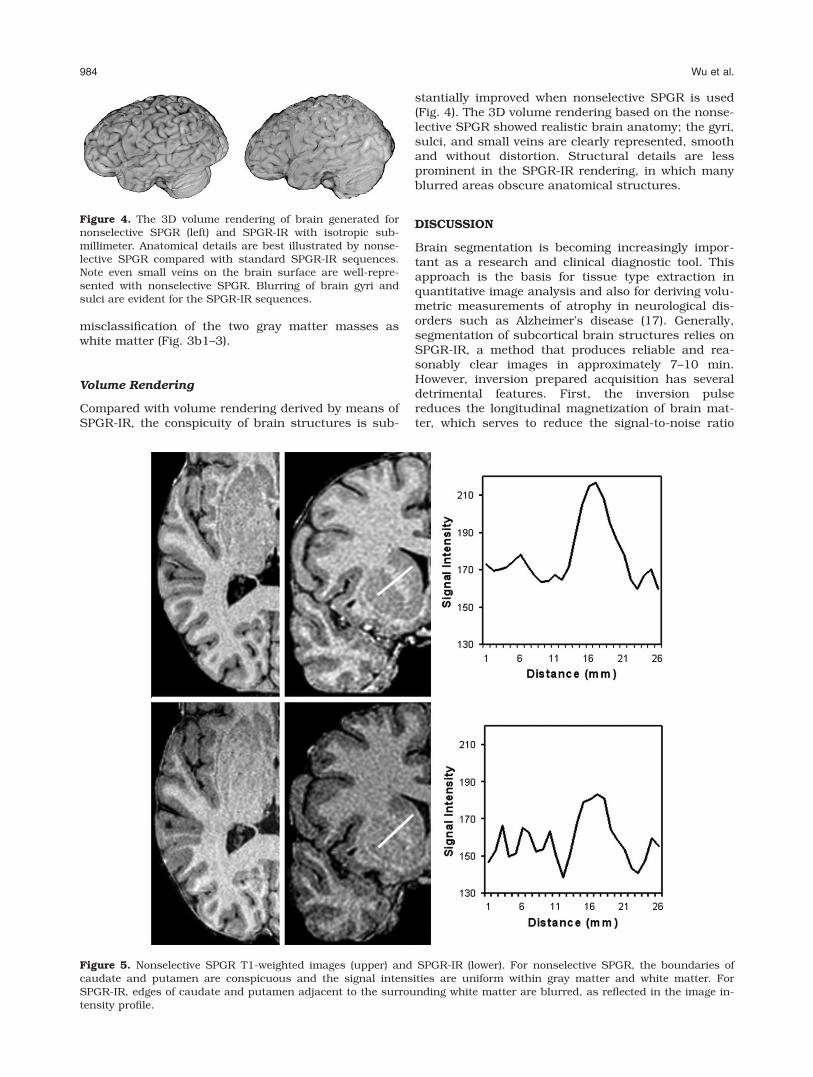
Figure 5. Nonselective SPGR T1-weighted images (upper) and SPGR-IR (lower). For nonselective SPGR, the boundaries ofcaudate and putamen are conspicuous and the signal intensities are uniform within gray matter and white matter. ForSPGR-IR, edges of caudate and putamen adjacent to the surrounding white matter are blurred, as reflected in the image in-tensity profile.
984 Wu et al.
during the imaging readout period. Second, a rela-tively high bandwidth is needed to facilitate an ultrashort TR acquisition with the conventional inversion-prepared approach; this reduces signal-to-noise fur-ther. Third, the differential longitudinal relaxation ofinversion-prepared tissues over the echo train duringthe conventional inversion-prepared acquisition intro-duces signal imperfections in the Fourier domain,which degrades the imaging point spread function.The nonselective acquisition reported in this manu-script does not have these limitations.
This investigation indicates that volumetric meas-urements of the hippocampus based on nonselectiveSPGR, acquired in less than 5 min, show close agree-ment with those of SPGR-IR. Importantly, in this com-parative evaluation, the nonselective SPGR sequencedemonstrated consistently and markedly higher appa-rent SNR and CNR than the SPGR-IR in subcorticalstructures. The markedly higher apparent SNR andCNR, may account for the enhanced quality andstructural detail in segmentation of basal ganglia.Structural MR measures acquired with SPGR-IR oftenuse a slice thickness of at least 1.2 mm (thicker thanused in this investigation) for FAST and FreeSurfersegmentation. In this investigation, the spatial resolu-tion of the SPGR-IR was made equivalent to that ofthe nonselective SPGR (sub-millimeter isotropic) tomaintain consistency between the two methods. Thesub-millimeter isotropic SPGR-IR provided poor appa-rent CNR and SNR in basal ganglia regions (See Table1; Fig. 3), leading to the failure of FAST in segmentingthe region. FreeSurfer (Fig. 1) segmentation was ableto depict most of the basal ganglia structures possiblybecause FreeSurfer uses a priori anatomical knowl-edge of brain atlas, which compensates for inadequateimage quality in the sub-millimeter isotropic SPGR-IR.For the regions studied, T1 contrast/signal character-istics were more constant for nonselective SPGR thanfor SPGR-IR with reduced variability within studiedregions. This advantage was also reflected in an imageprofile in basal ganglia regions; where nonselectiveSPGR showed more homogeneous signal in both graymatter and white matter and afforded better contrastbetween gray matter and white matter (Fig. 5).
The basal ganglia are involved in cognitive (e.g.,motor control, memory, and learning) and affectivefunctions. Injury to these nuclei figures prominentlyin Parkinson’s Disease, Huntington’s Disease andmany other neurological conditions (18,19). The hip-pocampus is anatomically small but critical in thedetection of early stage Alzheimer’s disease. The highresolution, and high apparent SNR and CNR affordedby the nonselective SPGR sequence may benefit quan-titative studies of these small, functionally eloquentbrain regions. It should be noted that FreeSurferresamples any voxel size to 1mm isotropic voxelsincluding sub-millimeter voxels. However, it can beanticipated that the nonselective SPGR method willhave potential benefit when segmentation technologycan better accommodate processing of very high reso-lution images. Further studies could examine the util-ity of this method, specifically for clinical applicationsinvolving cortical parcellation.
The nonselective SPGR may also be useful for otherimportant applications. In fMRI, 3D brain volume ren-dering is used for displaying activation maps. Acquisi-tion of small, isotropic voxels eliminates magneticsusceptibility artifacts on the brain surface andimproves image-processing efficiencies relative toother methods (10). This is possible by enablingadvanced 3D reconstruction in arbitrary orientationswithout interpretation blurring. Improved apparentSNR and CNR of nonselective SPGR produce realisticand accurate depictions of anatomic details, includingpresurgical visualization of small veins on the brainsurface.
In conclusion, this investigation indicates that thenonselective SPGR sequence has excellent imagequality and gray/white matter tissue contrast behav-ior for segmentation of subcortical structures and foradvanced brain volume rendering for surgical prepa-ration. The nonselective SPGR reduces scan time forwhole brain coverage and can be integrated with cur-rently available automated segmentation and visual-ization algorithms.
ACKNOWLEDGMENT
We are grateful for the assistance of Fiona Maloneand Lisa DeTora.
REFERENCES
1. Ishii K, Soma T, Kono AK, et al. Automatic volumetric measure-ment of segmented brain structures on magnetic resonance imag-ing. Radiat Med 2006;24:422–430.
2. Teipel SJ, Pruessner JC, Faltraco F, et al. Comprehensive dissec-tion of the medial temporal lobe in AD: measurement of hippo-campus, amygdala, entorhinal, perirhinal and parahippocampalcortices using MRI. J Neurol 2006;253:794–800.
3. Bohanna I, Georgiou-Karistianis N, Hannan AJ, et al. Magneticresonance imaging as an approach towards identifying neuro-pathological biomarkers for Huntington’s disease. Brain Res Rev2008;58:209–225.
4. Guarnieri R, Araujo D, Carlotti CG Jr, et al. Suppression ofobsessive-compulsive symptoms after epilepsy surgery. EpilepsyBehav 2005;7:316–319.
5. Alzheimer ’s Disease neuroimaging initiative. Laboratory of Neuroimag-ing-UCLA. Available at: http://www.loni.ucla.edu/ADNI/Data/index.shtml. Accessed September 23, 2008.
6. Hua X, Leow AD, Parikshak N, et al. Tensor-based morphometryas a neuroimaging biomarker for Alzheimer’s disease: an MRIstudy of 676 AD, MCI, and normal subjects. Neuroimage 2008;43:458–469.
7. Simon JH, Scherzinger A, Li X. Computerized method of lesionvolume quantitation in multiple sclerosis: error of serial studies.AJNR Am J Neuroradiol 1997;18:580–582.
8. Filippi M, Marciano N, Capra R, et al. The effect of impreciserepositioning on lesion volume measurements in patients withmultiple sclerosis. Neurology 1997;49:274–276.
9. Molyneux PD, Tofts PS, Fletcher A, et al. Precision and reliabilityfor measurement of change in MRI lesion volume in multiple scle-rosis: a comparison of two computer assisted techniques. J Neu-rol Neurosurg Psychiatry 1998;65:42–47.
10. Edelman R, Dunkle E, Koktzoglou I, et al. Whole-brain MRI withisotropic resolution at 3 tesla. Invest Radiol 2009;44:54–59.
11. Zhang Y, Brady M, Smith S. Segmentation brain MR imagesthough a hidden Markov random field model and the expecta-tion-maximization algorithm. IEEE Trans Med Imaging 2001;20:45–57.
12. Fischl B, Salat DH, Busa E, et al. Whole brain segmentation:automated labeling of neuroanatomical structures in the humanbrain. Neuron 2002;33:341–355.
Segmentation and Visualization: MRI 985

13. Hashemi RH, Bradley WG, Lisanti CJ. MRI: the basics. 1st edi-tion. Philadelphia, PA: Lippincott Williams and Wilkins; 2004. p253–259.
14. Martin K, Ibanez L, Avila L, et al. Integrating segmentation meth-ods from the Insight Toolkit into a visualization application. MedImage Anal 2005;9:579–593.
15. Smith SM. Fast robust automated brain extraction. Hum BrainMapp 2002;17:143–155.
16. Jenkinson M, Pechaud M, Smith S. BET2: MR-based estimationof brain, skull and scalp surfaces. In: Proceedings of the 11th An-
nual Meeting of the Organization for Human Brain Mapping, To-ronto, Canada, 2005.
17. St. George-Hyslops PH, Morris JC. Will anti-amyloid therapieswork for Alzheimer’s disease? Lancet 2008;372:216–223.
18. Aylward EH, Henderer JD, McArthur JC, et al. Reducedbasal ganglia volume in HIV-1 associated dementia: resultsfrom quantitative neuroimaging. Neurology 1993;43:2099–2104.
19. Aylward EH, Codori AM, Barta PE, et al. Basal ganglia volumeand proximity to onset in presymptomatic Huntington’s disease.Arch Neurol 1996;53:1293–1296.
986 Wu et al.

![Subcortical heterotopic gray matter brain malformationstheir normal position in the cortex (heterotopic gray matter brain malformations [HET]). The most commonly encoun-tered heterotopia](https://img.pdfslide.net/doc/110x75/5e479a488e3f397a933aa426/subcortical-heterotopic-gray-matter-brain-malformations-their-normal-position-in.jpg)


![Subcortical heterotopic gray matter brain malformations · 9/4/2019 · their normal position in the cortex (heterotopic gray matter brain malformations [HET]). The most commonly](https://img.pdfslide.net/doc/110x75/5f54a095a83d0853e24ffdc0/subcortical-heterotopic-gray-matter-brain-malformations-942019-their-normal.jpg)