Embed Size (px)
Citation preview
Sub-Module Integrated Distributed Maximum Power Point
Tracking for Solar Photovoltaic Applications
Robert C.N. Pilawa-PodgurskiUNIVERSITY OF ILLINOIS AT URBANA-CHAMPAIGN
URBANA, ILLINOIS
EMAIL: [email protected]
David J. PerreaultMASSACHUSETTS INSTITUTE OF TECHNOLOGY
CAMBRIDGE, MASSACHUSETTS
Abstract—This paper explores the benefits of distributed powerelectronics in solar photovoltaic applications through the use ofsub-module integrated maximum power point trackers (MPPT).We propose a system architecture that provides a substantialincrease in captured energy during partial shading conditions,while at the same time enabling significant overall cost reductions.This is achieved through direct integration of miniature MPPTpower converters into existing junction boxes. We describethe design and implementation of a high-efficiency (>98%)synchronous buck MPPT converter, along with digital controltechniques that ensure both local and global maximum powerextraction. Through detailed experimental measurements underreal-world conditions, we verify the increase in energy captureand quantify the benefits of the architecture.
I. INTRODUCTION
With rising world-wide energy demands and soaring prices
of fossil fuels, interest in renewable energy sources has in-
creased. Among these, solar photovoltaic (PV) energy has seen
a rapid growth in the last few years, resulting in decreased
prices of PV modules as production capacity increases at a
fast pace. As PV module prices decrease, the cost of the
power electronics required to extract the maximum power
from the PV modules and to interface the PV system to the
grid is becoming a larger part of the overall system cost [1].
Much attention has therefore been given to the development
of power electronics that enable a cost reduction of the overall
system. In addition, much research is focused on increasing
the efficiency of the power processing stage, as well as on
improving the power yield of the overall system [2], [3].
Many PV installations suffer from current mismatch be-
tween different modules, due to non-uniform shading of the
array, dirt accumulation, or manufacturing variability. Ensuring
uniform illumination is particularly challenging in residential
PV applications, where large current mismatch can be present
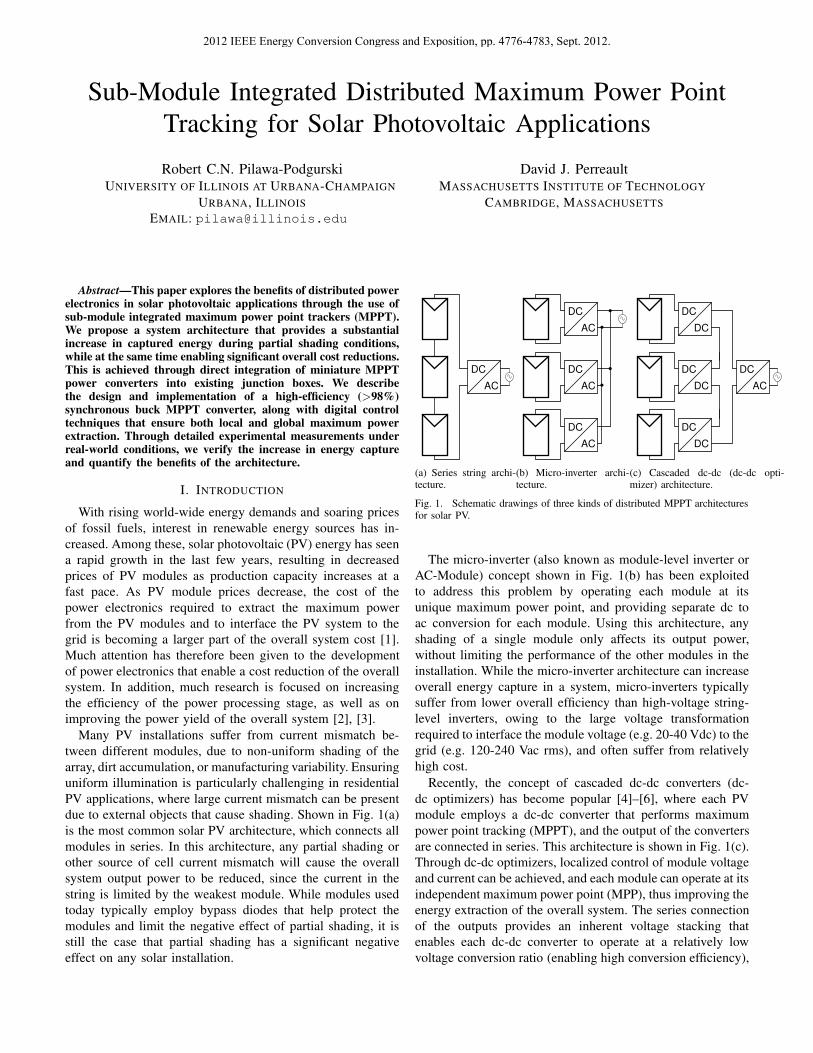
due to external objects that cause shading. Shown in Fig. 1(a)
is the most common solar PV architecture, which connects all
modules in series. In this architecture, any partial shading or
other source of cell current mismatch will cause the overall
system output power to be reduced, since the current in the
string is limited by the weakest module. While modules used
today typically employ bypass diodes that help protect the
modules and limit the negative effect of partial shading, it is
still the case that partial shading has a significant negative
effect on any solar installation.
DC
AC
(a) Series string archi-tecture.
DC
AC
DC
AC
DC
AC
(b) Micro-inverter archi-tecture.
DC
DC
DC
DC
DC
DC
DC
AC
(c) Cascaded dc-dc (dc-dc opti-mizer) architecture.
Fig. 1. Schematic drawings of three kinds of distributed MPPT architecturesfor solar PV.
The micro-inverter (also known as module-level inverter or
AC-Module) concept shown in Fig. 1(b) has been exploited
to address this problem by operating each module at its
unique maximum power point, and providing separate dc to
ac conversion for each module. Using this architecture, any
shading of a single module only affects its output power,
without limiting the performance of the other modules in the
installation. While the micro-inverter architecture can increase
overall energy capture in a system, micro-inverters typically
suffer from lower overall efficiency than high-voltage string-
level inverters, owing to the large voltage transformation
required to interface the module voltage (e.g. 20-40 Vdc) to the
grid (e.g. 120-240 Vac rms), and often suffer from relatively
high cost.
Recently, the concept of cascaded dc-dc converters (dc-
dc optimizers) has become popular [4]–[6], where each PV
module employs a dc-dc converter that performs maximum
power point tracking (MPPT), and the output of the converters
are connected in series. This architecture is shown in Fig. 1(c).
Through dc-dc optimizers, localized control of module voltage
and current can be achieved, and each module can operate at its
independent maximum power point (MPP), thus improving the
energy extraction of the overall system. The series connection
of the outputs provides an inherent voltage stacking that
enables each dc-dc converter to operate at a relatively low
voltage conversion ratio (enabling high conversion efficiency),
2012 IEEE Energy Conversion Congress and Exposition, pp. 4776-4783, Sept. 2012.
while still achieving high overall output voltage, which is
desirable as it enables the use of a central, high-voltage, high-
efficiency inverter.
To date, however, the promise of dc-dc optimizers has
not been fully realized, primarily due to the difficulty of
simultaneously achieving high conversion efficiency and low
cost of the power electronics. Low dc-dc conversion efficiency
can easily negate any increase in energy capture that is offered
by more localized (module-level) control, and must therefore
be addressed. It should be mentioned that it is not merely the
efficiency of the power electronics that must be addressed, but
also how much of the available power that is extracted. Some
circuit architectures, such as switched capacitor circuits [7],
[8] provide very high efficiency and density, but cannot oper-
ate efficiently at arbitrary conversion ratios, thereby limiting
maximum energy extraction. A goal is thus to achieve very
high conversion efficiency in the power electronics, as well as
high tracking efficiency (a measure of how close to the true
MPP the module is operated).
Furthermore, a solution that increases total energy capture
by a few percent, but which also increases the overall cost
by more than the monetary value of the increased power
(as compared to the installed system cost) will likely fail in
the marketplace. In this paper, we present a dc-dc optimizer
system that achieves both low cost and high conversion
efficiency, while at the same time capturing substantially more
energy than dc-dc optimizer architectures presented to date. In
addition, detailed field experiments are presented that illustrate
the benefits of our architecture under real-world partial shading
conditions.
This paper is organized as follows: Our proposed sys-
tem is presented in Section II, and Section III provides
implementation details of the power converter designed for
our architecture. The control implementation is discussed in
Section IV, and experimental results and analysis are provided
in Section V. A quantitative comparison to previous work is
presented in Section VI, where we also introduce a Figure-of-
Merit that incorporates cost, efficiency, and increase in energy
capture. Finally, Section VII concludes the paper.
II. PROPOSED ARCHITECTURE
Dc-dc optimizer systems can be implemented with many
different circuit topologies. Previous work at the module-level
has employed boost converters [5] and non-inverting buck-
boost converters [6]. While boost converters are an attractive
option because of their ability to increase the output voltage
(requiring fewer modules for a given desired output voltage),
their chief disadvantage is their limited operating range. As
discussed in [5], since the output current of a boost converter
can never be higher than its input current, the range over
which current mismatch can be addressed is severely limited.
The non-inverting buck-boost converter is employed in [6],
and can provide an output current that is both higher and
lower than the input current, thus providing both a voltage
increase and the ability to handle shaded modules (although
within a limited range, since each converter only operates in
buck or boost mode at a given time). The chief disadvantages
of the non-inverting buck-boost topology are the increased
number of transistors and the achievable conversion efficiency,
which is typically lower than buck or boost converters for the
same switch rating. A more detailed performance analysis of
a number of potential power converter topologies for dc-dc
optimizers can be found in [9].
In this work, we implement the dc-dc optimizer system
using synchronous buck converters. While the synchronous
buck topology enables both high switching frequency (im-
portant for small size and low cost) and high efficiency, it
does not contribute any voltage gain (which would reduce
the number of modules that must be series connected). In
most residential and utility-based installations, however, there
are a sufficient number of PV modules to provide for the
inherent stacking of voltages without requiring additional step-
up from the power converter. When not tasked with providing
additional voltage step-up, the power stage can be optimized
for size, cost, and efficiency. As our experimental results
indicate, the synchronous buck converter topology offers size,
cost, and efficiency benefits, and the system can be operated
in a manner where the control implementation is relatively
simple. Meanwhile, the string current can be kept sufficiently
low so that the added wiring conduction losses are kept to a
minimum.
In order to increase the overall system energy capture, our
design employs sub-module distributed MPPTs, as shown in
Fig. 21. Using this architecture, mismatch between different
sub-modules within the same module can be mitigated, which
yields an increase in energy capture compared to module-level
MPPTs. Furthermore, each MPPT in Fig. 2 only sees a third
of the module voltage, and can thus be designed using compo-
nents with lower voltage rating than module-level MPPTs. The
use of low-voltage power MOSFETs with their small parasitics
in turn enables an increase in achievable switching frequency,
which enables reduced passive component size and cost. As
will be shown in Section III, it is even possible to miniaturize
the MPPTs to the point where they can fit in the existing
standard junction box at the back of the PV module. This
leads to further cost reductions, as a large custom outdoor-
rated enclosure contributes significant cost to a dc-dc optimizer
system.
III. SUB-MODULE DISTRIBUTED MPPT CONVERTER
The inset of Fig. 2 shows a schematic drawing of the
sub-module MPPT system designed as part of this work.
The system comprises a synchronous buck converter power
stage controlled by a microcontroller to achieve local MPP
operation. The microcontroller can sense voltage, and also
employs lossless current sensing [10] for control algorithms
that also require current information. Each converter employs
an isolated I2C communication interface, enabling bidirec-
tional information transfer to a master node, which can be a
1We will refer to all cells in a PV module that are connected to thesame bypass diode as a sub-module. The most common type of PV modulescomprise three sub-modules.
2012 IEEE Energy Conversion Congress and Exposition, pp. 4776-4783, Sept. 2012.
MPPT
MPPT
MPPT
Istring
24 cells
24 cells
24 cells
Vpanel+
Vpanel-
Solar Panel
Microcontroller
gate
drive
VP
VP
VH
VL
VH VLCIN COUT
L
RHT
RHB
RLT
RLBCH CL
RPT
RPBCP
Integrated Power StageVIN VOUT
-
MPPT
Fig. 2. Schematic drawing of the sub-module integrated MPPT system. Acomponent listing is provided in Table I.
TABLE ICOMPONENT LISTING
Device Model Value Manufacturer
Integrated Power Stage FDMF6704A Fairchild
L SER1360-103KL 10 µH Coilcraft
RHT , RLT , RPT 0402 100kΩ Panasonic
RHB , RLB , RPB 0402 10kΩ Panasonic
CH , CL, CP 0402 1 µF Murata
CIN 1206, X5R, 25V 3 x 10 µF Murata
COUT 1206, X5R, 25V 2 x 10 µF Murata
Microcontroller ATtiny861 Atmel
dedicated microcontroller or a computer. It should be noted
that each MPPT can operate without any communication
interface, but the I2C interface is used here to gather diagnostic
data from each converter, and to provide a simple means for
controlling the global output power. Table I provides a listing
of the components used in the design. A complete bill-of-
material and cost analysis can be found in [9].
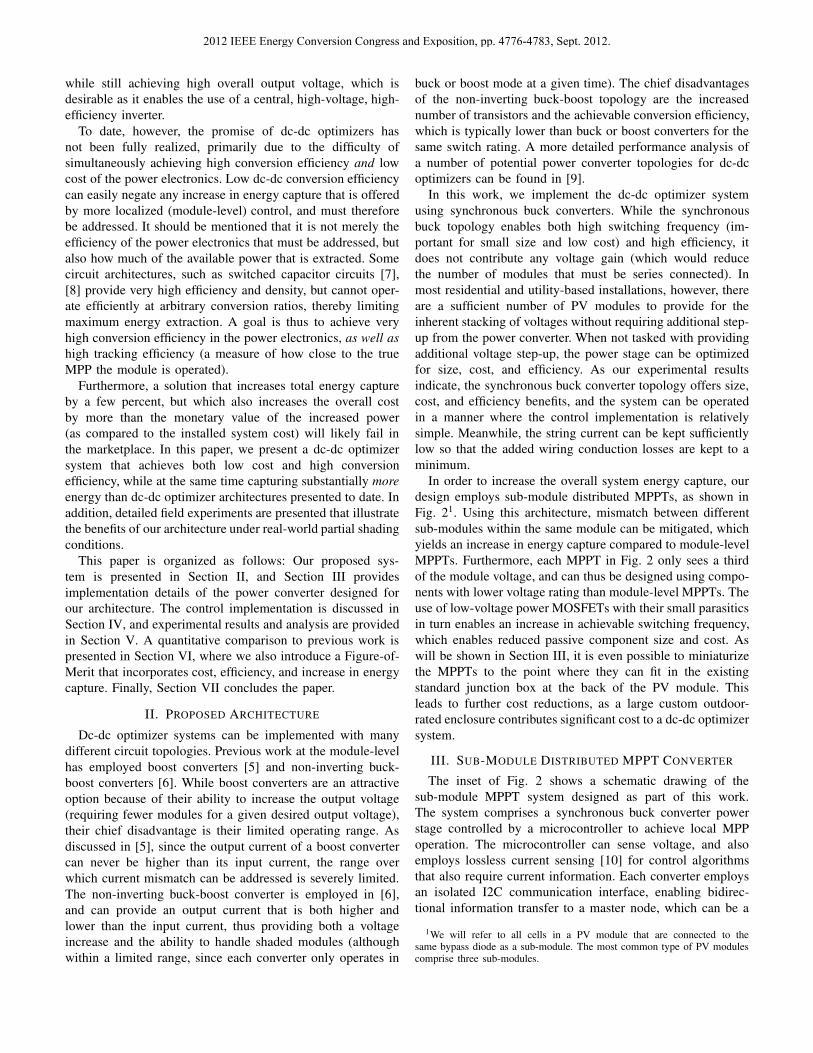
Shown in Fig. 3(a) is a photograph of the complete con-
verter prototype, together with a pencil for scale; the overall
converter “box volume” is 4 cm3. Shown in Fig. 3(b) is
one of the MPPTs placed in a typical solar module junction
box. In a full installation, three converters are used per PV
module, one in parallel with each bypass diode. It is evident
from the photograph that three converters fit in the junction
box, with plenty of space for connectors and sufficient air
flow for passive cooling. A goal of the power stage design
was to achieve a small enough converter footprint to fit into
the junction box on the back of off-the-shelf PV modules.
By utilizing the existing weather-resistant junction box as
an enclosure, significant cost savings can be realized. The
Integrated Power Stage is a combined gate-drive and power
MOSFET chip (FDMF6704A), which also incorporates a 5
V linear regulator, enabling the converter to be completely
powered from the sub-module cell stack.
In order for the sub-module distributed MPPT architecture
of Fig. 2 to be effective, it is important that the additional
(a) Photograph of the sub-module MPPT converter,with a pencil shown forscale. The power inductor ison the bottom side of thePCB.
(b) Photograph showing the sub-moduleMPPT together with a solar modulejunction box. The three bypass diodesare also visible; an MPPT converters isplaced in parallel with each diode.
Fig. 3. Photographs of sub-module MPPT hardware.
TABLE IICONVERTER SPECIFICATIONS
Input Voltage Range 5-27 V
Output Voltage Range 0.8-20
Max Output Power 80 W
Switching Frequency 250 kHz
Converter Peak Efficiency 98.2%
power captured is not wasted by low conversion efficiency
of the power electronics. Much care was thus taken in this
work to achieve high efficiency operation, both through the
choice of topology and passive components, as well as the
implementation of sensing and control. A detailed description
of these efforts can be found in [9]. Shown in Table II is an
overview of the specifications of the converter, along with a
performance summary.
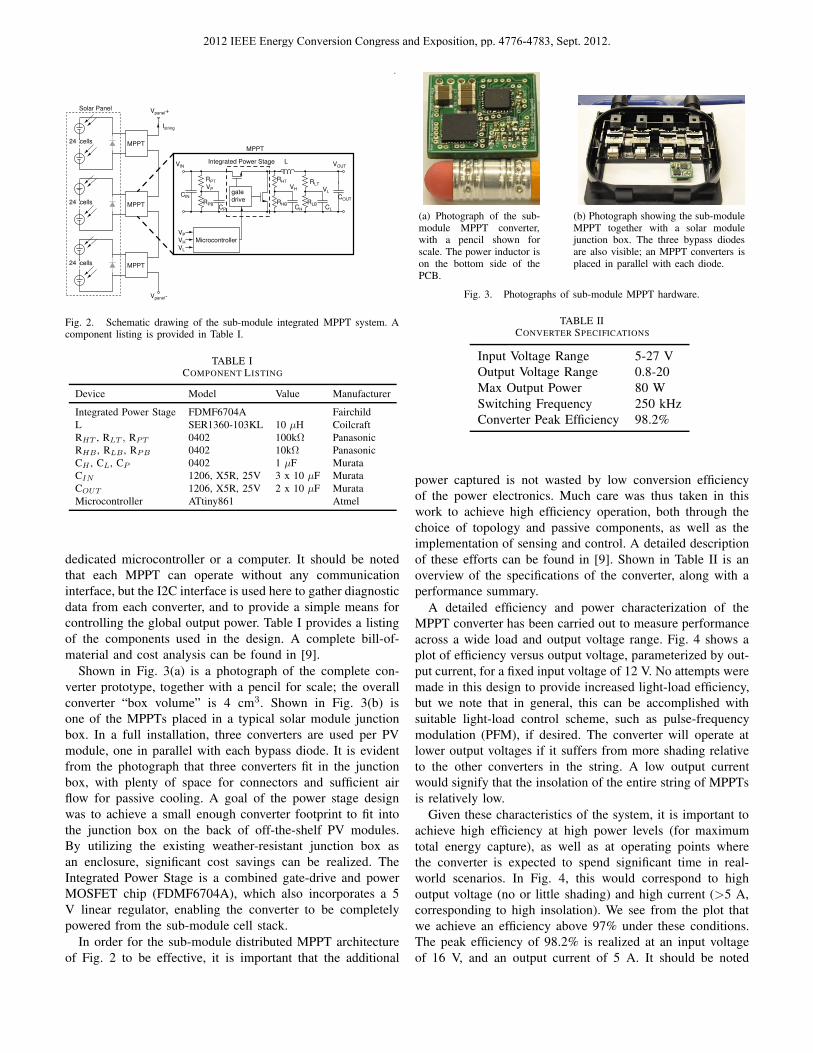
A detailed efficiency and power characterization of the
MPPT converter has been carried out to measure performance
across a wide load and output voltage range. Fig. 4 shows a
plot of efficiency versus output voltage, parameterized by out-
put current, for a fixed input voltage of 12 V. No attempts were
made in this design to provide increased light-load efficiency,
but we note that in general, this can be accomplished with
suitable light-load control scheme, such as pulse-frequency
modulation (PFM), if desired. The converter will operate at
lower output voltages if it suffers from more shading relative
to the other converters in the string. A low output current
would signify that the insolation of the entire string of MPPTs
is relatively low.
Given these characteristics of the system, it is important to
achieve high efficiency at high power levels (for maximum
total energy capture), as well as at operating points where
the converter is expected to spend significant time in real-
world scenarios. In Fig. 4, this would correspond to high
output voltage (no or little shading) and high current (>5 A,
corresponding to high insolation). We see from the plot that
we achieve an efficiency above 97% under these conditions.
The peak efficiency of 98.2% is realized at an input voltage
of 16 V, and an output current of 5 A. It should be noted
2012 IEEE Energy Conversion Congress and Exposition, pp. 4776-4783, Sept. 2012.
0 2 4 6 8 10 12Output Voltage [V]
70
75
80
85
90
95
100Ef
ficie
ncy
[%]
Vin = 12 V
Iout = 1 AIout = 2 AIout = 3 AIout = 4 AIout = 5 AIout = 6 AIout = 7 AIout = 8 A
Fig. 4. Measured efficiency versus output voltage, parameterized by outputcurrent. A lower output voltage corresponds to a shaded sub-module, while alower output current signifies a string with less insolation.
that all efficiency measurements include all sensing, gate drive
and control losses, as the converter itself is powered from its
input terminals. A more detailed performance characterization
of the power stage across a variety of operating conditions can
be found in [9]; excellent efficiency is maintained across an
input range from 8-16 V, and the converter functions over a
still much wider range.
IV. CONTROL IMPLEMENTATION
In our architecture, owing to the sub-module integrated
dc-dc converters, there are no local maxima in the I-V
characteristics of the overall system (these are caused by
conducting bypass diodes in regular PV modules during partial
shading). In order to extract maximum energy from a PV
installation with sub-module power tracking, each MPPT must
continuously operate its sub-module at the correct current and
voltage, while also allowing all other MPPTs do the same for
their individual sub-modules. We must thus design a control
algorithm that ensures that each sub-module operates at its
local MPP, while also ensuring that the overall system operates
at the global MPP (i.e., the overall string voltage and current
are such that all sub-modules are operating at their respective
MPPs).
A. Local MPPT algorithm
Since the outputs of the individual power trackers are
connected in series (as seen in Fig. 2), all of them share
the same output current (Istring). Each converter can thus
maximize its own output power by maximizing its output
voltage. It thus follows that a local MPPT algorithm can
be implemented by driving the local output voltage to its
maximum value. In our implementation, we employ a Perturb
and Observe (P & O) algorithm that continously tracks the
MPP by making small changes to the duty cycle in order to
drive the converter output voltage to its maximum.
TABLE IIIMPPT TRACKING PARAMETERS
MPPT Duty Cycle Step-Size 0.6%
MPPT Startup Sweep Step-Size 5%
Minimum Duty Cycle 10%
Maximum Duty Cycle 99 %
ADC Resolution 10 bit
ADC Samples Per Measurement (Overampling) 100
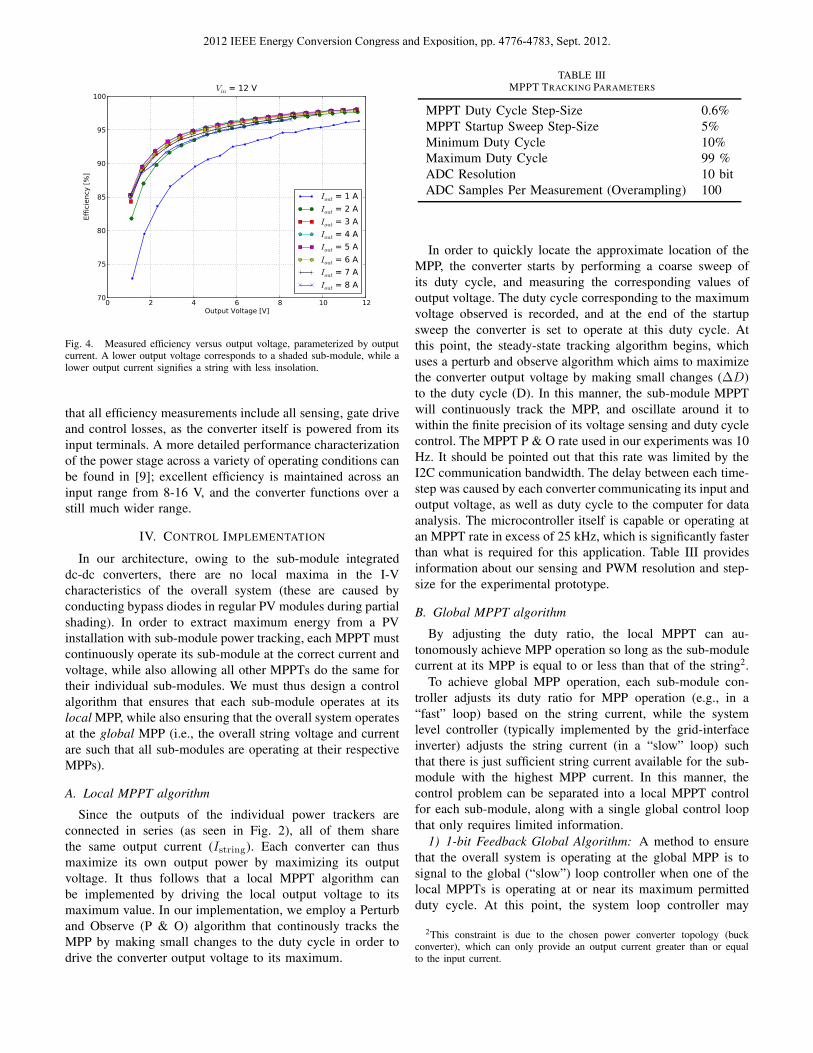
In order to quickly locate the approximate location of the
MPP, the converter starts by performing a coarse sweep of
its duty cycle, and measuring the corresponding values of
output voltage. The duty cycle corresponding to the maximum
voltage observed is recorded, and at the end of the startup
sweep the converter is set to operate at this duty cycle. At
this point, the steady-state tracking algorithm begins, which
uses a perturb and observe algorithm which aims to maximize
the converter output voltage by making small changes (∆D)
to the duty cycle (D). In this manner, the sub-module MPPT
will continuously track the MPP, and oscillate around it to
within the finite precision of its voltage sensing and duty cycle
control. The MPPT P & O rate used in our experiments was 10
Hz. It should be pointed out that this rate was limited by the
I2C communication bandwidth. The delay between each time-
step was caused by each converter communicating its input and
output voltage, as well as duty cycle to the computer for data
analysis. The microcontroller itself is capable or operating at
an MPPT rate in excess of 25 kHz, which is significantly faster
than what is required for this application. Table III provides
information about our sensing and PWM resolution and step-
size for the experimental prototype.
B. Global MPPT algorithm
By adjusting the duty ratio, the local MPPT can au-
tonomously achieve MPP operation so long as the sub-module
current at its MPP is equal to or less than that of the string2.
To achieve global MPP operation, each sub-module con-
troller adjusts its duty ratio for MPP operation (e.g., in a
“fast” loop) based on the string current, while the system
level controller (typically implemented by the grid-interface
inverter) adjusts the string current (in a “slow” loop) such
that there is just sufficient string current available for the sub-
module with the highest MPP current. In this manner, the
control problem can be separated into a local MPPT control
for each sub-module, along with a single global control loop
that only requires limited information.
1) 1-bit Feedback Global Algorithm: A method to ensure
that the overall system is operating at the global MPP is to
signal to the global (“slow”) loop controller when one of the
local MPPTs is operating at or near its maximum permitted
duty cycle. At this point, the system loop controller may
2This constraint is due to the chosen power converter topology (buckconverter), which can only provide an output current greater than or equalto the input current.
2012 IEEE Energy Conversion Congress and Exposition, pp. 4776-4783, Sept. 2012.
Camera
Solar Panel
MPPTs
Electronic Load
Shading Object
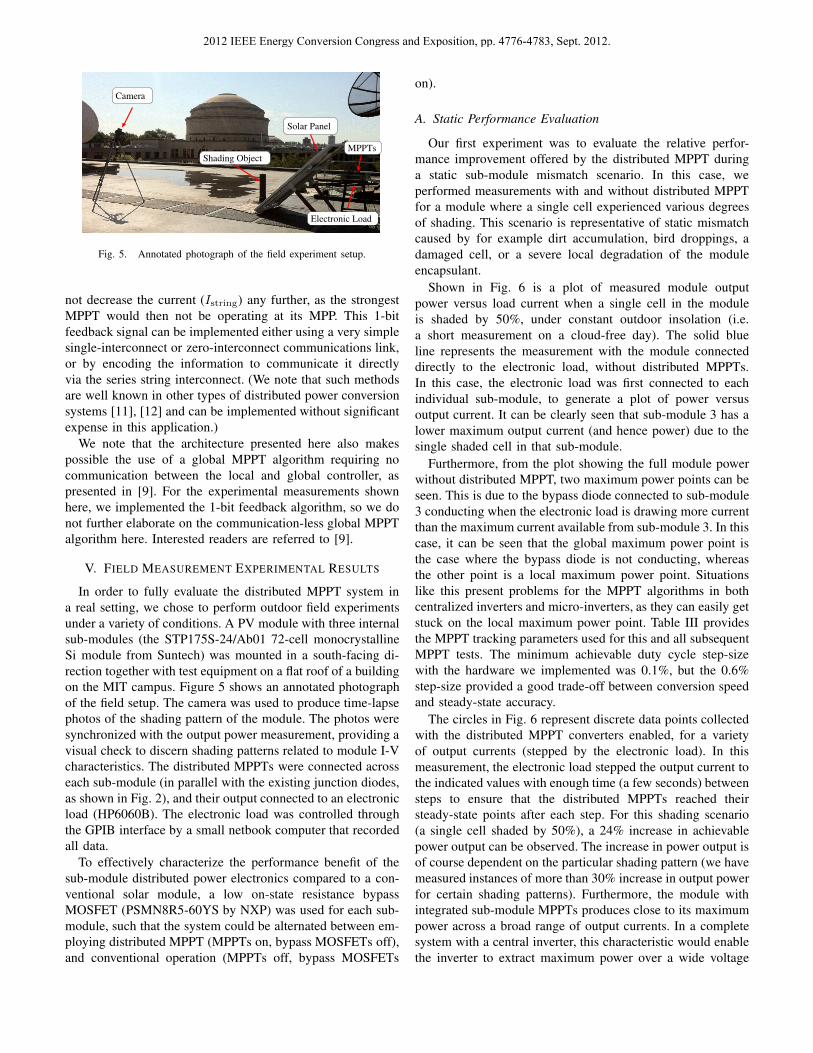
Fig. 5. Annotated photograph of the field experiment setup.
not decrease the current (Istring) any further, as the strongest
MPPT would then not be operating at its MPP. This 1-bit
feedback signal can be implemented either using a very simple
single-interconnect or zero-interconnect communications link,
or by encoding the information to communicate it directly
via the series string interconnect. (We note that such methods
are well known in other types of distributed power conversion
systems [11], [12] and can be implemented without significant
expense in this application.)
We note that the architecture presented here also makes
possible the use of a global MPPT algorithm requiring no
communication between the local and global controller, as
presented in [9]. For the experimental measurements shown
here, we implemented the 1-bit feedback algorithm, so we do
not further elaborate on the communication-less global MPPT
algorithm here. Interested readers are referred to [9].
V. FIELD MEASUREMENT EXPERIMENTAL RESULTS
In order to fully evaluate the distributed MPPT system in
a real setting, we chose to perform outdoor field experiments
under a variety of conditions. A PV module with three internal
sub-modules (the STP175S-24/Ab01 72-cell monocrystalline
Si module from Suntech) was mounted in a south-facing di-
rection together with test equipment on a flat roof of a building
on the MIT campus. Figure 5 shows an annotated photograph
of the field setup. The camera was used to produce time-lapse
photos of the shading pattern of the module. The photos were
synchronized with the output power measurement, providing a
visual check to discern shading patterns related to module I-V
characteristics. The distributed MPPTs were connected across
each sub-module (in parallel with the existing junction diodes,
as shown in Fig. 2), and their output connected to an electronic
load (HP6060B). The electronic load was controlled through
the GPIB interface by a small netbook computer that recorded
all data.
To effectively characterize the performance benefit of the
sub-module distributed power electronics compared to a con-
ventional solar module, a low on-state resistance bypass
MOSFET (PSMN8R5-60YS by NXP) was used for each sub-
module, such that the system could be alternated between em-
ploying distributed MPPT (MPPTs on, bypass MOSFETs off),
and conventional operation (MPPTs off, bypass MOSFETs
on).
A. Static Performance Evaluation
Our first experiment was to evaluate the relative perfor-
mance improvement offered by the distributed MPPT during
a static sub-module mismatch scenario. In this case, we
performed measurements with and without distributed MPPT
for a module where a single cell experienced various degrees
of shading. This scenario is representative of static mismatch
caused by for example dirt accumulation, bird droppings, a
damaged cell, or a severe local degradation of the module
encapsulant.
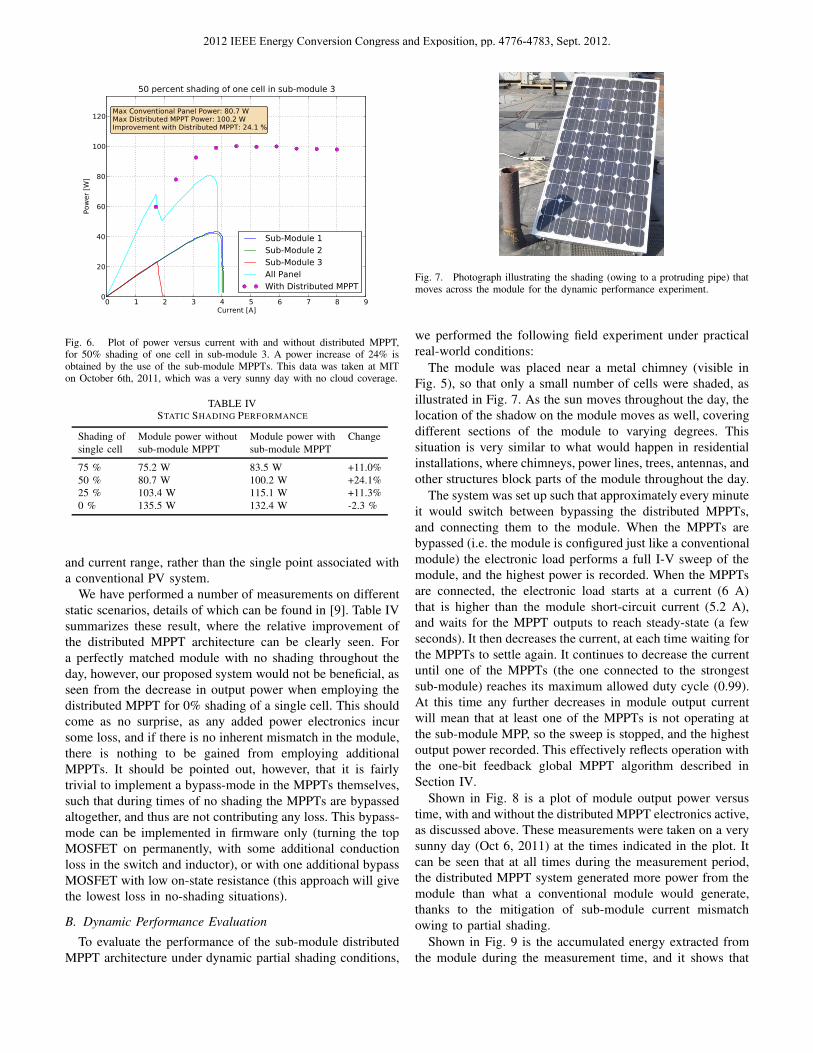
Shown in Fig. 6 is a plot of measured module output
power versus load current when a single cell in the module
is shaded by 50%, under constant outdoor insolation (i.e.
a short measurement on a cloud-free day). The solid blue
line represents the measurement with the module connected
directly to the electronic load, without distributed MPPTs.
In this case, the electronic load was first connected to each
individual sub-module, to generate a plot of power versus
output current. It can be clearly seen that sub-module 3 has a
lower maximum output current (and hence power) due to the
single shaded cell in that sub-module.
Furthermore, from the plot showing the full module power
without distributed MPPT, two maximum power points can be
seen. This is due to the bypass diode connected to sub-module
3 conducting when the electronic load is drawing more current
than the maximum current available from sub-module 3. In this
case, it can be seen that the global maximum power point is
the case where the bypass diode is not conducting, whereas
the other point is a local maximum power point. Situations
like this present problems for the MPPT algorithms in both
centralized inverters and micro-inverters, as they can easily get
stuck on the local maximum power point. Table III provides
the MPPT tracking parameters used for this and all subsequent
MPPT tests. The minimum achievable duty cycle step-size
with the hardware we implemented was 0.1%, but the 0.6%
step-size provided a good trade-off between conversion speed
and steady-state accuracy.
The circles in Fig. 6 represent discrete data points collected
with the distributed MPPT converters enabled, for a variety
of output currents (stepped by the electronic load). In this
measurement, the electronic load stepped the output current to
the indicated values with enough time (a few seconds) between
steps to ensure that the distributed MPPTs reached their
steady-state points after each step. For this shading scenario
(a single cell shaded by 50%), a 24% increase in achievable
power output can be observed. The increase in power output is
of course dependent on the particular shading pattern (we have
measured instances of more than 30% increase in output power
for certain shading patterns). Furthermore, the module with
integrated sub-module MPPTs produces close to its maximum
power across a broad range of output currents. In a complete
system with a central inverter, this characteristic would enable
the inverter to extract maximum power over a wide voltage
2012 IEEE Energy Conversion Congress and Exposition, pp. 4776-4783, Sept. 2012.
0 1 2 3 4 5 6 7 8 9Current [A]
0
20
40
60
80
100
120
Pow
er [W
]
Max Conventional Panel Power: 80.7 WMax Distributed MPPT Power: 100.2 WImprovement with Distributed MPPT: 24.1 %
50 percent shading of one cell in sub-module 3
Sub-Module 1Sub-Module 2Sub-Module 3All PanelWith Distributed MPPT
Fig. 6. Plot of power versus current with and without distributed MPPT,for 50% shading of one cell in sub-module 3. A power increase of 24% isobtained by the use of the sub-module MPPTs. This data was taken at MITon October 6th, 2011, which was a very sunny day with no cloud coverage.
TABLE IVSTATIC SHADING PERFORMANCE
Shading of Module power without Module power with Change
single cell sub-module MPPT sub-module MPPT
75 % 75.2 W 83.5 W +11.0%
50 % 80.7 W 100.2 W +24.1%
25 % 103.4 W 115.1 W +11.3%
0 % 135.5 W 132.4 W -2.3 %
and current range, rather than the single point associated with
a conventional PV system.
We have performed a number of measurements on different
static scenarios, details of which can be found in [9]. Table IV
summarizes these result, where the relative improvement of
the distributed MPPT architecture can be clearly seen. For
a perfectly matched module with no shading throughout the
day, however, our proposed system would not be beneficial, as
seen from the decrease in output power when employing the
distributed MPPT for 0% shading of a single cell. This should
come as no surprise, as any added power electronics incur
some loss, and if there is no inherent mismatch in the module,
there is nothing to be gained from employing additional
MPPTs. It should be pointed out, however, that it is fairly
trivial to implement a bypass-mode in the MPPTs themselves,
such that during times of no shading the MPPTs are bypassed
altogether, and thus are not contributing any loss. This bypass-
mode can be implemented in firmware only (turning the top
MOSFET on permanently, with some additional conduction
loss in the switch and inductor), or with one additional bypass
MOSFET with low on-state resistance (this approach will give
the lowest loss in no-shading situations).
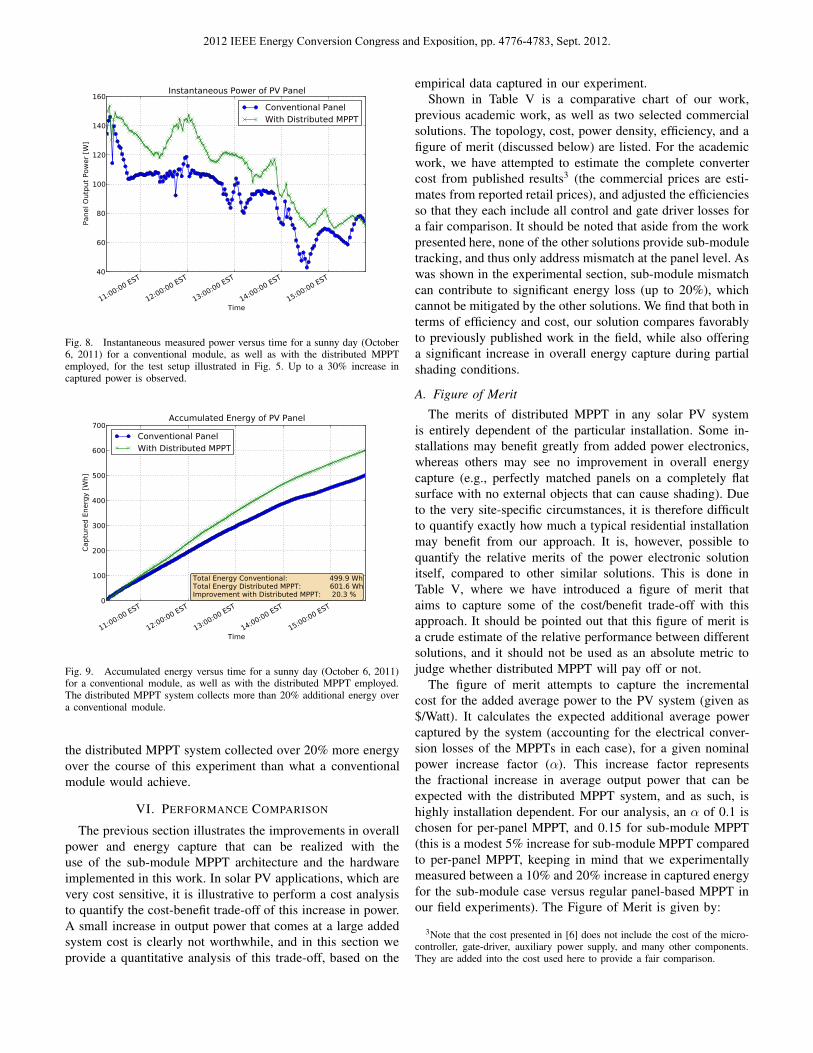
B. Dynamic Performance Evaluation
To evaluate the performance of the sub-module distributed
MPPT architecture under dynamic partial shading conditions,
Fig. 7. Photograph illustrating the shading (owing to a protruding pipe) thatmoves across the module for the dynamic performance experiment.
we performed the following field experiment under practical
real-world conditions:
The module was placed near a metal chimney (visible in
Fig. 5), so that only a small number of cells were shaded, as
illustrated in Fig. 7. As the sun moves throughout the day, the
location of the shadow on the module moves as well, covering
different sections of the module to varying degrees. This
situation is very similar to what would happen in residential
installations, where chimneys, power lines, trees, antennas, and
other structures block parts of the module throughout the day.
The system was set up such that approximately every minute
it would switch between bypassing the distributed MPPTs,
and connecting them to the module. When the MPPTs are
bypassed (i.e. the module is configured just like a conventional
module) the electronic load performs a full I-V sweep of the
module, and the highest power is recorded. When the MPPTs
are connected, the electronic load starts at a current (6 A)
that is higher than the module short-circuit current (5.2 A),
and waits for the MPPT outputs to reach steady-state (a few
seconds). It then decreases the current, at each time waiting for
the MPPTs to settle again. It continues to decrease the current
until one of the MPPTs (the one connected to the strongest
sub-module) reaches its maximum allowed duty cycle (0.99).
At this time any further decreases in module output current
will mean that at least one of the MPPTs is not operating at
the sub-module MPP, so the sweep is stopped, and the highest
output power recorded. This effectively reflects operation with
the one-bit feedback global MPPT algorithm described in
Section IV.
Shown in Fig. 8 is a plot of module output power versus
time, with and without the distributed MPPT electronics active,
as discussed above. These measurements were taken on a very
sunny day (Oct 6, 2011) at the times indicated in the plot. It
can be seen that at all times during the measurement period,
the distributed MPPT system generated more power from the
module than what a conventional module would generate,
thanks to the mitigation of sub-module current mismatch
owing to partial shading.
Shown in Fig. 9 is the accumulated energy extracted from
the module during the measurement time, and it shows that
2012 IEEE Energy Conversion Congress and Exposition, pp. 4776-4783, Sept. 2012.
11:00:00 EST
12:00:00 EST
13:00:00 EST
14:00:00 EST
15:00:00 EST
Time
40
60
80
100
120
140
160Pa
nel O
utpu
t Pow
er [W
]Instantaneous Power of PV Panel
Conventional PanelWith Distributed MPPT
Fig. 8. Instantaneous measured power versus time for a sunny day (October6, 2011) for a conventional module, as well as with the distributed MPPTemployed, for the test setup illustrated in Fig. 5. Up to a 30% increase incaptured power is observed.
11:00:00 EST
12:00:00 EST
13:00:00 EST
14:00:00 EST
15:00:00 EST
Time
0
100
200
300
400
500
600
700
Capt
ured
Ene
rgy
[Wh]
Total Energy Conventional: 499.9 WhTotal Energy Distributed MPPT: 601.6 WhImprovement with Distributed MPPT: 20.3 %
Accumulated Energy of PV Panel
Conventional PanelWith Distributed MPPT
Fig. 9. Accumulated energy versus time for a sunny day (October 6, 2011)for a conventional module, as well as with the distributed MPPT employed.The distributed MPPT system collects more than 20% additional energy overa conventional module.
the distributed MPPT system collected over 20% more energy
over the course of this experiment than what a conventional
module would achieve.
VI. PERFORMANCE COMPARISON
The previous section illustrates the improvements in overall
power and energy capture that can be realized with the
use of the sub-module MPPT architecture and the hardware
implemented in this work. In solar PV applications, which are
very cost sensitive, it is illustrative to perform a cost analysis
to quantify the cost-benefit trade-off of this increase in power.
A small increase in output power that comes at a large added
system cost is clearly not worthwhile, and in this section we
provide a quantitative analysis of this trade-off, based on the
empirical data captured in our experiment.
Shown in Table V is a comparative chart of our work,
previous academic work, as well as two selected commercial
solutions. The topology, cost, power density, efficiency, and a
figure of merit (discussed below) are listed. For the academic
work, we have attempted to estimate the complete converter
cost from published results3 (the commercial prices are esti-
mates from reported retail prices), and adjusted the efficiencies
so that they each include all control and gate driver losses for
a fair comparison. It should be noted that aside from the work
presented here, none of the other solutions provide sub-module
tracking, and thus only address mismatch at the panel level. As
was shown in the experimental section, sub-module mismatch
can contribute to significant energy loss (up to 20%), which
cannot be mitigated by the other solutions. We find that both in
terms of efficiency and cost, our solution compares favorably
to previously published work in the field, while also offering
a significant increase in overall energy capture during partial
shading conditions.
A. Figure of Merit
The merits of distributed MPPT in any solar PV system
is entirely dependent of the particular installation. Some in-
stallations may benefit greatly from added power electronics,
whereas others may see no improvement in overall energy
capture (e.g., perfectly matched panels on a completely flat
surface with no external objects that can cause shading). Due
to the very site-specific circumstances, it is therefore difficult
to quantify exactly how much a typical residential installation
may benefit from our approach. It is, however, possible to
quantify the relative merits of the power electronic solution
itself, compared to other similar solutions. This is done in
Table V, where we have introduced a figure of merit that
aims to capture some of the cost/benefit trade-off with this
approach. It should be pointed out that this figure of merit is
a crude estimate of the relative performance between different
solutions, and it should not be used as an absolute metric to
judge whether distributed MPPT will pay off or not.
The figure of merit attempts to capture the incremental
cost for the added average power to the PV system (given as
$/Watt). It calculates the expected additional average power
captured by the system (accounting for the electrical conver-
sion losses of the MPPTs in each case), for a given nominal
power increase factor (α). This increase factor represents
the fractional increase in average output power that can be
expected with the distributed MPPT system, and as such, is
highly installation dependent. For our analysis, an α of 0.1 is
chosen for per-panel MPPT, and 0.15 for sub-module MPPT
(this is a modest 5% increase for sub-module MPPT compared
to per-panel MPPT, keeping in mind that we experimentally
measured between a 10% and 20% increase in captured energy
for the sub-module case versus regular panel-based MPPT in
our field experiments). The Figure of Merit is given by:
3Note that the cost presented in [6] does not include the cost of the micro-controller, gate-driver, auxiliary power supply, and many other components.They are added into the cost used here to provide a fair comparison.
2012 IEEE Energy Conversion Congress and Exposition, pp. 4776-4783, Sept. 2012.
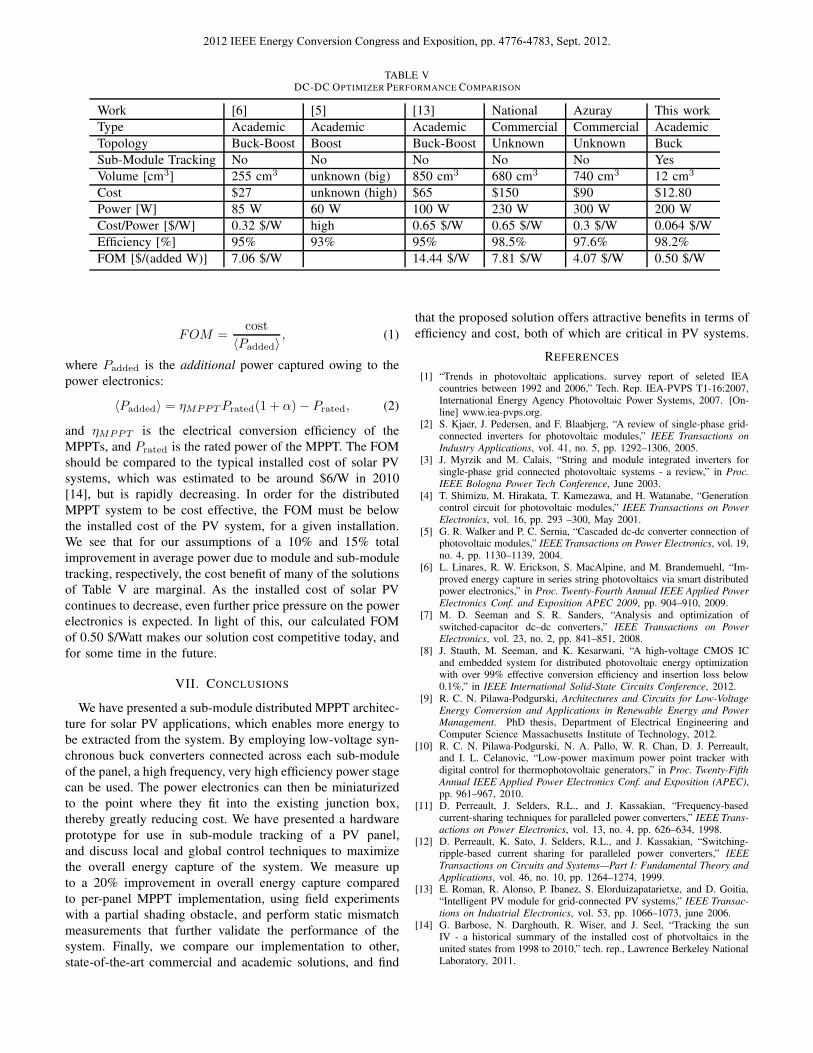
TABLE VDC-DC OPTIMIZER PERFORMANCE COMPARISON
Work [6] [5] [13] National Azuray This work
Type Academic Academic Academic Commercial Commercial Academic
Topology Buck-Boost Boost Buck-Boost Unknown Unknown Buck
Sub-Module Tracking No No No No No Yes
Volume [cm3] 255 cm3 unknown (big) 850 cm3 680 cm3 740 cm3 12 cm3
Cost $27 unknown (high) $65 $150 $90 $12.80
Power [W] 85 W 60 W 100 W 230 W 300 W 200 W
Cost/Power [$/W] 0.32 $/W high 0.65 $/W 0.65 $/W 0.3 $/W 0.064 $/W
Efficiency [%] 95% 93% 95% 98.5% 97.6% 98.2%
FOM [$/(added W)] 7.06 $/W 14.44 $/W 7.81 $/W 4.07 $/W 0.50 $/W
FOM =cost
〈Padded〉, (1)
where Padded is the additional power captured owing to the
power electronics:
〈Padded〉 = ηMPPTPrated(1 + α)− Prated, (2)
and ηMPPT is the electrical conversion efficiency of the
MPPTs, and Prated is the rated power of the MPPT. The FOM
should be compared to the typical installed cost of solar PV
systems, which was estimated to be around $6/W in 2010
[14], but is rapidly decreasing. In order for the distributed
MPPT system to be cost effective, the FOM must be below
the installed cost of the PV system, for a given installation.
We see that for our assumptions of a 10% and 15% total
improvement in average power due to module and sub-module
tracking, respectively, the cost benefit of many of the solutions
of Table V are marginal. As the installed cost of solar PV
continues to decrease, even further price pressure on the power
electronics is expected. In light of this, our calculated FOM
of 0.50 $/Watt makes our solution cost competitive today, and
for some time in the future.
VII. CONCLUSIONS
We have presented a sub-module distributed MPPT architec-
ture for solar PV applications, which enables more energy to
be extracted from the system. By employing low-voltage syn-
chronous buck converters connected across each sub-module
of the panel, a high frequency, very high efficiency power stage
can be used. The power electronics can then be miniaturized
to the point where they fit into the existing junction box,
thereby greatly reducing cost. We have presented a hardware
prototype for use in sub-module tracking of a PV panel,
and discuss local and global control techniques to maximize
the overall energy capture of the system. We measure up
to a 20% improvement in overall energy capture compared
to per-panel MPPT implementation, using field experiments
with a partial shading obstacle, and perform static mismatch
measurements that further validate the performance of the
system. Finally, we compare our implementation to other,
state-of-the-art commercial and academic solutions, and find
that the proposed solution offers attractive benefits in terms of
efficiency and cost, both of which are critical in PV systems.
REFERENCES
[1] “Trends in photovoltaic applications. survey report of seleted IEAcountries between 1992 and 2006,” Tech. Rep. IEA-PVPS T1-16:2007,International Energy Agency Photovoltaic Power Systems, 2007. [On-line] www.iea-pvps.org.
[2] S. Kjaer, J. Pedersen, and F. Blaabjerg, “A review of single-phase grid-connected inverters for photovoltaic modules,” IEEE Transactions on
Industry Applications, vol. 41, no. 5, pp. 1292–1306, 2005.[3] J. Myrzik and M. Calais, “String and module integrated inverters for
single-phase grid connected photovoltaic systems - a review,” in Proc.
IEEE Bologna Power Tech Conference, June 2003.[4] T. Shimizu, M. Hirakata, T. Kamezawa, and H. Watanabe, “Generation
control circuit for photovoltaic modules,” IEEE Transactions on Power
Electronics, vol. 16, pp. 293 –300, May 2001.[5] G. R. Walker and P. C. Sernia, “Cascaded dc-dc converter connection of
photovoltaic modules,” IEEE Transactions on Power Electronics, vol. 19,no. 4, pp. 1130–1139, 2004.
[6] L. Linares, R. W. Erickson, S. MacAlpine, and M. Brandemuehl, “Im-proved energy capture in series string photovoltaics via smart distributedpower electronics,” in Proc. Twenty-Fourth Annual IEEE Applied Power
Electronics Conf. and Exposition APEC 2009, pp. 904–910, 2009.[7] M. D. Seeman and S. R. Sanders, “Analysis and optimization of
switched-capacitor dc–dc converters,” IEEE Transactions on Power
Electronics, vol. 23, no. 2, pp. 841–851, 2008.[8] J. Stauth, M. Seeman, and K. Kesarwani, “A high-voltage CMOS IC
and embedded system for distributed photovoltaic energy optimizationwith over 99% effective conversion efficiency and insertion loss below0.1%,” in IEEE International Solid-State Circuits Conference, 2012.
[9] R. C. N. Pilawa-Podgurski, Architectures and Circuits for Low-Voltage
Energy Conversion and Applications in Renewable Energy and Power
Management. PhD thesis, Department of Electrical Engineering andComputer Science Massachusetts Institute of Technology, 2012.
[10] R. C. N. Pilawa-Podgurski, N. A. Pallo, W. R. Chan, D. J. Perreault,and I. L. Celanovic, “Low-power maximum power point tracker withdigital control for thermophotovoltaic generators,” in Proc. Twenty-Fifth
Annual IEEE Applied Power Electronics Conf. and Exposition (APEC),pp. 961–967, 2010.
[11] D. Perreault, J. Selders, R.L., and J. Kassakian, “Frequency-basedcurrent-sharing techniques for paralleled power converters,” IEEE Trans-
actions on Power Electronics, vol. 13, no. 4, pp. 626–634, 1998.[12] D. Perreault, K. Sato, J. Selders, R.L., and J. Kassakian, “Switching-
ripple-based current sharing for paralleled power converters,” IEEE
Transactions on Circuits and Systems—Part I: Fundamental Theory and
Applications, vol. 46, no. 10, pp. 1264–1274, 1999.[13] E. Roman, R. Alonso, P. Ibanez, S. Elorduizapatarietxe, and D. Goitia,
“Intelligent PV module for grid-connected PV systems,” IEEE Transac-
tions on Industrial Electronics, vol. 53, pp. 1066–1073, june 2006.[14] G. Barbose, N. Darghouth, R. Wiser, and J. Seel, “Tracking the sun
IV - a historical summary of the installed cost of photvoltaics in theunited states from 1998 to 2010,” tech. rep., Lawrence Berkeley NationalLaboratory, 2011.
2012 IEEE Energy Conversion Congress and Exposition, pp. 4776-4783, Sept. 2012.