Embed Size (px)
Citation preview
Sub-Regional Earthquake Hazards and Earthquake Mapping Update
Specialist, ABAG , [email protected]
Danielle Mieler, Earthquake and Hazards Program Coordinator, ABAG, [email protected]
November 20, 2013
USGS Award # G12AP20105
Award dates: September 1, 2012 - August 31, 2013
Introduction
One of the key objectives of the ABAG Earthquake and Hazards Program is to develop and disseminate scien-tific information about hazards in an understandable and usable way that facilitates good policy and plan-ning decisions. This project, the Sub-Regional Earth-quake Hazards and Earthquake Mapping Update, aims to forward this goal through the development of a risk-based approach to hazards communication and strat-egy development. This approach can be implemented across many of the program’s projects and products. In the context of this project, users of the website will have an improved understanding of the likelihood and consequence of hazards that contribute to their risk. The website provides users with accessible tools for reducing risk when it is unacceptably high. This project sought to better communicate the likelihood
of damaging earthquakes, their consequences on the built environment, and identify mitigation options for homeowners and renters.
Residents in many parts of the Bay Area do not have an accurate perception of the risks they face from earthquakes. Several myths common among residents contribute to this perception:
• “Loma Prieta was a major earthquake and because my home or business wasn’t damaged in that earth-quake, it will withstand future earthquakes as well”;
• “Living in earthquake country means that we expe-rience earthquakes all the time and I don’t perceive earthquakes to be a major threat”, and;
• “The greatest threat of earthquakes is on the Hayward and San Andreas faults—I don’t live very close to these faults and so I am not at significant risk.”
We wanted to help users understand that hazard is dif-ferent throughout the region and that the entire hazard does not come from the Hayward and San Andreas faults. At the same time, we wanted to make better use of probabilistic maps and find a way to use those maps to help residents make more informed decisions about retrofitting or buying a home.
In recent years the Uniform California Earthquake Rupture Forecast (UCERF)2 update of the Probabilistic Seismic Hazards Assessment Model resulted in updates to the probabilistic shaking map and change to sce-nario earthquakes. The Pacific Earthquake Engineer-ing Research Center’s Next Generation Attenuation (PEER-NGA) Project also updated their Ground-Mo-tion Prediction Equations (GMPEs), which resulted in changes to shaking scenario maps. The United States Geological Survey (USGS) developed new shaking sce-
ABAG Earthquake and Hazards ProgramP.O. Box 2050Oakland, CA 94604quake.abag.ca.gov
Dana Brechwald, Earthquake and Hazards
2
nario maps to match UCERF2’s scenario earthquakes and represent the new GMPEs from PEER-NGA. ABAG decided to replace its previously-developed scenario maps1 with these new USGS maps. These updates presented a new opportunity to communicate earthquake hazards to the users of the Earthquake and Hazards Program website.
Through this project, the Earthquake and Hazards Program’s aim was to develop a risk-based approach to decision-making around mitigation and seek to find creative ways to communicate hazard and risk to users of the program’s website. A risk-based approach involves evaluating the likelihood and consequences of a hazard and deciding how to reduce risk when it’s perceived as unacceptably high. This involves giving residents accurate perception of their risk to spur thinking about mitigation actions. This project specifically addressed risk perception through exam-ining how to communicate probability information associated with hazard maps, helping residents better understand which earthquake shaking scenario pres-ents the greatest risk to their home and what levels of shaking they could experience with this scenario to understand their hazard, and helping users connect to how different levels of shaking will translate to build-ing damage in an earthquake to better understand the consequences of this hazard. The goal of this project is to help residents and local government officials to understand that every region of the Bay Area faces sig-nificant earthquake risk from both near and far faults, and empower them to take actions to reduce their risk.
ABAG also wanted to better understand its regional role in disseminating hazards information. ABAG strives to take the most accurate information avail-able on natural hazards, risks, and expected impacts in the Bay Area and harness that information to provide an understandable picture of hazard and risk to Bay
1 Perkins, J. and Boatwright, J. On Shaky Ground (1995, 1998, 2003, 2010)
Area residents and local governments to guide deci-sion making. ABAG seeks to provide key information for these audiences in an easily accessible way to drive mitigation and policy action.
The goal of this project was met through a number of new map products and changes to the Program’s web-site. The changes are summarized below:
• Replaced ABAG-developed shaking scenarios with USGS shaking scenarios on the ABAG website;
• Developed Modified Mercalli Intensity (MMI)-based probabilistic shaking hazard maps for the Bay Area, using 10% chance in 50 years as the risk level, to help residents better understand their risk of shaking within a 50-year time period;
• Developed new explanations of the MMI scale lev-els to help residents relate MMI levels on the map to expected damage;
• Identified major sub-regions of the Bay Area and developed a detailed picture of hazard and risk in each sub-region that includes specific hazards, vulnerabilities, and resources;
• Identified the top faults and associated shaking scenarios for each region through a regional deag-gregation map to help residents understand which faults contribute to their risk;
• Developed a new web portal to disseminate sci-entific information about earthquake hazards and risks in each sub-region of the Bay Area and provide tools to mitigate those hazards and risks, including specific information about shaking-relat-ed risks and ground failures.
3
Methodology
Review of existing tools and literature
The first step in developing this project was to con-ceptualize a framework for thinking that guides us-ers from hazard information to mitigation action by linking hazard, exposure, vulnerability, risk and risk reduction actions through the Earthquake and Haz-ards Program website. This was done through a review of existing external websites, decision-making tools, information portals, and academic literature to better understand psychological factors that induce action as well as how individuals perceive their own risk. A Project Advisory Committee (see Acknowledgements for Advisory Committee members) was used exten-sively for idea generation and discussion.
The Committee agreed on several products that they believed would provide usable tools for understanding risk and spurring mitigation action. Several sources of existing decision-making tools, mapping interfaces, information portals, and academic literature were re-viewed to better understand how hazards are currently being conveyed to the public and how effective they are. The Committee reviewed and gleaned best prac-tices from several existing tools, including:
• United States Geological Survey (USGS) and Cali-fornia Integrated Seismic Network (CISN)’s Shake-Map products2
• California Geologic Survey (CGS) and California Office of Emergency Services (CalOES) MyHaz-ards and MyPlan websites3
• CGS’ Information Warehouse4
2 http://earthquake.usgs.gov/earthquakes/shakemap/3 http://myhazards.calema.ca.gov/ and http://myplan.calema.ca.gov/4 www.quake.ca.gov/gmaps/WH/index.htm
• National Research Institute for Earth Science and Disaster Prevention (NIED)’s Scenario Earthquake Shaking Maps
• Earthquake Country Alliance (ECA)’s Putting Down Roots in Earthquake Country5
• California Natural Resources Agency (CNRA)’s CERES information system6
• Academic literature to understand how users un-derstand probability7
ABAG and the Advisory Committee identified some information best practices as well as areas for im-provement based on this review. One major concept that arose was regulatory maps versus hazard maps. Regulatory maps, such as “Zones of Required Inves-tigation” maps for surface fault rupture, liquefaction, and landslide hazard prepared by CGS and mandated by the State, identify only zones within which site specific studies will be required for new construction or required disclosure for existing properties. These maps do not depict different degrees of hazard and so may not be useful tools for understanding the compre-hensive risk of an area. MyHazards, MyPlan, and the Information Warehouse provide regulatory maps.
The interface of some of these mapping products also did not allow for a comprehensive understanding of risk at multiple scales; for example, the Information Warehouse regulatory maps are not searchable by ad-dress, don’t provide a regional view, and are only avail-able as static PDF maps, not as interactive GIS data. This can make it difficult for homeowners to under-stand specific risk to their property within the context of neighborhood and community risks. MyHazards and MyPlan provide a more interactive interface but lack the probablistic hazard maps that the Committee
5 http://www.earthquakecountry.org/roots/cover.html6 http://ceres.ca.gov/7 Gigerenzer et al., (2005); Wang et al., (2003); Stein, Geller, and Liu (2012); and Mileti and Darlington (1995)
4
felt best communicated risk. However many of the existing resources provided good links to mitigation resources.
The Committee was particularly interested in the probabilistic maps developed in the original Putting Down Roots in Southern California. While these maps used acceleration instead of MMI and included some broad language about expected damage to buildings, the advisory committee was interested in the unique way probability information was presented as number of times a region would experience a ground motion in a period of time. The committee explored develop-ing a similar map for the Bay Area using the UCERF2 Probablistic Seismic Hazard Maps (PSHM). We found that reproducing such a map was not feasible within the time constraints of the project, but may be an area for future work.
In many cases, ABAG will present existing informa-tion from other sites and sources without modification, providing citations and links to original sources. In other cases, ABAG will modify or add value to exist-ing raw data or maps before making it available for our audiences. When possible we try to be consistent with other agencies that disseminate hazard information, such as USGS, CGS, and CalOES.
Development of Decision Flow Paths
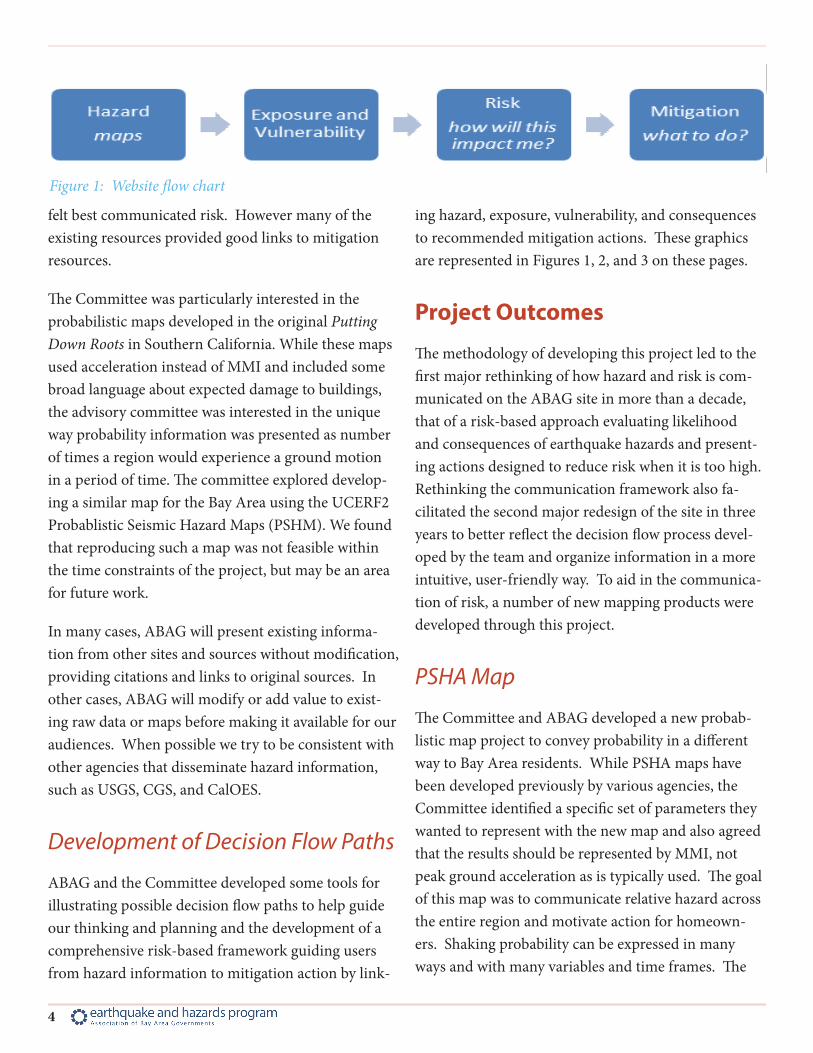
ABAG and the Committee developed some tools for illustrating possible decision flow paths to help guide our thinking and planning and the development of a comprehensive risk-based framework guiding users from hazard information to mitigation action by link-
ing hazard, exposure, vulnerability, and consequences to recommended mitigation actions. These graphics are represented in Figures 1, 2, and 3 on these pages.
Project Outcomes
The methodology of developing this project led to the first major rethinking of how hazard and risk is com-municated on the ABAG site in more than a decade, that of a risk-based approach evaluating likelihood and consequences of earthquake hazards and present-ing actions designed to reduce risk when it is too high. Rethinking the communication framework also fa-cilitated the second major redesign of the site in three years to better reflect the decision flow process devel-oped by the team and organize information in a more intuitive, user-friendly way. To aid in the communica-tion of risk, a number of new mapping products were developed through this project.
PSHA Map
The Committee and ABAG developed a new probab-listic map project to convey probability in a different way to Bay Area residents. While PSHA maps have been developed previously by various agencies, the Committee identified a specific set of parameters they wanted to represent with the new map and also agreed that the results should be represented by MMI, not peak ground acceleration as is typically used. The goal of this map was to communicate relative hazard across the entire region and motivate action for homeown-ers. Shaking probability can be expressed in many ways and with many variables and time frames. The
Figure 1: Website flow chart

5
Committee reviewed several PSHA maps used in other agency’s materials, including materials from USGS and CGS. The Committee decided to use a 10% in 50 year probability because it is the probability and timeframe most closely aligned with building standards in the California Building Code.
A PSHA analysis for Peak Ground Velocity (PGV) with a 10% probability in 50 years was run by CGS for 52,961 points along a grid covering the entire Bay Area, at intervals of 0.05 degrees longitude and 0.05 degrees latitude. PSHA codes are typically run uniform Vs30 values; however CGS developed seven sets of PGV runs with Vs30 values corresponding to
Figures 2 and 3: Decision flow path for homeowners, decision flow path for renters.
6
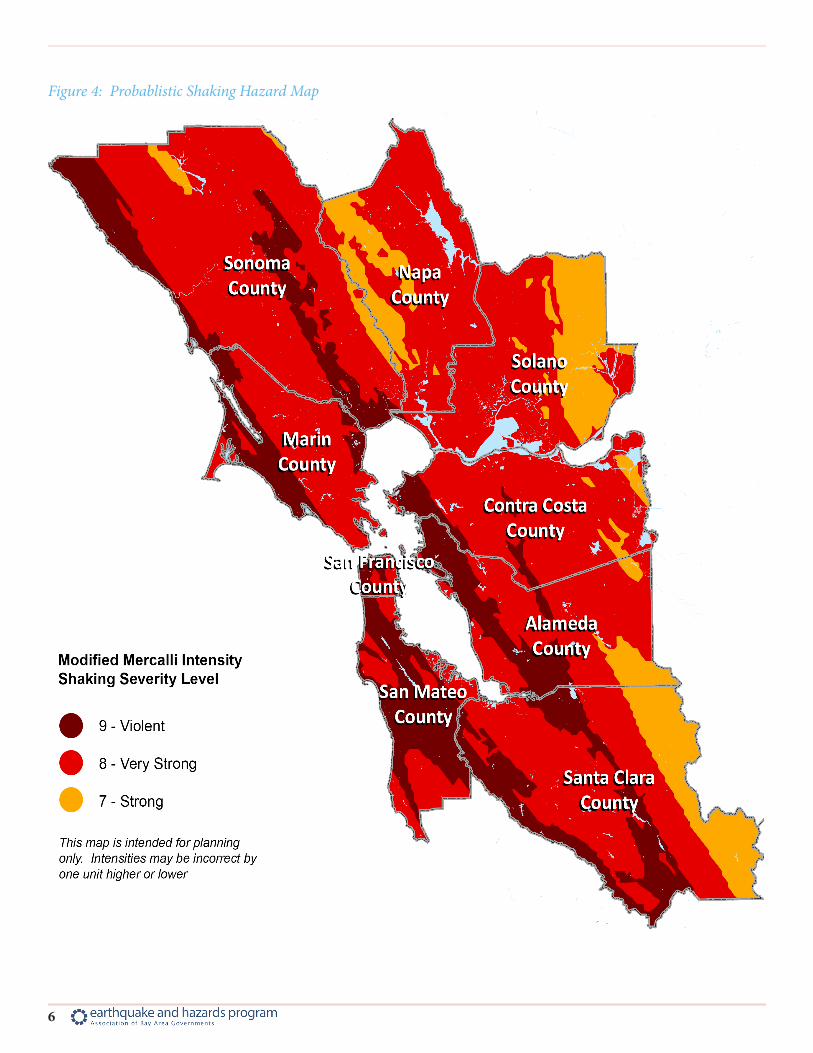
Figure 4: Probablistic Shaking Hazard Map
7
Intensity Building Contents Masonry Buildings Multi-Family Wood-Frame Buildings
1&2 Story Wood-Frame Buildings
MMI 6 Some things thrown from shelves, pictures shifted, water thrown from pools.
Some walls and parapets of poorly constructed buildings crack.
Some drywall cracks. Some chimneys are damaged, some drywall cracks. Some slab foundations, patios, and garage floors slightly crack.
MMI 7 Many things thrown from walls and shelves. Furniture is shifted.
Poorly constructed buildings are damaged and some well-constructed buildings crack. Cornices and unbraced parapets fall.
Plaster cracks, particularly at inside corners of buildings. Some soft-story buildings strain at the first floor level. Some partitions deform.
Many chimneys are broken and some collapse, damaging roofs, interiors, and porches. Weak foundations can be damaged.
MMI 8 Nearly everything thrown down from shelves, cabinets, and walls. Furniture overturned.
Poorly constructed buildings suffer partial or full collapse. Some well- constructed buildings are damaged. Unreinforced walls fall.
Soft-story buildings are displaced out of plumb and partially collapse. Loose partition walls are damaged and may fail. Some pipes break.
Houses shift if they are not bolted to the foundation, or are displaced and partially collapse if cripple walls are not braced. Structural elements such as beams, joists, and foundations are damaged. Some pipes break.
MMI 9 Only very well anchored contents remain in place.
Poorly constructed buildings collapse. Well-constructed buildings are heavily damaged. Retrofitted buildings damaged.
Soft-story buildings partially or completely collapse. Some well- constructed buildings are damaged.
Poorly constructed buildings are heavily damaged, some partially collapse. Some well- constructed buildings are damaged.
MMI 10 Only very well anchored contents remain in place.
Retrofitted buildings are heavily damaged, and some partially collapse.
Many well- constructed buildings are damaged.
Well-constructed buildings are damaged.
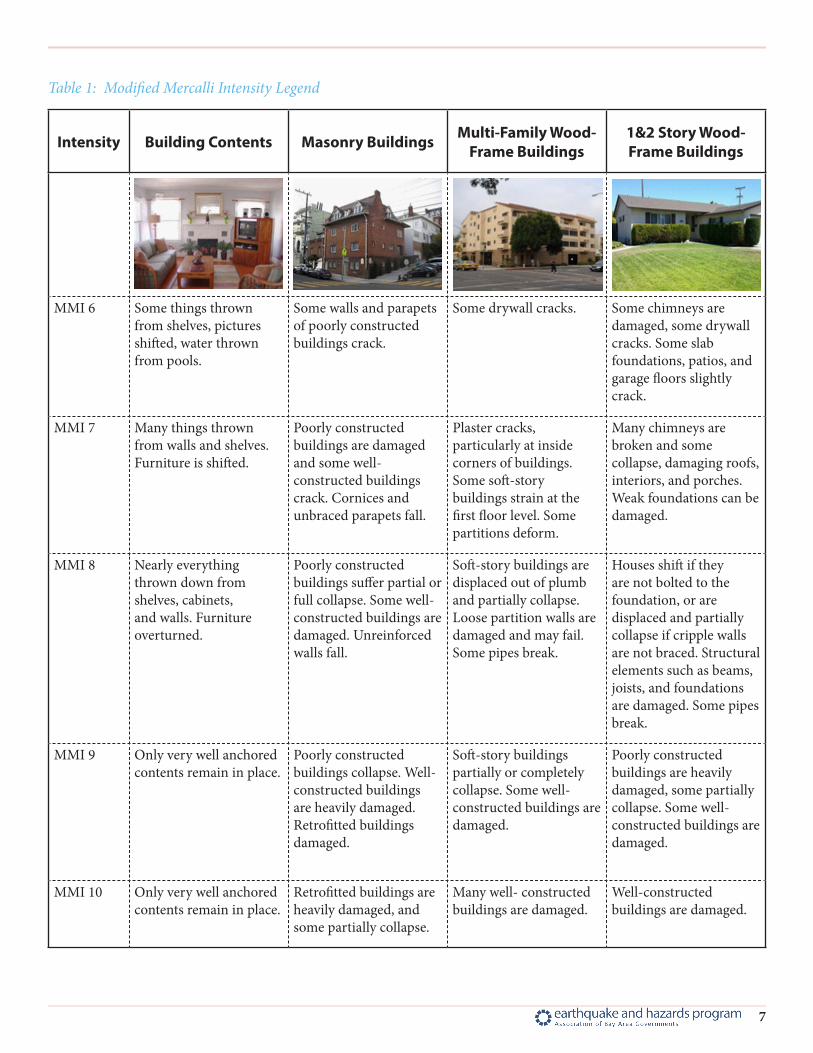
Table 1: Modified Mercalli Intensity Legend
8
the seven groups of geological units in a simplified Vs30 map for California developed by Wills, et al (2000). This simplified map was used to assign Vs30 values to all points on the PSHA grid and then the grid point Vs30 values were used to choose PGV results from the seven PGV runs to compile a final set of results. However, hazard contours based on grid-point ground motion values cannot sufficiently reflect geological boundaries observed on the Vs30 map. Dave Branum at CGS developed a post-processing technique in GIS to correct this issue, but due to the additional labor and time required to apply this post-processing, it was not included in this map. The seven Vs30 categories, and methodology to incorporate them, can be found in Chen, Branum, and Wills (2011). Lastly, PGV was converted to MMI using Worden et al (2012) methodology. It is important to note that Worden caps MMI at 8.6 because no data exist for higher PGV values. However, we used the Worden relationship at higher PGV because no alternative exists, and we believe that it is still a useful and realistic approximation at higher values.
Complementary to the new PSHA map, ABAG and the Committee developed ABAG website material explaining how to use the new PSHA map, how it can help residents better understand their risk, and what actions homeowners can take to mitigate against high ground shaking8. To help residents better understand the consequences of their level of risk the Committee developed a new MMI legend matching the shaking levels to damage of three common building types and building contents. This legend was peer reviewed by outside experts. The updated map and legend9 are seen in Figure 4 and Table 1 on pages six and seven.
8 http://quake.abag.ca.gov/shaking/psha/9 Also available at http://quake.abag.ca.gov/shaking/mmi-popup/
Deaggregation Map
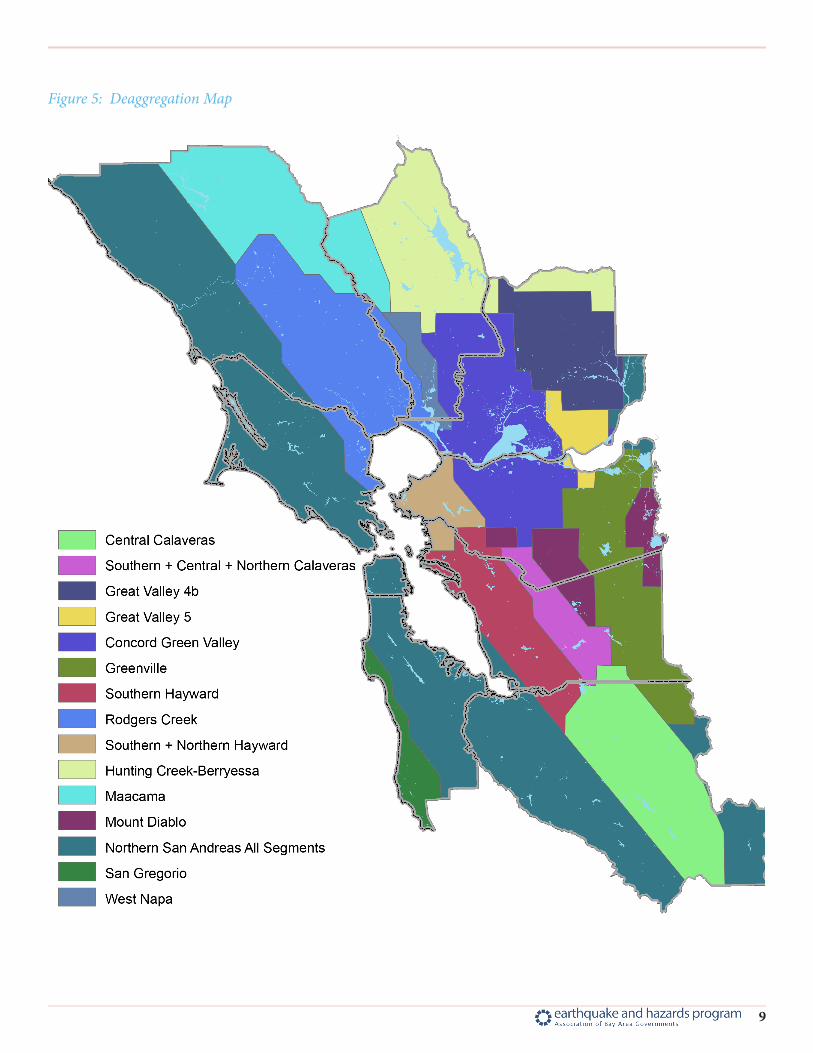
Another new map product developed through this project is a regional deaggregation map. This map represents the probable faul segment that is the largest contributor to the shaking hazard at any given point in the Bay Area. This map was developed by CGS by run-ning a deaggregation of 10% in 50 year hazard along a grid covering the entire Bay Area, at intervals of 0.05 degrees longitude and 0.05 degrees latitude to deter-mine the primary earthquake scenario contributing to shaking hazard affecting that point. USGS trimmed the data set down to 2,193 points at 0.5 degree inter-vals to make the number of data points more manage-able. ABAG then mapped each point using the latitude and longitude in ArcGIS and color-coded each point according to the primary earthquake scenario con-tributor to ground shaking hazard. ABAG then drew polygons by hand to approximate the area affected by each primary scenario, with polygon boundaries drawn approximately halfway between points of differ-ent primary scenarios, essentially splitting the distance in areas where the primary scenario was unknown. Therefore, the level of accuracy may not be very high around the edges of polygons and all of the polygon boundaries represent assumptions about the actual pri-mary scenario. In this manner, polygons were drawn to encompass the entire grid area, and then trimmed to the borders of the nine Bay Area counties.
This completed map showed twenty-four different primary scenarios. At this point, we selected a USGS shaking scenario that most closely represented the fault segment output from the PSHA deaggregation to represent the possible earthquake event represented by each polygon. When the completed map was pre-sented to the Advisory Committee, it became clear that there were easy opportunities to eliminate scenarios that covered only a tiny fraction of land area or had low PSHA PGV’s. Four scenarios were eliminated due to covering very small land areas: Bartlett Creek
9
Figure 5: Deaggregation Map
10
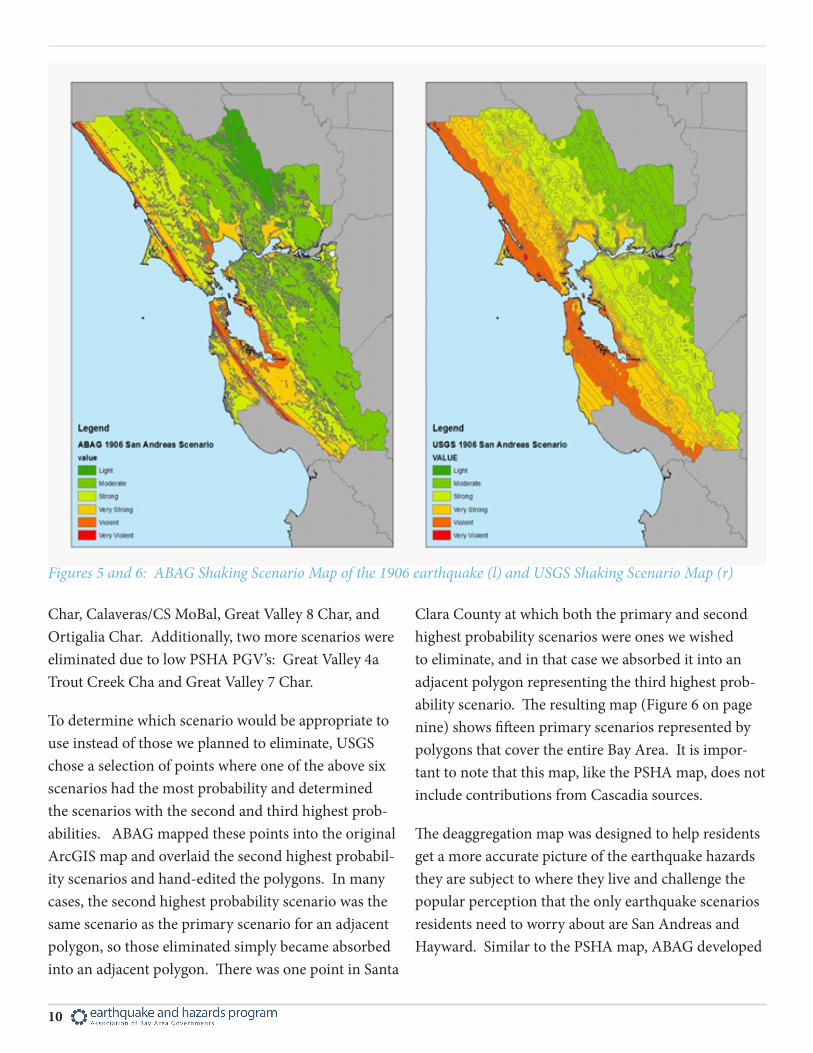
Char, Calaveras/CS MoBal, Great Valley 8 Char, and Ortigalia Char. Additionally, two more scenarios were eliminated due to low PSHA PGV’s: Great Valley 4a Trout Creek Cha and Great Valley 7 Char.
To determine which scenario would be appropriate to use instead of those we planned to eliminate, USGS chose a selection of points where one of the above six scenarios had the most probability and determined the scenarios with the second and third highest prob-abilities. ABAG mapped these points into the original ArcGIS map and overlaid the second highest probabil-ity scenarios and hand-edited the polygons. In many cases, the second highest probability scenario was the same scenario as the primary scenario for an adjacent polygon, so those eliminated simply became absorbed into an adjacent polygon. There was one point in Santa
Clara County at which both the primary and second highest probability scenarios were ones we wished to eliminate, and in that case we absorbed it into an adjacent polygon representing the third highest prob-ability scenario. The resulting map (Figure 6 on page nine) shows fifteen primary scenarios represented by polygons that cover the entire Bay Area. It is impor-tant to note that this map, like the PSHA map, does not include contributions from Cascadia sources.
The deaggregation map was designed to help residents get a more accurate picture of the earthquake hazards they are subject to where they live and challenge the popular perception that the only earthquake scenarios residents need to worry about are San Andreas and Hayward. Similar to the PSHA map, ABAG developed
Figures 5 and 6: ABAG Shaking Scenario Map of the 1906 earthquake (l) and USGS Shaking Scenario Map (r)
11
an explanation for website users to better understand the map10 and how to use it to assess their risk and decide which mitigation actions are most appropriate to take.
Scenario Shaking Maps
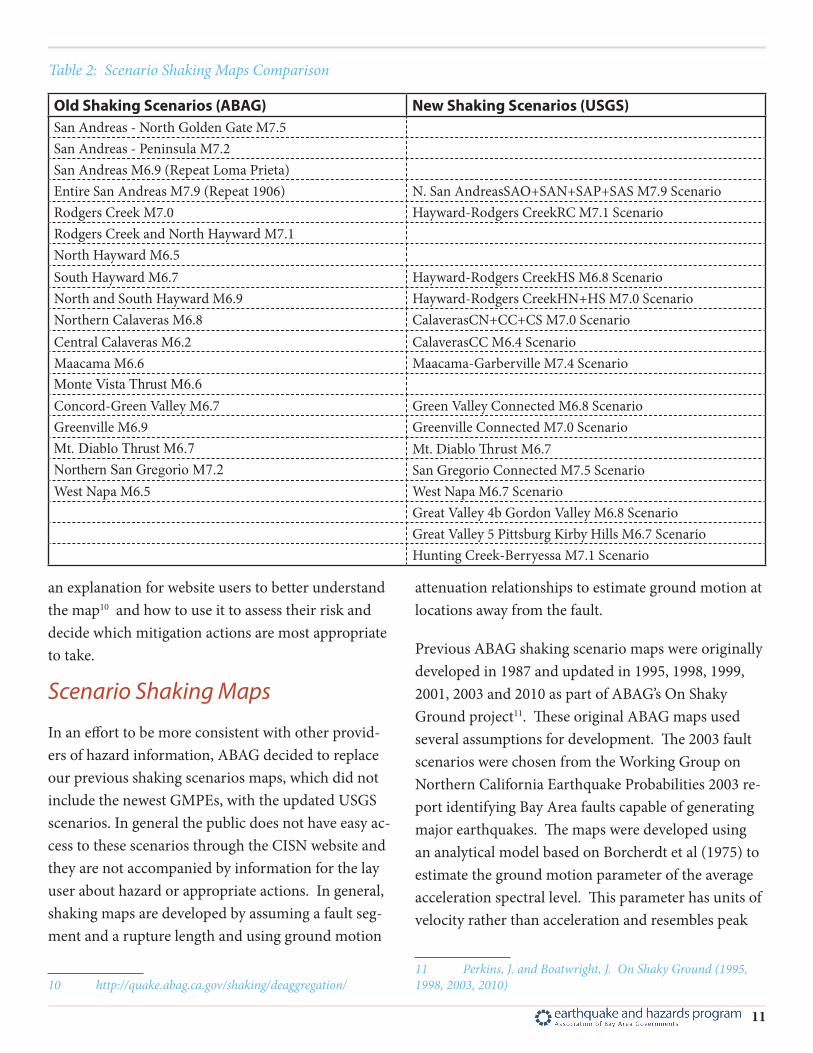
In an effort to be more consistent with other provid-ers of hazard information, ABAG decided to replace our previous shaking scenarios maps, which did not include the newest GMPEs, with the updated USGS scenarios. In general the public does not have easy ac-cess to these scenarios through the CISN website and they are not accompanied by information for the lay user about hazard or appropriate actions. In general, shaking maps are developed by assuming a fault seg-ment and a rupture length and using ground motion
10 http://quake.abag.ca.gov/shaking/deaggregation/
attenuation relationships to estimate ground motion at locations away from the fault.
Previous ABAG shaking scenario maps were originally developed in 1987 and updated in 1995, 1998, 1999, 2001, 2003 and 2010 as part of ABAG’s On Shaky Ground project11. These original ABAG maps used several assumptions for development. The 2003 fault scenarios were chosen from the Working Group on Northern California Earthquake Probabilities 2003 re-port identifying Bay Area faults capable of generating major earthquakes. The maps were developed using an analytical model based on Borcherdt et al (1975) to estimate the ground motion parameter of the average acceleration spectral level. This parameter has units of velocity rather than acceleration and resembles peak
11 Perkins, J. and Boatwright, J. On Shaky Ground (1995, 1998, 2003, 2010)
Old Shaking Scenarios (ABAG) New Shaking Scenarios (USGS)San Andreas - North Golden Gate M7.5San Andreas - Peninsula M7.2San Andreas M6.9 (Repeat Loma Prieta)Entire San Andreas M7.9 (Repeat 1906) N. San AndreasSAO+SAN+SAP+SAS M7.9 ScenarioRodgers Creek M7.0 Hayward-Rodgers CreekRC M7.1 ScenarioRodgers Creek and North Hayward M7.1North Hayward M6.5South Hayward M6.7 Hayward-Rodgers CreekHS M6.8 ScenarioNorth and South Hayward M6.9 Hayward-Rodgers CreekHN+HS M7.0 ScenarioNorthern Calaveras M6.8 CalaverasCN+CC+CS M7.0 ScenarioCentral Calaveras M6.2 CalaverasCC M6.4 ScenarioMaacama M6.6 Maacama-Garberville M7.4 ScenarioMonteVistaThrustM6.6Concord-Green Valley M6.7 Green Valley Connected M6.8 ScenarioGreenville M6.9 Greenville Connected M7.0 ScenarioMt.DiabloThrustM6.7 Mt. Diablo Thrust M6.7NorthernSanGregorioM7.2 San Gregorio Connected M7.5 ScenarioWest Napa M6.5 West Napa M6.7 Scenario
Great Valley 4b Gordon Valley M6.8 ScenarioGreat Valley 5 Pittsburg Kirby Hills M6.7 ScenarioHunting Creek-Berryessa M7.1 Scenario
Table 2: Scenario Shaking Maps Comparison

12
velocity more than peak acceleration. The model was calibrated by fitting the attenuation curve determined by Borcherdt et al (1975) for the 1906 San Andreas earthquake to determine the relationship between the average acceleration, spectral level, and intensity. The variation of intensity with amplification determined by Borcherdt et al (1975) was also considered. These maps accounted for local site conditions by using an amplification factor derived from previous ABAG re-ports12. Directivity was also included by incrementally increasing shaking intensity near the fault segment. The resulting intensity model was then tested for both the 1989 Loma Prieta and then 1984 Morgan Hill earthquakes using observed damage in both of these earthquakes.
The US Geological Survey has expanded and updated their ShakeMap scenarios with the revised GMPEs determined by the PEER-NGA Project. The scenarios are based on the Working Group on California Earth-quake Probabilities’ (Working Group) UCERF3; the set of possible scenarios was expanded to include fault systems with strain rates as low as one mm/yr. Ground motions for the scenarios were determined using the Boore and Atkinson (2007) GMPEs for peak accelera-tion and velocity, and response spectral ordinates. Site conditions are taken from Wills et al. (2000), and site correction amplification comes from amplitude and frequency-dependent factors from Borcherdt (1994). The ShakeMap methodology does not consider direc-tivity. The approach only gives mean peak ground mo-tions, so ground motions for actual ruptures of these fault segments can vary significantly.
As is evident by Figure 6 on page 10, the hazard is significantly higher in some locations and in others is significantly lower. This is largely due to increased sensitivity in the model to soil conditions and how they affect amplification. The changes in hazard were explained on the website, as residents may become
12 ibid
alarmed if their shaking hazard has suddenly appeared to increase significantly (such as on the peninsula).
Website
The ABAG website was last updated in 2010 with a grant from USGS. That update was a major update departure in philosophy from the previous website. Considerable effort was made to receive user input to the development of the site. The new design was focused around user groups as a way to better organize the major information on the site. That redesign effort significantly modernized the website infrastructure and made future changes to the design and format of the site significantly easier.
In the short time since that initial update ABAG had been considering a second update to the site to bet-ter reflect more recent work and to further improve the design and flow of the site. ABAG identified some priorities for the website to be addressed through this project. These priorities included updating retrofit resources, providing better decision making guidance for residents, and adding more local resources for residents to better understand the tools available for managing hazards in their own jurisdiction. ABAG also identified some issues with the design of the web-site. The Earthquake and Hazards Program website provides hazards information to hundreds of viewers daily, garnering over one million hits since the last site update in 2010. However, the look and feel of the site had become quickly outdated and we felt that the orga-nization of information by audience was not as useful or user-friendly as originally been imagined. There was also no good place on the website to highlight new projects, and separate pages for each individual earth-quake related hazard made the site feel clunky and information difficult to access.
ABAG staff developed a new website organization and flow that included the development of project

13
pages, topic pages, and hazards pages. New project pages were developed for each ABAG project, includ-ing a project overview and any products developed as part of the project13. Topic pages were cleaned up and clarified, and a new housing page was developed to combine a wide variety of housing information under one umbrella which had previously been scattered over several pages. For hazard topics, all earthquake hazards information, including shaking, liquefaction, faults, and landslides, was combined on to a single earthquake page. Lastly, ABAG staff developed county pages for each Bay Area county featuring the PSHA map and deaggregation map for each county along
13 The web page for this project can be found at http://quake.abag.ca.gov/projects/earthquake-mapping-update/
with a description of local hazards and local resources and programs. These county pages are accessible from the earthquake hazard page.
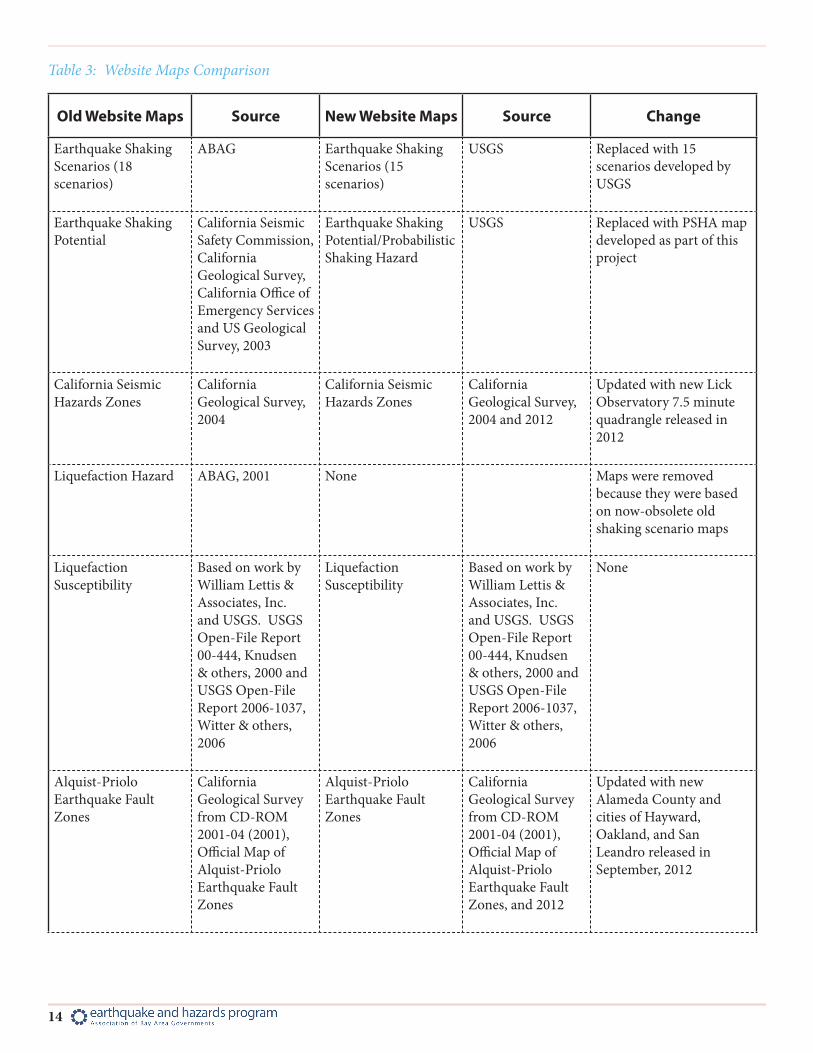
ABAG also replaced, updated, or removed other haz-ard maps to better reflect current hazard information. All of the map changes are summarized in Table 3 on pages 14-15.
Conclusion
Through this project ABAG was able to develop a risk based framework for communicating earthquake haz-ard, consequence and mitigation options to the public. This project helped ABAG and the Committee better
Figure 7: Screen shot of new website redesign
14
Old Website Maps Source New Website Maps Source Change
Earthquake Shaking Scenarios (18 scenarios)
ABAG Earthquake Shaking Scenarios (15 scenarios)
USGS Replaced with 15 scenarios developed by USGS
Earthquake Shaking Potential
California Seismic Safety Commission, California Geological Survey, California Office of Emergency Services and US Geological Survey, 2003
Earthquake Shaking Potential/Probabilistic Shaking Hazard
USGS Replaced with PSHA map developed as part of this project
California Seismic Hazards Zones
California Geological Survey, 2004
California Seismic Hazards Zones
California Geological Survey, 2004 and 2012
Updated with new Lick Observatory 7.5 minute quadrangle released in 2012
Liquefaction Hazard ABAG, 2001 None Maps were removed because they were based on now-obsolete old shaking scenario maps
Liquefaction Susceptibility
Based on work by William Lettis & Associates, Inc. and USGS. USGS Open-File Report 00-444, Knudsen & others, 2000 and USGS Open-File Report 2006-1037, Witter & others, 2006
Liquefaction Susceptibility
Based on work by William Lettis & Associates, Inc. and USGS. USGS Open-File Report 00-444, Knudsen & others, 2000 and USGS Open-File Report 2006-1037, Witter & others, 2006
None
Alquist-Priolo Earthquake Fault Zones
California Geological Survey from CD-ROM 2001-04 (2001), Official Map of Alquist-Priolo Earthquake Fault Zones
Alquist-Priolo Earthquake Fault Zones
California Geological Survey from CD-ROM 2001-04 (2001), Official Map of Alquist-Priolo Earthquake Fault Zones, and 2012
Updated with new Alameda County and cities of Hayward, Oakland, and San Leandro released in September, 2012
Table 3: Website Maps Comparison

15
Earthquake-Induced Landslides
California Geological Survey, 2004
Earthquake-Induced Landslides
California Geological Survey, 2004 and 2012
Updated with new Lick Observatory 7.5 minute quadrangle released in 2012
Rainfall-Induced Landslides – Existing Landslides
USGS Rainfall-Induced Landslides – Existing Landslides
USGS None
Rainfall-Induced Landslides – Debris Flow Source Areas
USGS Rainfall-Induced Landslides – Debris Flow Source Areas
USGS None
Tsunami Inundation California Emergency Management Agency, Coastal Region (2009)
Tsunami Inundation California Emergency Management Agency, Coastal Region (2009)
None
Sea Level Rise Inundation data from Knowles (2008). Additional salt pond elevation data by Siegel and Bachand (2002)
Sea Level Rise (hosted on NOAA webpage)
NOAA Now linked to NOAA Sea Level Rise viewer
Flood Maps FEMA Q3 (2003) and DFIRM (2009)
Flood Maps FEMA Q3 (2003) and DFIRM (2012)
San Mateo, Sonoma, and Solano Counties updated with 2012 DFIRM
Wildland-Urban Interface Fire Threat
California Department of Forestryand Fire Protection, 2003
Wildland-Urban Interface Fire Threat
California Department of Forestryand Fire Protection, 2003
None
Wildfire Threat California Department of Forestry and Fire Protection, 2005
Wildfire Threat California Department of Forestry and Fire Protection, 2005
None
Wildfire Perimeters, 1950-2008
California Department of Forestry and Fire Protection, 2008
Wildfire Perimeters, 1950-2011
California Department of Forestry and Fire Protection, 2011
Updated with information from 2008-2011
16
understand some issues around communicating haz-ards and risks as well as some website issues that were not able to be resolved under the scope of this project. Future work will be able to expand on this framework and provide additional details and information for the public to inform their understanding of risk in the Bay Area. Some next steps may include:
Hazards
• Incorporate products from UCERF3 as they be-come available
• Develop frequency of MMI exceedance map
• Time lapse video of shaking from Bay Area earth-quakes over the past 250 years to better visually understand seismicity patterns of the Bay Area.
Consequence
• Update housing loss numbers based on new sce-narios
• Update road closure numbers based on new sce-narios
Risk
• Better tie in of liquefaction hazard and risk
Mitigation
• Developing a tutorial video on how to best use the maps to make decisions about your home
Improved Tools
• Migrating mapping data to a new interface, as ABAG’s mapping interface is not powerful enough to accommodate many desired features, such as us-ing a single interface with several hazard layers that can be turned on and off, or defaulting to a specific scenario display based on which link users use to
access the maps.
Acknowledgements
ABAG staff would like to acknowledge the following individuals who contributed greatly to the develop-ment of this project:
Jack Boatwright, USGS*
Rui Chen, CGS
Mary Comerio, UC Berkeley
Johanna Fenton, CalOES*
Michael Germeraad, ABAG
Lucy Jones, USGS
Keith Knudsen, USGS*
Tim MacDonald, USGS
Tim McCrink, CGS*
Michael Smith, ABAG
Heidi Stenner, Exponent*
SR Uma, GNS Science New Zealand
*Indicates Advisory Committee Member
This project was generously funded by a grant from the USGS Earthquake Hazards Program.
17
ReferencesBoore, D. M., Joyner, W. B., and Fumal, T. E., (1997)
Equations for estimating horizontal response spectra and peak acceleration from western North American earth-quakes: A summary of recent work, Seismol. Res. Lett. 68, 128–153.
Borcherdt, R D., Joyner, W.B., Warrick, R.E., and Gibbs, J.F., (1975). Response of local geologic units to ground shak-ing, p. 52-67; in R.D. Borcherdt (ed.), Studies for Seismic Zo-nation of the San Francisco Bay Region, U.S. Geol. Survey Prof. Paper 941-A.
Borcherdt. R.D. (1994). Estimates of Site-Dependent Response Specra for Design (Methodology and Justifica-tion). Earthquake Spectra, Vol. 10, No. 4, 617-653
Chen, R., Branum, D.M., and Wills, C.J. (2011) HA-ZUS Scenario and Annualized Earthquake Loss Estimation for California. California Geological Survey: Special Report 222 Version 1.0.
Gigerenzer, G., Hertwig, R., Van Den Broek, E., Fasolo, B., Katsikopoulos, K.V. (2005). “A 30% chance of rain tomor-row”: How does the public understand probabilistic weather forecasts? Risk Analysis, 25(3), 623-9.
Joyner, W.B. and D.M. Boore (1988). Measurement, characterization, and prediction of strong ground motion, in Earthquake Engineering and Soil Dynamics II, Proc. Am. Soc. Civil Eng. Geotech. Eng. Div. Specialty Conf., June 27-30, 1988, Park City, Utah, 43-102.
Kalkan, E., Wills, C.J., and Branum, D.M. (2010) Seis-mic Hazard Mapping of California Considering Site Effects. Earthquake Spectra: November 2010, Vol. 26, No. 4, pp. 1039-1055.
Mileti, D.S. and Darlington, J. (1995) Societal Response to Revised Earthquake Probabilities in the San Francisco Bay Area. International Journal of Mass Emergencies and Disas-ters: Vol. 13, No. 2. pp 119-145. http://ijmed.org/articles/490/
Perkins, J. and Boatwright, J. On Shaky Ground (1995, 1998, 2003, 2010) Association of Bay Area Governments.
Stein, S., Geller, R., & Liu, M. (2012). Why earthquake hazard maps often fail and what to do about it. Tectonophys-ics, 562–563, 1–25. doi: 10.1016/j.tecto.2012.06.047
Wang, Z.-M., E.W.Woolery, B.-P. Shi, and J. D. Kiefer (2003), Communicating with uncertainty: A critical is-
sue with probabilistic seismic hazard analysis, Eos Trans.AGU,84(46), 501, 506, 508.
Wills, C.J., Petersen, M., Bryant, W., Reichle, M., Sauce-do, G., Tan, S., Taylor, G., and Treiman, J., (2000) A site-con-dition map for California based on geology and shear-wave velocity. Bulletin of the Seismological Society of America: v. 90, no. 6B, p. S187-S208.
Presentation by Public Health Seattle & King County, USGS
Worden, C. B., Gerstenberger, M. C. Rhoades, D. A. and Wald, D. J. (2012). Probabilistic Relationships between Ground-Motion Parameters and Modified Mercalli Intensity in California. Bulletin of the Seismological Society of Amer-ica, 102:1, pp. 204–221.