Embed Size (px)
DESCRIPTION
Subaru/FMOS. “A road to FMOS” (Dec 2007). Commissioning: Brief history & current status. Observation. Dalton & Lewis. Iwamuro. Expected performance. Naoyuki Tamura Instrument scientist Subaru Telescope, NAOJ. @ Dome 4F. - Prime focus unit (PIR) - Echidna - Fibre connector. - PowerPoint PPT Presentation
Citation preview
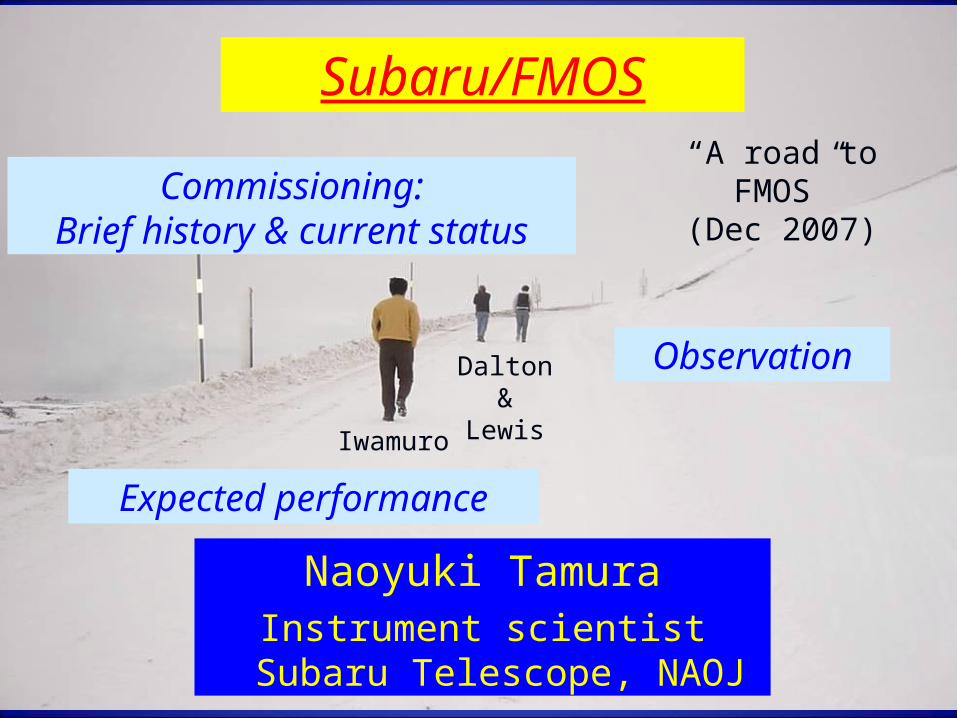
Subaru/FMOS
Commissioning:Brief history & current status
Naoyuki TamuraInstrument scientist
Subaru Telescope, NAOJ
Expected performance
Observation
“A road to FMOS”(Dec 2007)
Iwamuro
Dalton &Lewis
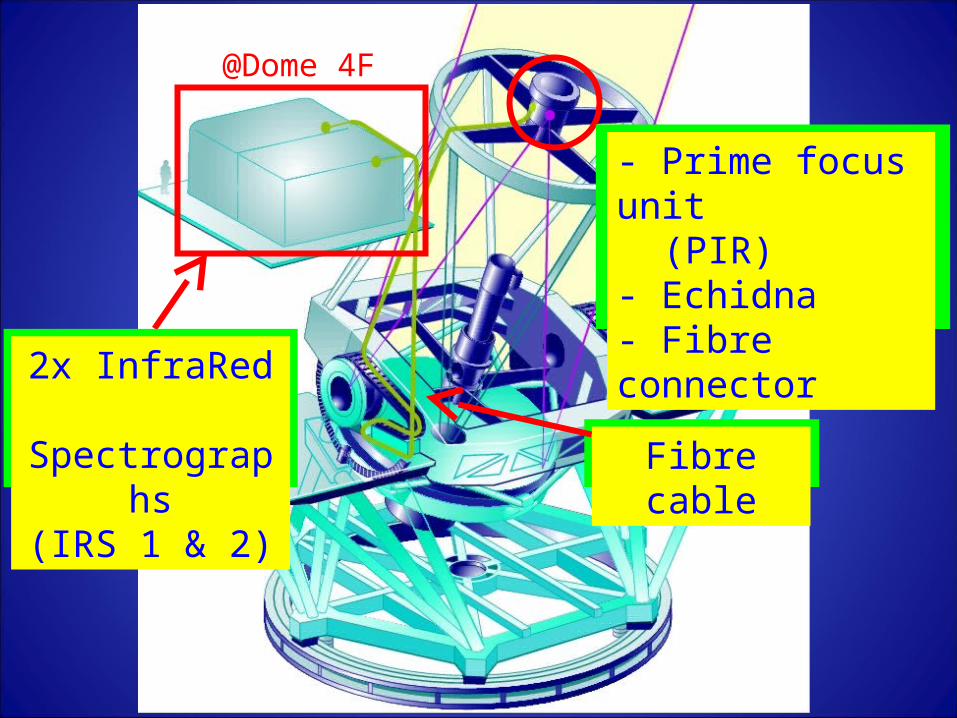
Fibre cable
2x InfraRed Spectrograph
s(IRS 1 & 2)
- Prime focus unit (PIR)- Echidna- Fibre connector
@Dome 4F
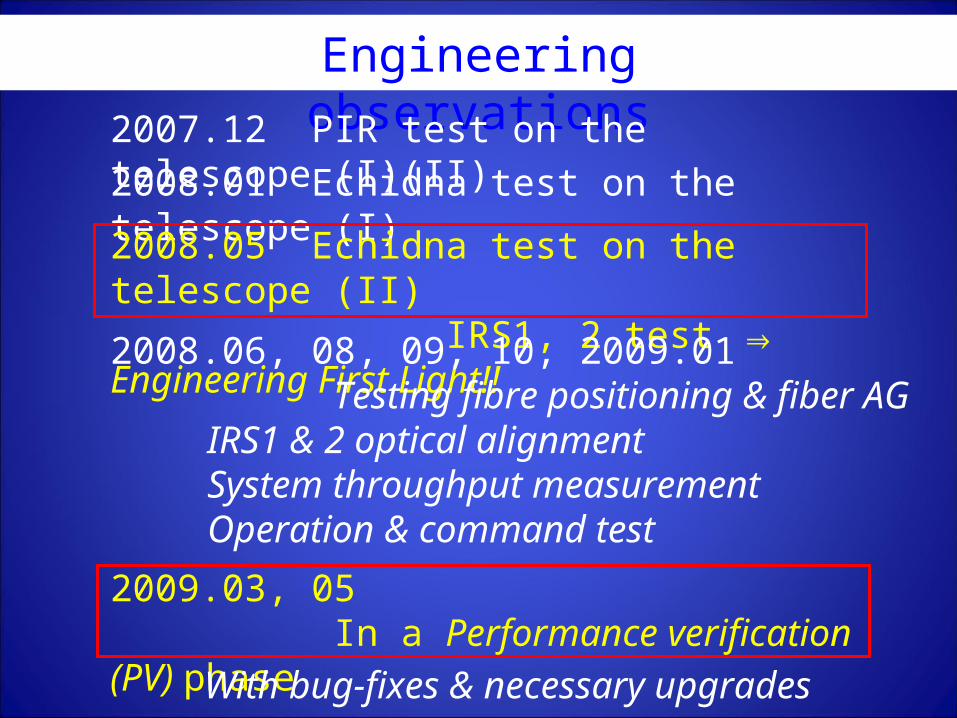
2009.03, 05 In a Performance verification (PV) phase
Engineering observations2007.12 PIR test on the telescope (I)(II)
2008.01 Echidna test on the telescope (I)
2008.05 Echidna test on the telescope (II) IRS1, 2 test ⇒ Engineering First Light!!2008.06, 08, 09, 10, 2009.01 Testing fibre positioning & fiber AG IRS1 & 2 optical alignment System throughput measurement Operation & command test
With bug-fixes & necessary upgrades …
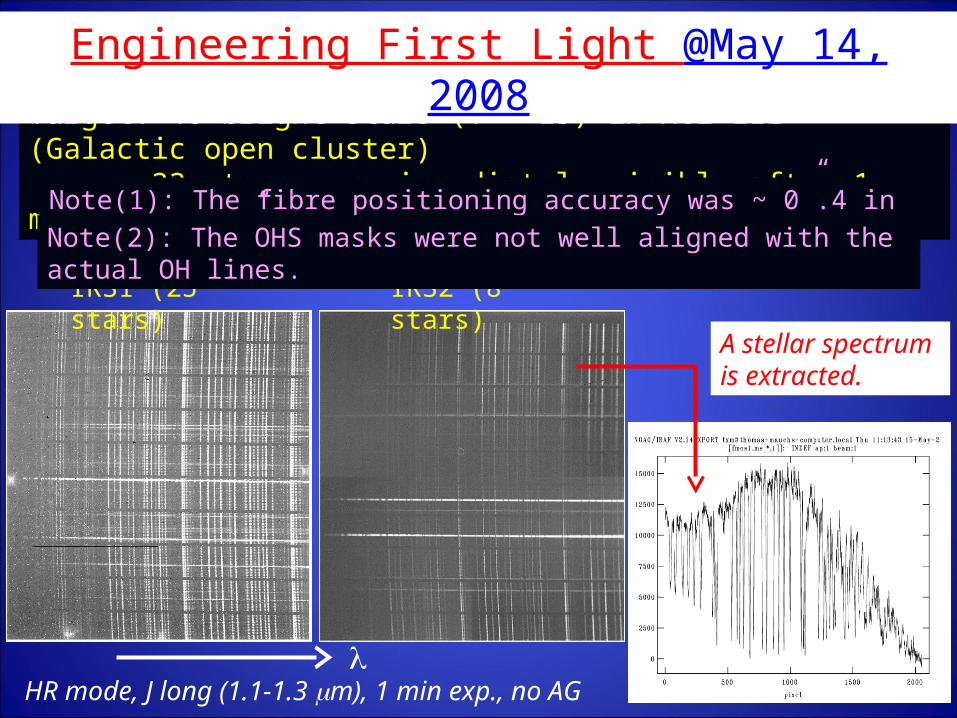
Target: 48 bright stars (V < 15) in Mel 111 (Galactic open cluster) → 33 stars were immediately visible after 1 min exposure!!
Engineering First Light @May 14, 2008
IRS1 (25 stars) IRS2 (8 stars)
HR mode, J long (1.1-1.3 m), 1 min exp., no AG
Note(1): The fibre positioning accuracy was ~ 0”.4 in rms (now ~ 0”.2)
Note(2): The OHS masks were not well aligned with the actual OH lines.
A stellar spectrum is extracted.
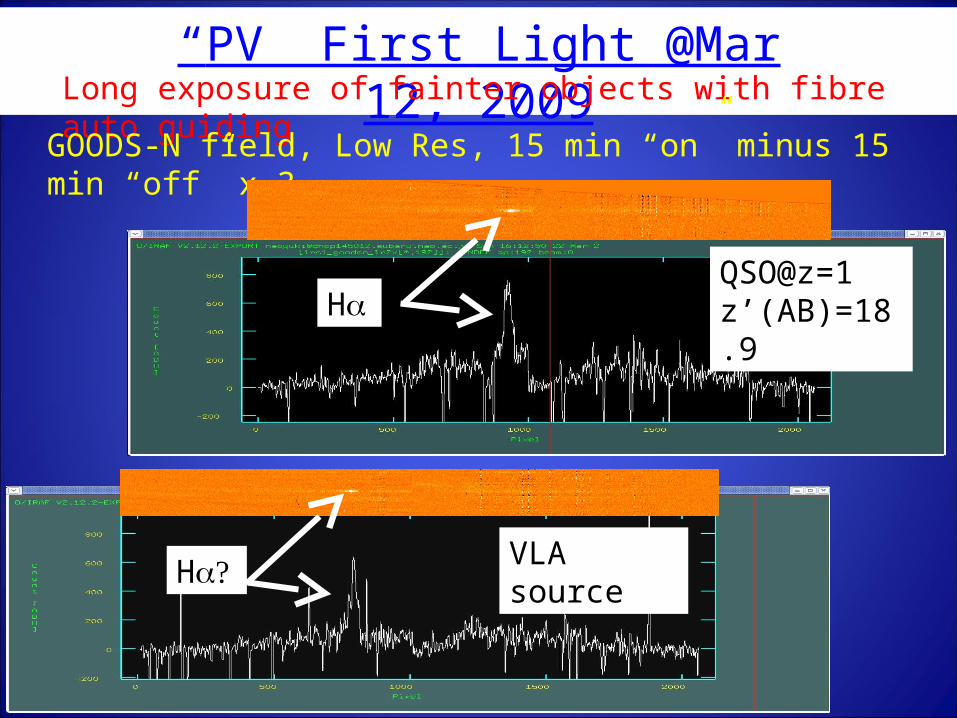
QSO@z=1z’(AB)=18.9
H
VLA source
H
“PV” First Light @Mar 12, 2009Long exposure of fainter objects with fibre auto
guidingGOODS-N field, Low Res, 15 min “on” minus 15 min “off” x 3
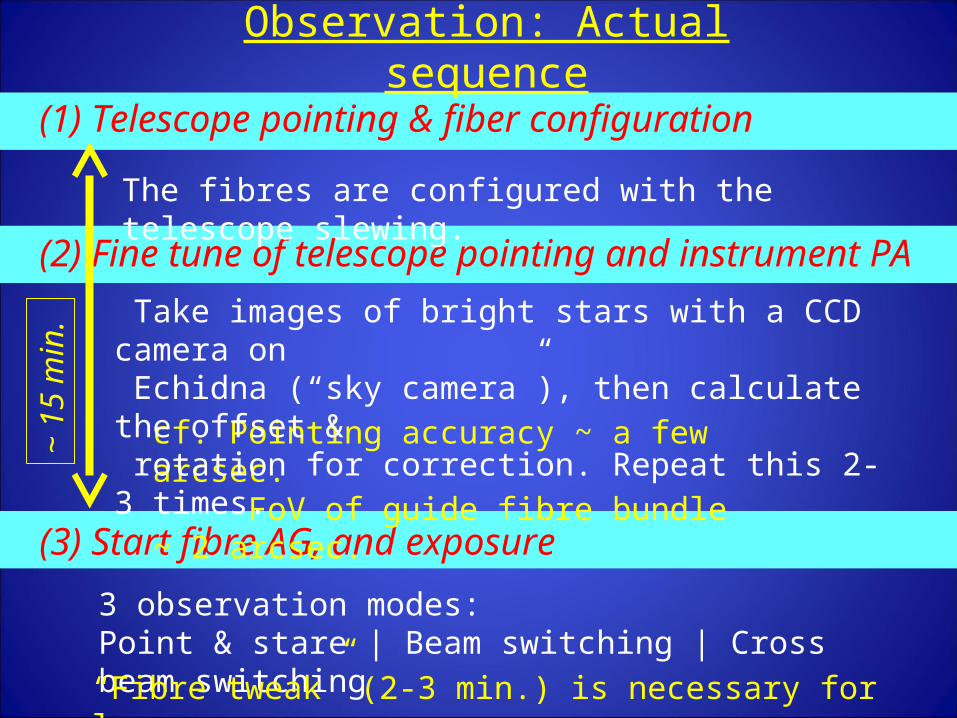
(1) Telescope pointing & fiber configuration
(2) Fine tune of telescope pointing and instrument PA
(3) Start fibre AG, and exposure
Observation: Actual sequence
The fibres are configured with the telescope slewing.
3 observation modes:Point & stare | Beam switching | Cross beam switching “Fibre tweak” (2-3 min.) is necessary for long exposure.
~ 1
5
min
.
cf. Pointing accuracy ~ a few arcsec. FoV of guide fibre bundle ~ 2 arcsec.
Take images of bright stars with a CCD camera on Echidna (“sky camera”), then calculate the offset & rotation for correction. Repeat this 2-3 times.
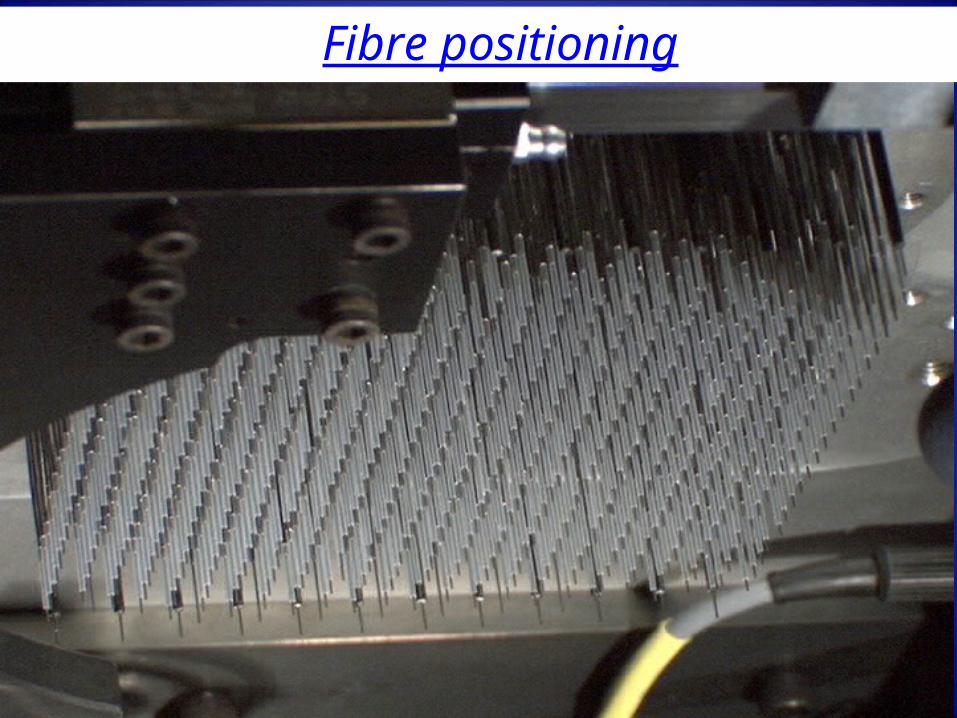
Fibre positioning
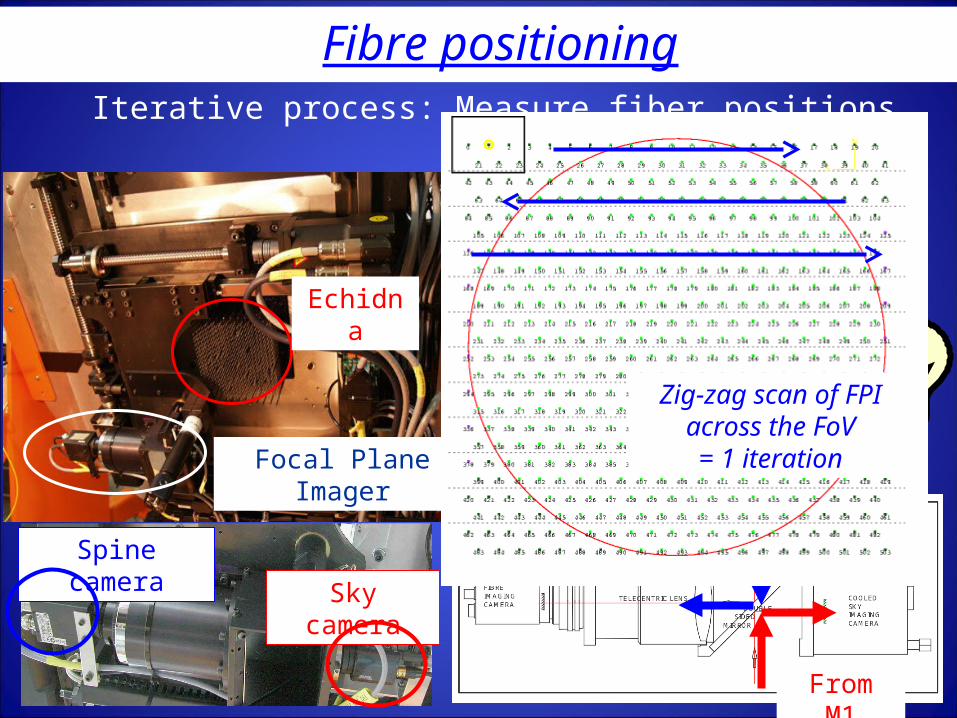
Fibre positioning
Focal Plane Imager
Iterative process: Measure fiber positions & move spines. (with “back” illumination + spine camera)
Spine camera Sky
camera
Echidna
Fibre tip at Prime Focus Back
illumination
From M1
From fibre
...Zig-zag scan of FPI
across the FoV= 1 iteration
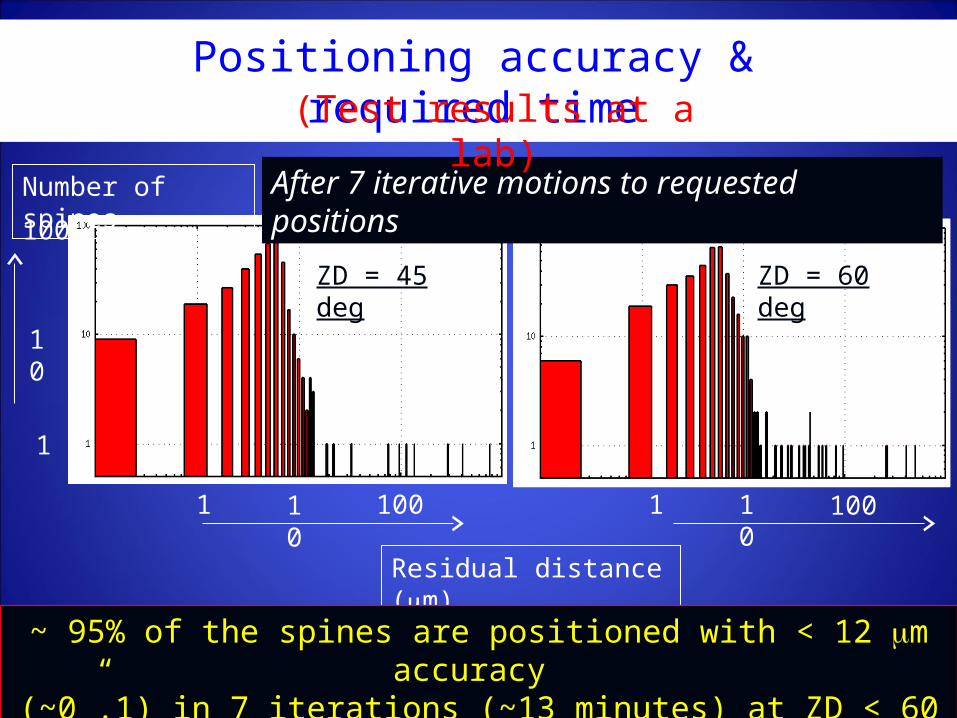
Positioning accuracy & required time
Number of spines100
10
1
1 10
100
1 10
100
Residual distance (m)
ZD = 45 deg
ZD = 60 deg
After 7 iterative motions to requested positions
(Test results at a lab)
~ 95% of the spines are positioned with < 12 m accuracy
(~0”.1) in 7 iterations (~13 minutes) at ZD < 60 deg.
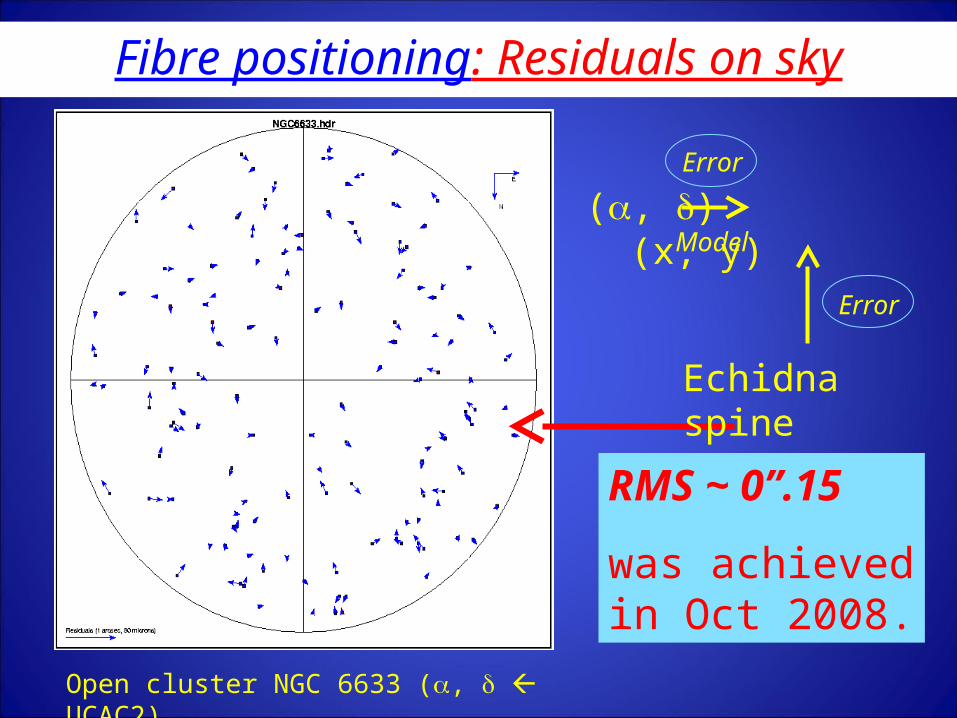
RMS ~ 0”.15
was achievedin Oct 2008.
(, ) (x, y)
Echidna spine
Error
Error
Open cluster NGC 6633 (, UCAC2)
Fibre positioning: Residuals on sky
Model
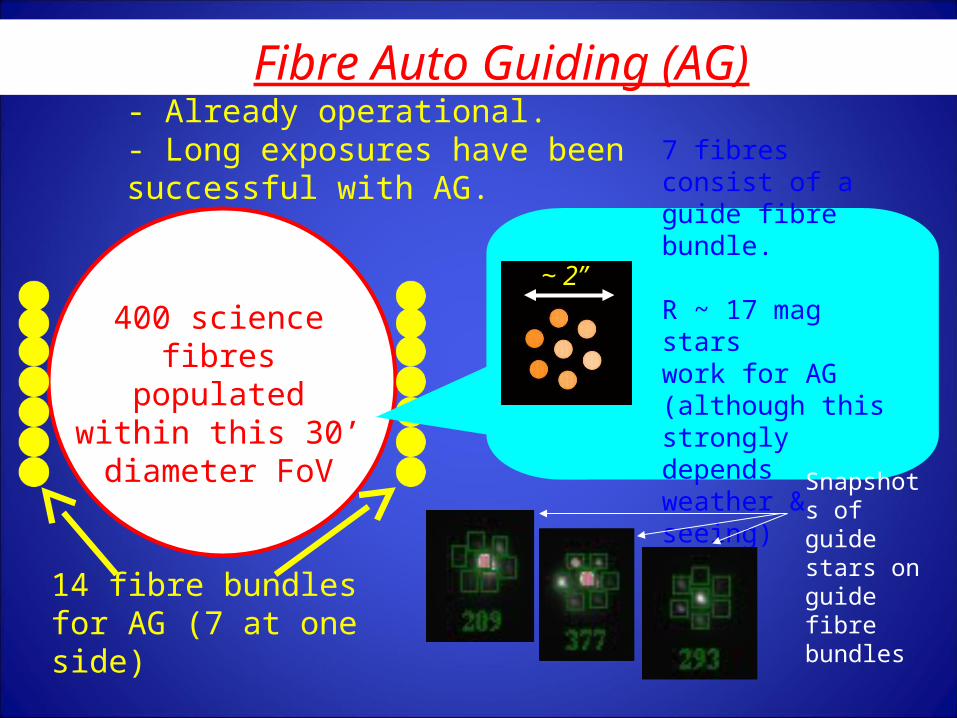
Fibre Auto Guiding (AG)
400 science fibres populated within this
30’ diameter FoV
14 fibre bundles for AG (7 at one side)
~ 2”
7 fibres consist of a guide fibre bundle.
R ~ 17 mag stars work for AG (although this strongly depends weather & seeing)
Snapshots of guide stars on guide fibre bundles
- Already operational.- Long exposures have been successful with AG.
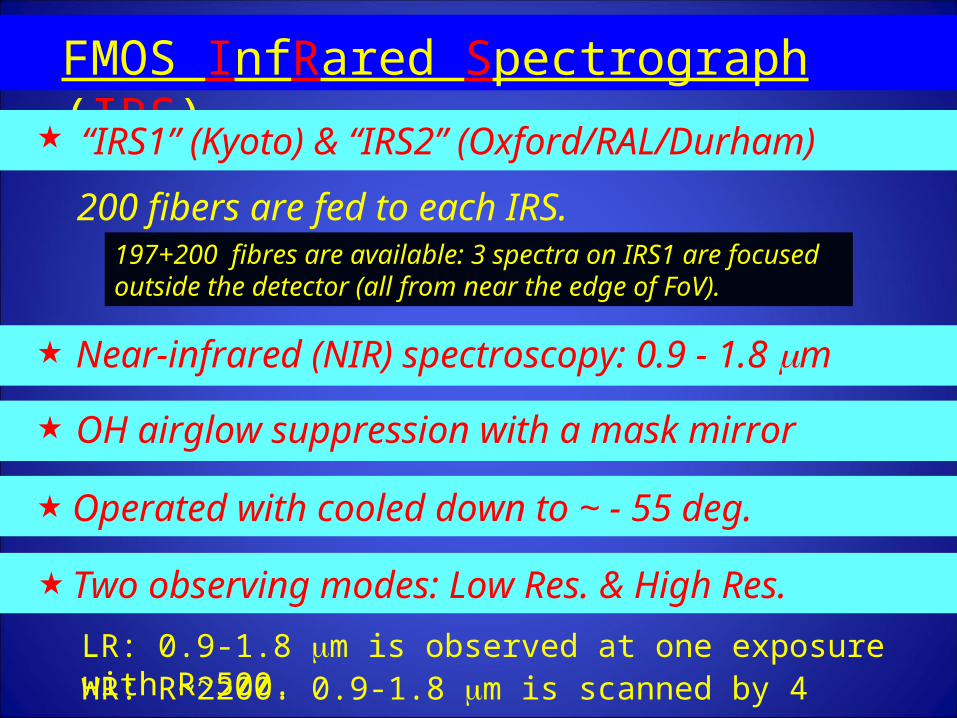
FMOS InfRared Spectrograph (IRS)
OH airglow suppression with a mask mirror
Operated with cooled down to ~ - 55 deg.
Two observing modes: Low Res. & High Res.
200 fibers are fed to each IRS.197+200 fibres are available: 3 spectra on IRS1 are focused outside the detector (all from near the edge of FoV).
Near-infrared (NIR) spectroscopy: 0.9 - 1.8 m
“IRS1” (Kyoto) & “IRS2” (Oxford/RAL/Durham)
LR: 0.9-1.8 m is observed at one exposure with R~500.HR: R~2200. 0.9-1.8 m is scanned by 4 exposures.
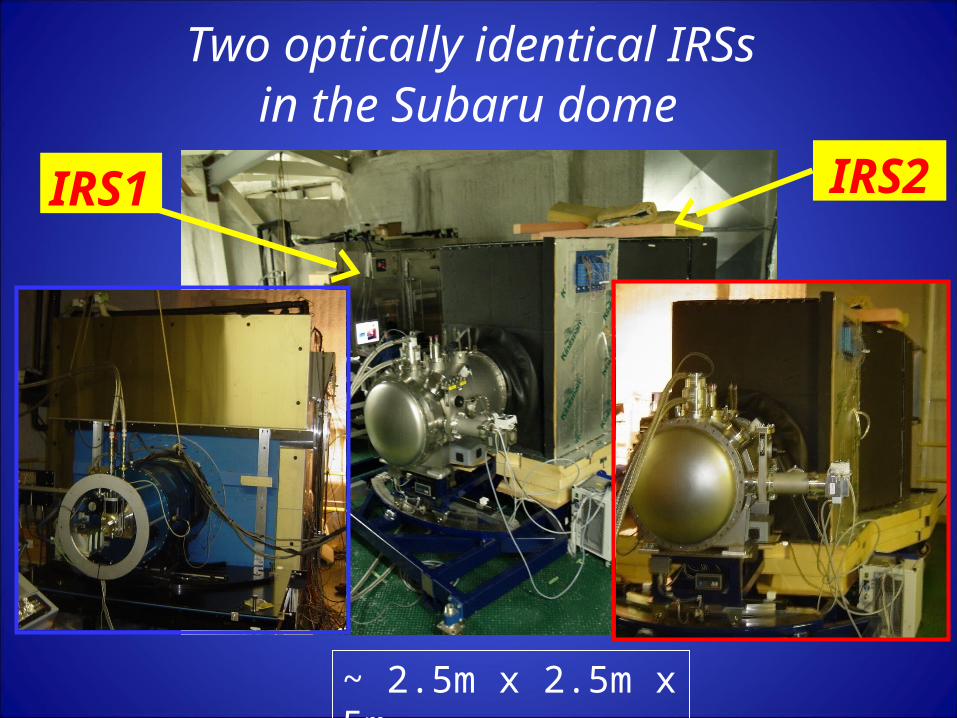
in the Subaru dome
IRS1 IRS2
Two optically identical IRSs
~ 2.5m x 2.5m x 5m
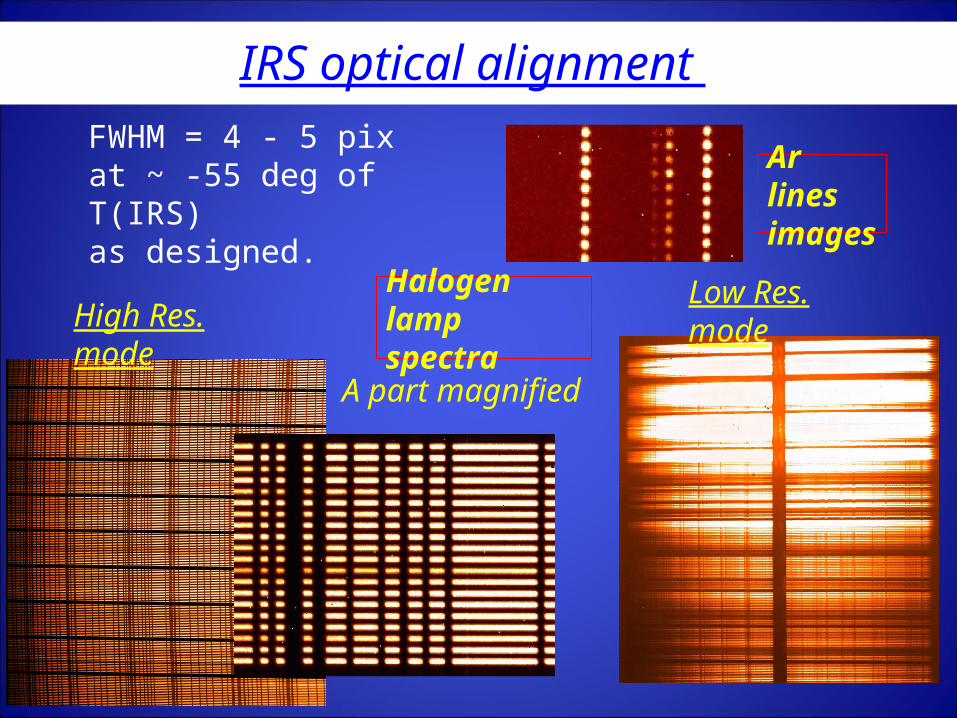
IRS optical alignment
Ar lines images
FWHM = 4 - 5 pixat ~ -55 deg of T(IRS)as designed.
High Res. mode
A part magnified …
Low Res. modeHalogen lamp spectra
PIR+Echidna@ PF
Cs. hole
Obs. floor
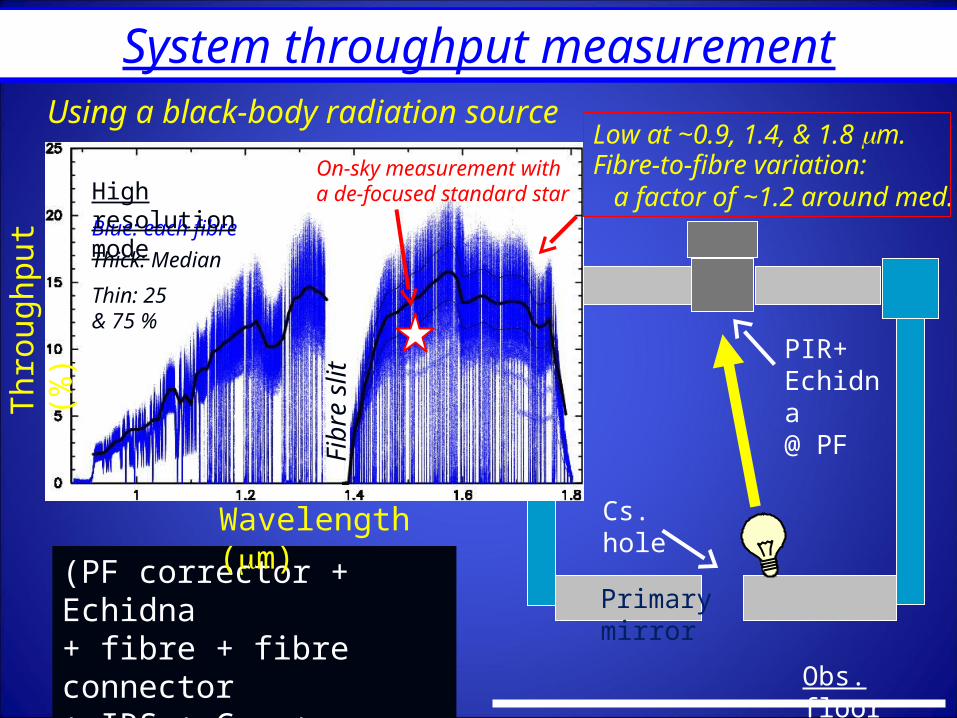
(PF corrector + Echidna+ fibre + fibre connector+ IRS + Cam + detector)x 0.9 (Primary mirror)
System throughput measurementUsing a black-body radiation source
Thr
ough
put (
%)
Wavelength (m)
Fib
re s
lit
Thick: Median
Thin: 25 & 75 %
Blue: each fibre
High resolution modeFibre-to-fibre variation: a factor of ~1.2 around med.
Low at ~0.9, 1.4, & 1.8 m. On-sky measurement with a de-focused standard star
Primary mirror
PIR+Echidna@ PF
Cs. hole
Obs. floor
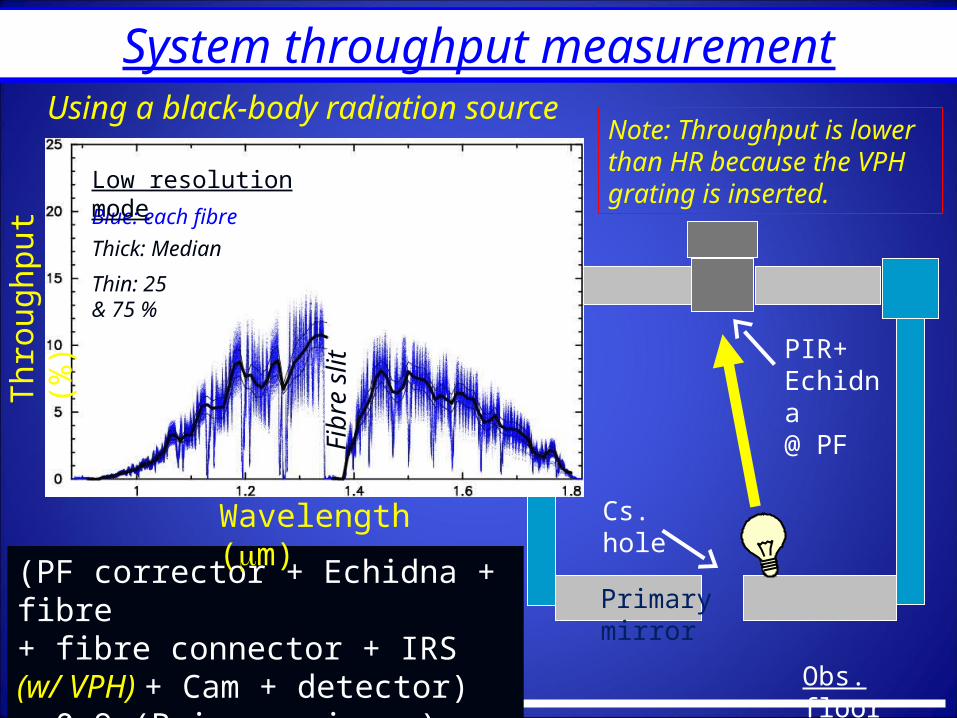
(PF corrector + Echidna + fibre+ fibre connector + IRS (w/ VPH) + Cam + detector)x 0.9 (Primary mirror)
System throughput measurementUsing a black-body radiation source
Thr
ough
put (
%)
Wavelength (m)
Fib
re s
lit
Thick: Median
Thin: 25 & 75 %
Blue: each fibre
Low resolution mode
Note: Throughput is lower than HR because the VPH grating is inserted.
Primary mirror
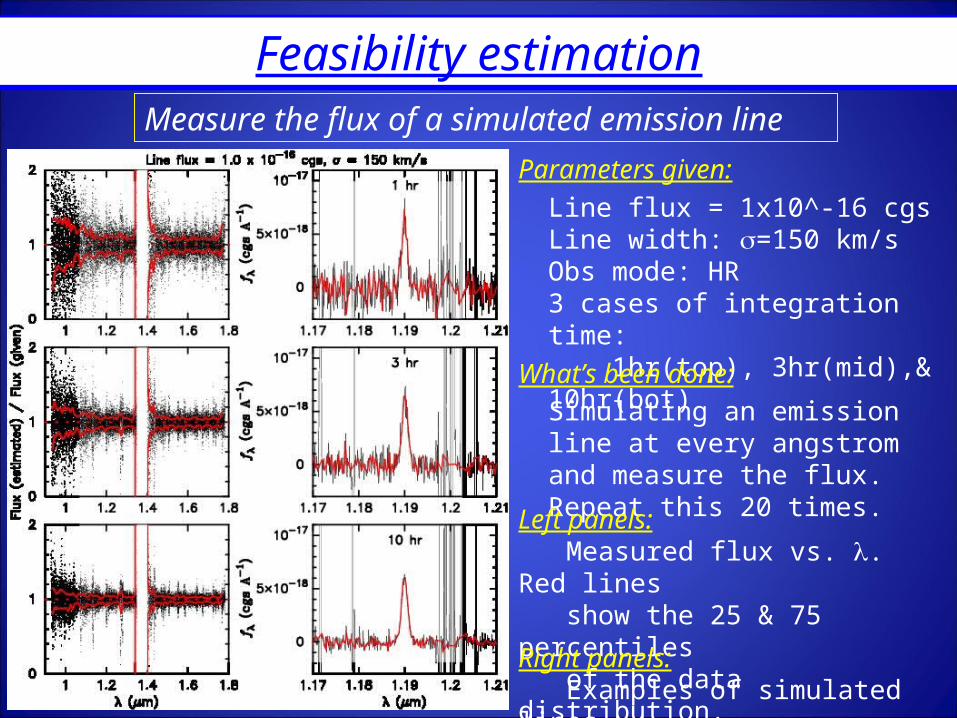
Feasibility estimation
Line flux = 1x10^-16 cgsLine width: =150 km/s Obs mode: HR3 cases of integration time: 1hr(top), 3hr(mid),& 10hr(bot)
Measure the flux of a simulated emission line
Simulating an emission line at every angstrom and measure the flux. Repeat this 20 times.
Parameters given:
What’s been done:
Left panels: Measured flux vs. . Red lines show the 25 & 75 percentiles of the data distribution.Right panels: Examples of simulated lines.
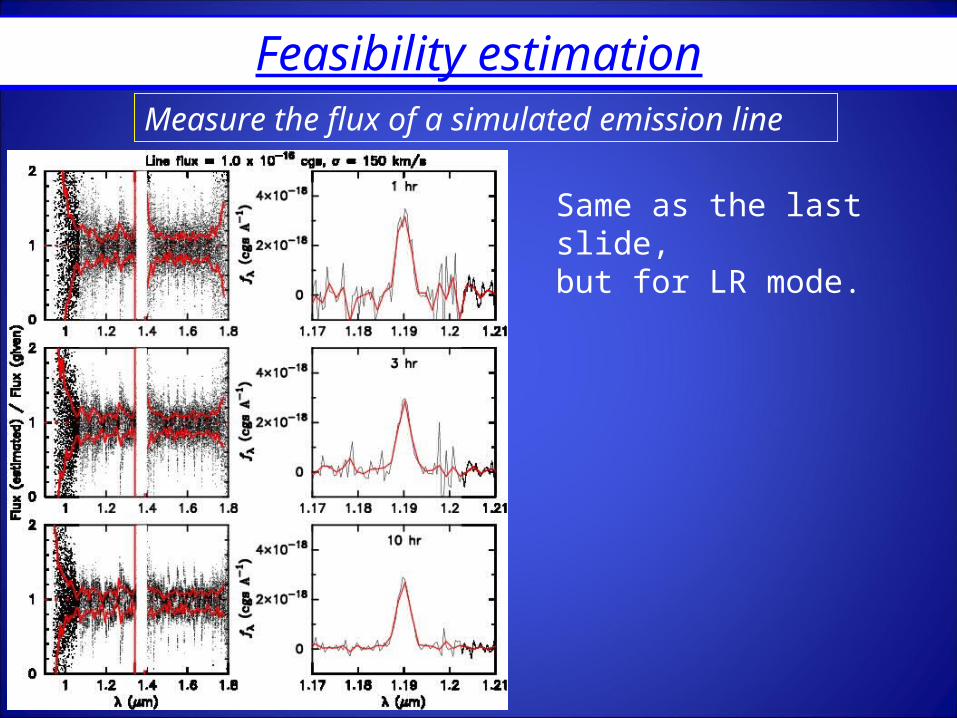
Feasibility estimation
Same as the last slide,but for LR mode.
Measure the flux of a simulated emission line
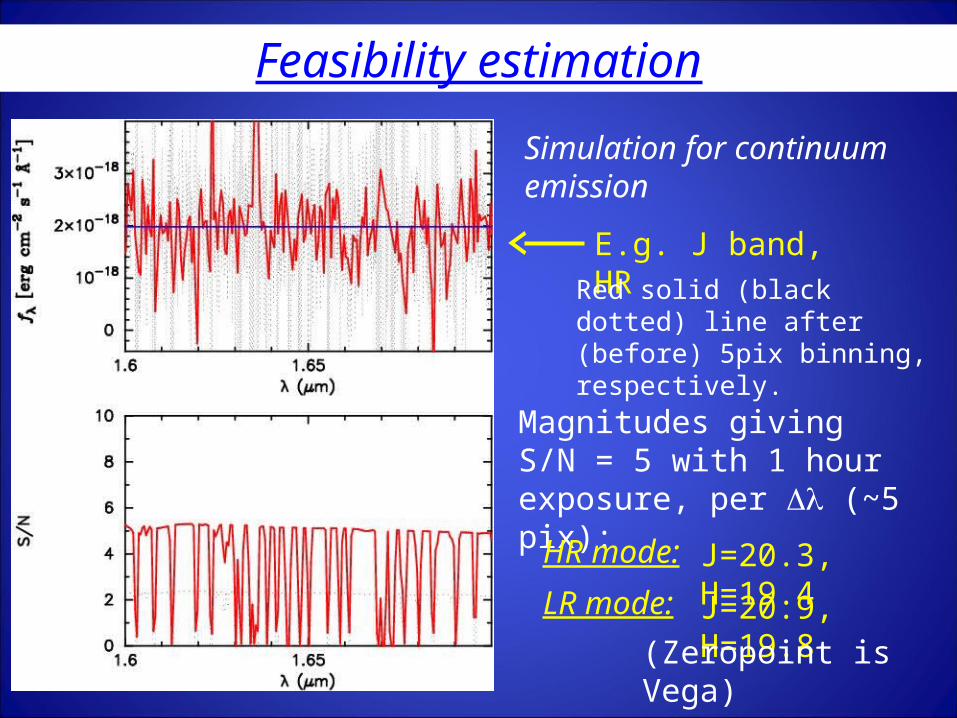
Simulation for continuum emission
Magnitudes giving S/N = 5 with 1 hour exposure, per (~5 pix):
E.g. J band, HR
HR mode:LR mode:
J=20.3, H=19.4J=20.9, H=19.8(Zeropoint is
Vega)
Feasibility estimation
Red solid (black dotted) line after (before) 5pix binning,respectively.
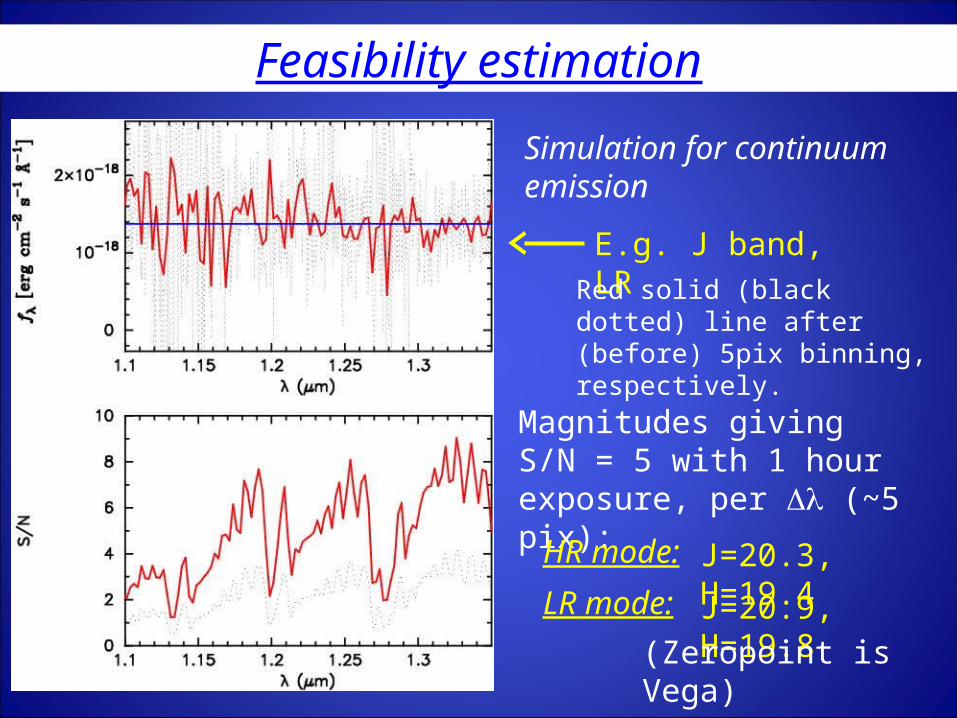
Simulation for continuum emission
Magnitudes giving S/N = 5 with 1 hour exposure, per (~5 pix):
E.g. J band, LR
HR mode:LR mode:
J=20.3, H=19.4J=20.9, H=19.8(Zeropoint is
Vega)
Feasibility estimation
Red solid (black dotted) line after (before) 5pix binning,respectively.
Summary of FMOS status
Echidna & PIR are fully operational.Fibre positioning accuracy is ~0”.2 in RMS by ~13 mins.
Some remaining issues on the spectrographs.
- (IRS2) Stabilize HR ↔ LR at -55 deg.
- (Both) Confirm the instrument background level.
- (IRS1) Small shift of spectrum positions on the detector from one exposure to another due to deflection of the floor. A new platform will be installed to resolve this.
- (IRS1) Stabilize the detector focus mechanism.
Performance estimation
(Need to confirm performance of tweak more quantitatively)
F(line) = 0.5 – 1.0 x 10^-16 cgs for a few hours integration?1 hour, 5 pix binned, S/N=5: J=20.5-21, H=19.5-20 (Vega)
- (Both) Mask alignment to actual OH lines.
- (IRS2) Optimise and characterise the detector readout system.
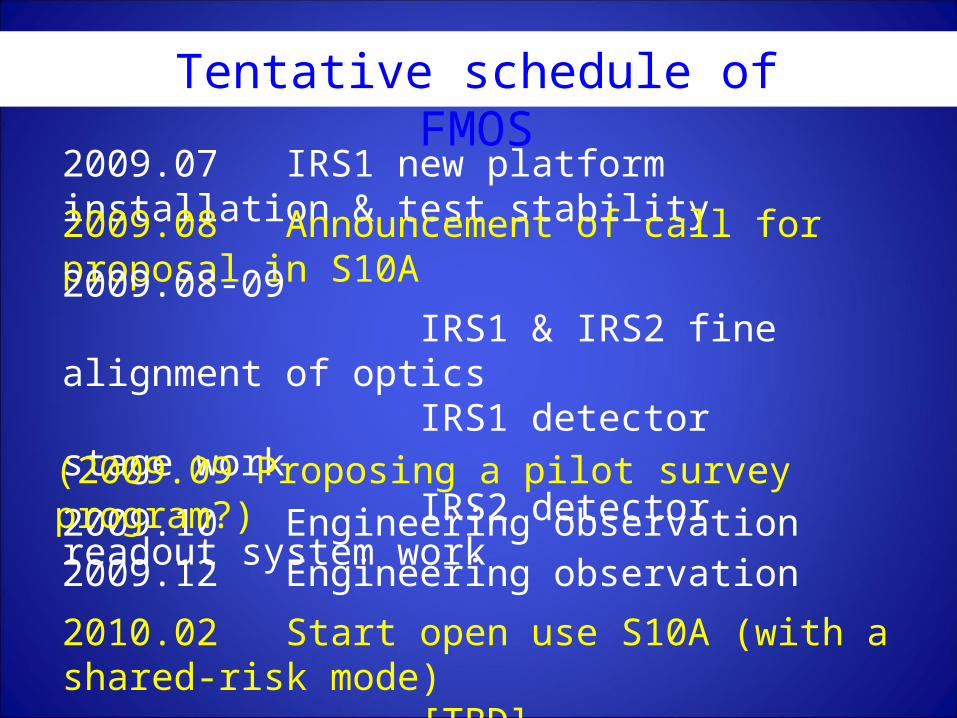
Tentative schedule of FMOS
2009.07 IRS1 new platform installation & test stability
2009.08 Announcement of call for proposal in S10A
2009.08-09 IRS1 & IRS2 fine alignment of optics IRS1 detector stage work IRS2 detector readout system work
2009.10 Engineering observation2009.12 Engineering observation
2010.02 Start open use S10A (with a shared-risk mode) [TBD]
(2009.09 Proposing a pilot survey program?)