Embed Size (px)
Citation preview
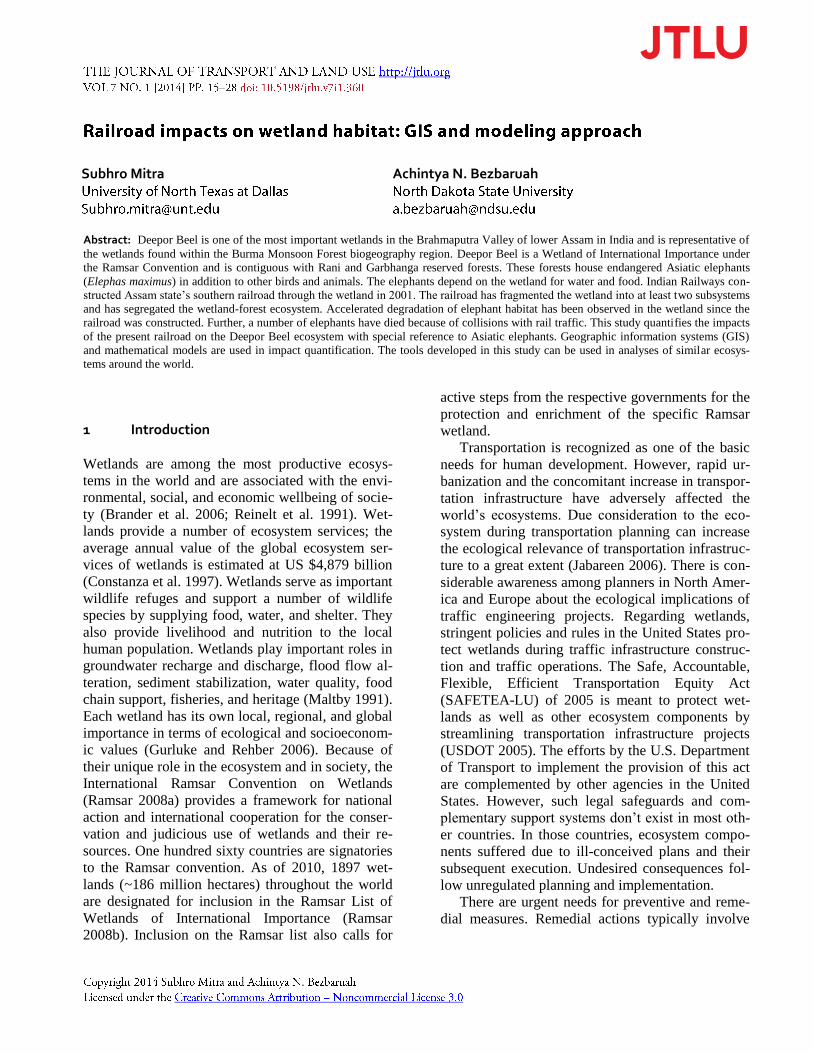
Subhro Mitra Achintya N. Bezbaruah
Abstract: Deepor Beel is one of the most important wetlands in the Brahmaputra Valley of lower Assam in India and is representative of
the wetlands found within the Burma Monsoon Forest biogeography region. Deepor Beel is a Wetland of International Importance under
the Ramsar Convention and is contiguous with Rani and Garbhanga reserved forests. These forests house endangered Asiatic elephants
(Elephas maximus) in addition to other birds and animals. The elephants depend on the wetland for water and food. Indian Railways con-
structed Assam state’s southern railroad through the wetland in 2001. The railroad has fragmented the wetland into at least two subsystems
and has segregated the wetland-forest ecosystem. Accelerated degradation of elephant habitat has been observed in the wetland since the
railroad was constructed. Further, a number of elephants have died because of collisions with rail traffic. This study quantifies the impacts
of the present railroad on the Deepor Beel ecosystem with special reference to Asiatic elephants. Geographic information systems (GIS)
and mathematical models are used in impact quantification. The tools developed in this study can be used in analyses of similar ecosys-
tems around the world.
1 Introduction
Wetlands are among the most productive ecosys-
tems in the world and are associated with the envi-
ronmental, social, and economic wellbeing of socie-
ty (Brander et al. 2006; Reinelt et al. 1991). Wet-
lands provide a number of ecosystem services; the
average annual value of the global ecosystem ser-
vices of wetlands is estimated at US $4,879 billion
(Constanza et al. 1997). Wetlands serve as important
wildlife refuges and support a number of wildlife
species by supplying food, water, and shelter. They
also provide livelihood and nutrition to the local
human population. Wetlands play important roles in
groundwater recharge and discharge, flood flow al-
teration, sediment stabilization, water quality, food
chain support, fisheries, and heritage (Maltby 1991).
Each wetland has its own local, regional, and global
importance in terms of ecological and socioeconom-
ic values (Gurluke and Rehber 2006). Because of
their unique role in the ecosystem and in society, the
International Ramsar Convention on Wetlands
(Ramsar 2008a) provides a framework for national
action and international cooperation for the conser-
vation and judicious use of wetlands and their re-
sources. One hundred sixty countries are signatories
to the Ramsar convention. As of 2010, 1897 wet-
lands (~186 million hectares) throughout the world
are designated for inclusion in the Ramsar List of
Wetlands of International Importance (Ramsar
2008b). Inclusion on the Ramsar list also calls for
active steps from the respective governments for the
protection and enrichment of the specific Ramsar
wetland.
Transportation is recognized as one of the basic
needs for human development. However, rapid ur-
banization and the concomitant increase in transpor-
tation infrastructure have adversely affected the
world’s ecosystems. Due consideration to the eco-
system during transportation planning can increase
the ecological relevance of transportation infrastruc-
ture to a great extent (Jabareen 2006). There is con-
siderable awareness among planners in North Amer-
ica and Europe about the ecological implications of
traffic engineering projects. Regarding wetlands,
stringent policies and rules in the United States pro-
tect wetlands during traffic infrastructure construc-
tion and traffic operations. The Safe, Accountable,
Flexible, Efficient Transportation Equity Act
(SAFETEA-LU) of 2005 is meant to protect wet-
lands as well as other ecosystem components by
streamlining transportation infrastructure projects
(USDOT 2005). The efforts by the U.S. Department
of Transport to implement the provision of this act
are complemented by other agencies in the United
States. However, such legal safeguards and com-
plementary support systems don’t exist in most oth-
er countries. In those countries, ecosystem compo-
nents suffered due to ill-conceived plans and their
subsequent execution. Undesired consequences fol-
low unregulated planning and implementation.
There are urgent needs for preventive and reme-
dial measures. Remedial actions typically involve
JOURNAL OF TRANSPORT AND LAND USE 7.1
________________________________________________________________________________
much higher costs compared to preventive steps in-
corporated at the beginning of a project.
2 Background
Wetlands are associated with a number of bird and
animal species, including elephants. Wetlands are
attractive to elephants not only for the water but also
as a food source, since wetlands include different
species of plants. India has the largest Asiatic ele-
phant (Elephas maximus) population (numbering
21,000–25,000) in the world. Assam state in India,
which is regarded as one of the strongholds of Asiat-
ic elephants with a population of about 5200 in 2005
(Authors 2006), is considered the key conservation
region for the species (Stracey 1963). Overall popu-
lation of the species is in decline and habitat loss has
been cited as one of the major causes of that decline
(Leimgruber et al. 2003; Thitaram et al. 2008).
Poaching for ivory, human-elephant competition for
land and food, and lack of management infrastruc-
ture are the other major reasons for elephant popula-
tion decline. Elephants depend on perennial water
sources such as wetlands for food, water, and rec-
reation (Fernando et al. 2008, Mosepele et al. 2009).
2.1 Genesis of the present problem
Deepor Beel is one of the largest and most important
natural wetlands in the Brahmaputra Valley of lower
Assam, India, and is representative of the wetlands
found within the Burma Monsoon Forest biogeogra-
phy region (Saikia and Bhattacharjee 1987). Like
other wetlands (Alho and Vieira 1997; Herath
2004), Deepor Beel supplies a diverse group of
goods and services to the local community and ani-
mal population. The whole wetland (40.14 km2) was
declared as a Ramsar site in 2002 (Ramsar 2008b)
and 4.14 km2
within the Ramsar site was proposed
as a wildlife sanctuary (Government of Assam
1989a). The existence of Deepor Beel and Rani-
Garbhanga reserved forests (> 100 km2) side by side
adds to the diversity of wildlife habitats and increas-
es the socioeconomic importance of the wetland. In
addition to other birds and animals (Table 1), Rani-
Garbhanga reserved forests house about 80 to 120
Asiatic elephants (Government of Assam records,
unpublished). Deepor Beel is a staging site for mi-
gratory birds, and some of the largest congregations
of aquatic birds in Assam can be seen here in winter
(a record 19,000 water birds for a single-day count).
The richness of avian fauna has earned Deepor Beel
a place in Birdlife International’s list of Important
Bird Areas (IBA). The wetland serves as a major
fish breeding and nursery ground and supplies fish
stocks to other nearby bodies of water (Bezbaruah
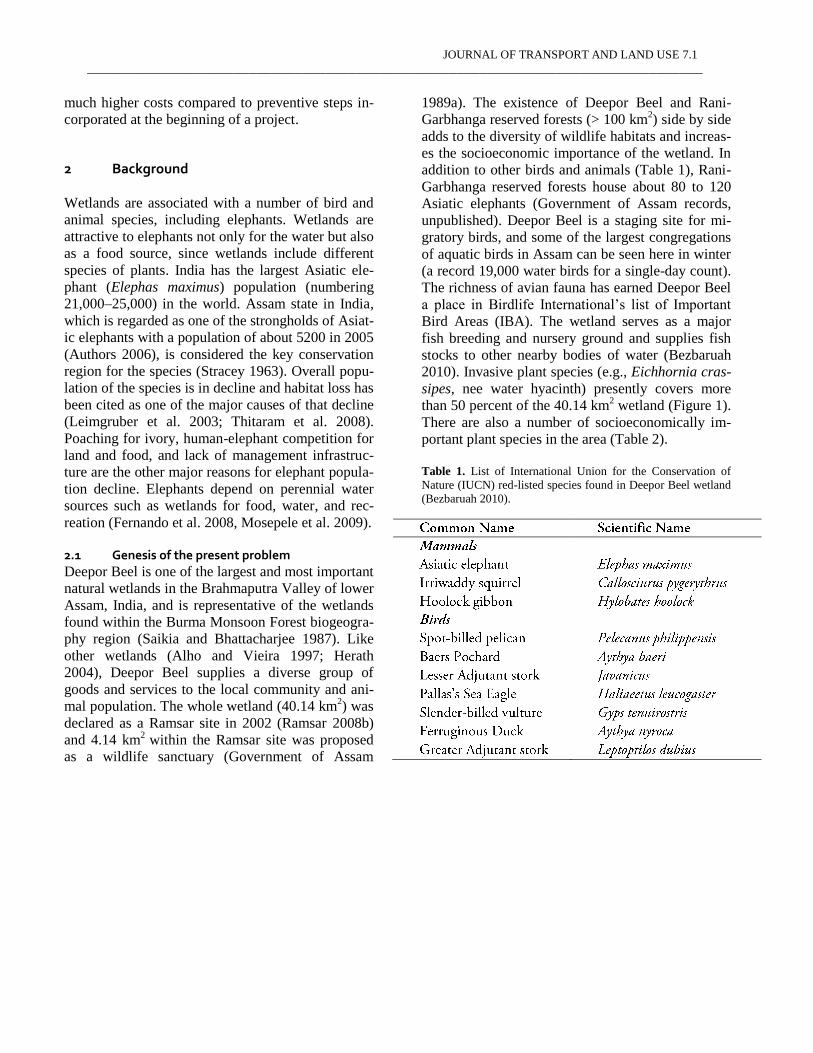
2010). Invasive plant species (e.g., Eichhornia cras-
sipes, nee water hyacinth) presently covers more
than 50 percent of the 40.14 km2 wetland (Figure 1).
There are also a number of socioeconomically im-
portant plant species in the area (Table 2).
Table 1. List of International Union for the Conservation of
Nature (IUCN) red-listed species found in Deepor Beel wetland
(Bezbaruah 2010).
Railroad impacts on wetland habitat: GIS and modeling approach ___________________________________________________________________________________
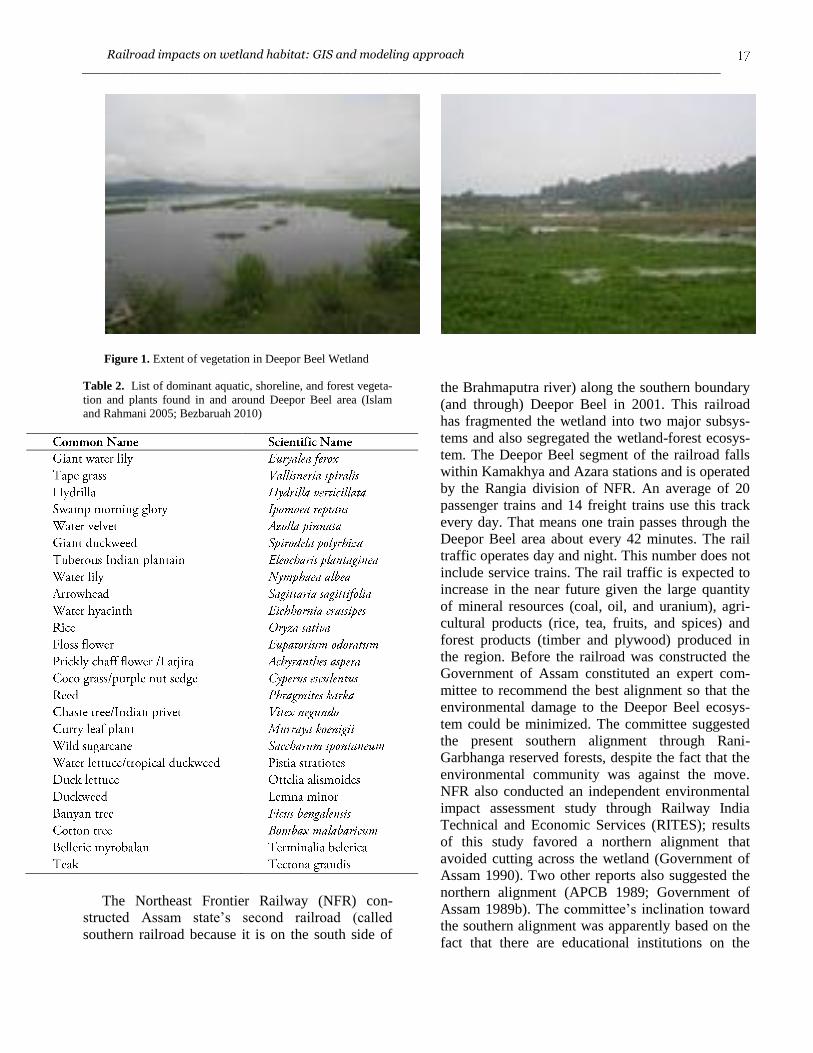
Figure 1. Extent of vegetation in Deepor Beel Wetland
Table 2. List of dominant aquatic, shoreline, and forest vegeta-
tion and plants found in and around Deepor Beel area (Islam
and Rahmani 2005; Bezbaruah 2010)
The Northeast Frontier Railway (NFR) con-
structed Assam state’s second railroad (called
southern railroad because it is on the south side of
the Brahmaputra river) along the southern boundary
(and through) Deepor Beel in 2001. This railroad
has fragmented the wetland into two major subsys-
tems and also segregated the wetland-forest ecosys-
tem. The Deepor Beel segment of the railroad falls
within Kamakhya and Azara stations and is operated
by the Rangia division of NFR. An average of 20
passenger trains and 14 freight trains use this track
every day. That means one train passes through the
Deepor Beel area about every 42 minutes. The rail
traffic operates day and night. This number does not
include service trains. The rail traffic is expected to
increase in the near future given the large quantity
of mineral resources (coal, oil, and uranium), agri-
cultural products (rice, tea, fruits, and spices) and
forest products (timber and plywood) produced in
the region. Before the railroad was constructed the
Government of Assam constituted an expert com-
mittee to recommend the best alignment so that the
environmental damage to the Deepor Beel ecosys-
tem could be minimized. The committee suggested
the present southern alignment through Rani-
Garbhanga reserved forests, despite the fact that the
environmental community was against the move.
NFR also conducted an independent environmental
impact assessment study through Railway India
Technical and Economic Services (RITES); results
of this study favored a northern alignment that
avoided cutting across the wetland (Government of
Assam 1990). Two other reports also suggested the
northern alignment (APCB 1989; Government of
Assam 1989b). The committee’s inclination toward
the southern alignment was apparently based on the
fact that there are educational institutions on the
JOURNAL OF TRANSPORT AND LAND USE 7.1
________________________________________________________________________________
northern side and they will be adversely affected by
disturbances caused by rail traffic. They failed to
recognize the future transportation needs of the area
and didn’t look into aspects of mass transport via a
northern alignment. A number of short- and long-
term steps toward achieving a sustainable post-
railroad environment were also proposed by the
committee as the necessary requirements that should
have gone along with the southern alignment. The
proposed sustainability measures included schedul-
ing rail traffic to ensure safety to wildlife, installing
plantations along the railroad, providing elephants
passes in the form of culverts, providing hydraulic
structures to ensure free flow of water in the wet-
land, and banning further development in the wet-
land.
3 Research objective and methodology
3.1 Development of GIS database
Satellite images of Deepor Beel and the surrounding
area are available from the National Remote Sensing
Agency (NRSA), which is an autonomous organiza-
tion under the Indian Department of Space. In a pre-
vious study by Sarma et al. (2008) satellite data pro-
vided by Landsat MSS, Landsat Thematic Mapper,
and IRS 1D LISS-III were used to assess the chang-
es in forest coverage and to estimate the loss of
Asian elephant habitat. Aerial images available from
Google Earth have fairly high resolution and are
freely available. It, therefore, was decided to use the
imagery downloaded from Google Earth for this
project with necessary georeferencing of the data.
The Google Earth data were also validated with the
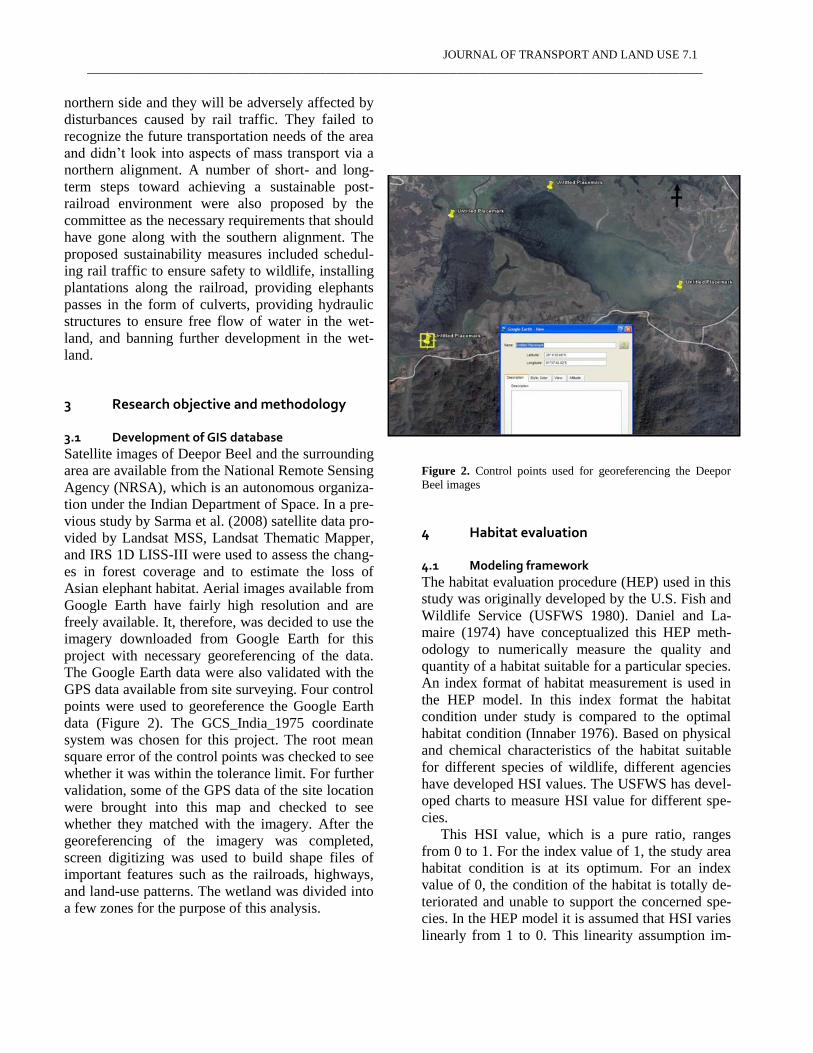
GPS data available from site surveying. Four control
points were used to georeference the Google Earth
data (Figure 2). The GCS_India_1975 coordinate
system was chosen for this project. The root mean
square error of the control points was checked to see
whether it was within the tolerance limit. For further
validation, some of the GPS data of the site location
were brought into this map and checked to see
whether they matched with the imagery. After the
georeferencing of the imagery was completed,
screen digitizing was used to build shape files of
important features such as the railroads, highways,
and land-use patterns. The wetland was divided into
a few zones for the purpose of this analysis.
Figure 2. Control points used for georeferencing the Deepor
Beel images
4 Habitat evaluation
4.1 Modeling framework
The habitat evaluation procedure (HEP) used in this
study was originally developed by the U.S. Fish and
Wildlife Service (USFWS 1980). Daniel and La-
maire (1974) have conceptualized this HEP meth-
odology to numerically measure the quality and
quantity of a habitat suitable for a particular species.
An index format of habitat measurement is used in
the HEP model. In this index format the habitat
condition under study is compared to the optimal
habitat condition (Innaber 1976). Based on physical
and chemical characteristics of the habitat suitable
for different species of wildlife, different agencies
have developed HSI values. The USFWS has devel-
oped charts to measure HSI value for different spe-
cies.
This HSI value, which is a pure ratio, ranges
from 0 to 1. For the index value of 1, the study area
habitat condition is at its optimum. For an index
value of 0, the condition of the habitat is totally de-
teriorated and unable to support the concerned spe-
cies. In the HEP model it is assumed that HSI varies
linearly from 1 to 0. This linearity assumption im-
Railroad impacts on wetland habitat: GIS and modeling approach ___________________________________________________________________________________
plies that the carrying capacity of the habitat has a
linear correlation with the index value. An index
value of 0.1 and 0.2 signifies 10 percent and 20 per-
cent carrying capacity of the optimal condition. The
HEP model uses a “species-habitat” approach to
assess the impact on the ecosystem. The index value
is a measure of the habitat’s ability to support the
species, which depends on it for its sustenance. The
HEP proposes habitat units as a means of measuring
impact of assessment. The product of the suitability
index and the area covered by the habitat, support-
ing a particular species, is a measure of habitat unit
for that particular species.
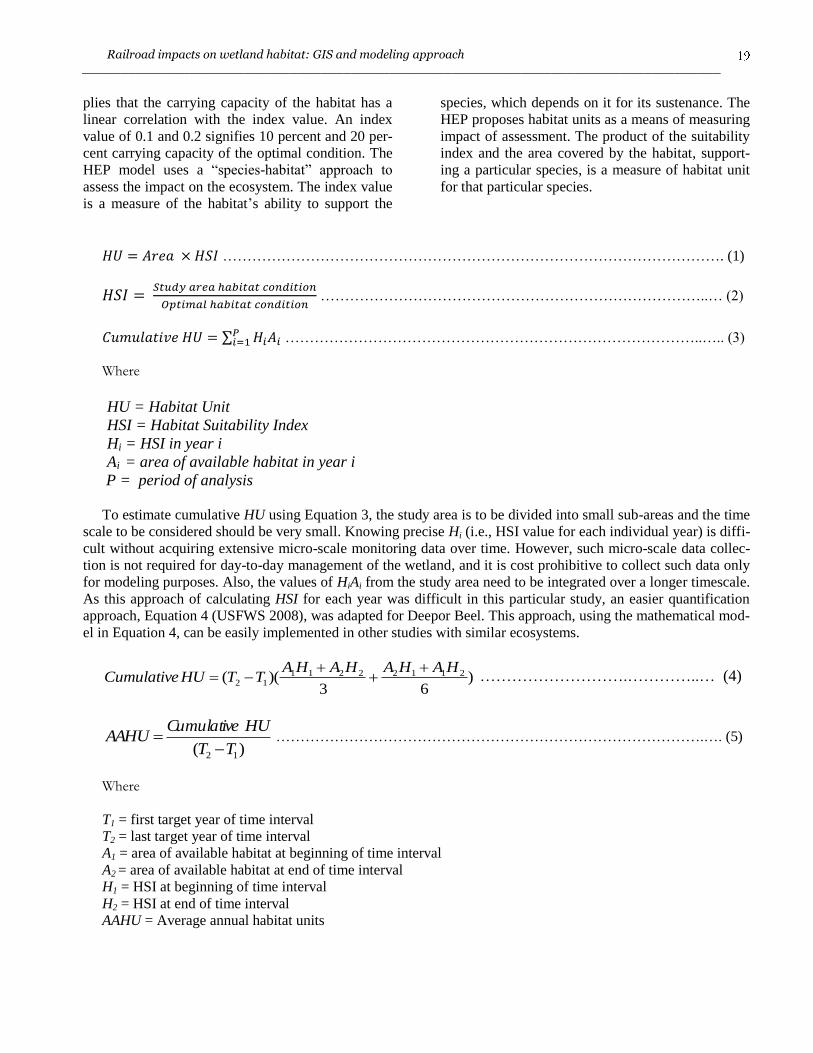
…………………………………………………………………………………………. (1)
……………………………………………………………………..… (2)
∑ …………………………………………………………………………..….. (3)
Where
HU = Habitat Unit
HSI = Habitat Suitability Index
Hi = HSI in year i
Ai = area of available habitat in year i
P = period of analysis
To estimate cumulative HU using Equation 3, the study area is to be divided into small sub-areas and the time
scale to be considered should be very small. Knowing precise Hi (i.e., HSI value for each individual year) is diffi-
cult without acquiring extensive micro-scale monitoring data over time. However, such micro-scale data collec-
tion is not required for day-to-day management of the wetland, and it is cost prohibitive to collect such data only
for modeling purposes. Also, the values of HiAi from the study area need to be integrated over a longer timescale.
As this approach of calculating HSI for each year was difficult in this particular study, an easier quantification
approach, Equation 4 (USFWS 2008), was adapted for Deepor Beel. This approach, using the mathematical mod-
el in Equation 4, can be easily implemented in other studies with similar ecosystems.
)63
)(( 2112221112
HAHAHAHATTHUCumulative
……………………….…………..… (4)
)( 12 TT
HUCumulativeAAHU
…………………………………………………………………………….…. (5)
Where
T1 = first target year of time interval
T2 = last target year of time interval
A1 = area of available habitat at beginning of time interval
A2 = area of available habitat at end of time interval
H1 = HSI at beginning of time interval
H2 = HSI at end of time interval
AAHU = Average annual habitat units

JOURNAL OF TRANSPORT AND LAND USE 7.1
________________________________________________________________________________
3 and 6 = constants derived from integration of HSI x Area for the interval between any two target years
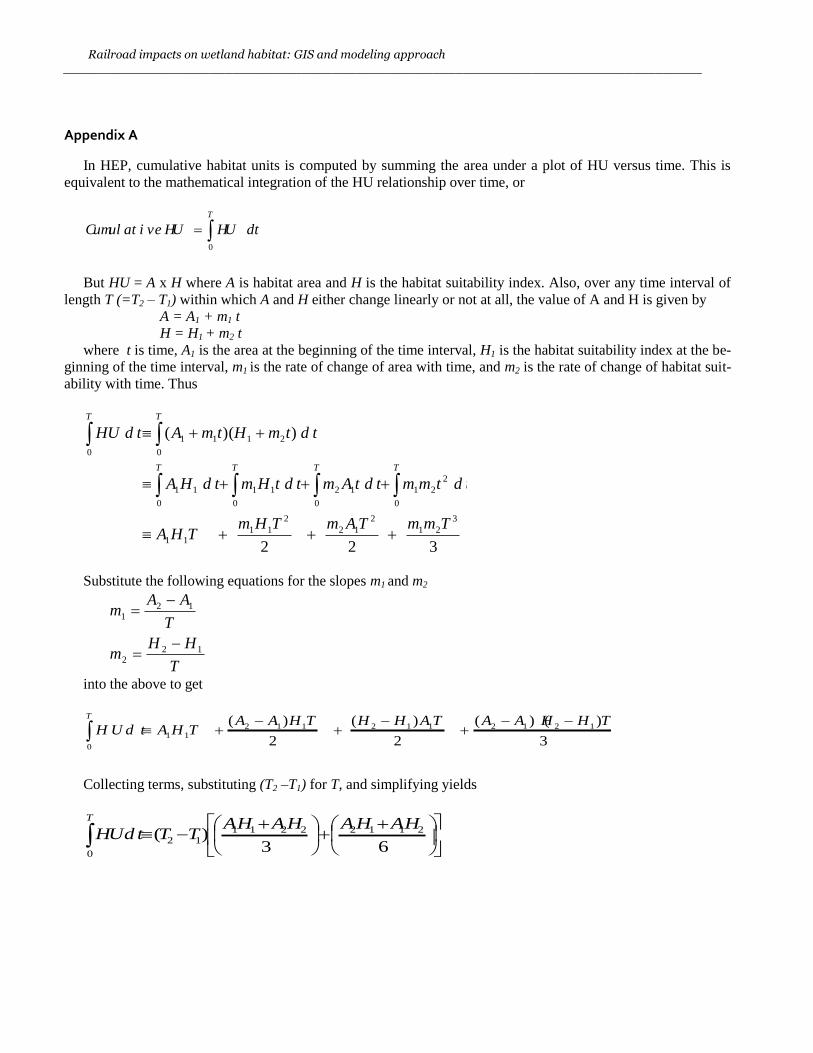
The mathematical derivation of Equation 4 is shown in Appendix 1.
Railroad impacts on wetland habitat: GIS and modeling approach ___________________________________________________________________________________
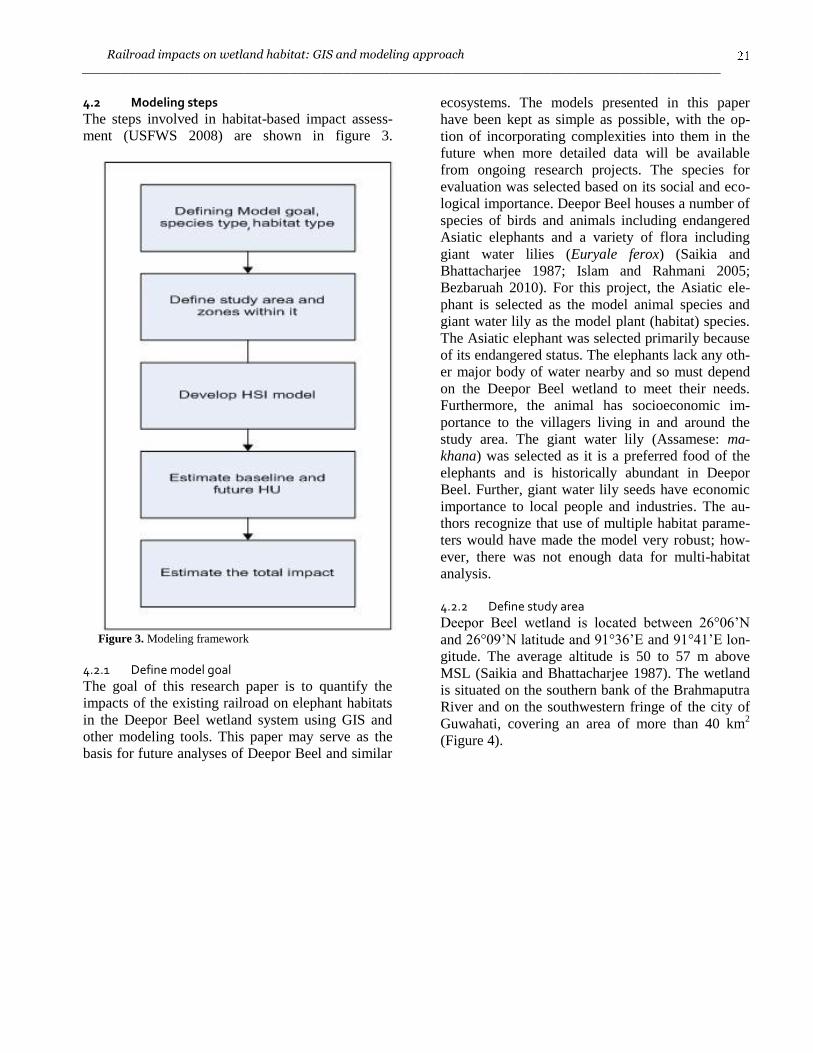
4.2 Modeling steps
The steps involved in habitat-based impact assess-
ment (USFWS 2008) are shown in figure 3.
Figure 3. Modeling framework
4.2.1 Define model goal
The goal of this research paper is to quantify the
impacts of the existing railroad on elephant habitats
in the Deepor Beel wetland system using GIS and
other modeling tools. This paper may serve as the
basis for future analyses of Deepor Beel and similar
ecosystems. The models presented in this paper
have been kept as simple as possible, with the op-
tion of incorporating complexities into them in the
future when more detailed data will be available
from ongoing research projects. The species for
evaluation was selected based on its social and eco-
logical importance. Deepor Beel houses a number of
species of birds and animals including endangered
Asiatic elephants and a variety of flora including
giant water lilies (Euryale ferox) (Saikia and
Bhattacharjee 1987; Islam and Rahmani 2005;
Bezbaruah 2010). For this project, the Asiatic ele-
phant is selected as the model animal species and
giant water lily as the model plant (habitat) species.
The Asiatic elephant was selected primarily because
of its endangered status. The elephants lack any oth-
er major body of water nearby and so must depend
on the Deepor Beel wetland to meet their needs.
Furthermore, the animal has socioeconomic im-
portance to the villagers living in and around the
study area. The giant water lily (Assamese: ma-
khana) was selected as it is a preferred food of the
elephants and is historically abundant in Deepor
Beel. Further, giant water lily seeds have economic
importance to local people and industries. The au-
thors recognize that use of multiple habitat parame-
ters would have made the model very robust; how-
ever, there was not enough data for multi-habitat
analysis.
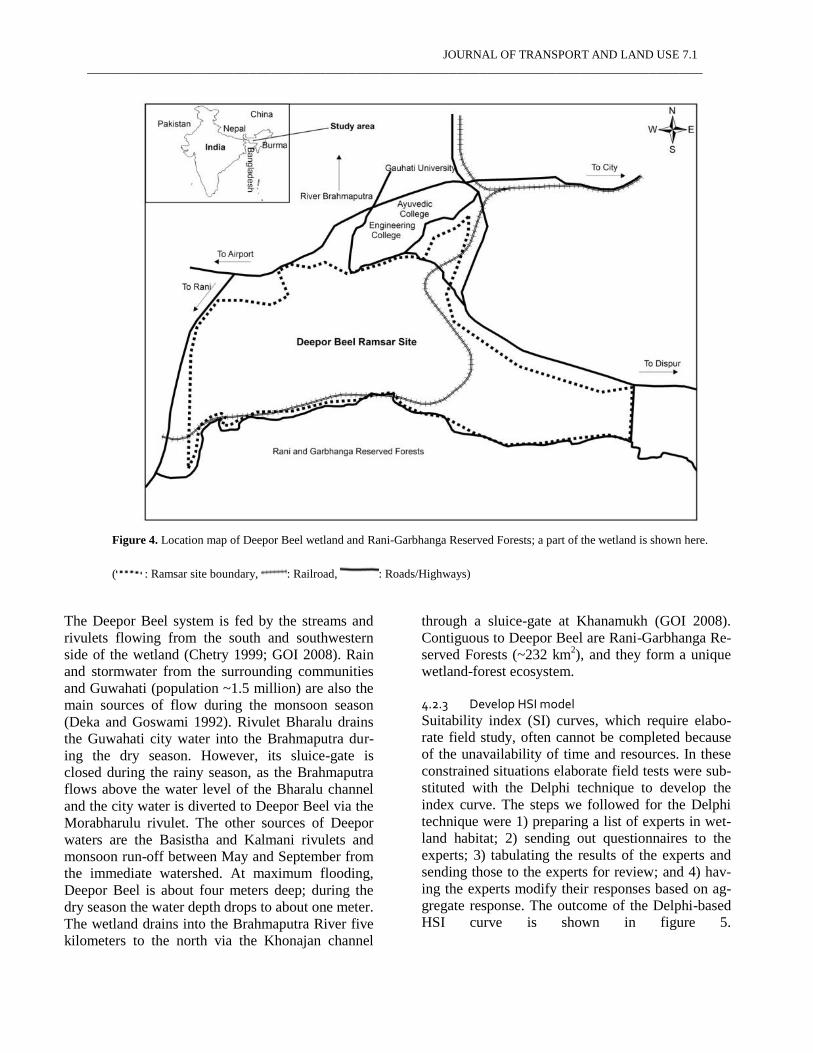
4.2.2 Define study area
Deepor Beel wetland is located between 26°06’N
and 26°09’N latitude and 91°36’E and 91°41’E lon-
gitude. The average altitude is 50 to 57 m above
MSL (Saikia and Bhattacharjee 1987). The wetland
is situated on the southern bank of the Brahmaputra
River and on the southwestern fringe of the city of
Guwahati, covering an area of more than 40 km2
(Figure 4).
JOURNAL OF TRANSPORT AND LAND USE 7.1
________________________________________________________________________________
Figure 4. Location map of Deepor Beel wetland and Rani-Garbhanga Reserved Forests; a part of the wetland is shown here.
( : Ramsar site boundary, : Railroad, : Roads/Highways)
The Deepor Beel system is fed by the streams and
rivulets flowing from the south and southwestern
side of the wetland (Chetry 1999; GOI 2008). Rain
and stormwater from the surrounding communities
and Guwahati (population ~1.5 million) are also the
main sources of flow during the monsoon season
(Deka and Goswami 1992). Rivulet Bharalu drains
the Guwahati city water into the Brahmaputra dur-
ing the dry season. However, its sluice-gate is
closed during the rainy season, as the Brahmaputra
flows above the water level of the Bharalu channel
and the city water is diverted to Deepor Beel via the
Morabharulu rivulet. The other sources of Deepor
waters are the Basistha and Kalmani rivulets and
monsoon run-off between May and September from
the immediate watershed. At maximum flooding,
Deepor Beel is about four meters deep; during the
dry season the water depth drops to about one meter.
The wetland drains into the Brahmaputra River five
kilometers to the north via the Khonajan channel
through a sluice-gate at Khanamukh (GOI 2008).
Contiguous to Deepor Beel are Rani-Garbhanga Re-
served Forests (~232 km2), and they form a unique
wetland-forest ecosystem.
4.2.3 Develop HSI model
Suitability index (SI) curves, which require elabo-
rate field study, often cannot be completed because
of the unavailability of time and resources. In these
constrained situations elaborate field tests were sub-
stituted with the Delphi technique to develop the
index curve. The steps we followed for the Delphi
technique were 1) preparing a list of experts in wet-
land habitat; 2) sending out questionnaires to the
experts; 3) tabulating the results of the experts and
sending those to the experts for review; and 4) hav-
ing the experts modify their responses based on ag-
gregate response. The outcome of the Delphi-based
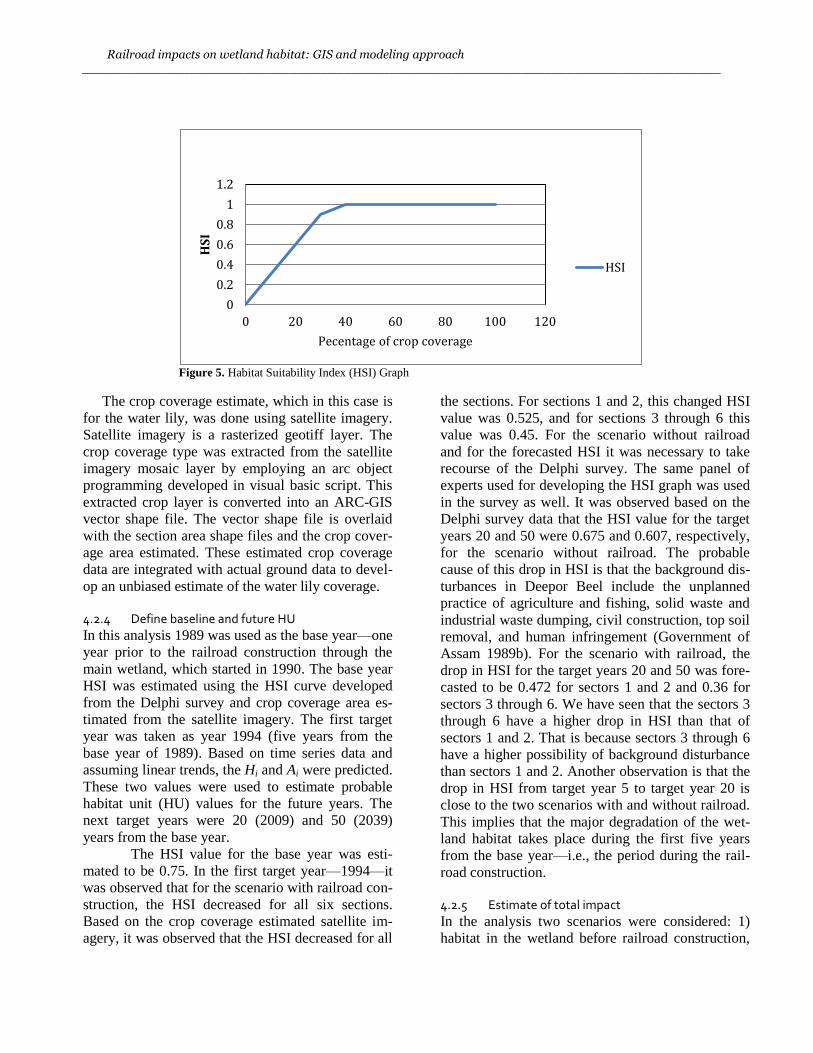
HSI curve is shown in figure 5.
Railroad impacts on wetland habitat: GIS and modeling approach ___________________________________________________________________________________
Figure 5. Habitat Suitability Index (HSI) Graph
The crop coverage estimate, which in this case is
for the water lily, was done using satellite imagery.
Satellite imagery is a rasterized geotiff layer. The
crop coverage type was extracted from the satellite
imagery mosaic layer by employing an arc object
programming developed in visual basic script. This
extracted crop layer is converted into an ARC-GIS
vector shape file. The vector shape file is overlaid
with the section area shape files and the crop cover-
age area estimated. These estimated crop coverage
data are integrated with actual ground data to devel-
op an unbiased estimate of the water lily coverage.
4.2.4 Define baseline and future HU
In this analysis 1989 was used as the base year—one
year prior to the railroad construction through the
main wetland, which started in 1990. The base year
HSI was estimated using the HSI curve developed
from the Delphi survey and crop coverage area es-
timated from the satellite imagery. The first target
year was taken as year 1994 (five years from the
base year of 1989). Based on time series data and
assuming linear trends, the Hi and Ai were predicted.
These two values were used to estimate probable
habitat unit (HU) values for the future years. The
next target years were 20 (2009) and 50 (2039)
years from the base year.
The HSI value for the base year was esti-
mated to be 0.75. In the first target year—1994—it
was observed that for the scenario with railroad con-
struction, the HSI decreased for all six sections.
Based on the crop coverage estimated satellite im-
agery, it was observed that the HSI decreased for all
the sections. For sections 1 and 2, this changed HSI
value was 0.525, and for sections 3 through 6 this
value was 0.45. For the scenario without railroad
and for the forecasted HSI it was necessary to take
recourse of the Delphi survey. The same panel of
experts used for developing the HSI graph was used
in the survey as well. It was observed based on the
Delphi survey data that the HSI value for the target
years 20 and 50 were 0.675 and 0.607, respectively,
for the scenario without railroad. The probable
cause of this drop in HSI is that the background dis-
turbances in Deepor Beel include the unplanned
practice of agriculture and fishing, solid waste and
industrial waste dumping, civil construction, top soil
removal, and human infringement (Government of
Assam 1989b). For the scenario with railroad, the
drop in HSI for the target years 20 and 50 was fore-
casted to be 0.472 for sectors 1 and 2 and 0.36 for
sectors 3 through 6. We have seen that the sectors 3
through 6 have a higher drop in HSI than that of
sectors 1 and 2. That is because sectors 3 through 6
have a higher possibility of background disturbance
than sectors 1 and 2. Another observation is that the
drop in HSI from target year 5 to target year 20 is
close to the two scenarios with and without railroad.
This implies that the major degradation of the wet-
land habitat takes place during the first five years
from the base year—i.e., the period during the rail-
road construction.
4.2.5 Estimate of total impact
In the analysis two scenarios were considered: 1)
habitat in the wetland before railroad construction,
0
0.2
0.4
0.6
0.8
1
1.2
0 20 40 60 80 100 120
HS
I
Pecentage of crop coverage
HSI
JOURNAL OF TRANSPORT AND LAND USE 7.1
________________________________________________________________________________
and 2) habitat in the wetland after railroad construc-
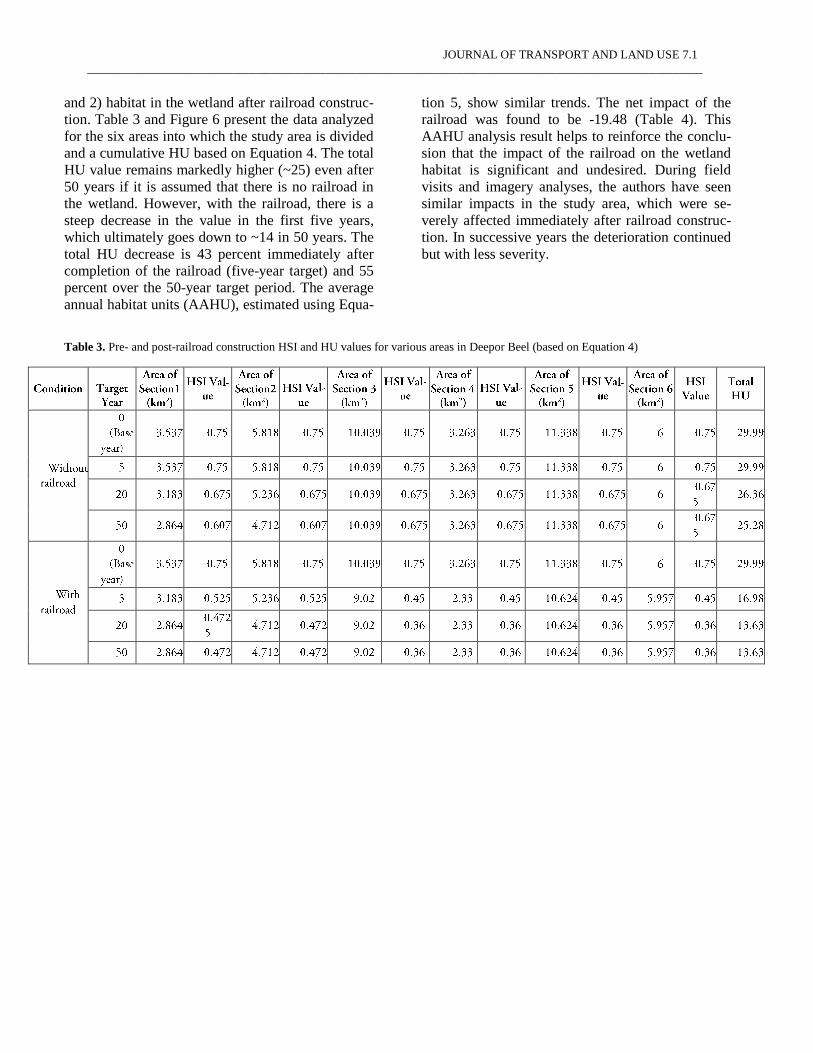
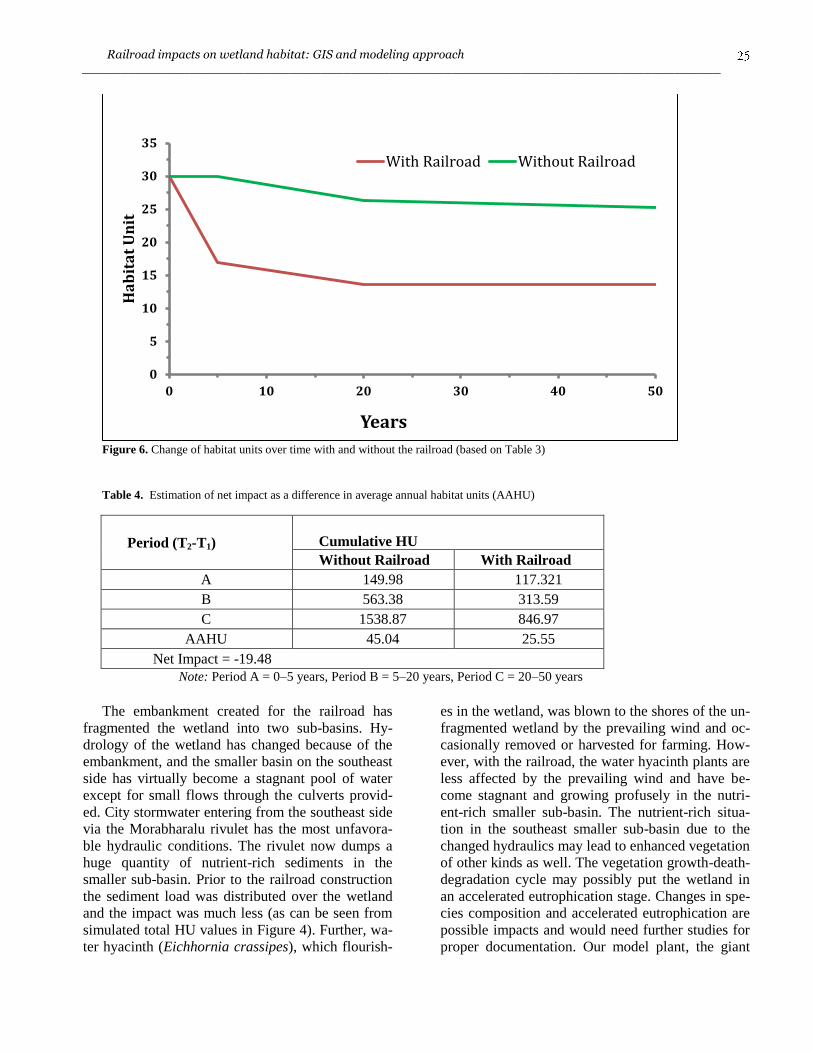
tion. Table 3 and Figure 6 present the data analyzed
for the six areas into which the study area is divided
and a cumulative HU based on Equation 4. The total
HU value remains markedly higher (~25) even after
50 years if it is assumed that there is no railroad in
the wetland. However, with the railroad, there is a
steep decrease in the value in the first five years,
which ultimately goes down to ~14 in 50 years. The
total HU decrease is 43 percent immediately after
completion of the railroad (five-year target) and 55
percent over the 50-year target period. The average
annual habitat units (AAHU), estimated using Equa-
tion 5, show similar trends. The net impact of the
railroad was found to be -19.48 (Table 4). This
AAHU analysis result helps to reinforce the conclu-
sion that the impact of the railroad on the wetland
habitat is significant and undesired. During field
visits and imagery analyses, the authors have seen
similar impacts in the study area, which were se-
verely affected immediately after railroad construc-
tion. In successive years the deterioration continued
but with less severity.
Table 3. Pre- and post-railroad construction HSI and HU values for various areas in Deepor Beel (based on Equation 4)
Railroad impacts on wetland habitat: GIS and modeling approach ___________________________________________________________________________________
Figure 6. Change of habitat units over time with and without the railroad (based on Table 3)
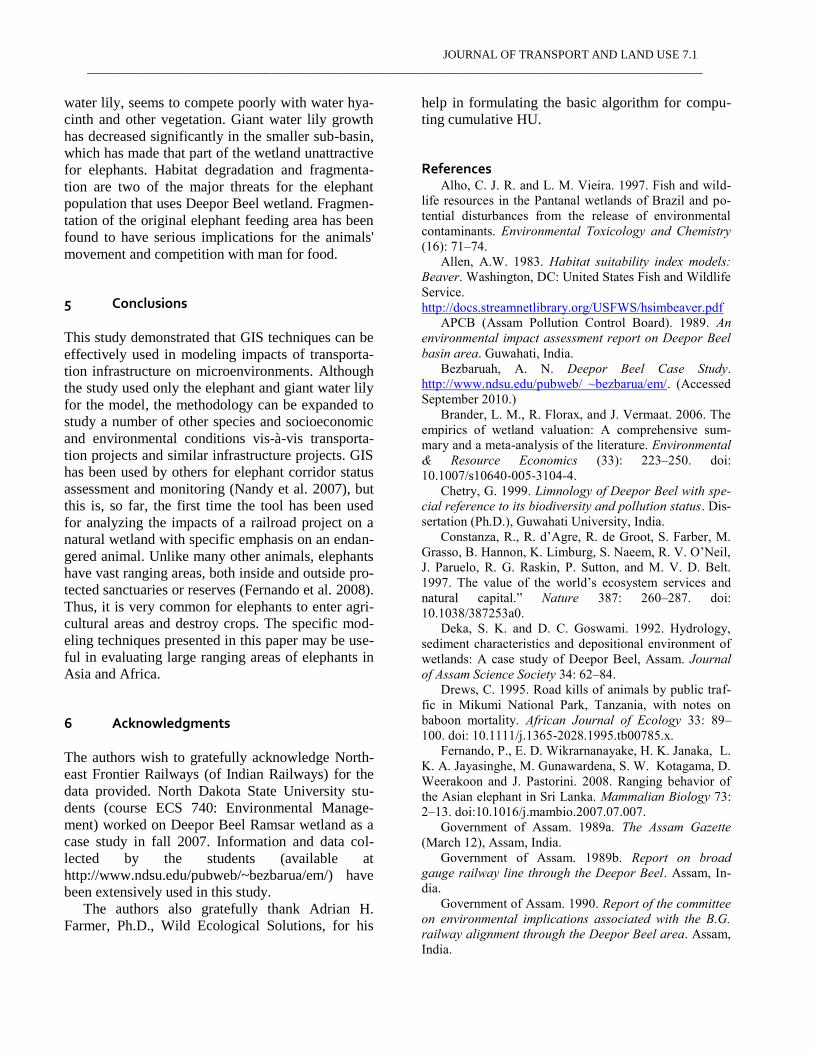
Table 4. Estimation of net impact as a difference in average annual habitat units (AAHU)
Period (T2-T1)
Cumulative HU
Without Railroad With Railroad
A 149.98 117.321
B 563.38 313.59
C 1538.87 846.97
AAHU 45.04 25.55
Net Impact = -19.48
Note: Period A = 0–5 years, Period B = 5–20 years, Period C = 20–50 years
The embankment created for the railroad has
fragmented the wetland into two sub-basins. Hy-
drology of the wetland has changed because of the
embankment, and the smaller basin on the southeast
side has virtually become a stagnant pool of water
except for small flows through the culverts provid-
ed. City stormwater entering from the southeast side
via the Morabharalu rivulet has the most unfavora-
ble hydraulic conditions. The rivulet now dumps a
huge quantity of nutrient-rich sediments in the
smaller sub-basin. Prior to the railroad construction
the sediment load was distributed over the wetland
and the impact was much less (as can be seen from
simulated total HU values in Figure 4). Further, wa-
ter hyacinth (Eichhornia crassipes), which flourish-
es in the wetland, was blown to the shores of the un-
fragmented wetland by the prevailing wind and oc-
casionally removed or harvested for farming. How-
ever, with the railroad, the water hyacinth plants are
less affected by the prevailing wind and have be-
come stagnant and growing profusely in the nutri-
ent-rich smaller sub-basin. The nutrient-rich situa-
tion in the southeast smaller sub-basin due to the
changed hydraulics may lead to enhanced vegetation
of other kinds as well. The vegetation growth-death-
degradation cycle may possibly put the wetland in
an accelerated eutrophication stage. Changes in spe-
cies composition and accelerated eutrophication are
possible impacts and would need further studies for
proper documentation. Our model plant, the giant
0
5
10
15
20
25
30
35
0 10 20 30 40 50
Ha
bit
at
Un
it
Years
With Railroad Without Railroad
JOURNAL OF TRANSPORT AND LAND USE 7.1
________________________________________________________________________________
water lily, seems to compete poorly with water hya-
cinth and other vegetation. Giant water lily growth
has decreased significantly in the smaller sub-basin,
which has made that part of the wetland unattractive
for elephants. Habitat degradation and fragmenta-
tion are two of the major threats for the elephant
population that uses Deepor Beel wetland. Fragmen-
tation of the original elephant feeding area has been
found to have serious implications for the animals'
movement and competition with man for food.
5 Conclusions
This study demonstrated that GIS techniques can be
effectively used in modeling impacts of transporta-
tion infrastructure on microenvironments. Although
the study used only the elephant and giant water lily
for the model, the methodology can be expanded to
study a number of other species and socioeconomic
and environmental conditions vis-à-vis transporta-
tion projects and similar infrastructure projects. GIS
has been used by others for elephant corridor status
assessment and monitoring (Nandy et al. 2007), but
this is, so far, the first time the tool has been used
for analyzing the impacts of a railroad project on a
natural wetland with specific emphasis on an endan-
gered animal. Unlike many other animals, elephants
have vast ranging areas, both inside and outside pro-
tected sanctuaries or reserves (Fernando et al. 2008).
Thus, it is very common for elephants to enter agri-
cultural areas and destroy crops. The specific mod-
eling techniques presented in this paper may be use-
ful in evaluating large ranging areas of elephants in
Asia and Africa.
6 Acknowledgments
The authors wish to gratefully acknowledge North-
east Frontier Railways (of Indian Railways) for the
data provided. North Dakota State University stu-
dents (course ECS 740: Environmental Manage-
ment) worked on Deepor Beel Ramsar wetland as a
case study in fall 2007. Information and data col-
lected by the students (available at
http://www.ndsu.edu/pubweb/~bezbarua/em/) have
been extensively used in this study.
The authors also gratefully thank Adrian H.
Farmer, Ph.D., Wild Ecological Solutions, for his
help in formulating the basic algorithm for compu-
ting cumulative HU.
References Alho, C. J. R. and L. M. Vieira. 1997. Fish and wild-
life resources in the Pantanal wetlands of Brazil and po-
tential disturbances from the release of environmental
contaminants. Environmental Toxicology and Chemistry
(16): 71–74.
Allen, A.W. 1983. Habitat suitability index models:
Beaver. Washington, DC: United States Fish and Wildlife
Service.
http://docs.streamnetlibrary.org/USFWS/hsimbeaver.pdf
APCB (Assam Pollution Control Board). 1989. An
environmental impact assessment report on Deepor Beel
basin area. Guwahati, India.
Bezbaruah, A. N. Deepor Beel Case Study.
http://www.ndsu.edu/pubweb/ ~bezbarua/em/. (Accessed
September 2010.)
Brander, L. M., R. Florax, and J. Vermaat. 2006. The
empirics of wetland valuation: A comprehensive sum-
mary and a meta-analysis of the literature. Environmental
& Resource Economics (33): 223–250. doi:
10.1007/s10640-005-3104-4.
Chetry, G. 1999. Limnology of Deepor Beel with spe-
cial reference to its biodiversity and pollution status. Dis-
sertation (Ph.D.), Guwahati University, India.
Constanza, R., R. d’Agre, R. de Groot, S. Farber, M.
Grasso, B. Hannon, K. Limburg, S. Naeem, R. V. O’Neil,
J. Paruelo, R. G. Raskin, P. Sutton, and M. V. D. Belt.
1997. The value of the world’s ecosystem services and
natural capital.” Nature 387: 260–287. doi:
10.1038/387253a0.
Deka, S. K. and D. C. Goswami. 1992. Hydrology,
sediment characteristics and depositional environment of
wetlands: A case study of Deepor Beel, Assam. Journal
of Assam Science Society 34: 62–84.
Drews, C. 1995. Road kills of animals by public traf-
fic in Mikumi National Park, Tanzania, with notes on
baboon mortality. African Journal of Ecology 33: 89–
100. doi: 10.1111/j.1365-2028.1995.tb00785.x.
Fernando, P., E. D. Wikrarnanayake, H. K. Janaka, L.
K. A. Jayasinghe, M. Gunawardena, S. W. Kotagama, D.
Weerakoon and J. Pastorini. 2008. Ranging behavior of
the Asian elephant in Sri Lanka. Mammalian Biology 73:
2–13. doi:10.1016/j.mambio.2007.07.007.
Government of Assam. 1989a. The Assam Gazette
(March 12), Assam, India.
Government of Assam. 1989b. Report on broad
gauge railway line through the Deepor Beel. Assam, In-
dia.
Government of Assam. 1990. Report of the committee
on environmental implications associated with the B.G.
railway alignment through the Deepor Beel area. Assam,
India.
Railroad impacts on wetland habitat: GIS and modeling approach ___________________________________________________________________________________
Gurluke, S., and E. Rehber. 2006. Evaluation of an in-
tegrated wetland management plan: Case of Uluabat (Ap-
ollonia) Lake, Turkey. Wetlands 26: 258–264.
doi:10.1672/0277-
5212(2006)26[258:EOAIWM]2.0.CO;2.
Herath, G. 2004. Incorporating community objectives
in improved wetland management: The use of the analyt-
ic hierarchy process. Journal of Environmental Manage-
ment 70: 263–273. doi: 10.1016/j.jenvman.2003.12.011.
Huijser, M.P., P. McGowen, J. Fuller, A. Hardy, A.
Kociolek, A.P. Clevenger, D. Smith and R. Ament. 2008.
Wildlife-vehicle collision reduction study: Report to Con-
gress. Washington, DC: US Department of Transporta-
tion Federal Highway Administration.
http://www.fhwa.dot.gov/publications/research/safety/08
034/.
Islam M. Z. and A. R. Rahmani. 2005. Important bird
areas in India: Priority sites for conservation. Oxford
University Press, Oxford, UK.
Jabareen, Y. R. 2006. Sustainable urban forms -
Their typologies, models, and concepts.” Journal of
Planning Education and Research 26: 38–52.
doi:10.1177/0739456X05285119.
Kushwaha, S. P. S. and R. Hazarika. 2004. Assess-
ment of habitat loss in Kameng and Sonitpur Elephant
Reserves. Current Science 87:1447–1453.
Leimgruber, P., J. B. Gagnon, C. Wemmer, D. S.
Kelly, M. A. Songer, and E. R. Selig. 2003. Fragmenta-
tion of Asia’s remaining wild lands: implications for
Asian elephant conservation. Animal Conservation 6:
347–359. doi:10.1177/0739456X05285119.
Maltby, E. 1991. Wetland management goals—Wise
use and conservation. Landscape and Urban Planning
20: 9–18. doi: 10.1016/0169-2046(91)90085-Z.
Mosepele, K., Moyle, P. B., Merron, G. S., Purkey, D.
R. and Mosepele, B. 2009. Fish, floods, and ecosystem
engineers: Aquatic conservation in the Okavango Delta,
Botswana.” Bioscience, 59:53–64. doi:
10.1525/bio.2009.59.1.9.
Nandy, S., S. P. S. Kushwaha, and S. Mukhopadhyay.
2007. Monitoring the Chilla-Motichur wildlife corridor
using geospatial tools. Journal for Nature Conservation
15:237–244. doi: 10.1016/j.jnc.2007.03.003.
Ramsar. 2008a.The Ramsar Convention on Wetlands.
http://www.ramsar.org/pdf/sitelist.pdf. (Accessed Sep-
tember 2010.)
Ramsar. 2008b.The list of wetlands of international
importance. http://www.ramsar.org/pdf/sitelist.pdf. (Ac-
cessed September 2010.)
Reinelt, E. L., J. Velikanje and J. E. Bell. 1991. De-
velopment and application of geographic information
system for wetland/watershed analysis. Computer, Envi-
ronment and Urban Systems 15(4):239–251. doi:
10.1016/0198-9715(91)90029-D.
Saikia, P. K. and P. C. Bhattacharjee. 1987. A study of
the avifauna of Deepor Beel: A potential bird sanctuary
in Assam. Asian Wetland Bureau, Kuala Lumpur, Malay-
sia.
Sinha, K. C. and S. Labi. 2007. Transportation deci-
sion making: Principles of project evaluation and pro-
gramming. New Jersey: John Wiley & Sons.
Stracey, P. D. 1963. Elephant gold. London: Wei-
denfeld and Nicolson.
Authors. 2006. Site visit by one or more authors.
Thitaram, C., N. Thongtip, C. Somgird, B. Colen-
brander, D. C. J. van Boxtel, F. Van Steenbeek, and J. A.
Lenstra. 2008. Evaluation and selection of microsatellite
markers for an identification and parentage test of Asian
elephants. Conservation Genetics 9, 921–925. doi:
10.1007/s10592-007-9406-z.
United States Department of Transportation (n.d.).
USDOT full text of SAFETEA-LU and the related con-
gressional reports. Washington DC.
https://www.fhwa.dot.gov/safetealu/legis.htm.
United States Fish and Wildlife Service. 2008. Na-
tional wetlands inventory habitat evaluation procedures
handbook. Washington, DC.
Railroad impacts on wetland habitat: GIS and modeling approach ___________________________________________________________________________________
Appendix A
In HEP, cumulative habitat units is computed by summing the area under a plot of HU versus time. This is
equivalent to the mathematical integration of the HU relationship over time, or
T
dtHUHUCumul at i ve0
But HU = A x H where A is habitat area and H is the habitat suitability index. Also, over any time interval of
length T (=T2 – T1) within which A and H either change linearly or not at all, the value of A and H is given by
A = A1 + m1 t
H = H1 + m2 t
where t is time, A1 is the area at the beginning of the time interval, H1 is the habitat suitability index at the be-
ginning of the time interval, m1 is the rate of change of area with time, and m2 is the rate of change of habitat suit-
ability with time. Thus
322
))((
3
21
2
12
2
1111
0 0 0 0
2
21121111
0
2111
0
TmmTAmTHmTHA
d ttmmd ttAmd ttHmd tHA
d ttmHtmAd tHU
T T T T
TT
Substitute the following equations for the slopes m1 and m2
T
HHm
T
AAm
122
121
into the above to get
3
)) ((
2
)(
2
)(1212112
0
11211
THHAATAHHTHAATHAd tH U
T
Collecting terms, substituting (T2 –T1) for T, and simplifying yields
THAHAHAHA
TTd tHU0
2112221112
63)(