Embed Size (px)
Citation preview
Research Report DFE-RR160
Subject and course choices at ages 14 and 16 amongst young people in England:
insights from behavioural economics
Wenchao Jin, Alastair Muriel and Luke Sibieta
Institute for Fiscal Studies

This research report was commissioned before the new UK Government took office on 11 May 2010. As a result the content may not reflect current
Government policy and may make reference to the Department for Children, Schools and Families (DCSF) which has now been replaced by the Department
for Education (DFE).
The views expressed in this report are the authors’ and do not necessarily reflect those of the Department for Education.

1
Acknowledgements
This report is published as part of the research programme of the Centre for Understanding Behaviour Change (CUBeC). CUBeC is a research centre funded by the Department for Education. More information about CUBeEC can be found at http://www.cubec.org.uk.
We would like to thank colleagues at the Institute for Fiscal Studies (IFS). In particular, we are grateful to Haroon Chowdry for guidance on data analysis and to Claire Crawford, Lorraine Dearden and Professor Imran Rasul for their thoughts and comments throughout the project. We would also like to thank Judith Payne for copy‐editing.
Thanks are also due to Oliver Clifton‐Moore and Andrew Mellon at the Department for Education and all the members of the steering group for their thoughts, comments and participation in the project.
2
Contents
mary Executive sum 4
tro In duction 8
1. ubje s at 14 and 16 S ct and course choice 10
ces 1.1 Key Stage 4 choi 10
oices 1.2 Post‐16 ch 16
1.3 Summary 23
2. How do young people make subject and course choices? 24
ices 2.1 Existing empirical evidence on subject and course cho 24
2.2 Models of decision‐making: standard ‘rational’ model 29
y 3 2.3 Models of decision‐making: departures from standard rationalit 1
2.4 hts from behavioural economics to school pupils Applying insig 48
3. r The ole of schools 51
3.1 What options do schools offer at Key Stage 4? 51
3.2 Are some schools ‘gaming’ the GCSE league tables? 55
they wish to take? 3.3 Are pupils able to take the choices 62
nd subject offers 3.4 Post‐16 course a 63
ffects 3.5 Framing e 68
3.6 Summary 68
4. iva ject choices Mult riate analysis of sub 70
s 4.1 Outcomes and factor 70
findings 4.2 Regression 72
4.3 ary Summ 78
sion 5. Conclu 80
References 84
APPENDIX A – Pupil‐level data 88
APPENDIX B – School‐level data 94
APPENDIX C – Regression results 99

3
4
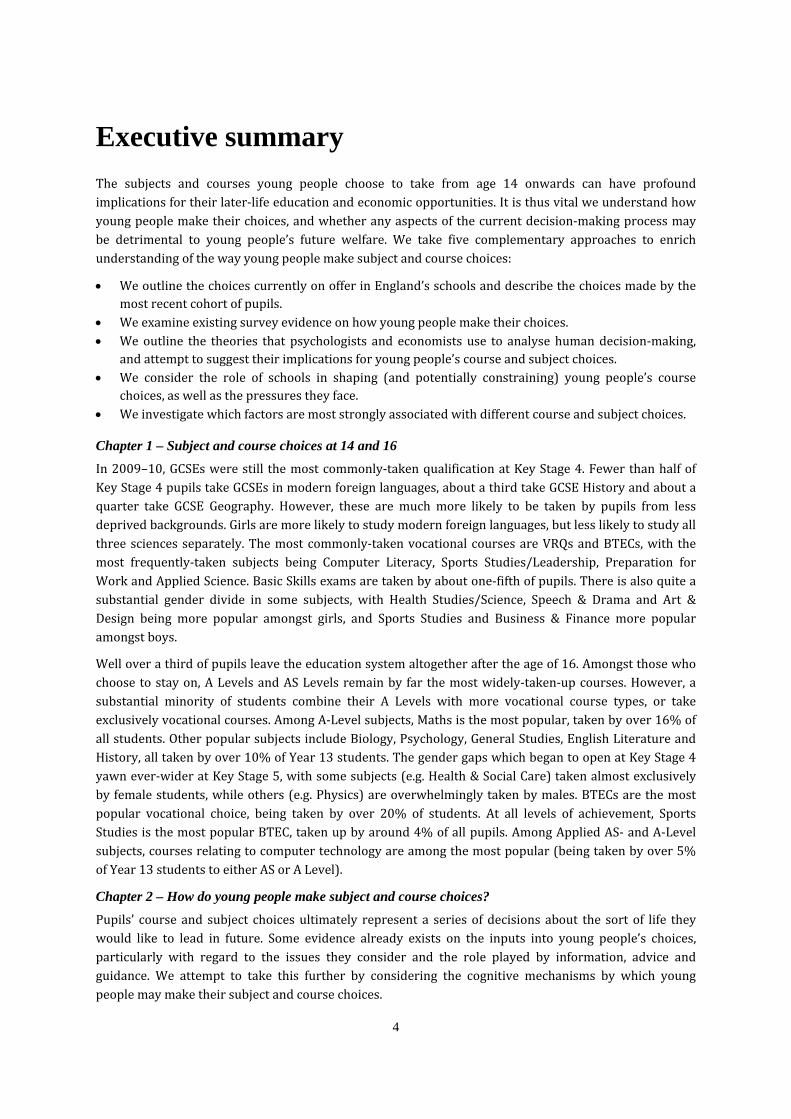
Executive summary The subjects and courses young people choose to take from age 14 onwards can have profound implications for their later‐life education and economic opportunities. It is thus vital we understand how young people make their choices, and whether any aspects of the current decision‐making process may be detrimental to young people’s future welfare. We take five complementary approaches to enrich understanding of the way young people make subject and course choices:
• choices made by the We outline the choices currently on offer in England’s schools and describe themost recent cohort of pupils.
• We examine existing survey evidence on how young people make their choices. • l eWe outline the theories that psycho ogists and economists us to analyse human decision‐making,
and attempt to suggest their implications for young people’s course and subject choices. • We consider the role of schools in shaping (and potentially constraining) young people’s course
choices, as well as the pressures they face. • We investigate which factors are most strongly associated with different course and subject choices.
Chapter 1 – Subject and course choices at 14 and 16 In 2009–10, GCSEs were still the most commonly‐taken qualification at Key Stage 4. Fewer than half of Key Stage 4 pupils take GCSEs in modern foreign languages, about a third take GCSE History and about a quarter take GCSE Geography. However, these are much more likely to be taken by pupils from less deprived backgrounds. Girls are more likely to study modern foreign languages, but less likely to study all three sciences separately. The most commonly‐taken vocational courses are VRQs and BTECs, with the most frequently‐taken subjects being Computer Literacy, Sports Studies/Leadership, Preparation for Work and Applied Science. Basic Skills exams are taken by about one‐fifth of pupils. There is also quite a substantial gender divide in some subjects, with Health Studies/Science, Speech & Drama and Art & Design being more popular amongst girls, and Sports Studies and Business & Finance more popular amongst boys.
Well over a third of pupils leave the education system altogether after the age of 16. Amongst those who choose to stay on, A Levels and AS Levels remain by far the most widely‐taken‐up courses. However, a substantial minority of students combine their A Levels with more vocational course types, or take exclusively vocational courses. Among A‐Level subjects, Maths is the most popular, taken by over 16% of all students. Other popular subjects include Biology, Psychology, General Studies, English Literature and History, all taken by over 10% of Year 13 students. The gender gaps which began to open at Key Stage 4 yawn ever‐wider at Key Stage 5, with some subjects (e.g. Health & Social Care) taken almost exclusively by female students, while others (e.g. Physics) are overwhelmingly taken by males. BTECs are the most popular vocational choice, being taken by over 20% of students. At all levels of achievement, Sports Studies is the most popular BTEC, taken up by around 4% of all pupils. Among Applied AS‐ and A‐Level subjects, courses relating to computer technology are among the most popular (being taken by over 5% of Year 13 students to either AS or A Level).
Chapter 2 – How do young le make subject and course choices? Pupils’ course and subject choices ultimately represent a series of decisions about the sort of life they would like to lead in future. Some evidence already exists on the inputs into young people’s choices, particularly with regard to the issues they consider and the role played by information, advice and guidance. We attempt to take this further by considering the cognitive mechanisms by which young people may make their subject and course choices.
peop
5
people’s subject an course choices.
We recommend two particular areas as meriting further investigation: present bias and default/anchoring bias. If present bias were shown to be a particular issue in subject and course choices, this might militate in favour of earlier decision times or other ways to allow young people to commit to decisions as early as possible. Should default/anchoring issues be problematic, this might suggest the creation of ‘desirable’ defaults or anchors (or the avoidance of defaults or anchors that are unsuitable to wide numbers of young people). These are just two examples where experimental techniques could provide concrete evidence for appropriate policy reactions. Not only could such techniques produce valuable evidence: they are comparably inexpensive and could significantly add to understanding on how young people approach choices in general, as well as their cognitive development.
In the standard model of rational decision‐making, it is generally assumed that individuals make the best possible decision from the choices available to them, given the information at their disposal. If young people’s subject and course choices conformed to such a model, then the government might wish to offer high‐quality information to students, but no further intervention would be required (unless there were clear spill‐over benefits to society from individuals taking particular subjects) . Current evidence suggests that the quality of information available to young people is, at best, variable, suggesting significant room
he s for improvement even under t trong assumptions of rational decision‐making.
In recent years, researchers in psychology and behavioural economics have documented numerous anomalies which suggest that human decision‐making is far from perfectly rational and that individuals use a range of ‘rules of thumb’, as well as being subject to a variety of cognitive and emotional biases, when making decisions. What insights can behavioural economics provide for the way young people make subject and course choices, and how could policymakers respond?
Evidence from behavioural economics suggests that individuals appear to treat the present as a ‘special case’ when planning ahead (present bias), appear to exhibit overconfidence in their own ability and over‐optimism about the likelihood that good things will happen to them, and appear to underestimate their own adaptability when imagining their life under different circumstances (projection bias). Applying this to subject and course choices, present bias suggests that individuals may overweight short‐run considerations (such as taking easier courses) compared with long‐run considerations. Overconfidence suggests that pupils may overestimate their likelihood of performing well at school, and so could choose courses to which they are ill‐suited. Projection bias suggests that students may not fully appreciate the way their preferences will change, and may thus make choices that restrict their ability to make desirable choices at later ages.
Framing effects suggest that young people might be influenced (or ‘nudged’) towards certain options, depending on how those options are presented. In particular, default options are more likely to be chosen for reasons beyond their actual desirability, and ‘anchoring’ based on recently‐presented pieces of information may also bias individuals’ choices. The order in which choices are presented could matter, as could whether they are described as losses or gains around some reference point. Over‐introspection regarding large choice sets could also worsen the quality of decision‐making.
Policymakers should, however, be particularly cautious before directly applying these insights to school pupils. The evidence supporting these insights overwhelmingly comes from experiments in laboratory settings, usually conducted on adults rather than school‐age individuals. Results derived from adults may not be a reliable guide to the decision‐making of young people. The parts of the brain associated by neuroscientists with long‐term planning and impulse control show significant development during adolescence, and continue to develop into the mid‐20s. It is therefore entirely possible that young people may be even more prone to present‐biasing impulses than adults are. Nonetheless, in the absence of experimental evidence quantifying the extent to which such biases actually affect young people’s choices, we must restrict attention to the implications these behavioural regularities might have for young
d
6
consideration.
Meanwhile, young people’s views of the future clearly affect their subject choices. Those who believed from an early age (Year 9) that they were likely to get into university are more likely to take the EBacc combination of subjects, to stay on in full‐time education and to study A Levels. On the other hand, the mere intention to apply, if not accompanied by self‐confidence about getting in, appears to have little impact on those subject and course choices. It should be noted that the observed correlation between aspiration and positive educational choices does not necessarily mean there is any causal relationship. We might well be measuring some innate ability or quality (such as optimism or drive) that is not fully
Chapter 3 – The role of schools At both Key Stages 4 and 5, we see a strong degree of differentiation in the subjects and courses offered in secondary schools, with some offering a large range of academic and vocational course types while others focus solely on academic courses. We discuss factors that could be driving those differences.
Schools face a substantial degree of pressure as a result of the annually‐published league tables. We provide suggestive evidence that schools have been ‘gaming’ the system by moving aggressively into vocational subjects with comparatively generous GCSE equivalencies, which was also the conclusion of the Wolf Review of Vocational Education. Schools performing comparatively poorly on the raw ‘at least five GCSEs at grade A*–C’ measure appear to have moved most rapidly towards vocational courses, and the schools that were swiftest to adopt vocational courses appear to have made the most substantial gains in their ‘5+ A*–C’ performance. These latter schools also appear to have improved their GCSE Maths and English performances, though to a smaller extent than the gain in the ‘5+ A*–C’ measure. Curiously, Basic Skills in Literacy and Numeracy do not appear to have been exclusively focused on pupils with fundamental difficulties with English and Maths. These results do not prove definitively that schools have been ‘gaming’ the league table system. It could be argued that the schools with poorly‐performing pupils were also those whose pupils would gain most from a shift towards vocational, rather than academic, courses. It is also important to remember that the alternative situation for these pupils might have been leaving school with very few GCSEs, and these pupils may thus have benefited from being able to take vocational qualifications.
Evidence from the Longitudinal Survey of Young People in England (LSYPE) suggests that in 2005–06 around a fifth of students were unable to choose one or more courses or subjects that they wished to study – most often because the school simply did not offer the course in question or because of timetable clashes. For many pupils, therefore, school organisation and resources appear to be a binding constraint, preventing them from pursuing some of the courses they would like to take.
Chapter 4 – Multivariate analysis of subject choices
In this chapter, we analyse subject choice patterns according to particular child and family characteristics, and how these patterns are affected by controlling for school characteristics, prior attainment and young people’s attitudes and preferences. We find that gender differences in subject choices are largely unaffected by taking these characteristics into account. For example, boys are significantly more likely than girls to study triple science, even after controlling for prior attainment and subject preferences. This
t urcesuggests hat the so of gender differences lies elsewhere, such as in gender stereotypes.
We also find that children from richer families and children whose parents have higher levels of education are more likely to study triple science, to take the English Baccalaureate (EBacc) combination, to stay on in full‐time education after Year 11 and to study A Levels. However, such differences largely disappear when we control for prior attainment and a wider range of factors. Children who have ever had a Special Educational Need are less likely to study these subjects and to stay on, which can also be largely explained by differences in prior attainment. There is less consistency according to ethnic differences, with individuals’ subject choices displaying quite different patterns depending on the subject under

7
captured by test scores.
8
extremely difficult to answer.
If young people are fully informed about the consequences of all the choices available to them, and weigh their choices in a careful and rational manner, then there is likely to be little need for any external influence (unless there were clear spill‐over benefits to society from individuals taking particular subjects). If, as seems more likely, these decisions are made in conditions of considerable uncertainty, the provision of guidance and mandatory minimum requirements would seem altogether more important. In this report, we consider the policy consequences of both purely ‘rational’ models of decision‐making (often used as the starting point for models of economic decisions) and the more effect‐ and context‐driven decision‐making theories developed by psychologists and behavioural economists.
Introduction From the age of 14 onwards, young people in England are given ever‐more control over the direction of their education – gaining access to a variety of different qualification types and an ever‐expanding menu of possible subjects. At each stage, their choices can have far‐reaching consequences for both their subsequent education options and their later‐life outcomes. Subject and course choices made at 14 influence the options available after the age of 16, and post‐16 choices will in turn affect later options available to young people in terms of further study at university, further training and employment opportunities. At every stage, choices are likely to affect young people’s later‐life employment prospects, earnings and job satisfaction.
While the importance of subject and course choices for young people is very clear, the area remains comparatively little studied by academic researchers, and comparatively poorly understood outside of education policymaking circles. Most people remember the choices available when they were at school (whether they were O Levels and A Levels or GCSEs and GNVQs), but the array of new courses that have sprung up in recent years, from Diplomas and Vocationally Related Qualifications to Key Skills and International Baccalaureates, can seem bewildering to anyone whose school days lie more than a few years in the past.
Employers continue to complain that too many young people lack ‘basic skills’, while policymakers continue to search for ways to encourage young people to take more courses in areas (such as Science and Maths) for which England is claimed to be suffering a ‘skills shortage’. Newspapers continue to fret about the ‘dumbing‐down’ of exams and qualifications, while others rail against the possible emergence of a ‘two‐tier education system’ divided along lines of social class or between vocational and academic courses. The issue of course choices thus combines a high level of political sensitivity and forceful opinion with a comparative paucity of hard evidence.
In this report, we attempt to address some of the key issues relating to young people’s subject and course choices, both from a purely descriptive standpoint – explaining the different choices on offer in England at ages 14 and 16, and documenting the actual decisions made by recent cohorts of young people – and from a more scientific perspective, attempting to point the way towards future experiments that may begin to untangle the cognitive mechanisms through which young people make decisions about their future.
All modern societies accept that children should be heavily guided (and often subjected to outright compulsion) in making decisions relating to their education. Such considerations underlie compulsory education ages, national curricula, standardised national tests and many more aspects of most nations’ education systems. But how much help (and compulsion) do young people need with regard to their subject and course choices? To what extent should they be compelled to study certain courses or subjects and to what extent should they be trusted to make their own decisions? Without a deeper understanding of the operation and development of young people’s decision‐making abilities, such questions are
9
The relevance of insights from behavioural economics and psychology to the way individuals make choices, and what role there might be for national policymakers, have already been the subject of reviews in other domains such as health policy (Cabinet Office, 2010) and financial services (de Meza et al., 2008; prepared for the Financial Services Authority). An important goal of this report is to understand whether such insights are likely to be relevant to understanding the way young people make choices, how schools can influence these choices and what role this might suggest for national policymakers.
The rest of this report proceeds as follows. We begin in Chapter 1 by describing the options and choices currently available to young people at the ages of 14 and 16. In Chapter 2, we focus on how young people make their subject and course choices. We start by looking at existing evidence, before focusing in detail on how insights from behavioural economics and psychology might be relevant to the question of subject and course choices. We examine a range of well‐documented cognitive biases in turn, and consider the ways in which these biases might affect young people’s decision‐making as they choose their courses. These psychological models often suggest that even well‐informed young people may make choices that could diminish their well‐being in the future, and which they may later come to regret. The extent to which these biases are truly problematic can only be established, of course, by carefully‐designed experiments. We therefore also offer some thoughts on how such experiments could be attempted.
Chapter 3 examines the role of schools in shaping young people’s subject and course choices. Schools are far from being passive receptacles of the different courses on offer in England’s education system, having considerable control over the courses they offer to their students and over the manner in which those choices are presented. With schools in England under considerable pressure to perform well in national school league tables, there is a clear concern that schools may attempt to ‘game the system’ by identifying comparatively straightforward vocational courses, which nonetheless receive generous GCSE ‘equivalencies’ in school league tables, and encouraging pupils to take those courses. While we cannot prove conclusively that such gaming has taken place, we present suggestive evidence that is likely to provide grounds for concern.
In Chapter 4, we conduct new ‘multivariate’ data analysis to examine whether differences in subject and course choices are strongly correlated with individual pupil characteristics (such as gender and family income), with differences in the characteristics of the schools they attend, with their prior attainment in earlier years and with their stated aspirations and preferences. Given the recent direction of government policy regarding the English Baccalaureate (or ‘EBacc’) – a particular combination of subjects which will be measured in future school performance tables – we focus particular attention on explaining differences in the likelihood that pupils study this particular combination of subjects. Chapter 5 concludes.
We should state at the outset that we make no attempt to draw conclusions about many hotly‐debated aspects of England’s qualifications system, such as the aforementioned ‘dumbing‐down’ and ‘skills shortage’ concerns. Our aim is to describe the current state of the system, in the hope that such debates may proceed on a firmer empirical footing in future.
10
57% of schools and OCR
1. Subject and course choices at 14 and 16 In this chapter, we describe the subject and course choices available to pupils in England’s schools and the current pattern of choices they make. We begin in Section 1.1 by describing the choices pupils face in Year 9 (ages 13–14), when they must decide on their courses and subjects at Key Stage 4 (Years 10 and 11). In Section 1.2, we move on to consider young people’s post‐16 choices, describing the courses on offer at Key Stage 5 and the current pattern of choices young people make. Section 1.3 summarises the key results.
1.1 Key Stage 4 choices
A number of different qualification types are available to young people at Key Stage 4, varying widely in both their level of difficulty and their availability in England’s schools. These include (in descending order of availability in England’s schools):
• General Certificates of Secondary Education (GCSEs) – the main academic qualifications currently taken by 15‐ to 16‐year‐olds. GCSEs in English, Maths and Science form a compulsory (‘core’) component of the National Curriculum. Beyon
m over 50 different subjects. d this requirement, schools can offer a selection of
GCSE courses fro• Vocationally Related Qualifications (VRQs –) professional qualifications focused on specific areas
of employment. • Basic Skills and Functional Skills courses – intended to improve fundamental literacy, numeracy
and computer skills. • Business and Tech k
anology Education Council (BTEC) courses – an alternative wor ‐related
qualification, available in areas such s sport, media and business. • Key Skills courses ‘tr mu – intended to improve ansferable skills’ such as com nication, problem
solving and teamwork. • Vocational GCSEs – a more work‐focused alternative to academic GCSEs, focusing on specific
industries, such as Health & Social Care and Leisure & Tourism. • OCR Nationals – exam‐free vocational qualifications, introduced by the OCR examinations board in
2004, available in similar areas to BTECs and VRQs. • Diplomas – introduced in September 2008 with the intention of combining theoretical study with
practical experience.
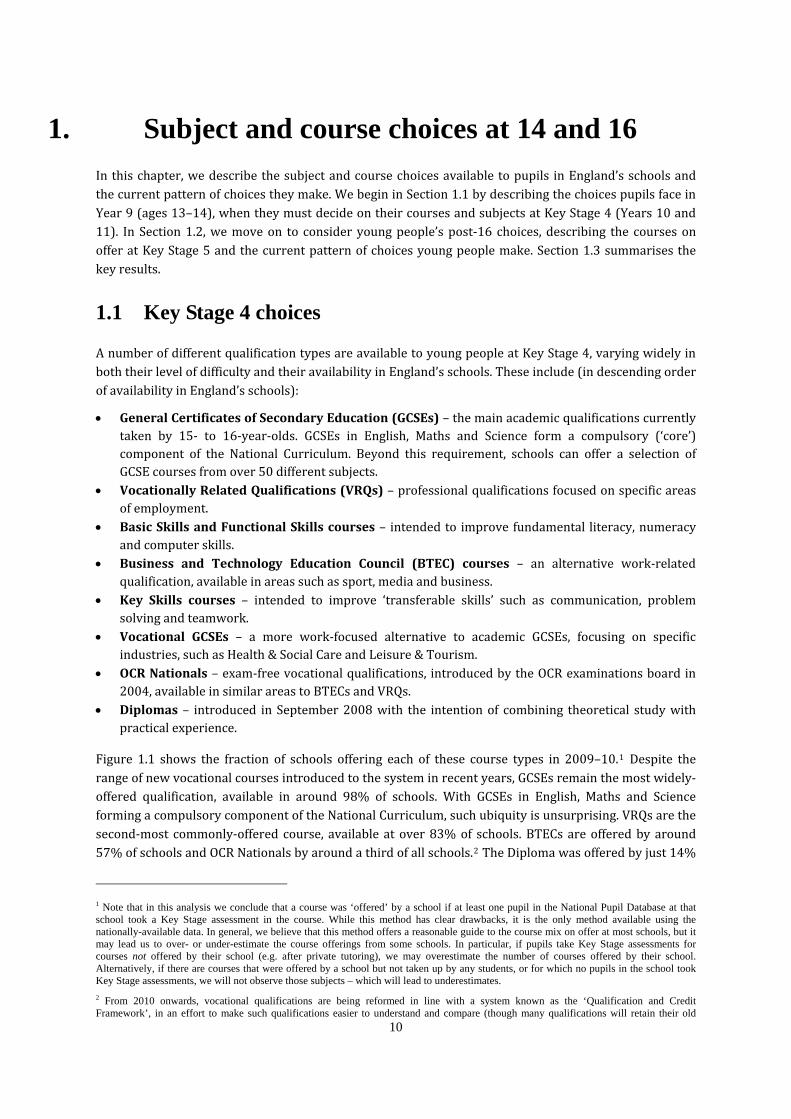
Figure 1.1 shows the fraction of schools offering each of these course types in 2009–10.1 Despite the range of new vocational courses introduced to the system in recent years, GCSEs remain the most widely‐offered qualification, available in around 98% of schools. With GCSEs in English, Maths and Science forming a compulsory component of the National Curriculum, such ubiquity is unsurprising. VRQs are the second‐most commonly‐offered course, available at over 83% of schools. BTECs are offered by around
Nationals by around a third of all schools.2 The Diploma was offered by just 14%
1 Note that in this analysis we conclude that a course was ‘offered’ by a school if at least one pupil in the National Pupil Database at that school took a Key Stage assessment in the course. While this method has clear drawbacks, it is the only method available using the nationally-available data. In general, we believe that this method offers a reasonable guide to the course mix on offer at most schools, but it may lead us to over- or under-estimate the course offerings from some schools. In particular, if pupils take Key Stage assessments for courses not offered by their school (e.g. after private tutoring), we may overestimate the number of courses offered by their school. Alternatively, if there are courses that were offered by a school but not taken up by any students, or for which no pupils in the school took Key Stage assessments, we will not observe those subjects – which will lead to underestimates. 2 From 2010 onwards, vocational qualifications are being reformed in line with a system known as the ‘Qualification and Credit Framework’, in an effort to make such qualifications easier to understand and compare (though many qualifications will retain their old
of schools in 2009–10.
Figure 1.1. Percentage of schools offering Key Stage 4 course types (2009–10)
0%10%20%30%40%50%60%70%80%90%
100%
Acade
mic GCSEs
VRQs
Basic
Skills
BTECs
Key S
kills
Vocati
onal
GCSEs
OCR Nati
onals
Diplom
asPerc
enta
ge o
f sch
ools
offe
ring
cour
se ty
pe
Note: Schools are counted as offering a course type if they register results in at least one Key Stage 4 assessment of that type. Source: Authors’ calculations using the National Pupil Database. Sample size = 5,266.
These different qualifications can often be completed in combination with one another, e.g. combining GCSEs and vocational qualifications. Indeed, as we will show in Chapter 3, the single most popular offering among England’s secondary schools is all seven of the most popular course types shown in Figure 1.1 (i.e. all excluding Diplomas). However, reflecting the substantial degree of differentiation in England’s secondary school system, a substantial minority of schools offer only academic GCSE subjects.
No matter what type of qualifications they take, all young people are required to study English, Maths and Science. They are also required to study (though are not necessarily examined) in the following areas: Information and Computer Technology (ICT); Physical Education (PE); Personal, Social, Health and Economic Education (PSHE); Citizenship; work experience; religious education; and careers education. State‐funded schools (with the exception of some academies) must also offer young people access to each of the following broad areas:
• humanities (Geography and History); a an
• 4); • d Media Arts); arts (including Art & Design, Music, Dance, Dram
modern foreign languages (compulsory until 200l i .• design and techno ogy (compulsory unt l 2004)
The government has recently introduced a new benchmark at Key Stage 4, known as the ‘English Baccalaureate’ (EBacc). Young people are awarded the EBacc if they gain a grade C or above in GCSEs in all of the following areas: English; Maths; a science; a humanity (Geography or History); and a modern or ancient foreign language. In the latest data, for 2009–10, just 15.6% of pupils would have met this benchmark.
Having considered the choices available to young people, we now turn to the subject of what individual pupils end up choosing. Figure 1.2 shows the proportion of young people taking different course types in
2009–10. Appendix Table A.1 shows the proportion of pupils taking each course type by gender and
names).
11
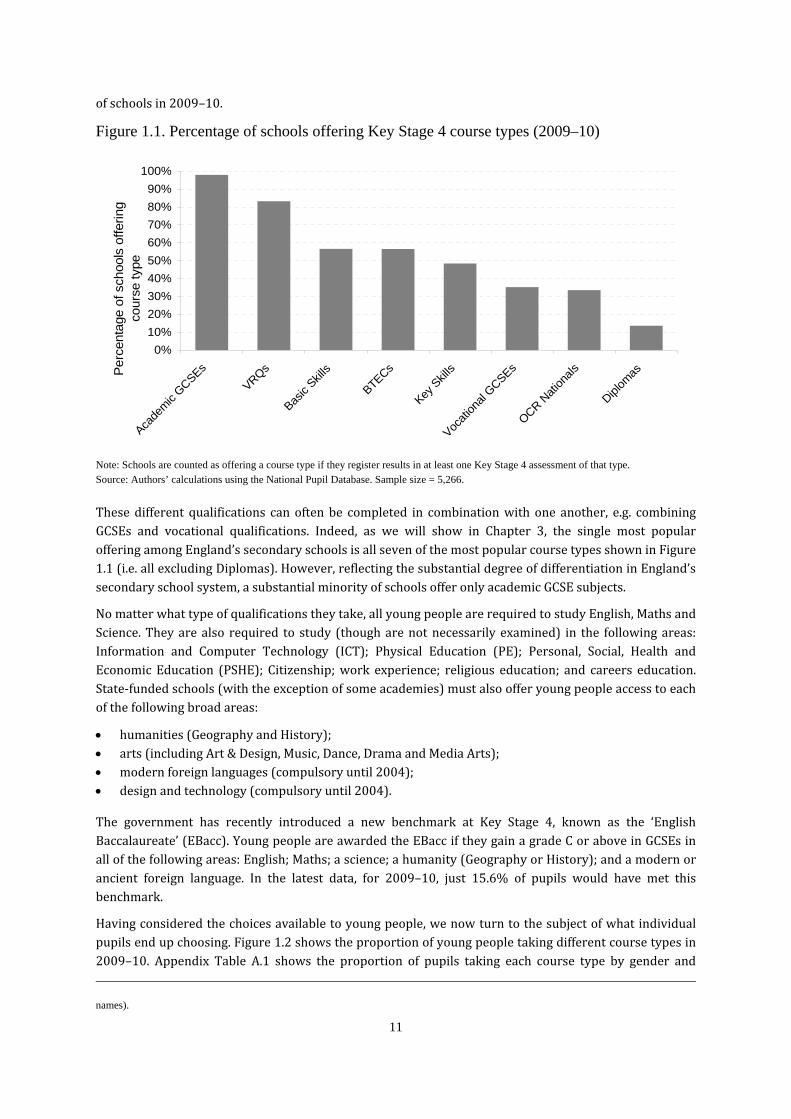
eligibility for free school meals (FSM), as well as the proportions taking different combinations of courses.
Figure 1.2. Percentage of pupils taking different Key Stage 4 course types (2009–10)
0%10%20%30%40%50%60%70%80%90%
100%
GCSEsVRQs
BTECs
OCR Nati
onals
Basic
Skills
Key S
kills
Functi
onal
Skills
NVQs
Diplom
as
Perc
enta
ge o
f pup
ils ta
king
this
cou
rse
type
Academic GCSEs only
Academic and vocational GCSEs
Note: Pupils are counted as taking a course type if they register results in at least one Key Stage 4 assessment of that type. Source: Authors’ calculations using the National Pupil Database. Sample size = 631,448.
Unsurprisingly, GCSEs are by far the most widely‐taken qualification at Key Stage 4. Of those taking GCSEs, about 89% take only GCSEs in academic subjects, while around 11% of pupils take GCSEs in both vocational and academic subjects. GCSEs in vocational subjects are more likely to be taken by girls and slightly more likely to be taken by pupils eligible for FSM (see Appendix Table A.1).
Of the other vocational qualifications, VRQs are most popular, with 42% of pupils taking at least one VRQ course. BTECs are the next most popular, taken by 30% of students. Basic Skills courses are taken by around one in five pupils, whilst OCR Nationals and Key Skills courses are taken by around 14% of students. Diplomas have comparatively low take‐up (perhaps unsurprising, given that this was the first cohort able to take Diplomas).
In terms of the combinations of courses taken by pupils in 2009–10, Appendix Table A.2 shows that about a third of students take only GCSEs and a further fifth take GCSEs in combination with VRQs (but no other course types). Around 9% take GCSEs with BTECs (but no other course types), and a further 9% take GCSEs, VRQs and BTECs. On average, students taking combinations involving BTECs are more likely to be from poorer families (that is, they are more likely to be eligible for FSM than pupils on average) than those taking only GCSE/VRQ/OCR combinations.
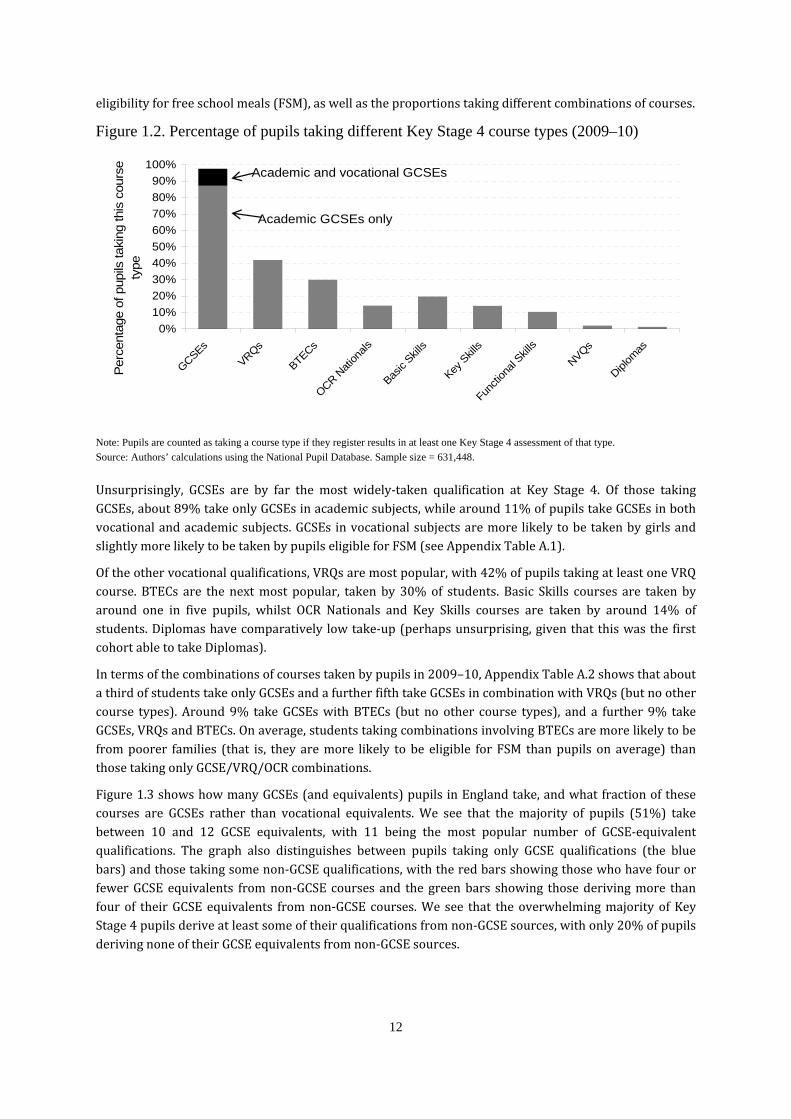
Figure 1.3 shows how many GCSEs (and equivalents) pupils in England take, and what fraction of these courses are GCSEs rather than vocational equivalents. We see that the majority of pupils (51%) take between 10 and 12 GCSE equivalents, with 11 being the most popular number of GCSE‐equivalent qualifications. The graph also distinguishes between pupils taking only GCSE qualifications (the blue bars) and those taking some non‐GCSE qualifications, with the red bars showing those who have four or fewer GCSE equivalents from non‐GCSE courses and the green bars showing those deriving more than four of their GCSE equivalents from non‐GCSE courses. We see that the overwhelming majority of Key Stage 4 pupils derive at least some of their qualifications from non‐GCSE sources, with only 20% of pupils deriving none of their GCSE equivalents from non‐GCSE sources.
12
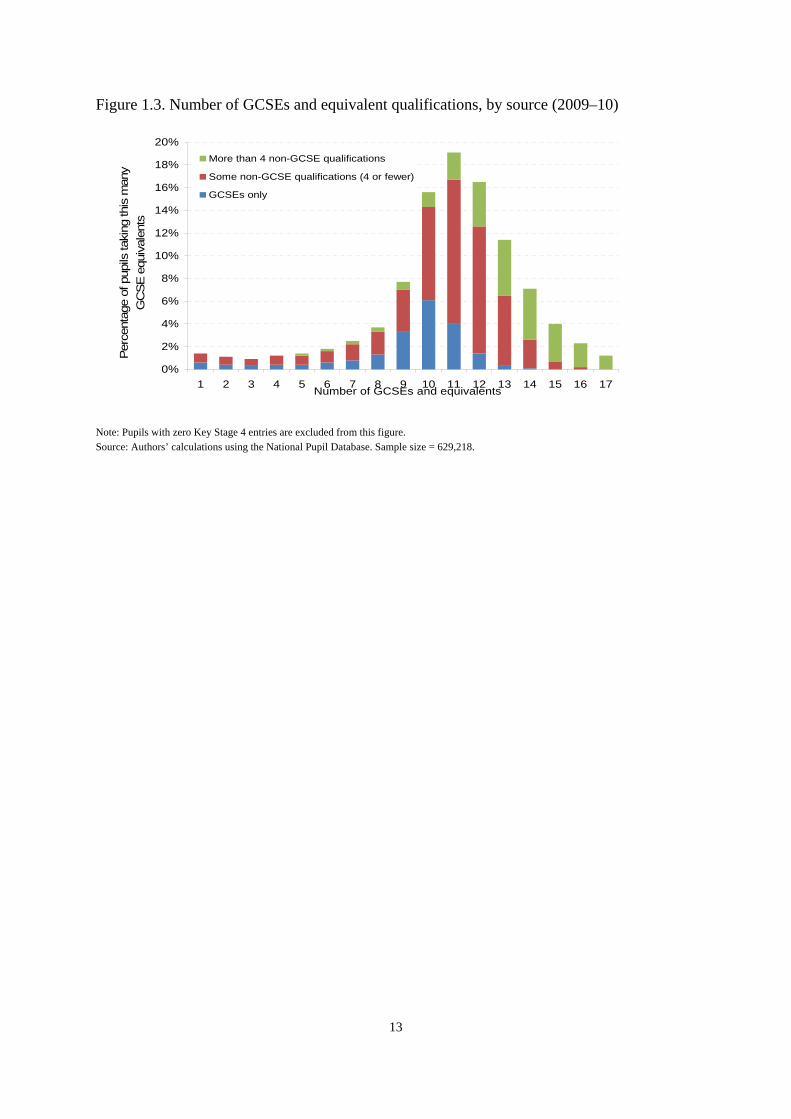
Figure 1.3. Number of GCSEs and equivalent qualifications, by source (2009–10)
0%
2%
4%
6%
8%
10%
12%
14%
16%
18%
20%
1 2 3 4 5 6 7 8 9 10 11 12 13 14 15 16 17Number of GCSEs and equivalents
Perc
enta
ge o
f pup
ils ta
king
this
man
y G
CSE
equ
ival
ents
More than 4 non-GCSE qualifications
Some non-GCSE qualifications (4 or fewer)
GCSEs only
Note: Pupils with zero Key Stage 4 entries are excluded from this figure. Source: Authors’ calculations using the National Pupil Database. Sample size = 629,218.
13
14
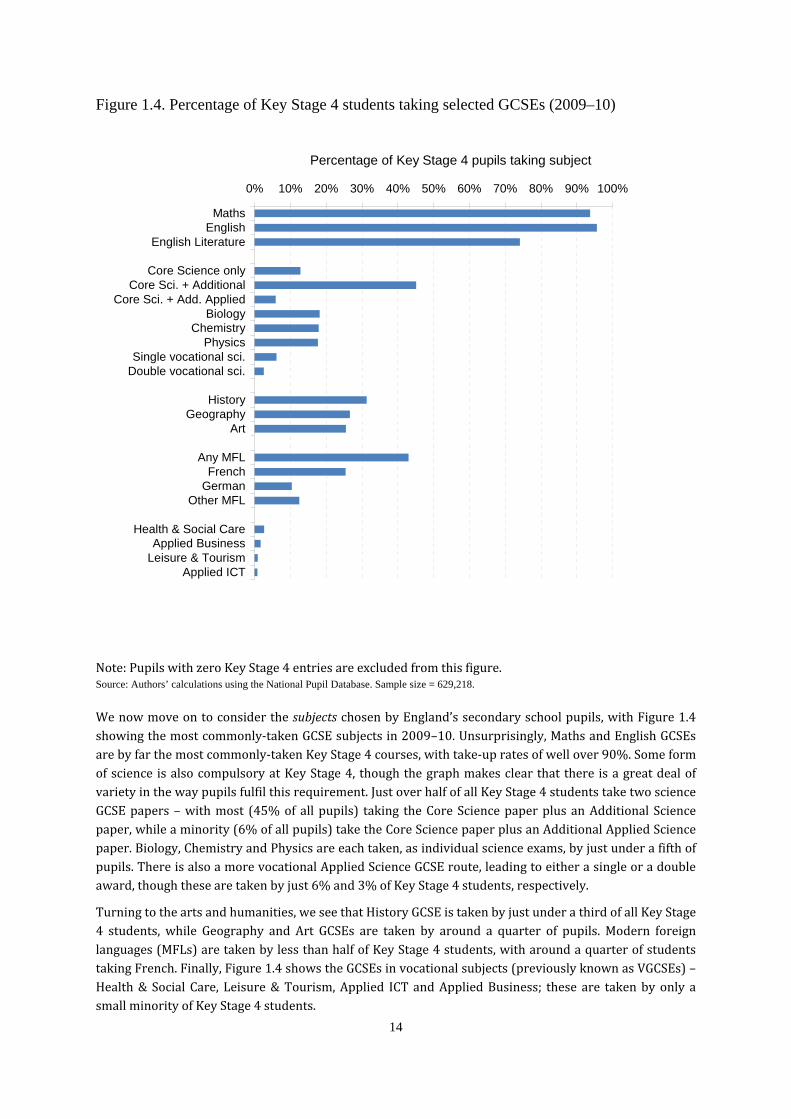
Figure 1.4. Percentage of Key Stage 4 students taking selected GCSEs (2009–10)
0% 10% 20% 30% 40% 50% 60% 70% 80% 90% 100%
MathsEnglish
English Literature
Core Science onlyCore Sci. + Additional
Core Sci. + Add. AppliedBiology
ChemistryPhysics
Single vocational sci.Double vocational sci.
HistoryGeography
Art
Any MFLFrench
GermanOther MFL
Health & Social CareApplied Business
Leisure & TourismApplied ICT
Percentage of Key Stage 4 pupils taking subject
Note: Pupils with zero Key Stage 4 entries are excluded from this figure. Source: Authors’ calculations using the National Pupil Database. Sample size = 629,218.
We now move on to consider the subjects chosen by England’s secondary school pupils, with Figure 1.4 showing the most commonly‐taken GCSE subjects in 2009–10. Unsurprisingly, Maths and English GCSEs are by far the most commonly‐taken Key Stage 4 courses, with take‐up rates of well over 90%. Some form of science is also compulsory at Key Stage 4, though the graph makes clear that there is a great deal of variety in the way pupils fulfil this requirement. Just over half of all Key Stage 4 students take two science GCSE papers – with most (45% of all pupils) taking the Core Science paper plus an Additional Science paper, while a minority (6% of all pupils) take the Core Science paper plus an Additional Applied Science paper. Biology, Chemistry and Physics are each taken, as individual science exams, by just under a fifth of pupils. There is also a more vocational Applied Science GCSE route, leading to either a single or a double award, though these are taken by just 6% and 3% of Key Stage 4 students, respectively.
Turning to the arts and humanities, we see that History GCSE is taken by just under a third of all Key Stage 4 students, while Geography and Art GCSEs are taken by around a quarter of pupils. Modern foreign languages (MFLs) are taken by less than half of Key Stage 4 students, with around a quarter of students taking French. Finally, Figure 1.4 shows the GCSEs in vocational subjects (previously known as VGCSEs) – Health & Social Care, Leisure & Tourism, Applied ICT and Applied Business; these are taken by only a small minority of Key Stage 4 students.
15
Appendix Table A.3 provides more detail regarding the types of student taking each GCSE subject, breaking each subject’s intake down by sex and eligibility for FSM. This shows that subjects which might be considered more ‘academic’ in nature, such as English Literature, History, Geography, modern foreign languages and the triple science exams, are disproportionately taken by students from less‐deprived backgrounds – pupils eligible for FSM are less than half as likely to take individual science exams as their less‐deprived peers. The individual science GCSEs are also taken by a greater percentage of boys than girls, while girls are more likely than boys to study Art and modern foreign languages.
A small minority of pupils take GCSEs in vocational subjects, and we see substantial gender divides in the different subjects (revealed in Appendix Table A.3). Among students taking GCSEs in more vocational subjects, the most marked gender divide is seen in the Health & Social Care GCSE, which has an intake that is nearly 96% female. The Leisure & Tourism GCSE also has a disproportionately female intake, though the divide is less stark (57% female), while the gender divide is reversed for Applied Business, which has an intake that is 57% male.
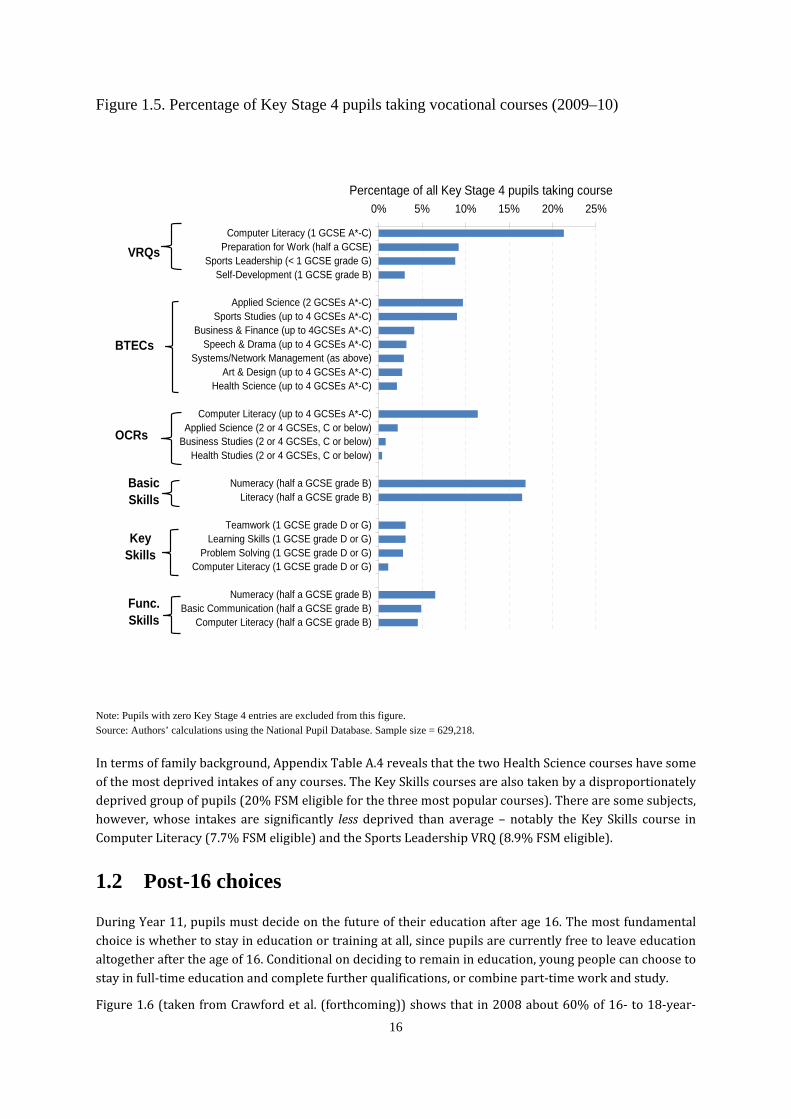
Figure 1.5 shows the fraction of Key Stage 4 pupils taking the most popular vocational subjects, grouped by course type. We see that by far the most popular course is the VRQ in Computer Literacy, worth one GCSE grade A*–C, which is taken by over a fifth of all pupils. Basic Skills in Numeracy and Literacy are taken by about a sixth of students. Next most popular is the OCR National course in Computer Literacy, worth up to four GCSEs at grade A*–C, taken by over 10% of all Key Stage 4 students. The most popular BTEC courses are the Applied Science course, worth two GCSEs at grade A*–C, and Sports Studies, worth up to four GCSEs at grade A*–C, each taken by just under 10% of Key Stage 4 pupils. Of the remaining vocational qualifications, the most popular are the Basic Skills courses in Numeracy and Literacy, each worth half a GCSE at grade B and each taken by 17% of all Key Stage 4 pupils. Finally, the Functional Skills and Key Skills assessments are taken by around 5% of students or less, though the Functional Skills assessment in Numeracy (worth half a GCSE at grade B) is the most popular of these courses, taken by over 6% of all Key Stage 4 pupils.
Appendix Table A.4 provides more detail regarding these course types, breaking down their intakes by gender and FSM status. This shows that the most significant gender imbalances are seen in Health Science courses (both the BTEC and OCR), whose intakes are around 95% female. Several other BTECs also show significant gender biases, with Speech & Drama having an intake that is 72% female and Art & Design having an intake that is 61% female, while Sports Studies is nearly 65% male.
16
Figure 1.5. Percentage of Key Stage 4 pupils taking vocational courses (2009–10)
0% 5% 10% 15% 20% 25%
Computer Literacy (1 GCSE A*-C)Preparation for Work (half a GCSE)
Sports Leadership (< 1 GCSE grade G)Self-Development (1 GCSE grade B)
Applied Science (2 GCSEs A*-C)Sports Studies (up to 4 GCSEs A*-C)
Business & Finance (up to 4GCSEs A*-C)Speech & Drama (up to 4 GCSEs A*-C)
Systems/Network Management (as above)Art & Design (up to 4 GCSEs A*-C)
Health Science (up to 4 GCSEs A*-C)
Computer Literacy (up to 4 GCSEs A*-C)Applied Science (2 or 4 GCSEs, C or below)
Business Studies (2 or 4 GCSEs, C or below)Health Studies (2 or 4 GCSEs, C or below)
Numeracy (half a GCSE grade B)Literacy (half a GCSE grade B)
Teamwork (1 GCSE grade D or G)Learning Skills (1 GCSE grade D or G)
Problem Solving (1 GCSE grade D or G)Computer Literacy (1 GCSE grade D or G)
Numeracy (half a GCSE grade B)Basic Communication (half a GCSE grade B)
Computer Literacy (half a GCSE grade B)
Percentage of all Key Stage 4 pupils taking course
VRQs
BTECs
OCRs
KeySkills
Func.Skills
Basic Skills
Note: Pupils with zero Key Stage 4 entries are excluded from this figure. Source: Authors’ calculations using the National Pupil Database. Sample size = 629,218.
In terms of family background, Appendix Table A.4 reveals that the two Health Science courses have some of the most deprived intakes of any courses. The Key Skills courses are also taken by a disproportionately deprived group of pupils (20% FSM eligible for the three most popular courses). There are some subjects, however, whose intakes are significantly less deprived than average – notably the Key Skills course in Computer Literacy (7.7% FSM eligible) and the Sports Leadership VRQ (8.9% FSM eligible).
1.2 Post-16 choices
During Year 11, pupils must decide on the future of their education after age 16. The most fundamental choice is whether to stay in education or training at all, since pupils are currently free to leave education altogether after the age of 16. Conditional on deciding to remain in education, young people can choose to stay in full‐time education and complete further qualifications, or combine part‐time work and study.
Figure 1.6 (taken from Crawford et al. (forthcoming)) shows that in 2008 about 60% of 16‐ to 18‐year‐
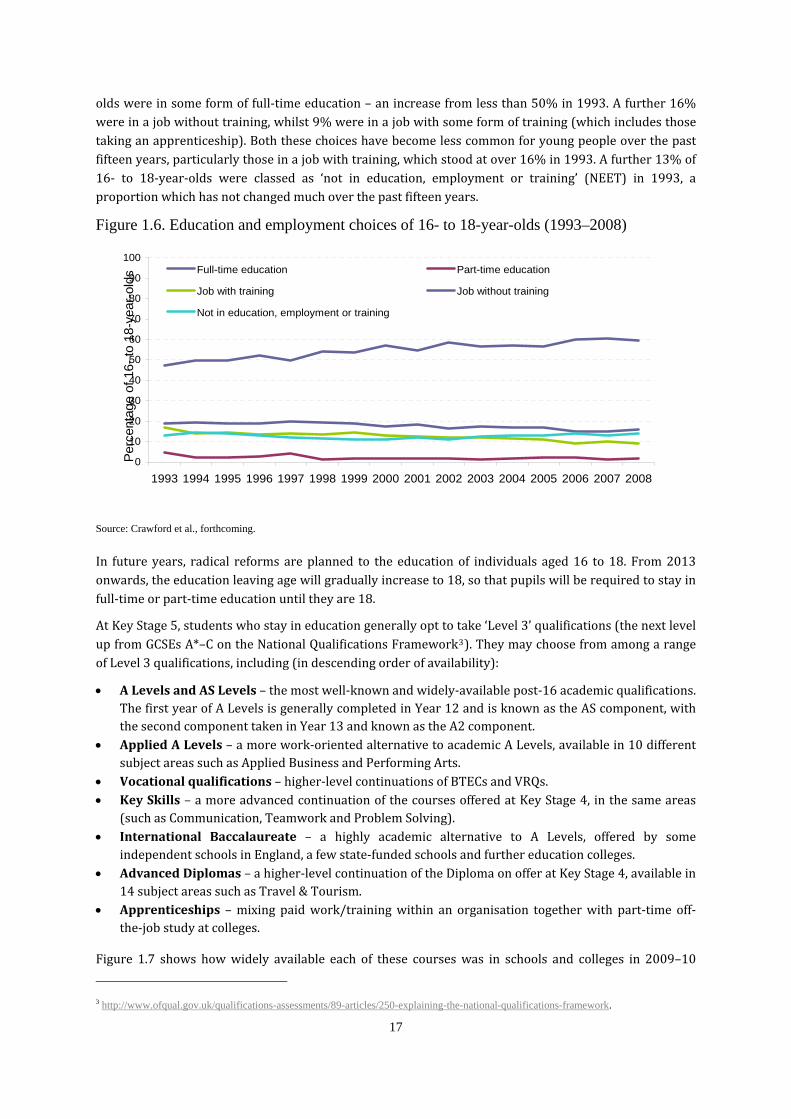
olds were in some form of full‐time education – an increase from less than 50% in 1993. A further 16% were in a job without training, whilst 9% were in a job with some form of training (which includes those taking an apprenticeship). Both these choices have become less common for young people over the past fifteen years, particularly those in a job with training, which stood at over 16% in 1993. A further 13% of 16‐ to 18‐year‐olds were classed as ‘not in education, employment or training’ (NEET) in 1993, a proportion which has not changed much over the past fifteen years.
Figure 1.6. Education and employment choices of 16- to 18-year-olds (1993–2008)
0
10
20
30
40
50
60
70
80
90
100
1993 1994 1995 1996 1997 1998 1999 2000 2001 2002 2003 2004 2005 2006 2007 2008
Per
cent
age
of 1
6- to
18-
year
-old
s Full-time education Part-time education
Job with training Job without training
Not in education, employment or training
Source: Crawford et al., forthcoming.
In future years, radical reforms are planned to the education of individuals aged 16 to 18. From 2013 onwards, the education leaving age will gradually increase to 18, so that pupils will be required to stay in full‐time or part‐time education until they are 18.
At Key Stage 5, students who stay in education generally opt to take ‘Level 3’ qualifications (the next level up from GCSEs A*–C on the National Qualifications Framework3). They may choose from among a range of Level 3 qualifications, including (in descending order of availability):
• A Levels and AS Levels – the most well‐known and widely‐available post‐16 academic qualifications. The first year of A Levels is generally completed in Year 12 and is known as the AS component, with the second component taken in Year 13 and known as the A2 component.
• Applied A Levels – a more , available in 10 different subject area
work‐oriented alternative to academic A Levels
• s such as Applied Business and Performing Arts.
Vocational qualifications – higher‐level continuations of BTECs and VRQs. • Key Skills – a more advanced c o a St a ontinuation f the courses offered t Key age 4, in the s me areas
(such as Communication, Teamwork and Problem Solving). • International Baccalaureate – a highly academic alternative to A Levels, offered by some
independent schools in England, a few state‐funded schools and further education colleges. • Advanced Diplom e as – a higher‐l vel continuation of the Diploma on offer at Key Stage 4, available in
14 subject areas such as Travel & Tourism. • Apprenticeships – mixing paid work/training within an organisation together with part‐time off‐
lthe‐job study at col eges.
idely available each of these courses was in schools and colleges in 2009–10
Figure 1.7 shows how w 3 http://www.ofqual.gov.uk/qualifications-assessments/89-articles/250-explaining-the-national-qualifications-framework.
17
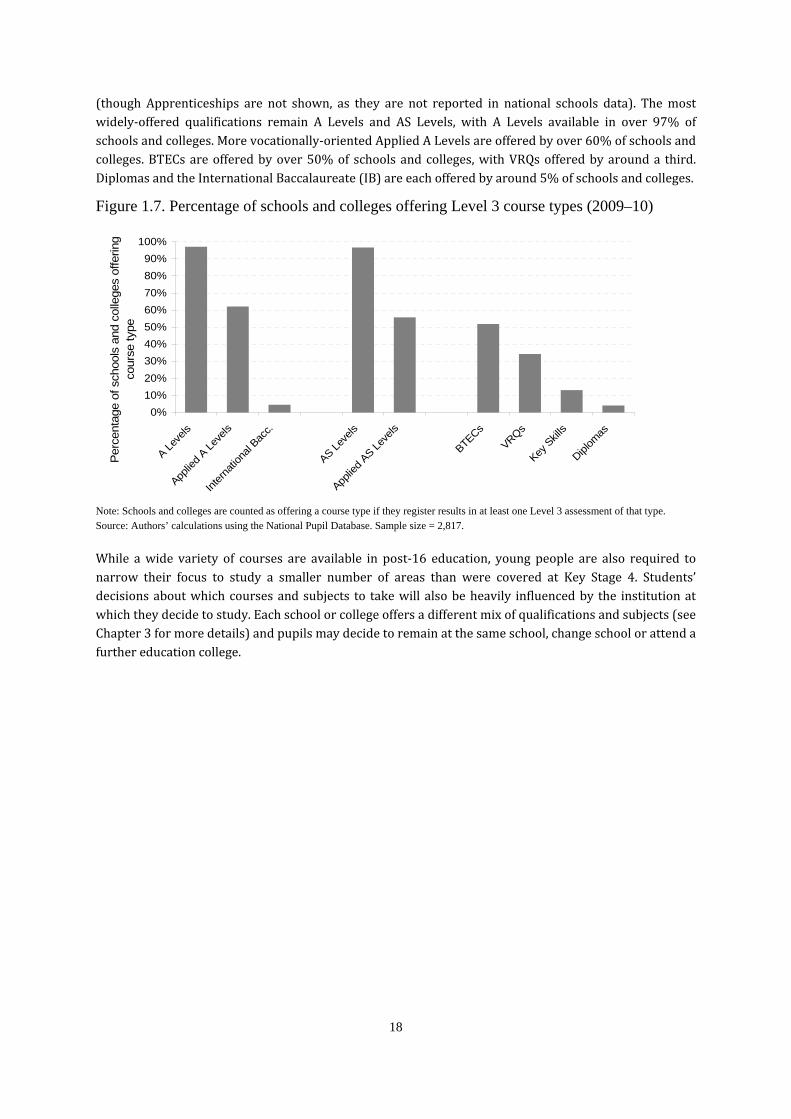
(though Apprenticeships are not shown, as they are not reported in national schools data). The most widely‐offered qualifications remain A Levels and AS Levels, with A Levels available in over 97% of schools and colleges. More vocationally‐oriented Applied A Levels are offered by over 60% of schools and colleges. BTECs are offered by over 50% of schools and colleges, with VRQs offered by around a third. Diplomas and the International Baccalaureate (IB) are each offered by around 5% of schools and colleges.
Figure 1.7. Percentage of schools and colleges offering Level 3 course types (2009–10)
0%10%20%30%40%50%60%70%80%90%
100%
A Leve
ls
Applie
d A Le
vels
Intern
ation
al Bac
c.
AS Leve
ls
Applie
d AS Le
vels
BTECsVRQs
Key S
kills
Diplom
as
Perc
enta
ge o
f sch
ools
and
col
lege
s of
ferin
g co
urse
type
Note: Schools and colleges are counted as offering a course type if they register results in at least one Level 3 assessment of that type. Source: Authors’ calculations using the National Pupil Database. Sample size = 2,817.
While a wide variety of courses are available in post‐16 education, young people are also required to narrow their focus to study a smaller number of areas than were covered at Key Stage 4. Students’ decisions about which courses and subjects to take will also be heavily influenced by the institution at which they decide to study. Each school or college offers a different mix of qualifications and subjects (see Chapter 3 for more details) and pupils may decide to remain at the same school, change school or attend a further education college.
18
19
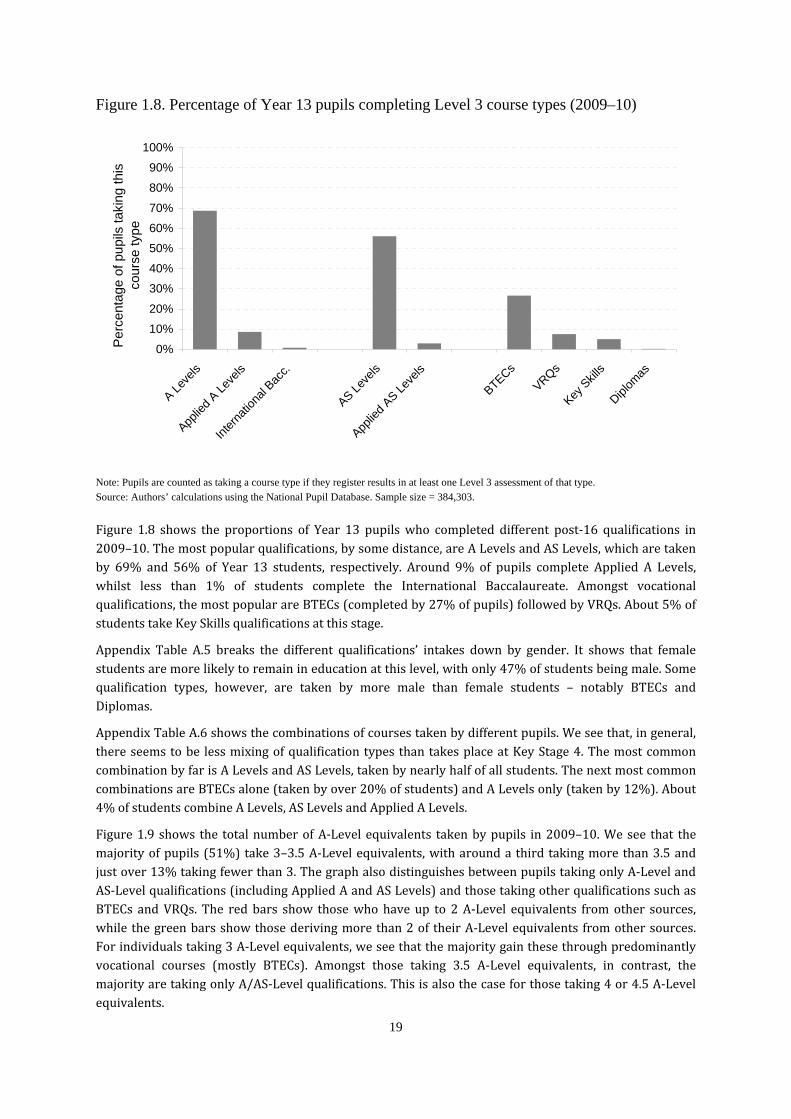
Figure 1.8. Percentage of Year 13 pupils completing Level 3 course types (2009–10)
0%
10%
20%
30%
40%
50%
60%
70%
80%
90%
100%
A Leve
ls
Applie
d A Le
vels
Intern
ation
al Bac
c.
AS Leve
ls
Applie
d AS Le
vels
BTECsVRQs
Key S
kills
Diplom
as
Perc
enta
ge o
f pup
ils ta
king
this
cour
se ty
pe
Note: Pupils are counted as taking a course type if they register results in at least one Level 3 assessment of that type. Source: Authors’ calculations using the National Pupil Database. Sample size = 384,303.
Figure 1.8 shows the proportions of Year 13 pupils who completed different post‐16 qualifications in 2009–10. The most popular qualifications, by some distance, are A Levels and AS Levels, which are taken by 69% and 56% of Year 13 students, respectively. Around 9% of pupils complete Applied A Levels, whilst less than 1% of students complete the International Baccalaureate. Amongst vocational qualifications, the most popular are BTECs (completed by 27% of pupils) followed by VRQs. About 5% of
ills quastudents take Key Sk lifications at this stage.
Appendix Table A.5 breaks the different qualifications’ intakes down by gender. It shows that female students are more likely to remain in education at this level, with only 47% of students being male. Some qualification types, however, are taken by more male than female students – notably BTECs and Diplomas.
Appendix Table A.6 shows the combinations of courses taken by different pupils. We see that, in general, there seems to be less mixing of qualification types than takes place at Key Stage 4. The most common combination by far is A Levels and AS Levels, taken by nearly half of all students. The next most common combinations are BTECs alone (taken by over 20% of students) and A Levels only (taken by 12%). About 4% of students combine A Levels, AS Levels and Applied A Levels.
Figure 1.9 shows the total number of A‐Level equivalents taken by pupils in 2009–10. We see that the majority of pupils (51%) take 3–3.5 A‐Level equivalents, with around a third taking more than 3.5 and just over 13% taking fewer than 3. The graph also distinguishes between pupils taking only A‐Level and AS‐Level qualifications (including Applied A and AS Levels) and those taking other qualifications such as BTECs and VRQs. The red bars show those who have up to 2 A‐Level equivalents from other sources, while the green bars show those deriving more than 2 of their A‐Level equivalents from other sources. For individuals taking 3 A‐Level equivalents, we see that the majority gain these through predominantly vocational courses (mostly BTECs). Amongst those taking 3.5 A‐Level equivalents, in contrast, the majority are taking only A/AS‐Level qualifications. This is also the case for those taking 4 or 4.5 A‐Level equivalents.
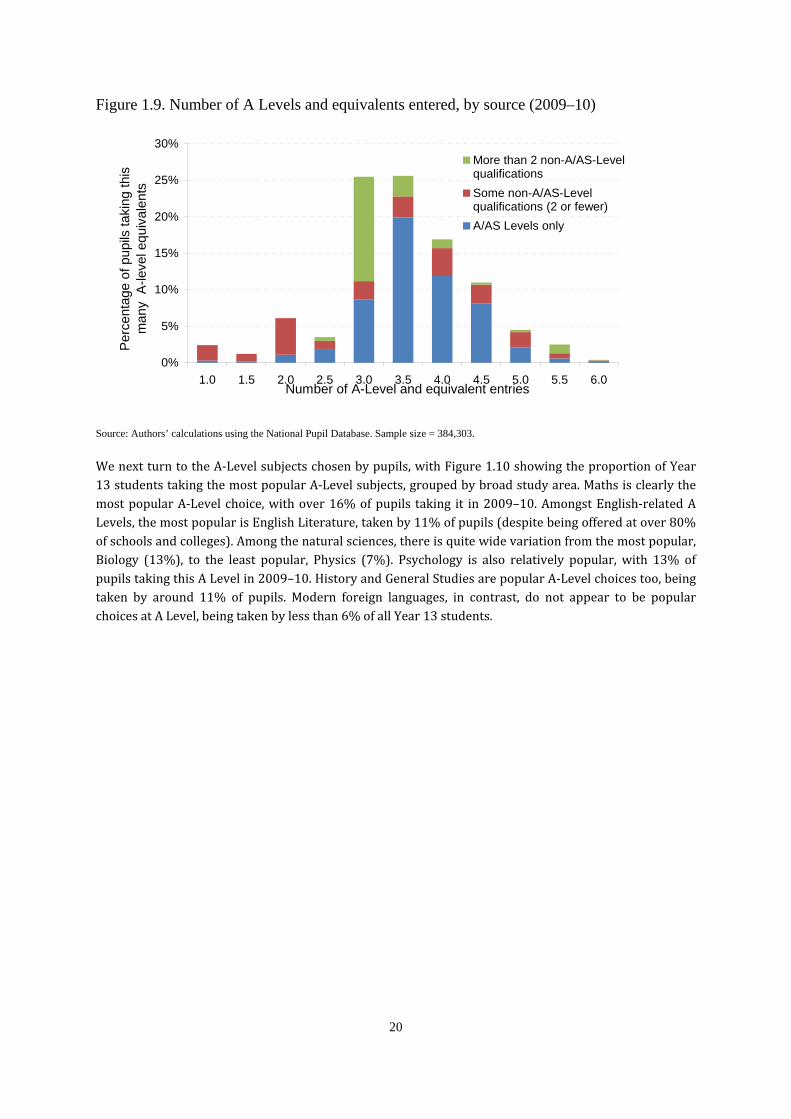
Figure 1.9. Number of A Levels and equivalents entered, by source (2009–10)
0%
5%
10%
15%
20%
25%
30%
1.0 1.5 2.0 2.5 3.0 3.5 4.0 4.5 5.0 5.5 6.0Number of A-Level and equivalent entries
Perc
enta
ge o
f pup
ils ta
king
this
m
any
A-le
vel e
quiv
alen
tsMore than 2 non-A/AS-LevelqualificationsSome non-A/AS-Levelqualifications (2 or fewer)A/AS Levels only
Source: Authors’ calculations using the National Pupil Database. Sample size = 384,303.
We next turn to the A‐Level subjects chosen by pupils, with Figure 1.10 showing the proportion of Year 13 students taking the most popular A‐Level subjects, grouped by broad study area. Maths is clearly the most popular A‐Level choice, with over 16% of pupils taking it in 2009–10. Amongst English‐related A Levels, the most popular is English Literature, taken by 11% of pupils (despite being offered at over 80% of schools and colleges). Among the natural sciences, there is quite wide variation from the most popular, Biology (13%), to the least popular, Physics (7%). Psychology is also relatively popular, with 13% of pupils taking this A Level in 2009–10. History and General Studies are popular A‐Level choices too, being taken by around 11% of pupils. Modern foreign languages, in contrast, do not appear to be popular choices at A Level, being taken by less than 6% of all Year 13 students.
20
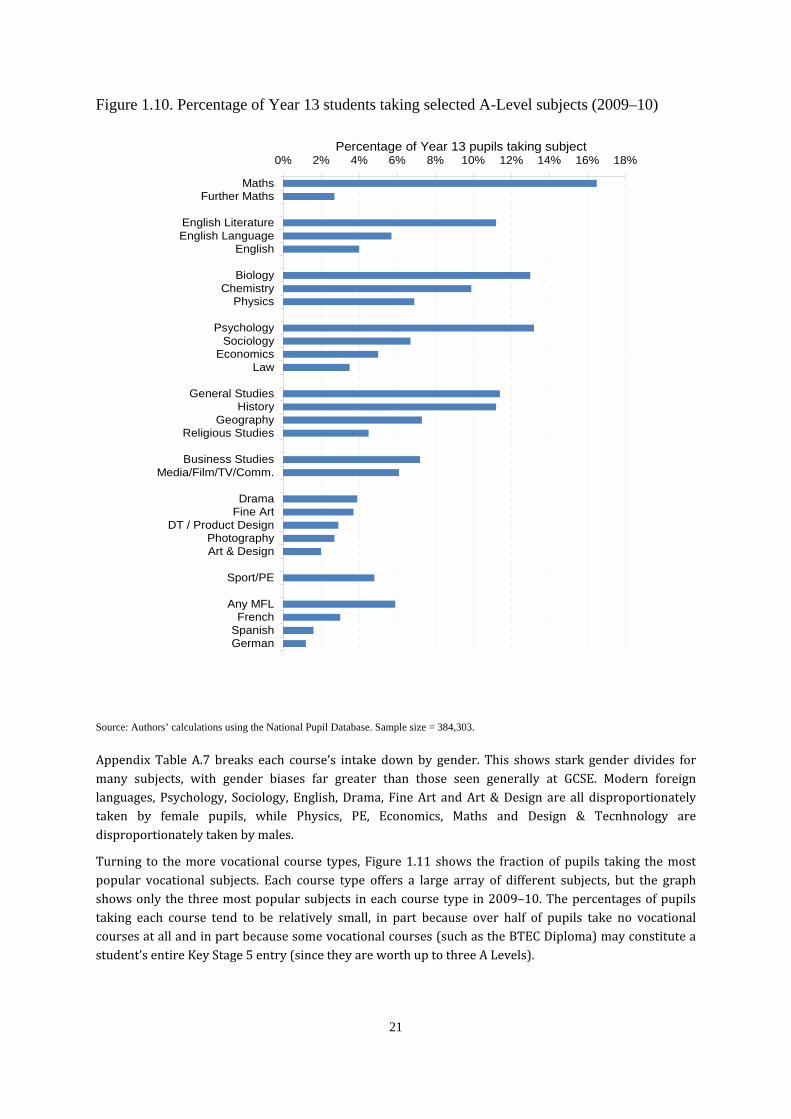
Figure 1.10. Percentage of Year 13 students taking selected A-Level subjects (2009–10)
0% 2% 4% 6% 8% 10% 12% 14% 16% 18%
MathsFurther Maths
English LiteratureEnglish Language
English
BiologyChemistry
Physics
PsychologySociology
EconomicsLaw
General StudiesHistory
GeographyReligious Studies
Business StudiesMedia/Film/TV/Comm.
DramaFine Art
DT / Product DesignPhotographyArt & Design
Sport/PE
Any MFLFrench
SpanishGerman
Percentage of Year 13 pupils taking subject
Source: Authors’ calculations using the National Pupil Database. Sample size = 384,303.
Appendix Table A.7 breaks each course’s intake down by gender. This shows stark gender divides for many subjects, with gender biases far greater than those seen generally at GCSE. Modern foreign languages, Psychology, Sociology, English, Drama, Fine Art and Art & Design are all disproportionately taken by female pupils, while Physics, PE, Economics, Maths and Design & Tecnhnology are disproportionately taken by males.
Turning to the more vocational course types, Figure 1.11 shows the fraction of pupils taking the most popular vocational subjects. Each course type offers a large array of different subjects, but the graph shows only the three most popular subjects in each course type in 2009–10. The percentages of pupils taking each course tend to be relatively small, in part because over half of pupils take no vocational courses at all and in part because some vocational courses (such as the BTEC Diploma) may constitute a student’s entire Key Stage 5 entry (since they are worth up to three A Levels).
21
22
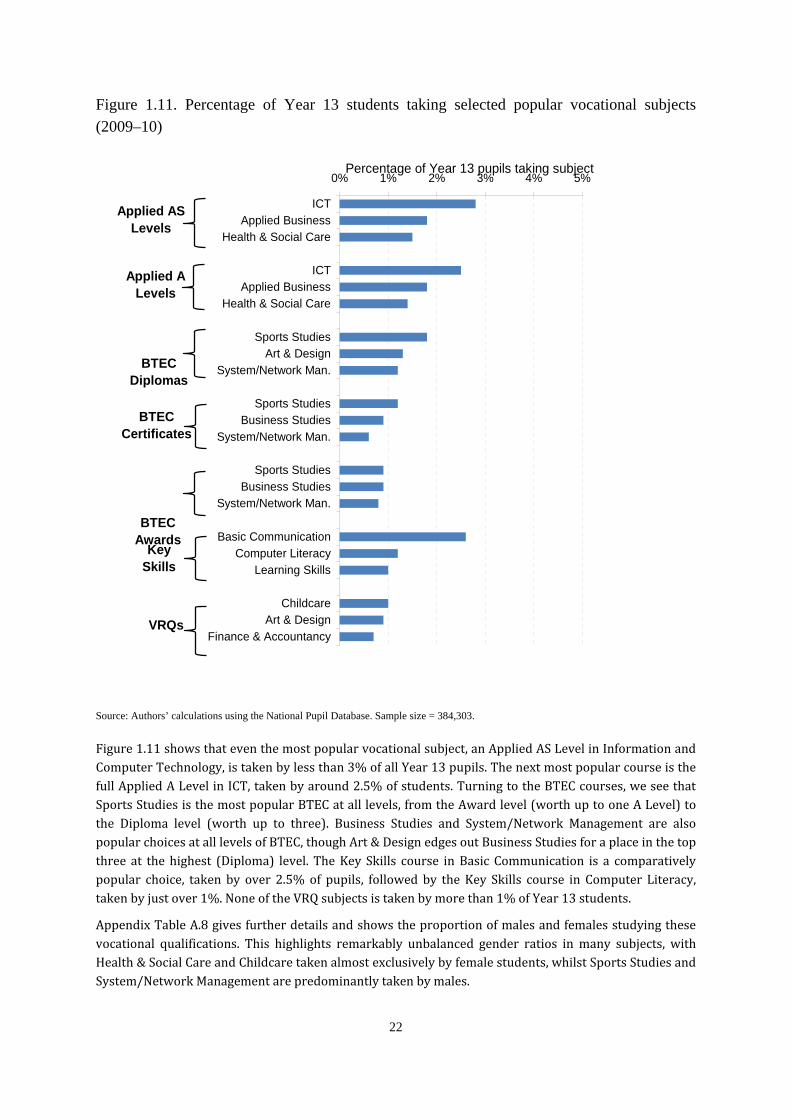
Figure 1.11. Percentage of Year 13 students taking selected popular vocational subjects (2009–10)
0% 1% 2% 3% 4% 5%
ICTApplied Business
Health & Social Care
ICTApplied Business
Health & Social Care
Sports StudiesArt & Design
System/Network Man.
Sports StudiesBusiness Studies
System/Network Man.
Sports StudiesBusiness Studies
System/Network Man.
Basic CommunicationComputer Literacy
Learning Skills
ChildcareArt & Design
Finance & Accountancy
Percentage of Year 13 pupils taking subject
Applied AS Levels
Applied A Levels
BTEC Diplomas
BTEC Certificates
BTEC Awards
Key Skills
VRQs
Source: Authors’ calculations using the National Pupil Database. Sample size = 384,303.
Figure 1.11 shows that even the most popular vocational subject, an Applied AS Level in Information and Computer Technology, is taken by less than 3% of all Year 13 pupils. The next most popular course is the full Applied A Level in ICT, taken by around 2.5% of students. Turning to the BTEC courses, we see that Sports Studies is the most popular BTEC at all levels, from the Award level (worth up to one A Level) to the Diploma level (worth up to three). Business Studies and System/Network Management are also popular choices at all levels of BTEC, though Art & Design edges out Business Studies for a place in the top three at the highest (Diploma) level. The Key Skills course in Basic Communication is a comparatively popular choice, taken by over 2.5% of pupils, followed by the Key Skills course in Computer Literacy, taken by just over 1%. None of the VRQ subjects is taken by more than 1% of Year 13 students.
Appendix Table A.8 gives further details and shows the proportion of males and females studying these vocational qualifications. This highlights remarkably unbalanced gender ratios in many subjects, with Health & Social Care and Childcare taken almost exclusively by female students, whilst Sports Studies and System/Network Management are predominantly taken by males.
23
1.3 Summary
In this chapter, we have attempted to make clear the broad array of courses on offer to young people at Key Stage 4 and Key Stage 5, and to describe the choices currently made by England’s students. In 2009–10, GCSEs were still the most commonly‐taken qualification at Key Stage 4, which is unsurprising given the national requirements to take GCSEs in Maths and English. Fewer than half of Key Stage 4 pupils take GCSEs in modern foreign languages, about a third take GCSE History and about a quarter take GCSE Geography. However, these are much more likely to be taken by pupils from less deprived backgrounds. Girls are more likely to study modern foreign languages but less likely to study all three sciences separately.
The most commonly‐taken vocational courses are VRQs and BTECs, with the most frequently‐taken subjects being Computer Literacy, Sports Studies/Leadership, Preparation for Work and Applied Science. Basic Skills exams are taken by about one‐fifth of pupils. There is also quite a substantial gender divide in some subjects, with Health Studies/Science, Speech & Drama and Art & Design being more popular amongst girls, and Sports Studies and Business & Finance more popular amongst boys.
At age 16, the first (and most fundamental) choice facing pupils about the future of their education after the age of 16 is whether to stay on in education at all, since (for the next few years at least) it is not compulsory to do so. Well over a third of pupils leave the education system altogether after the age of 16. Those who decide to stay on are able to take an extremely broad range of courses and subjects, though the choice of courses available to any given pupil may be substantially limited depending on the type of institution they choose to attend.
A Levels and AS Levels remain by far the most widely‐taken‐up courses, with a slender majority of students taking no other qualification type at all. However, a substantial minority of students combine their A Levels with more vocational course types, or take exclusively vocational courses. Among A‐Level subjects, Maths is the most popular, taken by over 16% of all students. Other popular subjects include Biology, Psychology, General Studies, English Literature and History, all taken by over 10% of Year 13 students. The gender gaps which began to open at Key Stage 4 yawn ever‐wider at Key Stage 5, with some subjects (e.g. Health & Social Care) taken almost exclusively by female students, while others (e.g. Physics) are overwhelmingly taken by males.
Among the more vocational choices, BTECs are the most popular (being taken by over 20% of students), though the fact that a single BTEC subject can comprise a student’s entire Key Stage 5 entry means that few individual BTEC subjects register among the most popular individual courses. At all levels of achievement, Sports Studies is the most popular BTEC, taken up by around 4% of all pupils. Among Applied AS‐ and A‐Level subjects, courses relating to computer technology are among the most popular (being taken by over 5% of Year 13 students to either AS or A Level).
This chapter has sketched the choice landscape available to young people in England today, and provided some statistics regarding the choices made by the most recent cohorts of pupils. However, our interest in young people’s subject and course choices extends considerably further than these simple descriptive statistics. In the next chapter, we explore the way in which young people make their subject and course choices, focusing on what lessons can be learned from theoretical models proposed by psychologists and behavioural economists. In Chapter 3, we move on to discuss the role that schools can play in young people’s subject and course choices, and look at the incentives schools face to provide different subject and course offers to young people (including pressure to improve their performance in school league tables). In Chapter 4, we then conduct multivariate analysis of the choices made by an earlier cohort of young people for whom we have a rich set of data.
24
decision‐making is itself potential
2. How do young people make subject and course choices? Pupils’ course and subject choices ultimately represent a series of decisions about the sort of life they would like to lead in future, from more proximate concerns such as which teachers will instruct them and which of their peers will be in their class, to more distant concerns such as whether they will pursue higher education, what courses they would like to be open to them and what jobs they have in mind. Some evidence already exists on the inputs into young people’s choices, particularly with regard to the issues they consider and the role played by information, advice and guidance. In the early part of this chapter (Section 2.1), we review such evidence, supplementing this with our own analysis of the Longitudinal Survey of Young People in England (LSYPE). However, little evidence exists on the cognitive process young people go through before reaching a final decision about the courses and subjects they will take.
This cognitive process may take the form of a largely ‘rational’ calculation, in which pupils methodically weigh their options in order to maximise their future well‐being, which would certainly be the starting point for a purely economic model of subject choices (described in Section 2.2). However, in recent years, researchers have identified numerous anomalies in observed human behaviour – predictable, consistent ways in which individuals’ decisions deviate from the predictions of the rational model. Researchers have ascribed these deviations to various biases, cognitive short cuts and ‘rules of thumb’ used by individuals in making their decisions – and have speculated that such biases may lead individuals to make decisions which they later regret. Where these biases are a particular problem in important decisions, these models may suggest various interventions by outside agents (including the ‘nudges’ popularised by Cass Sunstein and Richard Thaler4), in order to help people in their decision‐making. If pupils’ decisions regarding their courses and subjects are affected by such biases and short cuts, then there may be a case for various interventions to help pupils make ‘better’ decisions (i.e. decisions that they will be happier about in future). The precise form of these interventions will depend on which biases are believed to be most problematic.
In Section 2.3, we therefore also consider a wide variety of cognitive biases identified in the literature, and in each case we outline the evidence for its existence and the circumstances in which it has been studied and we reflect on its possible relevance for course and subject choice. Currently, we can do no more than suggest avenues for future research, since few (if any) of these biases can be analysed using existing data sources. Isolating cognitive processes generally requires a carefully‐controlled environment (in order to hold other factors constant), for which existing survey data simply cannot substitute. Finally, in Section 2.4, we consider the extent to which insights from behavioural economics can be applied to school pupils.
2.1 Existing empirical evidence on subject and course choices
A useful starting point for understanding how young people make their choices is the reasons given by young people themselves. We should, however, remain cautious in interpreting such self‐reports as a pure, unbiased insight into the cognitive process through which pupils choose their courses and subjects. The same literature that has uncovered biases in cognition also tells us that individuals’ reporting of their
ly biased. Interviewees may be reluctant to report some aspects of their
4 Thaler and Sunstein, 2008.
decision‐making to an interviewer (an example of reporting bias), or they may simply not be consciously aware of certain factors that skewed their decision‐making process (such as the way in which the choice was framed).
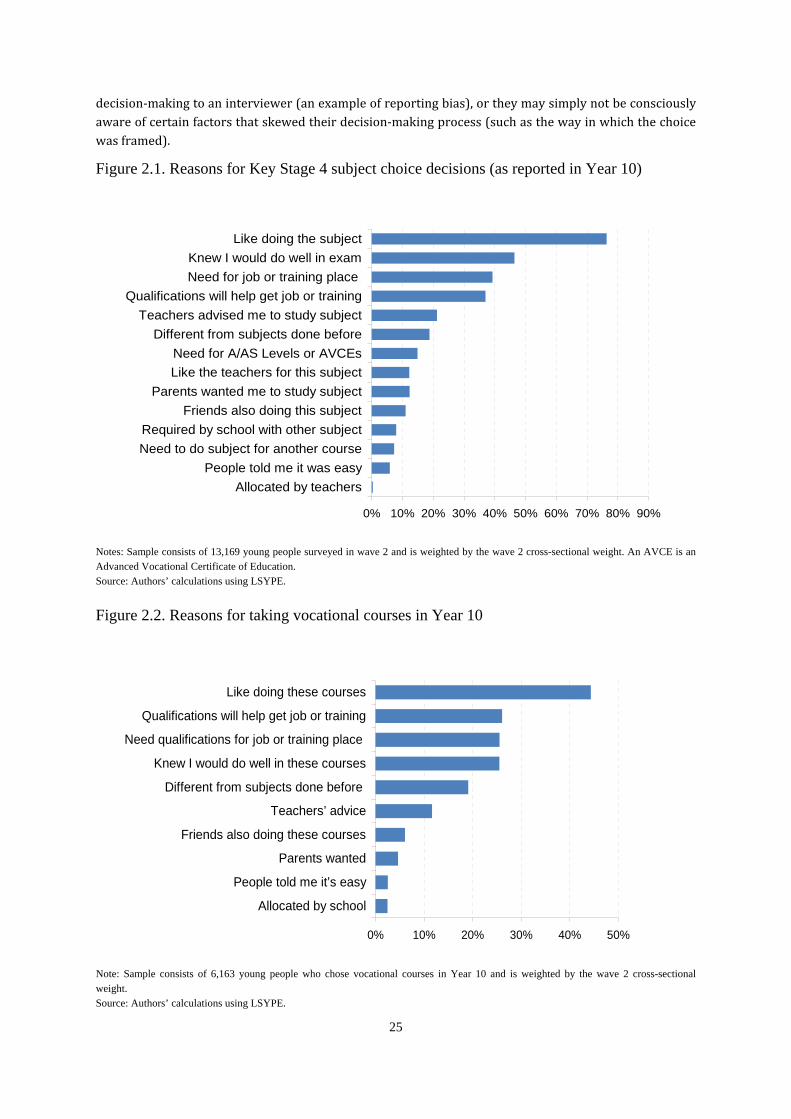
Figure 2.1. Reasons for Key Stage 4 subject choice decisions (as reported in Year 10)
0% 10% 20% 30% 40% 50% 60% 70% 80% 90%
Allocated by teachersPeople told me it was easy
Need to do subject for another courseRequired by school with other subject
Friends also doing this subjectParents wanted me to study subject
Like the teachers for this subjectNeed for A/AS Levels or AVCEs
Different from subjects done beforeTeachers advised me to study subject
Qualifications will help get job or trainingNeed for job or training place Knew I would do well in exam
Like doing the subject
Notes: Sample consists of 13,169 young people surveyed in wave 2 and is weighted by the wave 2 cross-sectional weight. An AVCE is an Advanced Vocational Certificate of Education. Source: Authors’ calculations using LSYPE.
Figure 2.2. Reasons for taking vocational courses in Year 10
0% 10% 20% 30% 40% 50%
Allocated by school
People told me it’s easy
Parents wanted
Friends also doing these courses
Teachers’ advice
Different from subjects done before
Knew I would do well in these courses
Need qualifications for job or training place
Qualifications will help get job or training
Like doing these courses
Note: Sample consists of 6,163 young people who chose vocational courses in Year 10 and is weighted by the wave 2 cross-sectional weight. Source: Authors’ calculations using LSYPE.
25
26
propensity to study Economics relative to science subjects.
Gender differences also play a role in subject choices, with perceived subject appropriateness or gender stereotypes affecting decisions. Ashworth and Evans (2001) found that girls were less likely to study Economics if the teacher was male and more likely to take it if the teacher was female. Blenkinsop et al. (2006) concluded that preconceptions by gender and ability can shape whether pupils opt for an academic or vocational focus. Colley and Comber (2003) also found evidence of gender differences, with girls less likely to prefer practical subjects, though this was less pronounced for younger students than seen in previous studies. Stables and Wikeley (1999) also suggested that gender preconceptions have diminished in recent years. To further demonstrate gender differences in views of particular subjects, Figure 2.4 shows favourite subject in Year 9 separately for males and females. Subjects more likely to be liked by boys are Physical Education, Design & Technology, ICT, Science and, to a lesser extent, Maths. All these subjects seem to be relatively scientific or physical in nature. In comparison, girls are more likely to report Art, Drama or Media Studies, English, modern foreign languages and, to a lesser extent, Music as
Figure 2.1 shows the reasons young people in the LSYPE report for selecting their Key Stage 4 choices (as reported by Year 10 students in 2004–05). The most frequently reported is that they ‘like doing the subject’, with 76% of pupils saying they chose subjects because they liked them. Other frequently‐reported reasons include ‘knowing I would do well in the exam’ and needing qualifications for future job, training or career prospects.
Figure 2.2 shows the reasons pupils report for taking vocational courses at Key Stage 4 (only including those who took a vocational course). Similar to the reasons for choosing optional courses, ‘like doing these courses’ is the most popular reported reason for taking vocational courses as well. Future employment and training, and performance/attainment, are also concerns for pupils taking vocational courses (25% for each).
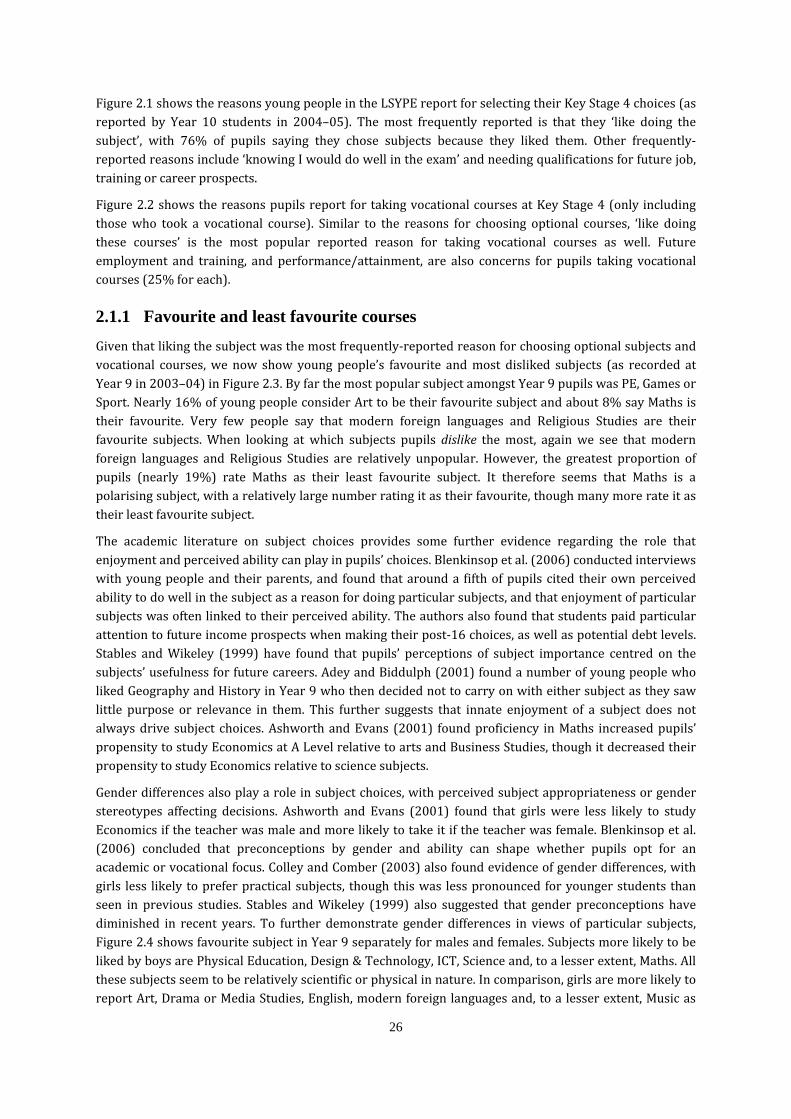
2.1.1 Favourite and least favourite courses
Given that liking the subject was the most frequently‐reported reason for choosing optional subjects and vocational courses, we now show young people’s favourite and most disliked subjects (as recorded at Year 9 in 2003–04) in Figure 2.3. By far the most popular subject amongst Year 9 pupils was PE, Games or Sport. Nearly 16% of young people consider Art to be their favourite subject and about 8% say Maths is their favourite. Very few people say that modern foreign languages and Religious Studies are their favourite subjects. When looking at which subjects pupils dislike the most, again we see that modern foreign languages and Religious Studies are relatively unpopular. However, the greatest proportion of pupils (nearly 19%) rate Maths as their least favourite subject. It therefore seems that Maths is a polarising subject, with a relatively large number rating it as their favourite, though many more rate it as their least favourite subject.
The academic literature on subject choices provides some further evidence regarding the role that enjoyment and perceived ability can play in pupils’ choices. Blenkinsop et al. (2006) conducted interviews with young people and their parents, and found that around a fifth of pupils cited their own perceived ability to do well in the subject as a reason for doing particular subjects, and that enjoyment of particular subjects was often linked to their perceived ability. The authors also found that students paid particular attention to future income prospects when making their post‐16 choices, as well as potential debt levels. Stables and Wikeley (1999) have found that pupils’ perceptions of subject importance centred on the subjects’ usefulness for future careers. Adey and Biddulph (2001) found a number of young people who liked Geography and History in Year 9 who then decided not to carry on with either subject as they saw little purpose or relevance in them. This further suggests that innate enjoyment of a subject does not always drive subject choices. Ashworth and Evans (2001) found proficiency in Maths increased pupils’ propensity to study Economics at A Level relative to arts and Business Studies, though it decreased their
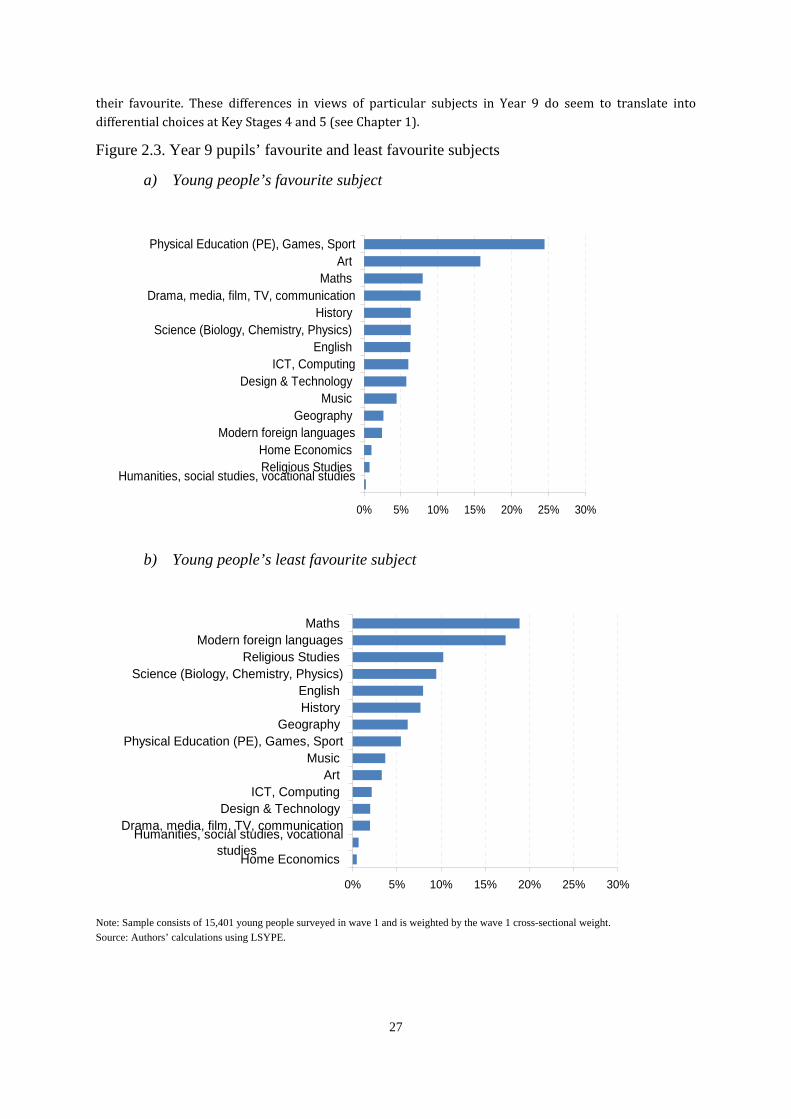
their favourite. These differences in views of particular subjects in Year 9 do seem to translate into differential choices at Key Stages 4 and 5 (see Chapter 1).
Figure 2.3. Year 9 pupils’ favourite and least favourite subjects
a) Young people’s favourite subject
0% 5% 10% 15% 20% 25% 30%
Humanities, social studies, vocational studies Religious Studies Home Economics
Modern foreign languagesGeography
Music Design & Technology
ICT, ComputingEnglish
Science (Biology, Chemistry, Physics) History
Drama, media, film, TV, communicationMaths
Art Physical Education (PE), Games, Sport
b) Young people’s least favourite subject
0% 5% 10% 15% 20% 25% 30%
Home Economics
Humanities, social studies, vocationalstudies
Drama, media, film, TV, communicationDesign & Technology
ICT, Computing Art
Music Physical Education (PE), Games, Sport
Geography History English
Science (Biology, Chemistry, Physics)Religious Studies
Modern foreign languagesMaths
Note: Sample consists of 15,401 young people surveyed in wave 1 and is weighted by the wave 1 cross-sectional weight. Source: Authors’ calculations using LSYPE.
27
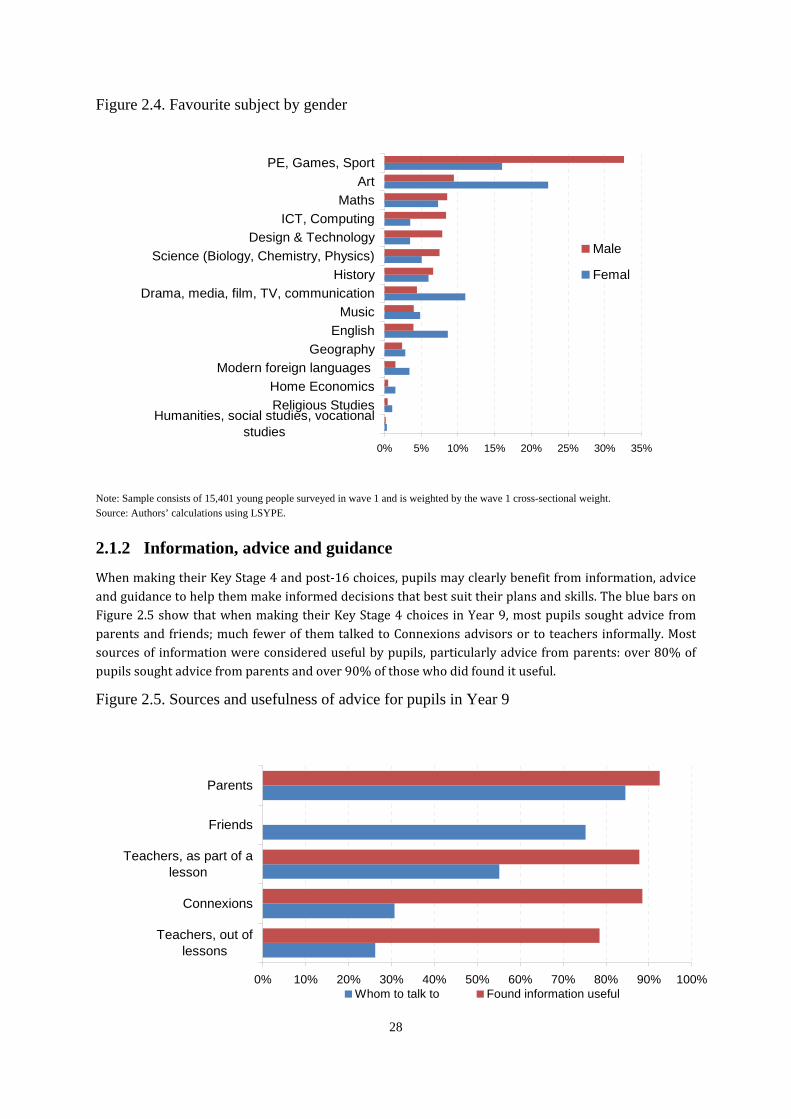
Figure 2.4. Favourite subject by gender
0% 5% 10% 15% 20% 25% 30% 35%
Humanities, social studies, vocationalstudies
Religious StudiesHome Economics
Modern foreign languages Geography
EnglishMusic
Drama, media, film, TV, communicationHistory
Science (Biology, Chemistry, Physics)Design & Technology
ICT, ComputingMaths
ArtPE, Games, Sport
Male
Femal
Note: Sample consists of 15,401 young people surveyed in wave 1 and is weighted by the wave 1 cross-sectional weight. Source: Authors’ calculations using LSYPE.
2.1.2 Information, advice and guidance
When making their Key Stage 4 and post‐16 choices, pupils may clearly benefit from information, advice and guidance to help them make informed decisions that best suit their plans and skills. The blue bars on Figure 2.5 show that when making their Key Stage 4 choices in Year 9, most pupils sought advice from parents and friends; much fewer of them talked to Connexions advisors or to teachers informally. Most sources of information were considered useful by pupils, particularly advice from parents: over 80% of pupils sought advice from parents and over 90% of those who did found it useful.
Figure 2.5. Sources and usefulness of advice for pupils in Year 9
0% 10% 20% 30% 40% 50% 60% 70% 80% 90% 100%
Teachers, out oflessons
Connexions
Teachers, as part of alesson
Friends
Parents
Whom to talk to Found information useful
28
29
Having looked at the current choice landscape for England’s pupils and investigated their reported
Notes: The blue bars include those who talk to the sources ‘a little’, ‘quite a lot’ and ‘a lot’, as opposed to ‘not very often’ and ‘not at all’. Those who answered ‘don’t know’ were excluded from the base for each question. The unweighted sample size thus varies across each category. Those who did not seek advice from a source at all were not asked about the usefulness of that source. The survey did not ask respondents to rate advice from friends. Source: Authors’ calculations using LSYPE.
A large amount of research has examined the current quality of careers advice and guidance. This includes both careers advice within schools and the Connexions service, which aims to provide direct information and advice to young people. Morris et al. (2001) reviewed the then arrangements for careers advice within schools, concluding that practices and quality were highly variable. In a report for the National Audit Office, Morris (2004) then found that the range and quality of careers advice were still highly variable even after the introduction of the Connexions service. However, it should be said that satisfaction ratings have been found to be relatively high amongst Connexions users (Moon et al., 2004). This is also evident in Figure 2.5: not many pupils talk to Connexions advisors, but those who do tend to find it useful.
The variable quality of careers advice and guidance should be a concern for policymakers. Blenkinsop et al. (2006) reported a link between good‐quality advice and the way pupils approached subject and course choices, concluding that there ‘appeared to be an association between schools in which ... effective careers education and guidance provision was in place and the schools in which young people seemed to be
n they received’. thinking through their choices more rationally, weighing up all of the informatio
In order to go into higher education, one must meet the entry requirements for individual courses at different institutions. Specific entry requirements are published each year in the UCAS guide to higher education courses. What is not published is how universities rate the full set of Key Stage 4 and post‐16 qualifications that pupils can take. Recently, the Russell Group (the 20 leading research universities) produced advice for young people on how this group of universities view different sorts of qualifications, and what qualifications and subjects they expect pupils to be studying (Russell Group, 2011). For instance, this states that ‘It is extremely important that you are aware that for several university courses, [Applied A Levels, BTEC Nationals and OCR Nationals] are not considered to be suitable’. It also states that ‘If you plan to take more than one perceived “soft” subject, some caution may be needed’, and it defines ‘soft’ subjects as those with a practical or vocational bias such as Art & Design, Media Studies, Photography and Business Studies. Clearly, this advice is only directly relevant for those pupils aspiring to attend a Russell Group university. However, it does serve to illustrate that when choosing subjects and courses, pupils must be aware not only of explicit university entry requirements but also of unstated ones.
There is comparatively less information on how peers may influence subject and career choices. We know from Figure 2.5 that 75% of Year 9 pupils report consulting their friends. However, the way peers influence choices may well be more nuanced, such as through the establishment of social norms or because pupils want to do what their friends are doing. Blenkinsop et al. (2006) concluded that what pupils’ friends are doing matters more to choices at age 14 than at age 16. They also concluded that pupils relied less on friends and family when subject information and guidance provided by schools were better. In a study of course choices made by college students in the US, Owen and Jensen (2008) found that students with more experience of particular subject areas relied less on peer advice. Pupils may thus rely on peers when information provided by schools is poor or where they lack experience.
2.2 Models of decision-making: standard ‘rational’ model
30
choices based on this information
reasons for making their choices, we now move on to a more speculative endeavour – an attempt to consider the cognitive mechanisms through which pupils decide on their courses and subjects. Whilst it is interesting to observe the choices young people make in today’s school system and analyse survey information about their experience of the system, our deeper scientific interest lies in understanding how young people make their decisions.
Pupils’ course and subject choices ultimately represent a series of decisions about the sort of life they would like to lead in future, from more proximate concerns such as which teachers will instruct them and which of their peers will be in their class, to more distant concerns such as whether or not they will pursue higher education, what courses they would like open to them and what jobs they have in mind. In the jargon of decision theory, course choices are unavoidably ‘intertemporal choices’ – decisions involving costs and benefits occurring at different times – in which each pupil’s decision today has
consequences for their future well‐being and for the options available to them in future years.
For decades, economists have analysed such decisions using a radically‐simplified model of decision‐making, known as the ‘discounted utility’ model, first proposed by Paul Samuelson in 1937. In this model, perfectly informed and perfectly rational agents evaluate all the options available to them and choose the one that will maximise their future well‐being.5 The model is couched in the language of mathematics, but is reasonably straightforward to explain intuitively – though Samuelson’s original formulation relates to the consumption of goods rather than educational investments.
In the model, an individual decides how much to consume over a number of periods of time. Rather than simply deciding how much to consume right now and ignoring the future, the individual decides how much to consume today and in all future periods (creating a ‘consumption profile’ for the future). The individual knows exactly how much satisfaction they will get from a given level of consumption at any one moment (their ‘instantaneous utility’), and this is assumed to be the same in all periods – the individual’s tastes never change.
Individuals may, however, prefer consumption in the present (and in the near future) to consumption in the distant future. In mathematical terms, the individual may attach greater weight to their utility in the present and less weight to their utility in the distant future. In Samuelson’s original formulation, the weight attached to the present is known as the ‘discount rate’, which specifies the rate at which the individual ‘discounts’ utility in future periods. An individual with a high discount rate places a greater weight on the present (they discount the future more heavily), meaning that their consumption profile will be more ‘front‐loaded’ than that of an individual with a low discount rate. In this basic model, individuals are also assumed to have perfect information and foresight. The only factors that can influence their choices are therefore the set of options available to them, their tastes and preferences, and how much they value their well‐being in the present relative to the future.
It is worth emphasising that Samuelson did not claim that this model was a truly accurate representation of individuals’ decision‐making. Indeed, he was at considerable pains to emphasise its limitations, noting that ‘it is extremely doubtful whether we can learn much [about savings behaviour] from considering such an economic man, whose tastes remain unchanged, who seeks to maximise some functional of consumption alone, in a perfect world, where all things are certain and synchronised’ (Samuelson, 1937). However, despite such misgivings, the sheer elegance and tractability of the model saw it rapidly adopted as a central component of subsequent analysis of economic decisions.
Applied to subject and course choices, this model would postulate perfectly‐informed young people, with perfect information about the implications of all the potential choices available to them, making rational
to maximise their future well‐being. Given the sheer number of options
5 Or, more correctly, the choice that maximises the ‘present value’ of their future well-being.
31
While the rational model has long been the foundation of theories of economic decision‐making, recent decades have seen an increasing emphasis on departures from standard rationality. Researchers have begun to delineate numerous predictable, replicable ways in which human decision‐making deviates from the predictions of perfect rationality (known as ‘behavioural regularities’). In this section, we examine a range of such behavioural regularities, attempt to briefly summarise the evidence for their existence, assess their possible relevance to subject and course choices, and provide some speculation regarding possible policy responses, should such biases prove to be a serious problem for students in making their decisions. Table 2.1 provides a concise summary of the biases considered in this chapter, while the
available to young people and the large degree of uncertainty regarding how employers will value a r ldifferent qualifications in the future, the model is clearly (at best) adica simplification of reality.
This model of decision‐making has been adapted over time. Rather than choosing among definite outcomes (which can be known in advance), these more complex models examine individuals’ behaviour when they have to ‘gamble’ – choosing among various risky options which will yield different pay‐offs depending on whether events turn out in their favour (a higher pay‐off) or against them (a lower one).
Under such circumstances, an individual’s choices will depend in large part on their attitude to risk (their degree of ‘risk aversion’). Individuals make their choices in a similar manner to the ‘economic man’ of Samuelson’s original theory, this time calculating the pay‐offs in all possible states of the world, weighted according to the probability that each outcome will occur. Individuals then choose the course of action that maximises their expected utility, taking into account their attitude to risk.
This seems a substantially more realistic model for considering how young people make subject and course choices, as there is now some uncertainty as to the effects of their choices in the future. In both these simple models, however, individuals make the best possible decisions for themselves, with no need for any outside interference. Agents such as governments may change the choices that are available or feasible for people (e.g. through legislation or taxation), but for a given choice environment, individuals will always act in a manner that maximises their (expected) future.
When it comes to education choices, however, the issue may not be so much one of risk (choosing among known probabilities) as one of uncertainty and lack of information – choosing among options whose possible pay‐offs are either unknown or unknowable to students. For example, if students are simply unaware that certain courses offer strong benefits in the labour market – and if the costs of acquiring such information are high (reading the economic literature regarding the returns to different qualifications would seem a tall order for even the most gifted of 10‐year‐olds) – then there may be a role for outside agents, such as schools or government, to play in helping students to make their choices. By communicating information to pupils in a simple (readily‐comprehensible) manner, a government may lower the cost of acquiring information and so help pupils to make better decisions even under the assumptions of the purely rational models considered above. As detailed in the previous section, the current quality of information, advice and guidance is variable according to the latest empirical evidence, suggesting that such information could clearly be improved upon. Beyond providing information, however, the rational model suggests little role for outside intervention in pupils’ course decisions.
The only other possible justification for outside intervention would be the existence of large spill‐over benefits to society from individuals taking particular subjects, over and above the private benefits to individuals. However, the question of which subjects offer the greatest external benefits to society is clearly subject to debate: do scientific subjects offer greater spill‐overs than creative or artistic subjects?
2.3 Models of decision-making: departures from standard rationality

32
subsections that follow consider each of these concepts in more detail. Section 2.3.1 considers biases related to the time dimension and uncertainties in decision‐making, while Section 2.3.2 considers behavioural regularities where people are susceptible to the framing of options and the context of decision‐making.
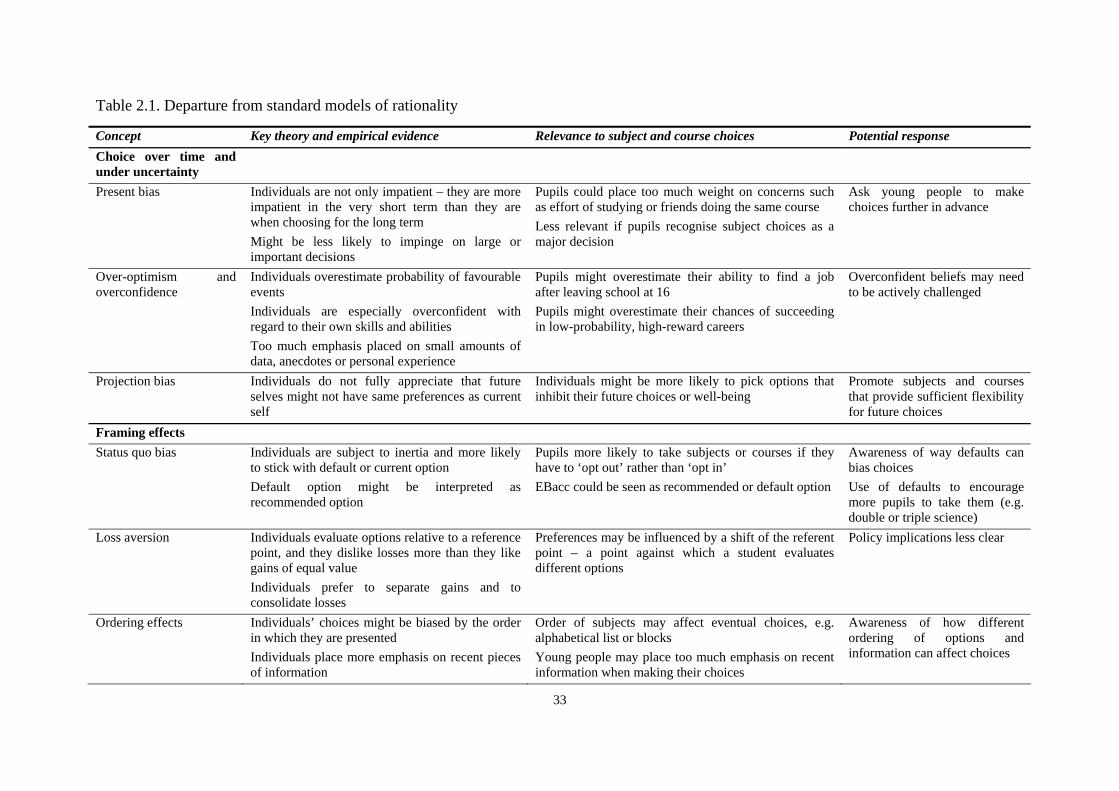
Table 2.1. Departure from standard models of rationality
Concept Key theory and empirical evidence Relevance to subject and course choices Potential response Choice over time and under uncertainty
Present bias Individuals are not only impatient – they are more impatient in the very short term than they are when choosing for the long term Might be less likely to impinge on large or important decisions
Pupils could place too much weight on concerns such as effort of studying or friends doing the same course Less relevant if pupils recognise subject choices as a major decision
Ask young people to make choices further in advance
Over-optimism and overconfidence
Individuals overestimate probability of favourable events Individuals are especially overconfident with regard to their own skills and abilities Too much emphasis placed on small amounts of data, anecdotes or personal experience
Pupils might overestimate their ability to find a job after leaving school at 16 Pupils might overestimate their chances of succeeding in low-probability, high-reward careers
Overconfident beliefs may need to be actively challenged
Projection bias Individuals do not fully appreciate that future selves might not have same preferences as current self
Individuals might be more likely to pick options that inhibit their future choices or well-being
Promote subjects and courses that provide sufficient flexibility for future choices
Framing effects Status quo bias Individuals are subject to inertia and more likely
to stick with default or current option Default option might be interpreted as recommended option
Pupils more likely to take subjects or courses if they have to ‘opt out’ rather than ‘opt in’ EBacc could be seen as recommended or default option
Awareness of way defaults can bias choices Use of defaults to encourage more pupils to take them (e.g. double or triple science)
Loss aversion Individuals evaluate options relative to a reference point, and they dislike losses more than they like gains of equal value Individuals prefer to separate gains and to consolidate losses
Preferences may be influenced by a shift of the referent point – a point against which a student evaluates different options
Policy implications less clear
Ordering effects Individuals’ choices might be biased by the order in which they are presented Individuals place more emphasis on recent pieces of information
Order of subjects may affect eventual choices, e.g. alphabetical list or blocks Young people may place too much emphasis on recent information when making their choices
Awareness of how different ordering of options and information can affect choices
33
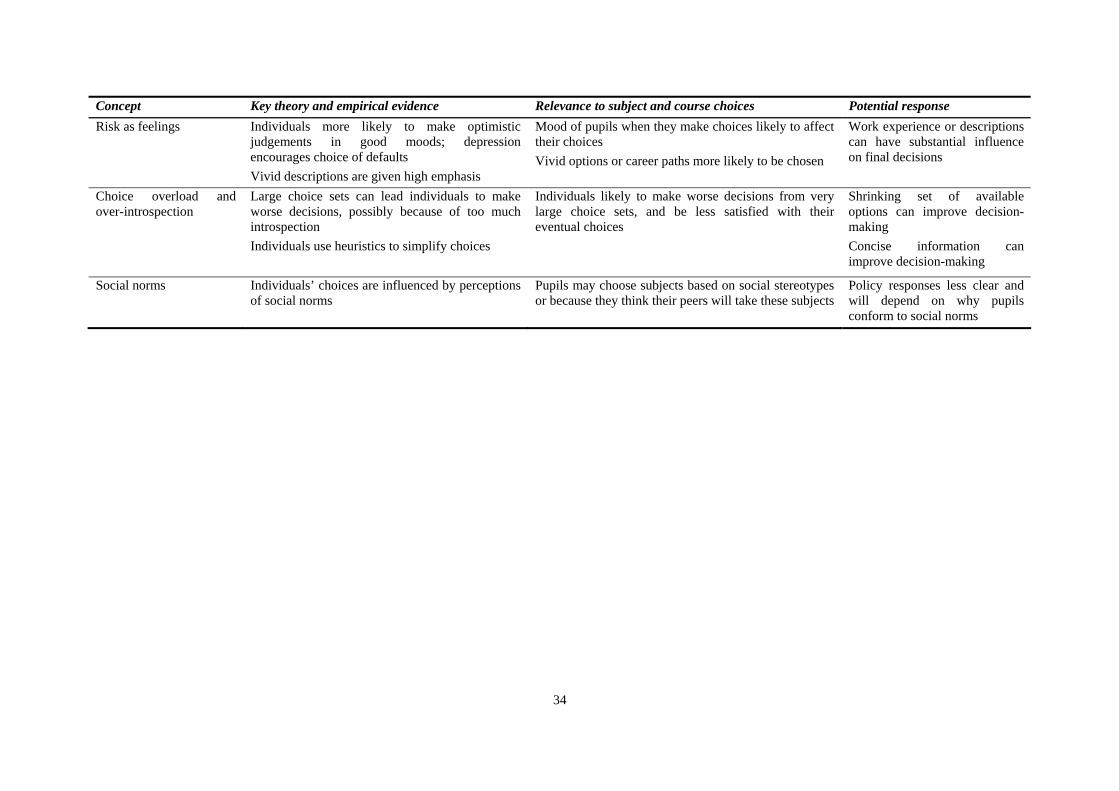
34
Concept Key theory and empirical evidence Relevance to subject and course choices Potential response Risk as feelings Individuals more likely to make optimistic
judgements in good moods; depression encourages choice of defaults Vivid descriptions are given high emphasis
Mood of pupils when they make choices likely to affect their choices Vivid options or career paths more likely to be chosen
Work experience or descriptions can have substantial influence on final decisions
Choice overload and over-introspection
Large choice sets can lead individuals to make worse decisions, possibly because of too much introspection Individuals use heuristics to simplify choices
Individuals likely to make worse decisions from very large choice sets, and be less satisfied with their eventual choices
Shrinking set of available options can improve decision-making Concise information can improve decision-making
Social norms Individuals’ choices are influenced by perceptions of social norms
Pupils may choose subjects based on social stereotypes or because they think their peers will take these subjects
Policy responses less clear and will depend on why pupils conform to social norms
35
There is a large amount of quan
Throughout this discussion, it is important to remember that evidence for these insights overwhelmingly comes from experiments in laboratory settings, usually conducted on adults rather than school‐age individuals. Results derived from adults may not be a reliable guide to the decision‐making of young people. Evidence from the laboratory does not necessarily translate into other contexts, such as subject choices, either. Nonetheless, it is still informative to consider the implications that behavioural regularities might have for young people’s subject and course choices. Where appropriate, we also make specific suggestions for how experimental evidence could be produced. In Section 2.4, we then further reflect on applying insights from behavioural economics to school pupils.
2.3.1 Choices over time and under uncertainty
Present bias We have already seen, in Section 2.1, that individuals must weigh up short‐run costs and benefits (e.g. study effort or enjoyment of different courses) as well as longer‐run factors (e.g. career prospects). In order to understand educational decisions, it is therefore important to understand the way in which individuals process decisions with long‐term consequences. In Section 2.2, we outlined simple economic models of choices over time, but psychologists and economists have long observed situations in which individuals act in a manner very different from that predicted by this model.
The standard ‘discounted utility’ model allows for the possibility that individuals have some degree of impatience, giving less weight to their well‐being in the distant future than they do to their well‐being in the present. However, the model requires that individuals do this in a constant and consistent manner over time – that is, their degree of impatience does not change over time. If offered the choice between $100 today and $110 tomorrow, the rational individual will make the same decision as if they are offered $100 in 30 days or $110 in 31 days. Their discount rate is a single, fixed constant.
In reality, however, individuals appear to treat the present as a ‘special case’, displaying substantially more impatience when making decisions that involve consequences for the here and now than when thinking about the same options further in the future. To continue the example given above, experiments have found that many people simultaneously prefer receiving $100 today over $110 tomorrow, and $110 in 31 days over $100 in 30 days.6 Therefore, there are individuals who, if asked the same question again in 30 days, will choose an option ($100 immediately) that they originally considered inferior. Such behaviour is ruled out by standard models of individual rationality, which assume that individuals will display a similar degree of impatience over time. Present bias predicts that the measure of impatience should be larger in shorter time horizons, which has been confirmed by many studies.7
Many people have experiences of present‐biased preferences in real‐life situations. For instance, individuals sign up for gym memberships at the time of New Year resolutions, believing that they will prefer exercise to watching TV at home in the coming year, but then they do not visit the gym as frequently as they expected. DellaVigna and Malmendier (2006), studying data from US health clubs, found that those on a monthly contract (with a lump‐sum fee and no limit on visits) paid, on average, significantly more per visit than the pay‐per‐visit fee offered by the clubs (i.e. it would have been
y cheasignificantl per to have chosen to ‘pay as you go’).
titative evidence on present‐biased preferences in the literature. For
6 Such preference reversals have been found in Solnick et al. (1980), Millar and Navarick (1984), Green et al. (1994) and Kirby and Herrnstein (1995). 7 Typically, an experiment asks subjects hypothetical questions such as what level of reward in X days or years would make them equally happy compared with $100 received today. Experimenters then compute an implied measure of impatience (a discount rate). For example, indifference between $100 today and $105 one year later implies an annual discount rate of 5%. The average subject in Thaler (1981) is indifferent between $15 now and $20 in one month’s time, $50 in one year’s time and $100 in ten years’ time. This implies annual discount rates of 345%, 120% and 19%, respectively, over the horizons of one month, one year and ten years.
36
When making their subject and co
example, Frederick et al. (2002) surveyed many different experiments that have replicated the higher level of impatience for immediate choices. Their findings suggest that people are particularly impatient and irrational about the short term (e.g. within a year), but that they weigh consequences in the longer‐term future more consistently (or ‘rationally’).8 Intuitively, the difference between 12 years from now and 13 years from now seems similar to the difference between 13 years from now and 14 years from now, but the difference between today and one year from now seems greater.
While most existing evidence on present bias is based on experiments on adults, Whelan and McHugh (2009)’s findings suggest that present bias is just as relevant to adolescents. In their experiment, adolescents, adults and older adults were asked about their preference between a large reward at a specified time in the future and a smaller immediate monetary reward. They found present bias in all three groups.
Present bias applied to subject and course choices would imply that some young people give too much weight to factors relating to the immediate present, e.g. effort of studying, teacher personality or taking similar subjects to friends. They will behave more myopically if the courses are set to start very soon and the prospect of difficult coursework looms. Crucially, present bias means that young people may make choices that could be harmful to their long‐run selves, or at least different from what they would have chosen with a longer time horizon. This could be used as a justification for policy intervention if one felt that the welfare of individuals’ long‐run selves is an appropriate welfare criterion. For a discussion of the
edifficulties of welfare analysis under pres nt bias, see O’Donoghue and Rabin (1999).
The commonly‐recommended response to present bias is commitment, i.e. making a decision well in advance and sticking to it. In the context of subject and course choices, a present‐biased person will be more inclined to choose the subjects with long‐term gains if the decision is made well in advance. Therefore, the existence of present bias would provide a rationale for an early decision time. However, such potential benefits from an early decision time would need to be set against potential costs (e.g. an earlier decision time could prevent young people from responding to changes in their preferences or to the knowledge they acquire through spending more time taking different subjects).
Benzion et al. (1989) have found that people become less impatient as the reward (or ‘pay‐off’) becomes larger or more valuable. It is possible, therefore, that individuals are more patient when making important decisions than they are when considering small stakes. This might be particularly true for young people, as Whelan and McHugh (2009) found that adolescents discounted significantly more than adults for a £100 stake but the difference became insignificant when the stake was raised to £1,000. Therefore, present bias will be less of a concern for subject and course choices, if young people consider such choices to be a truly important decision.
Lastly, it should be acknowledged that much of the quantitative evidence comes from questions of hypothetical monetary rewards. Given the huge differences between choosing monetary options and picking subjects, we cannot really establish the existence or importance of present bias in subject choices based on existing evidence. This could be easily corrected for by using carefully‐designed experiments that seek to tease out present bias in particular contexts. For instance, in Section 2.3.2, we will set out an experiment design that can potentially identify the existence of present bias as well as anchoring effects. Given the dynamic features of almost all educational decisions, such experiments could have wider significance to policymakers considering young people’s educational choices.
Over-optimism and overconfidence urse choices, young people must weigh various uncertainties regarding
8 In the jargon of the literature, the authors found that the negative correlation between estimated discount rates and time horizon disappears after excluding studies with time horizons of one year or less.
37
Both overconfidence and over‐op
the future. They must assess, for example, whether specific subjects and courses will give them a good opportunity to study particular courses at university, or whether they are likely to be able to find a job. Insights from behavioural economics suggest that when decision‐making involves such uncertainties, people’s beliefs tend to be biased in systematic ways. In particular, they tend to overestimate the probability of favourable events or weight such events more heavily than other possible outcomes – a bias known simply as ‘over‐optimism’. Over‐optimism is especially prevalent when people believe that the outcomes depend on their own skills, ability or knowledge. They tend to be overconfident about their own ability, as well as the accuracy of their knowledge or information. Such incorrect beliefs can lead to suboptimal decisions. Applied to subject and course choices, over‐optimism and overconfidence may lead young people to make inappropriate decisions and are manifested in lower actual career prospects or an inability in practice to take other qualifications.
A widely‐cited study by Weinstein (1980) found that students thought they would be more likely than average to experience positive events and less likely to experience negative ones. On average, students believed that they were 50% more likely than their peers to like their graduate job and 32% less likely to be fired from a job. It also found that the amount of over‐optimism was positively correlated with the desirability of positive events, the perceived probability of the events and their perceived controllability. This may reflect overconfidence: when it appears that personal positive outcomes may be made more likely by taking certain actions (such as training or studying) and having certain attributes (such as being clever or healthy), people tend to be more over‐optimistic than they are about uncontrollable outcomes. The intuitive explanation, as given in Weinstein (1980), is that people can easily imagine themselves taking actions to achieve the desired outcome (such as training or studying), but tend not to imagine others taking similar actions.9 The same study showed that individuals’ unrealistic optimism could be reduced simply by exposure to a list (made by others) of factors that would improve others’ chances of positive outcomes.
There are numerous empirical contexts where over‐optimism and overconfidence may result in suboptimal decisions. Over‐optimism and overestimation of one’s entrepreneurial ability may be the primary reason for high failure rates and low average returns among new enterprises.10 Psychological research also suggests that men are more overconfident than women in financial decisions. Indeed, this may have led to both higher trading frequencies and lower average returns for male investors than for
atheir female counterparts (Barber and Ode n, 2001).
Over‐optimism and overconfidence also mean that people tend to be systematically biased when collecting and processing information. First of all, they draw too strong inferences from small amounts of data, the so‐called ‘law of small numbers’ as originally documented by Tversky and Kahneman (1971) and further developed by Spiegler (2006) and Rubinstein and Spiegler (2008). They rely far too much on personal experience or friends’ experiences relative to aggregate data in judging risks and returns; and they respond to concrete, narrative information more than general statistical information (Nisbett et al., 1982). Moreover, people tend to exhibit a confirmation bias when searching for information (Nickerson, 1998); they tend to search for information that would support rather than contradict their prior beliefs (Eliaz and Spiegler, 2006); and they tend to interpret information in ways that confirm their priors, and put less weight on unfavourable evidence. Furthermore, the bias is exacerbated when there are objective or subjective limits on the amount of information one can obtain (Jonas et al., 2001).
timism could play a substantial role in young people’s subject and
9 Arguably, it is easier to imagine oneself doing something than to imagine others doing the same thing. See the point on vividness below, under the heading ‘Risk as feelings’. 10 According to a cross-country study by Koellinger et al. (2007), ‘subjective, and often biased, perceptions’ were an important driving factor in starting up new businesses; and this reported level of entrepreneurial confidence was actually negatively correlated with the survival chances of new start-ups across countries.
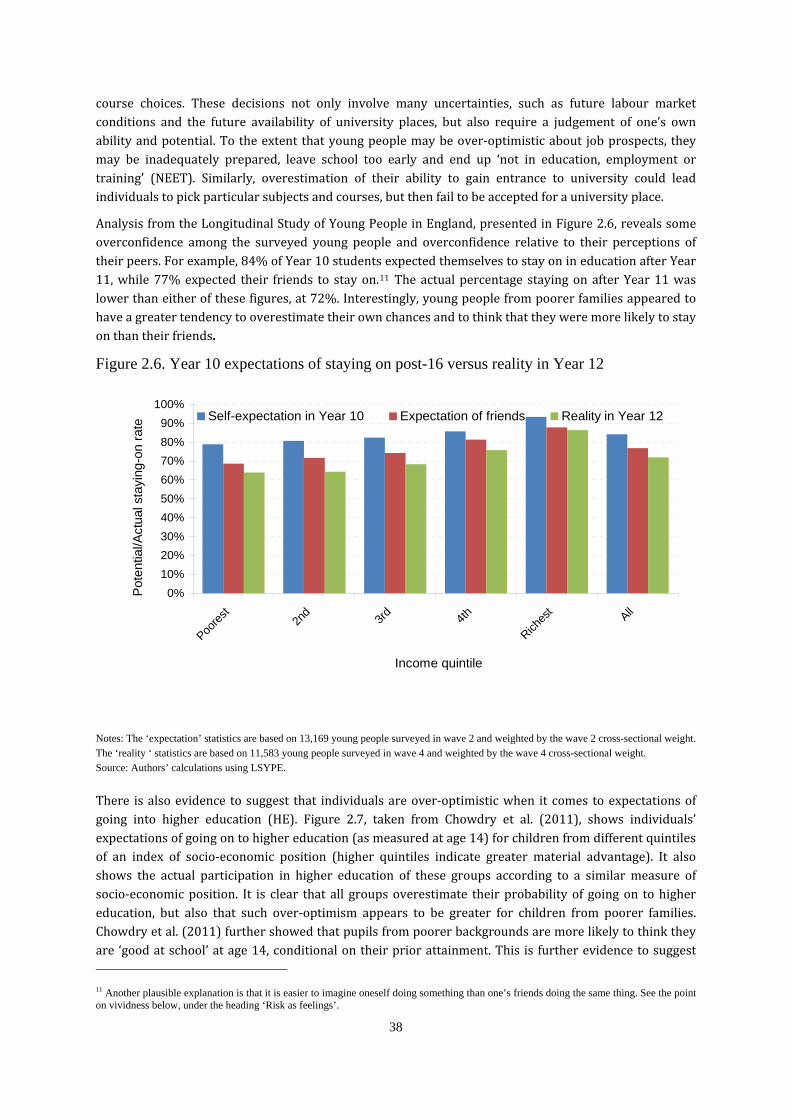
course choices. These decisions not only involve many uncertainties, such as future labour market conditions and the future availability of university places, but also require a judgement of one’s own ability and potential. To the extent that young people may be over‐optimistic about job prospects, they may be inadequately prepared, leave school too early and end up ‘not in education, employment or training’ (NEET). Similarly, overestimation of their ability to gain entrance to university could lead individuals to pick particular subjects and courses, but then fail to be accepted for a university place.
Analysis from the Longitudinal Study of Young People in England, presented in Figure 2.6, reveals some overconfidence among the surveyed young people and overconfidence relative to their perceptions of their peers. For example, 84% of Year 10 students expected themselves to stay on in education after Year 11, while 77% expected their friends to stay on.11 The actual percentage staying on after Year 11 was lower than either of these figures, at 72%. Interestingly, young people from poorer families appeared to have a greater tendency to overestimate their own chances and to think that they were more likely to stay on than their friends.
Figure 2.6. Year 10 expectations of staying on post-16 versus reality in Year 12
0%10%20%30%40%50%60%70%80%90%
100%
Poores
t2n
d 3rd 4th
Riches
t All
Income quintile
Pot
entia
l/Act
ual s
tayi
ng-o
n ra
te
Self-expectation in Year 10 Expectation of friends Reality in Year 12
Notes: The ‘expectation’ statistics are based on 13,169 young people surveyed in wave 2 and weighted by the wave 2 cross-sectional weight. The ‘reality ‘ statistics are based on 11,583 young people surveyed in wave 4 and weighted by the wave 4 cross-sectional weight. Source: Authors’ calculations using LSYPE.
There is also evidence to suggest that individuals are over‐optimistic when it comes to expectations of going into higher education (HE). Figure 2.7, taken from Chowdry et al. (2011), shows individuals’ expectations of going on to higher education (as measured at age 14) for children from different quintiles of an index of socio‐economic position (higher quintiles indicate greater material advantage). It also shows the actual participation in higher education of these groups according to a similar measure of socio‐economic position. It is clear that all groups overestimate their probability of going on to higher education, but also that such over‐optimism appears to be greater for children from poorer families. Chowdry et al. (2011) further showed that pupils from poorer backgrounds are more likely to think they
ditional on their prior attainment. This is further evidence to suggest are ‘good at school’ at age 14, con 11 Another plausible explanation is that it is easier to imagine oneself doing something than one’s friends doing the same thing. See the point on vividness below, under the heading ‘Risk as feelings’.
38
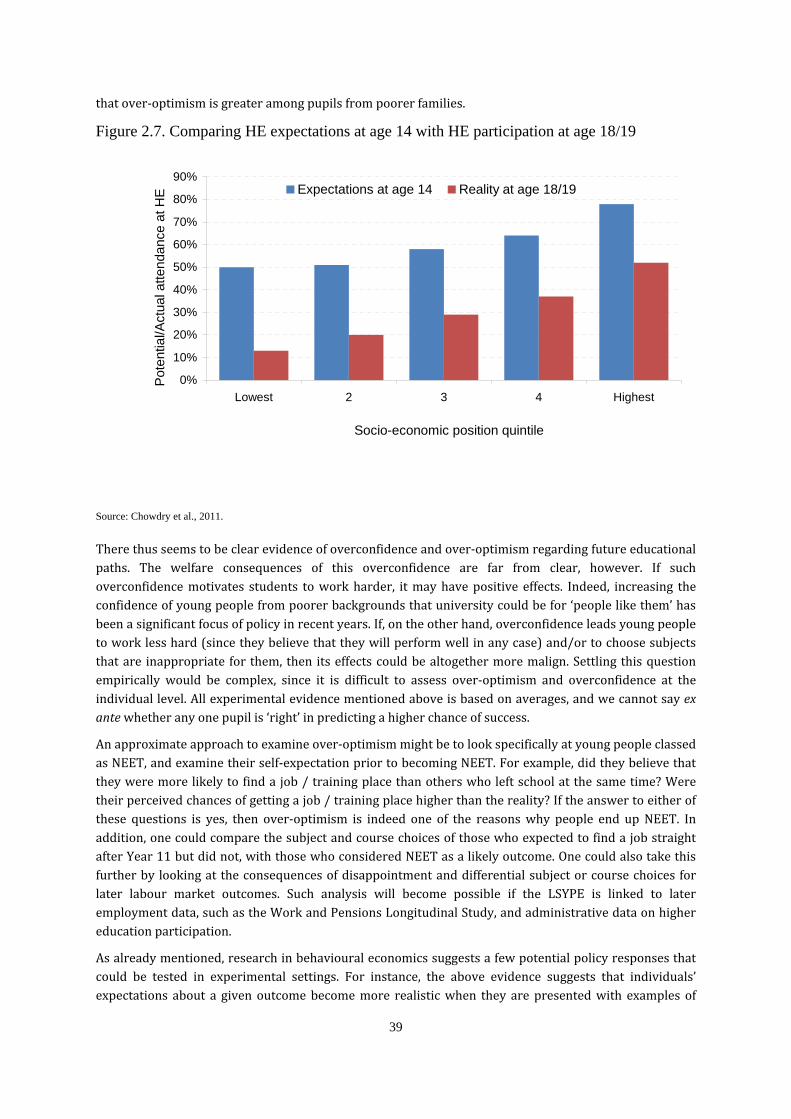
that over‐optimism is greater among pupils from poorer families.
Figure 2.7. Comparing HE expectations at age 14 with HE participation at age 18/19
0%
10%
20%
30%
40%
50%
60%
70%
80%
90%
Lowest 2 3 4 Highest
Socio-economic position quintile
Pote
ntia
l/Act
ual a
ttend
ance
at H
E Expectations at age 14 Reality at age 18/19
Source: Chowdry et al., 2011.
There thus seems to be clear evidence of overconfidence and over‐optimism regarding future educational paths. The welfare consequences of this overconfidence are far from clear, however. If such overconfidence motivates students to work harder, it may have positive effects. Indeed, increasing the confidence of young people from poorer backgrounds that university could be for ‘people like them’ has been a significant focus of policy in recent years. If, on the other hand, overconfidence leads young people to work less hard (since they believe that they will perform well in any case) and/or to choose subjects that are inappropriate for them, then its effects could be altogether more malign. Settling this question empirically would be complex, since it is difficult to assess over‐optimism and overconfidence at the individual level. All experimental evidence mentioned above is based on averages, and we cannot say ex ante whether any one pupil is ‘right’ in predicting a higher chance of success.
An approximate approach to examine over‐optimism might be to look specifically at young people classed as NEET, and examine their self‐expectation prior to becoming NEET. For example, did they believe that they were more likely to find a job / training place than others who left school at the same time? Were their perceived chances of getting a job / training place higher than the reality? If the answer to either of these questions is yes, then over‐optimism is indeed one of the reasons why people end up NEET. In addition, one could compare the subject and course choices of those who expected to find a job straight after Year 11 but did not, with those who considered NEET as a likely outcome. One could also take this further by looking at the consequences of disappointment and differential subject or course choices for later labour market outcomes. Such analysis will become possible if the LSYPE is linked to later employment data, such as the Work and Pensions Longitudinal Study, and administrative data on higher
39
education participation.
As already mentioned, research in behavioural economics suggests a few potential policy responses that could be tested in experimental settings. For instance, the above evidence suggests that individuals’ expectations about a given outcome become more realistic when they are presented with examples of
40
existence of projection bias just re
actions that others could take (such as training or studying) to help them achieve the desired outcome. This could be tested in an experimental setting by enquiring about individuals’ higher education or employment expectations and intended subject choices, under two different treatments: with and without information on example actions they and other individuals can take to achieve these expectations. One could also present some individuals with data on their relative performance in previous exams and see whether this changes their intended subject or course choices.
It should be noted that these potential interventions differ from simply providing more information to young people. The proposed interventions would aim to challenge beliefs, encouraging individuals to reconsider their relative position or what others might do. In general terms, if one believes that young people are subject to overconfidence or over‐optimism, and that this has negative effects on their decision‐making (rather than positive effects on their motivation), then one needs to design interventions that actively challenge such misperceptions. Simply providing more information to young people is unlikely to be productive, however, if individuals are subject to ‘confirmation bias’, whereby students may seek advice from sources likely to confirm their prior beliefs.
Projection bias Projection bias refers to the idea that people systematically underestimate the magnitude of future changes in their preferences (Loewenstein et al., 2003). In the context of subject and course choices, it may imply, for example, that young people fail to recognise that their 18‐year‐old self may have different preferences from their current 14‐year‐old self. They may thus make choices that restrict their ability to make particular choices at later ages.
Projection bias can result from people’s under‐appreciation of the ways in which they will adapt when estimating the impact of some big event on their future happiness. For example, non‐patients predict serious medical conditions would lead to much lower life quality than the level reported by patients who have actually experienced the conditions (Sackett and Torrance, 1978). Projection bias can also result from under‐appreciating the power of visceral influences. That is, people recognise the effects of visceral influences on their preferences, but underestimate the full magnitude of that effect.12
Projection bias is relevant to the question of subject choices because young people do not know how their preferences will change over time, and yet their current choices will affect later outcomes and their later available choices. If young people under‐appreciate their adaptability, then they might avoid difficult and demanding courses even though they would be able to adapt to the situation with little cost were they to
a a e op tstudy the courses. Such courses m y also provide future self with mor tions at later poin s in time.
Policy responses to projection bias are less clear‐cut. Sunstein (2007), considering individuals’ willingness to pay for different goods, argues that ‘it is not clear how or whether public officials should react to the possibility of projection bias. My major point is that people might be willing to pay for goods that will not promote their welfare—and that they might not be willing to pay for goods that will promote their welfare’. When an individual has difficulty predicting how their preferences would change, it is very hard to argue that somebody else such as the government would know better.
As projection bias is more harmful when choices have irreversible consequences, one implication is that people will be better off choosing options that allow reversals or future changes. Of course, this is not a pure ‘nudge’; it would also be welfare‐enhancing for pupils who simply changed their minds. The
inforces the merit of more flexible options. However, there is currently
12 For example, an experiment by Read and van Leeuwen (1998) investigated how people’s current state of appetite affects their perception of their future preferences. The experiment asked subjects about their preferences between unhealthy and healthy snacks to be delivered to them at a designated time one week later. Some were asked in the late afternoon and some just after lunch (when they are supposed to be less hungry). As it turned out, those who were hungry at the time of the advance order were significantly more likely to choose unhealthy snacks than those who were asked just after lunch, conditional on when the snacks would be delivered.
41
systems – the only difference was that individuals had to actively consider the various options.
Overall, evidence suggests that the existence of a default option can bias people’s decisions towards it. This has strong implications for subject and course choices. Most importantly, it would suggest that if individuals had to opt out of certain options (e.g. a given combination of science subjects – whether individual triple sciences or the Core plus Additional science papers), then they may be more likely to take the default option. If the default were a complete set of subjects (i.e. to be studied by those who cannot make up their minds themselves), we might predict that more students will study that particular set of subjects. In general, students must currently make active decisions with regards to subject and course choices, making the phenomenon potentially less relevant. However, the existence of a default bias does suggest that careful thought should be given to the question of what the default option will be for
no evidence to suggest that projection bias affects course and subject choices. At the moment, such bias simply represents another theoretical justification for more flexible options. Any increased flexibility would need to be set against the costs of increased flexibility, such as how appropriate such courses would be for pupils who want to specialise.
2.3.2 Framing and context
Advertisers have long known that the way in which a choice is presented can be just as important as the content of the choice itself. Researchers refer to such anomalies as ‘framing effects’ – individuals may respond to identical choices differently, depending on how the choices are presented. More generally, the circumstances and the context in which thinking or choosing takes place affect the choices made. In this subsection, we review behavioural regularities where framing and context influence how the problem is perceived and, as a result, the choices people make. We focus on five major framing/context effects: status quo bias (also known as reference‐point effects); loss aversion; ordering effects; ‘risk as feelings’; choice overload and introspection; and social norms. We will assess their possible relevance to the subject and course choices made by young people.
Status quo bias
Status quo bias refers to the considerable degree of ‘inertia’ that people exhibit in their decision‐making – tending to stick with the current or default option, rather than actively changing to another readily‐available option.
The most famous example of the power of default options derives from an experiment with employee pension plans (Madrian and Shea, 2001). This study found that the participation rate among new employees significantly increased if they were enrolled in the scheme by default (and had to opt out), rather than excluded from the scheme by default (and required to opt in). Perfectly rational decision‐makers should make the same decision in either treatment, since the choices on offer are identical. In reality, significantly more employees paid into the pension plan if included by default. The default rate of contributions (3%) was also stuck with by a large fraction of employees under the ‘opt‐out’ system. Yet under the original (opt‐in) system, few employees chose contributions of 3% – some opting for contributions significantly above this rate, some choosing rates below it. The default options may therefore have reduced the pension contributions of some employees, compared with what they would have chosen in a simple opt‐in system, even as it increased the contributions of the majority.
There are a number of reasons why the change in the default pension option (from opt‐in to opt‐out) may have changed individuals’ behaviour. First, employees might have interpreted the default as a ‘recommended’ option. Second, it might also be the case that changing from the default is perceived as costly, and thus individuals stick with the default. A follow‐on study responded to these questions by asking all individuals to actively choose how much they wanted to contribute (with zero as a potential option). This variation was able to replicate the increase in pension plan participation, but with less bunching around the default rate. The set of options was almost identical to both the opt‐in and opt‐out
42
such experiments would require m
young people when the education participation age is raised to 18. It also cautions against creating any default subject and course choices that are not appropriate for everyone as, for whatever reason, individuals will become more likely to take any such default option.
Another manifestation of status quo bias is the endowment effect, which refers to the idea that people appreciate/value the same item more if it is currently in their possession. This creates a status quo bias in the sense that owners tend to hold on to their belongings or stick with current options.13 The idea of an endowment effect has clear relevance to young people’s subject and course choices, since it suggests that individuals may be more naturally drawn to subjects and courses they have studied before. It may, for instance, make young people less likely to apply for an apprenticeship or less likely to study subjects at A Level that they have not studied before.
More generally, the default can be thought of as an example of ‘anchoring effects’, with people’s decisions biased towards the anchor. Here, an anchor can refer to any previously‐mentioned piece of information. For example, Ariely et al. (2003) asked people whether they would buy some good for a dollar figure equal to the last two digits of their social security number and then asked their maximum willingness‐to‐pay for the same good. People with higher social security numbers (in the last two digits) reported significantly higher willingness‐to‐pay. Evidence of anchoring effects has also been found by Wansink et al. (1998) and Russo and Schoemaker (1989). Similarly to the pensions contributions experiment, Mussweiler et al. (2000) found that the anchoring effect can be mitigated using what they call a ‘consider‐the‐opposite’ strategy – that is, decision‐makers are explicitly asked to list reasons why a given anchor may be inappropriate or inaccurate. This strategy diminished, but did not eliminate, the anchoring effect.
In addition, the government can create anchor or reference points. For example, the creation of the EBacc may increase the number of students taking the subjects involved, even beyond the attraction of any EBacc certificate and any league table incentive for schools. This is because pupils may interpret the EBacc as a recommended set of options, which might increase the number of pupils taking such subjects. It may also have an anchoring effect – even when the EBacc subjects are not perceived as recommended, the policy‐induced attention and pondering over those subjects might bias students towards them. However, the existence of a default bias strongly cautions schools against presenting the EBacc as a default option for young people. If the EBacc is not the best choice for some pupils, its introduction as a perceived ‘default option’ could damage the welfare of those students who, at the margin, stick with the default instead of choosing courses that better fit their preferences or ability.
Recent survey evidence suggests that more Year 9 pupils planned to take EBacc combinations of subjects in 2011 than were taking them as Year 10 pupils (Clemens, 2011). This might reflect a response by pupils to the creation of the EBacc, consciously or unconsciously. However, it could equally represent a response by schools to the new importance attached to EBacc results in performance tables. It could also reflect an age effect if Year 9 pupils then change their minds by Year 10. Based on existing evidence, it is impossible to separate these competing hypotheses. But it is noteworthy that over half of schools in the survey said that they had changed the courses they offered to pupils as a result of the creation of EBacc, with many no longer offering BTECs.
Existing data and evidence do not allow us to establish how relevant or important the default bias and anchoring effects are for young people’s subject choices. Hence, we set out below an experiment design that seeks to identify three behavioural biases: the default bias, the anchoring effect and the present bias. It gives a simple example of how experiments can be used to identify those biases. The implementation of
uch more detailed planning tailored to students’ circumstances.
13 A well-known experiment regarding endowment effects was carried out with a comparatively mundane item: mugs (Kahneman et al., 1990). The researchers found that the average willingness-to-pay for a mug was $2.25, but that individuals who were randomly allocated a mug would then demand, on average, $5.75 if they were to give up their mugs (well above the average willingness-to-pay).
43
to a prior level). Genesove and M
The experiment can be run on one cohort of students from an individual school. First, students are sorted randomly into three groups: Groups A, B and C. All students would make their final subject decisions at some point in time T, which could be the same deadline that the school normally imposes.
All students in Group A are asked to report their intended subject choices three months before time T. They would be told that the form is just indicative and they will be perfectly free to make different subject choices at time T. At time T, they will make their choices under the usual conditions in the school, which can be ticking options from a comprehensive list, for example.
Students in Group B go through the same process as Group A, except that at time T, Group B will be presented with their own form from before and then they will make their choices under the same conditions as Group A.
Group C is similar to Group B, except that their reported intentions will be their default choices at time T, rather than just a reminder. That is, they can freely choose their subjects at time T subject to the same constraints as all the others; or they can skip the process (of filling in a new form, perhaps) and just stick with their previous plans. Group C should be informed, before filling in the first form, of how their reported intentions will be used as default options.
If the three behavioural biases have significant influence on young people’s subject choices, there will be systematic differences between the choices of these groups. First, reminding Group B of their earlier intentions can serve as an anchor and bias their final decisions towards their earlier intentions. So we would expect to observe a higher degree of similarity between the early and final choices of Group B, than of Group A, if the anchoring effect is important. Similarly, explicitly setting previous intentions as the default may bias choices towards the default. This default bias means the similarity between the early and final choices of Group C will be greater than that similarity for Group A.
Meanwhile, the present bias implies that the intended subject choices at time T–3 will be more forward‐looking than the choices at time T. That is, the earlier choices should be more likely to include ‘hard’ subjects such as triple science, which are known to cost more time and effort in the short term but yield higher returns in the longer term.14 This difference may be observed by comparing the early and final choices of each group. The difference is likely to be the greatest for Group A, because the effect of present bias will be mitigated by the anchoring effect for Group B and by the default bias for Group C.
Loss aversion One of the most famous examples of behavioural regularities is known as ‘loss aversion’, first described by Kahneman and Tversky (1979). The basic idea is that individuals evaluate options as changes around some reference point, and they dislike losses more than they like corresponding gains relative to this reference point. This means that avoiding a loss is more important than making a gain of an equal amount. Therefore, if an outsider can shift an individual’s reference point, or frame the options as forgone gains rather than losses, they could potentially change the eventual option chosen by the decision‐maker.
The concept of loss aversion is a well‐documented phenomenon in experimental settings15 as well as in real‐world settings. Epley et al. (2006) found that people had a higher tendency to spend income that was framed as a gain on top of the current wealth level than to spend income framed as a rebate (i.e. a return
ayer (2001) found that a homeowner whose property had declined in
14 Of course, the choices can also be different for other reasons, such as greater maturity, more knowledge and more information at time T than at time T–3. 15 For example, consider the question of choosing between a sure loss of $10 and a 1% chance of losing $1,000. In the experiment by Hershey and Schoemaker (1980), 56% of subjects chose the sure loss option when the question was phrased this way. The same question can be formulated differently: to pay an insurance premium of $10 or to remain exposed to a hazard of losing $1,000 with a 1% chance. Now, 81% of subjects chose the sure loss option when facing the insurance formulation. The decisions are conceptually identical, yet the difference in framing had a significant influence on the decisions made.
44
separating out the gains, such as t
market value since their purchase would demand a higher sale price than an owner of a similar house who bought it at less than the current market price.
Applying loss aversion to the context of subject choices is not straightforward. In particular, it is difficult to define the relevant dimension over which ‘losses’ and ‘gains’ might be assessed. For the sake of illustration, we give a simple example in which loss aversion can lead to different subject choices when the reference point is changed. Consider two options: double science and triple science. Suppose the individual cares only about the number of good GCSEs he will get in the end. Also assume that if he chooses double science he will get two good GCSEs for sure and if he chooses triple science he will get three with probability p and nothing with probability 1–p (this assumption simplifies the exposition). Suppose the reference point is having zero GCSEs (which is the individual’s status quo), so the question at hand is choosing between a sure gain and an uncertain larger gain. Which the individual will choose depends on his risk attitudes and how he weighs the different possibilities. Now, if the individual reference point is having two GCSEs, then the question is about choosing between nothing for sure and a gamble that involves a gain with probability p and a loss with probability 1–p. If there is strong loss aversion, then the possibility of a loss will be very much disliked and the individual will naturally avoid the gamble. In other words, the individual will be less likely to choose the risky option (triple science) when the reference point is high, compared with when it is low.
While the implication of loss aversion in the above single‐dimension example is clear, it is not clear in a multidimensional world. In practice, subjects differ in so many aspects, including the efforts and time required, enjoyment during the process and the opportunities they offer for future studies, employment etc. So, ideally, the question of subject choices should be conceptualised in a multidimensional space, with the position of the reference point defined according to the same dimensions. In such a multidimensional world, the impact of a shift of the reference point would depend on how the different aspects interact to shape preferences. Unless all those aspects are completely independent of each other,16 we cannot predict how choices will change due to a shift of the reference point.
In addition, young people may have different reference points, which come from their status quo, the default, their self‐expectation, their hope, their friend’s achievement and their family members’ achievement. It is difficult for outsiders to predict where an individual’s reference point is, and even more difficult to predict how it will be shifted by some intervention. Therefore, the policy implication of loss aversion is unclear.
Another related insight from behavioural economics is that individuals tend to be risk‐averse when choosing between gains but risk‐loving when dealing with losses.17 This implies that individuals prefer to separate out multiple gains and to consolidate multiple losses. In other words, individuals prefer lots of small gains to a large gain of equal value. This is because each gain can be evaluated relative to the reference point and because individuals are risk‐averse (the marginal value of a gain is diminishing in its size). Conversely, they prefer one large loss to a series of multiple losses of equal value. This is because each loss is evaluated relative to the reference point and because individuals are risk‐loving in losses (the marginal cost is increasing in the size of the loss).
This insight is relevant for subject and course choices since many courses are separated out quite clearly (e.g. GCSEs in individual subjects), whilst others are combined (e.g. Diploma or BTEC courses). In theory,
he gains from individual GCSEs, makes a combination of subjects more
16 This would mean that the effect of one aspect on utility is independent of the effects of all the other aspects. For example, the attraction of a good job prospect following an optional course, relative to another course or some reference point, is independent of the HE prospects following the same options. 17 This corresponds to a concave value function in the positive domain and a convex one in the negative domain, as proposed by Kahneman and Tversky (1979).
45
had a significantly different impact on preferences from presenting the same st tistics as survival rates.
There is also evidence that vivid imagination of potential outcomes can trigger feelings and bias judgement. One interesting example was given by Johnson et al. (1993): on average, people were willing to pay more for airline travel insurance covering death from ‘terrorist acts’ than death from ‘all possible causes’. Clearly, the risk of the former must be smaller than the risk of the latter. But imagining ‘terrorist acts’ is easier (or at least more vivid) than picturing ‘all possible causes’. The vividness with which people can imagine terrorist acts led them to attach a higher subjective probability to them, or to subconsciously
appealing. However, if the student also evaluates the losses or costs in a separating mindset, then the set of losses will appear more off‐putting than if they are considered as a single big cost. Thus, it is hard to predict the influence of a separating framing when the options involve both benefits and costs.
Ordering effects The order in which decision‐makers receive information may also influence their judgement in predictable ways. Tubbs et al. (1993) designed an experiment in which auditors reviewed evidence regarding certain financial irregularities (such as overstating assets or understating liabilities) and found that the order in which evidence was presented to auditors had a significant effect on their final judgement. More recent pieces of information were more heavily weighted when the evidence was mixed (i.e. some evidence was positive and some negative), while there were no significant ordering effects when the evidence was consistent (all positive or all negative). Admittedly, making a judgement on an objective question is quite different from choosing the best course of action on a subjective matter such as subject choices. However, if order effects apply to the latter context as well, it seems likely that more recent pieces of information or arguments will have a greater influence. Advice given in the period shortly before course choices are made may therefore be of disproportionate significance, compared with advice given earlier in the process.
The ordering effect may also matter for something as simple as the way subjects are presented on a course‐choice form. It may be the case, for example, that presenting choices in a long alphabetical list may have different effects from presenting choices in blocks or grouping them by subject area (e.g. sciences, humanities, languages, etc.). This could be easily tested in an experimental setting through the presentation of differently‐structured lists to randomly‐assigned groups of individuals within the same school. However, the only potential policy implications would be providing advice to schools on the effects of differently‐structured lists.
Risk as feelings The idea of ‘risk as feelings’ comes from a well‐known study by Loewenstein et al. (2001), which highlighted the effects of particular feelings at the time of decision‐making. In the presence of risks and uncertainties, the authors argued, decision‐making is not a purely cognitive process of optimisation subject to certain constraints and based on some beliefs. Instead, feelings and emotions interact with the cognitive process of decision‐making and result in systematic departures from rationality. This is another example of a context effect, in the sense that the choices available to individuals are the same but emotional feelings change the way individuals interact with those choices.
Risk assessments and preferences appear to be affected by people’s emotions in predictable ways. People in a good mood tend to make optimistic judgements, while those in a bad mood make more pessimistic ones (Wright and Bower, 1992). Induced anxiety could increase individuals’ preference for low‐risk, low‐return options, whereas induced sadness has the opposite effect (Raghunathan and Pham, 1999). And depression has been related to a preference for default options (Eisenberg et al., 1995). Meanwhile, it is arguable that different forms of framing affect risk assessments through eliciting different emotions. For example, McNeil et al. (1982) presented comparative statistics of two medical treatments to patients and asked about their preferences between the two. They found that presenting the statistics as death rates
a
46
conclusions.
Based on these results, the authors concluded that large choice sets can be demotivating for individuals since the costs associated with picking the ‘right’ option from a long list could be relatively high. The authors hypothesised that, faced with such large choice sets, individuals may fall back on simple, affective or heuristic rules rather than use rational decision‐making tools. For example, Timmermans (1993)
give them a higher weight in their decision‐making.
Similarly, Hsee and Weber (1997) found that students consistently predicted that other students would be more risk‐seeking than themselves in risky choices, regardless of whether the choices were between positive or negative outcomes. However, the discrepancy between the predicted behaviour of themselves and of others occurred only when students were asked to predict the behaviour of an abstract, hypothetical ‘other’ person – it disappeared when the target of prediction was a real person, sitting nearby.
The above evidence has two implications for subject choices. First, the emotional state of the person at the time of choosing subjects can influence the choices made. For example, how information about course choices is presented may influence young people’s feelings and therefore their choices. One could provide two sets of students with information regarding the performance of previous students at their school in particular subjects. In one setting, students would be told the proportion achieving grade A*–C; in the other setting, they would be told the proportion getting grade D or worse. The framing may matter, with students showing different preferences when ‘reducing the risk of failure’ than they do when ‘improving the chances of passing’.
Second, vivid outcomes may receive a higher weight in students’ decision‐making process. For example, the chance of becoming a superstar may be overestimated and that could lead to excessive risk‐taking. Similarly, a young person may overestimate their chance of having the same positive experience as an older sibling, and as a result choose some options not appropriate for themselves.
The effect of vividness can be harnessed in more positive directions. The advertising campaign ‘Science and Maths: See where they can take you’ appears to have had the intention of making scientific careers more vivid to young people, and so (perhaps) more desirable. While a career in ‘science’ may sound abstract, a career in Formula 1, or designing computer games, may be altogether more desirable. Another possible policy implication is that work experience placements can create vivid ideas of what certain combinations of subjects and courses can lead to in the future. As such, they would seem to be an important contribution to the subject‐ and course‐choice decision‐making process. Greater use of work experience was just one of the recommendations of the Wolf Review of Vocational Education.
Choice overload and over-introspection Standard models of rationality suggest that a decision‐maker cannot be made worse off by a larger set of options. In practice, however, too many options can make the question look overcomplicated and lead to more dissatisfaction and worse decisions. Indeed, reasoning and deliberation may in some cases be counterproductive, worsening (rather than improving) the quality of decision‐making. For example, Iyengar and Lepper (2000) provided evidence for three different examples of choice overload. In one experiment, they offered students the chance to complete an extra‐credit assignment for their mid‐term examination. However, some students were randomly offered a list of 30 potential topics and others were randomly offered 6 different topics. The results showed that those in the limited‐choice group were more likely to complete the extra‐credit assignment (74% compared with 60%) and were perceived to have written better‐quality essays. In a second experiment, participants were able to choose a chocolate from a display of 6 or 30 Godiva chocolates. As it turned out, participants who were offered 6 options reported a higher level of satisfaction with their choices than those who faced 30 options. The former were also more likely to buy the chocolates subsequently. Another experiment using jam tasting came to similar
47
findings for school‐level subject cquality of any given course was
concluded that individuals are more likely to use elimination strategies (finding simple reasons to drop some options from the choice set entirely) when confronted with larger numbers of options. Other examples of heuristic tools include a preference for familiar choices, ignoring similar attributes across items and choosing compromise options. While these decision‐making tools may be part of humans’ evolved cognitive toolkit to make complex decisions more tractable, they can also be manipulated to result in suboptimal decisions.
The concept of choice overload is certainly likely to be relevant to subject and course choices, given that the potential number of options available to young people can already be substantial at age 14, and only grows when it comes to post‐16 choices. Young people’s susceptibility to choice overload is a clear area of possible concern, and may caution against very wide choice sets. However, one has to be equally cautious when reducing the number and the complexity of choices faced by young people, for the reason that some of the eliminated options might be more appropriate for some students.
One possible response to a large number of options is to think more carefully. However, Wilson and Schooler (1991)’s experiment on university course choices suggests that too much introspection could reduce the quality of decision‐making. Students received a booklet of course information on nine psychology courses that they could opt to study in the following semester. All students were then asked to rate the nine courses and their likelihood of choosing each course. They were also asked to rate the importance of the information provided in the booklet, what they had heard from others and their own interest in the topic to their decisions. Students were also allocated to three groups: ‘reasons’, ‘rate all’ and a control group. The ‘reasons’ treatment group were instructed to write down (confidentially) the reasons why they did or did not want to take each course. The ‘rate all’ treatment group were asked to rate the impact of each piece of information on their likelihood of taking the course. The control group were not asked to conduct these tasks. All students were then asked, unexpectedly, to recall as much information as they could about the courses and write it down.
The results reveal three interesting points. First, introspection may reduce the quality of choices made. The control group showed more of a preference for highly‐rated courses (as rated by previous students who had taken those courses) over poorly‐rated courses than the students in the ‘rate all’ group; but there was no significant difference between the control and ‘reasons’ groups.18 Second, there is a risk of being distracted by irrelevant or unimportant information if one thinks too much. Although the total amount of information recalled did not differ significantly across groups, the kinds of information students were most likely to remember did. Those in the control group recalled more of the ‘most important’ pieces of information (as rated by the faculty) than the ‘least important’ ones. The ‘reasons’ group recalled as much important information as unimportant information. The ‘rate all’ group were actually more likely to recall less important pieces of information. Third, having to pay attention to all pieces of information reduced the perceived differences in the quality of courses. The average range of ratings of courses given by the ‘rate all’ group was smaller than that given by the control group, which was smaller than that given by the ‘reasons’ group. The intuition is that attention to all information made it easier for the ‘rate all’ group to see both the advantages and disadvantages of each course, while those who reasoned by themselves might have been subject to confirmation bias.
Therefore, the findings suggest that too much introspection can lead to poor‐quality decision‐making, with students less likely to pick highly‐rated courses, more likely to be distracted by less important information and fewer perceived differences in course quality. However, the implications of these
hoices should be treated with caution. The approach assumed that the the same for any student. This assumption is clearly unrealistic for
18 The authors also examined data regarding students’ actual pre-registration for courses and final enrolment. Students in the introspection conditions (especially those who analysed reasons) were less likely than those in the control condition to take the highly-rated courses but about equally likely to take the poorly-rated courses. Similar but less significant results were attained from the enrolment data.
48
future and uncertainty and the possible ffects of the way in which choices are framed and presented.
Since course choices are unavoidably decisions about the future, it is important to understand the limitations of individuals’ ability to make long‐term decisions. In particular, individuals appear to treat the present as a ‘special case’ when planning ahead (present bias), they appear to exhibit overconfidence in their own ability and over‐optimism about the likelihood that good things will happen to them, and
secondary‐school subject choices, where not all courses are appropriate for everyone. This means a simple replication of the experiment at the school level is unlikely to work as there is little objective basis
’ con which to rate individual students choi es as being ‘better’ or ‘worse’ in quality.
One could envisage experiments that examine students’ susceptibility to over‐introspection. In a laboratory setting, young people could be asked to make decisions while given various levels of information, varying amounts of time to make their choices, and differing treatments regarding how they process the available information (in a similar spirit to the ‘rate all’ and ‘reasons’ groups in Wilson and Schooler’s experiment). It may be that young people have lower (or indeed higher) tolerance for a wide array of choices than adults, and that different forms of information (such as statistics versus vivid examples) may have a differing degree of salience to different age groups.
Social norms Finally, we consider the way that social norms can influence individual behaviour. As we saw in Chapter 1, there are strong gender differences in young people’s subject and course choices, and it is often suggested that these result from gender stereotyping on the part of both young people and education professionals. From the perspective of behavioural economics, social norms could be considered as types of reference or anchoring points, against which individuals evaluate their options and on which basis individuals make decisions. When young people are inherently indifferent between a few courses, they may choose the ones that conform to social stereotypes. For example, they may be more inclined to choose courses that previous students similar to them (in terms of gender, academic ability, etc.) had chosen, all else being equal.
On the other hand, there are often rational reasons to conform to social norms and it is hard to disentangle the behavioural bias from those reasons. First, individuals may experience welfare gains from belonging to a social group. Making the same subject and course choices as one’s peers is arguably a way to improve bonding and networking within one’s social group. Second, it may be that individuals are imperfectly informed about the benefits of particular subject and course choices, and it is costly to obtain such information. In this case, following the choices of similar individuals to oneself may be a perfectly rational response. Finally, the observation of some people conforming to a social norm might simply be a result of the rational decision‐making of similar individuals. For example, a young person may choose the subjects that his older siblings have studied because of family background, or even genetic, similarities. It is hard to tell whether this is the case or whether the young person is unconsciously influenced by his siblings.
In general, it is thus hard to derive policy implications from the potential influences of social norms. Such effects could work through multiple channels, and each could suggest very different appropriate policy responses, if any.
2.4 Applying insights from behavioural economics to school pupils
In this chapter, we have discussed the implications of insights from behavioural economics for the way young people make subject and course choices, and the potential ways in which policymakers could respond. We have focused our attention on cognitive biases relating to how individuals think about the
e
49
crucial to establish empirically the relative importance of different forces before making policy decisions.
In response to these concerns, we have recommended a number of experiments designed to tease out the relevance of these insights from behavioural economics for the way young people make subject and course choices. We would like to highlight two areas as meriting further investigation: present bias and default/anchoring bias. Since almost all educational choices are inherently dynamic, the extent to which young people’s choices are present‐biased is likely to be of wider significance to education policy. Equally, the extent to which young people’s choices are subject to default or anchoring bias is also likely to be
they appear to underestimate their own adaptability when imagining their life under different circumstances (projection bias). All these sources of bias may be relevant to individuals’ course and subject choices. Present bias suggests that individuals may overweight short‐run considerations (such as taking easier courses) compared with long‐run considerations. Overconfidence suggests that pupils may overestimate their likelihood of performing well at school, and so could choose courses to which they are ill‐suited. Projection bias suggests that students may not fully appreciate the way their preferences will change, and may thus make choices that restrict their ability to make desirable choices at later ages.
Framing effects suggest ways in which young people might be influenced or nudged towards certain options. In particular, default options are more likely to be chosen for reasons beyond their actual desirability, and anchoring based on recently‐presented pieces of information could be important in decision‐making. The order in which choices are presented could matter, as could whether they are described as losses or gains around some reference point. Over‐introspection of wide choice sets could also worsen the quality of decision‐making.
There are three reasons to be particularly cautious before directly applying these insights to school pupils. First, the evidence supporting the existence of many ‘behavioural regularities’ comes overwhelmingly from experiments in laboratory settings or adults in very different contexts. It is possible to derive implications for the way in which young people make subject and course choices. However, this is no substitute for empirical evidence on the extent to which cognitive biases actually pervade young people’s subject and course choices. Empirical evidence certainly suggests that (on average) young people overestimate their chances of staying on in education at older ages, and that this overconfidence is more extreme for children from more deprived backgrounds. However, this is an area where the policy implications are unclear, since over‐optimism could encourage greater educational effort.
Second, almost all the evidence cited on cognitive biases relates to experiments conducted with adult (or at least college‐age) subjects. We have attempted to indicate how these behaviours may be relevant to young people’s subject and course choices, but it is important be cautious in applying these ideas directly to school pupils. The degree of ‘rationality’ of children and adolescents is probably not comparable to that of adults. Young people’s brains are not considered to be ‘fully developed’ (see e.g. Reyna and Farley (2006)), and the parts of the brain associated by neuroscientists with long‐term planning and impulse control show significant development during adolescence, and continue to develop into the mid‐20s. It may be the case, therefore, that young people require more protection from their present‐biasing impulses than adults do. Meanwhile, there is currently a lack of evidence as to how susceptible young people are to the various framing effects found in adults.
Third, while behavioural economics provides some insights that the rational model could not, it is worth noting that standard arguments, such as the importance of incentives and information, are often important as well. In some cases, it is difficult to disentangle the influence of behavioural biases from rational decision‐making. For example, the Wolf Report concludes that a large number of young people are doing vocational qualifications of little long‐term value and which limit their future choices. If this is the result of lack of information, then better information is the natural response. Alternatively, if it is the result of present bias towards easier courses or a projection bias, then an earlier decision time, other commitment devices or increased flexibility would be more appropriate responses. Consequently, it is
50
relevant to all areas of education policy. Both also have clear policy implications – an earlier decision time or other forms of precommitment devices in the case of present bias, and the creation of desirable defaults or anchors (or the avoidance of defaults or anchors unsuitable to wide numbers of young people). In this chapter, we have proposed a simple experiment that could tease out anchoring and default bias, as well as present bias. Other experiments could also be equally valid and useful. For instance, replication of existing experiments on present bias would be simple and highly relevant to many features of education policy. One could also design experiments to tease out present bias or anchoring and default biases in other educational contexts as well. We therefore conclude that these two areas represent a fertile area for cutting‐edge academic research, which would also be highly relevant to the appropriate design of education policy.
We have also set out experiments to tease out the relevance of other insights from behavioural economics for the way young people make subject and course choices. For instance, the existence of ordering effects and any effects of over‐introspection could easily be tested using existing experimental designs. These would provide greater insights into the way young people make subject and course choices and lead to clear policy implications – for example, avoiding presenting options in such a way as to bias decisions, such as in a long list, and the provision of much more concise information to young people.
Where we see less potential for further insights from experiments relates to loss aversion and projection bias. In the case of loss aversion, the multiple competing rationales for making particular subject and course choices make it very difficult to isolate a reference point against which young people assess gains and losses. This is likely to apply across other educational contexts as well. The implications of projection bias are equally unclear, as it is difficult to imagine that policymakers could be better placed to predict how individuals’ preferences will change. The main implication is a further potential justification for increased flexibility in subject and course choices, such that individuals’ options are not closed off too early. Indeed, this could be a policy implication of many of the behavioural biases we discuss in this chapter: for example, over‐optimism and present bias could both lead to young people making choices ill‐suited to them such that they close off more suitable options later in life. However, flexibility would also be beneficial to young people making decisions according to a standard rational model. Any increased flexibility would also need to be set against the costs of increased flexibility, such as how appropriate such courses would be for pupils who want to specialise.
In summary, there are numerous future avenues of enquiry that could help to cast light on the cognitive processes through which young people make decisions (including course and subject decisions). In particular, there is a great deal of potential for replicating simple decision‐making experiments on young people in English schools – at a relatively low cost (since small rewards and incentives can have a much larger impact on a young person’s budget than on an adult’s), and with a large body of existing experiments on which to draw when designing the studies. Such experiments would be of considerable interest not only to academic researchers but also to teachers and policymakers.
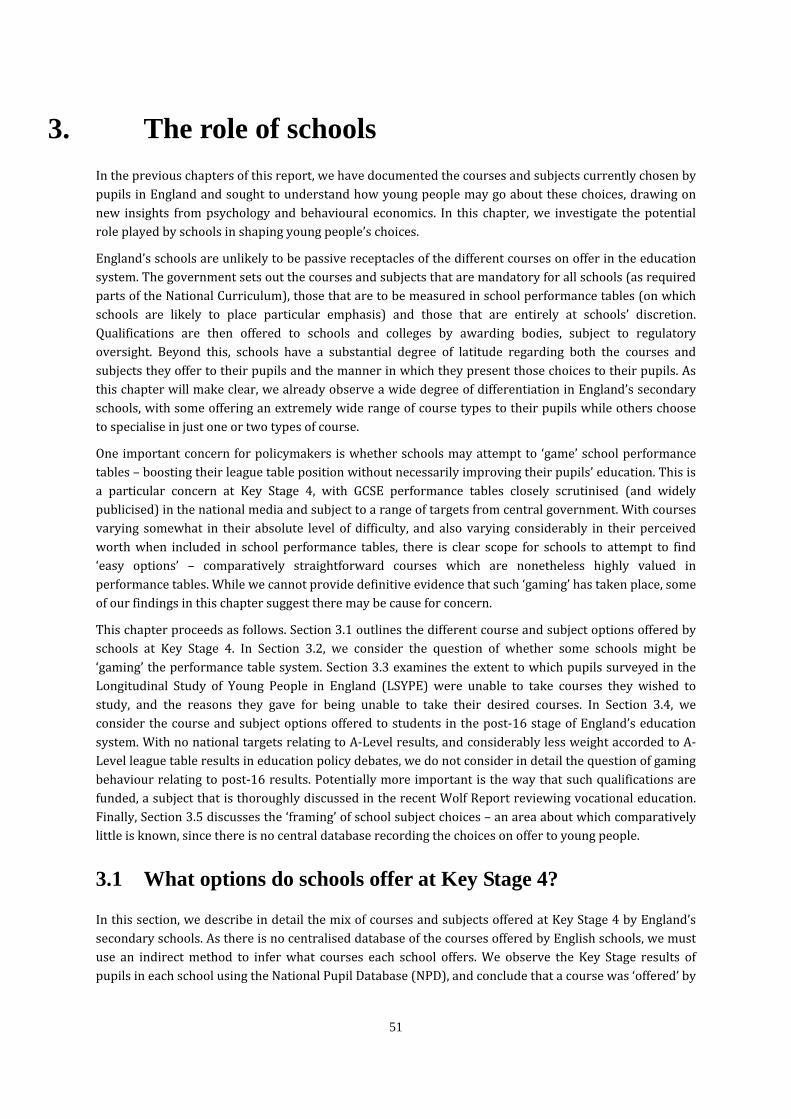
51
3. The role of schools In the previous chapters of this report, we have documented the courses and subjects currently chosen by pupils in England and sought to understand how young people may go about these choices, drawing on new insights from psychology and behavioural economics. In this chapter, we investigate the potential role played by schools in shaping young people’s choices.
England’s schools are unlikely to be passive receptacles of the different courses on offer in the education system. The government sets out the courses and subjects that are mandatory for all schools (as required parts of the National Curriculum), those that are to be measured in school performance tables (on which schools are likely to place particular emphasis) and those that are entirely at schools’ discretion. Qualifications are then offered to schools and colleges by awarding bodies, subject to regulatory oversight. Beyond this, schools have a substantial degree of latitude regarding both the courses and subjects they offer to their pupils and the manner in which they present those choices to their pupils. As this chapter will make clear, we already observe a wide degree of differentiation in England’s secondary schools, with some offering an extremely wide range of course types to their pupils while others choose to specialise in just one or two types of course.
One important concern for policymakers is whether schools may attempt to ‘game’ school performance tables – boosting their league table position without necessarily improving their pupils’ education. This is a particular concern at Key Stage 4, with GCSE performance tables closely scrutinised (and widely publicised) in the national media and subject to a range of targets from central government. With courses varying somewhat in their absolute level of difficulty, and also varying considerably in their perceived worth when included in school performance tables, there is clear scope for schools to attempt to find ‘easy options’ – comparatively straightforward courses which are nonetheless highly valued in performance tables. While we cannot provide definitive evidence that such ‘gaming’ has taken place, some of our findings in this chapter suggest there may be cause for concern.
This chapter proceeds as follows. Section 3.1 outlines the different course and subject options offered by schools at Key Stage 4. In Section 3.2, we consider the question of whether some schools might be ‘gaming’ the performance table system. Section 3.3 examines the extent to which pupils surveyed in the Longitudinal Study of Young People in England (LSYPE) were unable to take courses they wished to study, and the reasons they gave for being unable to take their desired courses. In Section 3.4, we consider the course and subject options offered to students in the post‐16 stage of England’s education system. With no national targets relating to A‐Level results, and considerably less weight accorded to A‐Level league table results in education policy debates, we do not consider in detail the question of gaming behaviour relating to post‐16 results. Potentially more important is the way that such qualifications are funded, a subject that is thoroughly discussed in the recent Wolf Report reviewing vocational education. Finally, Section 3.5 discusses the ‘framing’ of school subject choices – an area about which comparatively little is known, since there is no central database recording the choices on offer to young people.
3.1 What options do schools offer at Key Stage 4?
In this section, we describe in detail the mix of courses and subjects offered at Key Stage 4 by England’s secondary schools. As there is no centralised database of the courses offered by English schools, we must use an indirect method to infer what courses each school offers. We observe the Key Stage results of pupils in each school using the National Pupil Database (NPD), and conclude that a course was ‘offered’ by
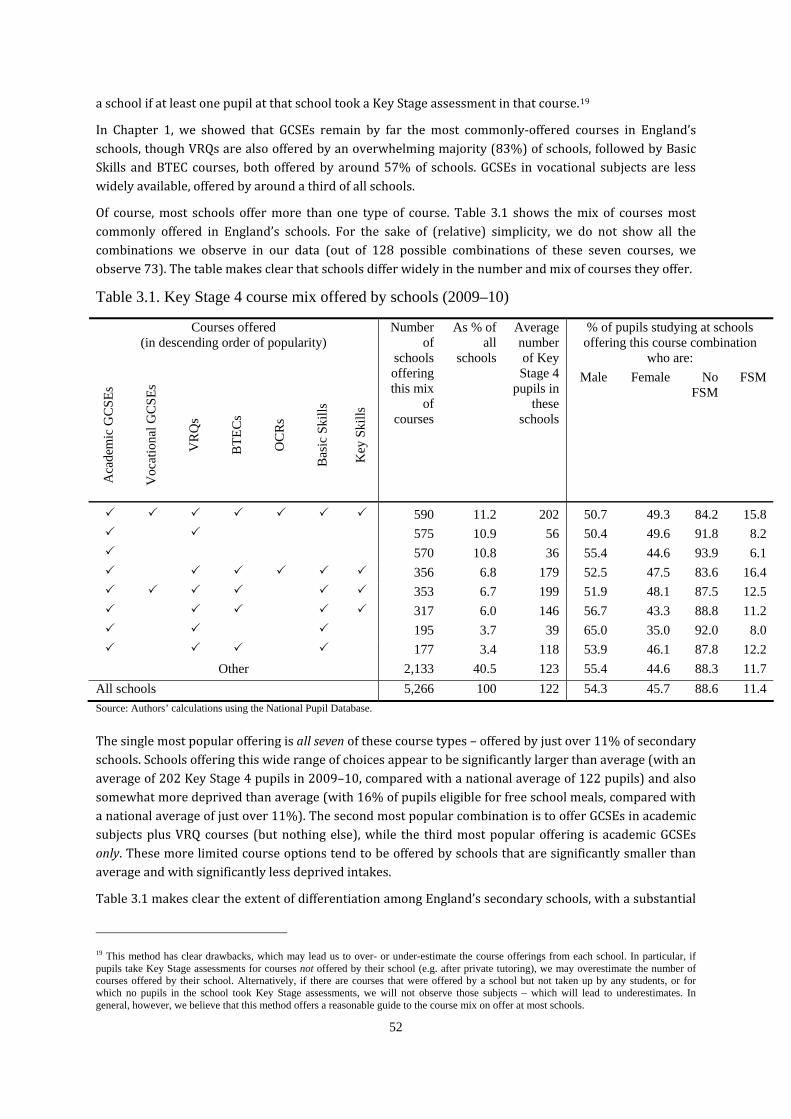
52
a school if at least one pupil at that school took a Key Stage assessment in that course.19
In Chapter 1, we showed that GCSEs remain by far the most commonly‐offered courses in England’s schools, though VRQs are also offered by an overwhelming majority (83%) of schools, followed by Basic Skills and BTEC courses, both offered by around 57% of schools. GCSEs in vocational subjects are less widely available, offered by around a third of all schools.
Of course, most schools offer more than one type of course. Table 3.1 shows the mix of courses most commonly offered in England’s schools. For the sake of (relative) simplicity, we do not show all the combinations we observe in our data (out of 128 possible combinations of these seven courses, we observe 73). The table makes clear that schools differ widely in the number and mix of courses they offer.
Table 3.1. Key Stage 4 course mix offered by schools (2009–10)
Courses offered (in descending order of popularity)
% of pupils studying at schools offering this course combination
who are:
Aca
dem
ic G
CSE
s
Voc
atio
nal G
CSE
s
VR
Qs
BTE
Cs
OC
Rs
Bas
ic S
kills
Key
Ski
lls
Number of
schools offering this mix
of courses
As % of all
schools
Average number of Key Stage 4
pupils in these
schools
Male Female No FSM
FSM
590 11.2 202 50.7 49.3 84.2 15.8
575 10.9 56 50.4 49.6 91.8 8.2 570 10.8 36 55.4 44.6 93.9 6.1
356 6.8 179 52.5 47.5 83.6 16.4 353 6.7 199 51.9 48.1 87.5 12.5 317 6.0 146 56.7 43.3 88.8 11.2
195 3.7 39 65.0 35.0 92.0 8.0 177 3.4 118 53.9 46.1 87.8 12.2
Other 2,133 40.5 123 55.4 44.6 88.3 11.7 All schools 5,266 100 122 54.3 45.7 88.6 11.4 Source: Authors’ calculations using the National Pupil Database.
The single most popular offering is all seven of these course types – offered by just over 11% of secondary schools. Schools offering this wide range of choices appear to be significantly larger than average (with an average of 202 Key Stage 4 pupils in 2009–10, compared with a national average of 122 pupils) and also somewhat more deprived than average (with 16% of pupils eligible for free school meals, compared with a national average of just over 11%). The second most popular combination is to offer GCSEs in academic subjects plus VRQ courses (but nothing else), while the third most popular offering is academic GCSEs only. These more limited course options tend to be offered by schools that are significantly smaller than average and with significantly less deprived intakes.
f differentiation among England’s secondary schools, with a substantial Table 3.1 makes clear the extent o
19 This method has clear drawbacks, which may lead us to over- or under-estimate the course offerings from each school. In particular, if pupils take Key Stage assessments for courses not offered by their school (e.g. after private tutoring), we may overestimate the number of courses offered by their school. Alternatively, if there are courses that were offered by a school but not taken up by any students, or for which no pupils in the school took Key Stage assessments, we will not observe those subjects – which will lead to underestimates. In general, however, we believe that this method offers a reasonable guide to the course mix on offer at most schools.
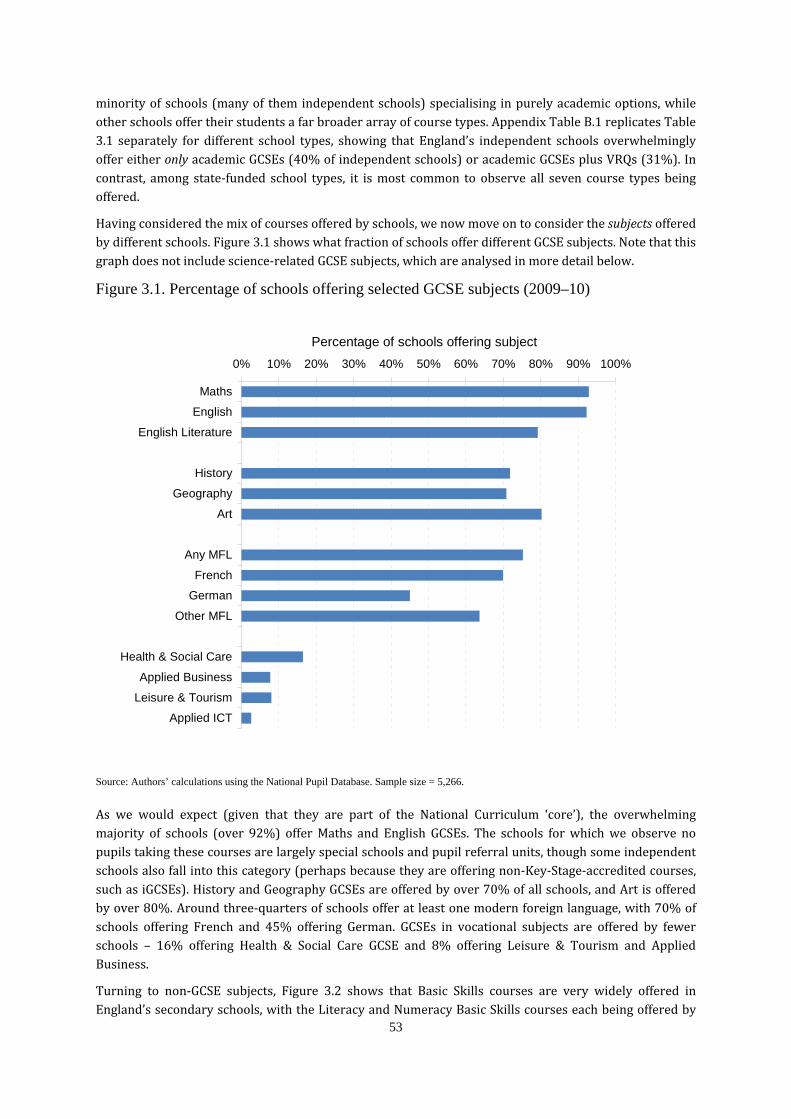
minority of schools (many of them independent schools) specialising in purely academic options, while other schools offer their students a far broader array of course types. Appendix Table B.1 replicates Table 3.1 separately for different school types, showing that England’s independent schools overwhelmingly offer either only academic GCSEs (40% of independent schools) or academic GCSEs plus VRQs (31%). In contrast, among state‐funded school types, it is most common to observe all seven course types being offered.
Having considered the mix of courses offered by schools, we now move on to consider the subjects offered by different schools. Figure 3.1 shows what fraction of schools offer different GCSE subjects. Note that this graph does not include science‐related GCSE subjects, which are analysed in more detail below.
Figure 3.1. Percentage of schools offering selected GCSE subjects (2009–10)
0% 10% 20% 30% 40% 50% 60% 70% 80% 90% 100%
Maths
English
English Literature
History
Geography
Art
Any MFL
French
German
Other MFL
Health & Social Care
Applied Business
Leisure & Tourism
Applied ICT
Percentage of schools offering subject
Sou ce: Authors’ calculations using the National Pupil Database. Sample size = 5,266.
As we would expect (given that they are part of the National Curriculum ‘core’), the overwhelming majority of schools (over 92%) offer Maths and English GCSEs. The schools for which we observe no pupils taking these courses are largely special schools and pupil referral units, though some independent schools also fall into this category (perhaps because they are offering non‐Key‐Stage‐accredited courses, such as iGCSEs). History and Geography GCSEs are offered by over 70% of all schools, and Art is offered by over 80%. Around three‐quarters of schools offer at least one modern foreign language, with 70% of schools offering French and 45% offering German. GCSEs in vocational subjects are offered by fewer schools – 16% offering Health & Social Care GCSE and 8% offering Leisure & Tourism and Applied
r
53
Business.
Turning to non‐GCSE subjects, Figure 3.2 shows that Basic Skills courses are very widely offered in England’s secondary schools, with the Literacy and Numeracy Basic Skills courses each being offered by
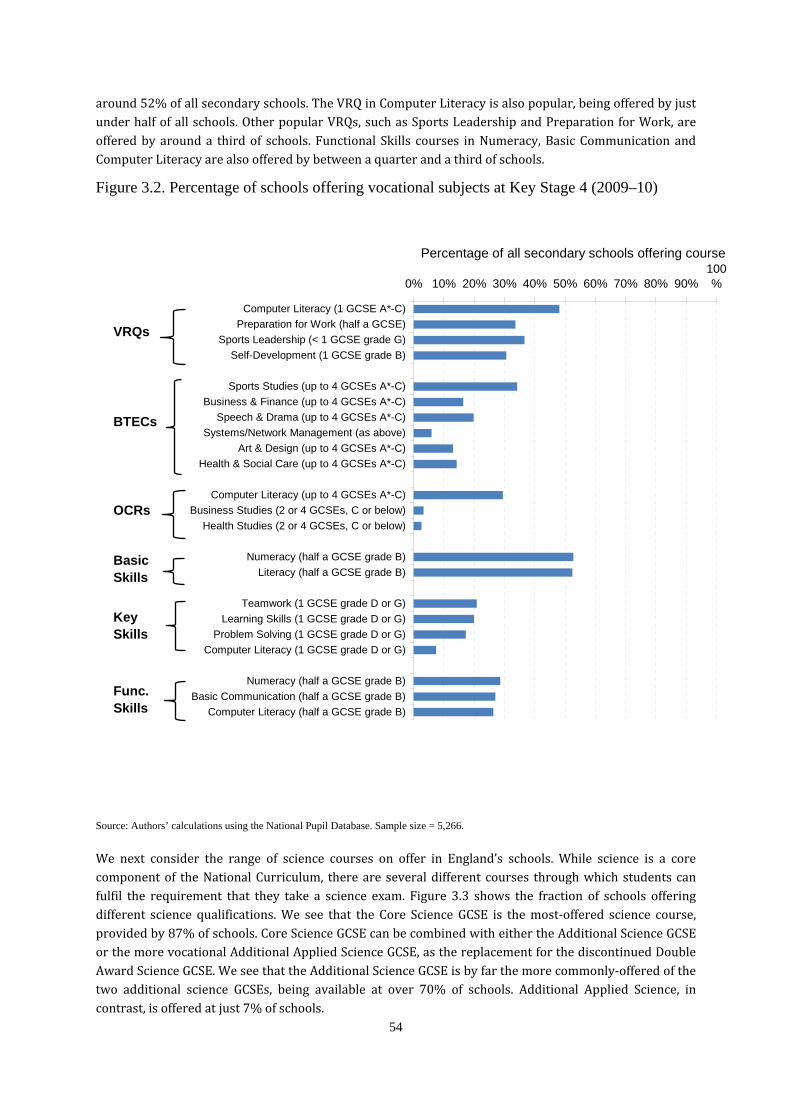
around 52% of all secondary schools. The VRQ in Computer Literacy is also popular, being offered by just under half of all schools. Other popular VRQs, such as Sports Leadership and Preparation for Work, are offered by around a third of schools. Functional Skills courses in Numeracy, Basic Communication and Computer Literacy are also offered by between a quarter and a third of schools.
Figure 3.2. Percentage of schools offering vocational subjects at Key Stage 4 (2009–10)
0% 10% 20% 30% 40% 50% 60% 70% 80% 90%100%
Computer Literacy (1 GCSE A*-C)Preparation for Work (half a GCSE)
Sports Leadership (< 1 GCSE grade G)Self-Development (1 GCSE grade B)
Sports Studies (up to 4 GCSEs A*-C)Business & Finance (up to 4 GCSEs A*-C)
Speech & Drama (up to 4 GCSEs A*-C)Systems/Network Management (as above)
Art & Design (up to 4 GCSEs A*-C)Health & Social Care (up to 4 GCSEs A*-C)
Computer Literacy (up to 4 GCSEs A*-C)Business Studies (2 or 4 GCSEs, C or below)
Health Studies (2 or 4 GCSEs, C or below)
Numeracy (half a GCSE grade B)Literacy (half a GCSE grade B)
Teamwork (1 GCSE grade D or G)Learning Skills (1 GCSE grade D or G)
Problem Solving (1 GCSE grade D or G)Computer Literacy (1 GCSE grade D or G)
Numeracy (half a GCSE grade B)Basic Communication (half a GCSE grade B)
Computer Literacy (half a GCSE grade B)
Percentage of all secondary schools offering course
VRQs
BTECs
OCRs
KeySkills
Func.Skills
Basic Skills
54
Source: Authors’ calculations using the National Pupil Database. Sample size = 5,266.
We next consider the range of science courses on offer in England’s schools. While science is a core component of the National Curriculum, there are several different courses through which students can fulfil the requirement that they take a science exam. Figure 3.3 shows the fraction of schools offering different science qualifications. We see that the Core Science GCSE is the most‐offered science course, provided by 87% of schools. Core Science GCSE can be combined with either the Additional Science GCSE or the more vocational Additional Applied Science GCSE, as the replacement for the discontinued Double Award Science GCSE. We see that the Additional Science GCSE is by far the more commonly‐offered of the two additional science GCSEs, being available at over 70% of schools. Additional Applied Science, in contrast, is offered at just 7% of schools.
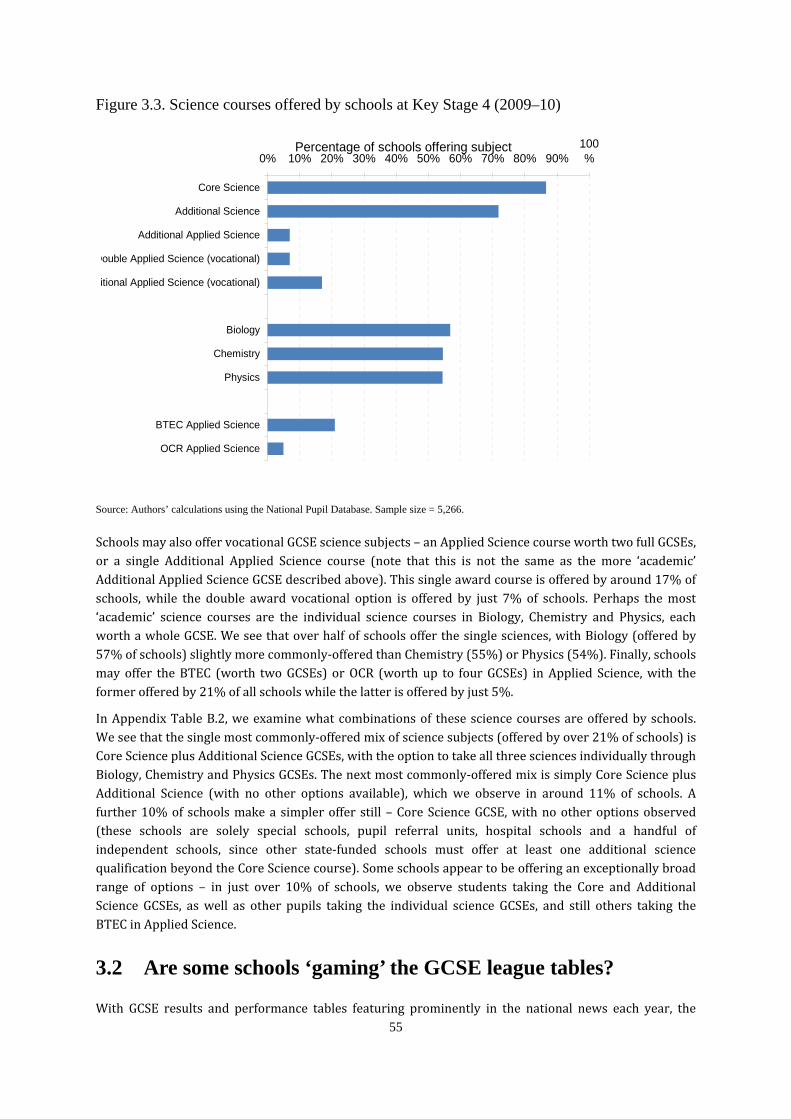
Figure 3.3. Science courses offered by schools at Key Stage 4 (2009–10)
0% 10% 20% 30% 40% 50% 60% 70% 80% 90%100%
Core Science
Additional Science
Additional Applied Science
Double Applied Science (vocational)
itional Applied Science (vocational)
Biology
Chemistry
Physics
BTEC Applied Science
OCR Applied Science
Percentage of schools offering subject
Source: Authors’ calculations using the National Pupil Database. Sample size = 5,266.
Schools may also offer vocational GCSE science subjects – an Applied Science course worth two full GCSEs, or a single Additional Applied Science course (note that this is not the same as the more ‘academic’ Additional Applied Science GCSE described above). This single award course is offered by around 17% of schools, while the double award vocational option is offered by just 7% of schools. Perhaps the most ‘academic’ science courses are the individual science courses in Biology, Chemistry and Physics, each worth a whole GCSE. We see that over half of schools offer the single sciences, with Biology (offered by 57% of schools) slightly more commonly‐offered than Chemistry (55%) or Physics (54%). Finally, schools may offer the BTEC (worth two GCSEs) or OCR (worth up to four GCSEs) in Applied Science, with the former offered by 21% of all schools while the latter is offered by just 5%.
In Appendix Table B.2, we examine what combinations of these science courses are offered by schools. We see that the single most commonly‐offered mix of science subjects (offered by over 21% of schools) is Core Science plus Additional Science GCSEs, with the option to take all three sciences individually through Biology, Chemistry and Physics GCSEs. The next most commonly‐offered mix is simply Core Science plus Additional Science (with no other options available), which we observe in around 11% of schools. A further 10% of schools make a simpler offer still – Core Science GCSE, with no other options observed (these schools are solely special schools, pupil referral units, hospital schools and a handful of independent schools, since other state‐funded schools must offer at least one additional science qualification beyond the Core Science course). Some schools appear to be offering an exceptionally broad range of options – in just over 10% of schools, we observe students taking the Core and Additional Science GCSEs, as well as other pupils taking the individual science GCSEs, and still others taking the BTEC in Applied Science.
3.2 Are some schools ‘gaming’ the GCSE league tables?
55
With GCSE results and performance tables featuring prominently in the national news each year, the
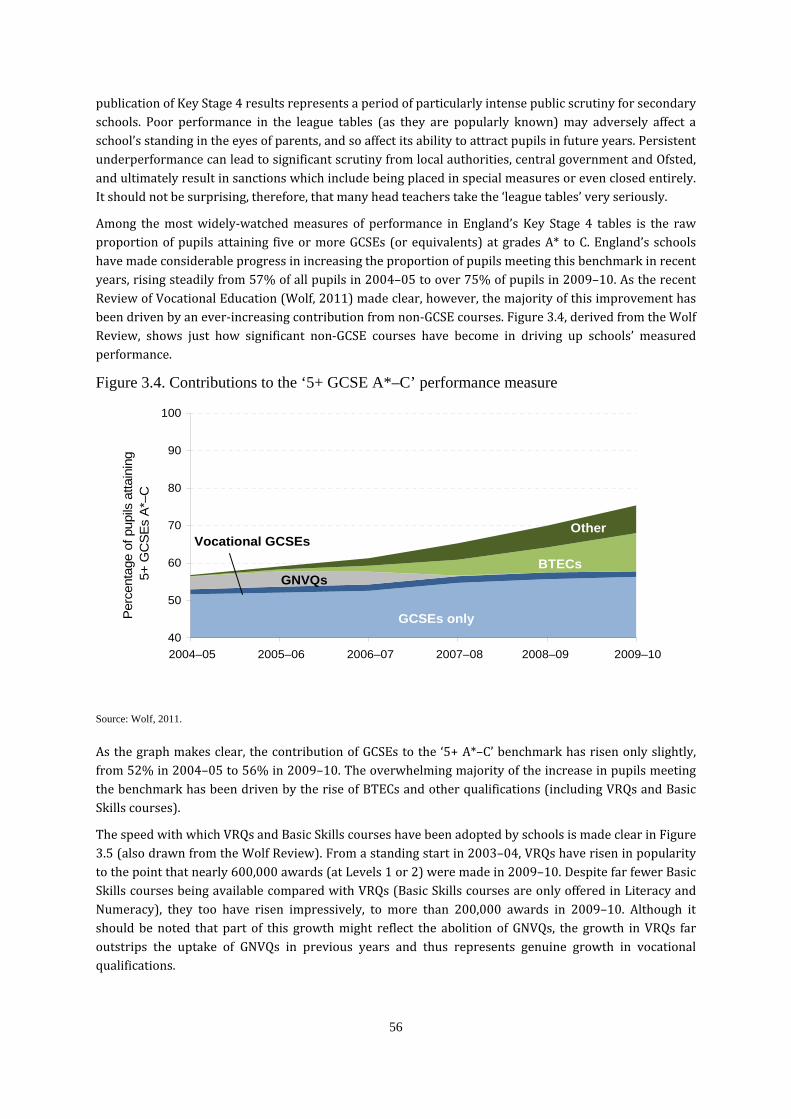
publication of Key Stage 4 results represents a period of particularly intense public scrutiny for secondary schools. Poor performance in the league tables (as they are popularly known) may adversely affect a school’s standing in the eyes of parents, and so affect its ability to attract pupils in future years. Persistent underperformance can lead to significant scrutiny from local authorities, central government and Ofsted, and ultimately result in sanctions which include being placed in special measures or even closed entirely.
s gIt should not be surprising, therefore, that many head teacher take the ‘lea ue tables’ very seriously.
Among the most widely‐watched measures of performance in England’s Key Stage 4 tables is the raw proportion of pupils attaining five or more GCSEs (or equivalents) at grades A* to C. England’s schools have made considerable progress in increasing the proportion of pupils meeting this benchmark in recent years, rising steadily from 57% of all pupils in 2004–05 to over 75% of pupils in 2009–10. As the recent Review of Vocational Education (Wolf, 2011) made clear, however, the majority of this improvement has been driven by an ever‐increasing contribution from non‐GCSE courses. Figure 3.4, derived from the Wolf Review, shows just how significant non‐GCSE courses have become in driving up schools’ measured performance.
Figure 3.4. Contributions to the ‘5+ GCSE A*–C’ performance measure
40
50
60
70
80
90
100
2004–05 2005–06 2006–07 2007–08 2008–09 2009–10
Per
cent
age
of p
upils
atta
inin
g 5
+ G
CSE
s A*
–C
GCSEs only
Vocational GCSEs
GNVQsBTECs
Other
Source: Wolf, 2011.
As the graph makes clear, the contribution of GCSEs to the ‘5+ A*–C’ benchmark has risen only slightly, from 52% in 2004–05 to 56% in 2009–10. The overwhelming majority of the increase in pupils meeting the benchmark has been driven by the rise of BTECs and other qualifications (including VRQs and Basic Skills courses).
The speed with which VRQs and Basic Skills courses have been adopted by schools is made clear in Figure 3.5 (also drawn from the Wolf Review). From a standing start in 2003–04, VRQs have risen in popularity to the point that nearly 600,000 awards (at Levels 1 or 2) were made in 2009–10. Despite far fewer Basic Skills courses being available compared with VRQs (Basic Skills courses are only offered in Literacy and Numeracy), they too have risen impressively, to more than 200,000 awards in 2009–10. Although it should be noted that part of this growth might reflect the abolition of GNVQs, the growth in VRQs far outstrips the uptake of GNVQs in previous years and thus represents genuine growth in vocational qualifications.
56
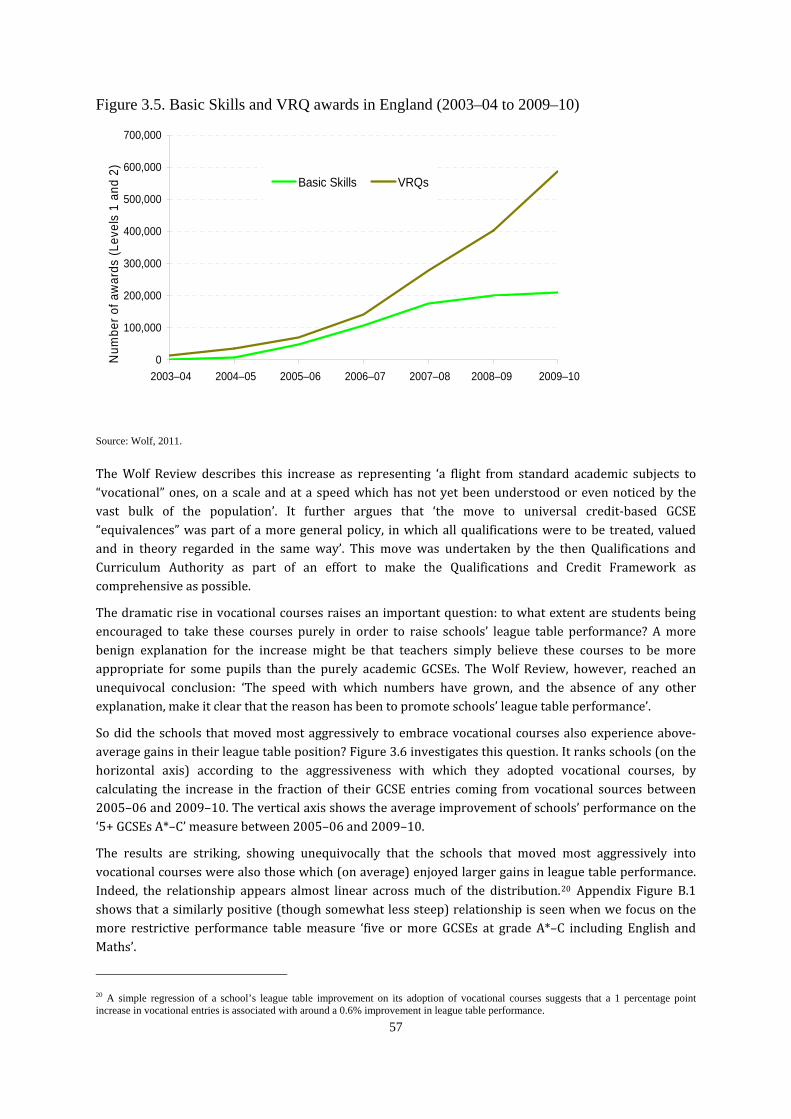
Figure 3.5. Basic Skills and VRQ awards in England (2003–04 to 2009–10)
0
100,000
200,000
300,000
400,000
500,000
600,000
700,000
2003–04 2004–05 2005–06 2006–07 2007–08 2008–09 2009–10
Num
ber o
f aw
ards
(Lev
els
1 an
d 2)
Basic Skills VRQs
Source: Wolf, 2011.
The Wolf Review describes this increase as representing ‘a flight from standard academic subjects to “vocational” ones, on a scale and at a speed which has not yet been understood or even noticed by the vast bulk of the population’. It further argues that ‘the move to universal credit‐based GCSE “equivalences” was part of a more general policy, in which all qualifications were to be treated, valued and in theory regarded in the same way’. This move was undertaken by the then Qualifications and Curriculum Authority as part of an effort to make the Qualifications and Credit Framework as comprehensive as possible.
The dramatic rise in vocational courses raises an important question: to what extent are students being encouraged to take these courses purely in order to raise schools’ league table performance? A more benign explanation for the increase might be that teachers simply believe these courses to be more appropriate for some pupils than the purely academic GCSEs. The Wolf Review, however, reached an unequivocal conclusion: ‘The speed with which numbers have grown, and the absence of any other explanation, make it clear that the reason has been to promote schools’ league table performance’.
So did the schools that moved most aggressively to embrace vocational courses also experience above‐average gains in their league table position? Figure 3.6 investigates this question. It ranks schools (on the horizontal axis) according to the aggressiveness with which they adopted vocational courses, by calculating the increase in the fraction of their GCSE entries coming from vocational sources between 2005–06 and 2009–10. The vertical axis shows the average improvement of schools’ performance on the ‘5+ GCSEs A*–C’ measure between 2005–06 and 2009–10.
The results are striking, showing unequivocally that the schools that moved most aggressively into vocational courses were also those which (on average) enjoyed larger gains in league table performance. Indeed, the relationship appears almost linear across much of the distribution.20 Appendix Figure B.1 shows that a similarly positive (though somewhat less steep) relationship is seen when we focus on the more restrictive performance table measure ‘five or more GCSEs at grade A*–C including English and Maths’.
20 A simple regression of a school’s league table improvement on its adoption of vocational courses suggests that a 1 percentage point increase in vocational entries is associated with around a 0.6% improvement in league table performance.
57
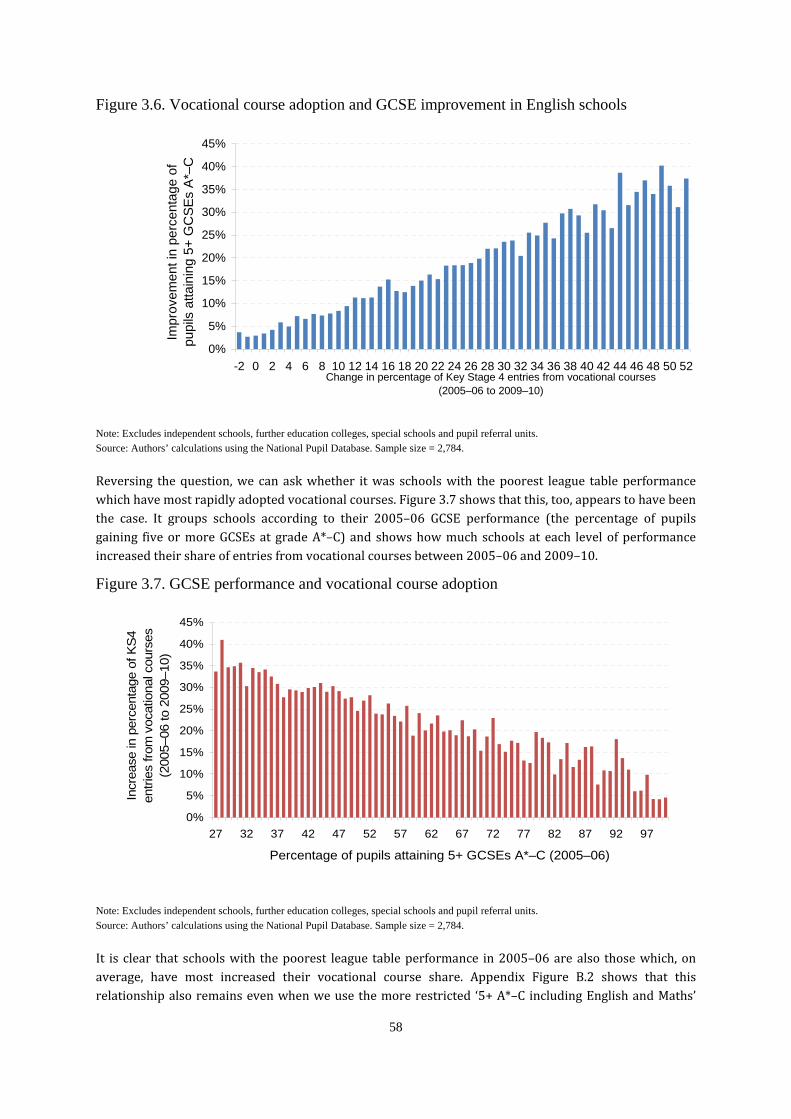
Figure 3.6. Vocational course adoption and GCSE improvement in English schools
0%
5%
10%
15%
20%
25%
30%
35%
40%
45%
-2 0 2 4 6 8 10 12 14 16 18 20 22 24 26 28 30 32 34 36 38 40 42 44 46 48 50 52Change in percentage of Key Stage 4 entries from vocational courses
(2005–06 to 2009–10)
Impr
ovem
ent i
n pe
rcen
tage
of
pupi
ls a
ttain
ing
5+ G
CSE
s A*
–C
Note: Excludes independent schools, further education colleges, special schools and pupil referral units. Source: Authors’ calculations using the National Pupil Database. Sample size = 2,784.
Reversing the question, we can ask whether it was schools with the poorest league table performance which have most rapidly adopted vocational courses. Figure 3.7 shows that this, too, appears to have been the case. It groups schools according to their 2005–06 GCSE performance (the percentage of pupils gaining five or more GCSEs at grade A*–C) and shows how much schools at each level of performance increased their share of entries from vocational courses between 2005–06 and 2009–10.
Figure 3.7. GCSE performance and vocational course adoption
0%
5%
10%
15%
20%
25%
30%
35%
40%
45%
27 32 37 42 47 52 57 62 67 72 77 82 87 92 97
Percentage of pupils attaining 5+ GCSEs A*–C (2005–06)
Incr
ease
in p
erce
ntag
e of
KS4
en
tries
from
voc
atio
nal c
ours
es(2
005–
06 to
200
9–10
)
Note: Excludes independent schools, further education colleges, special schools and pupil referral units.
58
Source: Authors’ calculations using the National Pupil Database. Sample size = 2,784.
It is clear that schools with the poorest league table performance in 2005–06 are also those which, on average, have most increased their vocational course share. Appendix Figure B.2 shows that this relationship also remains even when we use the more restricted ‘5+ A*–C including English and Maths’
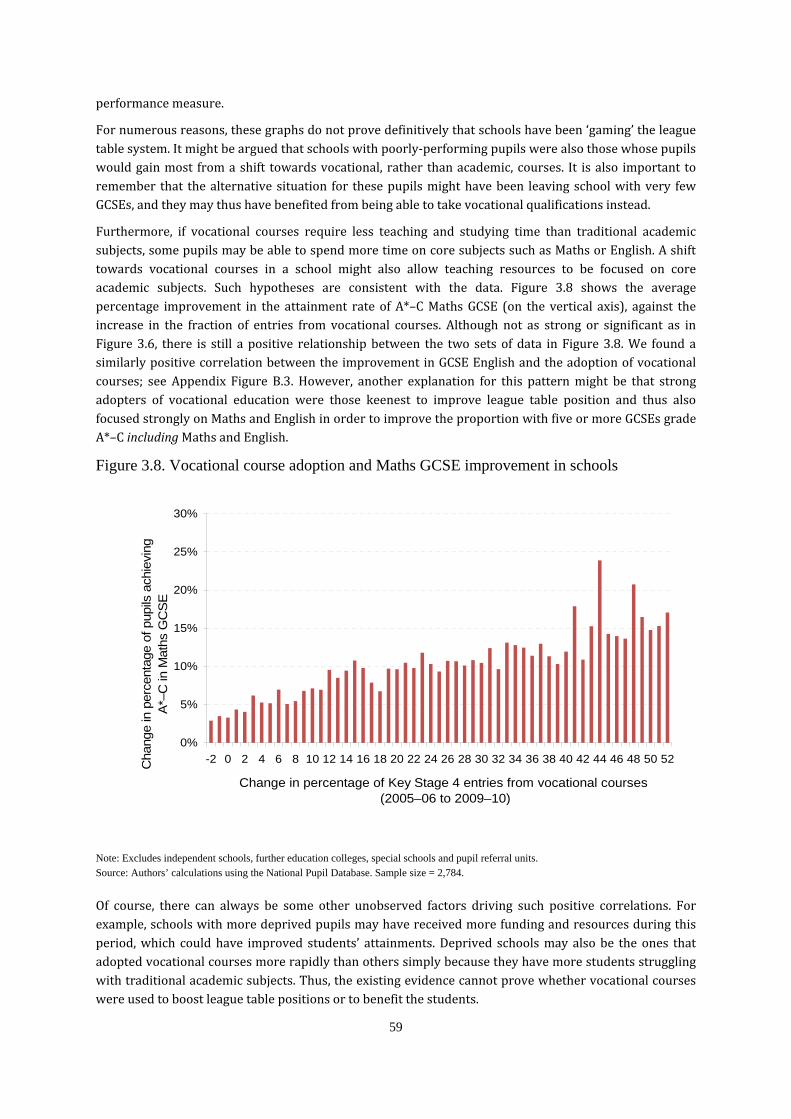
performance measure.
For numerous reasons, these graphs do not prove definitively that schools have been ‘gaming’ the league table system. It might be argued that schools with poorly‐performing pupils were also those whose pupils would gain most from a shift towards vocational, rather than academic, courses. It is also important to remember that the alternative situation for these pupils might have been leaving school with very few GCSEs, and they may thus have benefited from being able to take vocational qualifications instead.
Furthermore, if vocational courses require less teaching and studying time than traditional academic subjects, some pupils may be able to spend more time on core subjects such as Maths or English. A shift towards vocational courses in a school might also allow teaching resources to be focused on core academic subjects. Such hypotheses are consistent with the data. Figure 3.8 shows the average percentage improvement in the attainment rate of A*–C Maths GCSE (on the vertical axis), against the increase in the fraction of entries from vocational courses. Although not as strong or significant as in Figure 3.6, there is still a positive relationship between the two sets of data in Figure 3.8. We found a similarly positive correlation between the improvement in GCSE English and the adoption of vocational courses; see Appendix Figure B.3. However, another explanation for this pattern might be that strong adopters of vocational education were those keenest to improve league table position and thus also focused strongly on Maths and English in order to improve the proportion with five or more GCSEs grade A*–C including Maths and English.
Figure 3.8. Vocational course adoption and Maths GCSE improvement in schools
0%
5%
10%
15%
20%
25%
30%
-2 0 2 4 6 8 10 12 14 16 18 20 22 24 26 28 30 32 34 36 38 40 42 44 46 48 50 52
Change in percentage of Key Stage 4 entries from vocational courses (2005–06 to 2009–10)
Cha
nge
in p
erce
ntag
e of
pup
ils a
chie
ving
A*
–C in
Mat
hs G
CSE
Note: Excludes independent schools, further education colleges, special schools and pupil referral units.
59
Source: Authors’ calculations using the National Pupil Database. Sample size = 2,784.
Of course, there can always be some other unobserved factors driving such positive correlations. For example, schools with more deprived pupils may have received more funding and resources during this period, which could have improved students’ attainments. Deprived schools may also be the ones that adopted vocational courses more rapidly than others simply because they have more students struggling with traditional academic subjects. Thus, the existing evidence cannot prove whether vocational courses were used to boost league table positions or to benefit the students.
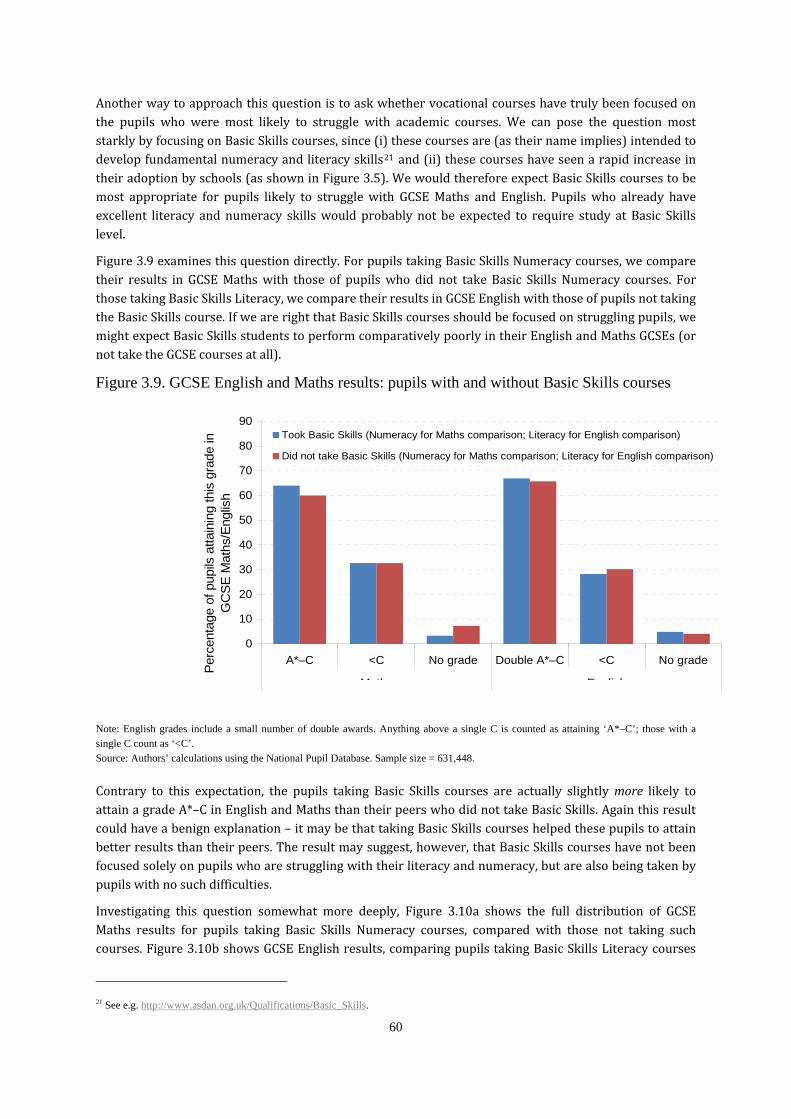
Another way to approach this question is to ask whether vocational courses have truly been focused on the pupils who were most likely to struggle with academic courses. We can pose the question most starkly by focusing on Basic Skills courses, since (i) these courses are (as their name implies) intended to develop fundamental numeracy and literacy skills21 and (ii) these courses have seen a rapid increase in their adoption by schools (as shown in Figure 3.5). We would therefore expect Basic Skills courses to be most appropriate for pupils likely to struggle with GCSE Maths and English. Pupils who already have excellent literacy and numeracy skills would probably not be expected to require study at Basic Skills level.
Figure 3.9 examines this question directly. For pupils taking Basic Skills Numeracy courses, we compare their results in GCSE Maths with those of pupils who did not take Basic Skills Numeracy courses. For those taking Basic Skills Literacy, we compare their results in GCSE English with those of pupils not taking the Basic Skills course. If we are right that Basic Skills courses should be focused on struggling pupils, we might expect Basic Skills students to perform comparatively poorly in their English and Maths GCSEs (or not take the GCSE courses at all).
Figure 3.9. GCSE English and Maths results: pupils with and without Basic Skills courses
0
10
20
30
40
50
60
70
80
90
A*–C <C No grade Double A*–C <C No grade
M th E li h
Per
cent
age
of p
upils
atta
inin
g th
is g
rade
in
GC
SE M
aths
/Eng
lish
Took Basic Skills (Numeracy for Maths comparison; Literacy for English comparison)
Did not take Basic Skills (Numeracy for Maths comparison; Literacy for English comparison)
Note: English grades include a small number of double awards. Anything above a single C is counted as attaining ‘A*–C’; those with a single C count as ‘<C’. Source: Authors’ calculations using the National Pupil Database. ple size = 631,448.
Contrary to this expectation, the pupils taking Basic Skills courses are actually slightly more likely to attain a grade A*–C in English and Maths than their peers who did not take Basic Skills. Again this result could have a benign explanation – it may be that taking Basic Skills courses helped these pupils to attain better results than their peers. The result may suggest, however, that Basic Skills courses have not been focused solely on pupils who are struggling with their literacy and numeracy, but are also being taken by
Sam
pupils with no such difficulties.
Investigating this question somewhat more deeply, Figure 3.10a shows the full distribution of GCSE Maths results for pupils taking Basic Skills Numeracy courses, compared with those not taking such
English results, comparing pupils taking Basic Skills Literacy courses courses. Figure 3.10b shows GCSE
21 See e.g. http://www.asdan.org.uk/Qualifications/Basic_Skills.
60

with their peers who do not. We see that over 10% of the pupils taking Basic Skills courses actually attain A* or A in the corresponding GCSE, suggesting that they are unlikely to have needed extra help with their literacy or numeracy. For these pupils, their presence in Basic Skills courses seems (at best) anomalous.
Figure 3.10a. Full GCSE Maths results: pupils with and without Basic Skills courses
0
5
10
15
20
25
30
35
40
A* A B C D E F G U NogradeGCSE Maths grade
Perc
enta
ge o
f pup
ils a
ttain
ing
this
gr
ade
in G
CSE
Mat
hsTook Basic Skills (Numeracy) Did not take Basic Skills (Numeracy)
Figure 3.10b. Full GCSE English results: pupils with and without Basic Skills courses
0
5
10
15
20
25
30
35
40
A* A B C D E F G U NogradeGCSE English grade
Perc
enta
ge o
f pup
ils a
ttain
ing
this
gr
ade
in G
CSE
Eng
lish
Took Basic Skills (Literacy) Did not take Basic Skills (Literacy)
Note: English grades include (very few) pupils taking double awards, with the lowest grade counted for the purposes of this graph.
61
Source: Authors’ calculations using the National Pupil Database. Sample size = 631,448.
It is true, however, that pupils taking Basic Skills courses are less likely to attain A* and A grades than their peers who do not take such courses. Instead, Basic Skills students’ results show a clear spike at grade C (for both English and Maths), with Basic Skills students substantially more likely to get a grade C at GCSE than their peers who do not take such courses. One possibility, therefore, is that some schools are focusing their Basic Skills courses on the ‘marginal’ pupils on the cusp of gaining a C at GCSE. This focus on pupils at the C/D boundary might itself be an artefact of the GCSE performance tables, which encourage schools to push pupils ‘over the boundary’ to count towards the A*–C performance measures.
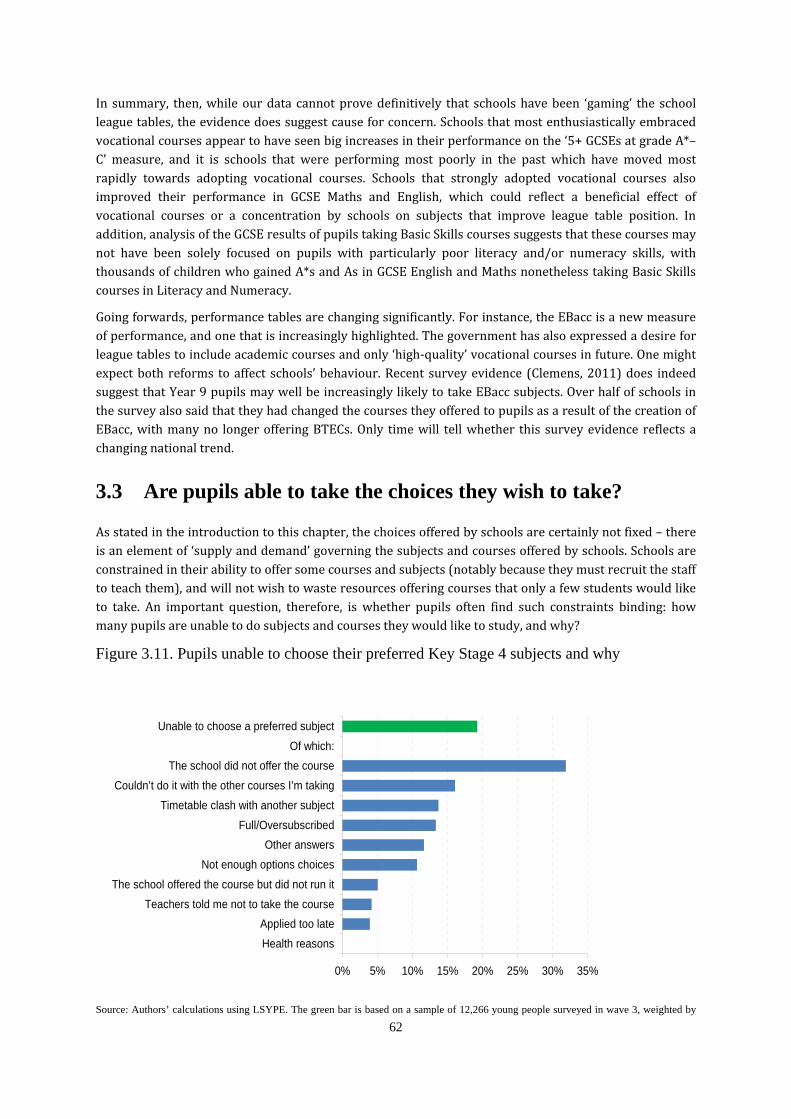
In summary, then, while our data cannot prove definitively that schools have been ‘gaming’ the school league tables, the evidence does suggest cause for concern. Schools that most enthusiastically embraced vocational courses appear to have seen big increases in their performance on the ‘5+ GCSEs at grade A*–C’ measure, and it is schools that were performing most poorly in the past which have moved most rapidly towards adopting vocational courses. Schools that strongly adopted vocational courses also improved their performance in GCSE Maths and English, which could reflect a beneficial effect of vocational courses or a concentration by schools on subjects that improve league table position. In addition, analysis of the GCSE results of pupils taking Basic Skills courses suggests that these courses may not have been solely focused on pupils with particularly poor literacy and/or numeracy skills, with thousands of children who gained A*s and As in GCSE English and Maths nonetheless taking Basic Skills courses in Literacy and Numeracy.
Going forwards, performance tables are changing significantly. For instance, the EBacc is a new measure of performance, and one that is increasingly highlighted. The government has also expressed a desire for league tables to include academic courses and only ‘high‐quality’ vocational courses in future. One might expect both reforms to affect schools’ behaviour. Recent survey evidence (Clemens, 2011) does indeed suggest that Year 9 pupils may well be increasingly likely to take EBacc subjects. Over half of schools in the survey also said that they had changed the courses they offered to pupils as a result of the creation of EBacc, with many no longer offering BTECs. Only time will tell whether this survey evidence reflects a changing national trend.
3.3 Are pupils able to take the choices they wish to take?
As stated in the introduction to this chapter, the choices offered by schools are certainly not fixed – there is an element of ‘supply and demand’ governing the subjects and courses offered by schools. Schools are constrained in their ability to offer some courses and subjects (notably because they must recruit the staff to teach them), and will not wish to waste resources offering courses that only a few students would like to take. An important question, therefore, is whether pupils often find such constraints binding: how many pupils are unable to do subjects and courses they would like to study, and why?
Figure 3.11. Pupils unable to choose their preferred Key Stage 4 subjects and why
62
0% 5% 10% 15% 20% 25% 30% 35%
Health reasonsApplied too late
Teachers told me not to take the courseThe school offered the course but did not run it
Not enough options choicesOther answers
Full/OversubscribedTimetable clash with another subject
Couldn’t do it with the other courses I’m takingThe school did not offer the course
Of which:Unable to choose a preferred subject
Source: Authors’ calculations using LSYPE. The green bar is based on a sample of 12,266 young people surveyed in wave 3, weighted by
63
the wave 3 cross-sectional weight. The blue bars are based on the group of 2,419 individuals who were unable to choose a preferred subject, weighted by the wave 3 cross-sectional weight.
We investigate this issue using data from the Longitudinal Study of Young People in England (LSYPE). Figure 3.11 shows that 19% of pupils were unable to take subjects they would like to study at Key Stage 4 (as reported in Year 10 in 2004–05). Of those who were unable to study particular subjects, about 14% were unable to take these subjects due to timetable clashes, while 16% were unable to do so because they could not combine particular subjects and 13% because the course was full (suggesting that resource constraints play a significant role). In all these cases, schools clearly offer the subject or course, but for various reasons pupils were unable to do these subjects. In roughly a third of cases, however, pupils were unable to take a subject because the school simply did not offer the course.
In the case of pupils unable to take subjects even though they were offered by the school, the major obstacle appears to be organisational. With a fixed number of subject teachers and classrooms, there will always be some pupils who are unable to take particular subjects. It is difficult to tell whether schools’ current practices with regards to timetabling, curriculum management and recruitment minimise the number of disappointed pupils. It is certainly possible that schools attempt to manage demand (and minimise timetable clashes) by tailoring the manner in which choices are presented to pupils – perhaps by presenting choices in ‘blocks’ rather than simply open lists from which pupils are free to choose. It is to this issue of the ‘framing’ of course and subject choices that we turn in Section 3.5. Before that, we look at the courses and subjects that schools and colleges offer 16‐ to 18‐year‐olds.
3.4 Post-16 course and subject offers
Having looked in detail at the courses and subjects offered to Key Stage 4 pupils, we now do the same for post‐16 options. We should note at the outset that radical reforms are planned to the education of individuals aged 16 to 18, with the education leaving age gradually increasing from 16 to 18 from 2013 onwards, so that far more pupils will be required to stay in full‐time or part‐time education.
We showed in Chapter 1 that A Levels and AS Levels in academic subjects are by far the most commonly‐offered post‐16 qualifications in England, available at around 97% of schools and colleges. Among the more vocationally‐oriented subjects, Applied A Levels and AS Levels are the most popular, being offered by around 60% of institutions, followed by BTECs, offered by over 50% of institutions.
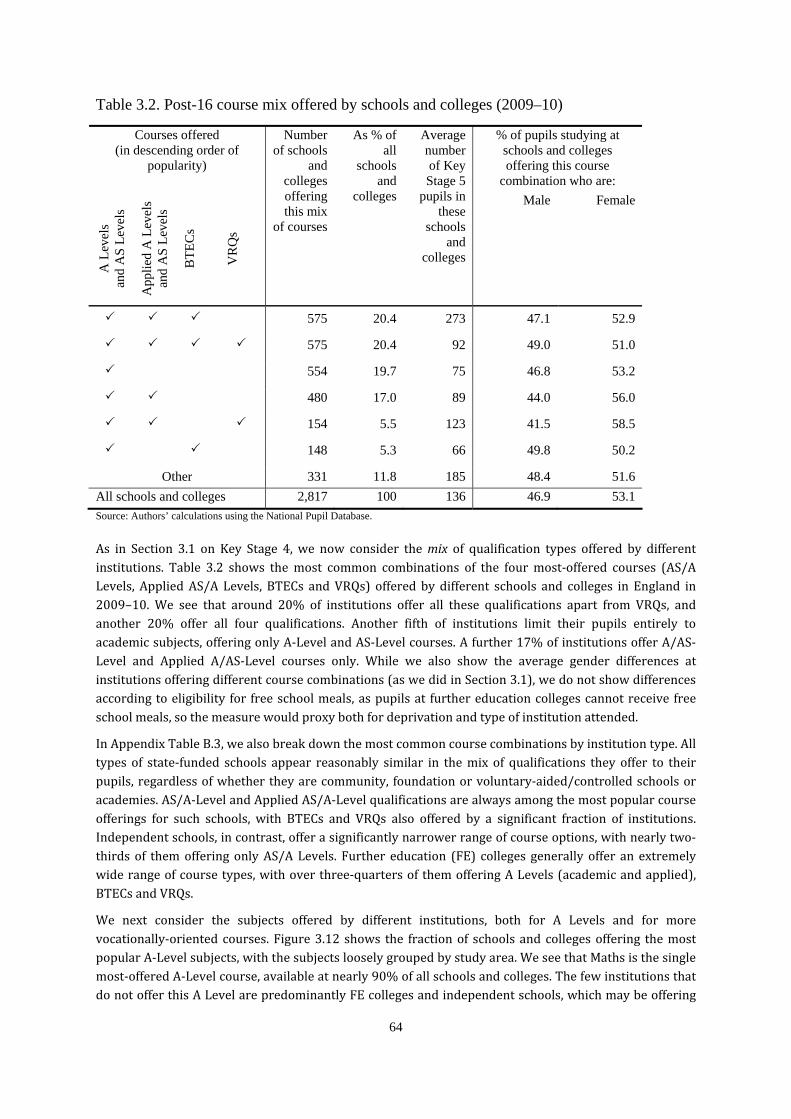
64
Table 3.2. Post-16 course mix offered by schools and colleges (2009–10)
Courses offered Number As % of Average % of pupils studying at (in descending order of of schools all number schools and colleges
popularity) and schools of Key offering this course colleges and Stage 5 combination who are:
s offering colleges pupils in Male Female ls
A L
evel ls this mix these
ls ve ve of courses schools
veLe
Le
Le
BTE
Cs
VR
Qs
and
A
and
AS
App
lied
and
AS colleges
575 20.4 273 47.1 52.9
575 20.4 92 49.0 51.0
554 19.7 75 46.8 53.2
480 17.0 89 44.0 56.0
154 5.5 123 41.5 58.5
148 5.3 66 49.8 50.2
Other 331 11.8 185 48.4 51.6 All schools and colleges 2,817 100 136 46.9 53.1 Source: Authors’ calculations using the National Pupil Database.
As in Section 3.1 on Key Stage 4, we now consider the mix of qualification types offered by different institutions. Table 3.2 shows the most common combinations of the four most‐offered courses (AS/A Levels, Applied AS/A Levels, BTECs and VRQs) offered by different schools and colleges in England in 2009–10. We see that around 20% of institutions offer all these qualifications apart from VRQs, and another 20% offer all four qualifications. Another fifth of institutions limit their pupils entirely to academic subjects, offering only A‐Level and AS‐Level courses. A further 17% of institutions offer A/AS‐Level and Applied A/AS‐Level courses only. While we also show the average gender differences at institutions offering different course combinations (as we did in Section 3.1), we do not show differences according to eligibility for free school meals, as pupils at further education colleges cannot receive free school meals, so the measure would proxy both for deprivation and type of institution attended.
In Appendix Table B.3, we also break down the most common course combinations by institution type. All types of state‐funded schools appear reasonably similar in the mix of qualifications they offer to their pupils, regardless of whether they are community, foundation or voluntary‐aided/controlled schools or academies. AS/A‐Level and Applied AS/A‐Level qualifications are always among the most popular course offerings for such schools, with BTECs and VRQs also offered by a significant fraction of institutions. Independent schools, in contrast, offer a significantly narrower range of course options, with nearly two‐thirds of them offering only AS/A Levels. Further education (FE) colleges generally offer an extremely wide range of course types, with over three‐quarters of them offering A Levels (academic and applied), BTECs and VRQs.
We next consider the subjects offered by different institutions, both for A Levels and for more vocationally‐oriented courses. Figure 3.12 shows the fraction of schools and colleges offering the most popular A‐Level subjects, with the subjects loosely grouped by study area. We see that Maths is the single most‐offered A‐Level course, available at nearly 90% of all schools and colleges. The few institutions that do not offer this A Level are predominantly FE colleges and independent schools, which may be offering
65
alternat es (such as the International Baccalaureate).
English Literature is a widely‐offered A‐Level subject, available at 84% of schools and colleges, with independent schools and FE colleges again making up the majority of institutions not offering this course. The English Language course is far less widely offered, available at only a third of institutions. Among the sciences, we see a similar pattern to that observed among the individual GCSE science subjects, with Biology the most widely‐offered science (available at 86% of schools), followed by Chemistry (83%) and Physics (79%). Psychology A Level is also a particularly commonly‐offered subject, available at over three‐quarters of all institutions. Among the humanities, History is the most widely‐offered A Level, available at 85% of institutions, followed by Geography, available at 77%. Modern foreign language A Levels are offered at 78% of institutions, with French the most widely available, being offered at 65% of
ive rout
schools and colleges.
Figure 3.13 offers a similar breakdown for the most popular vocational subjects, showing the three most popular subjects for each course type. We see that Information and Computer Technology (ICT) is the most widely‐offered subject among Applied A‐ and AS‐Level courses, being available at over 40% of all institutions (at AS Level). Applied Business is the next most commonly‐offered course among the Applied GCE courses, followed by Health & Social Care.
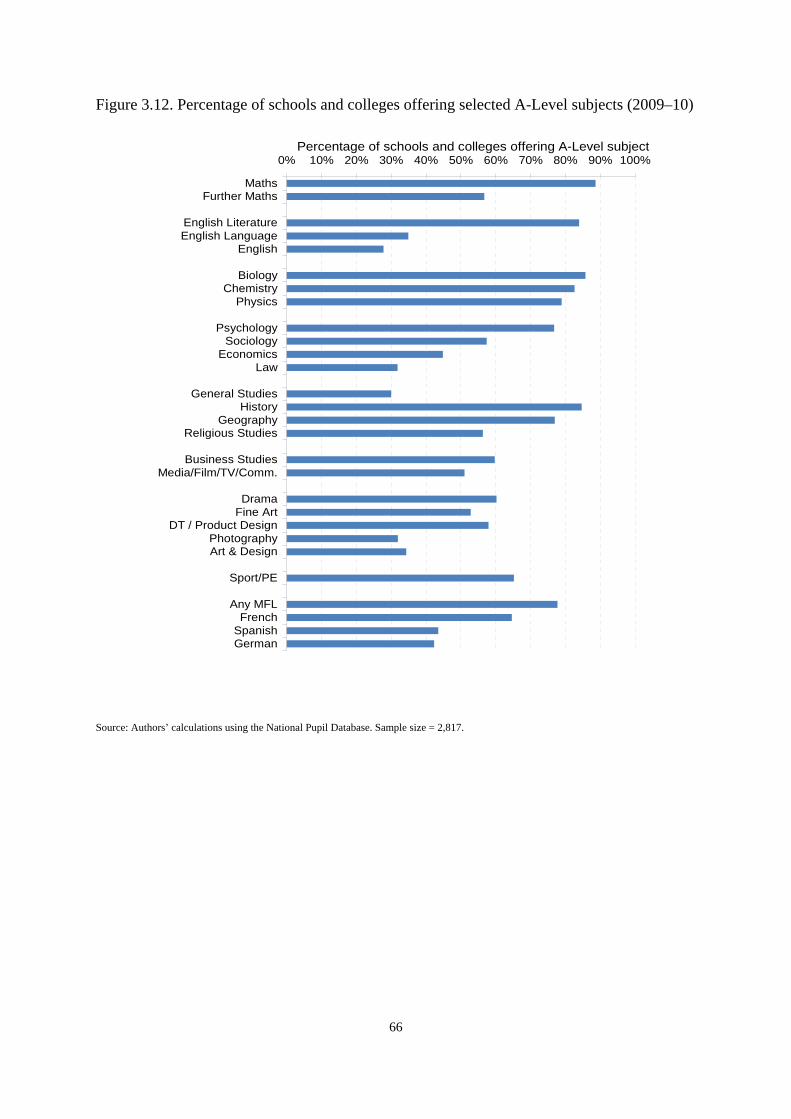
Figure 3.12. Percentage of schools and colleges offering selected A-Level subjects (2009–10)
0% 10% 20% 30% 40% 50% 60% 70% 80% 90% 100%
MathsFurther Maths
English LiteratureEnglish Language
English
BiologyChemistry
Physics
PsychologySociology
EconomicsLaw
General StudiesHistory
GeographyReligious Studies
Business StudiesMedia/Film/TV/Comm.
DramaFine Art
DT / Product DesignPhotographyArt & Design
Sport/PE
Any MFLFrench
SpanishGerman
Percentage of schools and colleges offering A-Level subject
Source: Authors’ calculations using the National Pupil Database. Sample size = 2,817.
66
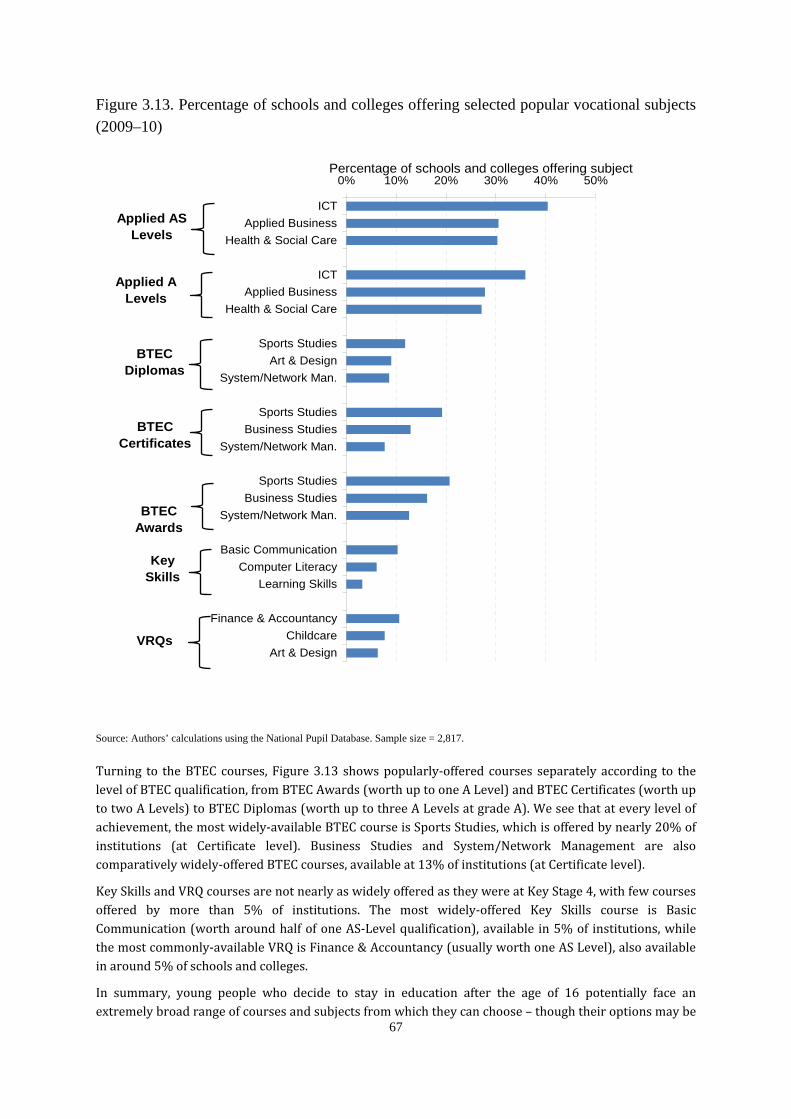
Figure 3.13. Percentage of schools and colleges offering selected popular vocational subjects (2009–10)
0% 10% 20% 30% 40% 50%
ICTApplied Business
Health & Social Care
ICTApplied Business
Health & Social Care
Sports StudiesArt & Design
System/Network Man.
Sports StudiesBusiness Studies
System/Network Man.
Sports StudiesBusiness Studies
System/Network Man.
Basic CommunicationComputer Literacy
Learning Skills
Finance & AccountancyChildcare
Art & Design
Percentage of schools and colleges offering subject
Applied AS Levels
Applied A Levels
BTEC Diplomas
BTEC Certificates
BTEC Awards
KeySkills
VRQs
Source: Authors’ calculations using the National Pupil Database. Sample size = 2,817.
Turning to the BTEC courses, Figure 3.13 shows popularly‐offered courses separately according to the level of BTEC qualification, from BTEC Awards (worth up to one A Level) and BTEC Certificates (worth up to two A Levels) to BTEC Diplomas (worth up to three A Levels at grade A). We see that at every level of achievement, the most widely‐available BTEC course is Sports Studies, which is offered by nearly 20% of institutions (at Certificate level). Business Studies and System/Network Management are also comparatively widely‐offered BTEC courses, available at 13% of institutions (at Certificate level).
Key Skills and VRQ courses are not nearly as widely offered as they were at Key Stage 4, with few courses offered by more than 5% of institutions. The most widely‐offered Key Skills course is Basic Communication (worth around half of one AS‐Level qualification), available in 5% of institutions, while the most commonly‐available VRQ is Finance & Accountancy (usually worth one AS Level), also available
67
in around 5% of schools and colleges.
In summary, young people who decide to stay in education after the age of 16 potentially face an extremely broad range of courses and subjects from which they can choose – though their options may be
68
In this chapter, we have considered the role of schools in shaping pupils’ subject and course choices. We
substantially limited depending on the type of institution they attend. Among the qualifications on offer, A Levels and AS Levels remain by far the most widely offered, with Maths, Biology, English Literature and History among the most widely‐offered subjects. Vocational and applied subjects are less widely offered than at Key Stage 4, with Applied AS/A Levels in ICT, Applied Business Studies and Health & Social Care being the most widely‐available courses.
3.5 Framing effects
In Chapter 2, we discussed some of the evidence relating to framing effects – the regularly‐observed phenomenon that the manner in which choices are presented (‘framed’) can affect individuals’ decisions, even if the underlying nature of a choice is unchanged. If young people are subject to framing and context effects, then the way schools present choices to young people could ultimately affect their eventual choices. For instance, the use of any default subjects, courses or combinations by schools would seem likely to bias young people’s eventual choices towards such defaults, e.g. whichever science option is the
t tdefault. A very long list of choices could also lead to a different set of choices from hat with a shor list.
It is therefore natural to wonder how schools go about presenting subject and course choices to their pupils (since they are free to present these choices however they wish), and how this affects the choices pupils eventually make. Unfortunately, our ability to investigate this issue is severely constrained: at present, there is no centralised database containing information regarding the manner in which pupils in different schools had their course and subject choices presented to them.
The best available existing evidence comes from Blenkinsop et al. (2006), who surveyed a small number of schools and found three broad systems in use. First, some schools operate a ‘block system’, with pupils asked to choose a fixed number of subjects from groups of subjects (e.g. ‘choose 1 subject from each of blocks A to D). Second, some schools operate open list systems whereby pupils are asked to pick options from a full list of all potential options. Third, there is a ‘pathways system’ where pupils are presented with different options depending on their prior attainment. For instance, pupils with high prior attainment might be offered blocks of mainly academic subjects, whilst those with low prior academic attainment might be more restricted in their options or directed towards vocational options. By and large, Blenkinsop et al. found that the pathways system was the most common system used by schools in the 14 schools they sampled.
There is also substantial variation in the post‐16 options offered by schools, sixth‐form colleges and further education colleges. As we have already seen, some institutions offer only AS/A Levels in academic subjects, while others offer a broad array of courses, from Applied AS/A Levels and BTECs to Key Skills courses and VRQs. In terms of how they present such options, schools and colleges will usually produce some form of prospectus for the next academic year, listing the qualifications and subjects available in blocks or as open lists. Lists of qualifications and subjects are also frequently given for wide geographical areas, reflecting the fact that post‐16 choices entail a simultaneous decision about what young people
dwould like to stu y and where.
Framing effects could be important and they deserve further study, which could be easily achieved through the use of experiments to determine the impact of these effects on young people’s choices (as set out in Chapter 2). However, in the absence of further data and such experiments, there is little more one can say in this regard.
3.6 Summary
69
have seen that at both Key Stages 4 and 5, pupils may potentially choose from a wide array of courses and subjects, but that the type of school they attend may substantially limit these choices. There is a strong degree of differentiation in secondary schools, with some offering a large range of academic and vocational course types, while others focus solely on academic courses.
With schools facing a substantial degree of pressure with regard to the annually‐published league tables, we have shown some suggestive evidence that schools may have been ‘gaming’ the system by moving aggressively into vocational subjects with comparatively generous GCSE equivalencies. Schools performing comparatively poorly on the raw ‘five or more GCSEs at grade A*–C’ measure appear to have moved most rapidly towards vocational courses, and the schools that were swiftest to adopt vocational courses appear to have made the most substantial gains in their ‘5+ A*–C’ performance. We have also shown that one particular type of vocational course – Basic Skills in Literacy and Numeracy – does not appear to have been exclusively focused on pupils with fundamental difficulties with English and Maths. Thousands of pupils taking these courses gain A*s and As in their English and Maths GCSEs. However, these figures do not prove definitively that schools have been ‘gaming’ the league table system. It might be argued that schools with poorly‐performing pupils were also those whose pupils would gain most from a shift towards vocational, rather than academic, courses. It is also important to remember that the alternative situation for these pupils might have been leaving school with very few GCSEs, and they may
avethus h benefited from being able to take vocational qualifications instead.
Going forwards, the creation of the EBacc and the government’s desire to include only ‘high‐quality’ vocational courses in performance tables may well change schools’ behaviour. Recent survey evidence does indeed suggest that Year 9 pupils may well be increasingly likely to take EBacc subjects. Over half of schools in the survey also said that they had changed the courses they offered to pupils as a result of the creation of EBacc, with many no longer offering BTECs. Only time will tell whether this survey evidence reflects a changing national trend.
Evidence from the 2005–06 LSYPE suggests that for up to a fifth of England’s students, there was at least one course or subject that they wished to study that they were unable to choose – most often because the school simply did not offer the course in question, or because of timetable clashes. For many pupils, therefore, school resources appear to be a binding constraint, preventing them from pursuing some of the courses they would like to take.
Finally, it seems reasonable to assume that the manner in which schools present course choices to their students is likely to be a significant determinant of pupils’ ultimate choices. However, without adequate data recording the ways in which schools frame their course options, we are currently unable to investigate this issue further.
70
4. Multivariate analysis of subject choices In previous chapters of this report, we have sought to describe the courses and subjects currently chosen by young people, to shed light on the cognitive mechanisms by which they might make their subject and course choices, and to describe the role of schools in shaping these decisions. In this chapter, we attempt to establish the relative importance of different factors for young people’s actual choices – or at least to establish the factors associated with different course and subject choices. We ask whether the strong differences in choices by gender and family income, observed in earlier chapters, can be explained by other individual factors. For example, are pupils from poorer families less likely to do triple science at GCSE due to differences in prior attainment, differences in school characteristics or pure subject likes/dislikes? Such multivariate analysis does not allow us to isolate truly causal effects on young people’s course and subject choices, but they nonetheless provide a richer set of information than the simple descriptive statistics often used when discussing these issues.
To answer these questions, we examine the decisions made by young people in the Longitudinal Study of Young People in England (LSYPE). This survey followed about 13,500 young people who started their Key Stage 4 studies in 2004–05 and finished their compulsory schooling in Summer 2006.22 Although this is not quite the most recent cohort of young people to have passed through the system, the LSYPE presents a uniquely rich set of factors associated with different subject and course choices, and many (self‐reported) aspects of young people’s experience of choosing their courses.
4.1 Outcomes and factors
We focus our attention on a particular set of important Key Stage 4 and post‐16 choices. In particular, we exam of choosing the following Key Stage 4 options: ine the determinants
• triple science at GCSE; • lish Baccalaureate (though this benchmark did not exist at the time
s); the subjects comprising the Engthese students made their choice
• any vocational GCSEs or GNVQs.
Encouraging students to take more Science, Technology and Maths (STEM) subjects has long been a priority of governments, while the English Baccalaureate (EBacc) is a rather newer policy focus, introduced by the current government. In both cases, we hope that our results will cast some light on the
cdrivers (and barriers) to taking these subjects among a previous ohort of students.
In addition to the analysis presented in this chapter, we have examined the determinants of choosing each of the optional components of the EBacc – namely, double or triple science, Geography or History, and at least one foreign language. Findings on these individual components are presented in Appendix C. However, as noted above, it should be borne in mind that the English Baccalaureate was not in existence
ople maat the time this set of young pe de their subject choices.
Having considered Key Stage 4 choices, we then move on to consider post‐16 choices, examining the determinants of choosing to stay on in full‐time education, and the particular qualification routes chosen by those who do stay on. In particular, we examine the determinants of choosing to study:
22 Due to survey non-response, the sample size dropped to about 11,000 in their Year 12 (the first year after compulsory schooling) and to about 10,000 in their Year 13.
71
whether student has achieved A*–C CSE; whether student has achieved at lea t five GCSEs at g ade A*–C;
• whether student has taken triple science, double science, a modern foreign language (MFL), a
• any A/AS Levels in Year 13; • any vocational qualifications in Year 13.
In each case, we use multivariate regression analysis to examine the relative importance of a number of different pupil, family and school factors. In particular, we begin by establishing the relative importance of a number of pupil and family characteristics that can be considered fixed or predetermined with resp hool subject and course choices. These are: ect to sc
• gender;
• • child ethnicity;
• not having English as a first language (‘English as an additional language’);
g Special Educational Needs (SEN); • across the first three waves of LSYPE);
ever having been classified as havinquintiles of family income (averaged
• parents’ educational qualifications.
We tors at this stage, though do not focus on the results in detail: also control for the following fac
• whether parents are in work;
• ; • parents’ ages;
lone‐parent families (mother or father)• number of younger and older siblings.
Following this stage, we then examine the role of additional factors and whether they can to some extent ‘explain’ these patterns of subject and course choices according to child and family characteristics. We begin by considering the role of schoollevel factors:
• average school intake and quality (average Key Stage 2 attainment, and value added from Key Stage 2
• to Key Stage 4); school type (community, city technology college, foundation, voluntary‐aided, voluntary‐controlled);
• l type indicators (special school, grammar school, whether it has a sixth form, single‐sex other schoo
• school);
• school size;
• proportion of pupils eligible for free school meals (FSM);
• proportion of pupils with English as an additional language; proportion of pupils who are from a White ethnic background;
• whether pupil thinks most of their friends will stay on at school after age 16.
Where there is variation in the availability of particular subjects and courses (specifically, availability of triple science and the English Baccalaureate), we also consider the effects of only focusing on pupils who
o bjects or the combin had the option of ch osing these su ation of these subjects.
We then consider the effects of prior attainment. For regressions of Key Stage 4 choices, prior attainment is measured as:
• Key Stage 2 scores in English, Maths and Science, by quintiles in each exam; • Key Stage 3 scores in English, Maths and Science, by quintiles in each exam.
For ly, we use the following measures of prior attainment instead: regressions of Key Stage 5 outcomes on
• total score at Key Stage 4, by quintiles;
• • whether student has achieved A*–C in English GCSE;
in Maths G• s r
72
humanity and any vocational subjects at Key Stage 4.
Finally, we control for a group of factors relating to young people’s attitudes and preferences (which also include measures of material resources and outside tutoring). In particular, we look at the following factors:
• whether young person expects to stay in full‐time education after Year 11; whether parents would like them to stay in full‐time educati after Year 11;
• y (only asked of pupils who • on
whether young person considers they are likely to apply to universitachieved at least five GCSEs at grade A*–C);
• niversity; whether young person thinks they will get in if they apply to u
• s;
• whether parents think they are likely to go to university;
lementary lesson•
whether young person has private or supp
• whether young person has computer and internet at home; most and least favourite subject in Year 9;
• subjects, such as being interested in the reasons young person reports for choosing their Year 10subject;
• whom young person talks to for advice on subject choices.
4.2 Regression findings
We now go through each of the subject and course choices in turn, discussing the pupil and family characteristics associated with these choices and how this pattern is affected by controlling for school characteristics, whether the particular option was offered by the school, the pupil’s prior attainment and finally the wider set of factors. The full results are available in Appendix C; here we discuss the key results. Throughout, we weight by the appropriate cross‐sectional sampling weights made available with the LSYPE data.
It is important to note that the relationships we estimate are unlikely to be causal, particularly with regard to young people’s preferences and aspirations. For our estimates to be the causal impact of these factors, we would have to argue (among other things) that there are no unobserved characteristics of the child or family that influence the likelihood of studying particular subjects that are also correlated with those we do observe (such as aspirations and preferences). This is unlikely to be true in practice. However, whilst our work cannot robustly establish the presence of direct causal links between these factors, we are fortunate to have an extremely rich data set at our disposal. This allows us to observe in great detail a wide range of child and family characteristics associated with different subject and course courses, and how these associations change as we condition on school characteristics, prior attainment and young people’s attitudes and preferences.
4.2.1 Triple science
The first choice we examine is the decision to study triple science at GCSE. In our weighted sample, just 9.3% of pupils took triple science at GCSE. However, about 62% of pupils were in schools that did not offer triple science (or, more precisely, in schools where no pupil took triple science), which explains about two‐thirds of all the pupils that did not take triple science. We therefore first examine what types of schools did offer triple science and what kind of pupils went to such schools.
We also note that some types of pupils are more likely to go to schools that offer triple science, conditional on all the school factors we can observe. For example, boys are more likely than girls to have access to triple science, and children in the highest quintile of Key Stage 3 Maths scores are more likely than others to have access to it.
73
these were the equivalent choice
We then restrict the sample to pupils with access to triple science for the following analysis. In the first regression, we only control for pupil and family characteristics, before controlling for further sets of characteristics to see how these patterns change (see Appendix Table C.1 for full results). This reveals the following differences in terms of the types of pupils who are more or less likely to study triple science at GCSE (holdin g other factors constant):
• Gender – Boys are about 9 percentage points more likely than girls to study triple science. This difference is slightly reduced when we control for school characteristics, and then again by controlling for prior attainment. It is further slightly reduced when we account for differences in young people’s attitudes and preferences.
• Ethnicity – Children from Black African and Black Caribbean backgrounds are significantly less likely to study triple science than White children when we only control for child and family characteristics, by about 14 percentage points in the case of Black African children. These differences are both reduced when we control for school characteristics, with the difference for Black Caribbean children beco im ng insignificant. The difference for Black African children then becomes insignificant when we control for prior attainment.
• SEN – Children who have ever had Special Educational Needs are about 9 percentage points less likely to study triple science when we only control for child and family characteristics. This difference is almost halved as we control for school characteristics. However, when we control for prior attainment, child er n who have had a Special Educational Need actually become more likely to study triple science.
• Family income – Children from richer families are significantly more likely to study triple science when controlling for child and family characteristics, children from the richest fifth of families being about 5 percentage points more likely to do so than children from the poorest fifth (note that this is only statistically significant at the 10% level). This difference becomes insignificant when we control for school characteristics. Children from richer families actually become slightly less likely to study triple science when we control for wider factors (these differences are only statistically significant at the 10% level and on y
tly rel for the third and fifth quintiles). The differences according to family income
thus mos flect differences in the types of school these children attend. • Parental education – Children whose parents have higher‐level educational qualifications are more
likely to study triple science controlling for child and family characteristics, e.g. children whose mother has a degree are 17 percentage points more likely to study triple science than those whose mothers have no qualifications. For both mother’s and father’s qualifications, these differences are reduced when controlling for school characteristics, and the differences become insignificant when controlling for prior attainment. The association with mother’s education generally appears stronger than that with father’s education.
In terms of the patterns of significance of wider factors, we observe that children who study triple science are, unsurprisingly, less likely to dislike Science and more likely to like Maths. However, they are also more likely to like modern foreign languages and History, which may reflect an underlying preference for ‘academic’ subjects.
4.2.2 English Baccalaureate
We now look at the determinants of taking the combination of GCSEs that qualify for the new English Baccalaureate. That is, we consider the GCSE combination of Maths, English, a humanity, a modern foreign language,23 and double or triple science (science GCSEs have since been reformed – see Chapter 1 – but
s available to LSYPE students). Although the EBacc has only recently
23 Although the language component in the EBacc can be ancient as well as modern, we focus on modern foreign languages because we cannot observe whether a person has taken ancient Greek or Latin.
74
remains significant.
been created, these results are still likely to be informative regarding the types of pupils who did (and did not) take EBacc qualifying subjects even before this policy was announced.
About 31% of our LSYPE sample took the combination of EBacc GCSEs in 2005‐06, which compares with 22% of pupils in 2009‐10 (the most recent cohort for which data is available24). About 5% of pupils in LSYPE were in schools that did not offer one or more of the subjects necessary to attain the EBacc. However, such schools account for only 8% of those who did not take EBacc GCSEs. Our first regression examines the determinants of being in a school that offers EBacc GCSEs. Most such schools are community schools, while our regression reveals that city technology colleges are less likely to offer EBacc subjects conditional on other factors. Also, small schools, and schools with higher proportions of pupils eligible for FSM, are less likely to offer EBacc subjects, while grammar schools are more likely to offer them. Children from Black African backgrounds and children with SEN records are significantly less likely to be in schools that offer EBacc. By contrast, boys and children whose fathers have A Levels or degrees are significantly more likely to be in such schools.
Having examined which schools offered EBacc GCSEs and who went to them, we restrict the sample to the schools that did offer the course for the next step, where we run several regressions with different sets of independent variables, as before. Wherever possible, we discuss the relative roles of double/triple science, modern foreign languages and humanities. (See Appendix Tables C.2 to C.5 for full regression results.)
• Gender – After excluding those who are not offered EBacc, we observe no significant gender differences in taking EBacc subjects, conditional on child and family characteristics only. However, boys are slightly more likely to take EBacc subjects as we control for the widest range of factors including favourite subjects. This hides bigger gender differences in taking the individual components of EBacc. As can be seen in Appendix Tables C.2, C.3 and C.4, boys are significantly more likely to take at least double science (by 3 percentage points) and to take humanities (by 7 percentage points), but are significantly less likely to take any modern foreign languages (by 4 percentage points), after controlling for the widest range of factors.
• Ethnicity – Children from Black ethnic backgrounds are significantly less likely to study EBacc subjects than White children, controlling for child and family characteristics, which appears to be driven by a lower propensity to study a humanity and a modern foreign language. These differences are slightly reduced when we control for school characteristics, and are further reduced when we control for prior attainment (the Black Caribbean difference becomes insignificant). The difference for B al ck African children remains significant and large when we control for the widest range of factors, including young people’s preferences and attitudes.
• SEN – Conditional on personal and family characteristics only, children who have ever had a record of SEN are less likely to study EBacc subjects, by about 14 percentage points. The difference is substantially reduced, to about 3 percentage points, once we control for prior attainment; but it remains statistically significant. It is largely unaffected by controlling for young people’s attitudes and preferences. The difference appears to be driven by modern foreign languages: children with SEN backgrounds are about 7 percentage points less likely to study any modern foreign languages, controlling for the widest range of factors; but there is no significant correlation between SEN and studying humanities or at least double science.
• Family income – Only controlling for child and family characteristics, children from poorer families are less likely to study EBacc subjects. These differences are reduced substantially when we control for school characteristics and prior attainment. When we control for the full set of factors, including children’s attitudes and preferences, the difference between the richest 20% and the poorest 20%
This difference appears to be driven by both modern foreign languages and
24 http://www.education.gov.uk/rsgateway/DB/SFR/s000985/index.shtml).
75
v als the following differences (see Appendix Table C.6 for full results):
• Ethnicity – Children from all ethnic minorities are significantly more likely to study vocational qualifications than White children (except for those of mixed ethnicity or from an ‘other ethnic minority’), controlling for child and family characteristics. These differences remain statistically significant for all groups, except Black African children, when we control for school‐level factors. When we control for prior attainment, the difference is no longer statistically significant for children of Bangladeshi ethnicity, and becomes statistically significant and negative for those from an ‘other ethnic minority’). When we control for wider factors, the differences remain statistically significant for children from Indian and Black Caribbean backgrounds, and are similar in magnitude to those seen when we only control for child and family characteristics.
humanities. • Parental education – Children whose parents have higher levels of education are more likely to be
studying EBacc subjects, after controlling for other personal and family characteristics. These differences are much reduced when we control for school characteristics. Once we take into account prior attainment, differences according to parents’ education become insignificant except that mothers with degrees or equivalents are still significantly positively associated with their children taking EBacc. It is possible that parental education affects the decision about taking EBacc GCSEs mainly through the channel of academic performance prior to Key Stage 4.
• Main language spoken at home – Compared with those who only speak English at home, bilingual pupils and those who mainly speak another language are much more likely to take EBacc GCSEs. The differences remain above 9 percentage points even after controlling for the widest range of factors. They are largely driven by modern foreign languages, and to a lesser extent by humanities.
• Prior attainment – Better‐than‐average results in Key Stage 3 English, Maths and Science are all associated with taking EBacc subjects, conditional on all other factors. In addition, children with good results in Key Stage 2 English are more likely to take EBacc even after controlling for Key Stage 3 results.
• Preferences – Reporting English, Science, History, Geography or MFLs as one’s favourite subject in Year 9 are all strong and significant predictors for taking EBacc GCSEs. Meanwhile, pupils who dislike Maths the most are less likely to take EBacc, all else being equal.
• Aspirations – Pupils who think they are likely to get into universities, and pupils whose parents also think they will, have a significantly higher tendency to take EBacc subjects, compared with those without aspirations for higher education.
4.2.3 Vocational courses at Key Stage 4 In our weighted sample of LSYPE participants, 34% of pupils took at least one vocational GCSE or GNVQ exam at Key Stage 4. There were 16% of children in schools that did not offer any vocational GCSEs and GNVQs, which accounted for about 25% of all the pupils who took no vocational exams at Key Stage 4. We
r end htherefore first examine who a e more likely to att schools t at offer vocational courses at Key Stage 4.
This reveals that vocational courses are more likely to be available in city technology colleges and voluntary‐controlled schools relative to community schools, but are less likely to be offered in foundation schools, independent schools and voluntary‐aided schools. Vocational courses are also more likely to be offered by mixed schools and schools for children aged 11–18; they are less likely to be offered by small schools and grammar schools. Schools with greater proportions of children eligible for FSM and greater proportions of ethnic minorities are also more likely to offer vocational courses. On the other hand, schools with more pupils with English as an additional language and schools that have higher value added are significantly less likely to offer vocational courses.
Restricting the sample to pupils who were offered vocational courses, we run several regressions with different sets of independent variables as before, to examine the decision by pupils to study vocational courses. This re e
76
likely to stay on in full‐time education than other pupils, by about 8 percentage points. Once we control for prior attainment, however, the reverse is true and equally significant.
• Family income – Children from richer families are significantly more likely to stay on when controlling for child and family characteristics. However, this difference becomes insignificant once we control for prior attainment. This suggests that the rich–poor gap in post‐16 participation is largely attributable to the gap in prior academic performance.
• SEN – Children with any history of SEN are much less likely to take vocational GCSEs or GNVQs. The difference is slightly reduced when we control for prior attainment, but remains significant at about 6 percentage points when controlling for the widest range of factors.
• Parental education – Having parents with degrees or equivalents is associated with children taking no vocational courses at all, after controlling for other personal and family characteristics. This difference is reduced when we control for more factors, but remains significant for mothers with degrees even when the widest range of factors is accounted for. Meanwhile, children whose parents have lower‐than‐degree‐level qualifications do not appear to be significantly different from those whose parents have no qualifications at all, in terms of whether they take any vocational courses.
• School type – Students in city technology colleges, mixed schools and 11–18 schools are more likely to study vocational courses than those in community schools, whilst those in voluntary‐controlled schools and small schools are significantly less likely to. Interestingly, students in schools with higher value added are more likely to take vocational courses when they are offered, although such schools are significantly less likely to offer them.
• Prior attainment – Pupils in the second‐lowest and middle quintile in terms of Key Stage 3 English are significantly more likely to take vocational courses than those achieving the lowest 20% in Key Stage 3 English, conditional on all other factors. But the differences between the 20% lowest achievers and the 40% highest achievers are insignificant.
• Preferences – Children who like Maths or English the most have a greater tendency to study some vocational courses.
4.2.4 Staying in full-time education in Year 12 Having discussed the factors associated with choices at Key Stage 4, we now focus on factors associated with post‐16 choices, starting with the decision to stay in full‐time education after the end of compulsory schooling. In our sample, 72% of pupils stayed on after Year 11 and were in full‐time education in Year 12.
Similarly to above, we begin by estimating differences in the propensity to stay in full‐time education according to child and family characteristics. We then control for other sets of characteristics to see whether these groups of factors (school characteristics, prior attainment, young people’s attitudes and preferences, and prior choices) can in some sense ‘explain’ these differences (see Appendix Table C.7 for full results).
• Gender – Girls are much more likely than boys to stay on after Year 11, by about 8 percentage points conditional on just child and family characteristics. This difference is substantially reduced but still remains significant when we account for differences in school characteristics and young people’s prior attainment, attitudes and preferences.
• Ethnicity – Children from most ethnic minority backgrounds are significantly more likely to stay on than White children, conditional on personal and family characteristics (e.g. children from Black African backgrounds are around 17 percentage points more likely to stay on). These differences are reduced when we control for Key Stage 4 school characteristics. Moreover, most become insignificant once we control for prior attainment, the exceptions being children from Black backgrounds and those o f mixed ethnicity, for whom the differences remain significant, at above 10 and 5 percentage points respectively, when we also control for young people’s attitudes and preferences.
• SEN – Conditional on personal and family characteristics only, children with any history of SEN are significantly less
77
characteristics. This difference is reduced when we control for school characteristics, and significant when we control for prior attainment and wider factors.
• Ethnicity – Children from Indian and Bangladeshi backgrounds are significantly more likely to stay
• Parental education – Again, differences between children whose parents have high or low levels of education are much reduced as we control for prior attainment and they become insignificant, except for mothers with degrees, when we control for young people’s attitudes and preferences.
• Peer effects – Children who expect their friends to stay on after Year 11 are much more likely to do so themselves, even after taking account of young people’s preferences and attitudes.
• Prior attainment – Unsurprisingly, achieving a ‘good’ Maths GCSE (graded A*–C), achieving a ‘good’ English GCSE and total score at Key Stage 4 are all positively associated with staying on after Year 11, holding other factors constant. For example, young people who achieved above‐average total scores at Key Stage 4 are much more likely to stay on than those who got the lowest 20% of scores, by more than 20 percentage points.
• Post16 expectation – Unsurprisingly, those who plan (in Year 9) to stay on after Year 11 are more likely to do so, conditional on all other factors. Similarly, those whose parents expect them to stay on are also more likely to do so, by about 10 percentage points, holding all other factors fixed.
4.2.5 Staying in full-time education in Year 13 About 51% of pupils in our sample remained in full‐time education more than one year after finishing compulsory schooling (into Year 13). The vast majority of them were also in education in the year before. Naturally, the decision one year later to stay in education is influenced by similar factors to the decision a year earlier. uB t there are some important differences (see Appendix Table C.8 for full results):
• Gender – The gender difference is slightly greater in Year 13 than in Year 12, increasing from 8 to 9 percentage points. Boys thus appear more likely to drop out, conditional on child and family characteristics. This is also true conditional on the widest range of factors.
• SEN – Conditional on personal and family characteristics only, children with any history of SEN are significantly less likely to stay on into Year 13 than other pupils. However, this difference is slightly reduced compared with Year 12 and becomes positive once we control for prior attainment (statistically significant at the 10% level).
• Prior attainment – The positive impact of higher total scores at Key Stage 4 is still significant, but smaller in magnitude now than in the first year. Achieving a ‘good’ English GCSE has no impact conditional on all other factors now. The positive effect of a ‘good’ Maths GCSE is also smaller in Year 13 than in Year 12.
• Prior choice s – Children who have studied vocational courses are less likely to remain in educationin Year 13, though there was little difference in Year 12.
• Aspirations – There is a big difference between intending to apply to university and having the self‐confidence that one is likely to get into university. Conditional on planning to apply and all other factors, having the confidence that one will get into university significantly increases the likelihood of staying in full‐time education in Year 13. On the other hand, those who intended to apply but thought they were unlikely to get an offer are significantly less likely to stay in education in Year 13, compared with those who did not intend to apply. The same impact of confidence was observed in Year 12 as well, but it was smaller in magnitude and insignificant.
4.2.6 A levels in Year 13
We now examine the post‐16 course choices of pupils. About 44% of pupils in our sample studied at least one A Level in Year 13. As before, we run several regressions with different sets of independent variables (see Append Table C.9 for full results): ix
• Gender – Girls are much more likely than boys to study A Levels in Year 13, conditional on personal and familybecomes in
78
In this chapter, we have analysed subject choice patterns according to particular child and family characteristics, and how these patterns are affected by controlling for school characteristics, prior attainment and young people’s attitudes and preferences. We found that gender differences are largely unaffected. For example, boys are significantly more likely than girls to study triple science, even after controlling for prior attainment and subject preferences. This suggests that the source of gender
on than White children, conditional on all other factors. • SEN – Conditional on personal and family characteristics only, children with any history of SEN are
significantly less likely to study A Levels than other pupils by about 19 percentage points. Controlling for school facto sr reduces the difference. Once we control for prior attainment, the difference becomes insignificant.
• Family income – Agai , n there is a rich–poor gap that disappears once prior academic performance is controlled for.
• Parental education – Similarly, differences according to parental education are substantially reduced when prior attainment is controlled for and are generally insignificant conditional on wider factors (the excepti d
on being whether the father has a egree, which is statistically significant at the 10% level).
• Prior attainment – Conditional on all other factors, ‘good’ Maths GCSE, ‘good’ English GCSE and higher total score at Key Stage 4 are all significant predictors of studying A Levels. In addition, achieving at least five ‘good’ GCSEs significantly increases the probability of studying A Levels, despite the fact that we have already seen (in the previous two sets of regressions – Appendix Tables C.7 and C.8) that it appears to have no impact on staying in full‐time education after Year 11. One possibility, therefore, is that achieving at least five ‘good’ GCSEs encourages some students to stay on to do A Levels while also creating better employment and training opportunities for other young people – so that the latter group would leave full‐time education.
• Aspirations – Unsurprisingly, young people who thought they were likely to get into university have a greater tendency to study A Levels in Year 13. But there is no significant difference between those who did not plan to apply and those who did but lacked the confidence of getting in.
4.2.7 Vocational qualifications in Year 13 A third (33%) of our sample studied for vocational qualifications in Year 13. The following factors are correlated with doing so (see Appendix Table C.10 for full results):
• Ethnicity – Conditional on just family and child characteristics, children from Black backgrounds are significantly more likely to study for vocational qualifications than White children. But the difference becomes insignificant once prior attainment is accounted for.
• SEN – Conditional on personal, family and school characteristics only, children with any history of SEN are significantly t more likely to study for vocational qualifications than o her students. This difference is eliminated once we control for prior attainment.
• Parental education – Children whose parents have a degree or equivalent are less likely to study vocational qualifica
btions, after controlling for other personal and family characteristics. Again, this
difference ecomes insignificant once prior attainment is controlled for. • Prior attainment – Pupils with a ‘good’ English GCSE and pupils with at least five ‘good’ GCSEs are
much less likely to study for vocational qualifications. Meanwhile, those who came in the second‐lowest and middle quintiles in their total Key Stage 4 scores are significantly more likely to study vocational qualifications than those in other quintiles, holding other factors constant.
• Plans – Those who planned (in Year 9) to stay in full‐time education after Year 11 are more likely to be studying vocational qualifications in Year 13.
4.3 Summary
79
differences lies elsewhere, such as in gender stereotypes.
We also found that children from richer families and children whose parents have higher levels of education are more likely to study triple science, to take the EBacc combination, to stay on in full‐time education after Year 11 and to study A Levels. However, such differences largely disappear when we control for prior attainment and a wider range of factors. Children who have ever had a Special Educational Need are less likely to study these subjects and to stay on, which can also be largely explained by differences in prior attainment. There is less consistency according to ethnic differences, with individuals’ subject choices displaying quite different patterns depending on the subject under consideration.
Meanwhile, young people’s views of the future clearly affect their subject choices. Those who believed from an early age (Year 9) that they were likely to get into university are more likely to take the EBacc combination of subjects, to stay on in full‐time education and to study A Levels. On the other hand, the mere intention to apply, if not accompanied by self‐confidence about getting in, appears to have little impact on those subject and course choices. It should be noted that the observed correlation between aspiration and positive educational choices does not necessarily mean there is any causal relationship. We might well be measuring some innate ability or quality (such as optimism or drive) that is not fully captured by test scores.
80
5. Conclusion The subjects and courses young people choose to take from age 14 onwards can have profound implications for their later‐life educational and economic opportunities. Given their potential impact on young people’s lives, it seems vital that we understand how young people make their choices, and whether any aspects of the current decision‐making process could be improved. In this report, we have take on five complementary approaches to understanding course and subject ch ices in England:
• describing the choices currently on offer in England’s schools and the choices made by the most recent cohort of pupils;
• examining survey evidence and academic studies regarding young people’s experiences in making their choices;
• outlining the theories that psychologists and economists use to analyse human decision‐making, and attempting to suggest their relevance for young people’s course and subject choices;
• ch cconsidering the role of s ools in shaping young people’s course hoices, and the pressures under which schools operate in deciding which courses to offer;
• analysing the rich data available from the Longitudinal Survey of Young People in England to investigate which factors are most strongly associated with different course and subject choices.
Any understanding of subject and course choices must clearly begin with a detailed understanding of the courses currently on offer to young people in England. At Key Stage 4, when pupils are aged 15/16, recent years have seen a veritable explosion of vocational and skills‐focused courses, crowding out (to some extent) the more traditional GCSEs. Despite this growth in non‐traditional courses, GCSEs maintain their position as the most commonly‐taken qualification. Nonetheless, the growth in the number of pupils taking vocational qualifications over the past five years has been astounding, with the number of VRQs awarded to England’s pupils growing from almost zero just six years ago to reach nearly 600,000 by 2009–10. In this report, we have presented suggestive evidence that this growth in vocational qualifications may have been driven (at least in part) by schools attempting to ‘game’ the league table system. Schools performing comparatively poorly on the raw ‘at least five GCSEs at grade A*–C’ measure appear to have moved most rapidly towards vocational courses, and the schools that were swiftest to adopt vocational courses appear to have made the most substantial gains in their ‘5+ A*–C’ performance. However, schools that were strong adopters of vocational qualifications also appear to have improved their GCSE Maths and English performances, though to a smaller extent than the gain in the ‘5+ A*–C’ measure. We have also shown that Basic Skills courses in Literacy and Numeracy – aimed at those with fundamental difficulties in literacy and numeracy – do not appear to have been exclusively focused on such pupils. These figures do not prove definitively that schools have been ‘gaming’ the league table system. It might be argued that schools with poorly‐performing pupils were also those whose pupils would gain most from a shift towards vocational, rather than academic, courses. It is also important to remember that the alternative situation for these pupils might have been leaving school with very few GCSEs, and these pupils may thus have benefited from being able to take vocational qualifications instead.
At the time of writing, the government has proposed significant changes to performance tables, including the creation of the English Baccalaureate, publishing school effectiveness by prior attainment (low, middle and high), abandoning contextual valued added measures and having only ‘high‐quality’ qualifications count towards performance tables. This last reform reflects the government’s acceptance of the Wolf Review’s conclusions that the current system creates perverse incentives for schools to teach qualifications that attract the most points in the performance tables. At the time of writing, the
81
pupils to take subjects or courses i
government was running a consultation to define the rules regarding high‐quality qualifications.25 Such reforms seem likely to affect schools’ behaviour significantly. One would predict almost certainly a greater focus on EBacc subjects and less on vocational courses.
Having documented young people’s choices, we sought to speculate regarding the possible cognitive mechanisms through which young people might make those choices. In the standard model of rational decision‐making, it is generally assumed that individuals make the best possible decision from the choices available to them, given the information at their disposal. If young people’s decision‐making conformed to such a model, then the role for intervention by outside agents would be extremely limited. The government may wish to offer high‐quality information to students, but no further intervention would be required (unless there were clear spill‐over benefits to society from individuals taking particular subjects). Current evidence suggests that the quality of information currently available to young people is, at best, variable, suggesting significant room for improvement even under the strong assumptions of rational decision‐making.
In recent years, researchers in psychology and behavioural economics have documented numerous anomalies that suggest that human decision‐making is far from perfectly rational, and that individuals use a range of ‘rules of thumb’, as well as being subject to a variety of cognitive and emotional biases, when making decisions. In this report, we have discussed the implications of insights from behavioural economics for the way young people make subject and course choices, and the potential policy responses.
The first set of anomalies we discussed relate to the way individuals make decisions across time and under uncertainty, clearly relevant to the subject and course choices of young people. When thinking about the future, experimental and real‐world evidence suggests that individuals appear to treat the present as a ‘special case’ (known as ‘present bias’). Present bias would imply that when making their subject and course choices, young people may overweight short‐run considerations (such as taking easier courses) compared with long‐run considerations (such as career prospects). The policy response to such a concern would seem to be an earlier decision time, limiting choices available to young people or giving
iopportun ties for young people to commit to particular choices.
Evidence also suggests that individuals appear to exhibit overconfidence in their own ability and over‐optimism about the likelihood that good things will happen to them, and they also appear to underestimate their own adaptability when imagining their life under different circumstances (projection bias). Empirical evidence certainly suggests that (on average) young people overestimate their chances of staying on in education at older ages, and that this overconfidence is more extreme for children from more deprived backgrounds. However, the potential policy responses to such concerns are less clear.
The second set of departures from rationality considered in this report relate to framing effects – that individuals may make different choices purely as a result of the way a decision is presented. First, individuals appear to exhibit a high degree of ‘inertia’ in their decision‐making, tending to stick with default options where they are offered, even for decisions with important long‐run consequences. This suggests that policymakers should act cautiously when offering up some courses (or combinations of courses) as being either the default options or a recommended ‘gold standard’, as they will clearly be taken up by large numbers of pupils. The creation of such options should be guided by an assessment of whether the default options really are ‘right’ for all pupils. This clearly has strong implications for the new English Baccalaureate (awarded if pupils gain at least a C in GCSE Maths, English, a science, a humanity and a modern foreign language). If this particular combination is suitable for all pupils, then it would seem natural to treat it as a default or recommended option, but if it is not, then the EBacc might lead
ll‐suited to them.
25 http://www.education.gov.uk/16to19/qualificationsandlearning/a00192510/performance-table-reform-and-transparency-will-raise-standards-and-end-perverse-incentives.
82
appropriate design of education policy.
In Chapter 4, we used the rich data available in the LSYPE to analyse the factors associated with different
Experimental evidence also suggests that individuals are sensitive to whether options are defined as losses or gains, disliking losses by more than they like gains. However, the multiple competing rationales for making particular subject and course choices make it very difficult to isolate a reference point against which young people assess gains and losses, making it much more difficult to derive policy implications.
Other reference point effects can be created by social norms. This seems particularly relevant to gender differences in subject and course choices, such as boys’ greater propensity to study science. Our analysis suggests that such gender differences remain even after controlling for prior attainment and subject preferences. This suggests that the source of gender differences lies elsewhere, such as in gender stereotypes and perceptions of social norms.
Individuals may also be prone to choice overload when presented with a large array of options – a critical consideration in the complex choice landscape facing young people in England’s school system – and may fall back on simple rules of thumb in order to narrow the choices being considered. Such choice overload effects would suggest that it would be undesirable to simply present young people with very long lists of courses, as they fall back on simple heuristics rather than fully considering the options. There is clearly a trade‐off with respect to restricting the choices of young people, but it should be remembered that presenting young people with more and more choices is not necessarily beneficial to young people. When making decisions with uncertain consequences, individuals may also be swayed by numerous non‐cognitive factors such as their emotional state and the vividness with which choices are presented. Such considerations suggest that subjects students may consider dry and abstract (such as sciences or Maths) may become more attractive if the pupils are presented with vivid evidence of their future usefulness. Concrete examples of people in interesting STEM‐related jobs may thus be more helpful than dry statistics regarding earnings potential.
There are numerous future avenues of enquiry, then, which could help to cast light on the cognitive processes by which young people make their subject and course choices. However, there are three reasons to be particularly cautious before directly applying these insights to school pupils. First, the evidence supporting the existence of many ‘behavioural regularities’ comes overwhelmingly from experiments in laboratory settings or adults in very different contexts. It is possible to derive implications for the way in which young people make subject and course choices, but this is no substitute for empirical evidence on the extent to which cognitive biases actually pervade young people’s subject and course choices. Second, almost all the evidence cited on cognitive biases relates to experiments conducted with adult (or at least college‐age) subjects. More evidence is required as to whether such cognitive biases also apply to young people, and maybe whether they are more susceptible to them. Third, standard arguments, such as the importance of incentives and information, are often important as well. In some cases, it is difficult to disentangle the influence of behavioural biases from rational decision‐making. It is thus crucial to establish empirically the relative importance of different forces before making policy decisions.
We have recommended two particular areas as meriting further investigation: present bias and default/anchoring bias. Both have clear policy implications: an earlier decision time or other forms of precommitment devices in the case of present bias, and the creation of desirable defaults or anchors (or the avoidance of defaults or anchors unsuitable to wide numbers of young people). They are also highly significant to education policy more widely beyond subject and course choices. We have thus proposed a simple experiment that could tease out anchoring and default bias, as well as present bias. Other experiments could also be equally valid and useful. Replication of existing experiments on present bias would be simple and highly relevant to many features of education policy. We feel that these two areas represent fertile areas for cutting‐edge academic research, which would also be highly relevant to the
83
course and subject choices. In particular, we attempted to disentangle the different factors associated with (among others) taking triple science GCSEs, following the courses making up the EBacc and studying A Levels. We found that the large gap in the likelihood of studying these subjects observed between children from richer and poorer families largely disappears when we control for children’s prior attainment. We also observed a strong correlation between young people’s aspirations and their future choices. Those who believed from an early age that they were likely to get into university are more likely to take the EBacc combination of subjects, to stay on in full‐time education and to study A Levels. On the other hand, the mere intention to apply, if not accompanied by self‐confidence about getting in, appears to have little impact on those subject and course choices.
In summary, the array of subject and course choices on offer to young people in England has undergone a dramatic upheaval in recent years, with a huge increase in the range of (particularly vocational) courses available. While the government has several clear priorities in terms of subjects and courses it wishes to encourage pupils to take – notably sciences, Maths and the ‘traditional’ academic subjects making up the EBacc, and a focus on ‘high‐quality’ vocational courses – there are currently significant gaps in our knowledge of how schools choose the choices they offer to their pupils, and how those pupils then weigh those choices to reach a final decision. The evidence certainly suggests that schools respond vigorously to the incentives created by school league tables, with some schools moving rapidly to identify and expand courses that may boost their performance. This may, however, be to the detriment of students, if the courses they are encouraged to take are not valued by universities or employers. In terms of understanding the process by which young people choose their courses, existing surveys can only take us so far. We can attempt to tease out the factors associated with different choices, but in terms of understanding the underlying cognitive mechanisms at play, few sources of evidence are available. It will take carefully‐designed experiments, attempting to isolate different mechanisms (and possible biases), to further our understanding in this important area.
84
References Adey, K. and Biddulph, M. (2001), ‘The influence of pupil perceptions on subject choice at fourteen‐plus in geography and history’, Educational Studies, 27(4), 439–50.
Ariely, D., Loewenstein, G. and Prelec, D. (2003), ‘Coherent arbitrariness: stable demand curves without stable preferences’, Quarterly Journal of Economics, 118(1), 73–105.
Ashworth, J. and Evans, J.L. (2001), ‘Modeling student subject choice at secondary and tertiary level: a ncross‐section study’, Journal of Economic Educatio , 32(4), 311–20.
Barber, B.M. and Odean, T. (2001), ‘Boys will be boys: gender, overconfidence, and common stock 92. investment’, Quarterly Journal of Economics, 116(1), 261–
Benzion, U., Rapoport, A. and Yagil, J. (1989), ‘Discount rates inferred from decisions: an experimental study’, Management Science, 35(3), 270–84.
Blenkinsop, S., McCrone, T., Wade, P. and Morris, M. (2006), How Do Young People Make Choices at 14 and ear , London: ar lls.16?, Res ch Report RR773 Dep tment for Education and Ski
Cabinet Office (2010), ‘Applying behavioural insight to health’, Discussion Paper (http://www.cabinetoffice.gov.uk/resource‐library/applying‐behavioural‐insight‐health).
Chowdry, H., Crawford, C. and Goodman, A. (2011), ‘The role of attitudes and behaviours in explaining socio‐economic differences in attainment at age 16’, Longitudinal and Life Course Studies, 2(1), 59–76.
Clemens, S. (2011), ‘The English Baccalaureate and GCSE choices’, Department for Education, Research Brief 150 (http://www.natcen.ac.uk/media/734426/dfe‐rb150.pdf).
Colley, A. and Comber, C. (2003), ‘School subject preferences: age and gender differences revisited’, –Educational Studies, 29(1), 59 67.
Crawford, C., Duckworth, K., Vignoles, A. and Wyness, G. (forthcoming), Young People’s Education and esearch Report. Labour Market Choices Aged 16/17 to 18/19, Department for Education R
DellaVigna, S. and Malmendier, U. (2006), ‘Paying not to go to the gym’, American Economic Review, 96(3), 694–719.
de Meza, D., Irlenbusch, B. and Reyniers, D. (2008), ‘Financial capability: a behavioural economics perspective’, Financial Services Authority, Consumer Research 69 (http://www.fsa.gov.uk/pubs/consumer‐research/crpr69.pdf).
Eisenberg, A.E., Baron, J. and Seligman, M.E.P. (1995), ‘Individual differences in risk aversion and anxiety’, University of Pennsylvania, Working Paper.
Eliaz, K. and Spiegler, R. (2006), ‘Contracting with diversely naïve agents’, Review of Economic Studies, 73(3), 689–714.
Epley, N., Mak, D. and Idson, L.C. (2006), ‘Bonus or rebate? The impact of income framing on spending and saving’, Journal of Behavioral Decision Making, 19(3), 213–27.
Frederick, S., Loewenstein, G. and O’Donoghue, T. (2002), ‘Time discounting and time preference: a critical review’, Journal of Economic Literature, 40(2), 351–401.
Genesove, D. and Mayer, C. (2001), ‘Loss aversion and seller behavior: evidence from the housing market’, Quarterly Journal of Economics, 116(4), 1233–60.
85
London: Department for Education and Skills.
Mussweiler, T., Strack, F. and Pfeiffer, T. (2000), ‘Overcoming the inevitable anchoring effect: considering the opposite compensates for selective accessibility’, Personality and Social Psychology Bulletin, 26(9),
Green, L., Fristoe, N. and Myerson, J. (1994), ‘Temporal discounting and preference reversals in choice between delayed outcomes’, Psychonomic Bulletin & Review, 1(3), 383–9.
Hershey, J.C. and Schoemaker, P.J.H. (1980), ‘Risk taking and problem context in the domain of losses: an expected utility analysis’, Journal of Risk and Insurance, 47(1), 111–32.
Hsee, C.K. and Weber, E.U. (1997), ‘A fundamental prediction error: self–others discrepancies in risk preference’, Journal of Experimental Psychology, 126(1), 45–53.
Iyengar, S.S. and Lepper, M.R. (2000), ‘When choice is demotivating: can one desire too much of a good thing?’, Journal of Personality and Social Psychology, 79(6), 995–1006.
Johnson, E.J., Hershey, J., Meszaros, J. and Kunreuther, H. (1993), ‘Framing, probability distortions, and insurance decisions’, Journal of Risk and Uncertainty, 7(1), 35–51.
Jonas, E., Schulz‐Hardt, S., Frey, D. and Thelen, N. (2001), ‘Confirmation bias in sequential information search after preliminary decisions: an expansion of dissonance theoretical research on selective exposure to information’, Journal of Personality and Social Psychology, 80(4), 557–71.
Kahneman, D., Knetsch, J.L. and Thaler, R.H. (1990), ‘Experimental tests of the endowment effect and the Coase theorem’, Journal of Political Economy, 98(6), 1325–48.
Kahneman, D. and Tversky, A. (1979), ‘Prospect theory: an analysis of decision under risk’, Econometrica, 9147(2), 263– .
Kirby, K.N. and Herrnstein, R.J. (1995), ‘Preference reversals due to myopic discounting of delayed reward’, Psychological Science, 6(2), 83–9.
Koellinger, P., Minniti, M. and Schade, C. (2007), ‘I think I can, I think I can: overconfidence and of Psentrepreneurial behavior’, Journal Economic ychology, 28(4), 502–7.
Loewenstein, G., O’Donoghue, T. and Rabin, M. (2003), ‘Projection bias in predicting future utility’, Quarterly Journal of Economics, 118(4), 1209–48.
Loewenstein, G.F., Weber, E.U., Hsee, C.K. and Welch, N. (2001), ‘Risk as feelings’, Psychological Bulletin, 127(2), 267–86.
Madrian, B.C. and Shea, D.F. (2001), ‘The power of suggestion: inertia in 401(k) participation and savings behavior’, Quarterly Journal of Economics, 116(4), 1149–87.
McNeil, B.J., Pauker, S.G., Sox Jr, H.C. and Tversky, A. (1982), ‘On the elicitation of preferences for alternative therapies’, New England Journal of Medicine, 306(21), 1259–62.
Millar, A. and Navarick, D.J. (1984), ‘Self‐control and choice in humans: effects of video game playing as a L apositive reinforcer’, earning and Motiv tion, 15(2), 203–18.
Moon, S., Lilley, R., Morgan, S., Gray, S. and Krechowiecka, I. (2004), ‘A systematic review of recent research into the impact of careers education and guidance on transitions from Key Stage 3 to Key Stage 4 (1988–2003)’, Research Evidence in Education Library, London: EPPI‐Centre, Social Science Research Unit,
n, University of London. Institute of Educatio
Morris, M. (2004), Advice and Guidance in Schools: A Report Prepared for the National Audit Office, September 2003, London: National Audit Office.
Morris, M., Rickinson, M. and Davies, D. (2001), The Delivery of Careers Education and Guidance in Schools,
86
1142–50.
Nickerson, R.S. (1998), ‘Confirmation bias: a ubiquitous phenomenon in many guises’, Review of General Psychology, 2(2), 175–220.
Nisbett, R.E., Borgida, E., Crandall, R. and Reed, H. (1982), ‘Popular induction: information is not necessarily informative’, in D. Kahneman, P. Slovic and A. Tversky (eds), Judgment under Uncertainty:
, 101–16. Heuristics and Biases, New York: Cambridge University Press
Economic Review, 89(1), 103–24. O’Donoghue, T. and Rabin, M. (1999), ‘Doing it now or later’, American
Owen, L. and Jensen, E. (2008), ‘Social learning and course choice’, International Review of Economics Education, 7(1), 9–35.
Raghunathan, R. and Pham, M.T. (1999), ‘All negative moods are not equal: motivational influences of anxiety and sadness on decision making’, Organizational Behavior and Human Decision Processes, 79(1), 56–77.
Read, D. and van Leeuwen, B. (1998), ‘Predicting hunger: the effects of appetite and delay on choice’, Organizational Behavior and Human Decision Processes, 76(2), 189–205.
Reyna, V.F. and Farley, F. (2006), ‘Risk and rationality in adolescent decision making: implications for hological terest, 7(1), 1–44. theory, practice, and public policy’, Psyc Science in the Public In
Rubinstein, A. and Spiegler, R. (2008), ‘Money pumps in the market’, Journal of the European Economic ion . Associat , 6(1), 237–53
Russell Group (2011), Informed Choices: A Russell Group Guide to Making Decisions about Post16 /media/informed‐choices/InformedChoices‐latest.pdfEducation, http://www.russellgroup.ac.uk .
Russo, J.E. and Schoemaker, P.J.H. (1989), Decision Traps: Ten Barriers to Brilliant DecisionMaking & How to Overcome Them, New York: Doubleday/Currency.
Sackett, D.L. and Torrance, G.W. (1978), ‘The utility of different health states as perceived by the general public’, Journal of Chronic Diseases, 31(11), 697–704.
of ilitSamuelson, P.A. (1937), ‘A note on measurement ut y’, Review of Economic Studies, 4(2), 155–61.
Solnick, J.V., Kannenberg, C.H., Eckerman, D.A. and Waller, M.B. (1980), ‘An experimental analysis of Learning and Motivation, 1impulsivity and impulse control in humans’, 1(1), 61–77.
Spiegler, R. (2006), ‘The market for quacks’, Review of Economic Studies, 73(4), 1113–31.
Stables, A. and Wikeley, F. (1999), ‘From bad to worse? Pupils’ attitudes to modern foreign languages at 7–31. ages 14 and 15’, Language Learning Journal, 20(1), 2
licy Review, 1(2), Sunstein, C. (2007), ‘Willingness to pay vs. welfare’, Harvard Law and Po 303–30.
nce on dynamic inconsistency’, Economics Letters, 8(3), 201–7. Thaler, R. (1981), ‘Some empirical evide
Thaler, R.H. and Sunstein C.R. (2008), Nudge: Improving Decisions about Health, Wealth, and Happiness, New Haven, CT: Yale University Press.
Timmermans, D. (1993), ‘The impact of task complexity on information use in multi‐attribute decision na omaking’, Jour l of Behavioral Decisi n Making, 6(2), 95–111.
Tubbs, R.M., Gaeth, G.J., Levin, I.P. and Van Osdol, L.A. (1993), ‘Order effects in belief updating with 6(4), 257–69. consistent and inconsistent evidence’, Journal of Behavioral Decision Making,
Tversky, A. and Kahneman, D. (1971), ‘Belief in the law of small numbers’, Psychological Bulletin, 76(2), 105–10.
87
Wansink, B., Kent, R.J. and Hoch, S.J. (1998), ‘An anchoring and adjustment model of purchase quantity decisions’, Journal of Marketing Research, 35(1), 71–81.
Weinstein, N.D. (1980), ‘Unrealistic optimism about future life events’, Journal of Personality and Social Psychology, 39(5), 806–20.
Whelan, R. and McHugh, L.A. (2009), ‘Temporal discounting of hypothetical monetary rewards by adolescents, adults, and older adults’, The Psychological Record, 59(2), 247–58.
Wilson, T.D. and Schooler, J.W. (1991), ‘Thinking too much: introspection can reduce the quality of decisions’, Journal of Personality and Social Psychpreferences and ology, 60(2), 181–92.
Education. Wolf, A. (2011), Review of Vocational Education – The Wolf Report, London: Department for
Wright, W.F. and Bower, G.H. (1992), ‘Mood effects on subjective probability assessment’, Organizational Behavior and Human Decision Processes, 52(2), 276–91.
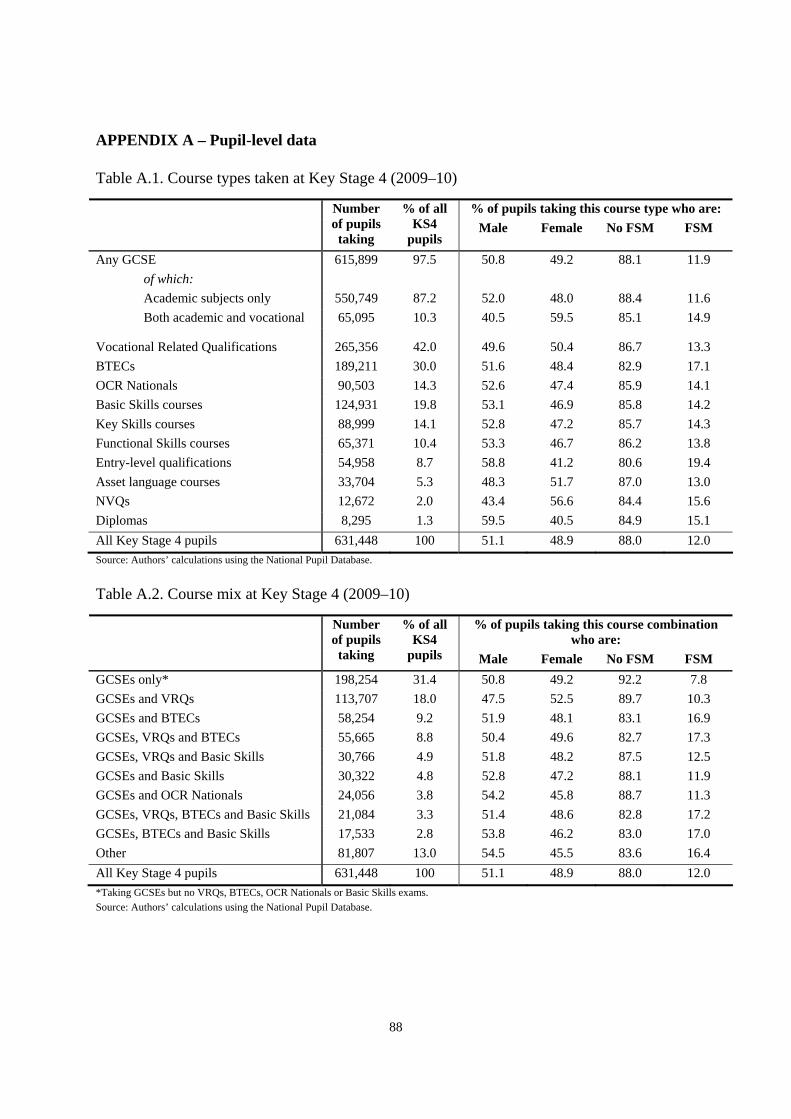
88
APPENDIX A – Pupil-level data
Table A.1. Course types taken at Key Stage 4 (2009–10)
% of pupils taking this course type who are:
Number of pupils taking
% of all KS4
pupils Male Female No FSM FSM
Any GCSE 615,899 97.5 50.8 49.2 88.1 11.9 of which: Academic subjects only 550,749 87.2 52.0 48.0 88.4 11.6 Both academic and vocational 65,095 10.3 40.5 59.5 85.1 14.9
Vocational Related Qualifications 265,356 42.0 49.6 50.4 86.7 13.3 BTECs 189,211 30.0 51.6 48.4 82.9 17.1 OCR Nationals 90,503 14.3 52.6 47.4 85.9 14.1 Basic Skills courses 124,931 19.8 53.1 46.9 85.8 14.2 Key Skills courses 88,999 14.1 52.8 47.2 85.7 14.3 Functional Skills courses 65,371 10.4 53.3 46.7 86.2 13.8 Entry-level qualifications 54,958 8.7 58.8 41.2 80.6 19.4 Asset language courses 33,704 5.3 48.3 51.7 87.0 13.0 NVQs 12,672 2.0 43.4 56.6 84.4 15.6 Diplomas 8,295 1.3 59.5 40.5 84.9 15.1 All Key Stage 4 pupils 631,448 100 51.1 48.9 88.0 12.0 Source: Authors’ calculations using the National Pupil Database.
Table A.2. Course mix at Key Stage 4 (2009–10)
% of pupils taking this course combination who are:
Number of pupils taking
% of all KS4
pupils Male Female No FSM FSM GCSEs only* 198,254 31.4 50.8 49.2 92.2 7.8 GCSEs and VRQs 113,707 18.0 47.5 52.5 89.7 10.3 GCSEs and BTECs 58,254 9.2 51.9 48.1 83.1 16.9 GCSEs, VRQs and BTECs 55,665 8.8 50.4 49.6 82.7 17.3 GCSEs, VRQs and Basic Skills 30,766 4.9 51.8 48.2 87.5 12.5 GCSEs and Basic Skills 30,322 4.8 52.8 47.2 88.1 11.9 GCSEs and OCR Nationals 24,056 3.8 54.2 45.8 88.7 11.3 GCSEs, VRQs, BTECs and Basic Skills 21,084 3.3 51.4 48.6 82.8 17.2 GCSEs, BTECs and Basic Skills 17,533 2.8 53.8 46.2 83.0 17.0 Other 81,807 13.0 54.5 45.5 83.6 16.4 All Key Stage 4 pupils 631,448 100 51.1 48.9 88.0 12.0 *Taking GCSEs but no VRQs, BTECs, OCR Nationals or Basic Skills exams. Source: Authors’ calculations using the National Pupil Database.
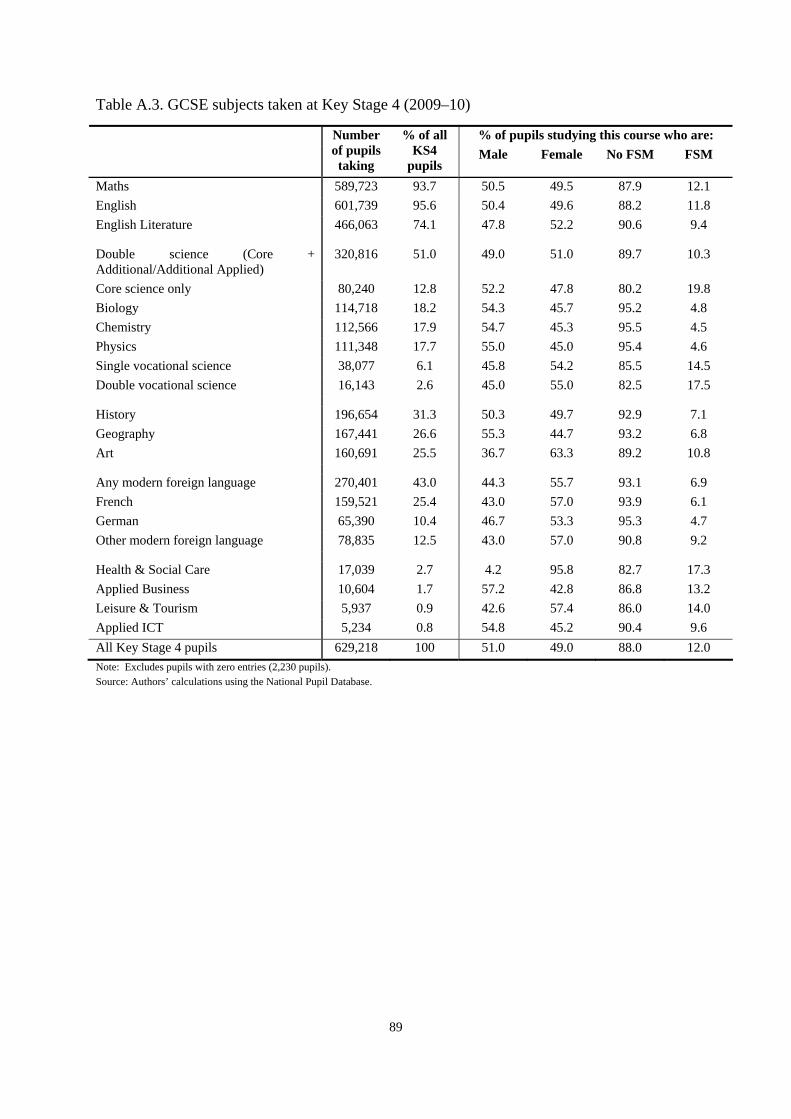
89
Table A.3. GCSE subjects taken at Key Stage 4 (2009–10)
% of pupils studying this course who are:
Number of pupils taking
% of all KS4
pupils Male Female No FSM FSM
Maths 589,723 93.7 50.5 49.5 87.9 12.1 English 601,739 95.6 50.4 49.6 88.2 11.8 English Literature 466,063 74.1 47.8 52.2 90.6 9.4
Double science (Core + Additional/Additional Applied)
320,816 51.0 49.0 51.0 89.7 10.3
Core science only 80,240 12.8 52.2 47.8 80.2 19.8 Biology 114,718 18.2 54.3 45.7 95.2 4.8 Chemistry 112,566 17.9 54.7 45.3 95.5 4.5 Physics 111,348 17.7 55.0 45.0 95.4 4.6 Single vocational science 38,077 6.1 45.8 54.2 85.5 14.5 Double vocational science 16,143 2.6 45.0 55.0 82.5 17.5
History 196,654 31.3 50.3 49.7 92.9 7.1 Geography 167,441 26.6 55.3 44.7 93.2 6.8 Art 160,691 25.5 36.7 63.3 89.2 10.8
Any modern foreign language 270,401 43.0 44.3 55.7 93.1 6.9 French 159,521 25.4 43.0 57.0 93.9 6.1 German 65,390 10.4 46.7 53.3 95.3 4.7 Other modern foreign language 78,835 12.5 43.0 57.0 90.8 9.2
Health & Social Care 17,039 2.7 4.2 95.8 82.7 17.3 Applied Business 10,604 1.7 57.2 42.8 86.8 13.2 Leisure & Tourism 5,937 0.9 42.6 57.4 86.0 14.0 Applied ICT 5,234 0.8 54.8 45.2 90.4 9.6 All Key Stage 4 pupils 629,218 100 51.0 49.0 88.0 12.0 Note: Excludes pupils with zero entries (2,230 pupils). Source: Authors’ calculations using the National Pupil Database.
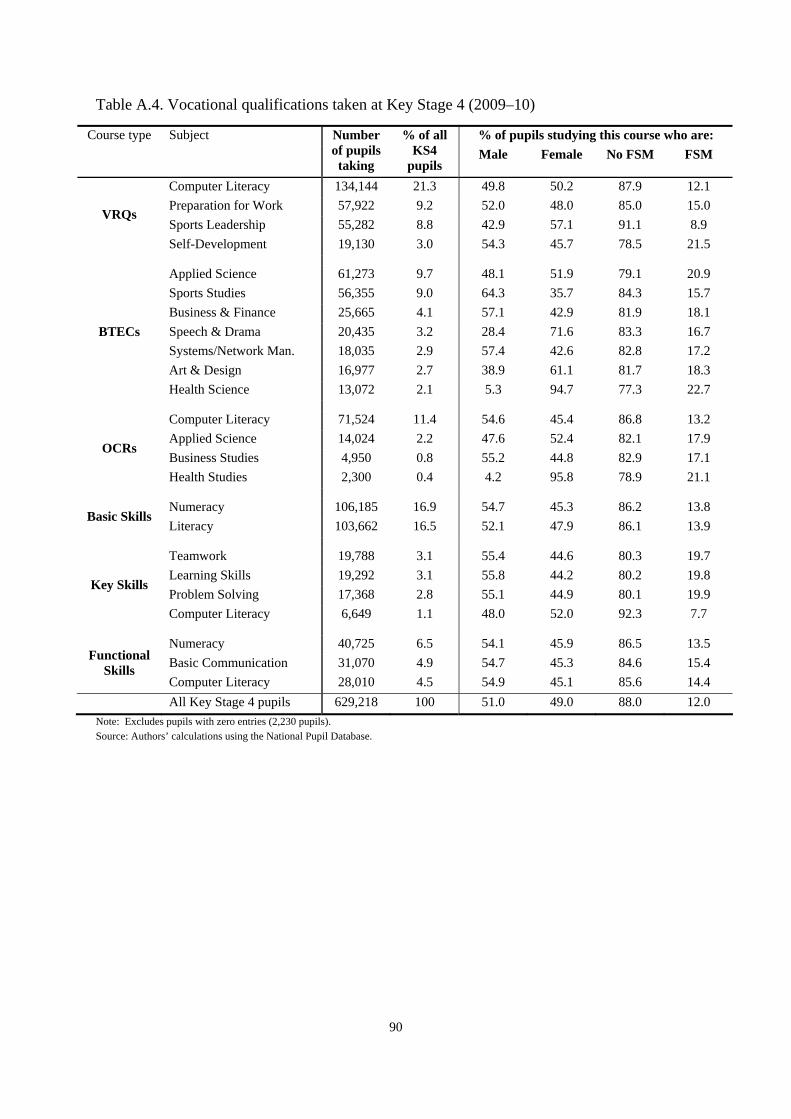
90
Table A.4. Vocational qualifications taken at Key Stage 4 (2009–10)
Course type Subject % of pupils studying this course who are:
Number of pupils taking
% of all KS4
pupils Male Female No FSM FSM
Computer Literacy 134,144 21.3 49.8 50.2 87.9 12.1 Preparation for Work 57,922 9.2 52.0 48.0 85.0 15.0 Sports Leadership 55,282 8.8 42.9 57.1 91.1 8.9
VRQs
Self-Development 19,130 3.0 54.3 45.7 78.5 21.5
Applied Science 61,273 9.7 48.1 51.9 79.1 20.9 Sports Studies 56,355 9.0 64.3 35.7 84.3 15.7 Business & Finance 25,665 4.1 57.1 42.9 81.9 18.1 Speech & Drama 20,435 3.2 28.4 71.6 83.3 16.7 Systems/Network Man. 18,035 2.9 57.4 42.6 82.8 17.2 Art & Design 16,977 2.7 38.9 61.1 81.7 18.3
BTECs
Health Science 13,072 2.1 5.3 94.7 77.3 22.7
Computer Literacy 71,524 11.4 54.6 45.4 86.8 13.2 Applied Science 14,024 2.2 47.6 52.4 82.1 17.9 Business Studies 4,950 0.8 55.2 44.8 82.9 17.1
OCRs
Health Studies 2,300 0.4 4.2 95.8 78.9 21.1
Numeracy 106,185 16.9 54.7 45.3 86.2 13.8 Basic Skills
Literacy 103,662 16.5 52.1 47.9 86.1 13.9
Teamwork 19,788 3.1 55.4 44.6 80.3 19.7 Learning Skills 19,292 3.1 55.8 44.2 80.2 19.8 Problem Solving 17,368 2.8 55.1 44.9 80.1 19.9
Key Skills
Computer Literacy 6,649 1.1 48.0 52.0 92.3 7.7
Numeracy 40,725 6.5 54.1 45.9 86.5 13.5 Basic Communication 31,070 4.9 54.7 45.3 84.6 15.4 Functional
Skills Computer Literacy 28,010 4.5 54.9 45.1 85.6 14.4
All Key Stage 4 pupils 629,218 100 51.0 49.0 88.0 12.0 Note: Excludes pupils with zero entries (2,230 pupils). Source: Authors’ calculations using the National Pupil Database.
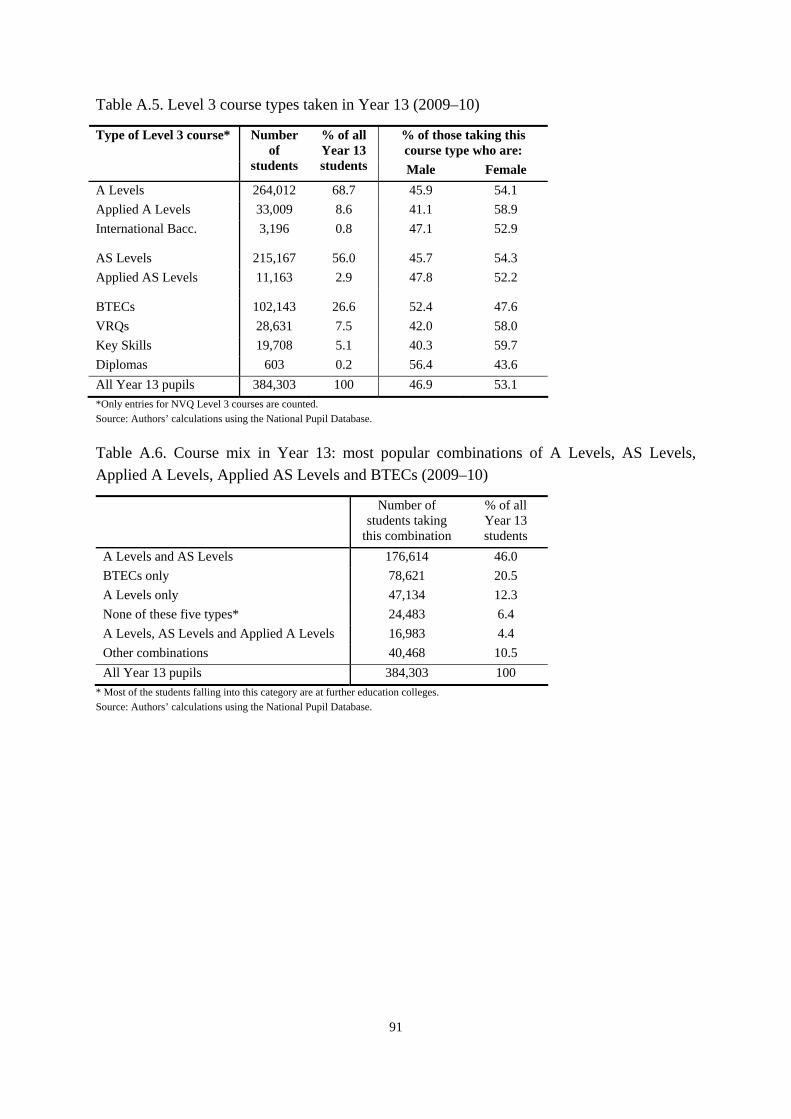
91
Table A.5. Level 3 course types taken in Year 13 (2009–10)
% of those taking this course type who are:
Type of Level 3 course* Number of
students
% of all Year 13 students Male Female
A Levels 264,012 68.7 45.9 54.1 Applied A Levels 33,009 8.6 41.1 58.9 International Bacc. 3,196 0.8 47.1 52.9
AS Levels 215,167 56.0 45.7 54.3 Applied AS Levels 11,163 2.9 47.8 52.2
BTECs 102,143 26.6 52.4 47.6 VRQs 28,631 7.5 42.0 58.0 Key Skills 19,708 5.1 40.3 59.7 Diplomas 603 0.2 56.4 43.6 All Year 13 pupils 384,303 100 46.9 53.1 *Only entries for NVQ Level 3 courses are counted. Source: Authors’ calculations using the National Pupil Database.
Table A.6. Course mix in Year 13: most popular combinations of A Levels, AS Levels, Applied A Levels, Applied AS Levels and BTECs (2009–10)
Number of students taking
this combination
% of all Year 13 students
A Levels and AS Levels 176,614 46.0 BTECs only 78,621 20.5 A Levels only 47,134 12.3 None of these five types* 24,483 6.4 A Levels, AS Levels and Applied A Levels 16,983 4.4 Other combinations 40,468 10.5 All Year 13 pupils 384,303 100
* Most of the students falling into this category are at further education colleges. Source: Authors’ calculations using the National Pupil Database.
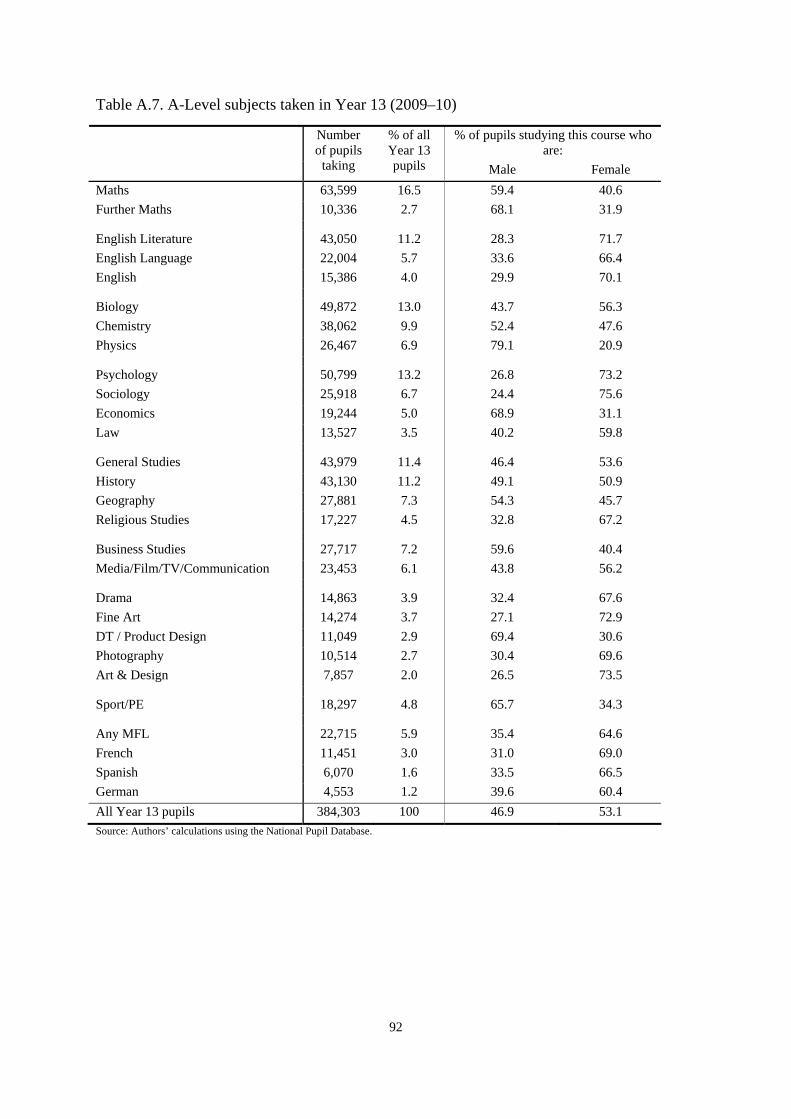
92
Table A.7. A-Level subjects taken in Year 13 (2009–10)
% of pupils studying this course who are:
Number of pupils
taking
% of all Year 13 pupils Male Female
Maths 63,599 16.5 59.4 40.6 Further Maths 10,336 2.7 68.1 31.9
English Literature 43,050 11.2 28.3 71.7 English Language 22,004 5.7 33.6 66.4 English 15,386 4.0 29.9 70.1
Biology 49,872 13.0 43.7 56.3 Chemistry 38,062 9.9 52.4 47.6 Physics 26,467 6.9 79.1 20.9
Psychology 50,799 13.2 26.8 73.2 Sociology 25,918 6.7 24.4 75.6 Economics 19,244 5.0 68.9 31.1 Law 13,527 3.5 40.2 59.8
General Studies 43,979 11.4 46.4 53.6 History 43,130 11.2 49.1 50.9 Geography 27,881 7.3 54.3 45.7 Religious Studies 17,227 4.5 32.8 67.2
Business Studies 27,717 7.2 59.6 40.4 Media/Film/TV/Communication 23,453 6.1 43.8 56.2
Drama 14,863 3.9 32.4 67.6 Fine Art 14,274 3.7 27.1 72.9 DT / Product Design 11,049 2.9 69.4 30.6 Photography 10,514 2.7 30.4 69.6 Art & Design 7,857 2.0 26.5 73.5
Sport/PE 18,297 4.8 65.7 34.3
Any MFL 22,715 5.9 35.4 64.6 French 11,451 3.0 31.0 69.0 Spanish 6,070 1.6 33.5 66.5 German 4,553 1.2 39.6 60.4 All Year 13 pupils 384,303 100 46.9 53.1 Source: Authors’ calculations using the National Pupil Database.
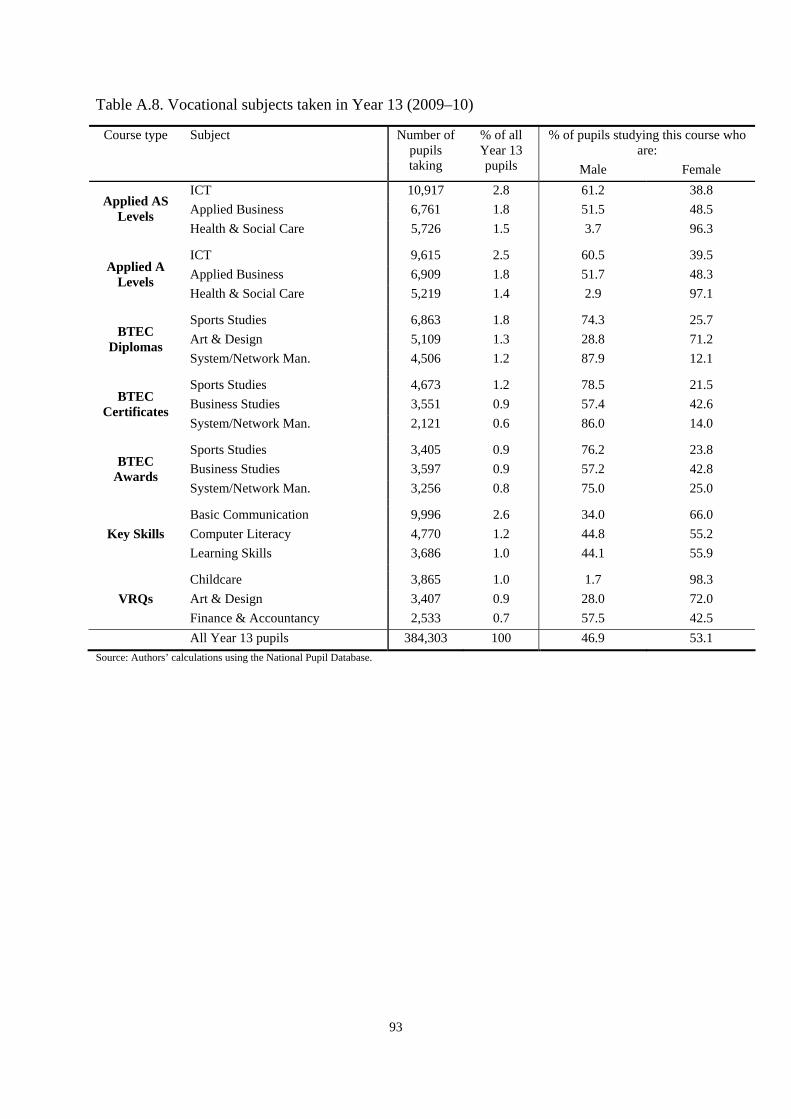
93
Table A.8. Vocational subjects taken in Year 13 (2009–10)
% of pupils studying this course who are:
Course type Subject Number of pupils taking
% of all Year 13 pupils Male Female
ICT 10,917 2.8 61.2 38.8 Applied Business 6,761 1.8 51.5 48.5 Applied AS
Levels Health & Social Care 5,726 1.5 3.7 96.3
ICT 9,615 2.5 60.5 39.5 Applied Business 6,909 1.8 51.7 48.3 Applied A
Levels Health & Social Care 5,219 1.4 2.9 97.1
Sports Studies 6,863 1.8 74.3 25.7 Art & Design 5,109 1.3 28.8 71.2 BTEC
Diplomas System/Network Man. 4,506 1.2 87.9 12.1
Sports Studies 4,673 1.2 78.5 21.5 Business Studies 3,551 0.9 57.4 42.6 BTEC
Certificates System/Network Man. 2,121 0.6 86.0 14.0
Sports Studies 3,405 0.9 76.2 23.8 Business Studies 3,597 0.9 57.2 42.8 BTEC
Awards System/Network Man. 3,256 0.8 75.0 25.0
Basic Communication 9,996 2.6 34.0 66.0 Computer Literacy 4,770 1.2 44.8 55.2 Key Skills Learning Skills 3,686 1.0 44.1 55.9
Childcare 3,865 1.0 1.7 98.3 Art & Design 3,407 0.9 28.0 72.0 VRQs Finance & Accountancy 2,533 0.7 57.5 42.5
All Year 13 pupils 384,303 100 46.9 53.1 Source: Authors’ calculations using the National Pupil Database.
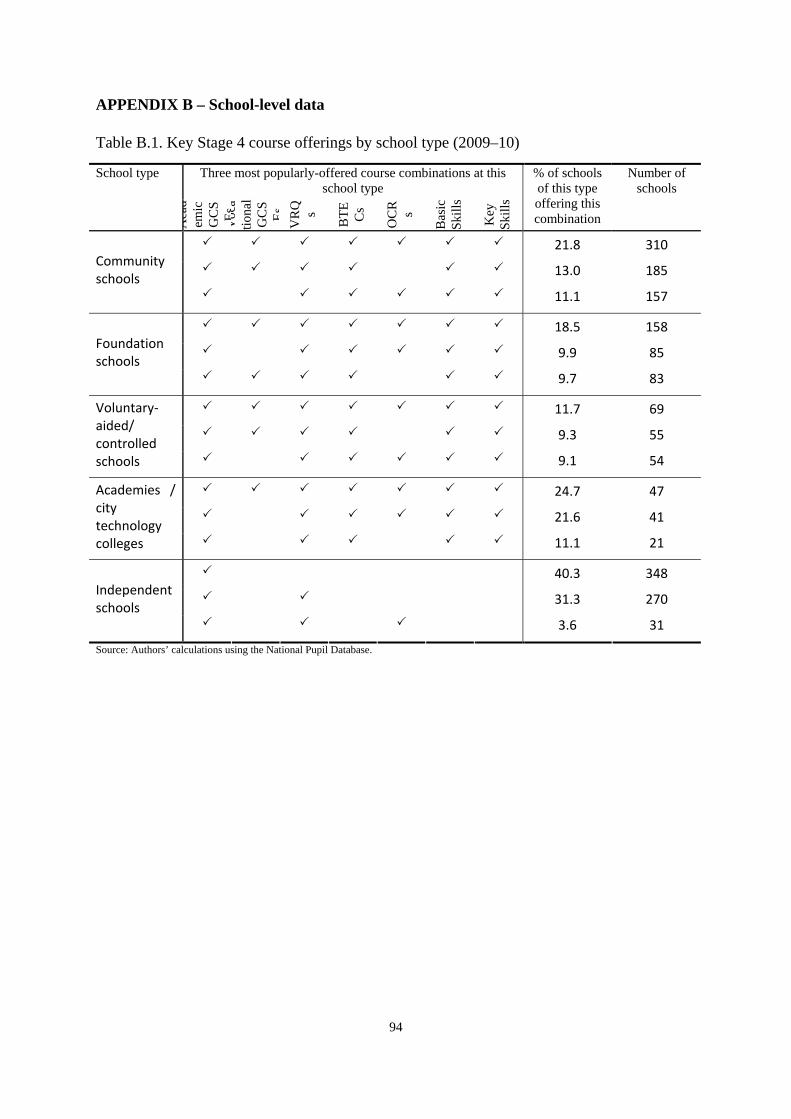
94
APPENDIX B – School-level data
Table B.1. Key Stage 4 course offerings by school type (2009–10)
Three most popularly-offered course combinations at this school type
School type A
cad
emic
G
CS
Es Voc
atio
nal
GC
SEs VR
Q s
BTE Cs
OC
R s
Bas
ic
Skill
s
Key
Sk
ills
% of schools of this type offering this combination
Number of schools
21.8 310
13.0 185 Community schools
11.1 157
18.5 158
9.9 85 Foundation schools
9.7 83
11.7 69
9.3 55
Voluntary‐aided/ controlled schools 9.1 54
24.7 47
21.6 41
Academies / city technology colleges 11.1 21
40.3 348
31.3 270 Independent schools
3.6 31
Source: Authors’ calculations using the National Pupil Database.
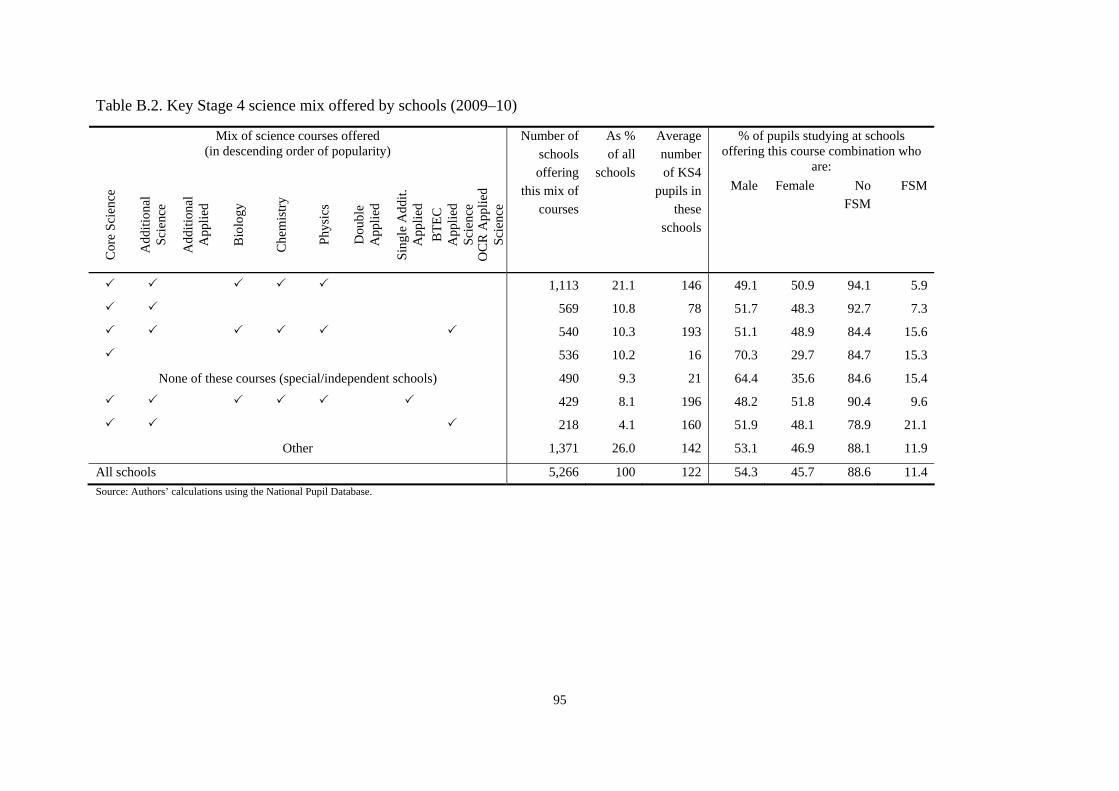
Table B.2. Key Stage 4 science mix offered by schools (2009–10)
Mix of science courses offered (in descending order of popularity)
% of pupils studying at schools offering this course combination who
are:
Cor
e Sc
ienc
e
Add
ition
al
Scie
nce
Add
ition
al
App
lied
Bio
logy
Che
mis
try
Phys
ics
Dou
ble
App
lied
Sing
le A
ddit.
A
pplie
d B
TEC
A
pplie
d Sc
ienc
e O
CR
App
lied
Scie
nce
Number of schools offering
this mix of courses
As % of all
schools
Average number of KS4
pupils in these
schools
Male Female No FSM
FSM
1,113 21.1 146 49.1 50.9 94.1 5.9
569 10.8 78 51.7 48.3 92.7 7.3
540 10.3 193 51.1 48.9 84.4 15.6
536 10.2 16 70.3 29.7 84.7 15.3
None of these courses (special/independent schools) 490 9.3 21 64.4 35.6 84.6 15.4
429 8.1 196 48.2 51.8 90.4 9.6
218 4.1 160 51.9 48.1 78.9 21.1
Other 1,371 26.0 142 53.1 46.9 88.1 11.9
All schools 5,266 100 122 54.3 45.7 88.6 11.4 Source: Authors’ calculations using the National Pupil Database.
95
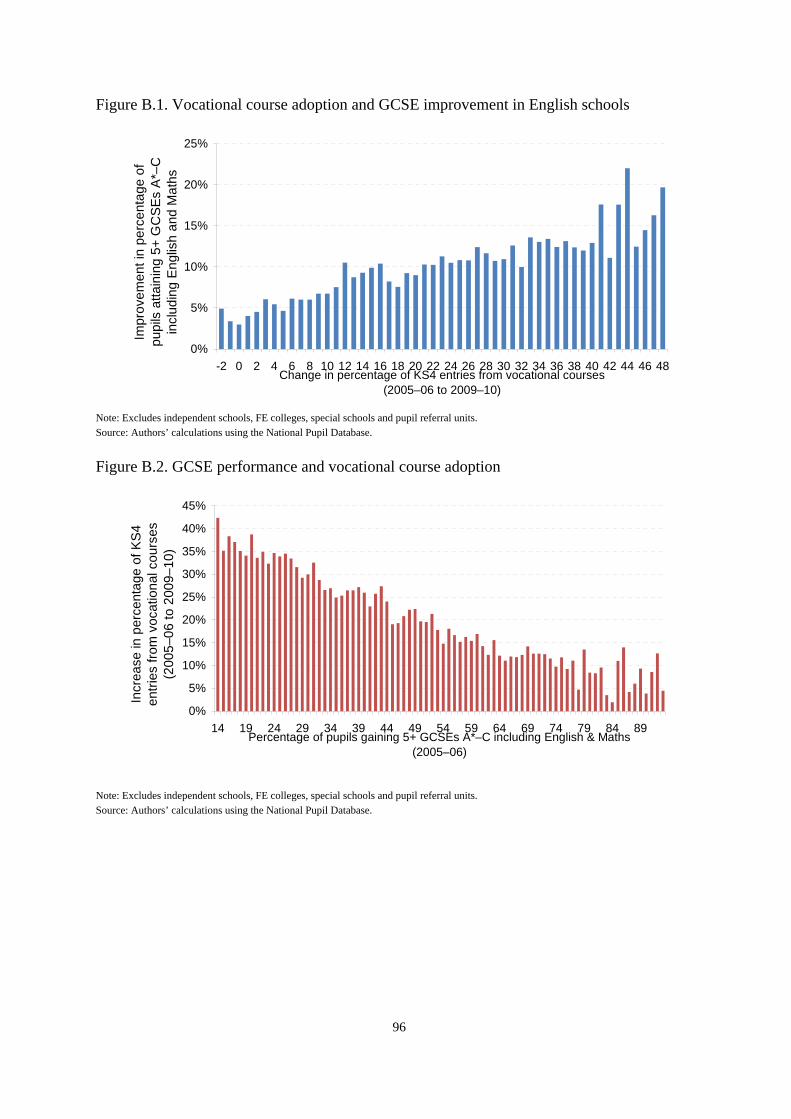
Figure B.1. Vocational course adoption and GCSE improvement in English schools
0%
5%
10%
15%
20%
25%
-2 0 2 4 6 8 10 12 14 16 18 20 22 24 26 28 30 32 34 36 38 40 42 44 46 48Change in percentage of KS4 entries from vocational courses
(2005–06 to 2009–10)
Impr
ovem
ent i
n pe
rcen
tage
of
pupi
ls a
ttain
ing
5+ G
CSE
s A*
–C
incl
udin
g En
glis
h an
d M
aths
Note: Excludes independent schools, FE colleges, special schools and pupil referral units. Source: Authors’ calculations using the National Pupil Database.
Figure B.2. GCSE performance and vocational course adoption
0%
5%
10%
15%
20%
25%
30%
35%
40%
45%
14 19 24 29 34 39 44 49 54 59 64 69 74 79 84 89Percentage of pupils gaining 5+ GCSEs A*–C including English & Maths
(2005–06)
Incr
ease
in p
erce
ntag
e of
KS4
en
tries
from
voc
atio
nal c
ours
es(2
005–
06 to
200
9–10
)
NoteSour
: Excludes independent schools, FE colleges, special schools and pupil referral units. ce: Authors’ calculations using the National Pupil Database.
96
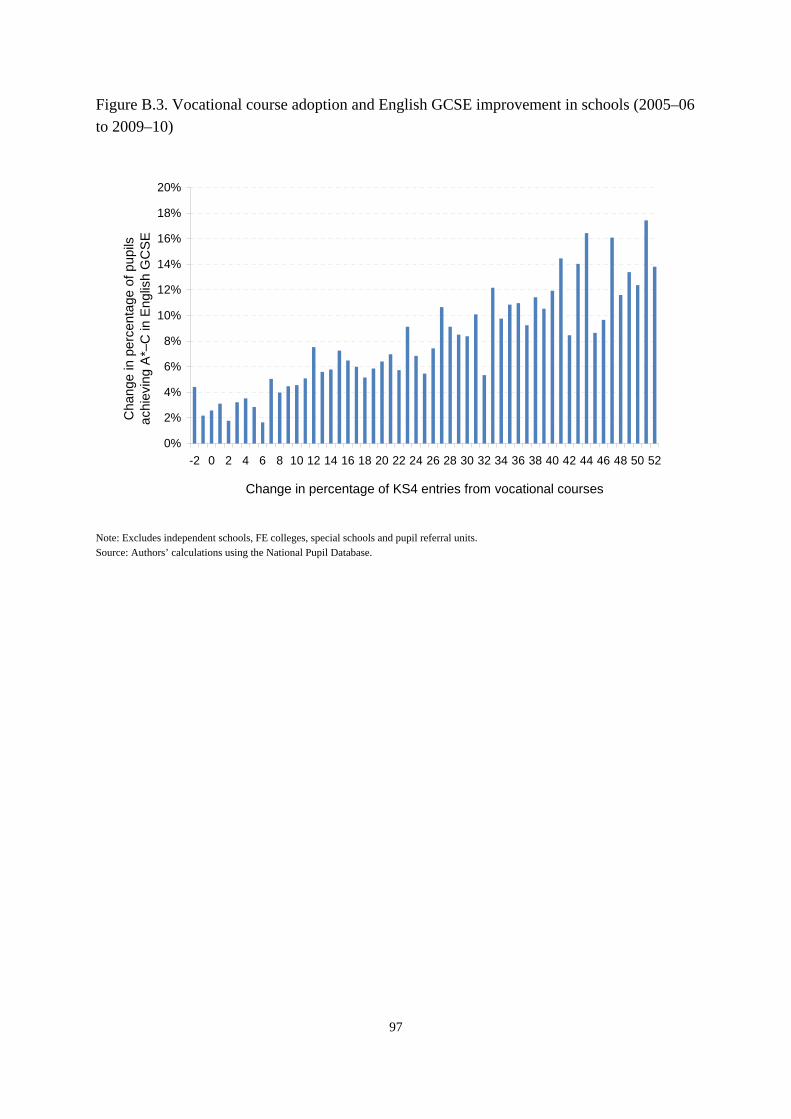
Figure B.3. Vocational course adoption and English GCSE improvement in schools (2005–06 to 2009–10)
0%
2%
4%
6%
8%
10%
12%
14%
16%
18%
20%
-2 0 2 4 6 8 10 12 14 16 18 20 22 24 26 28 30 32 34 36 38 40 42 44 46 48 50 52
Change in percentage of KS4 entries from vocational courses
Cha
nge
in p
erce
ntag
e of
pup
ilsac
hiev
ing
A*–C
in E
nglis
h G
CSE
Note: Excludes independent schools, FE colleges, special schools and pupil referral units. Source: Authors’ calculations using the National Pupil Database.
97
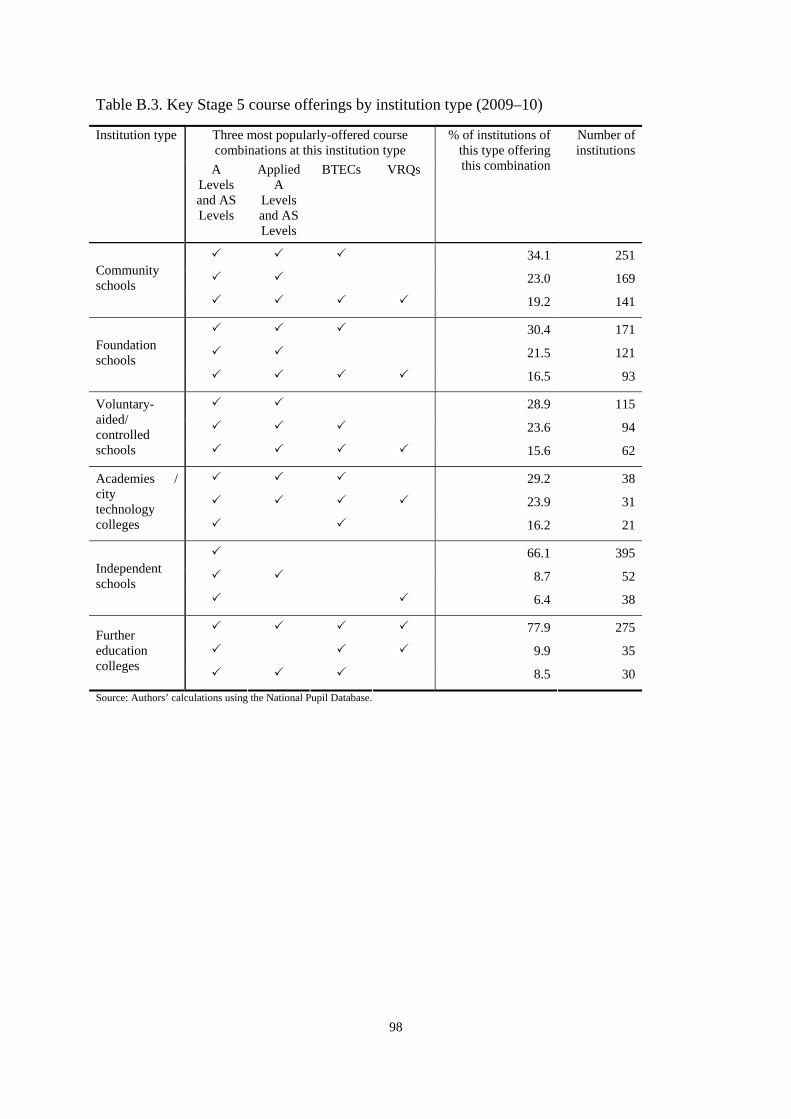
Table B.3. Key Stage 5 course offerings by institution type (2009–10)
Three most popularly-offered course combinations at this institution type
Institution type
A Levels and AS Levels
Applied A
Levels and AS Levels
BTECs VRQs
% of institutions of this type offering this combination
Number of institutions
34.1 251
23.0 169 Community schools
19.2 141
30.4 171
21.5 121 Foundation schools
16.5 93
28.9 115
23.6 94
Voluntary-aided/ controlled schools 15.6 62
29.2 38
23.9 31
Academies / city technology colleges 16.2 21
66.1 395
8.7 52 Independent schools
6.4 38
77.9 275
9.9 35 Further education colleges 8.5 30
Source: Authors’ calculations using the National Pupil Database.
98

APPENDIX C – Regression results: Table C.1. Triple science at Key Stage 4
99
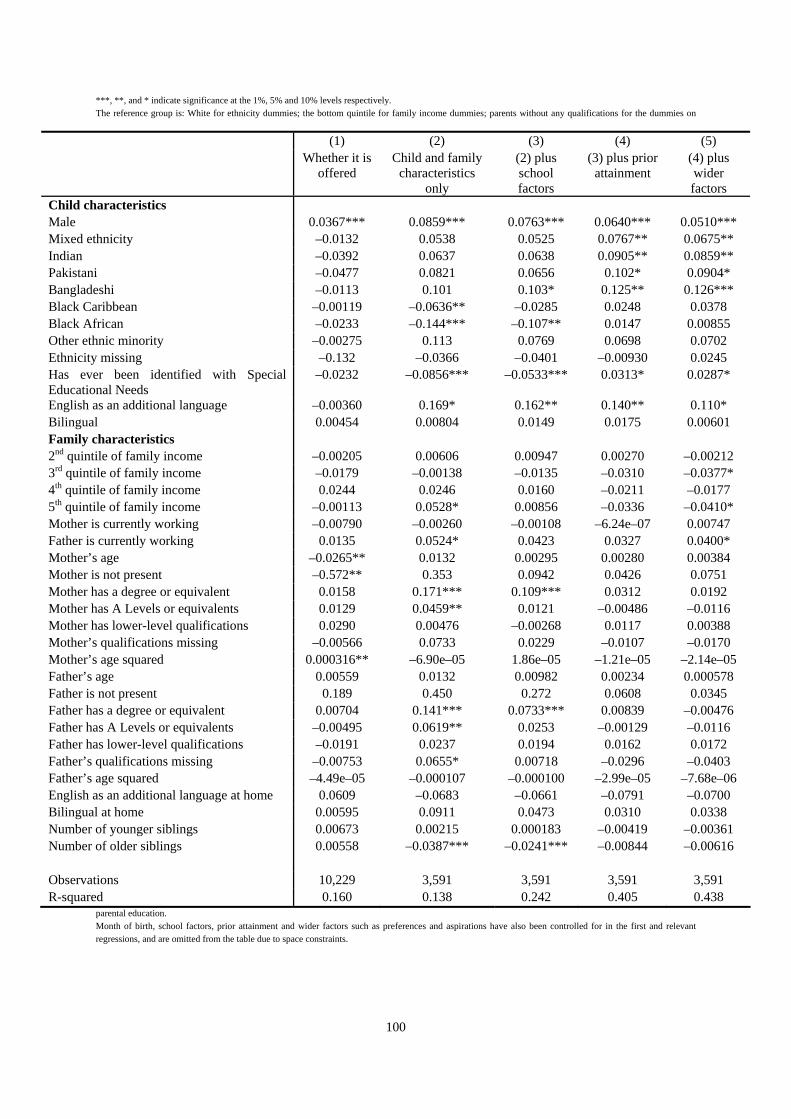
***, **, and * indicate significance at the 1%, 5% and 10% levels respectively. The reference group is: White for ethnicity dummies; the bottom quintile for family income dummies; parents without any qualifications for the dummies on
parental education.
(1) (2) (3) (4) (5) Whether it is
offered Child and family
characteristics only
(2) plus school factors
(3) plus prior attainment
(4) plus wider factors
Child characteristics Male 0.0367*** 0.0859*** 0.0763*** 0.0640*** 0.0510*** Mixed ethnicity –0.0132 0.0538 0.0525 0.0767** 0.0675** Indian –0.0392 0.0637 0.0638 0.0905** 0.0859** Pakistani –0.0477 0.0821 0.0656 0.102* 0.0904* Bangladeshi –0.0113 0.101 0.103* 0.125** 0.126*** Black Caribbean –0.00119 –0.0636** –0.0285 0.0248 0.0378 Black African –0.0233 –0.144*** –0.107** 0.0147 0.00855 Other ethnic minority –0.00275 0.113 0.0769 0.0698 0.0702 Ethnicity missing –0.132 –0.0366 –0.0401 –0.00930 0.0245 Has ever been identified with Special Educational Needs
–0.0232 –0.0856*** –0.0533*** 0.0313* 0.0287*
English as an additional language –0.00360 0.169* 0.162** 0.140** 0.110* Bilingual 0.00454 0.00804 0.0149 0.0175 0.00601 Family characteristics 2nd quintile of family income –0.00205 0.00606 0.00947 0.00270 –0.00212 3rd quintile of family income –0.0179 –0.00138 –0.0135 –0.0310 –0.0377* 4th quintile of family income 0.0244 0.0246 0.0160 –0.0211 –0.0177 5th quintile of family income –0.00113 0.0528* 0.00856 –0.0336 –0.0410* Mother is currently working –0.00790 –0.00260 –0.00108 –6.24e–07 0.00747 Father is currently working 0.0135 0.0524* 0.0423 0.0327 0.0400* Mother’s age –0.0265** 0.0132 0.00295 0.00280 0.00384 Mother is not present –0.572** 0.353 0.0942 0.0426 0.0751 Mother has a degree or equivalent 0.0158 0.171*** 0.109*** 0.0312 0.0192 Mother has A Levels or equivalents 0.0129 0.0459** 0.0121 –0.00486 –0.0116 Mother has lower-level qualifications 0.0290 0.00476 –0.00268 0.0117 0.00388 Mother’s qualifications missing –0.00566 0.0733 0.0229 –0.0107 –0.0170 Mother’s age squared 0.000316** –6.90e–05 1.86e–05 –1.21e–05 –2.14e–05 Father’s age 0.00559 0.0132 0.00982 0.00234 0.000578 Father is not present 0.189 0.450 0.272 0.0608 0.0345 Father has a degree or equivalent 0.00704 0.141*** 0.0733*** 0.00839 –0.00476 Father has A Levels or equivalents –0.00495 0.0619** 0.0253 –0.00129 –0.0116 Father has lower-level qualifications –0.0191 0.0237 0.0194 0.0162 0.0172 Father’s qualifications missing –0.00753 0.0655* 0.00718 –0.0296 –0.0403 Father’s age squared –4.49e–05 –0.000107 –0.000100 –2.99e–05 –7.68e–06 English as an additional language at home 0.0609 –0.0683 –0.0661 –0.0791 –0.0700 Bilingual at home 0.00595 0.0911 0.0473 0.0310 0.0338 Number of younger siblings 0.00673 0.00215 0.000183 –0.00419 –0.00361 Number of older siblings 0.00558 –0.0387*** –0.0241*** –0.00844 –0.00616 Observations 10,229 3,591 3,591 3,591 3,591 R-squared 0.160 0.138 0.242 0.405 0.438
Month of birth, school factors, prior attainment and wider factors such as preferences and aspirations have also been controlled for in the first and relevant egressions, and are omitted from the table due to space constraints. r
100
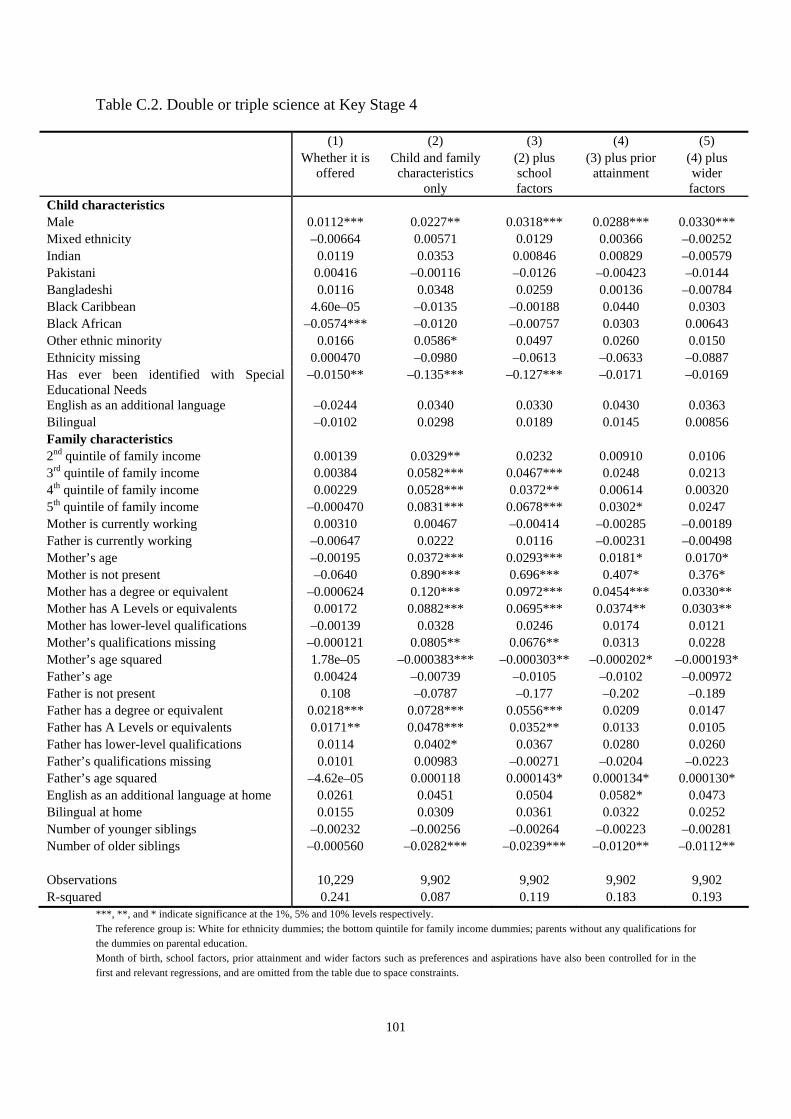
Table C.2. Double or triple science at Key Stage 4
***, **, and * indicate significance at the 1%, 5% and 10% levels respectively.
(1) (2) (3) (4) (5) Whether it is
offered Child and family
characteristics only
(2) plus school factors
(3) plus prior attainment
(4) plus wider factors
Child characteristics Male 0.0112*** 0.0227** 0.0318*** 0.0288*** 0.0330*** Mixed ethnicity –0.00664 0.00571 0.0129 0.00366 –0.00252 Indian 0.0119 0.0353 0.00846 0.00829 –0.00579 Pakistani 0.00416 –0.00116 –0.0126 –0.00423 –0.0144 Bangladeshi 0.0116 0.0348 0.0259 0.00136 –0.00784 Black Caribbean 4.60e–05 –0.0135 –0.00188 0.0440 0.0303 Black African –0.0574*** –0.0120 –0.00757 0.0303 0.00643 Other ethnic minority 0.0166 0.0586* 0.0497 0.0260 0.0150 Ethnicity missing 0.000470 –0.0980 –0.0613 –0.0633 –0.0887 Has ever been identified with Special Educational Needs
–0.0150** –0.135*** –0.127*** –0.0171 –0.0169
English as an additional language –0.0244 0.0340 0.0330 0.0430 0.0363 Bilingual –0.0102 0.0298 0.0189 0.0145 0.00856 Family characteristics 2nd quintile of family income 0.00139 0.0329** 0.0232 0.00910 0.0106 3rd quintile of family income 0.00384 0.0582*** 0.0467*** 0.0248 0.0213 4th quintile of family income 0.00229 0.0528*** 0.0372** 0.00614 0.00320 5th quintile of family income –0.000470 0.0831*** 0.0678*** 0.0302* 0.0247 Mother is currently working 0.00310 0.00467 –0.00414 –0.00285 –0.00189 Father is currently working –0.00647 0.0222 0.0116 –0.00231 –0.00498 Mother’s age –0.00195 0.0372*** 0.0293*** 0.0181* 0.0170* Mother is not present –0.0640 0.890*** 0.696*** 0.407* 0.376* Mother has a degree or equivalent –0.000624 0.120*** 0.0972*** 0.0454*** 0.0330** Mother has A Levels or equivalents 0.00172 0.0882*** 0.0695*** 0.0374** 0.0303** Mother has lower-level qualifications –0.00139 0.0328 0.0246 0.0174 0.0121 Mother’s qualifications missing –0.000121 0.0805** 0.0676** 0.0313 0.0228 Mother’s age squared 1.78e–05 –0.000383*** –0.000303** –0.000202* –0.000193* Father’s age 0.00424 –0.00739 –0.0105 –0.0102 –0.00972 Father is not present 0.108 –0.0787 –0.177 –0.202 –0.189 Father has a degree or equivalent 0.0218*** 0.0728*** 0.0556*** 0.0209 0.0147 Father has A Levels or equivalents 0.0171** 0.0478*** 0.0352** 0.0133 0.0105 Father has lower-level qualifications 0.0114 0.0402* 0.0367 0.0280 0.0260 Father’s qualifications missing 0.0101 0.00983 –0.00271 –0.0204 –0.0223 Father’s age squared –4.62e–05 0.000118 0.000143* 0.000134* 0.000130* English as an additional language at home 0.0261 0.0451 0.0504 0.0582* 0.0473 Bilingual at home 0.0155 0.0309 0.0361 0.0322 0.0252 Number of younger siblings –0.00232 –0.00256 –0.00264 –0.00223 –0.00281 Number of older siblings –0.000560 –0.0282*** –0.0239*** –0.0120** –0.0112** Observations 10,229 9,902 9,902 9,902 9,902 R-squared 0.241 0.087 0.119 0.183 0.193
The reference group is: White for ethnicity dummies; the bottom quintile for family income dummies; parents without any qualifications for the dummies on parental education. Month of birth, school factors, prior attainment and wider factors such as preferences and aspirations have also been controlled for in the first and relevant regressions, and are omitted from the table due to space constraints.
101
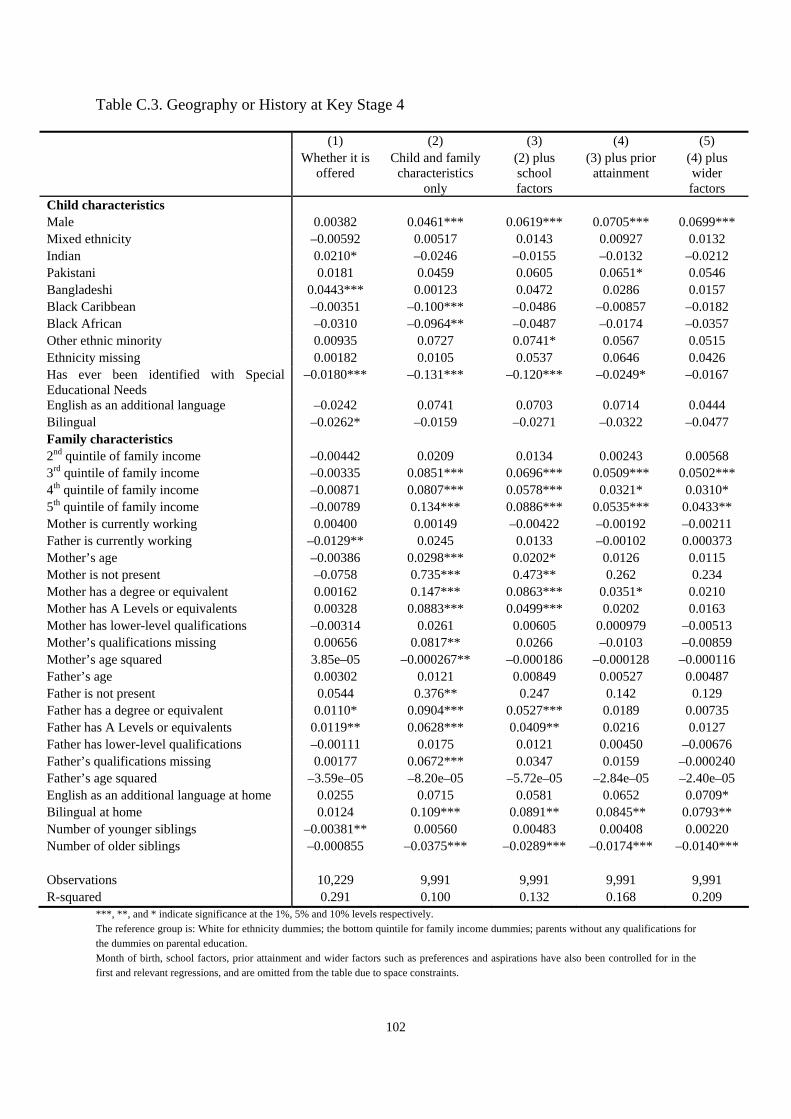
Table C.3. Geography or History at Key Stage 4
***, **, and * indicate significance at the 1%, 5% and 10% levels respectively.
(1) (2) (3) (4) (5) Whether it is
offered Child and family
characteristics only
(2) plus school factors
(3) plus prior attainment
(4) plus wider factors
Child characteristics Male 0.00382 0.0461*** 0.0619*** 0.0705*** 0.0699*** Mixed ethnicity –0.00592 0.00517 0.0143 0.00927 0.0132 Indian 0.0210* –0.0246 –0.0155 –0.0132 –0.0212 Pakistani 0.0181 0.0459 0.0605 0.0651* 0.0546 Bangladeshi 0.0443*** 0.00123 0.0472 0.0286 0.0157 Black Caribbean –0.00351 –0.100*** –0.0486 –0.00857 –0.0182 Black African –0.0310 –0.0964** –0.0487 –0.0174 –0.0357 Other ethnic minority 0.00935 0.0727 0.0741* 0.0567 0.0515 Ethnicity missing 0.00182 0.0105 0.0537 0.0646 0.0426 Has ever been identified with Special Educational Needs
–0.0180*** –0.131*** –0.120*** –0.0249* –0.0167
English as an additional language –0.0242 0.0741 0.0703 0.0714 0.0444 Bilingual –0.0262* –0.0159 –0.0271 –0.0322 –0.0477 Family characteristics 2nd quintile of family income –0.00442 0.0209 0.0134 0.00243 0.00568 3rd quintile of family income –0.00335 0.0851*** 0.0696*** 0.0509*** 0.0502*** 4th quintile of family income –0.00871 0.0807*** 0.0578*** 0.0321* 0.0310* 5th quintile of family income –0.00789 0.134*** 0.0886*** 0.0535*** 0.0433** Mother is currently working 0.00400 0.00149 –0.00422 –0.00192 –0.00211 Father is currently working –0.0129** 0.0245 0.0133 –0.00102 0.000373 Mother’s age –0.00386 0.0298*** 0.0202* 0.0126 0.0115 Mother is not present –0.0758 0.735*** 0.473** 0.262 0.234 Mother has a degree or equivalent 0.00162 0.147*** 0.0863*** 0.0351* 0.0210 Mother has A Levels or equivalents 0.00328 0.0883*** 0.0499*** 0.0202 0.0163 Mother has lower-level qualifications –0.00314 0.0261 0.00605 0.000979 –0.00513 Mother’s qualifications missing 0.00656 0.0817** 0.0266 –0.0103 –0.00859 Mother’s age squared 3.85e–05 –0.000267** –0.000186 –0.000128 –0.000116 Father’s age 0.00302 0.0121 0.00849 0.00527 0.00487 Father is not present 0.0544 0.376** 0.247 0.142 0.129 Father has a degree or equivalent 0.0110* 0.0904*** 0.0527*** 0.0189 0.00735 Father has A Levels or equivalents 0.0119** 0.0628*** 0.0409** 0.0216 0.0127 Father has lower-level qualifications –0.00111 0.0175 0.0121 0.00450 –0.00676 Father’s qualifications missing 0.00177 0.0672*** 0.0347 0.0159 –0.000240 Father’s age squared –3.59e–05 –8.20e–05 –5.72e–05 –2.84e–05 –2.40e–05 English as an additional language at home 0.0255 0.0715 0.0581 0.0652 0.0709* Bilingual at home 0.0124 0.109*** 0.0891** 0.0845** 0.0793** Number of younger siblings –0.00381** 0.00560 0.00483 0.00408 0.00220 Number of older siblings –0.000855 –0.0375*** –0.0289*** –0.0174*** –0.0140*** Observations 10,229 9,991 9,991 9,991 9,991 R-squared 0.291 0.100 0.132 0.168 0.209
The reference group is: White for ethnicity dummies; the bottom quintile for family income dummies; parents without any qualifications for the dummies on parental education. Month of birth, school factors, prior attainment and wider factors such as preferences and aspirations have also been controlled for in the first and relevant regressions, and are omitted from the table due to space constraints.
102
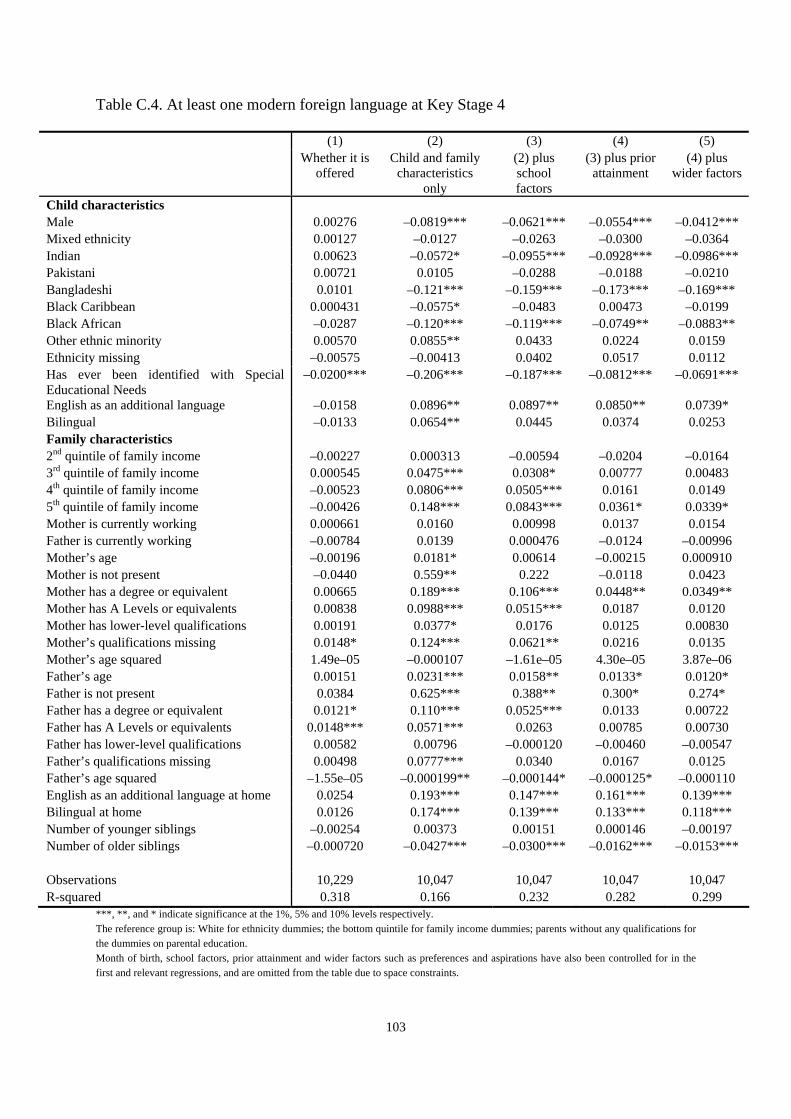
Table C.4. At least one modern foreign language at Key Stage 4
***, **, and * indicate significance at the 1%, 5% and 10% levels respectively.
(1) (2) (3) (4) (5) Whether it is
offered Child and family
characteristics only
(2) plus school factors
(3) plus prior attainment
(4) plus wider factors
Child characteristics Male 0.00276 –0.0819*** –0.0621*** –0.0554*** –0.0412*** Mixed ethnicity 0.00127 –0.0127 –0.0263 –0.0300 –0.0364 Indian 0.00623 –0.0572* –0.0955*** –0.0928*** –0.0986*** Pakistani 0.00721 0.0105 –0.0288 –0.0188 –0.0210 Bangladeshi 0.0101 –0.121*** –0.159*** –0.173*** –0.169*** Black Caribbean 0.000431 –0.0575* –0.0483 0.00473 –0.0199 Black African –0.0287 –0.120*** –0.119*** –0.0749** –0.0883** Other ethnic minority 0.00570 0.0855** 0.0433 0.0224 0.0159 Ethnicity missing –0.00575 –0.00413 0.0402 0.0517 0.0112 Has ever been identified with Special Educational Needs
–0.0200*** –0.206*** –0.187*** –0.0812*** –0.0691***
English as an additional language –0.0158 0.0896** 0.0897** 0.0850** 0.0739* Bilingual –0.0133 0.0654** 0.0445 0.0374 0.0253 Family characteristics 2nd quintile of family income –0.00227 0.000313 –0.00594 –0.0204 –0.0164 3rd quintile of family income 0.000545 0.0475*** 0.0308* 0.00777 0.00483 4th quintile of family income –0.00523 0.0806*** 0.0505*** 0.0161 0.0149 5th quintile of family income –0.00426 0.148*** 0.0843*** 0.0361* 0.0339* Mother is currently working 0.000661 0.0160 0.00998 0.0137 0.0154 Father is currently working –0.00784 0.0139 0.000476 –0.0124 –0.00996 Mother’s age –0.00196 0.0181* 0.00614 –0.00215 0.000910 Mother is not present –0.0440 0.559** 0.222 –0.0118 0.0423 Mother has a degree or equivalent 0.00665 0.189*** 0.106*** 0.0448** 0.0349** Mother has A Levels or equivalents 0.00838 0.0988*** 0.0515*** 0.0187 0.0120 Mother has lower-level qualifications 0.00191 0.0377* 0.0176 0.0125 0.00830 Mother’s qualifications missing 0.0148* 0.124*** 0.0621** 0.0216 0.0135 Mother’s age squared 1.49e–05 –0.000107 –1.61e–05 4.30e–05 3.87e–06 Father’s age 0.00151 0.0231*** 0.0158** 0.0133* 0.0120* Father is not present 0.0384 0.625*** 0.388** 0.300* 0.274* Father has a degree or equivalent 0.0121* 0.110*** 0.0525*** 0.0133 0.00722 Father has A Levels or equivalents 0.0148*** 0.0571*** 0.0263 0.00785 0.00730 Father has lower-level qualifications 0.00582 0.00796 –0.000120 –0.00460 –0.00547 Father’s qualifications missing 0.00498 0.0777*** 0.0340 0.0167 0.0125 Father’s age squared –1.55e–05 –0.000199** –0.000144* –0.000125* –0.000110 English as an additional language at home 0.0254 0.193*** 0.147*** 0.161*** 0.139*** Bilingual at home 0.0126 0.174*** 0.139*** 0.133*** 0.118*** Number of younger siblings –0.00254 0.00373 0.00151 0.000146 –0.00197 Number of older siblings –0.000720 –0.0427*** –0.0300*** –0.0162*** –0.0153*** Observations 10,229 10,047 10,047 10,047 10,047 R-squared 0.318 0.166 0.232 0.282 0.299
The reference group is: White for ethnicity dummies; the bottom quintile for family income dummies; parents without any qualifications for the dummies on parental education. Month of birth, school factors, prior attainment and wider factors such as preferences and aspirations have also been controlled for in the first and relevant regressions, and are omitted from the table due to space constraints.
103

Table C.5. English Baccalaureate at Key Stage 4
***, **, and * indicate significance at the 1%, 5% and 10% levels respectively.
(1) (2) (3) (4) (5) Whether it is
offered Child and family
characteristics only
(2) plus school factors
(3) plus prior attainment
(4) plus wider factors
Child characteristics Male 0.0103** –0.00812 0.00551 0.0106 0.0190* Mixed ethnicity –0.0104 0.00896 0.00788 0.00775 0.00797 Indian 0.0102 –0.0566 –0.0792** –0.0671** –0.0746** Pakistani 0.00490 –0.00266 –0.0187 0.000932 –0.00522 Bangladeshi 0.0321* –0.0672 –0.0655 –0.0601 –0.0621 Black Caribbean 0.0116 –0.0888*** –0.0683*** –0.0138 –0.0297 Black African –0.0525** –0.165*** –0.145*** –0.0902*** –0.110*** Other ethnic minority 0.000496 0.0951** 0.0596 0.0455 0.0415 Ethnicity missing 0.00620 –0.0985 –0.0550 –0.0246 –0.0666 Has ever been identified with Special Educational Needs
–0.0181*** –0.140*** –0.123*** –0.0345*** –0.0258**
English as an additional language –0.0247 0.122** 0.122*** 0.112** 0.0907** Bilingual –0.0181 –0.000624 –0.0166 –0.0249 –0.0397 Family characteristics 2nd quintile of family income –0.00293 0.00965 0.00273 –0.00363 0.00140 3rd quintile of family income –0.00296 0.0590*** 0.0427*** 0.0271* 0.0279* 4th quintile of family income –0.00494 0.0628*** 0.0354** 0.0106 0.0119 5th quintile of family income –0.00534 0.141*** 0.0878*** 0.0485** 0.0441** Mother is currently working –0.000532 0.00323 –0.00326 0.000875 0.00272 Father is currently working –0.0175** 0.0327* 0.0164 0.00640 0.00960 Mother’s age –0.00421 0.0238** 0.0120 0.00475 0.00575 Mother is not present –0.105 0.630*** 0.310 0.0991 0.114 Mother has a degree or equivalent 0.00652 0.179*** 0.107*** 0.0476*** 0.0360** Mother has A Levels or equivalents 0.00766 0.0790*** 0.0369*** 0.00981 0.00541 Mother has lower-level qualifications 0.00243 0.0199 0.00211 0.000467 –0.00294 Mother’s qualifications missing 0.00301 0.0749** 0.0211 –0.0122 –0.0119 Mother’s age squared 4.24e–05 –0.000185 –8.79e–05 –3.89e–05 –5.06e–05 Father’s age 0.00703 0.0219*** 0.0166** 0.0139** 0.0137** Father is not present 0.167* 0.627*** 0.438*** 0.345** 0.339** Father has a degree or equivalent 0.0291*** 0.120*** 0.0696*** 0.0225 0.0124 Father has A Levels or equivalents 0.0259*** 0.0573*** 0.0310** 0.0136 0.00838 Father has lower-level qualifications 0.0173 0.00646 0.00131 –0.00439 –0.0105 Father’s qualifications missing 0.0170* 0.0664*** 0.0275 0.00830 –0.00141 Father’s age squared –7.60e–05 –0.000175** –0.000138* –0.000116 –0.000113 English as an additional language at home 0.0367* 0.115** 0.0882** 0.0998** 0.0937** Bilingual at home 0.0235 0.171*** 0.144*** 0.139*** 0.131*** Number of younger siblings –0.00361 0.0124** 0.0103** 0.00754 0.00568 Number of older siblings –0.00197 –0.0431*** –0.0319*** –0.0205*** –0.0180*** Observations 10,229 9,782 9,782 9,782 9,782 R-squared 0.212 0.148 0.207 0.261 0.288
The reference group is: White for ethnicity dummies; the bottom quintile for family income dummies; parents without any qualifications for the dummies on parental education. Month of birth, school factors, prior attainment and wider factors such as preferences and aspirations have also been controlled for in the first and relevant regressions, and are omitted from the table due to space constraints.
104
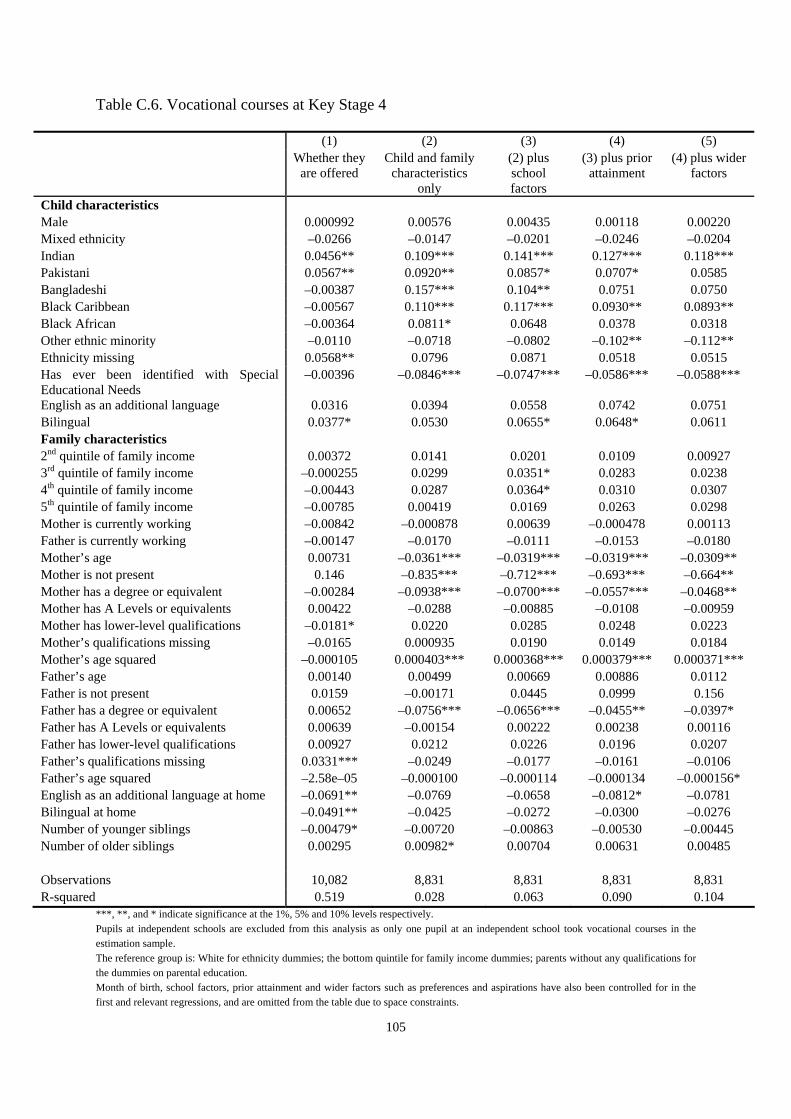
Table C.6. Vocational courses at Key Stage 4
***, **, and * indicate significance at the 1%, 5% and 10% levels respectively.
(1) (2) (3) (4) (5) Whether they
are offered Child and family
characteristics only
(2) plus school factors
(3) plus prior attainment
(4) plus wider factors
Child characteristics Male 0.000992 0.00576 0.00435 0.00118 0.00220 Mixed ethnicity –0.0266 –0.0147 –0.0201 –0.0246 –0.0204 Indian 0.0456** 0.109*** 0.141*** 0.127*** 0.118*** Pakistani 0.0567** 0.0920** 0.0857* 0.0707* 0.0585 Bangladeshi –0.00387 0.157*** 0.104** 0.0751 0.0750 Black Caribbean –0.00567 0.110*** 0.117*** 0.0930** 0.0893** Black African –0.00364 0.0811* 0.0648 0.0378 0.0318 Other ethnic minority –0.0110 –0.0718 –0.0802 –0.102** –0.112** Ethnicity missing 0.0568** 0.0796 0.0871 0.0518 0.0515 Has ever been identified with Special Educational Needs
–0.00396 –0.0846*** –0.0747*** –0.0586*** –0.0588***
English as an additional language 0.0316 0.0394 0.0558 0.0742 0.0751 Bilingual 0.0377* 0.0530 0.0655* 0.0648* 0.0611 Family characteristics 2nd quintile of family income 0.00372 0.0141 0.0201 0.0109 0.00927 3rd quintile of family income –0.000255 0.0299 0.0351* 0.0283 0.0238 4th quintile of family income –0.00443 0.0287 0.0364* 0.0310 0.0307 5th quintile of family income –0.00785 0.00419 0.0169 0.0263 0.0298 Mother is currently working –0.00842 –0.000878 0.00639 –0.000478 0.00113 Father is currently working –0.00147 –0.0170 –0.0111 –0.0153 –0.0180 Mother’s age 0.00731 –0.0361*** –0.0319*** –0.0319*** –0.0309** Mother is not present 0.146 –0.835*** –0.712*** –0.693*** –0.664** Mother has a degree or equivalent –0.00284 –0.0938*** –0.0700*** –0.0557*** –0.0468** Mother has A Levels or equivalents 0.00422 –0.0288 –0.00885 –0.0108 –0.00959 Mother has lower-level qualifications –0.0181* 0.0220 0.0285 0.0248 0.0223 Mother’s qualifications missing –0.0165 0.000935 0.0190 0.0149 0.0184 Mother’s age squared –0.000105 0.000403*** 0.000368*** 0.000379*** 0.000371*** Father’s age 0.00140 0.00499 0.00669 0.00886 0.0112 Father is not present 0.0159 –0.00171 0.0445 0.0999 0.156 Father has a degree or equivalent 0.00652 –0.0756*** –0.0656*** –0.0455** –0.0397* Father has A Levels or equivalents 0.00639 –0.00154 0.00222 0.00238 0.00116 Father has lower-level qualifications 0.00927 0.0212 0.0226 0.0196 0.0207 Father’s qualifications missing 0.0331*** –0.0249 –0.0177 –0.0161 –0.0106 Father’s age squared –2.58e–05 –0.000100 –0.000114 –0.000134 –0.000156* English as an additional language at home –0.0691** –0.0769 –0.0658 –0.0812* –0.0781 Bilingual at home –0.0491** –0.0425 –0.0272 –0.0300 –0.0276 Number of younger siblings –0.00479* –0.00720 –0.00863 –0.00530 –0.00445 Number of older siblings 0.00295 0.00982* 0.00704 0.00631 0.00485 Observations 10,082 8,831 8,831 8,831 8,831 R-squared 0.519 0.028 0.063 0.090 0.104
Pupils at independent schools are excluded from this analysis as only one pupil at an independent school took vocational courses in the estimation sample. The reference group is: White for ethnicity dummies; the bottom quintile for family income dummies; parents without any qualifications for the dummies on parental education. Month of birth, school factors, prior attainment and wider factors such as preferences and aspirations have also been controlled for in the first and relevant regressions, and are omitted from the table due to space constraints.
105
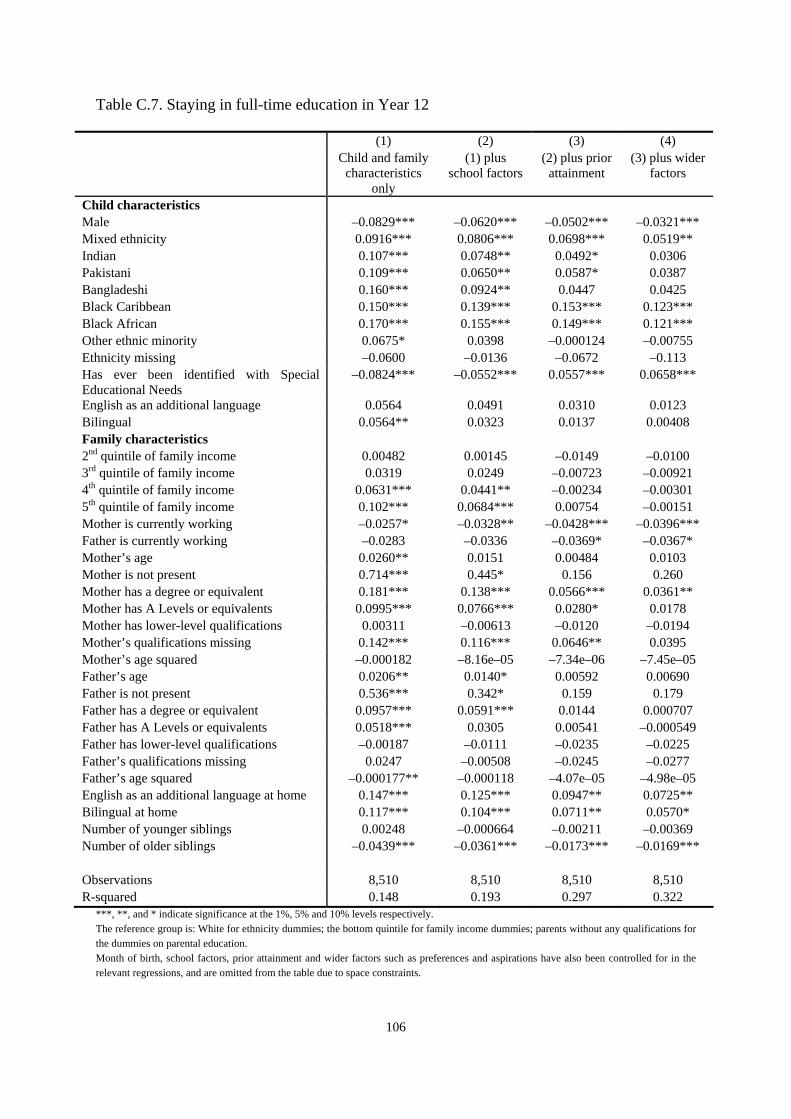
Table C.7. Staying in full-time education in Year 12
***, **, and * indicate significance at the 1%, 5% and 10% levels respectively.
(1) (2) (3) (4) Child and family
characteristics only
(1) plus school factors
(2) plus prior attainment
(3) plus wider factors
Child characteristics Male –0.0829*** –0.0620*** –0.0502*** –0.0321*** Mixed ethnicity 0.0916*** 0.0806*** 0.0698*** 0.0519** Indian 0.107*** 0.0748** 0.0492* 0.0306 Pakistani 0.109*** 0.0650** 0.0587* 0.0387 Bangladeshi 0.160*** 0.0924** 0.0447 0.0425 Black Caribbean 0.150*** 0.139*** 0.153*** 0.123*** Black African 0.170*** 0.155*** 0.149*** 0.121*** Other ethnic minority 0.0675* 0.0398 –0.000124 –0.00755 Ethnicity missing –0.0600 –0.0136 –0.0672 –0.113 Has ever been identified with Special Educational Needs
–0.0824*** –0.0552*** 0.0557*** 0.0658***
English as an additional language 0.0564 0.0491 0.0310 0.0123 Bilingual 0.0564** 0.0323 0.0137 0.00408 Family characteristics 2nd quintile of family income 0.00482 0.00145 –0.0149 –0.0100 3rd quintile of family income 0.0319 0.0249 –0.00723 –0.00921 4th quintile of family income 0.0631*** 0.0441** –0.00234 –0.00301 5th quintile of family income 0.102*** 0.0684*** 0.00754 –0.00151 Mother is currently working –0.0257* –0.0328** –0.0428*** –0.0396*** Father is currently working –0.0283 –0.0336 –0.0369* –0.0367* Mother’s age 0.0260** 0.0151 0.00484 0.0103 Mother is not present 0.714*** 0.445* 0.156 0.260 Mother has a degree or equivalent 0.181*** 0.138*** 0.0566*** 0.0361** Mother has A Levels or equivalents 0.0995*** 0.0766*** 0.0280* 0.0178 Mother has lower-level qualifications 0.00311 –0.00613 –0.0120 –0.0194 Mother’s qualifications missing 0.142*** 0.116*** 0.0646** 0.0395 Mother’s age squared –0.000182 –8.16e–05 –7.34e–06 –7.45e–05 Father’s age 0.0206** 0.0140* 0.00592 0.00690 Father is not present 0.536*** 0.342* 0.159 0.179 Father has a degree or equivalent 0.0957*** 0.0591*** 0.0144 0.000707 Father has A Levels or equivalents 0.0518*** 0.0305 0.00541 –0.000549 Father has lower-level qualifications –0.00187 –0.0111 –0.0235 –0.0225 Father’s qualifications missing 0.0247 –0.00508 –0.0245 –0.0277 Father’s age squared –0.000177** –0.000118 –4.07e–05 –4.98e–05 English as an additional language at home 0.147*** 0.125*** 0.0947** 0.0725** Bilingual at home 0.117*** 0.104*** 0.0711** 0.0570* Number of younger siblings 0.00248 –0.000664 –0.00211 –0.00369 Number of older siblings –0.0439*** –0.0361*** –0.0173*** –0.0169*** Observations 8,510 8,510 8,510 8,510 R-squared 0.148 0.193 0.297 0.322
The reference group is: White for ethnicity dummies; the bottom quintile for family income dummies; parents without any qualifications for the dummies on parental education. Month of birth, school factors, prior attainment and wider factors such as preferences and aspirations have also been controlled for in the relevant regressions, and are omitted from the table due to space constraints.
106
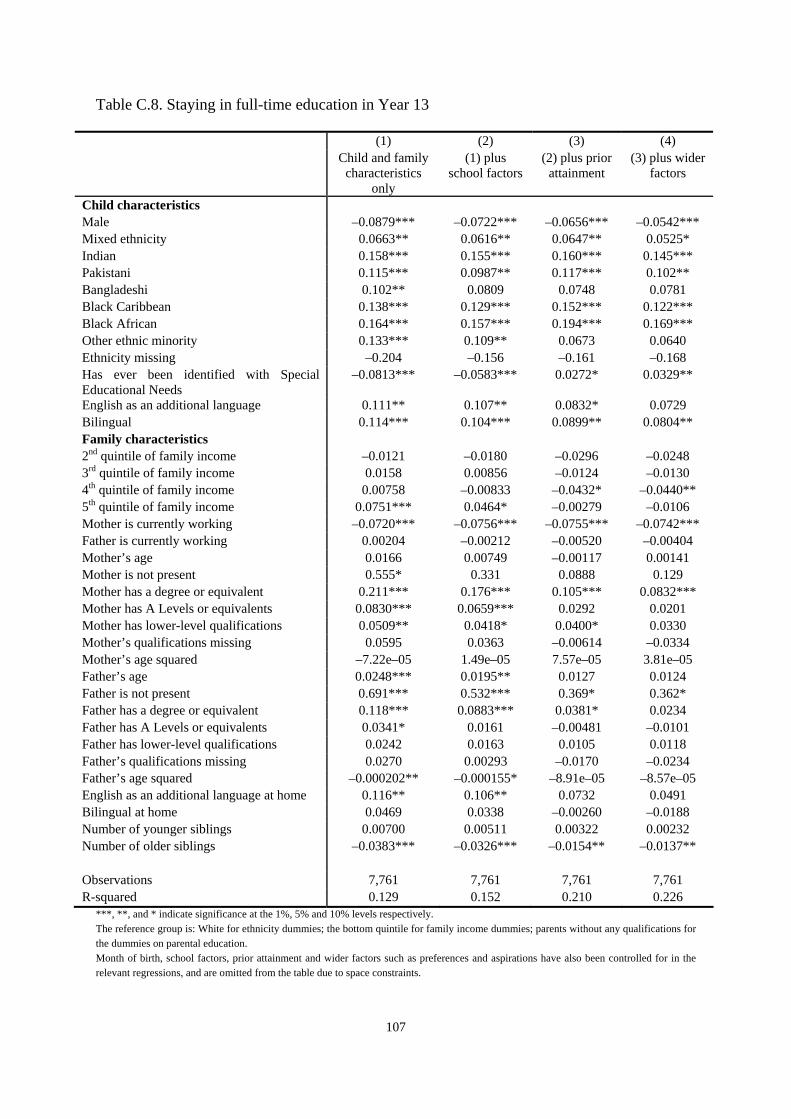
Table C.8. Staying in full-time education in Year 13
***, **, and * indicate significance at the 1%, 5% and 10% levels respectively.
(1) (2) (3) (4) Child and family
characteristics only
(1) plus school factors
(2) plus prior attainment
(3) plus wider factors
Child characteristics Male –0.0879*** –0.0722*** –0.0656*** –0.0542*** Mixed ethnicity 0.0663** 0.0616** 0.0647** 0.0525* Indian 0.158*** 0.155*** 0.160*** 0.145*** Pakistani 0.115*** 0.0987** 0.117*** 0.102** Bangladeshi 0.102** 0.0809 0.0748 0.0781 Black Caribbean 0.138*** 0.129*** 0.152*** 0.122*** Black African 0.164*** 0.157*** 0.194*** 0.169*** Other ethnic minority 0.133*** 0.109** 0.0673 0.0640 Ethnicity missing –0.204 –0.156 –0.161 –0.168 Has ever been identified with Special Educational Needs
–0.0813*** –0.0583*** 0.0272* 0.0329**
English as an additional language 0.111** 0.107** 0.0832* 0.0729 Bilingual 0.114*** 0.104*** 0.0899** 0.0804** Family characteristics 2nd quintile of family income –0.0121 –0.0180 –0.0296 –0.0248 3rd quintile of family income 0.0158 0.00856 –0.0124 –0.0130 4th quintile of family income 0.00758 –0.00833 –0.0432* –0.0440** 5th quintile of family income 0.0751*** 0.0464* –0.00279 –0.0106 Mother is currently working –0.0720*** –0.0756*** –0.0755*** –0.0742*** Father is currently working 0.00204 –0.00212 –0.00520 –0.00404 Mother’s age 0.0166 0.00749 –0.00117 0.00141 Mother is not present 0.555* 0.331 0.0888 0.129 Mother has a degree or equivalent 0.211*** 0.176*** 0.105*** 0.0832*** Mother has A Levels or equivalents 0.0830*** 0.0659*** 0.0292 0.0201 Mother has lower-level qualifications 0.0509** 0.0418* 0.0400* 0.0330 Mother’s qualifications missing 0.0595 0.0363 –0.00614 –0.0334 Mother’s age squared –7.22e–05 1.49e–05 7.57e–05 3.81e–05 Father’s age 0.0248*** 0.0195** 0.0127 0.0124 Father is not present 0.691*** 0.532*** 0.369* 0.362* Father has a degree or equivalent 0.118*** 0.0883*** 0.0381* 0.0234 Father has A Levels or equivalents 0.0341* 0.0161 –0.00481 –0.0101 Father has lower-level qualifications 0.0242 0.0163 0.0105 0.0118 Father’s qualifications missing 0.0270 0.00293 –0.0170 –0.0234 Father’s age squared –0.000202** –0.000155* –8.91e–05 –8.57e–05 English as an additional language at home 0.116** 0.106** 0.0732 0.0491 Bilingual at home 0.0469 0.0338 –0.00260 –0.0188 Number of younger siblings 0.00700 0.00511 0.00322 0.00232 Number of older siblings –0.0383*** –0.0326*** –0.0154** –0.0137** Observations 7,761 7,761 7,761 7,761 R-squared 0.129 0.152 0.210 0.226
The reference group is: White for ethnicity dummies; the bottom quintile for family income dummies; parents without any qualifications for the dummies on parental education. Month of birth, school factors, prior attainment and wider factors such as preferences and aspirations have also been controlled for in the relevant regressions, and are omitted from the table due to space constraints.
107
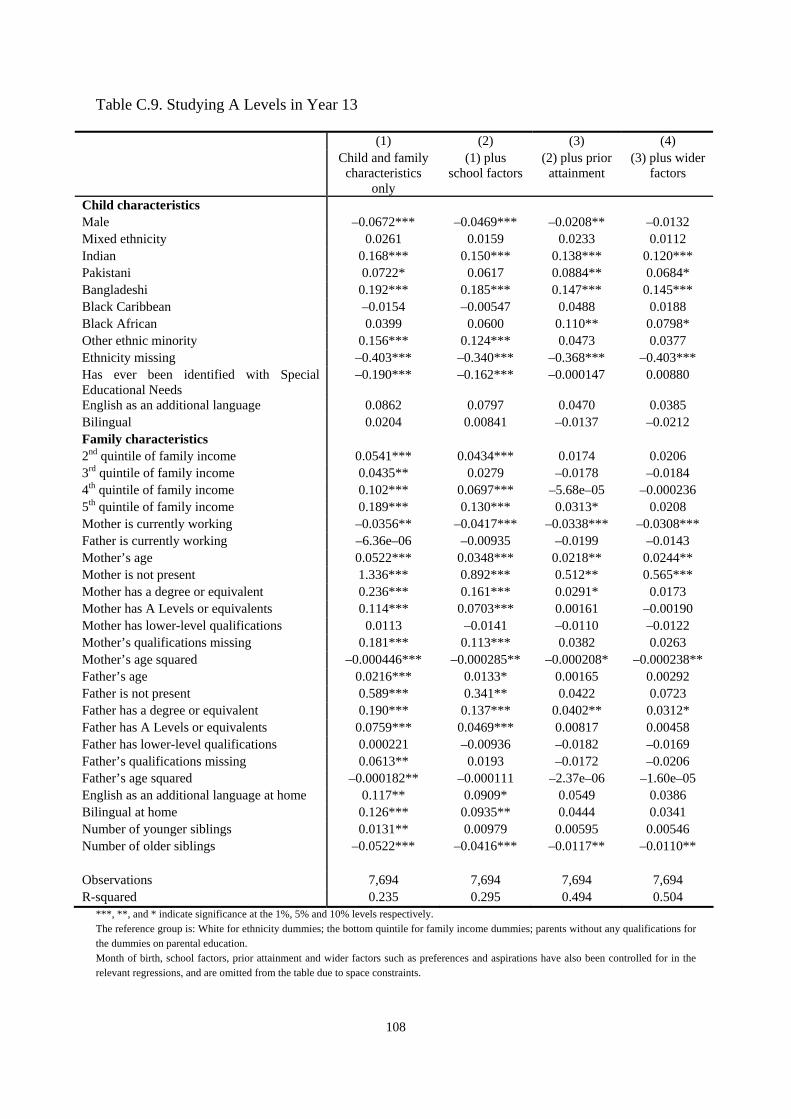
Table C.9. Studying A Levels in Year 13
***, **, and * indicate significance at the 1%, 5% and 10% levels respectively.
(1) (2) (3) (4) Child and family
characteristics only
(1) plus school factors
(2) plus prior attainment
(3) plus wider factors
Child characteristics Male –0.0672*** –0.0469*** –0.0208** –0.0132 Mixed ethnicity 0.0261 0.0159 0.0233 0.0112 Indian 0.168*** 0.150*** 0.138*** 0.120*** Pakistani 0.0722* 0.0617 0.0884** 0.0684* Bangladeshi 0.192*** 0.185*** 0.147*** 0.145*** Black Caribbean –0.0154 –0.00547 0.0488 0.0188 Black African 0.0399 0.0600 0.110** 0.0798* Other ethnic minority 0.156*** 0.124*** 0.0473 0.0377 Ethnicity missing –0.403*** –0.340*** –0.368*** –0.403*** Has ever been identified with Special Educational Needs
–0.190*** –0.162*** –0.000147 0.00880
English as an additional language 0.0862 0.0797 0.0470 0.0385 Bilingual 0.0204 0.00841 –0.0137 –0.0212 Family characteristics 2nd quintile of family income 0.0541*** 0.0434*** 0.0174 0.0206 3rd quintile of family income 0.0435** 0.0279 –0.0178 –0.0184 4th quintile of family income 0.102*** 0.0697*** –5.68e–05 –0.000236 5th quintile of family income 0.189*** 0.130*** 0.0313* 0.0208 Mother is currently working –0.0356** –0.0417*** –0.0338*** –0.0308*** Father is currently working –6.36e–06 –0.00935 –0.0199 –0.0143 Mother’s age 0.0522*** 0.0348*** 0.0218** 0.0244** Mother is not present 1.336*** 0.892*** 0.512** 0.565*** Mother has a degree or equivalent 0.236*** 0.161*** 0.0291* 0.0173 Mother has A Levels or equivalents 0.114*** 0.0703*** 0.00161 –0.00190 Mother has lower-level qualifications 0.0113 –0.0141 –0.0110 –0.0122 Mother’s qualifications missing 0.181*** 0.113*** 0.0382 0.0263 Mother’s age squared –0.000446*** –0.000285** –0.000208* –0.000238** Father’s age 0.0216*** 0.0133* 0.00165 0.00292 Father is not present 0.589*** 0.341** 0.0422 0.0723 Father has a degree or equivalent 0.190*** 0.137*** 0.0402** 0.0312* Father has A Levels or equivalents 0.0759*** 0.0469*** 0.00817 0.00458 Father has lower-level qualifications 0.000221 –0.00936 –0.0182 –0.0169 Father’s qualifications missing 0.0613** 0.0193 –0.0172 –0.0206 Father’s age squared –0.000182** –0.000111 –2.37e–06 –1.60e–05 English as an additional language at home 0.117** 0.0909* 0.0549 0.0386 Bilingual at home 0.126*** 0.0935** 0.0444 0.0341 Number of younger siblings 0.0131** 0.00979 0.00595 0.00546 Number of older siblings –0.0522*** –0.0416*** –0.0117** –0.0110** Observations 7,694 7,694 7,694 7,694 R-squared 0.235 0.295 0.494 0.504
The reference group is: White for ethnicity dummies; the bottom quintile for family income dummies; parents without any qualifications for the dummies on parental education. Month of birth, school factors, prior attainment and wider factors such as preferences and aspirations have also been controlled for in the relevant regressions, and are omitted from the table due to space constraints.
108
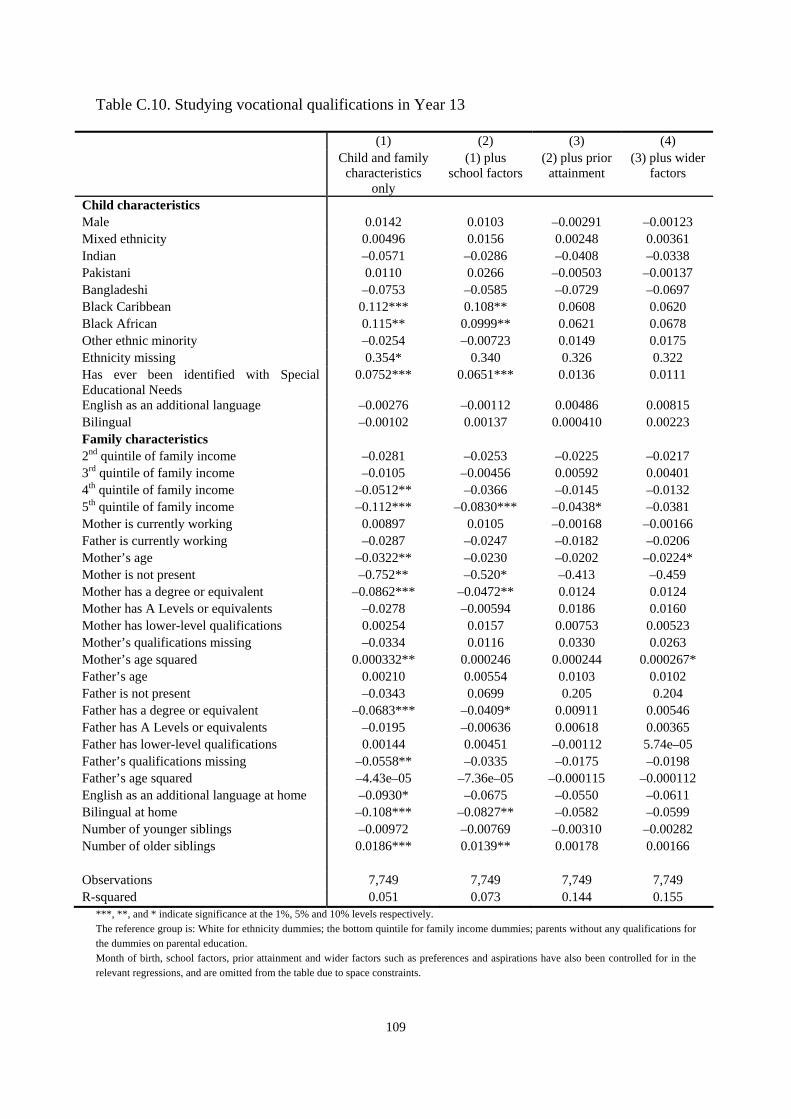
109
Table C.10. Studying vocational qualifications in Year 13
***, **, and * indicate significance at the 1%, 5% and 10% levels respectively.
(1) (2) (3) (4) Child and family
characteristics only
(1) plus school factors
(2) plus prior attainment
(3) plus wider factors
Child characteristics Male 0.0142 0.0103 –0.00291 –0.00123 Mixed ethnicity 0.00496 0.0156 0.00248 0.00361 Indian –0.0571 –0.0286 –0.0408 –0.0338 Pakistani 0.0110 0.0266 –0.00503 –0.00137 Bangladeshi –0.0753 –0.0585 –0.0729 –0.0697 Black Caribbean 0.112*** 0.108** 0.0608 0.0620 Black African 0.115** 0.0999** 0.0621 0.0678 Other ethnic minority –0.0254 –0.00723 0.0149 0.0175 Ethnicity missing 0.354* 0.340 0.326 0.322 Has ever been identified with Special Educational Needs
0.0752*** 0.0651*** 0.0136 0.0111
English as an additional language –0.00276 –0.00112 0.00486 0.00815 Bilingual –0.00102 0.00137 0.000410 0.00223 Family characteristics 2nd quintile of family income –0.0281 –0.0253 –0.0225 –0.0217 3rd quintile of family income –0.0105 –0.00456 0.00592 0.00401 4th quintile of family income –0.0512** –0.0366 –0.0145 –0.0132 5th quintile of family income –0.112*** –0.0830*** –0.0438* –0.0381 Mother is currently working 0.00897 0.0105 –0.00168 –0.00166 Father is currently working –0.0287 –0.0247 –0.0182 –0.0206 Mother’s age –0.0322** –0.0230 –0.0202 –0.0224* Mother is not present –0.752** –0.520* –0.413 –0.459 Mother has a degree or equivalent –0.0862*** –0.0472** 0.0124 0.0124 Mother has A Levels or equivalents –0.0278 –0.00594 0.0186 0.0160 Mother has lower-level qualifications 0.00254 0.0157 0.00753 0.00523 Mother’s qualifications missing –0.0334 0.0116 0.0330 0.0263 Mother’s age squared 0.000332** 0.000246 0.000244 0.000267* Father’s age 0.00210 0.00554 0.0103 0.0102 Father is not present –0.0343 0.0699 0.205 0.204 Father has a degree or equivalent –0.0683*** –0.0409* 0.00911 0.00546 Father has A Levels or equivalents –0.0195 –0.00636 0.00618 0.00365 Father has lower-level qualifications 0.00144 0.00451 –0.00112 5.74e–05 Father’s qualifications missing –0.0558** –0.0335 –0.0175 –0.0198 Father’s age squared –4.43e–05 –7.36e–05 –0.000115 –0.000112 English as an additional language at home –0.0930* –0.0675 –0.0550 –0.0611 Bilingual at home –0.108*** –0.0827** –0.0582 –0.0599 Number of younger siblings –0.00972 –0.00769 –0.00310 –0.00282 Number of older siblings 0.0186*** 0.0139** 0.00178 0.00166 Observations 7,749 7,749 7,749 7,749 R-squared 0.051 0.073 0.144 0.155
The reference group is: White for ethnicity dummies; the bottom quintile for family income dummies; parents without any qualifications for the dummies on parental education. Month of birth, school factors, prior attainment and wider factors such as preferences and aspirations have also been controlled for in the relevant regressions, and are omitted from the table due to space constraints.

Ref: DFE-RR160
ISBN: 978-1-78105-008-8
© The Department for Education
October 2011