Embed Size (px)
Citation preview
Item: A-2
Wednesday, July 21, 2010
SUBJECT: APPROVAL OF THE STADIUM FINANCING PLAN.
PROPOSED BOARD ACTION
Adopt a resolution authorizing the issuance of debt by The FAU Finance Corporation, an FAU direct-support organization (the "DSO"), and requesting the Florida Board of Governors (the "BOG") to approve the issuance of debt in an amount not to exceed $44,585,000 (the "Debt") for the purpose of financing the construction of certain football stadium facilities (the "Project") to be located on the Boca Raton campus of the University and further authorizing the President, the Senior Vice President for Finance & Administration, the Chair of the DSO, and other authorized representatives of the University, the Board, and the DSO to take all actions and steps, execute all instruments, documents and contracts, and take all other actions as necessary or desirable in connection with the execution, sale and delivery of the Debt.
BACKGROUND INFORMATION
I. Background The Project was approved in concept by this Board on September 18, 2007 and will consist of the construction of a football stadium with an approximately 30,000 total seating capacity, including approximately 1,076 premium club seats with a club level and traditional seating, 4,448 priority club seats, 16 loge boxes with capacity of 6 occupants each, 20 leasable luxury suites with capacity of 23 occupants each, and 4 non-leasable, university-utilized luxury suites with capacity of either 46 or 23 occupants each. Legislative approval of the Project has been obtained, pursuant to Section 1010.62, Florida Statutes, by section 24 of House Bill 5001 (the 2008-09 General Appropriations Act) enacted by the Florida Legislature. The Project will be financed through the DSO, which was created to construct, finance and manage capital projects for the benefit of the University. No proceeds of the Debt will be used to finance operating expenses of the University or the DSO. The Project is part of a multi-phase, mixed use project known as Innovation Village. Innovation Village includes student housing facilities, student life facilities, and retail, commercial, recreational and athletic facilities. Innovation Village is being developed in an effort to transform the University’s Boca Raton campus into a more traditional setting where students will enjoy a full range of campus activities. Innovation Village currently includes the Marlene
and Harold Forkas Alumni Center, a Student Recreation & Wellness Center, both of which opened in 2009, as well as construction of 1,200 new deluxe residence units—the first phase of Innovation Village Housing. The Project is reflected on the approved master plan for the University and is consistent with the mission of the University because it will provide needed student facilities and enhance students' University experience. The University currently plays its home football games at Lockhart Stadium in Ft. Lauderdale, 25 miles south of the Boca Raton campus. Lockhart Stadium is owned and operated by the Broward County Athletic Association and its primary use is by local high schools for football games and by the Baltimore Orioles minor league baseball franchises. The current stadium is substandard for a Division 1-A NCAA program. The stadium has limited seating capacity of around 20,000. There are no opportunities for FAU to achieve suite or premium seat revenue. The proposed on-campus stadium will be able to meet those demands.
II. Project Cost and Financing Structure The proposed Project construction and associated soft costs are approximately $63,500,000 (not including capitalized interest of approximately $2,842,294, a debt service reserve fund deposit of $2,616,675 and financing costs of approximately $873,000). The financing plan includes the infusion of $4,906,808 from the financing for the first phase of Innovation Village housing to be used to finance certain shared infrastructure costs, and $20,340,173 of funds contributed by the University and the University Foundation. The balance of the $12 million previously paid to the University as part of the Innovation Village Housing financing has been deposited into the replacement and renewal fund of the University’s existing housing system to finance capital expenditures related to the existing housing system. There is no pledge of University or DSO housing system revenues towards the proposed DSO stadium debt and no pledge of stadium revenues to support the DSO's housing system. Accordingly, there is no fiscal relationship between the financial success of the DSO's housing assets and the financial success of the proposed athletic component of FAU Innovation Village. In October 2009, the University issued an Invitation to Negotiate ("ITN") to obtain the services of a Financial Advisor to assist the University and the DSO in obtaining financing for the balance of the Project not funded through University resources. The University selected Dunlap & Associates Inc. as the firm that would best meet the needs of the Project. In February, 2010, the University, on behalf of the DSO, issued an ITN for the financing of the Project. The University received six responses to the ITN. The proposal of Regions Bank (“Regions”) was selected as the proposal that would best meet the needs of the University and the DSO to finance the Project. Under Regions’ proposal, the Project will be financed with a direct bank loan from Regions, who holds an option to issue a portion of the loan through a syndicate of banks formed by Regions. A private placement bank loan agreement provides a lower cost of financing than issuing bonds in the public market.

It is anticipated that the Debt will be designated as Build America Bonds and will thus bear interest at a taxable rate. The designation of the Debt as Build America Bonds is in the best interest of the University because the DSO will receive a 35% subsidy from the United States Treasury to offset the interest cost of the Debt, resulting in a lower net interest cost. The Debt will be issued at an assumed annual interest rate (net of the Build America Bonds subsidy) of approximately 4.25% and will mature thirty (30) years after issuance, with level debt service payments, with the first principal payment occurring in July 2013. The outstanding balance of the loan will be callable and the interest rate will be subject to adjustment after year seven and every third year thereafter. To mitigate the risk of the call option being exercised in an unfavorable rate environment, the DSO will develop a principal reduction reserve, supported in part by a stadium capital campaign to be undertaken by the FAU Foundation. The proposed financing is in compliance with the BOG’s Debt Management Guidelines, the University’s debt management policy, and applicable law. In consideration of Regions providing the financing, the DSO and/or the University will maintain a depository account with Regions in the combined amount of $6 million for as long as the loan from Regions is outstanding. The depository account will bear interest at Regions’ published rates for preferred institutional clients. The DSO will be responsible for customary costs and fees incurred in closing the transaction. If a bank syndication is necessary to complete the loan, Regions will serve as lead arranger and will be provided a syndication arrangement fee and annual maintenance fees.
III.
Pledged Revenues & Debt Service Coverage
The Debt will be secured by revenues as defined in a Trust Indenture (the "Pledged Revenues") to include the gross operating revenues of the Project -- which include ticket sales revenues, concession sales, catering services, novelty sales, parking revenues, premium seating revenues, facility service fees, advertising and sponsorship revenues -- and certain non-operating revenues including 5% of student Athletic Fees, revenues from the sale of naming rights, $1 million from away game guarantee and conference game revenues, fundraising revenues, and investment earnings on the above revenues. The DSO is legally authorized to secure the Debt with the Pledged Revenues pursuant to section 1010.62, Florida Statutes. For fiscal year 2012-2013, the first full year of operation of the Project, the Pledged Revenues are estimated at $6.92 million. Estimated expenses in the first year of operation are projected to be $1.15 million. The projected annual debt service coverage is 2.21x in 2012-2013 (after capitalized interest) and 2.35x in 2015-16. The projected debt service coverage has been calculated using an assumed net interest rate of 4.25% (based upon a formula of 2.59% (7 year Swap Curve) plus 3.36%) which results in a calculated bond yield (All-In TIC) for arbitrage purposes of approximately 4.37%. The interest rate assumption is based on prevailing market conditions as of the week of July 8, 2010 plus 338 basis points in order to account for changing market conditions. The projections are based on the C.H. Johnson Consulting, Inc. feasibility study and indicate that the Pledged Revenues will be sufficient to pay the required debt service and operating expenses.
IMPLEMENTATION PLAN/DATE
The Debt issuance is scheduled to be presented to the BOG for approval on September 16, 2010. If the BOG approves the issuance of the Debt, the closing on the bank loan is scheduled to occur on or before October 1, 2010. Preliminary site work, preparatory work related to laying foundations, infrastructure, and mobilization are already underway. The opening of the stadium is anticipated for the fall of 2011.
FISCAL IMPLICATIONS
Issuance of the Debt by the DSO, along with funds financed from the first phase of Innovation Village housing and other University contributions will cover all development costs of the Project. The Debt is to be secured by a lien on the gross revenues of the Project and certain other non-operating athletics’ revenues. The Debt, not to exceed $44,585,000, will carry an annual debt service payment of approximately $2,615,000. FAU’s financial advisor, Dunlap & Associates Inc., believes that the proposed financing plan is sound and consistent with other similar stadium deals done in the State and that the interest rate and terms are in line with market conditions. Supporting Documentation: Proposed Resolution Table of Sources and Uses of Funds Stadium Operating Pro Forma
C.H. Johnson Consulting, Inc. Football Stadium Market and Financial Analysis
Presented by: David L. Kian, Sr. Vice President & General Counsel Phone: 561-297-3007 Dennis Crudele, Interim SVP- Financial Affairs Phone: 561-297-3266 Tom Donaudy, Vice President & University Architect Phone: 561-297-0083

FAU Stadium Proposal
“Between the Palms” July 21, 2010Florida Atlantic University Board of Trustees
STADIUMSTADIUM DESIGN & CONSTRUCTION

Historical Perspective

Stadium SiteStadium Site
Innovation Village ApartmentsInnovation Village Apartments
Innovation Village

The Site
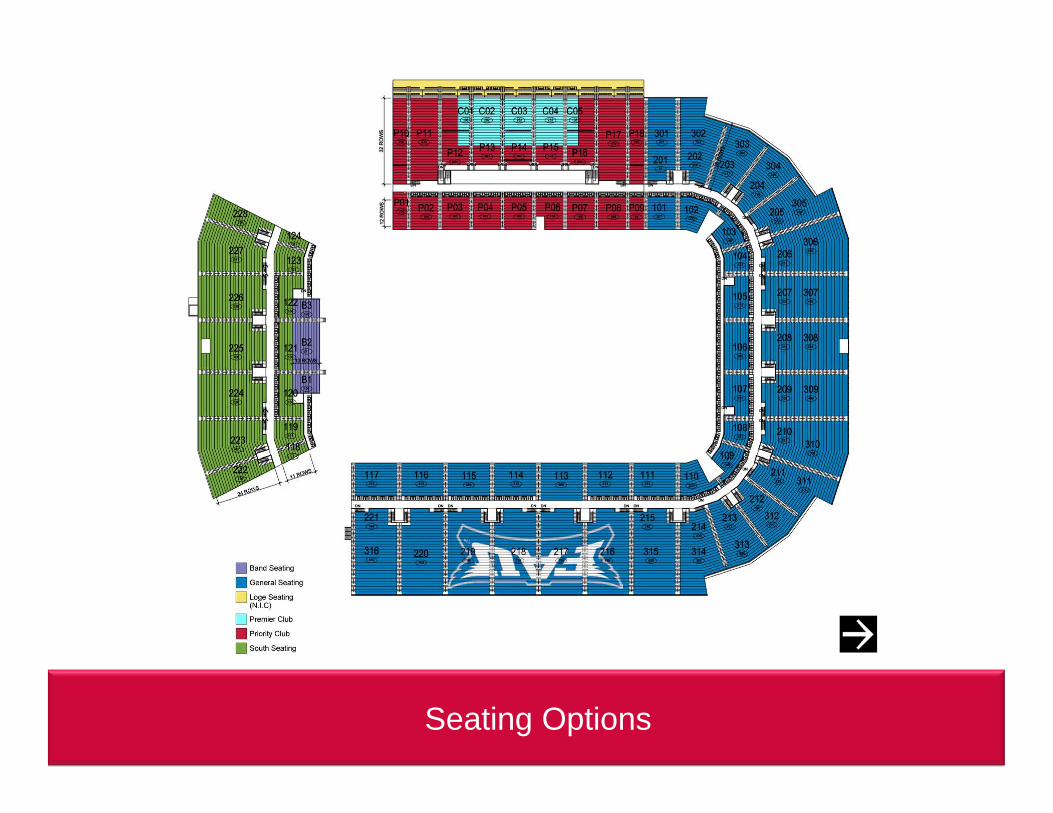
Seating Options
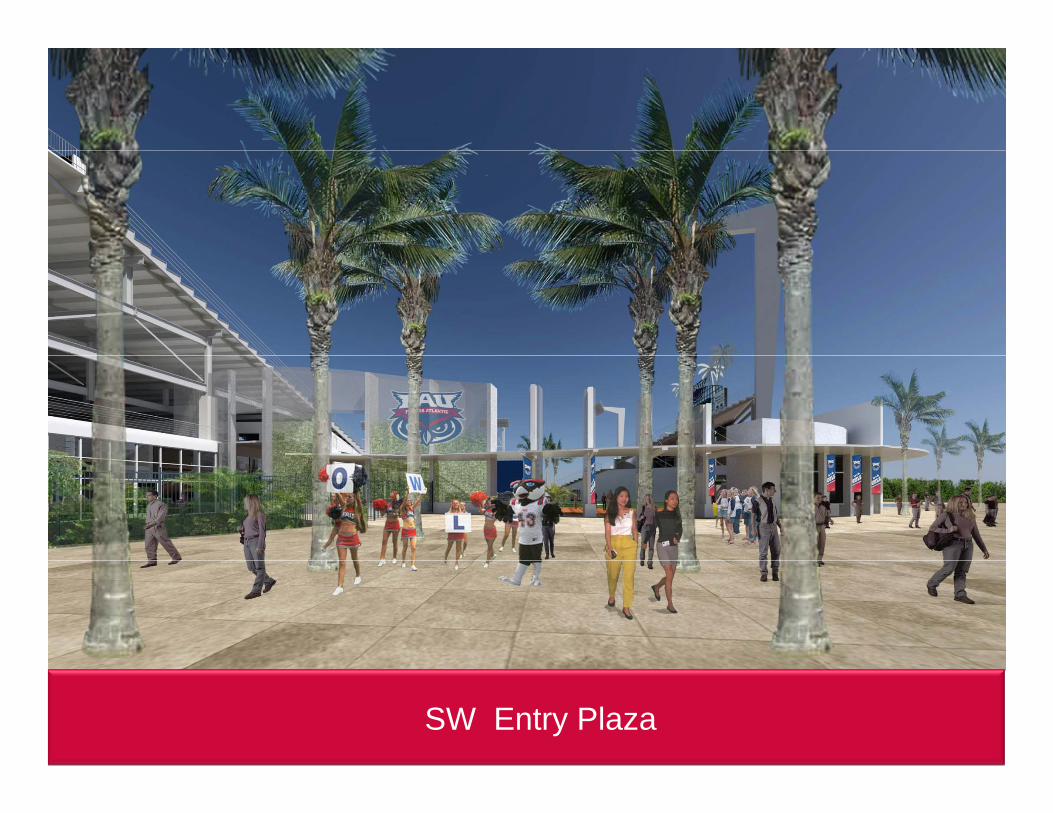
SW Entry Plaza

The Field

Recruiting Center
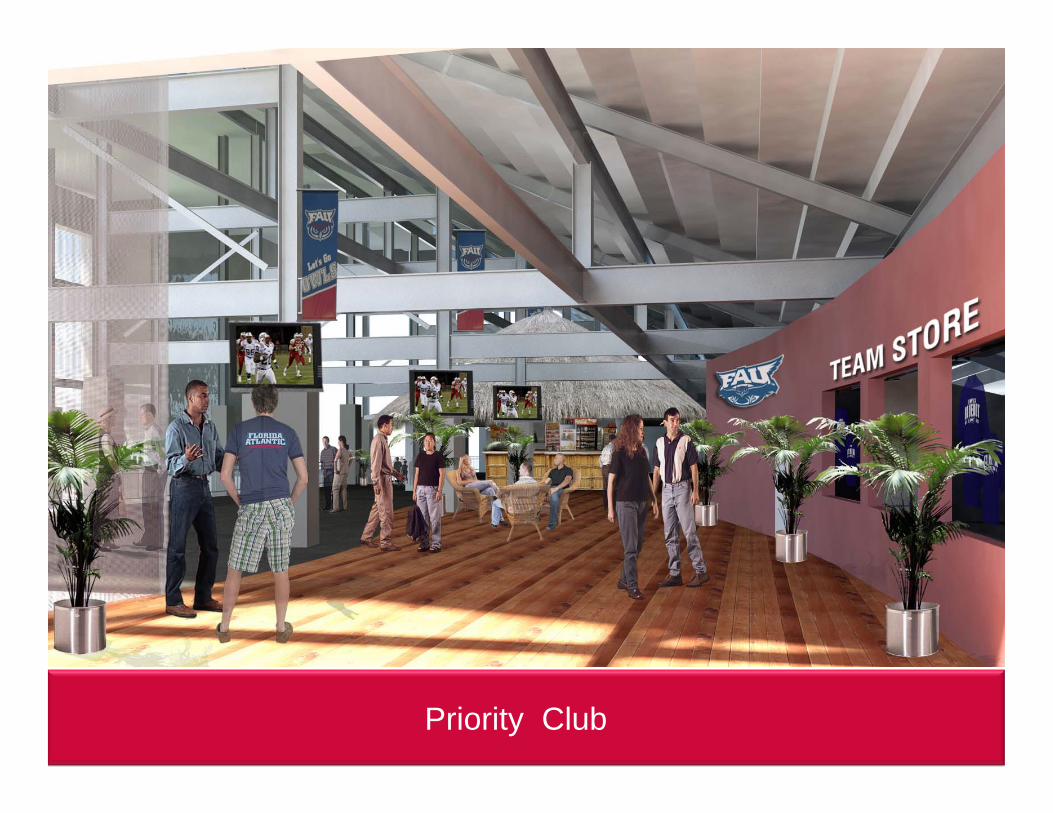
Priority Club
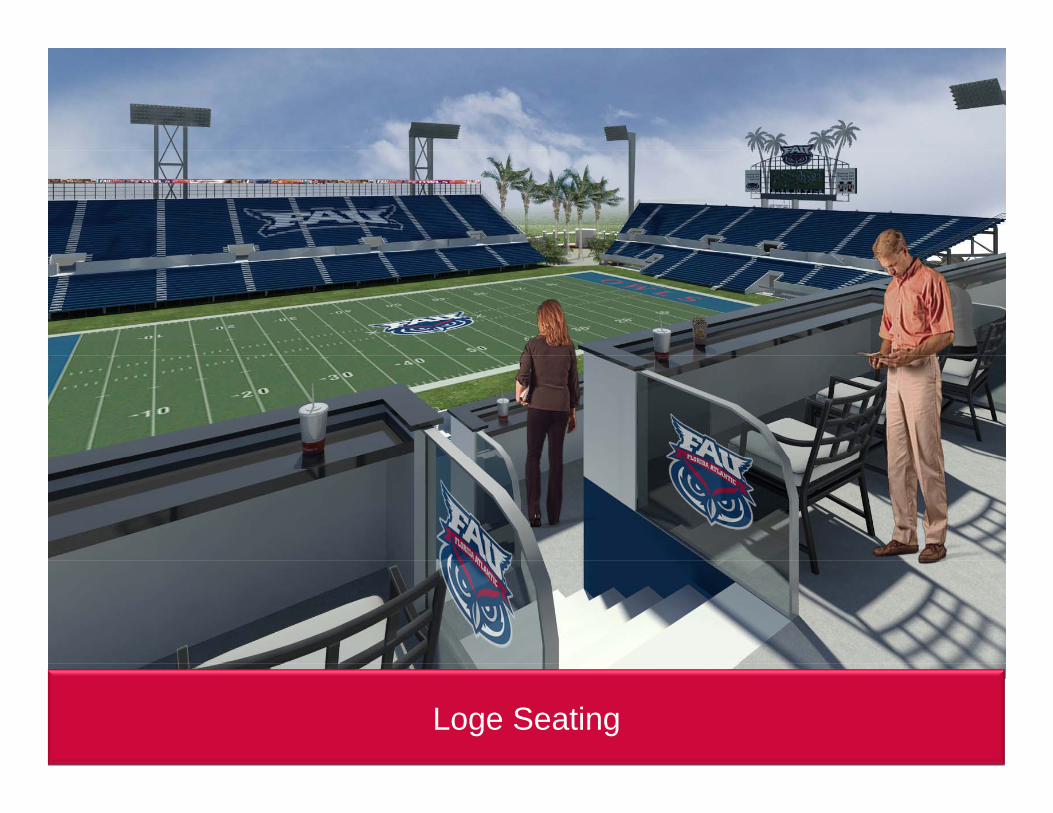
Loge Seating

Premier Club
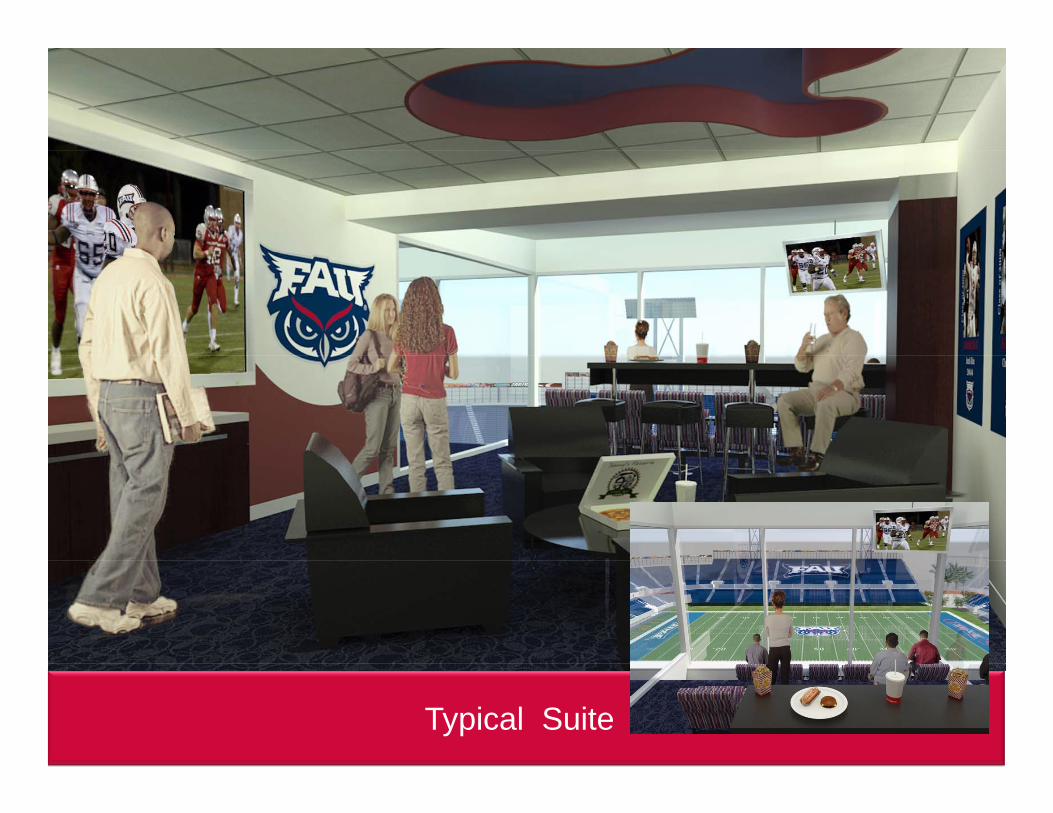
Typical Suite
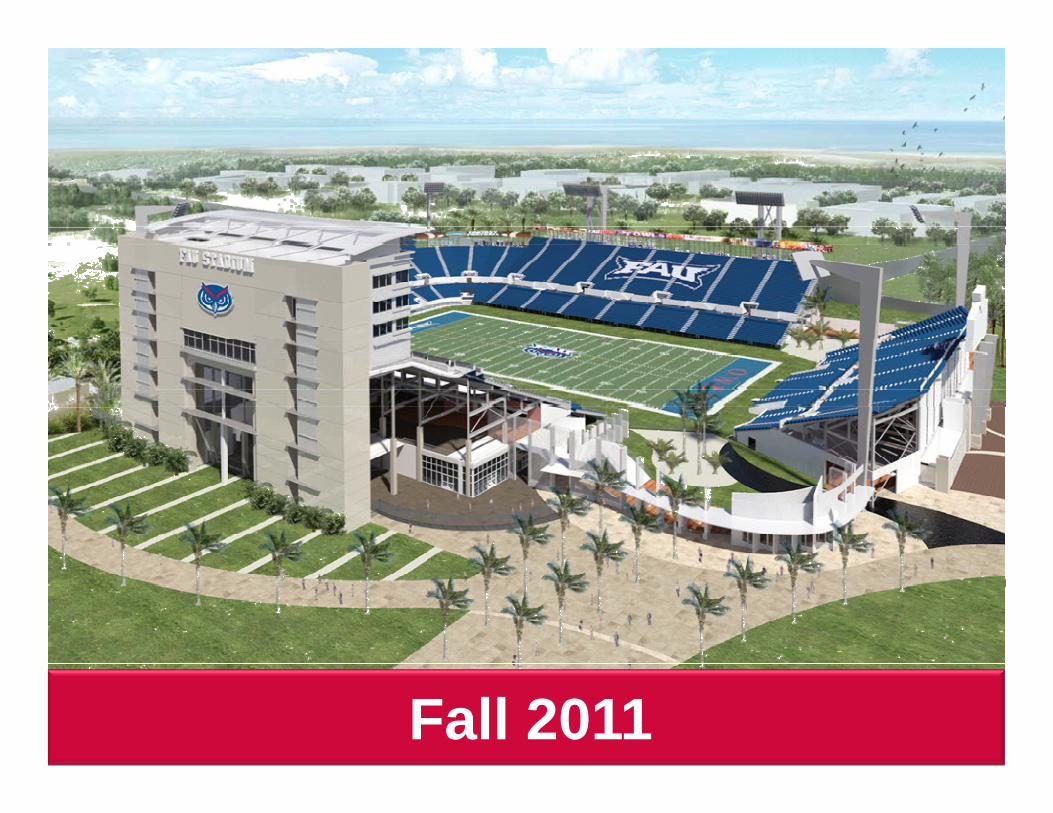
Fall 2011
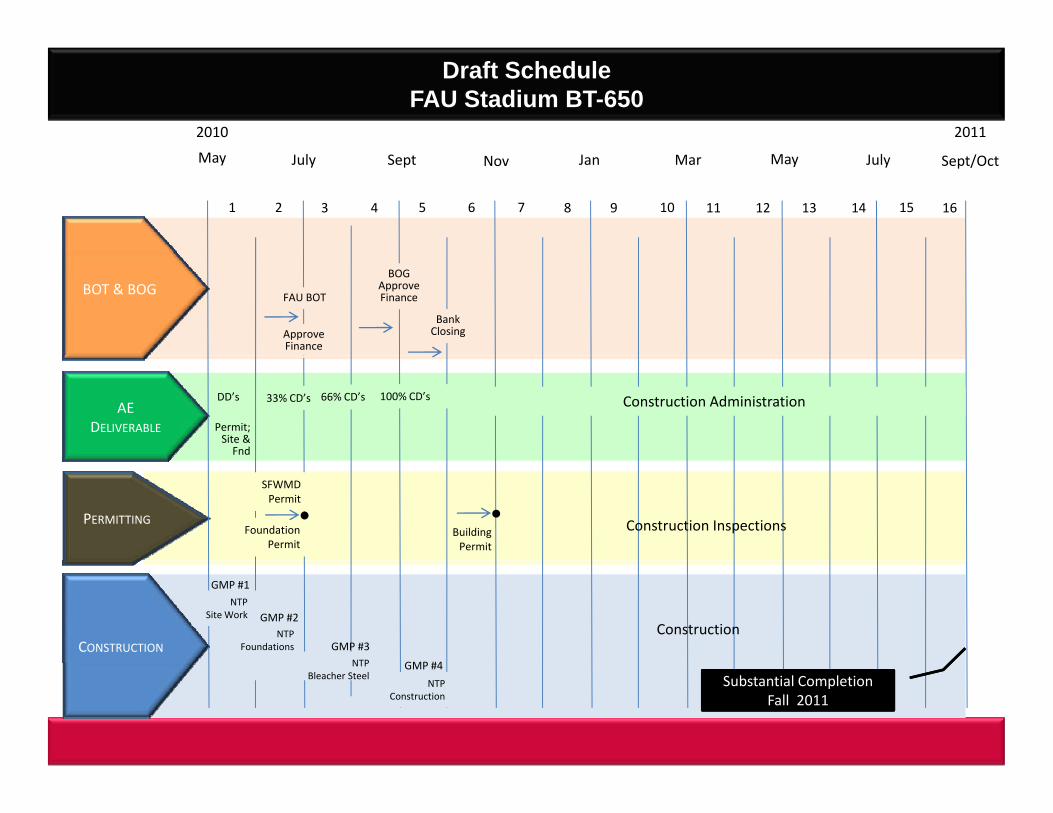
2010 2011
Draft ScheduleFAU Stadium BT-650
May July Sept Nov Jan Mar May July Sept/Oct
1 2 3 4 5 6 7 8 9 10 11 12 13 14 15 16
BOT & BOGFAU BOT
Approve Finance
BOG Approve Finance
Bank Closing
AE DELIVERABLE Permit;
Site & Fnd
DD’s 33% CD’s 100% CD’s Construction Administration66% CD’s
PERMITTINGBuildingPermit
FoundationPermit
SFWMDPermit
Construction Inspections
CONSTRUCTION
GMP #1
GMP #2
GMP #3NTP
NTPFoundations
GMP #4
NTPSite Work
Construction
NTPBleacher Steel Substantial Completion
Fall 2011
GMP #4
NTPConstruction
STADIUMSTADIUMFINANCING

Phasing of Innovation Village Phasing of Innovation Village Innovation Village Housing Phase 1
Student Housing 1,200 Beds, open in August 2011 Innovation Village Housing Phase 1
Student Housing 1,200 Beds, open in August 2011S di l i b O b 2011 Stadium – completion by October 2011
Planned Phases
Stadium – completion by October 2011
Planned Phases 30,000 Seat Stadium, planned for Fall 2011 Food Service/Retail Component – 20,000 square feet,
planned for Fall 2013
30,000 Seat Stadium, planned for Fall 2011 Food Service/Retail Component – 20,000 square feet,
planned for Fall 2013planned for Fall 2013
Completed Phases Recreation & Wellness Center – opened in January 2009
p a ed o a 0 3
Completed Phases Recreation & Wellness Center – opened in January 2009 Recreation & Wellness Center opened in January 2009 Forkas Alumni Center – opened in October 2008 Parking 480 new spaces - opened in Fall 2009
Recreation & Wellness Center opened in January 2009 Forkas Alumni Center – opened in October 2008 Parking 480 new spaces - opened in Fall 2009
C i D l A i h h Ci f Community Development Agreement with the City of Boca Raton
Community Development Agreement with the City of Boca Raton
A total campus experience A total campus experience FAU Innovation Village – Stadium ProjectFAU Innovation Village – Stadium Project

Stadium Project
Current temporary rental location (Lockhart Stadium) in B d C t (25 il th f FAU)Broward County (25 miles south of FAU)
More fully engage students, alumni, and friends of FAU; offer students a more traditional campus life experienceoffer students a more traditional campus life experience
30,000 Seat Stadium – NCAA Division I-A realignment
Consistent with Campus Master Plan; authorized by the Board of Trustees in 2007; consistent with the Campus Development Agreement; received approval by the City ofDevelopment Agreement; received approval by the City of Boca Raton; supported by C. H. Johnson Feasibility Report
Academic Linkages with Exercise Science Program and g gSports Management
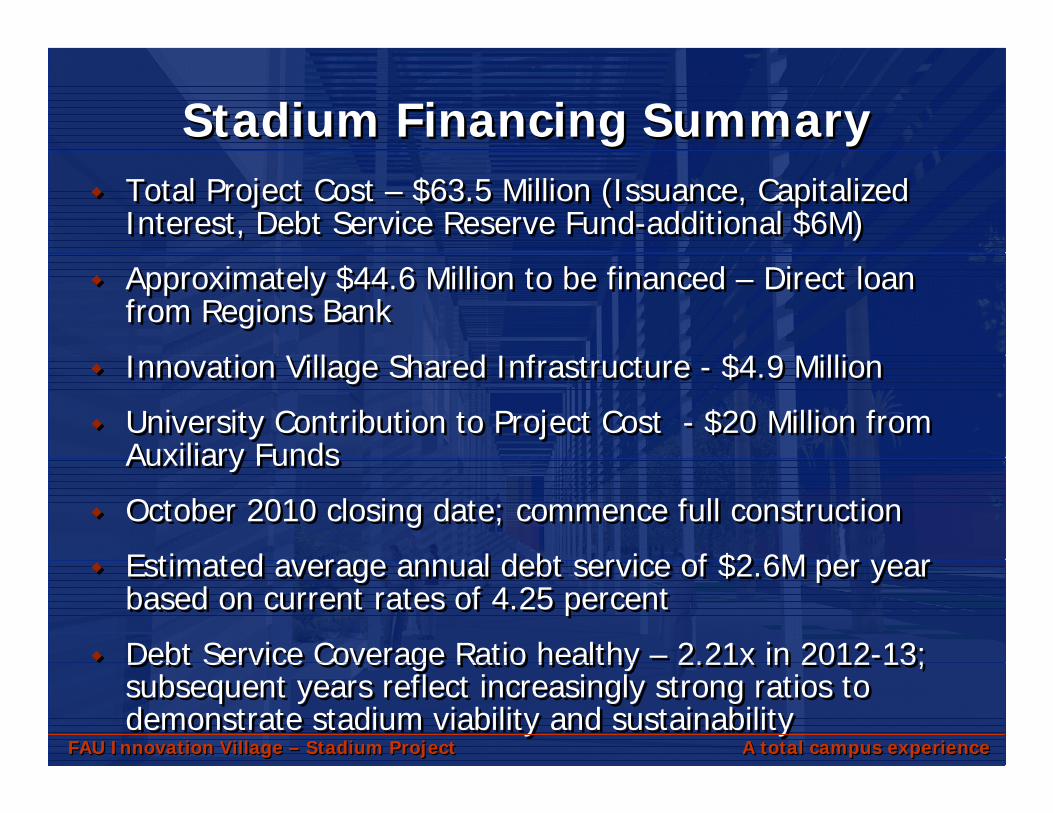
Stadium Financing SummaryStadium Financing Summary Total Project Cost – $63.5 Million (Issuance, Capitalized
Interest, Debt Service Reserve Fund-additional $6M) Total Project Cost – $63.5 Million (Issuance, Capitalized
Interest, Debt Service Reserve Fund-additional $6M)
Approximately $44.6 Million to be financed – Direct loan from Regions Bank
Approximately $44.6 Million to be financed – Direct loan from Regions Bank
I ti Vill Sh d I f t t $4 9 Milli Innovation Village Shared Infrastructure - $4.9 Million
University Contribution to Project Cost - $20 Million from Auxiliary Funds
Innovation Village Shared Infrastructure - $4.9 Million
University Contribution to Project Cost - $20 Million from Auxiliary FundsAuxiliary Funds
October 2010 closing date; commence full construction
E ti t d l d bt i f $2 6M
Auxiliary Funds
October 2010 closing date; commence full construction
Estimated average annual debt service of $2 6M per year Estimated average annual debt service of $2.6M per year based on current rates of 4.25 percent
Debt Service Coverage Ratio healthy – 2.21x in 2012-13;
Estimated average annual debt service of $2.6M per year based on current rates of 4.25 percent
Debt Service Coverage Ratio healthy – 2.21x in 2012-13; Debt Service Coverage Ratio healthy 2.21x in 2012 13; subsequent years reflect increasingly strong ratios to demonstrate stadium viability and sustainability
Debt Service Coverage Ratio healthy 2.21x in 2012 13; subsequent years reflect increasingly strong ratios to demonstrate stadium viability and sustainability
A total campus experience A total campus experience FAU Innovation Village – Stadium ProjectFAU Innovation Village – Stadium Project

Stadium Financing Summary cont’dStadium Financing Summary cont’d
Final Interest Rate – 7 year LIBOR swap rate plus 336 b i i t
Final Interest Rate – 7 year LIBOR swap rate plus 336 basis pointsbasis points
Qualifies for Build America Bonds (BAB) interest rate subsidy
basis points
Qualifies for Build America Bonds (BAB) interest rate subsidysubsidy
Current assumed rate net of BAB subsidy – 3.89%
Thirty year fixed rate note with a call option and rate
subsidy
Current assumed rate net of BAB subsidy – 3.89%
Thirty year fixed-rate note with a call option and rate Thirty year fixed-rate note, with a call option and rate adjustment after 7 years
University and FAU Finance Corporation will develop a
Thirty year fixed-rate note, with a call option and rate adjustment after 7 years
University and FAU Finance Corporation will develop a y p pcapital reduction reserve fund to mitigate interest rate risk of call option
y p pcapital reduction reserve fund to mitigate interest rate risk of call option
A total campus experience A total campus experience FAU Innovation Village – Stadium ProjectFAU Innovation Village – Stadium Project
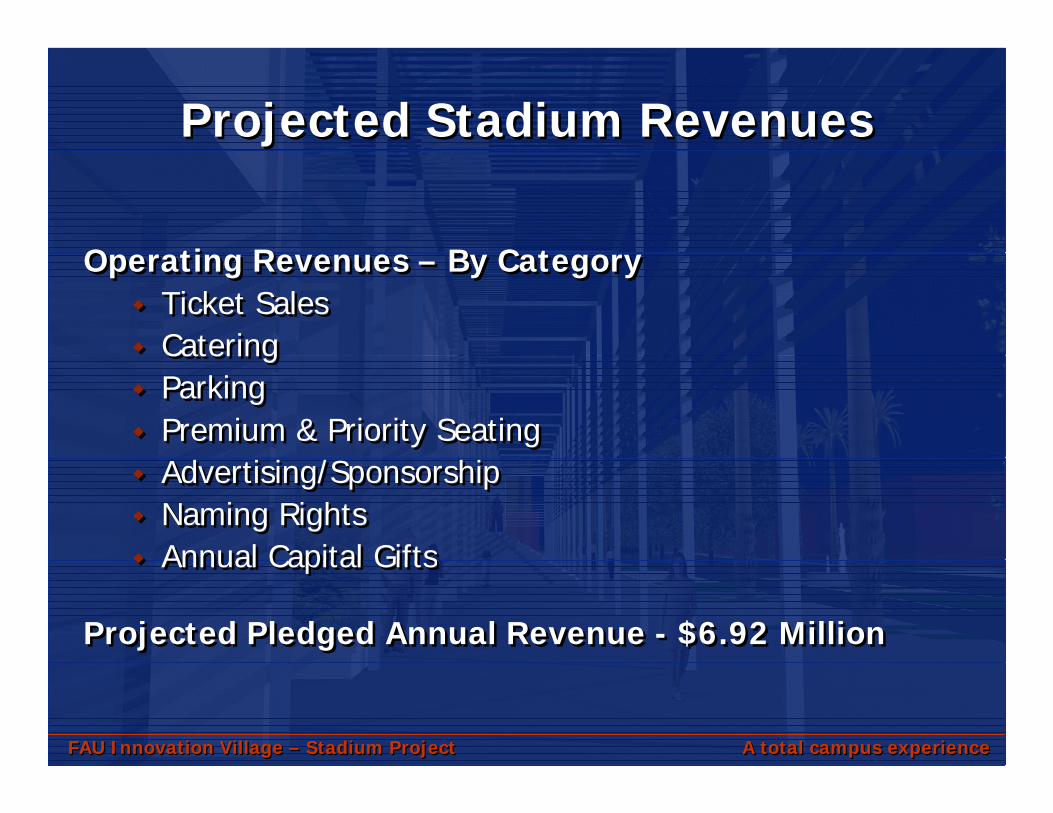
Projected Stadium RevenuesProjected Stadium Revenues
O ti R B C tO ti R B C tOperating Revenues – By Category Ticket Sales Catering
Operating Revenues – By Category Ticket Sales CateringCatering Parking Premium & Priority Seating
Catering Parking Premium & Priority Seating Advertising/Sponsorship Naming Rights Annual Capital Gifts
Advertising/Sponsorship Naming Rights Annual Capital Gifts Annual Capital Gifts
Projected Pledged Annual Revenue - $6.92 Million
Annual Capital Gifts
Projected Pledged Annual Revenue - $6.92 Million
A total campus experience A total campus experience FAU Innovation Village – Stadium ProjectFAU Innovation Village – Stadium Project
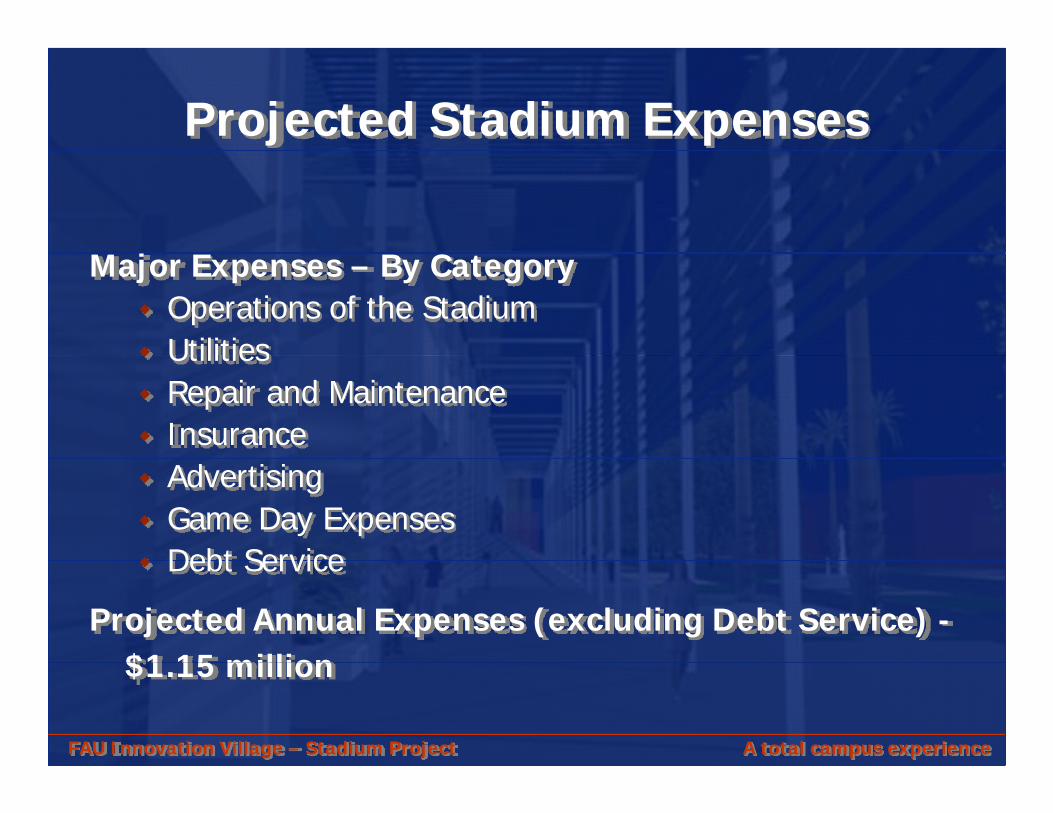
Projected Stadium Expenses
j CMajor Expenses – By Category Operations of the Stadium Utilities Utilities Repair and Maintenance Insurance Advertising Game Day Expenses Debt Service Debt Service
Projected Annual Expenses (excluding Debt Service) -$1 15 million$1.15 million
A total campus experience FAU Innovation Village – Stadium Project

Projected Debt Service CoverageProjected Debt Service Coverage
Projected annual net revenue $6.9 M
P j t d l d bt i $2 6 M
Projected annual net revenue $6.9 M
P j t d l d bt i $2 6 M Projected annual debt service $2.6 M
Projected annual debt service
Projected annual debt service $2.6 M
Projected annual debt service coverage ratio*
2012-2013 2.21x2015 2016 ( ft C it li d I t ) 2 35
coverage ratio* 2012-2013 2.21x
2015 2016 (after Capitalized Int ) 2 35x 2015-2016 (after Capitalized Int.) 2.35x
* Note: Board of Governors requires coverage ratio of only 1.2x
2015-2016 (after Capitalized Int.) 2.35x
* Note: Board of Governors requires coverage ratio of only 1.2x

Sources and Uses of FundsSources and Uses of Funds
SSSources:_______________________________________________________________________________________________________________________
Bond Proceeds:
Sources:_______________________________________________________________________________________________________________________
Bond Proceeds: Bond Proceeds: Par Amount $44,585,000
Other Sources of Funds:
Bond Proceeds: Par Amount $44,585,000
Other Sources of Funds: Other Sources of Funds: FAU Contribution Shared Infrastructure 4,906,808 FAU Cash Contribution 20,340,173
Other Sources of Funds: FAU Contribution Shared Infrastructure 4,906,808 FAU Cash Contribution 20,340,173
25,246,981
T t l S f F d $69 831 981
25,246,981
T t l S f F d $69 831 981Total Source of Funds: $69,831,981Total Source of Funds: $69,831,981
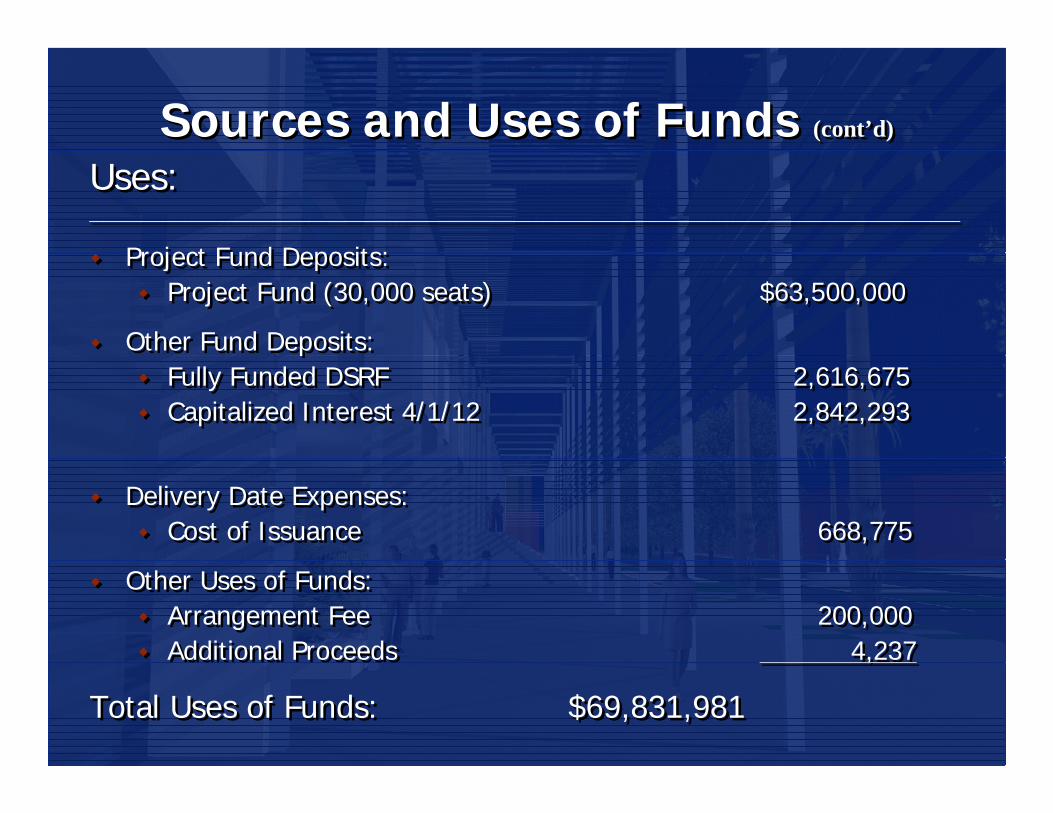
Sources and Uses of Funds (cont’d)Sources and Uses of Funds (cont’d)
Uses:_______________________________________________________________________________________________________________________
P j t F d D it
Uses:_______________________________________________________________________________________________________________________
Project Fund Deposits: Project Fund Deposits: Project Fund (30,000 seats) $63,500,000
Other Fund Deposits:
Project Fund Deposits: Project Fund (30,000 seats) $63,500,000
Other Fund Deposits:p Fully Funded DSRF 2,616,675 Capitalized Interest 4/1/12 2,842,293
p Fully Funded DSRF 2,616,675 Capitalized Interest 4/1/12 2,842,293
Delivery Date Expenses: Cost of Issuance 668,775
Delivery Date Expenses: Cost of Issuance 668,775
Other Uses of Funds: Arrangement Fee 200,000 Additional Proceeds 4,237
Other Uses of Funds: Arrangement Fee 200,000 Additional Proceeds 4,237,
Total Uses of Funds: $69,831,981
,
Total Uses of Funds: $69,831,981

Stadium Financial Pro FormaStadium Financial Pro Forma2011 12 2012 13 2013 14 2014 15 2015 16 2016 172011-12 2012-13 2013-14 2014-15 2015-16 2016-17
Ticket Sales - Football $1,239,000 $1,276,170 $1,314,455 $1,353,889 $1,394,505 $1,436,341Ticket Sales - Other Events 250,000 257,500 265,225 273,182 281,377 289,819 Premium Seating, less 7% fulfillment 995,000 1,024,850 1,055,596 1,087,263 1,119,881 1,153,478 Priority Seating Donation 757,000 779,710 803,101 827,194 852,010 877,570 Naming Rights less 7% fulfillment 400,000 400,000 400,000 400,000 400,000 400,000 Annual Capital Gifts 250 000 257 500 265 225 273 182 281 377 289 819Annual Capital Gifts 250,000 257,500 265,225 273,182 281,377 289,819 Advertising & Sponsorship 336,000 346,080 356,462 367,156 378,171 389,516 Novelties 40,000 41,200 42,436 43,709 45,020 46,371 Parking 288,000 296,640 305,539 314,705 324,147 333,871 Catering 43,000 44,290 45,619 46,987 48,397 49,849 Concessions 354,000 364,620 375,559 386,825 398,430 410,383 Facility Service Charges 98,000 100,940 103,968 107,087 110,300 113,609
T t l R $5 050 000 $5 189 500 $5 333 185 $5 481 181 $5 633 616 $5 790 624Total Revenues $5,050,000 $5,189,500 $5,333,185 $5,481,181 $5,633,616 $5,790,624
Operating ExpenseFixedSalary - Permanent Staff $150,000 154,500 159,135 163,909 168,826 173,891 General and Administrative 100,000 103,000 106,090 109,273 112,551 115,927 Utilities 175,000 180,250 185,658 191,227 196,964 202,873 Repairs and Maintenance 175 000 180 250 185 658 191 227 196 964 202 873Repairs and Maintenance 175,000 180,250 185,658 191,227 196,964 202,873 Insurance 55,000 56,650 58,350 60,100 61,903 63,760 Advertising 50,000 51,500 53,045 54,636 56,275 57,964 Misc. 25,000 25,750 26,523 27,318 28,138 28,982
Student Aid/OtherGameday Expenses 50,000 51,500 53,045 54,636 56,275 57,964
Total Expenses $780,000 803,400 827,502 852,327 877,897 904,234 Net Operating Income (Deficit) $4,270,000 $4,386,100 $4,505,683 $4,628,853 $4,755,719 $4,886,391
Deposit to Maintenance Reserve Account $340,000 $350,200 $360,706 $371,527 $382,673 $394,153Net Operating Income (Deficit) Avail. for Debt $3,930,000 $4,035,900 $4,144,977 $4,257,326 $4,373,046 $4,492,237
Other Non Operating RevenueAway Game & Conf Guarantees $1,000,000 $1,000,000 $1,000,000 $1,000,000 $1,000,000 $1,000,000Student Fees (limit of 5%) 467,483 481,507 495,953 510,831 526,156 541,941 ( %) , , , , , ,Miscellaneous Contractual Revenues 250,000 250,000 250,000 250,000 250,000 250,000
Total Other Sources $1,717,483 $1,731,507 $1,745,953 $1,760,831 $1,776,156 $1,791,941 Net Income for Debt Coverage $5,647,483 $5,767,407 $5,890,930 $6,018,158 $6,149,202 $6,284,178 Debt Service (1) 1,894,863 2,614,863 2,614,263 2,612,388 2,614,238 2,614,600
Coverage Ratio incl Other Non-operating Revenue 2.98 2.21 2.25 2.30 2.35 2.40

QUESTIONS & ANSWERS

{25579/002/00429763.DOCv12}
1
A RESOLUTION AUTHORIZING THE ISSUANCE OF DEBT
AND REQUESTING THE FLORIDA BOARD OF GOVERNORS
TO APPROVE THE ISSUANCE OF SUCH DEBT TO FINANCE
THE CONSTRUCTION OF CERTAIN FOOTBALL STADIUM
FACILITIES ON THE BOCA RATON CAMPUS OF FLORIDA
ATLANTIC UNIVERSITY, PROVIDING AN EFFECTIVE DATE.
BE IT RESOLVED BY THE FLORIDA ATLANTIC UNIVERSITY BOARD OF TRUSTEES:
Section 1. The Florida Atlantic University Board of Trustees (the "Board of Trustees") as
the governing body of Florida Atlantic University (the "University") hereby authorizes the issuance
of debt by The FAU Finance Corporation (the "DSO") and requests the Florida Board of Governors
(the "Board of Governors") to approve the issuance of debt in an amount not to exceed $44,585,000
(the "Debt") for the purpose of financing the construction of certain football stadium facilities (the
"Project") to be located on the Boca Raton campus of the University.
Section 2. The Project will consist of the construction of a football stadium with an
approximately 30,000 total seating capacity, including approximately 1,076 premium club seats with
a club level and traditional seating, 4,448 priority club seats, 16 loge boxes with capacity of 6
occupants each, 20 leasable luxury suites with capacity of 23 occupants each, and 4 non-leasable,
university-utilized luxury suites with capacity of either 46 or 23 occupants each. The Project is part
of a multi-phase, mixed use project known as Innovation Village. Innovation Village includes
student housing facilities, student life facilities, as well as retail, commercial, recreational and
athletic facilities. The Project is reflected on the approved master plan for the University and is
consistent with the mission of the University because it will provide needed student facilities and
enhance students' University experience. Other than site work and preparatory work related to
laying foundations, vertical construction of the Project is expected to begin in October of 2010 and to
be completed by October of 2011. Proceeds of the Debt, together with $4,906,808 previously raised
through the DSO's Capital Improvement Revenue Bonds, Series 2010 and $20,340,173 of funds
contributed by the University, are anticipated to be sufficient to complete the construction of the
Project without the use of additional funds. Legislative approval of the Project has been obtained,
pursuant to Section 1010.62, Florida Statutes, by section 24 of House Bill 5001 (the 2008-09 General
Appropriations Act) enacted by the Florida Legislature. No proceeds of the Debt will be used to
finance operating expenses of the University or the DSO.
Section 3. The Debt is to be secured by a first lien on revenues consisting of gross
operating revenues of the Project, which will include ticket sales revenues, concession sales, catering
services, novelty sales, parking revenues, premium and priority seating revenues, facility service
fees, advertising and sponsorship revenues, capital gifts, naming rights and certain non-operating
revenues including athletic fees (in an amount not exceeding 5% of the athletic fees collected during
the most recent twelve (12) consecutive months for which collection information is available prior to
the sale of the Debt), away game guarantee revenues and conference game revenues in an aggregate
amount equal to $1 million, miscellaneous contractual revenues and investment earnings on the
above revenues. The DSO is legally authorized to secure the Debt with the revenues to be pledged
pursuant to section 1010.62, Florida Statutes.

{25579/002/00429763.DOCv12}
2
Section 4. The Debt will mature not more than 30 years after issuance, including any
extensions or renewals thereof. The Project has an estimated useful life of 35 years, which is beyond
the anticipated final maturity of the Debt. The Debt will be designated as Build America Bonds,
thus bearing a taxable interest rate. The designation of the Debt as Build America Bonds on a
taxable basis is in the best interest of the University because the DSO will receive a 35% subsidy
from the United States Treasury offsetting the interest cost of the Debt. The Debt will bear interest
at a fixed interest rate which is subject to adjustment in year seven and every three years thereafter.
Section 5. In October, 2009, the University issued an Invitation to Negotiate ("ITN") to
obtain the services of a financial advisor for the Project. The University received three responses to
the ITN. The ITN Evaluation Committee (the "Committee") short-listed two firms, and
presentations by these firms were made to the Committee. The Committee recommended Dunlap
& Associates Inc. as the firm that would best meet the needs of the University, and such firm was
awarded the bid.
Section 6. The Debt to be issued by the DSO, will be in the form of a bank loan. In
February, 2010, the University issued an ITN for the financing of the Project, contemplating a
borrowing by the DSO to finance a portion of the costs of the Project. The University received six
responses to the ITN, three of which were for comprehensive services and three were for trustee
services. Three firms made presentations to the University for comprehensive services. The bank
that best met the needs of the University to finance the stadium, Regions Bank, was awarded the
opportunity to further negotiate with the University to provide financing for this Project to the DSO
through a bank loan with Regions Bank or a syndicate of banks led by Regions Bank. A negotiated
private placement with Regions Bank and potentially other members of a banking syndicate is
necessary to reduce the cost of financing by entering into a loan agreement with the banks instead
of issuing bonds in the public market. An analysis showing that a private placement is desirable is
attached in Appendix A.
Section 7. The Board of Trustees will comply, and will require the University and the
DSO to comply, with all requirements of federal and state law relating to the Debt, including, but
not limited to, laws relating to maintaining the qualification for the Build America Bond subsidy
payments and any continuing secondary market disclosure of information regarding the Debt as
required by the banks.
Section 8. The President and Senior Vice President for Finance & Administration of the
University and the Chairperson or Vice Chairperson and Secretary or other authorized officer of the
DSO and other authorized representatives of the University, and the Board of Trustees, and the
DSO are hereby authorized to take all actions and steps, to execute all instruments, documents, and
contracts, and to take all other actions as they may deem necessary or desirable, in connection with
the execution, sale and delivery of the Debt.
Section 9. In making the determination to finance the Project, the Board of Trustees has
reviewed the information attached to Appendix A and finds that the issuance of the Debt is in
compliance with the Debt Management Guidelines adopted by the Board of Governors on April 27,

{25579/002/00429763.DOCv12}
3
2006, as subsequently amended by the Board of Governors (the "Debt Management Guidelines"),
the University's debt management policy, and applicable law.
Section 10. This Resolution shall take effect immediately upon its adoption.
Adopted this 21st day of July, 2010.
{25579/002/00429763.DOCv12}
4
Appendix A
The following documents have been reviewed by the Board of Trustees prior to the
execution of this Resolution:
a. the project program, feasibility study, or consultant report;
b. a draw schedule for the Project;
c. sources and uses of funds for the Project;
d. an estimated debt service schedule;
e. debt service schedules for any outstanding debt with a lien on the pledged revenues;
f. a schedule showing estimated compliance with any additional bonds requirement set
forth in the documents governing the outstanding debt;
g. a description of the security supporting repayment and the lien position the debt will
have on that security;
h. a five year projection of the pledged revenues and the debt service coverage; and
i. any negotiated sale analysis.

TABLE OF CONTENTS
I. TRANSMITTAL LETTER
II. INTRODUCTION & EXECUTIVE SUMMARY
III. MARKET ANALYSIS
IV. COMPARABLE STADIUM AND COMPARATIVE MARKET ANALYSIS
V. FACILITY DEMAND AND FINANCIAL PROJECTION

I. TRANSMITTAL LETTER

C . H . J O H N S O N C O N S U L T I N G , I N C . EXPERTS IN CONVENTION, SPORT AND REAL ESTATE CONSULTING
6 East Monroe • 5th Floor • Chicago, Illinois 60603• Phone: 312.447.2010 • Fax 312.444.1125 www.chjc.com • [email protected]
January 29, 2010 Mr. David Kian Office of the General Counsel Florida Atlantic University Administration Building, Room 367 777 Glades Road Boca Raton, Florida 33431
Dear Mr. Kian:
C.H. Johnson Consulting, Inc. (Johnson Consulting) has prepared an updated market and financial analysis for the development of a new football stadium for Florida Atlantic University (FAU). This report includes estimates of market potential, demand, and projected financial performance. The attached report explains the methods used to develop the estimates and discusses the results of the report.
Johnson Consulting has no responsibility to update this report for events and circumstances occurring after the date of this report. The findings presented herein reflect analysis of primary and secondary sources of information. Johnson Consulting utilized sources deemed to be reliable, but cannot guarantee their accuracy. Moreover, estimates and analysis presented in this study are based on trends and assumptions, which usually result in differences between the projected results and actual results. And because events and circumstances frequently do not occur as expected, those differences may be material.
We have enjoyed serving you on this engagement and look forward to providing you with continuing service.
Sincerely yours,
C.H. JOHNSON CONSULTING, INC.

II. INTRODUCTION & EXECUTIVE SUMMARY
C . H . J O H N S O N C O N S U L T I N G , I N C . EXPERTS IN CONVENTION, SPORT AND REAL ESTATE CONSULTING
Florida Atlantic University Section 2 Page 1 Football Stadium Analysis July 2010
INTRODUCTION
Johnson Consulting is pleased to submit this report presenting a market and financial analysis for an on-campus football stadium at the Florida Atlantic University (FAU) on its main campus in Boca Raton, Palm Beach County, Florida. Johnson Consulting submitted the initial version of this report in 2007. This updated report reflects the current market condition and recent changes in the proposed stadium program. The football stadium will complement the other developments proposed for the Boca Raton campus. The analysis which follows includes estimates of demand for the on-campus football stadium as well as its projected operating financial performance.
C.H. Johnson Consulting (Johnson Consulting) is a nationally recognized authority on stadiums, arenas, and university development projects. The firm works nationally and internationally for universities, cities and counties, and private sector developers. Locally, Johnson Consulting has worked on projects in Palm Beach County as the County’s representative in reviewing developer proposals to construct a 400 room hotel in West Palm Beach (2004) and later in assessing the parking requirements for that convention center headquarters hotel (2006).
Elsewhere, the firm recently completed collegiate-level projects for a new arena for the University of Nebraska-Omaha, a university football stadium and arena for Delaware State University a new football stadium for The Citadel in Charleston, SC, a new multi-purpose arena for the University of Northern Iowa, and a new football stadium and arena for California State University-Sacramento. Johnson Consulting has also delivered comprehensive market and financial analysis reports for the new football stadiums at both Florida International University (2006) and the University of Central Florida (2006). Johnson Consulting is one of the top sports consulting firms nationally, serving universities and municipalities.
Objectives of the Study
Johnson Consulting has undertaken a program of services designed to accomplish the following major objectives:
To communicate the transaction structure, in order to isolate demand, revenue and expense factors pertinent to the stadium project specifically
To provide an evaluation of FAU Athletics as well as demand and market support patterns within the competitive area for the regional stadium marketplace
To identify and evaluate the competitive environment for the proposed stadium, should FAU decide to allow for other events within the facility besides university football games,

C . H . J O H N S O N C O N S U L T I N G , I N C . EXPERTS IN CONVENTION, SPORT AND REAL ESTATE CONSULTING
Florida Atlantic University Section 2 Page 2 Football Stadium Analysis July 2010
To independently estimate achievable demand potential for the football stadium’s elements
To present a ten year projection of revenue, expenses, debt service and funds available for other purposes and debt coverage.
In addition to this introduction and methodology review, the report contains the following sections:
Section 3 presents an economic and demographic overview of the local market. The information in this section is an essential component in understanding the economic and market framework that will support a new facility.
Section 4 presents an overview of trends and factors in the stadium and entertainment industry, with specific consideration given to conditions in college and university development that may impact the development and performance of facilities at FAU. Case studies on comparable sports facilities located in markets that offer emerging or successful sports programming that could serve as models for development for FAU are also detailed.
Section 5 presents the financial and demand projections for the football stadium along with a summary of assumptions and methods for developing projections.
Approach / Methodology
In order to accomplish these objectives, the program of analysis conducted by Johnson Consulting has undertaken the following research tasks:
Interviewed stakeholders to understand the deal structure, project interrelationships, and distribution of cash flows
Analyzed the proposed site and surrounding on and off campus development patterns and transportation access relative to factors which influence market support and demand penetration
Examined and projected regional economic trends relevant to population growth and changes in entertainment options for consumers who may use the stadium facilities
Interviewed current management, athletics officials, and other university representatives in order to gather information about expectations for the future of FAU athletics programming
Identified and examined relevant competitive and/or comparable stadium projects, both within and outside of the Sun Belt Conference
C . H . J O H N S O N C O N S U L T I N G , I N C . EXPERTS IN CONVENTION, SPORT AND REAL ESTATE CONSULTING
Florida Atlantic University Section 2 Page 3 Football Stadium Analysis July 2010
Conducted surveys of possible suite, advertising, branding, and naming rights partners and assessed the level of interest expected from these partners
Terms of Assignment
This report is based on estimates, assumptions, actual leases for premium seating, and other information obtained from our research, our prior experience with similar assignments, and information received from FAU and other sources. The sources of information and basis of estimates and assumptions are stated herein. Projections of stadium demand, attendance, contractual relationships, operating revenues, operating expenses, debt service and coverage ratios presented within this report are based Johnson Consulting’s assessment of various data, market characteristics, extensive discussions with FAU, actual premium seat leases, and documented assumptions. Projections of other revenues and expenses are based on input from FAU officials and the financial team. Since certain estimates and assumptions are inherently subject to variation depending on evolving conditions, we cannot represent our projections as results that will actually be achieved.
In accordance with our engagement letter, Johnson Consulting did not ascertain the legal or regulatory requirements applicable to this project, including zoning or other state and local government regulations, permits, and licenses. Furthermore, no effort has been made to determine the possible effect on this project of present or future federal, state, or local legislation, including those related to jurisdictional, environmental, or ecological matters or interpretations thereof.
Description of the Project
The football stadium project has been approved to be located on the northeast side of the Boca Raton main campus area proximate to the campus’ main circumferential roadway (Lee Street). The stadium will be financed through a University Direct Support Organization (DSO) and operated by the University
The on-site campus location affords the project accessibility and visibility to prospective and existing students. Moreover, all of the existing and planned campus amenities available to students are appealing to students, athletic recruits as well as alumni. The end product will be highly appealing, and from both an athletics and urban planning standpoint, will distinguish the campus within Florida, its athletic conference, and nationally. Importantly, the stadium is located on the west side of campus and its height will provide very visible views from I-95. This visibility impacts positively the advertising potential of the stadium.
The recreation, fitness and leisure facilities and programs on the FAU campus are adequate and include the following:
C . H . J O H N S O N C O N S U L T I N G , I N C . EXPERTS IN CONVENTION, SPORT AND REAL ESTATE CONSULTING
Florida Atlantic University Section 2 Page 4 Football Stadium Analysis July 2010
Oxley Athletic Center
o Multi-purpose gymnasium
o Cardiovascular fitness and weight areas
o Group exercise areas
o Locker rooms
o Wellness suite
Outdoor pool and deck
Ropes Course
Softball/baseball fields
The football stadium on the campus of FAU will provide a facility that will not only enhance the athletics program at FAU, but will also serve the needs of a growing university. The facility will help enrich the profile of the football program, as it currently uses the off-campus Lockhart Stadium located over 20 miles away in Fort Lauderdale. The development of the stadium, along with the elements of the Innovation Village plan, will help FAU recruit and compete in the Sun Belt Conferences and may even lead to a berth in a larger conference, such as the Big East Conference.
Executive Summary
The Miami MSA market continues to grow as a destination. Its healthy and diversified corporate presence and employment base is solid and far superior to that of other cities in Florida, including Orlando. This is significant in that UCF, located in Orlando, has sold out its premium seat amenities for their new stadium. The Miami area has sustained continued growth in population albeit with a reduced rate of increase from prior years, and can draw on surrounding population centers including a large number of local FAU alumni for support.
As detailed above, the football stadium will be located on the north side of the main campus area proximate to the campus’ main roadway. A collection of projects is currently affecting the overall face of the FAU campus, which includes the football stadium, Innovation Village, a major new Hospital, a renovated Arena, an Alumni Center, housing, retail, parking, and an array of other athletics facilities. With the development of these projects, FAU will have the critical mass of attractions, easy access via two limited access/toll roads and the proximity to Miami and surrounding affluent communities to support a new football stadium. Other sections in this report will investigate the sports and event market to support the building design and program, as well as make projections of demand and financial performance.
C . H . J O H N S O N C O N S U L T I N G , I N C . EXPERTS IN CONVENTION, SPORT AND REAL ESTATE CONSULTING
Florida Atlantic University Section 2 Page 5 Football Stadium Analysis July 2010
Currently, there is a national trend towards upgrading, expanding, and improving public assembly facilities such as stadiums and sports complexes. This trend has led to the development of new and renovated facilities throughout the country, not only in major professional sports but also at minor league and collegiate levels. Universities are becoming more cognizant of the multiple benefits of new athletic facility development based on the proven value of new revenue streams and the increased expectation from spectators, students, alumni, and the general community for more comfort and amenities. Also, the construction of new facilities can lead to improvement in the athletics programs at universities, with newer venues offering better opportunities. The addition of new facilities will likely allow FAU to attract better athletes and more students, bring more events into the area, as well as provide area citizens with better public facilities and increased entertainment options. Several new collegiate football stadiums profiled in this report have proven that , even with a limited number of events, they can be self-sustaining operations with revenues generated from premium seat leases, naming rights and other sponsorship, private donations, parking, ticket and concession sales.
Although the Palm Beach/Fort Lauderdale/Miami area has Dolphin Stadium and the new Marlins Stadium (slated for a 2012 opening) as its major stadium facilities, numerous markets with two to five million residents have multiple sports venues. In comparison to other markets of similar size to FAU’s market, the area is above average in terms of its representation of disposable income and the number of business establishments.
FAU is a classic example of a university in need of a new stadium because it is both relatively new to collegiate football and because its off-campus temporary stadium no longer suits it needs. It is recommended that an on-campus football stadium for FAU with a capacity of approximately 30,000 people is appropriate for the market and the university. Additionally, a variety of premium seating options, including luxury suites, loge boxes, and indoor and outdoor club seats are also recommended in the stadium plan. Approximately 20 leasable suites, 16 loge boxes, and 1,000 club seats are recommended. In addition, a donor priority seat program of approximately 4,500 seats is recommended. This type of facility will be able to host a wide range of events, such as sporting events, concerts, and community events. At the present time, the stadium will host FAU football events, high school football games, and other events. However, it is important that the facility be designed with the flexibility to host other types of events at a future date, should these event types be determined suitable within the community.
Based on these assumptions, once the stadium opens in the fall of 2011, it will host a minimum of six FAU football games annually. This number is anticipated to stay the same throughout the projections. An average FAU football per game attendance is projected at approximately 20,100. When considering the six football games and
C . H . J O H N S O N C O N S U L T I N G , I N C . EXPERTS IN CONVENTION, SPORT AND REAL ESTATE CONSULTING
Florida Atlantic University Section 2 Page 6 Football Stadium Analysis July 2010
other events, the total annual attendance is projected to reach 186,000. Based on the projected demand and attendance figures, the stadium is projected to generate a gross revenue of approximately $6.6 million in a stabilized year of operation. When considering the revenues which are currently earned from the FAU football program, net incremental revenues in a stabilized year are projected at approximately $6.0 million. Stadium operating expenses for this same period are estimated at $1.5 million resulting in a net operating income of approximately $4.5 million. These funds, along with non-operating revenues, such as away game and other guarantees, are available to fund maintenance reserve accounts, debt service and coverage.

III. MARKET ANALYSIS

C . H . J O H N S O N C O N S U L T I N G , I N C . EXPERTS IN CONVENTION, SPORT AND REAL ESTATE CONSULTING
Florida Atlantic University Section 3 Page 1 Football Stadium Analysis July 2010
MARKET ANALYSIS
In order to analyze the market opportunity for a new football stadium on the campus of Florida Atlantic University (FAU), in conjunction with development of an overall innovative master plan on campus, which includes housing and retail, Johnson Consulting reviewed market conditions and characteristics within the greater Miami-Fort Lauderdale-Miami Beach, FL MSA. While characteristics such as population, employment, and income are not strict predictors of performance for sports facilities, they provide insight into the capacity of a market to support facilities or activities. In addition, the size and role of a marketplace, recent and historical development trends, as well as competing or complementary attractions and venues all affect the scale or quality of facilities developed for a particular market. The objective of this analysis is to identify factors that may affect the level of support that would exist for an additional sports facility at FAU. This section also presents an overview of the university and its athletics department and facilities.
Florida Atlantic University
Johnson Consulting assessed various conditions and characteristics of FAU that will impact the planned football stadium. Characteristics such as current and projected student enrollment, athletics programs offered, resource support for entertainment programming, and the quality of existing facilities will affect the performance of the new and existing sports facilities.
Florida Atlantic University, a member institution of the Florida State University System, was established in 1961 as a fifth university in the state system. The University directly serves a seven county area with a population of over 5 million people. FAU consists of seven campuses with over 26,000 students in nearly 170 various degree programs, including its most recent addition—a two year medical school program, which is slated to increase to a four year medical school with the construction of a 600 bed teaching hospital on the southeast portion of its Boca Raton campus.
The FAU’s main and only traditional residential campus is located on over 850 acres in Boca Raton, just over 20 miles north of downtown Fort Lauderdale and 45 miles north of Miami. The campus is located immediately adjacent to I-95 and is within approximately 4 miles of another major north-south limited access highway—the Florida Turnpike--affording the campus excellent regional accessibility. The FAU campus has direct access to I-95 from Glades Road (SR 808) a major regional east-west artery. It should also be noted the proposed football stadium site in the northwest portion of campus will have visibility from I-95. In addition to vehicular accessibility described above, FAU’s campus is less than 20 miles from two of the

C . H . J O H N S O N C O N S U L T I N G , I N C . EXPERTS IN CONVENTION, SPORT AND REAL ESTATE CONSULTING
Florida Atlantic University Section 3 Page 2 Football Stadium Analysis July 2010
major airport serving Southeast Florida with Palm Beach International Airport (20 miles north) and Fort Lauderdale/Hollywood International Airport (about 18 miles south). FAU’s campus also enjoys proximity to the ocean being only about a mile from the Atlantic coast.
Table 3-1
Enrollment Growth
2000 21,4662001 23,819 11%2002 24,119 1%2003 25,261 5%2004 25,662 2%2005 25,994 1%2006 25,657 -1%2007 26,525 3%2008 27,021 2%2009 27,700 3%
Source: FAU, Johnson Consulting
Historical Enrollment
As the table shows, enrollment has progressively increased over the last seven academic years. In 2000, total enrollment was 21,466. With an increase in enrollment coming every year, FAU reached 25,000 students in 2003 and increased 2% in 2004 and 1% in 2005, before it took a slight drop in 2006. The three years to follow 2007-2009, all showed a positive growth with 3 %, 2%, and 3% respectively. The new on campus stadium will only help nourish this already healthy growth in student enrollment.
FAU Athletics
FAU currently has 19 men’s and women’s athletics teams that compete at the NCAA Division I-A level in the Sub Belt Conference. Table 3-2, lists the sanctioned intercollegiate athletics teams offered at FAU.

C . H . J O H N S O N C O N S U L T I N G , I N C . EXPERTS IN CONVENTION, SPORT AND REAL ESTATE CONSULTING
Florida Atlantic University Section 3 Page 3 Football Stadium Analysis July 2010
Table 3-2
Men's Athletics Women's Athletics
Baseball BasketballBasketball Cheer
Cheer Cross CountryCross Country Dance
Football GolfGolf Soccer
Soccer SoftballSwimming Swimming
Tennis TennisTrack
Volleyball
Source: FAU, Johnson Consulting
FAU Athletics
FAU athletics began in 1979 and has grown to Division I-A status. In 1999, the Owls became members of the Sun Belt Conference where it competes with Arkansas State, University of Arkansas at Little Rock, University of Denver, Florida International University, University of Louisiana at Lafayette, University of Louisiana at Monroe, Middle Tennessee State, University of New Orleans, North Texas, University of South Alabama, Troy University, and Western Kentucky University.
FAU Facilities
The following text describes the main athletics facilities on the FAU campus:
Tom Oxley Center – The 54,000 square foot, state of the art facility houses the football locker room, training room, weight room, meeting rooms and coaches' offices. The Oxley Center also opens its doors to individual locker rooms for women's track, soccer, softball and volleyball, as well as the respective coaches' offices. The Athletics Director, Associate AD for Compliance and Sports Information Director also call the Oxley Center home. All FAU students are allowed to use the computer study lab and take advantage of its classrooms. The facility overlooks the baseball "B" field, the soccer game field, the softball stadium, the Boca Raton airport, and two football practice fields.
FAU Arena/Gymnasium – Known as “The Burrow”, the Arena is currently undergoing a $10 million dollar renovation that will update the facility. The building is a multipurpose facility with approximately 31,000 square feet of exhibition space and a seating capacity of 5,000. The Arena is the current

C . H . J O H N S O N C O N S U L T I N G , I N C . EXPERTS IN CONVENTION, SPORT AND REAL ESTATE CONSULTING
Florida Atlantic University Section 3 Page 4 Football Stadium Analysis July 2010
home to women’s volleyball and men’s and women’s basketball. The facility houses locker rooms for two varsity teams.
Baseball Stadium – FAU’s baseball stadium has a seating capacity of 1,200. The facility is lighted. The stadium originally opened in 1990.
Softball Stadium – Home to the FAU women’s softball team. The stadium has a 1,000 seat capacity and is lighted.
Olympic Outdoor Swimming Pool – Home to both FAU’s men’s and women’s diving and swimming teams.
Innovation Village
In 2006, FAU, began exploring the possibilities for a public/private partnership to expand the offerings at the main campus of the University in Boca Raton in order to improve FAU’s perception as a “more traditional, first choice university campus”. The plan, which became known as “Innovation Village”, seeks to:
Create a traditional collegiate environment
Improve the student experience
Increase FAU’s visibility and reputation
Enhance athletics
In order to achieve these goals, it is believed Innovation Village could build a more vibrant campus life and programs by creating facilities that would:
Create traditions and a sense of pride through sports, new programs and student activities, such as, Homecoming, fraternities/sororities and other traditional elements of campus life
Generate additional facilities to engage students on campus, such as, additional recreation and fitness venues, more residence halls and expanded use of the student union or similar new facilities
Support this more vibrant campus life by providing additional entertainment and shopping on campus including such things as a restaurant, cleaners, convenience shopping, hair salon and coffee shop that appeal most to the wants and needs of students

C . H . J O H N S O N C O N S U L T I N G , I N C . EXPERTS IN CONVENTION, SPORT AND REAL ESTATE CONSULTING
Florida Atlantic University Section 3 Page 5 Football Stadium Analysis July 2010
Early proposals for this public/private partnership called for the addition of either a domed multi-purpose stadium/arena or an open air football stadium and separate arena together with approximately 2,000 new residence hall beds (although a proposed site plan with 1,545 beds was ultimately prepared and has been analyzed in a separate report) and up to 130,000 square feet of retail space to be located north of Lee Street spread across both sides of Palm Beach Avenue on the north side of campus (see Figure 3-1)
Figure 3-1
In November of 2006, the Board of Trustees was presented with the proposals for the aforementioned choices between the multi-purpose stadium/arena facility and separate football and arena facilities including the projected costs of such facilities. After deliberating over these proposals, the Board of Trustees instructed the University’s administration to focus its attention on a plan to build a separate football stadium and arena. It was concluded such an approach would afford greater flexibility to phase in the addition of the stadium and arena over time by addressing the more pressing need for a new home for the Owls’ football team.
The result of this decision is an Innovation Village plan consisting of a new open air football stadium with a capacity of between 20,000 and 45,000 fans with a site set aside for the possible addition of a new arena in the future. The Innovation Village plan also includes the 1,545 new beds for student housing and a retail site for up to 130,000 square feet as well as parking. All of these campus improvements will be located on the north side of campus as previously described.

C . H . J O H N S O N C O N S U L T I N G , I N C . EXPERTS IN CONVENTION, SPORT AND REAL ESTATE CONSULTING
Florida Atlantic University Section 3 Page 6 Football Stadium Analysis July 2010
This part of the project is proceeding and a developer has been selected. Based on preliminary developer agreements, it is anticipated that the Innovation Village aspect of the project will yield $12,000,000 in funding resources towards the infrastructure improvements common to Innovation Village and the stadium.
FAU/Boca Raton Area Overview FAU’s campuses and the Boca Raton campus, in particular, are located in what has been defined as the Miami-Fort Lauderdale-Pompano Beach Core Based Statistical Area (CBSA). The Miami CBSA covers Broward, Miami-Dade and Palm Beach Counties. Boca Raton and FAU’s main campus are located in Palm Beach County.
Population
Boca Raton is located in Miami-Dade County (County), which is comprised of 35 incorporated cities and unincorporated areas. The eastern portion of the County is heavily urbanized and is the location of the County’s central business district, downtown Miami. The western portion of the County extends into the Everglades National Park and is largely unpopulated. The County has a population of approximately 2.4 million in 2009 and is part of the Miami/Ft. Lauderdale/Pompano Core Based Statistical Area (CBSA) which has a combined population of 5.3 million in 2009. Table 3-3, displays the population trends for the United States, the State of Florida, the CBSA, Miami Dade County, Broward County, and the Cities of Miami, Ft. Lauderdale, and Boca Raton.
Table 3-3 Historical Population and Growth Rates
Population % of CBSA Population % of CBSA Population % of CBSA Population % of CBSA
US 248,576,851 -- 281,279,915 -- 305,921,712 -- 317,062,794 -- 1.0%State of Florida 12,937,941 -- 15,982,378 -- 18,573,951 -- 19,380,721 -- 1.7%
Miami-Ft. Lauderdale-Pompano CBSA* 4,056,109 100.0% 5,007,564 100.0% 5,305,182 100.0% 5,051,513 100.0% 0.9%
Miami Dade County 1,937,100 47.8% 2,253,362 45.0% 2,353,924 46.6% 2,275,478 45.0% 0.7%Broward County 1,255,486 31.0% 1,623,018 32.4% 1,701,866 33.7% 1,567,126 31.0% 0.9%
Miami 358,882 8.8% 362,458 7.2% 376,920 7.1% 381,318 7.5% 0.3%Ft. Lauderdale 150,078 3.7% 152,870 3.1% 152,966 2.9% 139,792 2.8% (0.3%)Boca Raton 61,379 1.5% 75,246 1.5% 73,901 1.4% 68,025 1.3% 0.4%
CBSA - Core Based Statistical Area Replaces Mertopolitan Statistical Area (MSA)CAGR - Compound Annual Growth RateSource: Demographics Now, Johnson Consulting
CAGR* 1990 to
2014
1990 2000 2014 (Projected)2009 (Estimated)
Population growth in the Miami CBSA has stayed consistent with that of the national growth rate of population. With a population of over 5.3 million in 2009, the CBSA is home to approximately 29 percent of Florida’s total population. The US population grew from 1990 to 2009 at 1 percent. In the State of Florida, the increase

C . H . J O H N S O N C O N S U L T I N G , I N C . EXPERTS IN CONVENTION, SPORT AND REAL ESTATE CONSULTING
Florida Atlantic University Section 3 Page 7 Football Stadium Analysis July 2010
from 2000 to 2009 is due to immigration and growth in the State. Florida as a state experienced a higher growth rate as compared to the rest of the country, and the Miami MSA experienced a similar above average growth rate with 1.7 percent from 1990 to 2009.
Income and Employment
The strength of a market’s income and employment can be an indicator of its potential ability to support public assembly facilities. In general, higher income levels lead to greater amounts of disposable income, which can be spent on non-essential items such as recreation and entertainment. Less wealthy markets will have less disposable income available to spend on event tickets, for example, and would be expected to provide a lower level of attendee demand. Indicators of a market’s overall wealth and growth can include trends in certain sectors of income and employment, such as construction, manufacturing, services, as well as finance, insurance, and real estate (FIRE). For many university-based events, such as football games, attendance is largely independent of a market’s wealth and will depend heavily on student support.
C . H . J O H N S O N C O N S U L T I N G , I N C . EXPERTS IN CONVENTION, SPORT AND REAL ESTATE CONSULTING
Florida Atlantic University Section 3 Page 8 Football Stadium Analysis July 2010
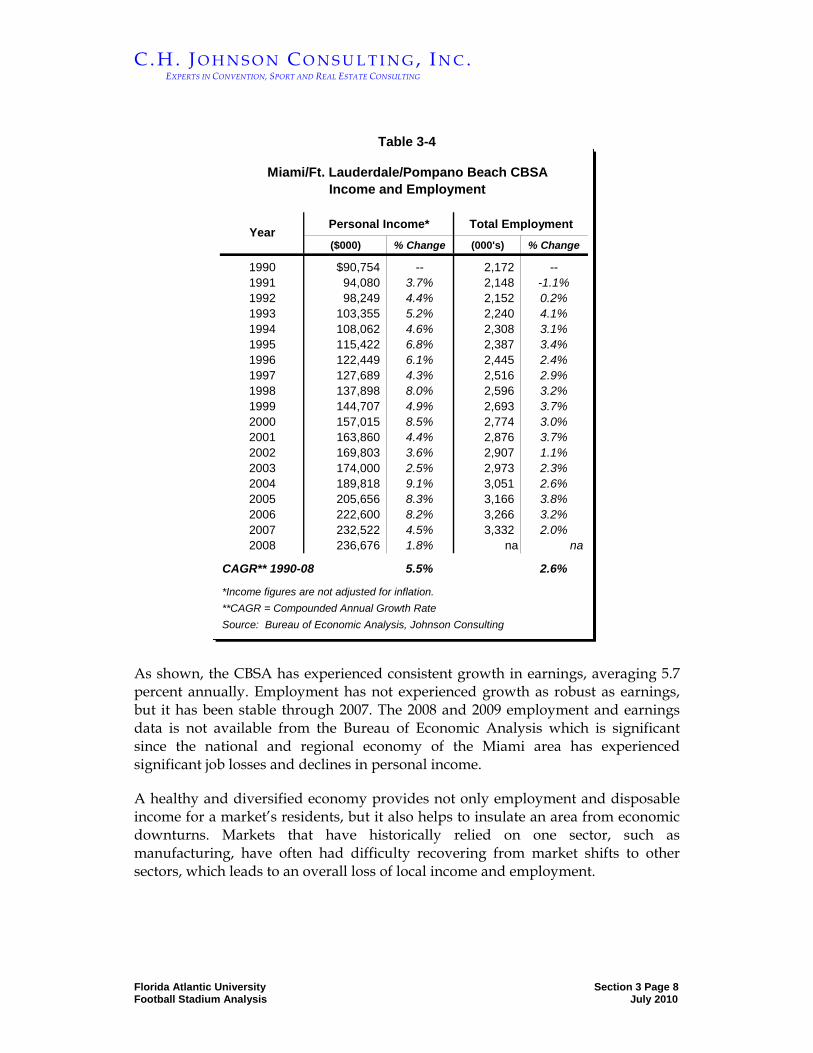
Table 3-4
Personal Income* Total Employment
($000) % Change (000's) % Change
1990 $90,754 -- 2,172 --1991 94,080 3.7% 2,148 -1.1%1992 98,249 4.4% 2,152 0.2%1993 103,355 5.2% 2,240 4.1%1994 108,062 4.6% 2,308 3.1%1995 115,422 6.8% 2,387 3.4%1996 122,449 6.1% 2,445 2.4%1997 127,689 4.3% 2,516 2.9%1998 137,898 8.0% 2,596 3.2%1999 144,707 4.9% 2,693 3.7%2000 157,015 8.5% 2,774 3.0%2001 163,860 4.4% 2,876 3.7%2002 169,803 3.6% 2,907 1.1%2003 174,000 2.5% 2,973 2.3%2004 189,818 9.1% 3,051 2.6%2005 205,656 8.3% 3,166 3.8%2006 222,600 8.2% 3,266 3.2%2007 232,522 4.5% 3,332 2.0%2008 236,676 1.8% na na
CAGR** 1990-08 5.5% 2.6%
*Income figures are not adjusted for inflation. **CAGR = Compounded Annual Growth RateSource: Bureau of Economic Analysis, Johnson Consulting
Year
Miami/Ft. Lauderdale/Pompano Beach CBSA Income and Employment
As shown, the CBSA has experienced consistent growth in earnings, averaging 5.7 percent annually. Employment has not experienced growth as robust as earnings, but it has been stable through 2007. The 2008 and 2009 employment and earnings data is not available from the Bureau of Economic Analysis which is significant since the national and regional economy of the Miami area has experienced significant job losses and declines in personal income.
A healthy and diversified economy provides not only employment and disposable income for a market’s residents, but it also helps to insulate an area from economic downturns. Markets that have historically relied on one sector, such as manufacturing, have often had difficulty recovering from market shifts to other sectors, which leads to an overall loss of local income and employment.

C . H . J O H N S O N C O N S U L T I N G , I N C . EXPERTS IN CONVENTION, SPORT AND REAL ESTATE CONSULTING
Florida Atlantic University Section 3 Page 9 Football Stadium Analysis July 2010
Table 3-5 displays total non-farm income by sector for the Miami-Fort Lauderdale CBSA from 2004 to 2007.
Table 3-5 Miami-Fort Lauderdale CBSA Non-Farm Earnings By Sector
($Millions)*
Sector 2004 2005 2006 2007
Construction 9.0 10.4 11.7 11.0 Percent of Total 7.1% 7.6% 8.0% 7.3%
Manufacturing 6.5 6.6 7.3 7.2 Percent of Total 5.2% 4.8% 5.0% 4.8%
Wholesale Trade 9.3 10.2 11.1 11.6 Percent of Total 7.4% 7.5% 7.6% 7.7%
Retail Trade 9.7 10.4 11.2 11.2 Percent of Total 7.6% 7.6% 7.6% 7.5%
FIRE** 9.7 10.5 11.6 12.0 Percent of Total 7.7% 7.7% 7.9% 8.0%
Services 47.4 51.6 54.8 57.3 Percent of Total 37.5% 37.5% 37.4% 38.1%
Government 18.5 20.0 20.6 21.5 Percent of Total 14.7% 14.5% 14.1% 14.3%
Other 16.2 17.6 18.2 18.3 Percent of Total 12.9% 12.8% 12.4% 12.5%
Total 126.3 137.3 146.4 150.3 Percent Growth -- 8.7% 6.6% 2.6%
Source: Bureau of Economic Analysis
*Earnings figures are not adjusted for inflation.**Finance, Insurance and Real Estate
The services sector is by far the largest contributor to income in the CBSA, with 47.4 percent of the total in 2007. This is largely due to the tourism industry, driven by the area’s beaches and the millions of tourists they attract. Government (18.5 percent) and Other (16.2 percent) comprise the second and third largest shares of income in the MSA.
C . H . J O H N S O N C O N S U L T I N G , I N C . EXPERTS IN CONVENTION, SPORT AND REAL ESTATE CONSULTING
Florida Atlantic University Section 3 Page 10 Football Stadium Analysis July 2010
Transportation
Location and physical characteristics of the subject property are important factors, which influence development opportunities, project marketing, and attractiveness for entertainment and recreational events. Such factors as access, surrounding land uses, support services, and physical site features will impact either positively or negatively upon overall development opportunities and market potential. Observations and key findings relevant to the subject site are discussed below.
As discussed earlier, the proposed site is on the Florida Atlantic University’s main campus in Boca Raton, Florida. The campus is located approximately 13 miles north of downtown Miami and is immediately adjacent to and visible from I-95 as well as within approximately 4 miles of the Florida Turnpike affording excellent regional accessibility.
Fort Lauderdale-Hollywood International Airport (FLL) is conveniently located just 30 minutes from Boca Raton with easy access to I-95, I-595 and Port Everglades. Over 660 international and domestic flights arrive and depart at the airport daily, transporting passengers to points throughout the U.S., Canada, the Bahamas, the Caribbean, Mexico, Latin and South America. Passenger traffic at FLL for July, 2007 shows total traffic was up 10.9% over July, 2006 as 2,007,417 passengers traveled through the airport. Domestic traffic was up 7.7% and international traffic grew 34.5%. This was the first time July has topped the 2 million mark, and the first month of double digit growth since September, 2005. Passenger traffic is expected to continue to increase. Seasonal additions, coupled with new service in the next few months by JetBlue, Spirit, American, and FLL’s newest entrant Allegiant Air, will have a very significant positive impact. FLL is the 37th busiest airport in the US.
The Miami International Airport (MIA) is about 50 minutes away from Boca Raton and serves the Boca Raton community in addition to FLL. In 2006, MIA served over 32.5 million passengers. MIA is the 20th busiest airport in the U.S., and has just fewer than 400,000 aircraft operations each year. The growth of the Miami metro area and its location has helped to make the airport a busy regional hub for air service.
Corporate Presence
In general, a strong corporate and business presence can also be an important factor in the success of a new athletics venue because local businesses can attract residents to an area, provide disposable income to residents, and can support facilities through donations, advertising, and their requirement for event space. In addition, local companies are also a common source of demand for premium seating in sports facilities. Because of central Florida’s economic reliance on tourism and hospitality,
C . H . J O H N S O N C O N S U L T I N G , I N C . EXPERTS IN CONVENTION, SPORT AND REAL ESTATE CONSULTING
Florida Atlantic University Section 3 Page 11 Football Stadium Analysis July 2010
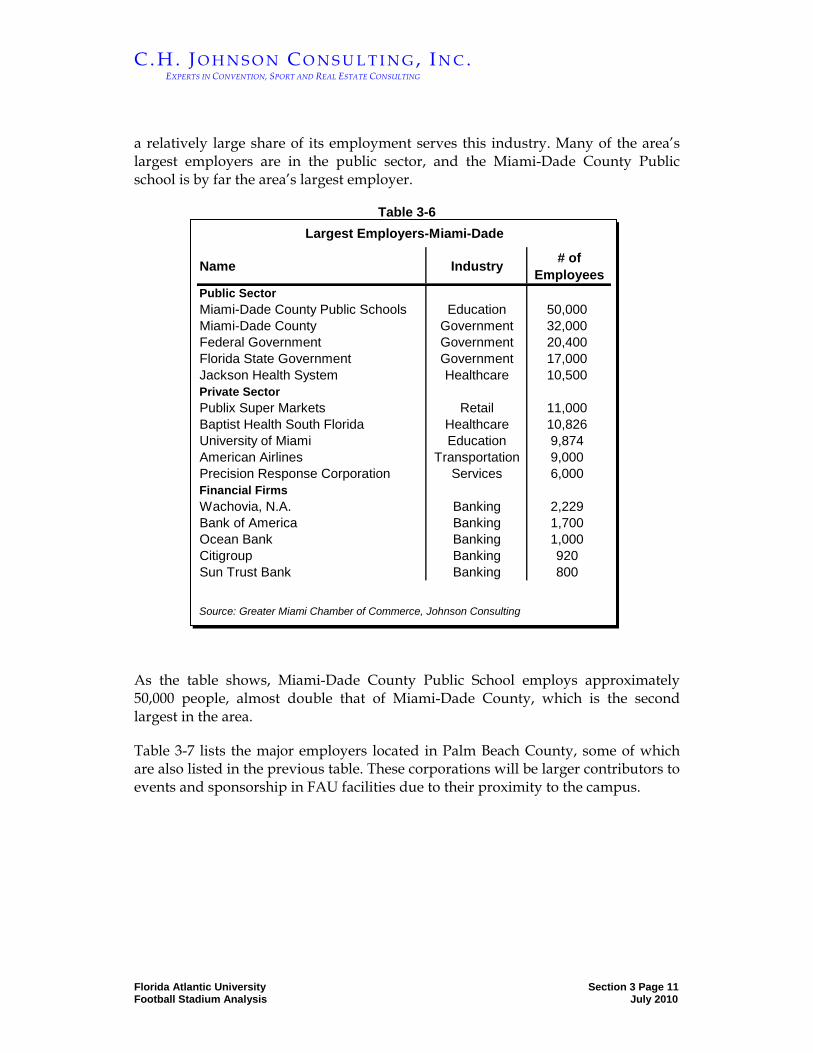
a relatively large share of its employment serves this industry. Many of the area’s largest employers are in the public sector, and the Miami-Dade County Public school is by far the area’s largest employer.
Table 3-6
Name Industry # of Employees
Public SectorMiami-Dade County Public Schools Education 50,000Miami-Dade County Government 32,000Federal Government Government 20,400Florida State Government Government 17,000Jackson Health System Healthcare 10,500Private SectorPublix Super Markets Retail 11,000Baptist Health South Florida Healthcare 10,826University of Miami Education 9,874American Airlines Transportation 9,000Precision Response Corporation Services 6,000Financial FirmsWachovia, N.A. Banking 2,229Bank of America Banking 1,700Ocean Bank Banking 1,000Citigroup Banking 920Sun Trust Bank Banking 800
Source: Greater Miami Chamber of Commerce, Johnson Consulting
Largest Employers-Miami-Dade
As the table shows, Miami-Dade County Public School employs approximately 50,000 people, almost double that of Miami-Dade County, which is the second largest in the area.
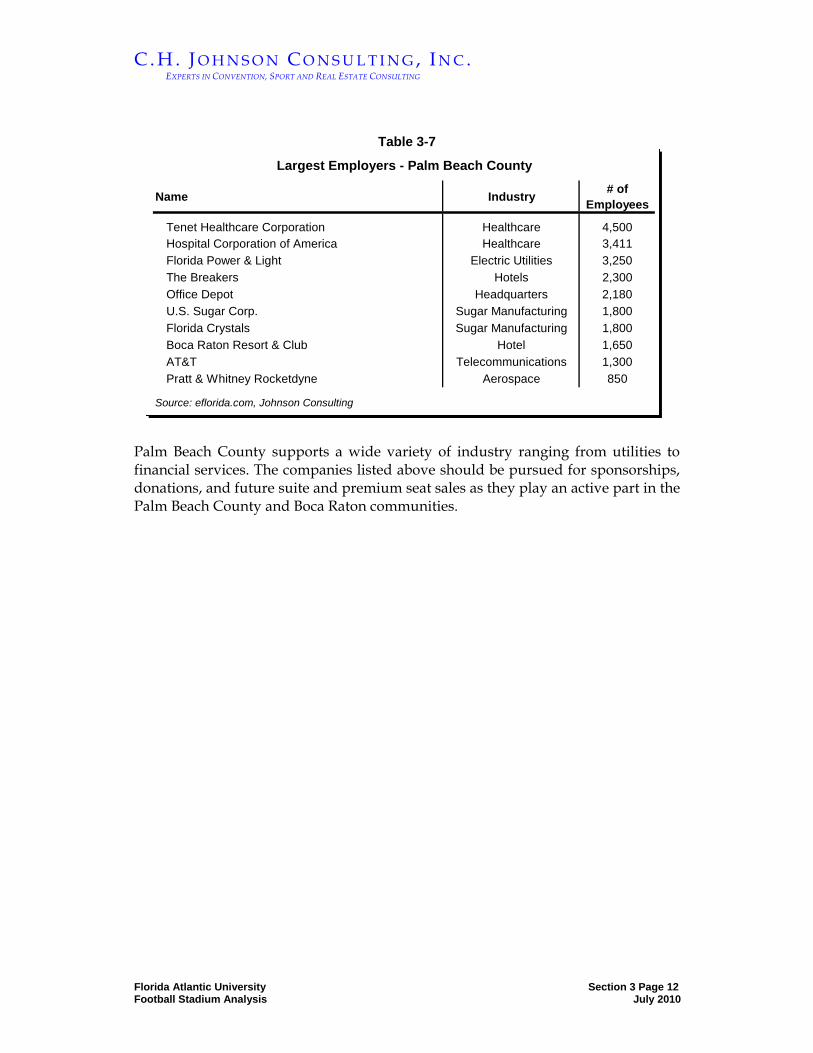
Table 3-7 lists the major employers located in Palm Beach County, some of which are also listed in the previous table. These corporations will be larger contributors to events and sponsorship in FAU facilities due to their proximity to the campus.
C . H . J O H N S O N C O N S U L T I N G , I N C . EXPERTS IN CONVENTION, SPORT AND REAL ESTATE CONSULTING
Florida Atlantic University Section 3 Page 12 Football Stadium Analysis July 2010
Table 3-7
Largest Employers - Palm Beach County
Name Industry # of Employees
Tenet Healthcare Corporation Healthcare 4,500Hospital Corporation of America Healthcare 3,411Florida Power & Light Electric Utilities 3,250The Breakers Hotels 2,300Office Depot Headquarters 2,180U.S. Sugar Corp. Sugar Manufacturing 1,800Florida Crystals Sugar Manufacturing 1,800Boca Raton Resort & Club Hotel 1,650AT&T Telecommunications 1,300Pratt & Whitney Rocketdyne Aerospace 850
Source: eflorida.com, Johnson Consulting
Palm Beach County supports a wide variety of industry ranging from utilities to financial services. The companies listed above should be pursued for sponsorships, donations, and future suite and premium seat sales as they play an active part in the Palm Beach County and Boca Raton communities.

IV. COMPARABLE STADIUM AND COMPARATIVE MARKET ANALYSIS
C . H . J O H N S O N C O N S U L T I N G , I N C . EXPERTS IN CONVENTION, SPORT AND REAL ESTATE CONSULTING
Florida Atlantic University Section 4 Page 1 Football Stadium Analysis July 2010
COMPARABLE STADIUM AND COMPARATIVE MARKET ANALYSIS
This section analyzes various factors that will affect the demand and performance of a new football stadium on the campus of Florida Atlantic University. The section includes an overview of collegiate sports facilities, a comparison of Sun Belt Conference facilities, an analysis of other comparable facilities, and other relevant issues.
Stadium Industry Overview
Football stadiums are different than arenas, in as much as they are generally single tenant oriented. Additionally, many stadiums have been expanded and upgraded, rather than built new. As a result, there has not been a tremendous amount of new stadium development at the NCAA Division I FBS level (formerly known as Division I-A). According to industry research, only ten Division I FBS football venues have been built in the last 19 years, including facilities for the University of Akron, the University of Minnesota, the University of Connecticut, Southern Methodist University, the University of Louisville, Rutgers University, the University of Central Florida, Marshall University, Florida International University and the University at Buffalo. In these markets, the facilities have been developed to replace completely obsolete stadiums, address new entrees into the football realm, or as in Southern Methodist University’s case, to reestablish the school’s football program after its NCAA sanctions. At both the professional and collegiate levels, new stadium construction in large markets has mainly served to replace existing facilities that have become functionally worn out and financial drains for long-term tenants.
Universities are becoming more cognizant of the multiple benefits of new athletic facility development based on the proven value of new revenue streams and the increased expectation from spectators, students, alumni, and the general community for more comfort and amenities. Historically, a typical university stadium facility was relatively sparse, with few modern amenities, and no emphasis on the fan experience. However, institutions of various sizes across the country have recently developed, or are planning to develop, stadiums and arenas based on the professional facility model, with premium seating, numerous advertising opportunities, private clubs, and other amenities to generate revenue and to improve attendees’ event experience.
Arenas have led the way, but more football stadiums will be built. FAU is a classic example of a university in need because it is both relatively new to collegiate football and because its temporary stadium needs to be replaced. FAU uses the off-campus, Lockhart Stadium, but as a University, it is moving upward, hoping to join

C . H . J O H N S O N C O N S U L T I N G , I N C . EXPERTS IN CONVENTION, SPORT AND REAL ESTATE CONSULTING
Florida Atlantic University Section 4 Page 2 Football Stadium Analysis July 2010
a new conference. FAU has begun to develop in-state rivalries and also must compete with the University of Florida, Florida State University, University of South Florida, and the University of Miami, among many other national schools for talent. The stadium is a key tool to grow the Campus’s identity both within the State and nationally. And, in the case of FAU and Lockhart Stadium, Lockhart does not meet FAU’s growing needs, does not afford the kind of amenities that have come to be expected of such sports venues, is not located on (or even very near) campus .
In a university setting, these new and redesigned facilities can have a wide variety of benefits. In terms of recruiting, prospective student-athletes place a great deal of importance on a school’s training and competition facilities, and this can have a direct impact on the quality of a school’s athletics program. The success of an athletics department, in turn, can positively affect a university’s exposure, and it has been shown there is often a correlation between athletics success and increased applications for student enrollment. In addition, in most cases, the development of a new facility with amenities, such as luxury suites, is not simply perceived as a new method to leverage dollars from alumni and other supporters, but is seen as providing a product supporters are willing to pay for, take pride in, and value greatly. It also serves as a vehicle to keep alumni, the community, and other supporters connected to a university and its campus.
More recently, budgetary limitations and decreased public funding (and in many cases, private donations) have forced institutions to be more creative and aggressive in developing new revenue streams to support programs and services. Depending on a number of factors, such as capital costs, developing new athletics facilities can potentially be one method of increasing both operating revenues as well as alumni donations.
Throughout the country, these new building models have also shown they can generate revenues previously only found in major event and professional sports venues. Prior to recent years, it was uncommon for a minor-league or collegiate facility to feature luxury suites, club seats, or premium restaurants and clubs. These features are now common in new or retrofitted facilities, regardless of market or venue size.
In addition, naming rights and sponsorship programs have also become more common among minor league and collegiate facilities. In the past, facility development and ownership was primarily the responsibility of the public sector, the availability of these revenue streams has made private ownership a viable option. Given the right circumstances, these facilities can generate an acceptable return on investment to public or private owners, rather than serving purely as a public service to a municipality’s citizens or a university’s students. Typically, common circumstances include strong management, effective event programming
C . H . J O H N S O N C O N S U L T I N G , I N C . EXPERTS IN CONVENTION, SPORT AND REAL ESTATE CONSULTING
Florida Atlantic University Section 4 Page 3 Football Stadium Analysis July 2010
and the presence of anchor tenants, public-sector investment such as tax rebates, and other funding support for infrastructure and related features such as parking.
Survey Results In order to understand the level of interest among the FAU community for the proposed football stadium at FAU, Johnson Consulting conducted a Web-based survey of a sample of selected members from the faculty, student and alumni (“University Survey”). Further, Johnson Consulting conducted a similar survey with the Boca Raton Chamber of Commerce; the surveys were launched via email through names given to Johnson Consulting by chamber records (“Chamber Survey”). University Survey Results The University Survey consisted of questions ranging from current involvement in FAU athletics, potential interest in FAU football, interest in premium seating opportunities, and sponsorship and advertising opportunities. We received 677 responses to these questions. Although the results of a similar survey conducted for UCF are proprietary to the client, we can disclose that the rate of return for the FAU survey was greater than that for UCF. This greater response rate along with the following summary of those responses indicates greater interest in the market for a football stadium. Below are some of the findings based on those responses:
Of the 677 responses, only 18% of the respondents currently have tickets to FAU athletics.
Eight percent (or 56 people) have a strong to definite interest in leasing a suite at the new FAU on-campus football stadium, 18% have a fair interest in leasing suites.
Two percent of the respondents would pay more than $60,000 for a suite, 2% would also pay between $55-60,000 for a suite and 7% indicated they would pay between $50-55,000 for a suite lease. The total number of respondents who indicated a willingness to pay $50,000 or more is 59, more than the total number of suites available.
Eighty percent of the respondents indicated they were willing to sign 3 year leases for the suites, 13% responded saying they were willing to sign 5 year leases and 7% indicated they were willing to sign 7 year leases. Once again, the 13%(60 respondents) who are willing to sign 5 year leases exceeds the number of suites available, which gives an indication of a strong interest in the market.
Twenty five percent of the respondents have indicated they have a strong interest in purchasing club seats and 9% have a definite interest in purchasing club seats.
C . H . J O H N S O N C O N S U L T I N G , I N C . EXPERTS IN CONVENTION, SPORT AND REAL ESTATE CONSULTING
Florida Atlantic University Section 4 Page 4 Football Stadium Analysis July 2010
Twenty five percent of the respondents have indicated they would pay between $500-1,000 for each club seat package, 11% indicated they would pay between $1,001-1,500, and 5% indicated they would spend between $1,501-2,000 for each club seat package.
Thirty eight percent of the respondents indicated they were very interested in purchasing season tickets for FAU football games and 40% indicated they were somewhat interested. Overall, 523 of the 677 people who responded have an interest in FAU season tickets.
93 people (or 14% of the respondents) indicated an interest in advertising and naming opportunities at the new stadium. 30% of respondents indicated that they were “not sure”. However, given the overall positive results, it can be inferred that an early success of ticket sales and marketing efforts can turn some of those responses into “yes”.
Chamber Survey Results The Chamber Survey results were very similar to the University Survey. The Chamber Survey was sent out via email to over 25,000 members; and, we received 134 responses within six days. Results for the Chamber Survey are as follows:
Only 15% of the respondents currently have season tickets to FAU athletic events.
Twenty five percent of the respondents believed they had a fair interest in the new luxury suites, 13% had a strong interest in the suites, and 2% had a definite interest in the suites.
When giving their opinion about the price of the suite: 12% of the respondents believed they would pay $50,000 or more for a luxury suite lease with 3% willing to pay over $60,000.
Seventy eight percent of the respondents said they were willing to sign a three year lease for the suites, 16% said they would sign a five year lease and 6% would sign a 7 year lease.
The results for club seats fared better than the luxury suites, with 12% of the respondents indicating a definite interest in club seats, 31% having a strong interest in club seats and 22% having a fair interest in club seats.
Three percent of the respondents said they would pay between $1,501-2,000 for each club seat package, 18% said they would pay between $1,001-1,500 and 31% said they would pay between $500-1,000.
Fifty two percent of the people believed they would only be interested in leasing a club seat for one year, 33% indicated a three year lease and 15% indicated a five year lease.
Forty one percent of the respondents were very interested in purchasing season tickets for FAU football games and 36% were somewhat interested.
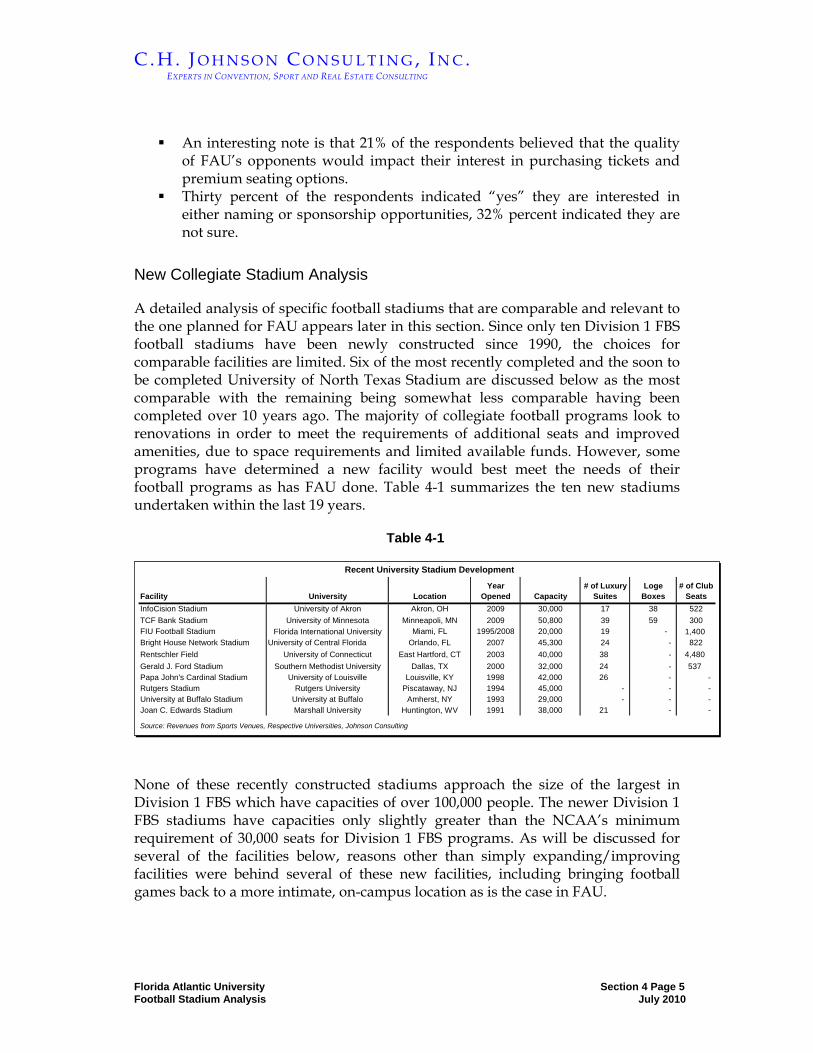
C . H . J O H N S O N C O N S U L T I N G , I N C . EXPERTS IN CONVENTION, SPORT AND REAL ESTATE CONSULTING
Florida Atlantic University Section 4 Page 5 Football Stadium Analysis July 2010
An interesting note is that 21% of the respondents believed that the quality of FAU’s opponents would impact their interest in purchasing tickets and premium seating options.
Thirty percent of the respondents indicated “yes” they are interested in either naming or sponsorship opportunities, 32% percent indicated they are not sure.
New Collegiate Stadium Analysis
A detailed analysis of specific football stadiums that are comparable and relevant to the one planned for FAU appears later in this section. Since only ten Division 1 FBS football stadiums have been newly constructed since 1990, the choices for comparable facilities are limited. Six of the most recently completed and the soon to be completed University of North Texas Stadium are discussed below as the most comparable with the remaining being somewhat less comparable having been completed over 10 years ago. The majority of collegiate football programs look to renovations in order to meet the requirements of additional seats and improved amenities, due to space requirements and limited available funds. However, some programs have determined a new facility would best meet the needs of their football programs as has FAU done. Table 4-1 summarizes the ten new stadiums undertaken within the last 19 years.
Table 4-1
Recent University Stadium Development
Facility University LocationYear
Opened Capacity# of Luxury
SuitesLoge
Boxes# of Club
SeatsInfoCision Stadium University of Akron Akron, OH 2009 30,000 17 38 522TCF Bank Stadium University of Minnesota Minneapoli, MN 2009 50,800 39 59 300FIU Football Stadium Florida International University Miami, FL 1995/2008 20,000 19 - 1,400Bright House Network Stadium University of Central Florida Orlando, FL 2007 45,300 24 - 822 Rentschler Field University of Connecticut East Hartford, CT 2003 40,000 38 - 4,480Gerald J. Ford Stadium Southern Methodist University Dallas, TX 2000 32,000 24 - 537Papa John's Cardinal Stadium University of Louisville Louisville, KY 1998 42,000 26 - - Rutgers Stadium Rutgers University Piscataway, NJ 1994 45,000 - - - University at Buffalo Stadium University at Buffalo Amherst, NY 1993 29,000 - - - Joan C. Edwards Stadium Marshall University Huntington, WV 1991 38,000 21 - -
Source: Revenues from Sports Venues, Respective Universities, Johnson Consulting
None of these recently constructed stadiums approach the size of the largest in Division 1 FBS which have capacities of over 100,000 people. The newer Division 1 FBS stadiums have capacities only slightly greater than the NCAA’s minimum requirement of 30,000 seats for Division 1 FBS programs. As will be discussed for several of the facilities below, reasons other than simply expanding/improving facilities were behind several of these new facilities, including bringing football games back to a more intimate, on-campus location as is the case in FAU.
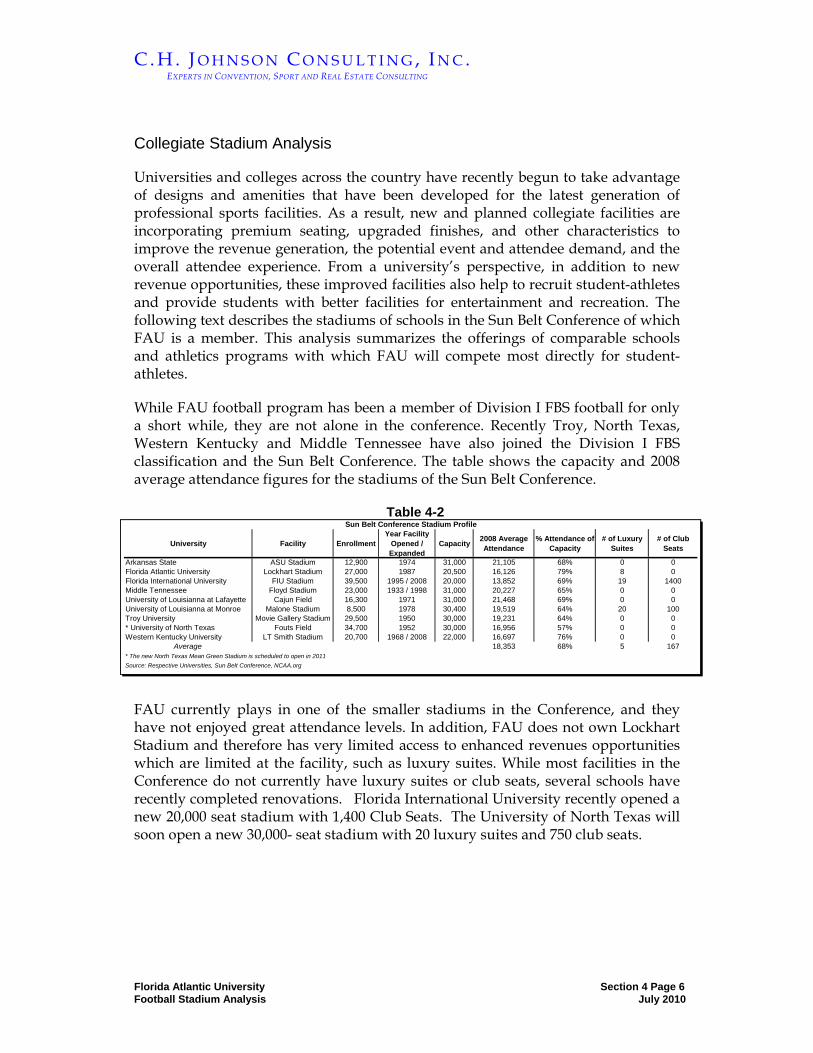
C . H . J O H N S O N C O N S U L T I N G , I N C . EXPERTS IN CONVENTION, SPORT AND REAL ESTATE CONSULTING
Florida Atlantic University Section 4 Page 6 Football Stadium Analysis July 2010
Collegiate Stadium Analysis
Universities and colleges across the country have recently begun to take advantage of designs and amenities that have been developed for the latest generation of professional sports facilities. As a result, new and planned collegiate facilities are incorporating premium seating, upgraded finishes, and other characteristics to improve the revenue generation, the potential event and attendee demand, and the overall attendee experience. From a university’s perspective, in addition to new revenue opportunities, these improved facilities also help to recruit student-athletes and provide students with better facilities for entertainment and recreation. The following text describes the stadiums of schools in the Sun Belt Conference of which FAU is a member. This analysis summarizes the offerings of comparable schools and athletics programs with which FAU will compete most directly for student-athletes.
While FAU football program has been a member of Division I FBS football for only a short while, they are not alone in the conference. Recently Troy, North Texas, Western Kentucky and Middle Tennessee have also joined the Division I FBS classification and the Sun Belt Conference. The table shows the capacity and 2008 average attendance figures for the stadiums of the Sun Belt Conference.
Table 4-2
University Facility EnrollmentYear Facility
Opened / Expanded
Capacity 2008 Average Attendance
% Attendance of Capacity
# of Luxury Suites
# of Club Seats
Arkansas State ASU Stadium 12,900 1974 31,000 21,105 68% 0 0Florida Atlantic University Lockhart Stadium 27,000 1987 20,500 16,126 79% 8 0Florida International University FIU Stadium 39,500 1995 / 2008 20,000 13,852 69% 19 1400Middle Tennessee Floyd Stadium 23,000 1933 / 1998 31,000 20,227 65% 0 0University of Louisianna at Lafayette Cajun Field 16,300 1971 31,000 21,468 69% 0 0University of Louisianna at Monroe Malone Stadium 8,500 1978 30,400 19,519 64% 20 100Troy University Movie Gallery Stadium 29,500 1950 30,000 19,231 64% 0 0* University of North Texas Fouts Field 34,700 1952 30,000 16,956 57% 0 0Western Kentucky University LT Smith Stadium 20,700 1968 / 2008 22,000 16,697 76% 0 0
Average 18,353 68% 5 167* The new North Texas Mean Green Stadium is scheduled to open in 2011Source: Respective Universities, Sun Belt Conference, NCAA.org
Sun Belt Conference Stadium Profile
FAU currently plays in one of the smaller stadiums in the Conference, and they have not enjoyed great attendance levels. In addition, FAU does not own Lockhart Stadium and therefore has very limited access to enhanced revenues opportunities which are limited at the facility, such as luxury suites. While most facilities in the Conference do not currently have luxury suites or club seats, several schools have recently completed renovations. Florida International University recently opened a new 20,000 seat stadium with 1,400 Club Seats. The University of North Texas will soon open a new 30,000- seat stadium with 20 luxury suites and 750 club seats.
C . H . J O H N S O N C O N S U L T I N G , I N C . EXPERTS IN CONVENTION, SPORT AND REAL ESTATE CONSULTING
Florida Atlantic University Section 4 Page 7 Football Stadium Analysis July 2010
Comparable Facilities
Johnson Consulting has analyzed a set of facilities in order to help demonstrate the potential for the planned stadium at FAU. Generally, the operations of university athletics facilities such as stadiums are combined with those of other university assets, and operating data for these facilities is not often available. In general, football stadiums are not utilized by many events other than a football tenant, and as a result, their operations are often not separated from other university athletic facilities. However, when available, operating data for football stadiums are shown in this section, as well as projected operations for University of Central Florida and Florida International University.
Although these facilities are located in various types of markets and have slightly different missions and orientations, each exhibit has characteristics relevant to the planned stadium at FAU. For this analysis, the following facilities are analyzed:
InfoCision Stadium, University of Akron in Akron, Ohio
TCF Bank Stadium, University of Minnesota in Minneapolis, Minnesota
Rentschler Field, University of Connecticut in East Hartford, Connecticut
Gerald J. Ford Stadium at Southern Methodist University in Dallas, Texas
Bright House Network Stadium at University of Central Florida in Orlando,, Florida
FIU Stadium at Florida International University in Miami, Florida
Mean Green Stadium, University of North Texas in Denton, Texas
InfoCision Stadium, University of Akron, Akron, Ohio
Home of the Akron Zips football program, the 27,000-seat InfoCision Stadium opened on September 12, 2009. The playing surface is separately known as Summa Field. The stadium replaced the 1940-era Rubber Bowl which was six miles off campus. An on-site stadium had long been desired. The stadium is a continuation of a University of Akron building initiative known as the “New Landscape for Learning” which included the construction on nine new buildings and the renovation of fourteen others. In order to build the stadium on campus, several dormitories were demolished and property was acquired via eminent domain. In order to house the displaced student, the university purchased the Quaker Square hotel, a renovated grain silo, for $22.6 million.
InfoCision Stadium has 27,000 seats plus “The Hill”, a grassy knoll at one end zone which can accommodate 3,000 student-spectators. The seven-level stadium houses

C . H . J O H N S O N C O N S U L T I N G , I N C . EXPERTS IN CONVENTION, SPORT AND REAL ESTATE CONSULTING
Florida Atlantic University Section 4 Page 8 Football Stadium Analysis July 2010
352,000 square feet, including 80,000 square feet of academic space. The playing surface at Summa Field is a synthetic surface, similar to that of the Rubber Bowl. In addition to general seating, the stadium features premium Club Seats for 522 Club Seats, 38 Loge Boxes with four seats per box, and 16 leasable suites with 16 seats per suite. There is also a 52-seat Presidential Suite for University use. A hospitality area is available for private rental on non-event days. There are 1,200 on-site parking spaces with an additional 10,000 spaces available throughout the campus.
The $61.6 million development cost of InfoCision Stadium was fully financed by the University of Akron. Debt will be paid over 30 years from premium seat sales, naming and sponsorship deals, other gifts and pledges, facility rentals and operating profits. Club seats are priced at $1,000 per seat. Loge and Suite per season prices are $5,000 and $20,000 each respectively. All premium seating is leased under a 3, 5 or 7 year contract. The University was able to secure separate naming rights deals for the stadium and the field, InfoCision paid $10 million for the stadium rights, while Summa Health Systems paid $5 million for the rights to the field. Other sponsorship deals include a $1 million agreement with First Merit Foundation for Club Level and a $100,000 deal with Towpath Credit Union for the Press Box.
TCF Bank Stadium, University of Minnesota, Minneapolis, Minnesota
Home of the University of Minnesota Gophers football program, TCF Bank Stadium opened on September 12, 2009. The stadium is the first new facility in the Big 10 Conference since 1960 and replaces the city-owned Hubert H. Humphrey Metrodome as the football program’s home field. The stadium is located on campus near the site of the former Memorial Stadium which hosted its final Gopher football game in 1981. It is a part of a 75-acre expansion plan for the University’s main campus which includes ten new academic building by 2015.
The open-air horseshoe stadium seats 50,000 with future expansion potential for over 80,000 seats. All seats between the goal lines, approximately 25,000, have chair backs. The façade and entrance arches were designed to resemble Memorial Stadium, and the entire 900,000 square foot stadium was designed to provide a collegiate feel to spectators. The synthetic playing surface is FieldTurf. In addition to general seating, stadium seating options include 250 indoor and 1,250 outdoor Club Seats. 59 Loge Boxes contain either four or six seats, and 39 Suites contain 16-19 seats.
The State of Minnesota is responsible for funding 48 percent of the $288.5 million development budget with the remaining 52 percent (approximately $133 million) the University’s responsibility. The University signed a $35 million, 25-year agreement the TCF Bank for the naming rights to the stadium. In addition to the
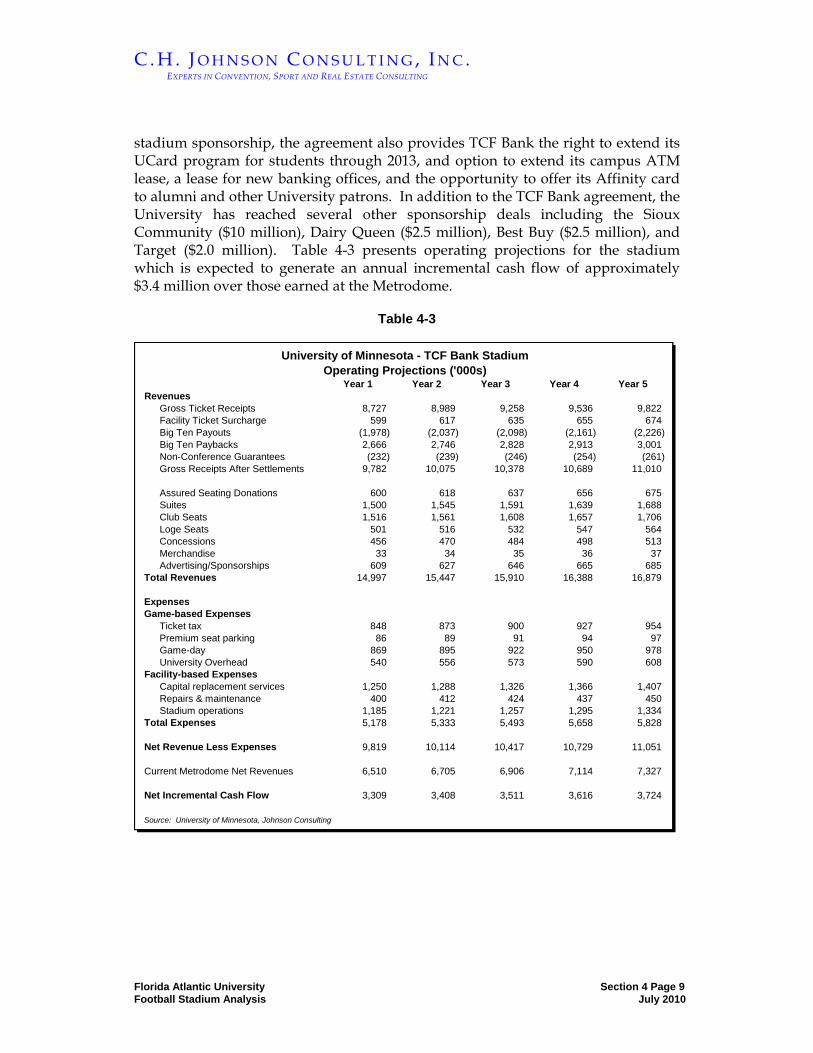
C . H . J O H N S O N C O N S U L T I N G , I N C . EXPERTS IN CONVENTION, SPORT AND REAL ESTATE CONSULTING
Florida Atlantic University Section 4 Page 9 Football Stadium Analysis July 2010
stadium sponsorship, the agreement also provides TCF Bank the right to extend its UCard program for students through 2013, and option to extend its campus ATM lease, a lease for new banking offices, and the opportunity to offer its Affinity card to alumni and other University patrons. In addition to the TCF Bank agreement, the University has reached several other sponsorship deals including the Sioux Community ($10 million), Dairy Queen ($2.5 million), Best Buy ($2.5 million), and Target ($2.0 million). Table 4-3 presents operating projections for the stadium which is expected to generate an annual incremental cash flow of approximately $3.4 million over those earned at the Metrodome.
Table 4-3
Year 1 Year 2 Year 3 Year 4 Year 5Revenues
Gross Ticket Receipts 8,727 8,989 9,258 9,536 9,822 Facility Ticket Surcharge 599 617 635 655 674 Big Ten Payouts (1,978) (2,037) (2,098) (2,161) (2,226) Big Ten Paybacks 2,666 2,746 2,828 2,913 3,001 Non-Conference Guarantees (232) (239) (246) (254) (261) Gross Receipts After Settlements 9,782 10,075 10,378 10,689 11,010
Assured Seating Donations 600 618 637 656 675 Suites 1,500 1,545 1,591 1,639 1,688 Club Seats 1,516 1,561 1,608 1,657 1,706 Loge Seats 501 516 532 547 564 Concessions 456 470 484 498 513 Merchandise 33 34 35 36 37 Advertising/Sponsorships 609 627 646 665 685
Total Revenues 14,997 15,447 15,910 16,388 16,879
ExpensesGame-based Expenses
Ticket tax 848 873 900 927 954 Premium seat parking 86 89 91 94 97 Game-day 869 895 922 950 978 University Overhead 540 556 573 590 608
Facility-based ExpensesCapital replacement services 1,250 1,288 1,326 1,366 1,407 Repairs & maintenance 400 412 424 437 450 Stadium operations 1,185 1,221 1,257 1,295 1,334
Total Expenses 5,178 5,333 5,493 5,658 5,828
Net Revenue Less Expenses 9,819 10,114 10,417 10,729 11,051
Current Metrodome Net Revenues 6,510 6,705 6,906 7,114 7,327
Net Incremental Cash Flow 3,309 3,408 3,511 3,616 3,724
Source: University of Minnesota, Johnson Consulting
University of Minnesota - TCF Bank StadiumOperating Projections ('000s)
C . H . J O H N S O N C O N S U L T I N G , I N C . EXPERTS IN CONVENTION, SPORT AND REAL ESTATE CONSULTING
Florida Atlantic University Section 4 Page 10 Football Stadium Analysis July 2010
Rentschler Field, University of Connecticut in East Hartford, Connecticut.
Home of the University of Connecticut (UConn) football program, Rentschler Field (Rentschler), is located in East Hartford, Connecticut, and is approximately 24 miles east of the main UConn campus. UConn recently was re-classified as a Division I FBS program and has seen great success associated with the addition of a new stadium. Rentschler was completed in 2003 at a cost of $91.2 million. Named for Pratt & Whitney founder, Frederick Rentschler, the land for the field was donated by Pratt & Whitney’s parent company, United Technologies Corporation. Rentschler is owned by the State of Connecticut (State) and is managed by Madison Square Garden (MSG).
The playing field at Rentschler is natural grass and has a large enough playing area to fit a regulation international soccer field. Rentschler has 40,000 seats, including 726 indoor and 3,754 outdoor club suites. The indoor club suites cost $40 per game per seat on top of an annual $1,400 donation. The indoor club suites are serviced by a 325-seat lounge, which is also used for approximately 15 to 20 other events throughout the year. Each outdoor club seat costs $35 per game with a $625 annual donation. Thirty-eight luxury suites are also available at an annual price of $50,000 for a term of five years. Concessions for all Rentschler functions are provided by Sodexho.
The original intention was to build a football stadium to lure the NFL’s New England Patriots and host the UConn football program. After the Patriots decided to stay in Massachusetts, the State of Connecticut and the town of East Hartford were able to modify the plans and funding for UConn. UConn has a lease agreement with the State, in which UConn agrees to host ten events annually at Rentschler, with a monetary penalty being levied if this is not fulfilled. Memorial Stadium was the previous home of UConn football, which, with only 16,200 seats, did not have sufficient seating capacity to meet the 30,000-seat requirement of the NCAA for a football program to be eligible to compete in Division FBS. UConn football is now a member of the Big East conference.
Table 4-3 summarizes the actual and projected event and average attendance demand at Rentschler during the 2009 and 2010 seasons, respectively.
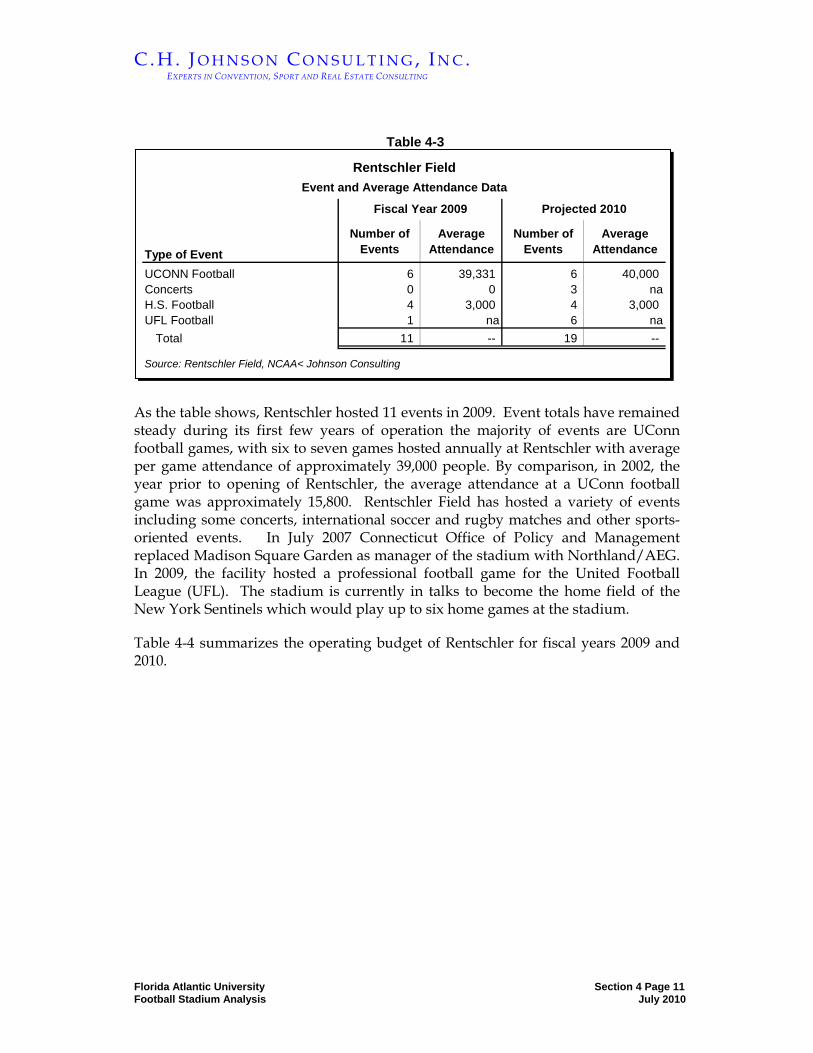
C . H . J O H N S O N C O N S U L T I N G , I N C . EXPERTS IN CONVENTION, SPORT AND REAL ESTATE CONSULTING
Florida Atlantic University Section 4 Page 11 Football Stadium Analysis July 2010
Table 4-3
Rentschler FieldEvent and Average Attendance Data
Type of Event
Number of Events
Average Attendance
Number of Events
Average Attendance
UCONN Football 6 39,331 6 40,000Concerts 0 0 3 naH.S. Football 4 3,000 4 3,000UFL Football 1 na 6 na
Total 11 -- 19 --
Source: Rentschler Field, NCAA< Johnson Consulting
Fiscal Year 2009 Projected 2010
As the table shows, Rentschler hosted 11 events in 2009. Event totals have remained steady during its first few years of operation the majority of events are UConn football games, with six to seven games hosted annually at Rentschler with average per game attendance of approximately 39,000 people. By comparison, in 2002, the year prior to opening of Rentschler, the average attendance at a UConn football game was approximately 15,800. Rentschler Field has hosted a variety of events including some concerts, international soccer and rugby matches and other sports-oriented events. In July 2007 Connecticut Office of Policy and Management replaced Madison Square Garden as manager of the stadium with Northland/AEG. In 2009, the facility hosted a professional football game for the United Football League (UFL). The stadium is currently in talks to become the home field of the New York Sentinels which would play up to six home games at the stadium.
Table 4-4 summarizes the operating budget of Rentschler for fiscal years 2009 and 2010.

C . H . J O H N S O N C O N S U L T I N G , I N C . EXPERTS IN CONVENTION, SPORT AND REAL ESTATE CONSULTING
Florida Atlantic University Section 4 Page 12 Football Stadium Analysis July 2010
Table 4-4
Rentschler Field
Operating Budget
Fiscal Year 2009 Fiscal Year 2010
Operating RevenueNet Event Revenue $1,143,000 $1,109,800Net Ticket Surcharge ($3/ticket) 702,900 644,500Net Concessions, Catering & Parking 1,151,723 1,399,506Net Suites and Advertising 320,275 177,459
Total Operating Revenue $3,317,898 $3,331,265
Operating ExpensesSalaries & Wages $480,538 $390,004Utilities 739,500 942,450Contractual Service / R&M 780,000 637,506Materials & Supplies 37,500 70,596Adminstrative & General 82,250 130,265Management Fee & Incentives 154,500 161,137Event Day Costs 882,500 732,500
Total Operating Expenses $3,156,788 $3,064,458
Net Operations Income $161,110 $266,807
Source: Connecticut Office of Policy & Management, Johnson Consulting
As the table shows, total operating revenue for Rentschler in fiscal year 2003 was approximately $4.4 million with total operating expenses of approximately $3.3 million. All tickets revenues and sales for UConn football games are handled by the university. MSG charges an annual management fee of $175,000, with other incentives given depending on performance of the facility. Total management fees and incentives totaled approximately $890,000 in fiscal year 2003, for an approximate $200,000 net operations income. The net operations income is available to the State to pay for debt service and other capital items for Rentschler. A cost saving measure of Rentschler was to use the State’s insurance to cover the facility itself and also to absorb a portion of MSG’s insurance liability to operate the facility as well.
Table 4-5 shows the estimated per capita for concession sales for Rentschler.

C . H . J O H N S O N C O N S U L T I N G , I N C . EXPERTS IN CONVENTION, SPORT AND REAL ESTATE CONSULTING
Florida Atlantic University Section 4 Page 13 Football Stadium Analysis July 2010
Table 4-5
Rentschler FieldEstimated Concessions Per Cap
Net Concession Revenue1 $858,150Estimated Gross Concession Revenue2 $2,145,375Estimated Total Attendance 330,000Concessions Per Cap $6.501 Includes sale of alcoholic beverages.2 Net concession revenues divided by 40 percent.Source: Johnson Consulting
Concessions per capita are estimated to be $6.50. This is based on estimated gross concession revenues of $2.1 million and estimated total attendance of 330,000 people. Rentschler serves alcohol at its events, as evident by the high concession per cap figure.
Rentschler provides an excellent example of how a well-managed and positioned facility is able to operate at a profit with a limited number of events that it is able to host. By hosting emerging sports and having a flexible field, Rentschler has been able to operate efficiently, even with a limited potential number of events it can host.
Gerald J. Ford Stadium at Southern Methodist University in Dallas, Texas
Gerald J. Ford Stadium (Ford Stadium) is host to the Southern Methodist University (SMU) football program and is located in Dallas, Texas. Ford Stadium was completed in August 2000 for a total cost of $58 million, of which $24 million was donated by Gerald J. Ford. The remainder was raised from other private donations. SMU owns and manages Ford Stadium with concessions being contracted to Sodexho.
Like FAU, the intention of Ford Stadium was to bring renewed interest to SMU football by bringing home games back to campus. SMU’s football program was suspended by the NCAA in the 1980’s for numerous rule violations. SMU had played its home games at the Cotton Bowl and Texas Stadium (home of NFL’s Dallas Cowboys). Ownby Stadium was the SMU’s on-campus facility with seating for approximately 15,000. A $32 million renovation of Ownby was passed on in favor of demolishing the old stadium and replacing it with Ford Stadium.
Ford Stadium has seating for 32,000 with 537 club seats and 24 suites. The new stadium has generated renewed interest in SMU football and has 9,000 season ticket-holders. Suites are available for $25,000 for a term of three to five years. Club

C . H . J O H N S O N C O N S U L T I N G , I N C . EXPERTS IN CONVENTION, SPORT AND REAL ESTATE CONSULTING
Florida Atlantic University Section 4 Page 14 Football Stadium Analysis July 2010
seats are available for $500 annually. The design of Ford Stadium allows for future expansion for a total of 45,000 seats.
The number of events hosted at Ford Stadium is severely restricted by local ordinances. Ford Stadium is located in a residential area of north Dallas and is bordered by two affluent north Dallas suburbs. Only SMU sponsored, intercollegiate events, two regular season high school football games, and an unlimited number of high school playoff games may be hosted at Ford Stadium. Approximately six SMU football games are hosted annually. Attendance for SMU football games varies widely, with regional opponents, such as Texas Tech drawing capacity crowds of 34,000 people; however, average attendance for all SMU football games is approximately 20,000 people. Ford Stadium also hosts high school football games, with average attendance for each games ranging from 12,000 to 14,000. SMU selectively markets high schools to help SMU lure top prospects or draw large crowds for teams with other top prospects.
While specific data on Ford Stadium is limited, it does set the precedent for returning home football games to facilities on campus. Benefits of relocating the SMU football team to campus increased overall interest in SMU football, particularly in terms of season ticket sales.
Bright House Networks Stadium at University of Central Florida in Orlando, Florida
Bright House Networks Stadium on the campus of University of Central Florida is the home of the UCF Knights football team. The 45,000 seat on-campus stadium opened its doors for the 2007 season. The stadium is located in Orlando, Florida on the north end of campus. The stadium is part of a $100 million intercollegiate athletics complex which also includes a convocation center, the Nicholson Feildhouse, the Wayne Densch Sports Center, athletic fields, student housing, and retail space. The $47 million stadium costs include infrastructure, practice fields, roads and financing costs. Of the cost, almost $29 million was raised in private donations, and premium seat sales. The administration’s mandate for the stadium project was that no student funds or public money was fund the construction or ongoing operations.
UCF is similar to FAU in that both are programs trying to attain an identity as a school offering high quality football as well as academic excellence. Since the inception of the football program in 1979, the UCF Knights played their home games at the Citrus Bowl located in downtown Orlando. Moving to a new on-campus stadium gave the program help in recruiting top athletes. Also, the addition of a stadium on-campus is helping with overall student and community involvement with the University and its football program. UCF sold out all of its 24

C . H . J O H N S O N C O N S U L T I N G , I N C . EXPERTS IN CONVENTION, SPORT AND REAL ESTATE CONSULTING
Florida Atlantic University Section 4 Page 15 Football Stadium Analysis July 2010
luxury suites and 822 club seats even before playing its first game at the new stadium.
Table 4-7 presented below shows the projected operating revenues and expenses from that study conducted by Johnson Consulting in 2006.
Table 4-6
Operating Revenue Projected 2007-2008Ticket Sales $1,919,000Suites/Club 1,571,000Advertising/Sponsorships 180,000Naming Rights 698,000Concessions 338,000Parking 495,000Other 90,000Total Operating Revenue $5,291,000
Operating ExpensesStaff $313,000General and Administrative 180,000Utilities 150,000Repairs and Maintenance 240,000Insurance 32,000Communications 80,000Advertising 27,000Other 50,000Game Day 160,000Total Operating Expense $1,232,000Net Operating Income $4,059,000
Source: Johnson Consulting, UCF
Bright House Networks Stadium Projected Operating Proforma
The Golden Knights Corporation, a not-for-profit entity, was created by UCF for the sole purpose of financing, constructing, operating and maintaining the football stadium on behalf of the University. Financial statements for this discretely presented entity reflect the fact that a number of operating revenues and expenses are reported as transfers from the University and other entities, such of the UCF Athletic Association. As such, direct comparisons of these projections versus the actual results are not possible. Revenues and expense which are directly reported by the Golden Knights Corporation are as follows.
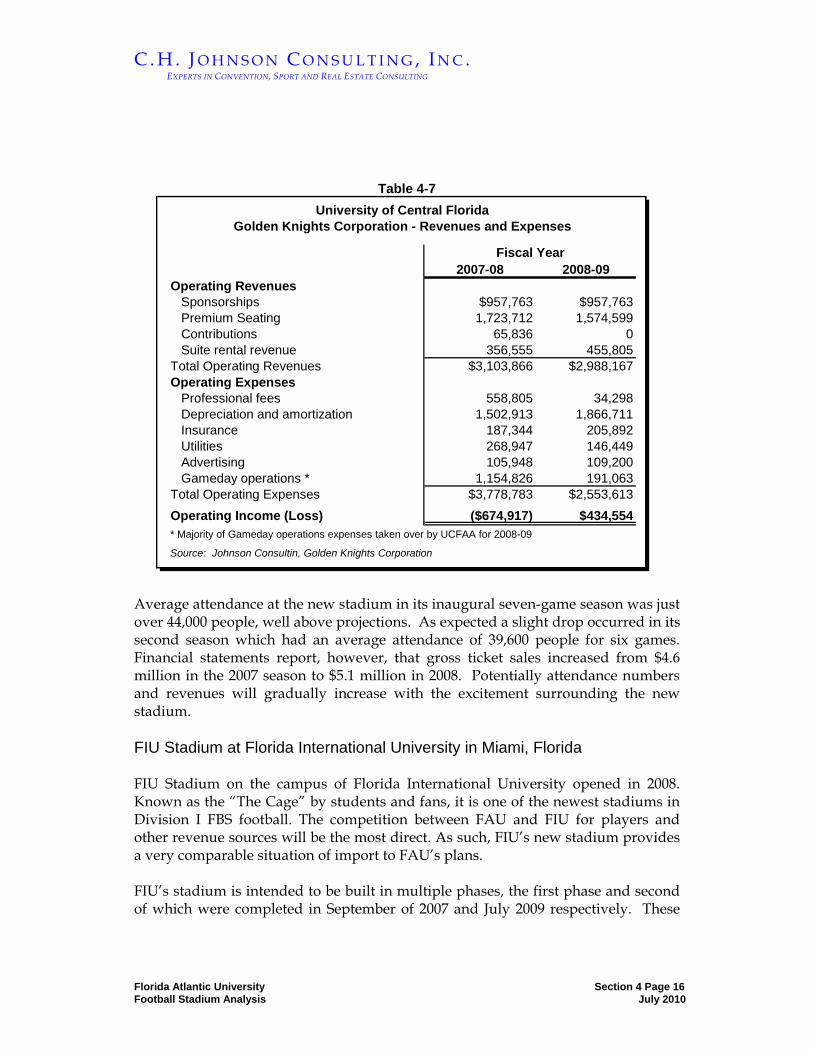
C . H . J O H N S O N C O N S U L T I N G , I N C . EXPERTS IN CONVENTION, SPORT AND REAL ESTATE CONSULTING
Florida Atlantic University Section 4 Page 16 Football Stadium Analysis July 2010
Table 4-7
2007-08 2008-09Operating Revenues Sponsorships $957,763 $957,763 Premium Seating 1,723,712 1,574,599 Contributions 65,836 0 Suite rental revenue 356,555 455,805Total Operating Revenues $3,103,866 $2,988,167Operating Expenses Professional fees 558,805 34,298 Depreciation and amortization 1,502,913 1,866,711 Insurance 187,344 205,892 Utilities 268,947 146,449 Advertising 105,948 109,200 Gameday operations * 1,154,826 191,063Total Operating Expenses $3,778,783 $2,553,613Operating Income (Loss) ($674,917) $434,554* Majority of Gameday operations expenses taken over by UCFAA for 2008-09
Source: Johnson Consultin, Golden Knights Corporation
Fiscal Year
Golden Knights Corporation - Revenues and ExpensesUniversity of Central Florida
Average attendance at the new stadium in its inaugural seven-game season was just over 44,000 people, well above projections. As expected a slight drop occurred in its second season which had an average attendance of 39,600 people for six games. Financial statements report, however, that gross ticket sales increased from $4.6 million in the 2007 season to $5.1 million in 2008. Potentially attendance numbers and revenues will gradually increase with the excitement surrounding the new stadium. FIU Stadium at Florida International University in Miami, Florida FIU Stadium on the campus of Florida International University opened in 2008. Known as the “The Cage” by students and fans, it is one of the newest stadiums in Division I FBS football. The competition between FAU and FIU for players and other revenue sources will be the most direct. As such, FIU’s new stadium provides a very comparable situation of import to FAU’s plans. FIU’s stadium is intended to be built in multiple phases, the first phase and second of which were completed in September of 2007 and July 2009 respectively. These

C . H . J O H N S O N C O N S U L T I N G , I N C . EXPERTS IN CONVENTION, SPORT AND REAL ESTATE CONSULTING
Florida Atlantic University Section 4 Page 17 Football Stadium Analysis July 2010
two phases included a major expansion to 20,000 seats, including 1,400 club seats and 19 luxury suites. Construction has also been completed on a 50,000 square foot football fieldhouse. Future plans call for an expansion of seating capacity of 45,000 seats, including additional suites and club seating as well as a 100,000 square foot student services complex. Below in Table 4-8 are the projected operation revenues and expenses for the 18,000 seat stadium that Johnson Consulting completed in 2006.
Table 4-8
Operating Revenue Projected FY 2008Ticket Sales $505,000Special Events 68,000Luxury Suites/Club seats 908,000Advertising/Sponsorships 225,000Naming Rights 651,000Concessions 190,000Parking 62,000Other 37,000
Total Operaing Revenues $2,646,000Operating Expenses
Staff $63,000General and Administrative 75,000Utilities 120,000Repairs and Maintenance 240,000Advertising 38,000Game Day 177,000
Total Operating Expenses $713,000Net Operating Income $1,933,000
Source: Johnson Consulting, FIU
FIU Stadium Projected Operating Proforma
As the pro forma shows, FIU is projected to have a net operating income of just under $2 million dollars in the FY 2008. All revenues generated from ticket sales and premium seating will go directly to the University. However, one difference between UCF and FIU is that FIU’s stadium in Miami will also host a number of extra events in the form of high school football games, which will generate an additional $70,000 annually. The 1,400 available club seats are sold at an annual cost of $1,000 per pair and require a three-year commitment. The breakdown of this price includes an $800 fair market value of the tickets and club access as well as a $200 charitable contribution to the university. Luxury suites priced at $28,000 per suite for 19 suites would generate $375,000 in annual revenues. Revenues generated
C . H . J O H N S O N C O N S U L T I N G , I N C . EXPERTS IN CONVENTION, SPORT AND REAL ESTATE CONSULTING
Florida Atlantic University Section 4 Page 18 Football Stadium Analysis July 2010
will go towards paying back the debt service created by the bonds sold to fund the new stadium. FIU will have six home football games each season, approximately 30 high school games and up to two entertainment events.. Also, in 2009, the professional soccer team, Miami FC, shared its home games between FIU Stadium and Lockhart Stadium in Fort Lauderdale. Mean Green Stadium at University of North Texas in Denton, Texas Fellow Sun Belt Conference member, University of North Texas (UNT) will replace its existing Fouts Field with the new Mean Green Stadium. Construction on the $78 million stadium is anticipated to begin in January of 2010, and the facility is scheduled to open in 2011. A ceremonial groundbreaking took place in November of 2009. The stadium is expected to be the centerpiece of the “Mean Green Village” which will take over the site of a failing golf course across I-35, opposite the UNT campus. The new stadium will reflect the change and growth of the university from just 5,000 in 1952 when Fouts Field was opened to almost 35,000 students today. The 30,000-seat facility will have the ability to be expanded to 50,000 seats. There will be 750 club level seats and another 400 seats in its 20 suites. Pricing of the suites and club seats is still being finalized. In addition to private donations, potential corporate sponsorships, and suite and club seat sales, the stadium will be financed via a recently approved hike in student fees which will go into effect after the stadium is completed. Texas state law prohibits funding more than 50 percent of the development costs through student fees. The new $10 per credit hour fee replaces a $3 per credit hour fee for a net increase of $7 per credit hour.
Orlando MSA and Miami MSA Arena, Venues and Stadium Comparison
FAU compares its expected stadium to that of UCF in Orlando. To understand this comparison, Johnson Consulting compiled population and venue-specific statistics for the Orlando-Kissimmee CBSA (Core Based Statistical Area) and the Miami-Fort Lauderdale CBSA. The number of business establishments is also compared to gauge the potential level of corporate sponsorship. Both the Miami and Orlando markets have had significant changes in their sports venue inventories. A number of venues have recently opened or are currently under construction, while others, such as the Orange Bowl, have recently been demolished. Table 4-9 below represents the sports venue inventory as it will be in 2012 when the new “Miami Marlins” Stadium comes on line. The information presented in the table does not include the new FAU Stadium, but does contain Lockhart Stadium.

C . H . J O H N S O N C O N S U L T I N G , I N C . EXPERTS IN CONVENTION, SPORT AND REAL ESTATE CONSULTING
Florida Atlantic University Section 4 Page 19 Football Stadium Analysis July 2010
Table 4-9
Orlando - Kissimmee
Miami - Fort Lauderdale Variance
CBSA Population - 2009 2,124,270 5,305,182 3,180,912Number of Business Establishments 91,033 264,154 173,121
Total Number of Venues 6 9 3Total Seat Inventory 160,000 216,600 56,600Population per seat 13.3 24.5 11.2Total Luxury Suites 78 457 379Average Venue Size (seats) 26,667 24,067 (2,600)
Source: Johnson Consulting, Demographics Now, Facility/City websites
Florida - Venues, Arenas, Stadium Analysis
Observations regarding the comparison between Miami and Orlando metro statistical areas in relation to the venue analysis are highlighted below:
Comparing populations is crucial in determining the size of the market which can be penetrated for season tickets and premium seating sales opportunities. With over three million more people in the Miami CBSA than the Orlando CBSA, FAU has a much larger market to penetrate and can reach a greater number of people with information via television, radio, and mass mailings about its athletic offerings.
Miami has three more sports venues and a higher total seat inventory than Orlando, however, due to its larger population, Miami has a much more favorable population to seat ratio. The 25.4 persons per seat in Miami suggests some room for growth before it reaches the more saturated 13.3 person per seat ration found in Orlando.
The total number businesses in an area is a good indicator of the potential market for premium seating, naming opportunities, and advertising. In Orlando with its emphasis on the hospitality and tourism industries, there are a significantly fewer number of businesses. In Miami, with it broader based economy, there is a much greater opportunities for the sale of naming rights, advertising and premium seating total as well as greater demand for such opportunities, which generally equates to higher prices.
In analyzing total luxury suites each market has a different dynamic. Miami with a much larger population base has more luxury suites available in their respective facilities. By 2012 Miami’s facilities will have 457 suites, although this number is skewed because Dolphins’ Stadium (currently known as Land Shark stadium in a temporary naming agreement with Anheuser Busch) has 240 suites. The suite inventory is further increased due to the
C . H . J O H N S O N C O N S U L T I N G , I N C . EXPERTS IN CONVENTION, SPORT AND REAL ESTATE CONSULTING
Florida Atlantic University Section 4 Page 20 Football Stadium Analysis July 2010
separate arena venues for the city’s NBA and NHL teams. Together the American Airlines Arena (Miami Heat) and the Bank Atlantic Center (Florida Panthers), add an additional 148 suites to the market.
With the 2008 demolition of the 75,000-seat Orange Bowl and replacement with the 37,000-seat Marlins Stadium, Miami’s average venue size has been significantly reduced. Despite the fact that Orlando does not have an NFL team, the 2007 introduction of UCF’s Bright House Network Stadium has caused Orlando’s average venue size to become greater than that in Miami. This suggests the market potential of a larger, stadium venue in the Miami market.
Conclusions
Football stadiums are traditionally limited in the number and types of events they can host due to either lack of events or restrictions of the facility. The building of a new collegiate stadium is generally undertaken to fill a perceived gap in a program by the limitations of the existing facility, as outlined in each of the comparable facilities. By building a stadium on campus, FAU will be able to spark additional interest in its emerging football program. By having its own designated stadium, FAU will be able to further formulate its own identity in a stadium it can truly call home. In addition, with the offering of increased amenities, such as luxury suites, FAU will be able to draw further corporate and sponsor dollars by offering the types of facilities that these groups expect and often demand, particularly since the total business establishments in the CBSA is far greater than most in the state.
Football, like auto racing, defies demographics. Small cities, like Lincoln, Nebraska, Tallahassee, and Gainesville each attract full stadiums. It becomes the event for the community during college weekends. Boca Raton and Fort Lauderdale have other entertainment options and FAU’s program is in its infancy. If a higher quality stadium is added at FAU and the program builds as expected, we anticipate a significant level of attendance growth over a ten year period, but have used a conservative projection for this analysis.

V. FACILITY DEMAND AND FINANCIAL PROJECTION

C . H . J O H N S O N C O N S U L T I N G , I N C . EXPERTS IN CONVENTION, SPORT AND REAL ESTATE CONSULTING
Florida Atlantic University Section 5 Page 1 Football Stadium Analysis July 2010
FACILITY DEMAND AND FINANCIAL PROJECTION
Johnson Consulting projected the demand for the football stadium and also developed financial projections for the stadium over a 10 year period. The projection is based on comparable facilities’ operations, the evolving characteristics of the university and the expected surrounding development, and trends that are likely to affect the facility in the future. It is assumed that the stadium will have a permanent seating capacity of approximately 30,000 people. The projection also assumes that the stadium will open in the fall of 2011. The first year of the projection is FY 2011-12, which will accommodate an entire college football schedule. (Fiscal Year runs from July 1 through June 30).
Confirmation of Facility Offerings
In order to support our projections that appear later in this section, Johnson Consulting first confirmed the potential size of the football stadium on the campus of FAU, including number of seats, luxury suites and boxes, and club seats by comparing the building program as it currently exists, to other Sun Belt Conference venues as well as the comparable examples discussed in Section 4.
Working with the University, we have assumed the stadium will have an overall capacity of approximately 30,000 seats, including leasable and university, utilized luxury suites, loge boxes, premium club seats, priority club seats. As stated earlier in this report, the stadium will be financed through a university Direct Support Organization (DSO) and operated through the University.
Based on the building program provided by FAU, the new stadium on the campus of FAU is proposed to consist of the following elements:
30,000 total seats
20 leasable luxury suite with capacity of 23 occupants each
4 non-leasable, university-utilized luxury suites with capacity of either 46 or 23 occupants each
16 loge boxes with capacity of 6 occupants each
1,076 premium club seats with a club level and traditional seating
4,448 priority seats with access to a covered concourse
In order to compare the building program at FAU with other collegiate stadium developments, Table 5-1 displays the capacity, average attendance, number of luxury suites, number of club seats, and the occupancy rates for the premium seats for stadiums in the newly aligned Sun Belt Conference.
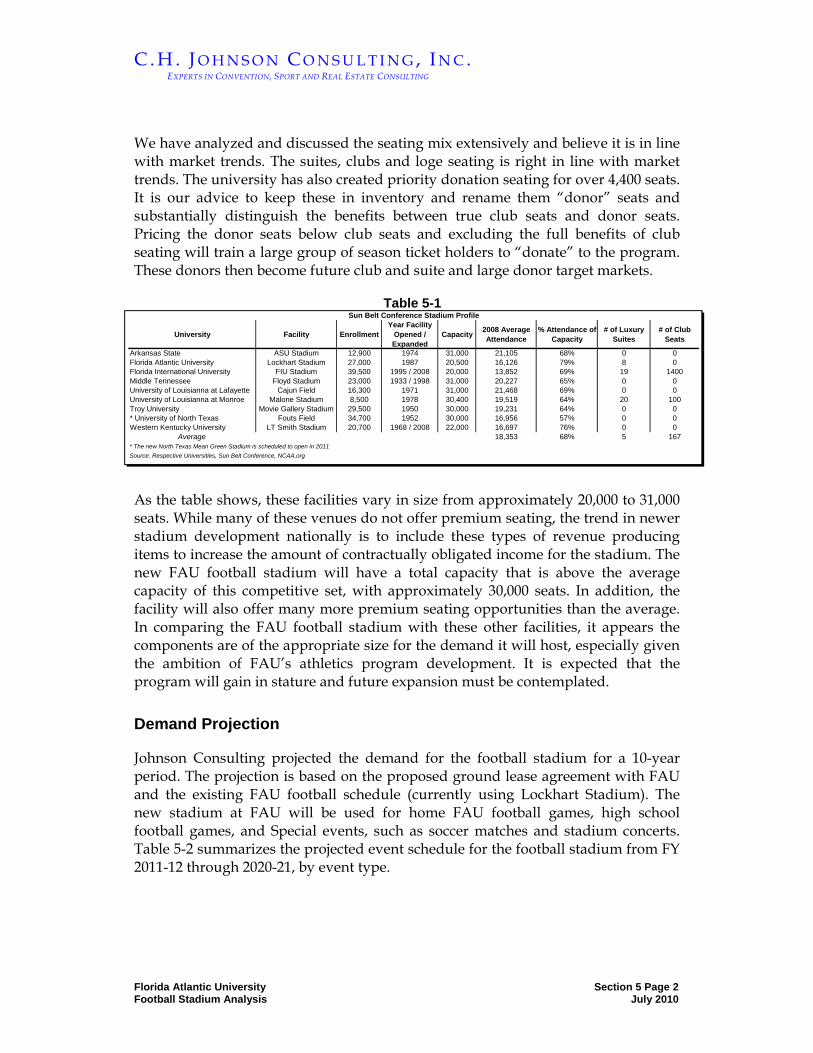
C . H . J O H N S O N C O N S U L T I N G , I N C . EXPERTS IN CONVENTION, SPORT AND REAL ESTATE CONSULTING
Florida Atlantic University Section 5 Page 2 Football Stadium Analysis July 2010
We have analyzed and discussed the seating mix extensively and believe it is in line with market trends. The suites, clubs and loge seating is right in line with market trends. The university has also created priority donation seating for over 4,400 seats. It is our advice to keep these in inventory and rename them “donor” seats and substantially distinguish the benefits between true club seats and donor seats. Pricing the donor seats below club seats and excluding the full benefits of club seating will train a large group of season ticket holders to “donate” to the program. These donors then become future club and suite and large donor target markets.
Table 5-1
University Facility EnrollmentYear Facility
Opened / Expanded
Capacity 2008 Average Attendance
% Attendance of Capacity
# of Luxury Suites
# of Club Seats
Arkansas State ASU Stadium 12,900 1974 31,000 21,105 68% 0 0Florida Atlantic University Lockhart Stadium 27,000 1987 20,500 16,126 79% 8 0Florida International University FIU Stadium 39,500 1995 / 2008 20,000 13,852 69% 19 1400Middle Tennessee Floyd Stadium 23,000 1933 / 1998 31,000 20,227 65% 0 0University of Louisianna at Lafayette Cajun Field 16,300 1971 31,000 21,468 69% 0 0University of Louisianna at Monroe Malone Stadium 8,500 1978 30,400 19,519 64% 20 100Troy University Movie Gallery Stadium 29,500 1950 30,000 19,231 64% 0 0* University of North Texas Fouts Field 34,700 1952 30,000 16,956 57% 0 0Western Kentucky University LT Smith Stadium 20,700 1968 / 2008 22,000 16,697 76% 0 0
Average 18,353 68% 5 167* The new North Texas Mean Green Stadium is scheduled to open in 2011Source: Respective Universities, Sun Belt Conference, NCAA.org
Sun Belt Conference Stadium Profile
As the table shows, these facilities vary in size from approximately 20,000 to 31,000 seats. While many of these venues do not offer premium seating, the trend in newer stadium development nationally is to include these types of revenue producing items to increase the amount of contractually obligated income for the stadium. The new FAU football stadium will have a total capacity that is above the average capacity of this competitive set, with approximately 30,000 seats. In addition, the facility will also offer many more premium seating opportunities than the average. In comparing the FAU football stadium with these other facilities, it appears the components are of the appropriate size for the demand it will host, especially given the ambition of FAU’s athletics program development. It is expected that the program will gain in stature and future expansion must be contemplated.
Demand Projection
Johnson Consulting projected the demand for the football stadium for a 10-year period. The projection is based on the proposed ground lease agreement with FAU and the existing FAU football schedule (currently using Lockhart Stadium). The new stadium at FAU will be used for home FAU football games, high school football games, and Special events, such as soccer matches and stadium concerts. Table 5-2 summarizes the projected event schedule for the football stadium from FY 2011-12 through 2020-21, by event type.

C . H . J O H N S O N C O N S U L T I N G , I N C . EXPERTS IN CONVENTION, SPORT AND REAL ESTATE CONSULTING
Florida Atlantic University Section 5 Page 3 Football Stadium Analysis July 2010
Table 5-2
Projected Schedule of Events by Category and Year
'11-12* '12-13 '13-14 '14-15 '15-16 '16-17 '17-18 '18-19 '19-20 '20-21FAU Football Games 6 6 6 6 6 6 6 6 6 6High School Football Games 8 8 8 8 8 8 8 8 8 8Special Event 1 1 1 1 1 1 1 1 1 1
Total 15 15 15 15 15 15 15 15 15 15
*Fiscal Year runs from July 1 through June 30.The new Football Stadium is expected to begin operation in the Fall of 2011.Source: Johnson Consulting
FAU Football Stadium
We anticipate that once the football stadium opens in the fall of 2011, the facility will operate at maximum efficiency. For this projection, we assume that the football stadium will host six FAU football games, eight high school football games, and one special event, such as a soccer exhibition game or a stadium concert.
Table 5-3 summarizes the projected attendance at the football stadium for a ten-year period.
Table 5-3
Projected Total Attendance by Category and Year
'011-012* '012-013 '013-14 '014-15 '15-16 '16-17 '17-18 '18-19 '19-20 '20-21Stabilized Year Avrg
AttendanceFAU Football Games 120,900 119,300 121,800 124,200 126,600 126,600 126,600 126,600 126,600 126,600 21,100High School Football Games 40,000 40,800 41,600 42,400 43,200 43,200 43,200 43,200 43,200 43,200 5,400Special Event 15,000 15,300 15,600 15,900 16,200 16,200 16,200 16,200 16,200 16,200 16,200
Total 175,900 175,400 179,000 182,500 186,000 186,000 186,000 186,000 186,000 186,000 12,400
*Fiscal Year runs from July 1 through June 30.The new Football Stadium is expected to begin operation in the Fall of 2011.Source: Johnson Consulting
FAU Football Stadium
Total year one attendance at the football stadium is projected to be approximately 176,000. Recognizing a first year boost, attendance will fall slightly in year two because of the waning of the novelty effect. It will slowly rebuild to 156,600 in 2015-2016 (stabilized year). Average attendance for a FAU football event is described in more detail below.
FAU Football – is currently held at Lockhart Stadium, but will move to the FAU Football Stadium once it opens in the fall of 2011 (FY 2011-12). The new stadium is expected to host six football games each season, 8 high school games, and one special event. Based on the lure of a new stadium, an improving football program, the average attendance from the Sunbelt Conference and comparable universities, average attendance is projected to reach 21,100 per game in 2015-16 (stabilized year). This is a conservative estimate of attendance, especially as the football program continues to grow its national reputation. Current ambitions of moving into a more prominent athletic conference will also raise attendance in the subsequent years.
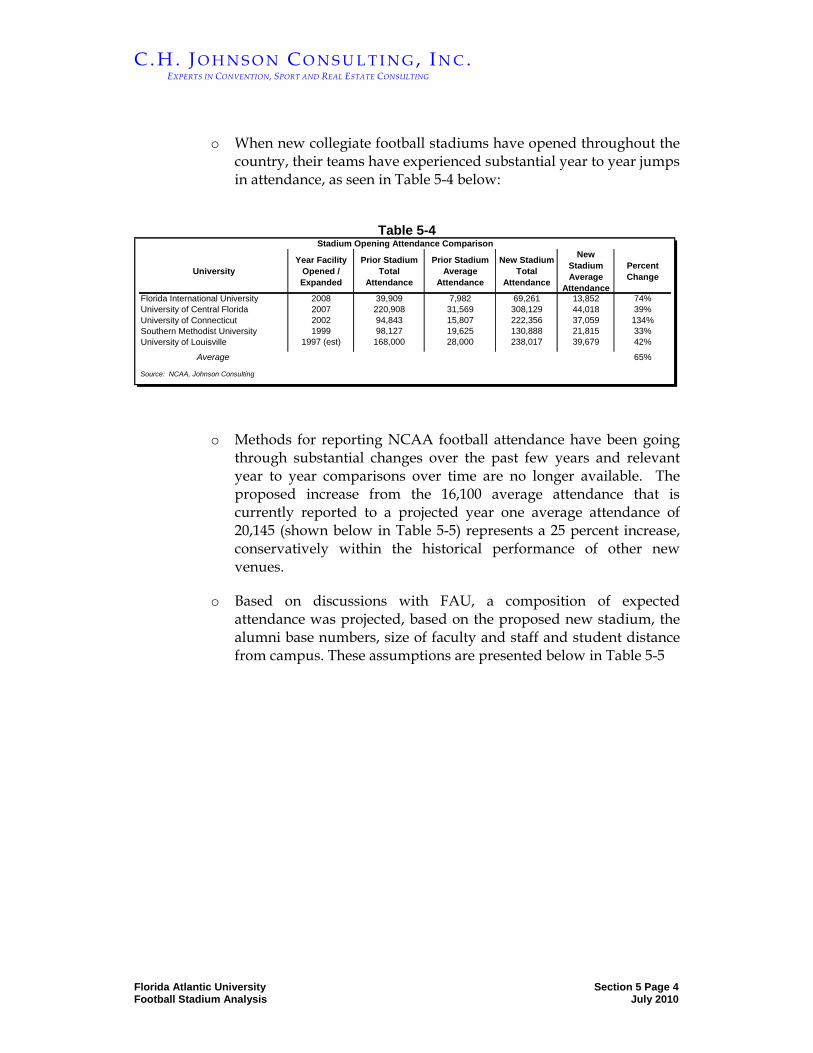
C . H . J O H N S O N C O N S U L T I N G , I N C . EXPERTS IN CONVENTION, SPORT AND REAL ESTATE CONSULTING
Florida Atlantic University Section 5 Page 4 Football Stadium Analysis July 2010
o When new collegiate football stadiums have opened throughout the country, their teams have experienced substantial year to year jumps in attendance, as seen in Table 5-4 below:
Table 5-4
UniversityYear Facility
Opened / Expanded
Prior Stadium Total
Attendance
Prior Stadium Average
Attendance
New Stadium Total
Attendance
New Stadium Average
Attendance
Percent Change
Florida International University 2008 39,909 7,982 69,261 13,852 74%University of Central Florida 2007 220,908 31,569 308,129 44,018 39%University of Connecticut 2002 94,843 15,807 222,356 37,059 134%Southern Methodist University 1999 98,127 19,625 130,888 21,815 33%University of Louisville 1997 (est) 168,000 28,000 238,017 39,679 42%
Average 65%
Source: NCAA, Johnson Consulting
Stadium Opening Attendance Comparison
o Methods for reporting NCAA football attendance have been going through substantial changes over the past few years and relevant year to year comparisons over time are no longer available. The proposed increase from the 16,100 average attendance that is currently reported to a projected year one average attendance of 20,145 (shown below in Table 5-5) represents a 25 percent increase, conservatively within the historical performance of other new venues.
o Based on discussions with FAU, a composition of expected attendance was projected, based on the proposed new stadium, the alumni base numbers, size of faculty and staff and student distance from campus. These assumptions are presented below in Table 5-5
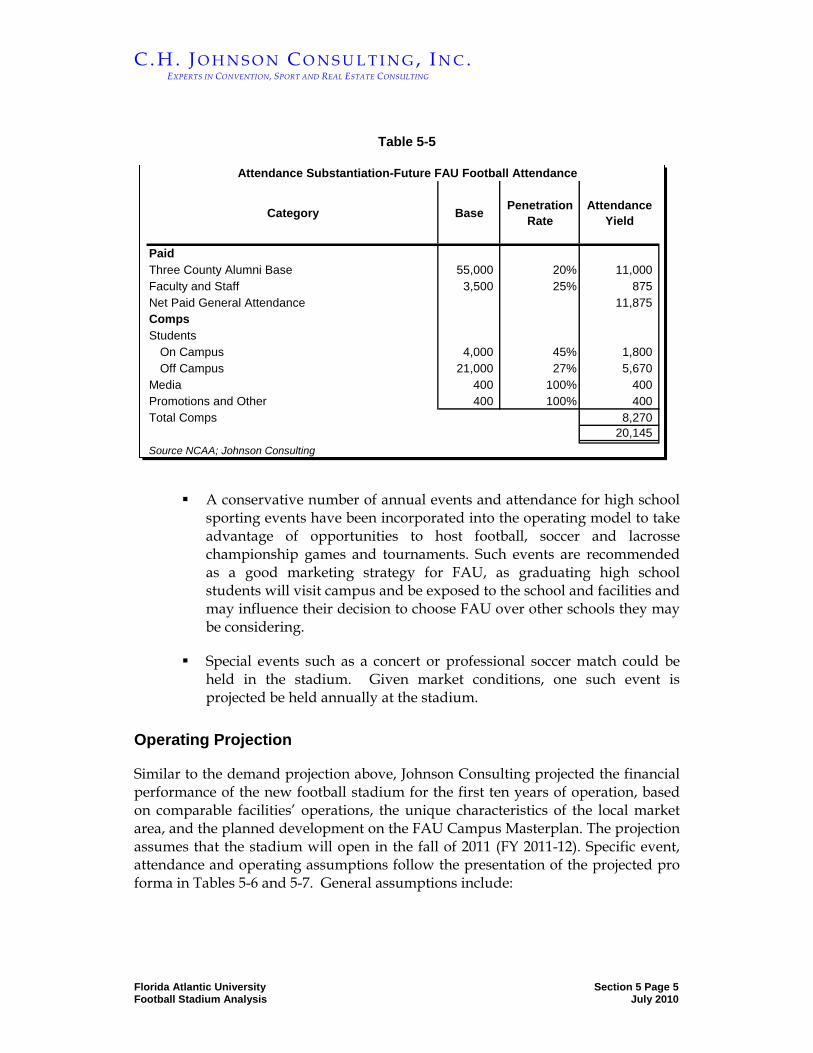
C . H . J O H N S O N C O N S U L T I N G , I N C . EXPERTS IN CONVENTION, SPORT AND REAL ESTATE CONSULTING
Florida Atlantic University Section 5 Page 5 Football Stadium Analysis July 2010
Table 5-5
Category Base Penetration Rate
Attendance Yield
PaidThree County Alumni Base 55,000 20% 11,000Faculty and Staff 3,500 25% 875Net Paid General Attendance 11,875CompsStudents
On Campus 4,000 45% 1,800Off Campus 21,000 27% 5,670
Media 400 100% 400Promotions and Other 400 100% 400Total Comps 8,270
20,145Source NCAA; Johnson Consulting
Attendance Substantiation-Future FAU Football Attendance
A conservative number of annual events and attendance for high school sporting events have been incorporated into the operating model to take advantage of opportunities to host football, soccer and lacrosse championship games and tournaments. Such events are recommended as a good marketing strategy for FAU, as graduating high school students will visit campus and be exposed to the school and facilities and may influence their decision to choose FAU over other schools they may be considering.
Special events such as a concert or professional soccer match could be held in the stadium. Given market conditions, one such event is projected be held annually at the stadium.
Operating Projection
Similar to the demand projection above, Johnson Consulting projected the financial performance of the new football stadium for the first ten years of operation, based on comparable facilities’ operations, the unique characteristics of the local market area, and the planned development on the FAU Campus Masterplan. The projection assumes that the stadium will open in the fall of 2011 (FY 2011-12). Specific event, attendance and operating assumptions follow the presentation of the projected pro forma in Tables 5-6 and 5-7. General assumptions include:

C . H . J O H N S O N C O N S U L T I N G , I N C . EXPERTS IN CONVENTION, SPORT AND REAL ESTATE CONSULTING
Florida Atlantic University Section 5 Page 6 Football Stadium Analysis July 2010
Revenues include all revenues of the facility that can be used for operations and debt service.
Expenses are categorized into two groups: 1) Fixed operating expenses, which are incurred regardless of the level of activity at the facility, and 2) Variable operating expenses, which are expenses related directly to the operation and demand of the facility that vary depending on the volume of activity. Some expenses have both a fixed and variable component.
As the football stadium will be used for a projected 15 events, 6 of which are FAU football games, a portion of the expenses could be the responsibility of the broader Athletics Department. Operating stadiums through other departments is typical and results in a fairly low operating structure for on campus stadiums. Parking and maintenance could be handled by existing departments. Athletics already has sales and administrative overhead within its organization and Utilities, Insurance and similar expenses may be borne elsewhere. Since such policy decisions have not been made by FAU, the projection includes a reasonable estimate of operating costs borne by the stadium. It is estimated that between services being provided by Athletics and other departments, a cost efficient operation can be achieved.
The stadium’s projection uses inflated dollars and accrual-based accounting, wherein revenues are recognized when they are earned and expenses are recognized when they are incurred.
All revenues and expenses are adjusted for inflation at a 2.5 percent annual rate, unless noted elsewhere in the projection.
Table 5-6 shows the projected operating statement for the first ten full years of operation. Current football games as Lockhart stadium yield revenue from ticket sales, concessions and parking. Table 5-7 nets out the existing revenue streams for these three line items and shows the incremental revenue from the new, on-campus stadium.

C . H . J O H N S O N C O N S U L T I N G , I N C . EXPERTS IN CONVENTION, SPORT AND REAL ESTATE CONSULTING
Florida Atlantic University Section 5 Page 7 Football Stadium Analysis July 2010
Table 5-6
Fiscal Year*
Ref '11-12* '12-13 '13-14 '14-15 '15-16 '16-17 '17-18 '18-19 '19-20 '20-21Operating Revenue
1 Ticket Sales - FAU Football $1,871 $1,893 $1,981 $2,071 $2,164 $2,218 $2,273 $2,330 $2,388 $2,4482 Ticket Sales - Other Events $250 $258 $265 $273 $281 $290 $299 $307 $317 $3263 Net Concessions 377 384 402 420 439 449 461 472 484 4964 Net Catering 43 44 45 46 47 48 50 51 52 545 Net Novelties 40 41 42 44 46 47 49 50 51 526 Net Parking 318 323 328 349 355 361 385 388 392 4147 Premium Seating, less 7% fulfillment 995 1,010 1,024 1,039 1,054 1,135 1,151 1,167 1,184 1,2028 Priority Seating Donation 757 757 757 757 757 884 884 884 884 8849 Advertising and Sponsorship 336 353 362 371 380 389 399 409 419 43010 Naming Rights less 7% fulfillment 400 420 431 441 452 464 475 487 499 51211 Facility Fee/ Rebates 0 0 0 0 0 0 0 0 0 012 Other Revenue 98 98 99 100 101 113 114 114 115 11613 Annual Capital Gifts 250 250 250 250 250 250 250 250 250 25014 Total Revenue $5,736 $5,831 $5,987 $6,161 $6,326 $6,647 $6,790 $6,909 $7,035 $7,183
Operating ExpenseFixed
15 Salary - Permanent Staff $100 $103 $105 $108 $110 $113 $116 $119 $122 $12516 Benefits - Permanent Staff 50 51 53 54 55 57 58 59 61 6217 General and Administrative 100 103 105 108 110 113 116 119 122 12518 Utilities 175 179 184 188 193 198 203 208 213 21919 Repairs and Maintenance 175 179 184 236 241 247 254 260 267 27320 Insurance 55 56 58 59 61 62 64 65 67 6921 Advertising 50 53 54 56 57 58 60 61 63 6522 Misc. 25 26 26 27 28 28 29 30 30 31
Variable23 Gameday Expenses 444 454 475 496 519 532 545 558 572 58724 Total Expenses $1,174 $1,204 $1,244 $1,332 $1,373 $1,408 $1,445 $1,479 $1,518 $1,55625 Net Operating Income (Deficit) $4,562 $4,627 $4,742 $4,829 $4,953 $5,239 $5,345 $5,430 $5,517 $5,62726 Deposit to Maintenance Reserve Account $344 $350 $359 $370 $380 $399 $407 $415 $422 $43127 Net Operating Income (Deficit) Avail. for Debt $4,218 $4,277 $4,383 $4,459 $4,573 $4,840 $4,937 $5,015 $5,095 $5,196
Other Non Operating Revenue28 Away Game & Conf Guarantees $1,000 $1,030 $1,061 $1,093 $1,126 $1,159 $1,194 $1,230 $1,267 $1,30529 Student Fees (limit of 5%) 467 482 496 511 526 542 558 575 592 61030 Other Guarantees 250 258 265 273 281 290 299 307 317 32631 Total Other Sources $1,717 $1,769 $1,822 $1,877 $1,933 $1,991 $2,051 $2,112 $2,176 $2,241
32 Net Income Avail. For Reserves and Debt $5,935 $6,046 $6,205 $6,336 $6,506 $6,831 $6,988 $7,128 $7,270 $7,43733 Deposit to Restricted Reserves 0 0 0 0 0 0 0 0 0 034 Income for Debt Coverage $5,935 $6,046 $6,205 $6,336 $6,506 $6,831 $6,988 $7,128 $7,270 $7,43735 Debt Service $4,095 $4,091 $4,091 $4,095 $4,091 $4,094 $4,094 $4,091 $4,09536 Coverage Ratio including Other Non-operating Rev NA 148% 152% 155% 159% 167% 171% 174% 178% 182%
*Fiscal Year runs from July 1 through June 30The new Football Stadium is expected to begin operation in the Fall of 2011Source: Johnson Consulting
FAU Football Stadium Financial Projection ($000's, Inflated)
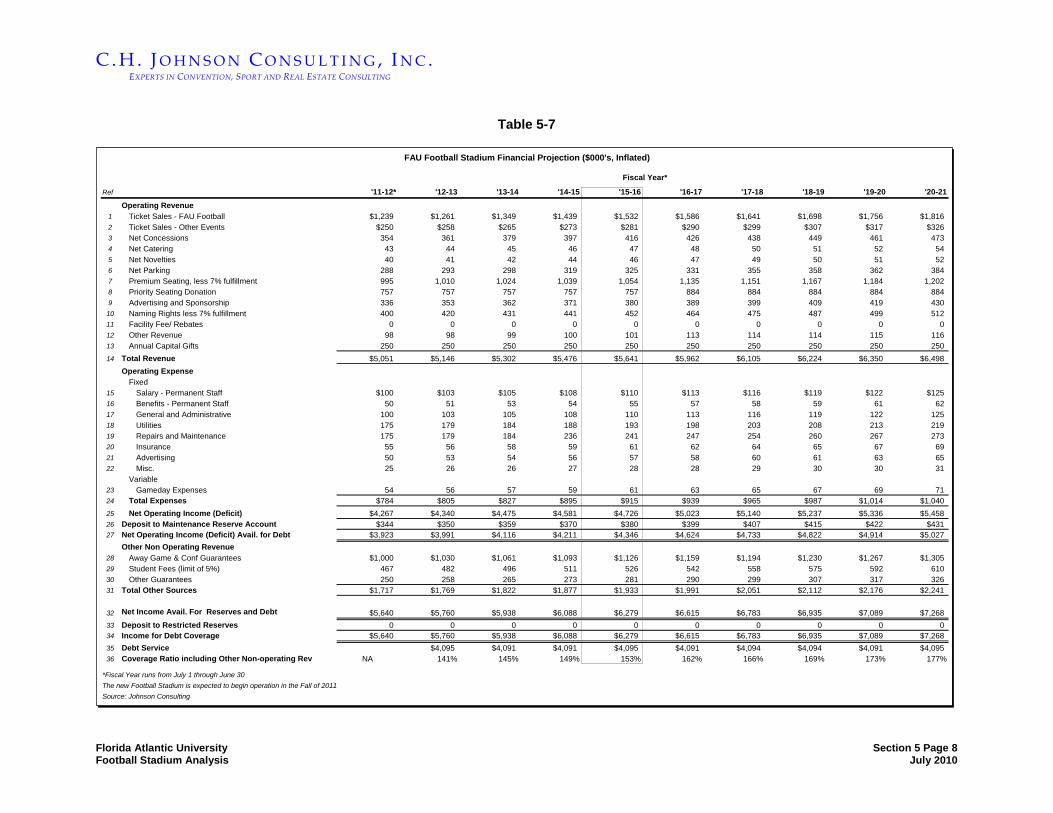
C . H . J O H N S O N C O N S U L T I N G , I N C . EXPERTS IN CONVENTION, SPORT AND REAL ESTATE CONSULTING
Florida Atlantic University Section 5 Page 8 Football Stadium Analysis July 2010
Table 5-7
Fiscal Year*
Ref '11-12* '12-13 '13-14 '14-15 '15-16 '16-17 '17-18 '18-19 '19-20 '20-21Operating Revenue
1 Ticket Sales - FAU Football $1,239 $1,261 $1,349 $1,439 $1,532 $1,586 $1,641 $1,698 $1,756 $1,8162 Ticket Sales - Other Events $250 $258 $265 $273 $281 $290 $299 $307 $317 $3263 Net Concessions 354 361 379 397 416 426 438 449 461 4734 Net Catering 43 44 45 46 47 48 50 51 52 545 Net Novelties 40 41 42 44 46 47 49 50 51 526 Net Parking 288 293 298 319 325 331 355 358 362 3847 Premium Seating, less 7% fulfillment 995 1,010 1,024 1,039 1,054 1,135 1,151 1,167 1,184 1,2028 Priority Seating Donation 757 757 757 757 757 884 884 884 884 8849 Advertising and Sponsorship 336 353 362 371 380 389 399 409 419 43010 Naming Rights less 7% fulfillment 400 420 431 441 452 464 475 487 499 51211 Facility Fee/ Rebates 0 0 0 0 0 0 0 0 0 012 Other Revenue 98 98 99 100 101 113 114 114 115 11613 Annual Capital Gifts 250 250 250 250 250 250 250 250 250 25014 Total Revenue $5,051 $5,146 $5,302 $5,476 $5,641 $5,962 $6,105 $6,224 $6,350 $6,498
Operating ExpenseFixed
15 Salary - Permanent Staff $100 $103 $105 $108 $110 $113 $116 $119 $122 $12516 Benefits - Permanent Staff 50 51 53 54 55 57 58 59 61 6217 General and Administrative 100 103 105 108 110 113 116 119 122 12518 Utilities 175 179 184 188 193 198 203 208 213 21919 Repairs and Maintenance 175 179 184 236 241 247 254 260 267 27320 Insurance 55 56 58 59 61 62 64 65 67 6921 Advertising 50 53 54 56 57 58 60 61 63 6522 Misc. 25 26 26 27 28 28 29 30 30 31
Variable23 Gameday Expenses 54 56 57 59 61 63 65 67 69 7124 Total Expenses $784 $805 $827 $895 $915 $939 $965 $987 $1,014 $1,04025 Net Operating Income (Deficit) $4,267 $4,340 $4,475 $4,581 $4,726 $5,023 $5,140 $5,237 $5,336 $5,45826 Deposit to Maintenance Reserve Account $344 $350 $359 $370 $380 $399 $407 $415 $422 $43127 Net Operating Income (Deficit) Avail. for Debt $3,923 $3,991 $4,116 $4,211 $4,346 $4,624 $4,733 $4,822 $4,914 $5,027
Other Non Operating Revenue28 Away Game & Conf Guarantees $1,000 $1,030 $1,061 $1,093 $1,126 $1,159 $1,194 $1,230 $1,267 $1,30529 Student Fees (limit of 5%) 467 482 496 511 526 542 558 575 592 61030 Other Guarantees 250 258 265 273 281 290 299 307 317 32631 Total Other Sources $1,717 $1,769 $1,822 $1,877 $1,933 $1,991 $2,051 $2,112 $2,176 $2,241
32 Net Income Avail. For Reserves and Debt $5,640 $5,760 $5,938 $6,088 $6,279 $6,615 $6,783 $6,935 $7,089 $7,26833 Deposit to Restricted Reserves 0 0 0 0 0 0 0 0 0 034 Income for Debt Coverage $5,640 $5,760 $5,938 $6,088 $6,279 $6,615 $6,783 $6,935 $7,089 $7,26835 Debt Service $4,095 $4,091 $4,091 $4,095 $4,091 $4,094 $4,094 $4,091 $4,09536 Coverage Ratio including Other Non-operating Rev NA 141% 145% 149% 153% 162% 166% 169% 173% 177%
*Fiscal Year runs from July 1 through June 30The new Football Stadium is expected to begin operation in the Fall of 2011Source: Johnson Consulting
FAU Football Stadium Financial Projection ($000's, Inflated)

C . H . J O H N S O N C O N S U L T I N G , I N C . EXPERTS IN CONVENTION, SPORT AND REAL ESTATE CONSULTING
Florida Atlantic University Section 5 Page 9 Football Stadium Analysis July 2010
The following text describes the projections of individual line items in more detail.
Operating Revenue
Ticket Sales Revenue –The projections assume all ticket sales to FAU games will be pledged to the stadium project fund. In order to determine the total ticket sales revenue, we have taken the total paid attendance figure and multiplied it by the average ticket price. The face value of the ticket is $25 dollars, but students, media and some comp tickets are free, hence the effective average ticket price is approximately $14.75. Based on discussions with FAU officials, approximately 8,270 tickets are not paid for on a per game basis, this includes students and complimentary tickets. While not shown in the ticket revenue figure above, these people are counted in the total attendance figures for purposes of concession, novelty, catering, and parking revenue calculations.
Based on our attendance projections shown in Table 5-3, for 2011, we have assumed 11,875 paid tickets and 8,270 complimentary and student tickets.
Also included in Ticket Sales revenue are the High School football games at $5 a ticket, with a Year one average attendance of 5,000 per game. Year one special event ticket revenue is based on 10,000 attendees at a ticket price of $25.
Concessions – The operation and management of food and beverage concession sales are generally handled by one of two methods. The first method, which is the most common, allows an independent concessionaire exclusive rights to facility events with the team and/or facility taking a percentage of gross sales. The second method allows for the facility owner to own and operate the concessions. Under this method, the facility owner will capture 100 percent of concession sales but will also incur expense items related to purchase and maintenance of equipment, labor costs, and costs of goods sold. For purposes of this analysis, concessions and novelty revenue estimates assume that facility management will choose to contract for these operations with a third party concessionaire.
The current campus food service provider is Chartwells, who may also be contracted to provide food and beverage at the football stadium. The parameters for food service deals are fairly well established for football stadiums and the approach taken can follow either a percentage rent to the building or a management agreement. While a management agreement is usually preferred because it engages the contractor to a greater extent and

C . H . J O H N S O N C O N S U L T I N G , I N C . EXPERTS IN CONVENTION, SPORT AND REAL ESTATE CONSULTING
Florida Atlantic University Section 5 Page 10 Football Stadium Analysis July 2010
may yield some investment for the football stadium being managed, the net economics of a percentage fee arrangement are similar. As such, for planning purposes, we have used a percentage approach for our projections.
Crucial to the derivation of concessions revenue is the per capita sales figure. Per capita sales vary from event to event and by the seating area. For purposes of this analysis, the per capita concession spending is estimated to average $5.50 for concessions at FAU football games. This assumption is based on information provided by a major stadium food service provider and a major facility management company, as well as current operating data from the University of Louisville’s Papa Johns Cardinals Stadium and the University of Connecticut’s Rentschler Field. It is assumed that the facility will receive 35 percent of concessions revenue. It is further assumed that alcohol beer and alcohol will not be available for purchase in the general seating areas. This is consistent with other universities with on-campus venues which have made the decision to prohibit alcohol sales.
Catering – The stadium concessionaire would also typically provide luxury suite and club seat catering services to the facility and the stadium receives a percentage of gross sales from each event. It is assumed that the gross per capita spending assumptions for catering are $25.00 for FAU football games. Again, based on data provided by a major stadium food service provider and a major facility management company, and other industry data, the stadium’s commission is assumed to be 20 percent of gross catering sales, because catering has a higher cost structure than general concession services. It is assumed that beer and alcohol will be available for purchase by premium seating holders at the club level and will be served in the luxury suites and boxes.
Novelties – The projection assumes that stadium management will contract with an outside provider for novelty sales. Similar to food service deals, novelty arrangements can follow either a percentage rent to the building or a management agreement. As such, for planning purposes, we have used a percentage approach for our projections. Novelty revenue is projected to be 10 percent of gross novelty sales for all events at the facility. Similar to concessions revenue, the per capita projections are based on information provided by a major stadium concessionaire and a major facility management company. It is assumed that $3.00 in merchandise per attendee will be sold within the stadium or on a per capita basis for FAU football games. This assumption does not take into consideration the sale of merchandise at off-site locations, which may be substantial.
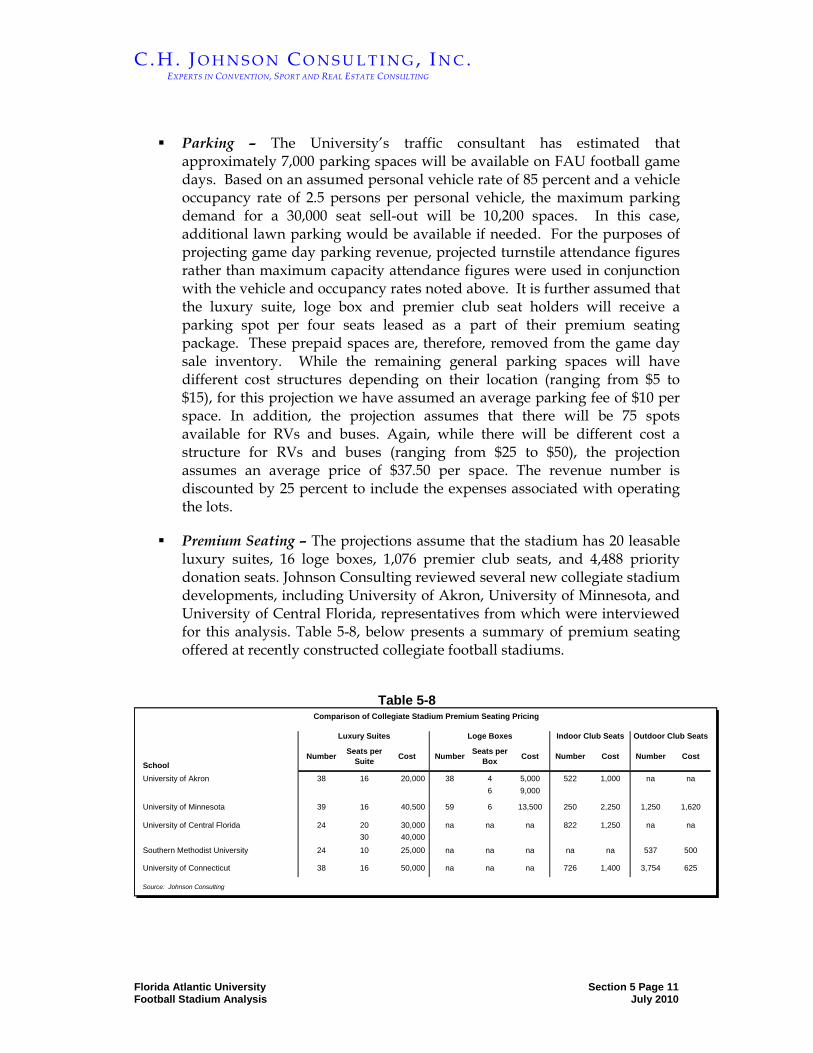
C . H . J O H N S O N C O N S U L T I N G , I N C . EXPERTS IN CONVENTION, SPORT AND REAL ESTATE CONSULTING
Florida Atlantic University Section 5 Page 11 Football Stadium Analysis July 2010
Parking – The University’s traffic consultant has estimated that approximately 7,000 parking spaces will be available on FAU football game days. Based on an assumed personal vehicle rate of 85 percent and a vehicle occupancy rate of 2.5 persons per personal vehicle, the maximum parking demand for a 30,000 seat sell-out will be 10,200 spaces. In this case, additional lawn parking would be available if needed. For the purposes of projecting game day parking revenue, projected turnstile attendance figures rather than maximum capacity attendance figures were used in conjunction with the vehicle and occupancy rates noted above. It is further assumed that the luxury suite, loge box and premier club seat holders will receive a parking spot per four seats leased as a part of their premium seating package. These prepaid spaces are, therefore, removed from the game day sale inventory. While the remaining general parking spaces will have different cost structures depending on their location (ranging from $5 to $15), for this projection we have assumed an average parking fee of $10 per space. In addition, the projection assumes that there will be 75 spots available for RVs and buses. Again, while there will be different cost a structure for RVs and buses (ranging from $25 to $50), the projection assumes an average price of $37.50 per space. The revenue number is discounted by 25 percent to include the expenses associated with operating the lots.
Premium Seating – The projections assume that the stadium has 20 leasable luxury suites, 16 loge boxes, 1,076 premier club seats, and 4,488 priority donation seats. Johnson Consulting reviewed several new collegiate stadium developments, including University of Akron, University of Minnesota, and University of Central Florida, representatives from which were interviewed for this analysis. Table 5-8, below presents a summary of premium seating offered at recently constructed collegiate football stadiums.
Table 5-8
SchoolNumber Seats per
Suite Cost Number Seats per Box Cost Number Cost Number Cost
University of Akron 38 16 20,000 38 4 5,000 522 1,000 na na6 9,000
University of Minnesota 39 16 40,500 59 6 13,500 250 2,250 1,250 1,620
University of Central Florida 24 20 30,000 na na na 822 1,250 na na30 40,000
Southern Methodist University 24 10 25,000 na na na na na 537 500
University of Connecticut 38 16 50,000 na na na 726 1,400 3,754 625
Source: Johnson Consulting
Comparison of Collegiate Stadium Premium Seating Pricing
Indoor Club Seats Outdoor Club SeatsLoge BoxesLuxury Suites

C . H . J O H N S O N C O N S U L T I N G , I N C . EXPERTS IN CONVENTION, SPORT AND REAL ESTATE CONSULTING
Florida Atlantic University Section 5 Page 12 Football Stadium Analysis July 2010
Based upon the market performance and comparative selling strengths of these comparable developments, Johnson Consulting arrived at the following assumptions for premium seating projections. One hundred percent of the 20 luxury suites will sell at an annual lease rate/donation of $25,000, exclusive of tickets. One hundred percent of loge boxes will sell at an annual lease rate/donation of $7,500, exclusive of tickets. Seventy-five percent of the 1,076 premier club seats will sell at an annual lease rate /donation of $1,000 per seat, exclusive of tickets. Seventy-five percent of the 4,488 priority donation seats will sell at an annual donation of $300 per seat, exclusive of tickets. In order to provide a conservative estimate of revenues available for debt service, Tables 5-6 and 5-7 reflect 75 percent of the premium seating revenue projection.
Furthermore, as FAU will sell the premium seating in-house, we have assumed a typical fulfillment fee of seven percent to cover the costs associated with marketing, advertising, legal, etc.
Advertising and Sponsorship – revenues are generated from the inventory of signage located within the facility, including those located in the concourses and on permanent scoreboards. Based on information obtained from the university and Front Row Marketing, advertising revenue has been guaranteed at $360,000 per year for ten years. Many advertising contracts are long-term and maintain a constant or escalating annual amount until renewal. For the purposes of this projections, are inflated each year. Again, Johnson Consulting has assumed that expenses related to the procurement of advertising revenue are seven percent of gross revenue sold. This results in a net revenue of $336,000.
Naming Rights – revenues from a corporate partner that takes title to the name of the stadium. Table 5-9 shows comparable naming rights at college football stadiums throughout the country.
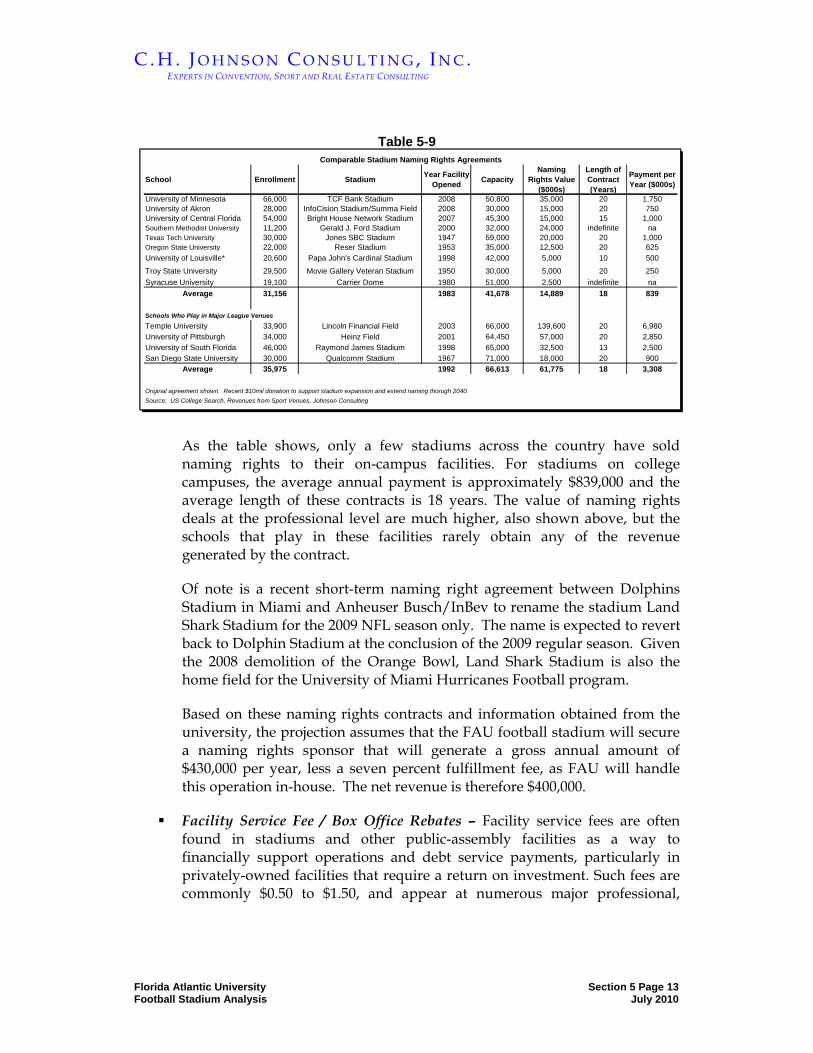
C . H . J O H N S O N C O N S U L T I N G , I N C . EXPERTS IN CONVENTION, SPORT AND REAL ESTATE CONSULTING
Florida Atlantic University Section 5 Page 13 Football Stadium Analysis July 2010
Table 5-9
School Enrollment Stadium Year Facility Opened Capacity
Naming Rights Value
($000s)
Length of Contract (Years)
Payment per Year ($000s)
University of Minnesota 66,000 TCF Bank Stadium 2008 50,800 35,000 20 1,750University of Akron 28,000 InfoCision Stadium/Summa Field 2008 30,000 15,000 20 750University of Central Florida 54,000 Bright House Network Stadium 2007 45,300 15,000 15 1,000Southern Methodist University 11,200 Gerald J. Ford Stadium 2000 32,000 24,000 indefinite naTexas Tech University 30,000 Jones SBC Stadium 1947 59,000 20,000 20 1,000Oregon State University 22,000 Reser Stadium 1953 35,000 12,500 20 625University of Louisville* 20,600 Papa John's Cardinal Stadium 1998 42,000 5,000 10 500
Troy State University 29,500 Movie Gallery Veteran Stadium 1950 30,000 5,000 20 250Syracuse University 19,100 Carrier Dome 1980 51,000 2,500 indefinite na
Average 31,156 1983 41,678 14,889 18 839
Schools Who Play in Major League VenuesTemple University 33,900 Lincoln Financial Field 2003 66,000 139,600 20 6,980University of Pittsburgh 34,000 Heinz Field 2001 64,450 57,000 20 2,850University of South Florida 46,000 Raymond James Stadium 1998 65,000 32,500 13 2,500San Diego State University 30,000 Qualcomm Stadium 1967 71,000 18,000 20 900
Average 35,975 1992 66,613 61,775 18 3,308
Original agreement shown. Recent $10mil donation to support stadium expansion and extend naming thorugh 2040.Source: US College Search, Revenues from Sport Venues, Johnson Consulting
Comparable Stadium Naming Rights Agreements
As the table shows, only a few stadiums across the country have sold naming rights to their on-campus facilities. For stadiums on college campuses, the average annual payment is approximately $839,000 and the average length of these contracts is 18 years. The value of naming rights deals at the professional level are much higher, also shown above, but the schools that play in these facilities rarely obtain any of the revenue generated by the contract.
Of note is a recent short-term naming right agreement between Dolphins Stadium in Miami and Anheuser Busch/InBev to rename the stadium Land Shark Stadium for the 2009 NFL season only. The name is expected to revert back to Dolphin Stadium at the conclusion of the 2009 regular season. Given the 2008 demolition of the Orange Bowl, Land Shark Stadium is also the home field for the University of Miami Hurricanes Football program.
Based on these naming rights contracts and information obtained from the university, the projection assumes that the FAU football stadium will secure a naming rights sponsor that will generate a gross annual amount of $430,000 per year, less a seven percent fulfillment fee, as FAU will handle this operation in-house. The net revenue is therefore $400,000.
Facility Service Fee / Box Office Rebates – Facility service fees are often found in stadiums and other public-assembly facilities as a way to financially support operations and debt service payments, particularly in privately-owned facilities that require a return on investment. Such fees are commonly $0.50 to $1.50, and appear at numerous major professional,
C . H . J O H N S O N C O N S U L T I N G , I N C . EXPERTS IN CONVENTION, SPORT AND REAL ESTATE CONSULTING
Florida Atlantic University Section 5 Page 14 Football Stadium Analysis July 2010
collegiate, and minor league facilities. For this projection, FAU has chosen not to implement this fee at this time. Johnson Consulting has projected at a fee of $0.75 the University could obtain an additional revenue of approximately $100,000.
Other Revenue – consists of interest earned from club seat and luxury suite deposits and other cash balances. Other incidental revenue will also be earned.
Fundraising – is an important portion of revenue generated for the Athletics Department. The Capital Gifts Fund is a fundraising effort, with campaign contributions going directly to the football stadium project. The FAU Foundation has set it sights on raising an undetermined amount in support of the stadium. Based on information obtained from the university, it is projected that the foundation will raise approximately $250,000 annually.
Debt Service
FAU has provided Johnson Consulting with the most current debt service numbers, which have been reflected in Tables 5-6 and 5-7.
Operating Expenses
Every university operates its facilities, including sports arena and stadiums differently. Each line item expense covered below is conservatively estimated based on common operating procedures and comparable data.
Fixed Expenses
As mentioned previously, fixed expenses are those that do not vary based on the specific number of events or attendees at the stadium. These expenses are salaries and benefits, general and administrative, the stadium management fee, a portion of utilities, repairs and maintenance, insurance, advertising, communications, and miscellaneous expenses.
Salaries – Based on prior stadium studies, the infrequent use of the stadium does not necessarily justify hiring a complement of full-time staff. It is expected that full-time personnel will be required for the sales and marketing of premium seating as well as facility maintenance. These employees will, in fact, be additions to the overall Athletics Department, so it becomes a matter of policy on how salaries are ultimately treated. For projection purposes, we have assumed a total salary of $100,000 for the

C . H . J O H N S O N C O N S U L T I N G , I N C . EXPERTS IN CONVENTION, SPORT AND REAL ESTATE CONSULTING
Florida Atlantic University Section 5 Page 15 Football Stadium Analysis July 2010
functions noted above. Benefits for these positions are assumed to be thirty three percent of the base salary.
General and Administrative – This category consists of general and administrative expenses such as office-related expenses, supplies, garbage, accounting, legal , etc.
Utilities – As with the salary and wage expenses, it is imperative that the management passes through to the user, to the extent possible, utility costs related to a particular event. In many facilities, these costs are handled as an expense that is reimbursed or partially reimbursed by the tenant. For purposes of this analysis, it is assumed that the utility cost shown represents the total non-reimbursable costs, net of any pass through arrangements. Based on comparable venues, we have assumed utility costs to be $175,000 per year. It should also be noted that actual utility expenses would also depend on facility design and decisions concerning energy systems and management.
Repairs and Maintenance – This line item includes various expenses that will be incurred related to building maintenance, equipment maintenance, and ground and turf maintenance. These expenses will include both in-house activities as well as contractual services for outsourced third party contractors. Expense allocations for repair and maintenance are highly dependent upon the owner/management philosophy relative to upkeep of the facility. We have assumed that in Years 1 through 3, expenses for this item will be lower due to projected construction warranties.
Insurance – Event insurance is included in the variable gameday expenses. Other insurance premiums are estimated at $55,000 in year one of operation.
Advertising - Advertising expense is primarily related to advertising in industry publications and local media outlets, as well as various promotions. This item does not include fulfillment costs for certain revenue-generating items, such as premium seating, that have been presented earlier in this section.
Miscellaneous Expenses – include licenses, publications, uniforms, and other various expenditures.
Variable Expenses
Variable expenses are those that fluctuate based on the usage of the stadium. These expenses include gameday expenses and funding of a maintenance reserve account, as discussed below.
Gameday Expense – include the cost of hosting a home game for FAU football, high school football, and special events which will be borne by the

C . H . J O H N S O N C O N S U L T I N G , I N C . EXPERTS IN CONVENTION, SPORT AND REAL ESTATE CONSULTING
Florida Atlantic University Section 5 Page 16 Football Stadium Analysis July 2010
stadium. In 2003, Global Spectrum conducted an analysis of professional football gameday expenses and found the expenses to be $2.15 per head in the south east, $2.63 in the north east, and $2.50 per head in the west. Collegiate stadiums, with their reduced amenity level shorter schedules incur lower per head costs. Johnson Consulting reviewed the actual 2009-10 gameday expenses incurred at Lockhart Stadium as presented in Table 5-10 below.
Table 5-10 Gameday Expenses - FAU Football
Lockhart Stadium 2009-10
Expense Average per Game Expense ($)
Projected per Game Expense at New
Stadium ($)
Stadium Rental $28,500 naFacility Insurance* 2,200 2,750Locker Room Rental 1,300 naStadium Food Service 780 780Copy Machine Rental 60 60Golf Cart Rental 330 330Portable Toilet Rental 170 170Radio Rental 500 500Auxiliary Officials 420 420Stadium Cleaning * 5,390 6,738Emergency Medical Service 1,410 1,410Event Staffing * 11,000 13,750Grounds Service * 880 1,100Grounds Supplies * 300 375Police - Local 4,000 4,000Student Buses 9,360 naMisc. Expense* 280 350Misc. Staffing* 150 188
Total $67,030 $32,920
Average Turnstile Attendance $16,126 $19,138
Gameday Expense / Attendee $4.16 $1.72
* Assumes 25% increase for new stadium projection increase due to larger stadium
Source: Johnson Consulting, FAU
The current gameday expenses incurred at Lockhart Stadium include such items as rentals and student buses which will not be required with a new, university-
C . H . J O H N S O N C O N S U L T I N G , I N C . EXPERTS IN CONVENTION, SPORT AND REAL ESTATE CONSULTING
Florida Atlantic University Section 5 Page 17 Football Stadium Analysis July 2010
owned, on-campus stadium. Other items, such as police, equipment rentals and emergency services, will remain the same despite the move to a new stadium. Other expenses, such as event insurance, cleaning and grounds keeping, have been increased proportionately to account for a larger stadium. It is also assumed that event insurance will be accounted for as a gameday expense and not be included in the overall insurance expenses. Based on this input, we have conservatively estimated a gameday expense of $2.50 per turnstile attendee. Table 5-6, shows the input of $2.50 per turnstile attendee, which amounts to $444,090 in 2011-2012. Table 5-7, shows the incremental difference between the projected $444,000 and their current gameday expense of $390,000, which is approximately $54,000.
Deposit to Maintenance Reserve Account – The maintenance reserve account funds major planned projects such as turf, equipment, and roof replacement, as well as other scheduled maintenance programs that are not routine or paid for by the facility’s repairs and maintenance account. Although facilities often have unique schedules for funding their maintenance reserve account, the annual amount deposited generally increases as a facility ages. The deposit to the maintenance reserve account is assumed to be six percent of gross revenue.
Coverage Ratio
Applying operating income, including the non-operating revenues, to debt service, the year five debt coverage ratio is approximately 122 percent when considering the incremental stadium revenues over the existing operation (Table 5-7).
Conclusions
Based upon the foregoing assumptions and considerations and upon our analyses and studies as summarized or referred to in this report, which report should be read in its entirety in conjunction with the following, we are of the opinion that:
1. The estimates of attendance, achievable ticket prices, suite, club seat and other revenues, as well as operating expenses, based on, among other things, analyses of historical trends, and reasonable projections form a reasonable basis for the projected operating results set forth in this report.
2. FAU and other parties are in compliance with known applicable government regulations pertaining to FAU campus development and facilities operations.
3. For the fiscal years ending June of 2012 through July of 2021, the Revenues from operation of the planned FAU on-campus football stadium and

C . H . J O H N S O N C O N S U L T I N G , I N C . EXPERTS IN CONVENTION, SPORT AND REAL ESTATE CONSULTING
Florida Atlantic University Section 5 Page 18 Football Stadium Analysis July 2010
associated facilities are projected to be sufficient to pay the projected Costs of Operation and Maintenance and to pay the projected annual debt service.
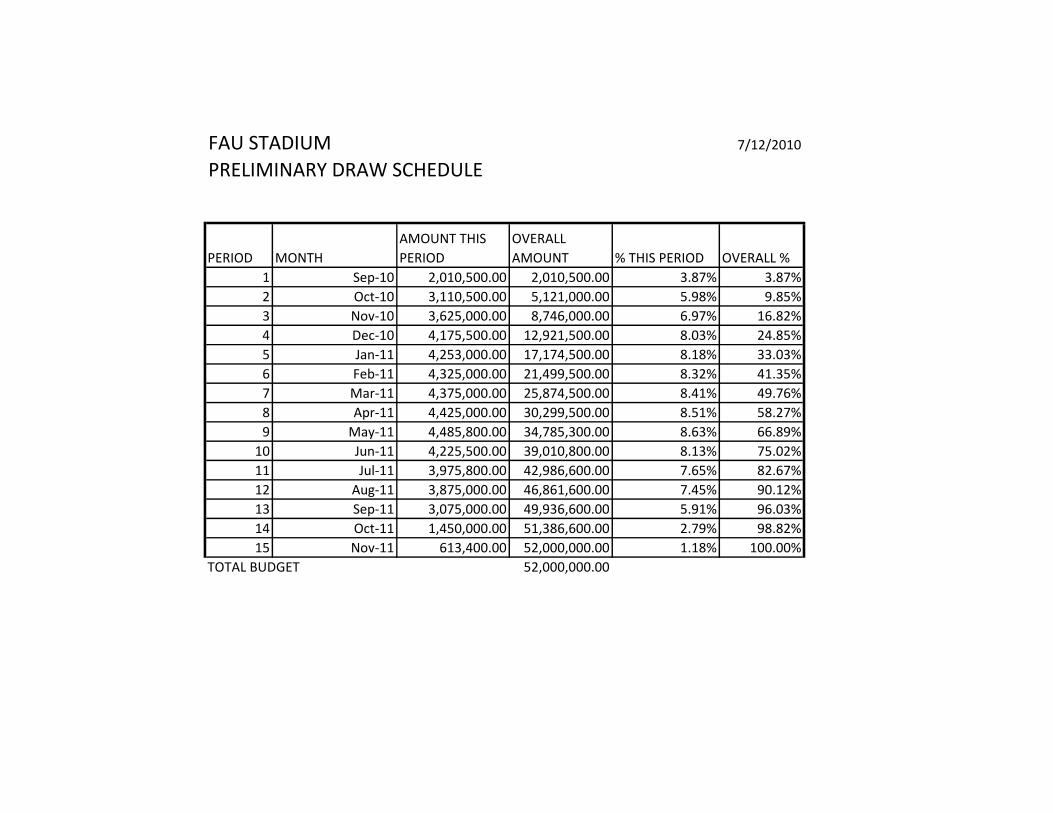
FAU STADIUM 7/12/2010
PRELIMINARY DRAW SCHEDULE
PERIOD MONTH
AMOUNT THIS
PERIOD
OVERALL
AMOUNT % THIS PERIOD OVERALL %
1 Sep-10 2,010,500.00 2,010,500.00 3.87% 3.87%
2 Oct-10 3,110,500.00 5,121,000.00 5.98% 9.85%
3 Nov-10 3,625,000.00 8,746,000.00 6.97% 16.82%
4 Dec-10 4,175,500.00 12,921,500.00 8.03% 24.85%
5 Jan-11 4,253,000.00 17,174,500.00 8.18% 33.03%
6 Feb-11 4,325,000.00 21,499,500.00 8.32% 41.35%
7 Mar-11 4,375,000.00 25,874,500.00 8.41% 49.76%
8 Apr-11 4,425,000.00 30,299,500.00 8.51% 58.27%
9 May-11 4,485,800.00 34,785,300.00 8.63% 66.89%
10 Jun-11 4,225,500.00 39,010,800.00 8.13% 75.02%
11 Jul-11 3,975,800.00 42,986,600.00 7.65% 82.67%
12 Aug-11 3,875,000.00 46,861,600.00 7.45% 90.12%
13 Sep-11 3,075,000.00 49,936,600.00 5.91% 96.03%
14 Oct-11 1,450,000.00 51,386,600.00 2.79% 98.82%
15 Nov-11 613,400.00 52,000,000.00 1.18% 100.00%
TOTAL BUDGET 52,000,000.00

Jul 9, 2010 2:29 pm Prepared by Dunlap & Associates (Finance 6.016 FAU:STADIUM-63M425) Page 1
SOURCES AND USES OF FUNDS
Florida Atlantic UniversityNew Money Bond Issue 2010
Assumes 30,000 Seat Stadium Tax-Exempt PortionFinal Maturity 2043Revised Project Cost
Dated Date 10/01/2010Delivery Date 10/01/2010
Sources:
Bond Proceeds:Par Amount 44,585,000.00
Other Sources of Funds:FAU Contribution Shared Infrastructure 4,906,808.00FAU Cash Contribution 20,340,173.00
25,246,981.00
69,831,981.00
Uses:
Project Fund Deposits:Project Fund (30,000 seats) 63,500,000.00
Other Fund Deposits:Fully Funded DSRF 2,616,675.00Capitalized Interest 4/1/12 2,842,293.84
5,458,968.84
Delivery Date Expenses:Cost of Issuance 668,775.00
Other Uses of Funds:Arrangement Fee 200,000.00Additional Proceeds 4,237.16
204,237.16
69,831,981.00
Notes: DSRF - Three Tier Test Capitalized Interest through 4/1/12 Current Rate of 4.25% Cost of Issuance 1.50%

Jul 9, 2010 2:29 pm Prepared by Dunlap & Associates (Finance 6.016 FAU:STADIUM-63M425) Page 2
BOND SUMMARY STATISTICS
Florida Atlantic UniversityNew Money Bond Issue 2010
Assumes 30,000 Seat Stadium Tax-Exempt PortionFinal Maturity 2043Revised Project Cost
Dated Date 10/01/2010Delivery Date 10/01/2010Last Maturity 07/01/2043
Arbitrage Yield 4.250422%True Interest Cost (TIC) 4.250422%Net Interest Cost (NIC) 4.250000%All-In TIC 4.366128%Average Coupon 4.250000%
Average Life (years) 20.991Duration of Issue (years) 13.389
Par Amount 44,585,000.00Bond Proceeds 44,585,000.00Total Interest 39,775,909.38Net Interest 39,775,909.38Total Debt Service 84,360,909.38Maximum Annual Debt Service 2,616,675.00Average Annual Debt Service 2,575,905.63
Underwriter's Fees (per $1000) Average Takedown Other Fee
Total Underwriter's Discount
Bid Price 100.000000
Par Average AverageBond Component Value Price Coupon Life
Serial 44,585,000.00 100.000 4.250% 20.991
44,585,000.00 20.991
All-In ArbitrageTIC TIC Yield
Par Value 44,585,000.00 44,585,000.00 44,585,000.00 + Accrued Interest + Premium (Discount) - Underwriter's Discount - Cost of Issuance Expense -668,775.00 - Other Amounts
Target Value 44,585,000.00 43,916,225.00 44,585,000.00
Target Date 10/01/2010 10/01/2010 10/01/2010Yield 4.250422% 4.366128% 4.250422%
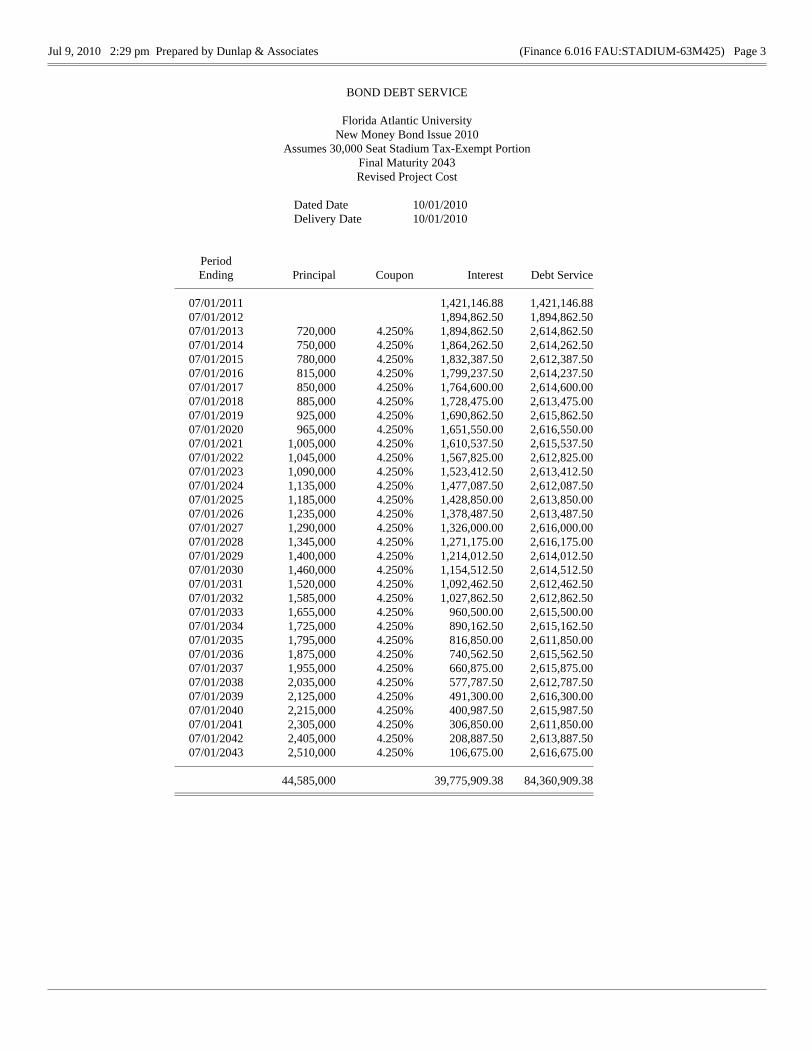
Jul 9, 2010 2:29 pm Prepared by Dunlap & Associates (Finance 6.016 FAU:STADIUM-63M425) Page 3
BOND DEBT SERVICE
Florida Atlantic UniversityNew Money Bond Issue 2010
Assumes 30,000 Seat Stadium Tax-Exempt PortionFinal Maturity 2043Revised Project Cost
Dated Date 10/01/2010Delivery Date 10/01/2010
PeriodEnding Principal Coupon Interest Debt Service
07/01/2011 1,421,146.88 1,421,146.8807/01/2012 1,894,862.50 1,894,862.5007/01/2013 720,000 4.250% 1,894,862.50 2,614,862.5007/01/2014 750,000 4.250% 1,864,262.50 2,614,262.5007/01/2015 780,000 4.250% 1,832,387.50 2,612,387.5007/01/2016 815,000 4.250% 1,799,237.50 2,614,237.5007/01/2017 850,000 4.250% 1,764,600.00 2,614,600.0007/01/2018 885,000 4.250% 1,728,475.00 2,613,475.0007/01/2019 925,000 4.250% 1,690,862.50 2,615,862.5007/01/2020 965,000 4.250% 1,651,550.00 2,616,550.0007/01/2021 1,005,000 4.250% 1,610,537.50 2,615,537.5007/01/2022 1,045,000 4.250% 1,567,825.00 2,612,825.0007/01/2023 1,090,000 4.250% 1,523,412.50 2,613,412.5007/01/2024 1,135,000 4.250% 1,477,087.50 2,612,087.5007/01/2025 1,185,000 4.250% 1,428,850.00 2,613,850.0007/01/2026 1,235,000 4.250% 1,378,487.50 2,613,487.5007/01/2027 1,290,000 4.250% 1,326,000.00 2,616,000.0007/01/2028 1,345,000 4.250% 1,271,175.00 2,616,175.0007/01/2029 1,400,000 4.250% 1,214,012.50 2,614,012.5007/01/2030 1,460,000 4.250% 1,154,512.50 2,614,512.5007/01/2031 1,520,000 4.250% 1,092,462.50 2,612,462.5007/01/2032 1,585,000 4.250% 1,027,862.50 2,612,862.5007/01/2033 1,655,000 4.250% 960,500.00 2,615,500.0007/01/2034 1,725,000 4.250% 890,162.50 2,615,162.5007/01/2035 1,795,000 4.250% 816,850.00 2,611,850.0007/01/2036 1,875,000 4.250% 740,562.50 2,615,562.5007/01/2037 1,955,000 4.250% 660,875.00 2,615,875.0007/01/2038 2,035,000 4.250% 577,787.50 2,612,787.5007/01/2039 2,125,000 4.250% 491,300.00 2,616,300.0007/01/2040 2,215,000 4.250% 400,987.50 2,615,987.5007/01/2041 2,305,000 4.250% 306,850.00 2,611,850.0007/01/2042 2,405,000 4.250% 208,887.50 2,613,887.5007/01/2043 2,510,000 4.250% 106,675.00 2,616,675.00
44,585,000 39,775,909.38 84,360,909.38
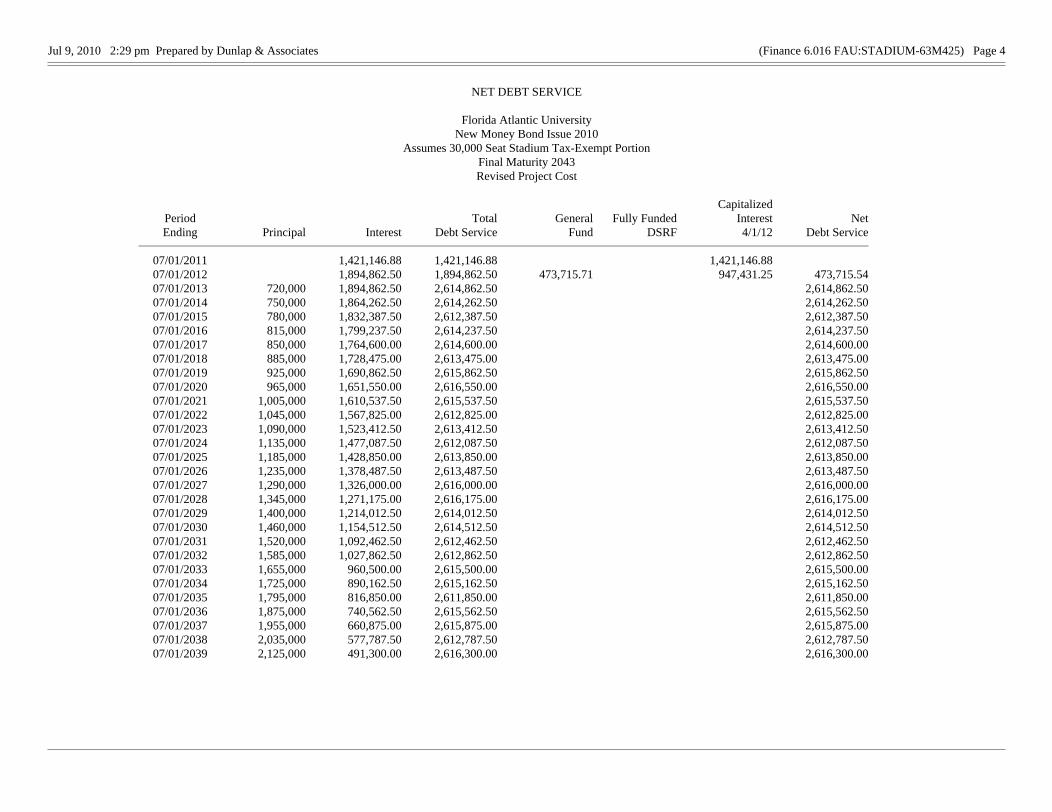
Jul 9, 2010 2:29 pm Prepared by Dunlap & Associates (Finance 6.016 FAU:STADIUM-63M425) Page 4
NET DEBT SERVICE
Florida Atlantic UniversityNew Money Bond Issue 2010
Assumes 30,000 Seat Stadium Tax-Exempt PortionFinal Maturity 2043Revised Project Cost
CapitalizedPeriod Total General Fully Funded Interest NetEnding Principal Interest Debt Service Fund DSRF 4/1/12 Debt Service
07/01/2011 1,421,146.88 1,421,146.88 1,421,146.8807/01/2012 1,894,862.50 1,894,862.50 473,715.71 947,431.25 473,715.5407/01/2013 720,000 1,894,862.50 2,614,862.50 2,614,862.5007/01/2014 750,000 1,864,262.50 2,614,262.50 2,614,262.5007/01/2015 780,000 1,832,387.50 2,612,387.50 2,612,387.5007/01/2016 815,000 1,799,237.50 2,614,237.50 2,614,237.5007/01/2017 850,000 1,764,600.00 2,614,600.00 2,614,600.0007/01/2018 885,000 1,728,475.00 2,613,475.00 2,613,475.0007/01/2019 925,000 1,690,862.50 2,615,862.50 2,615,862.5007/01/2020 965,000 1,651,550.00 2,616,550.00 2,616,550.0007/01/2021 1,005,000 1,610,537.50 2,615,537.50 2,615,537.5007/01/2022 1,045,000 1,567,825.00 2,612,825.00 2,612,825.0007/01/2023 1,090,000 1,523,412.50 2,613,412.50 2,613,412.5007/01/2024 1,135,000 1,477,087.50 2,612,087.50 2,612,087.5007/01/2025 1,185,000 1,428,850.00 2,613,850.00 2,613,850.0007/01/2026 1,235,000 1,378,487.50 2,613,487.50 2,613,487.5007/01/2027 1,290,000 1,326,000.00 2,616,000.00 2,616,000.0007/01/2028 1,345,000 1,271,175.00 2,616,175.00 2,616,175.0007/01/2029 1,400,000 1,214,012.50 2,614,012.50 2,614,012.5007/01/2030 1,460,000 1,154,512.50 2,614,512.50 2,614,512.5007/01/2031 1,520,000 1,092,462.50 2,612,462.50 2,612,462.5007/01/2032 1,585,000 1,027,862.50 2,612,862.50 2,612,862.5007/01/2033 1,655,000 960,500.00 2,615,500.00 2,615,500.0007/01/2034 1,725,000 890,162.50 2,615,162.50 2,615,162.5007/01/2035 1,795,000 816,850.00 2,611,850.00 2,611,850.0007/01/2036 1,875,000 740,562.50 2,615,562.50 2,615,562.5007/01/2037 1,955,000 660,875.00 2,615,875.00 2,615,875.0007/01/2038 2,035,000 577,787.50 2,612,787.50 2,612,787.5007/01/2039 2,125,000 491,300.00 2,616,300.00 2,616,300.00
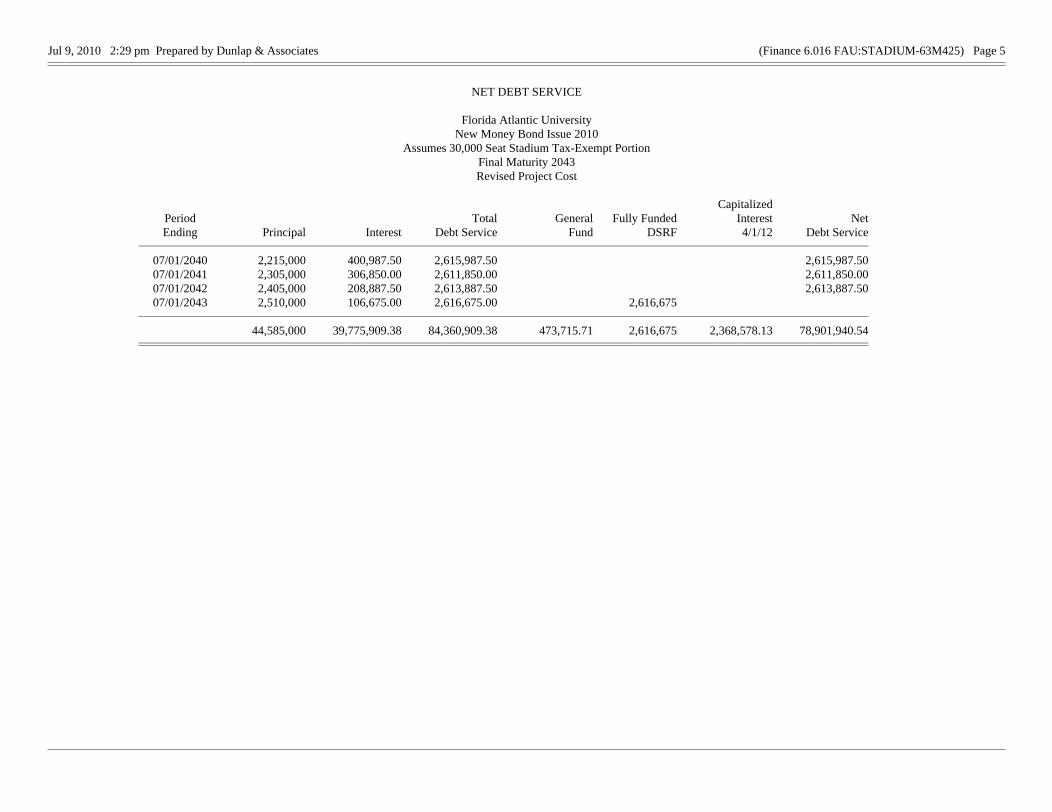
Jul 9, 2010 2:29 pm Prepared by Dunlap & Associates (Finance 6.016 FAU:STADIUM-63M425) Page 5
NET DEBT SERVICE
Florida Atlantic UniversityNew Money Bond Issue 2010
Assumes 30,000 Seat Stadium Tax-Exempt PortionFinal Maturity 2043Revised Project Cost
CapitalizedPeriod Total General Fully Funded Interest NetEnding Principal Interest Debt Service Fund DSRF 4/1/12 Debt Service
07/01/2040 2,215,000 400,987.50 2,615,987.50 2,615,987.5007/01/2041 2,305,000 306,850.00 2,611,850.00 2,611,850.0007/01/2042 2,405,000 208,887.50 2,613,887.50 2,613,887.5007/01/2043 2,510,000 106,675.00 2,616,675.00 2,616,675
44,585,000 39,775,909.38 84,360,909.38 473,715.71 2,616,675 2,368,578.13 78,901,940.54
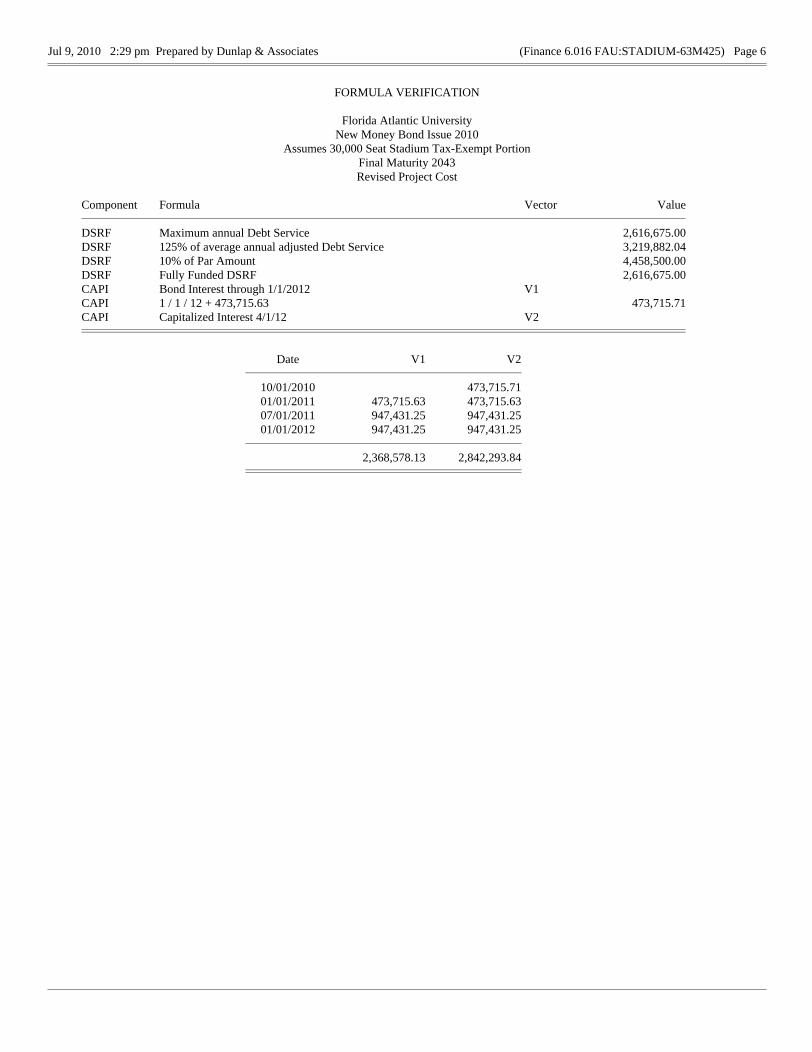
Jul 9, 2010 2:29 pm Prepared by Dunlap & Associates (Finance 6.016 FAU:STADIUM-63M425) Page 6
FORMULA VERIFICATION
Florida Atlantic UniversityNew Money Bond Issue 2010
Assumes 30,000 Seat Stadium Tax-Exempt PortionFinal Maturity 2043Revised Project Cost
Component Formula Vector Value
DSRF Maximum annual Debt Service 2,616,675.00DSRF 125% of average annual adjusted Debt Service 3,219,882.04DSRF 10% of Par Amount 4,458,500.00DSRF Fully Funded DSRF 2,616,675.00CAPI Bond Interest through 1/1/2012 V1CAPI 1 / 1 / 12 + 473,715.63 473,715.71CAPI Capitalized Interest 4/1/12 V2
Date V1 V2
10/01/2010 473,715.7101/01/2011 473,715.63 473,715.6307/01/2011 947,431.25 947,431.2501/01/2012 947,431.25 947,431.25
2,368,578.13 2,842,293.84

This document was created with Win2PDF available at http://www.daneprairie.com.The unregistered version of Win2PDF is for evaluation or non-commercial use only.

Item e
Debt service schedule for outstanding debt with a
lien on the pledged revenues.
There is no outstanding debt with a lien related to this project.

Item f
Schedule of estimated compliance with additional
bond requirement test
There is no outstanding debt related to this project and therefore no additional bond test
is required.

{25579/002/00436272.DOCv34}
Item g
Description of the security supporting repayment and
the lien position the debt will have on that security.
The Debt is to be secured by a first lien on revenues consisting of gross operating
revenues of the Project, which will include ticket sales revenues, concession sales, catering
services, novelty sales, parking revenues, premium and priority seating revenues, facility
service fees, advertising and sponsorship revenues, capital gifts, naming rights and certain non-
operating revenues including athletic fees (in an amount not exceeding 5% of the athletic fees
collected during the most recent twelve (12) consecutive months for which collection
information is available prior to the sale of the Debt), away game guarantee revenues and
conference game revenues in an aggregate amount equal to $1 million miscellaneous
contractual revenues and investment earnings on the above revenues.
There is no other debt outstanding with a lien on the above described Pledged
Revenues.

Document comparison by Workshare Professional on Wednesday, July 14, 2010 1:51:15 PM Input:
Document 1 ID file://J:\WDOX\DOCS\CLIENTS\25579\002\REPORTS\~VER\3\00436272.DOC
Description 00436272
Document 2 ID file://J:\WDOX\DOCS\CLIENTS\25579\002\REPORTS\00436272.DOC
Description 00436272 Rendering set Standard Legend:
Insertion
Deletion
Moved from
Moved to
Style change
Format change
Moved deletion
Inserted cell Deleted cell Moved cell Split/Merged cell Padding cell Statistics:
Count Insertions 2 Deletions 2 Moved from 0 Moved to 0 Style change 0 Format changed 0 Total changes 4
{25579/002/00449994.DOCv5}
BOARD OF GOVERNORS
STATE UNIVERSITY SYSTEM OF FLORIDA
Summary of Assumptions for Financing Analysis and Five-Year Revenue Projection
Florida Atlantic University
Innovation Village Stadium Project
The following assumptions have been used in the development of the preliminary financing
analysis and five-year revenue projection for the Project.
I. SCOPE OF THE PROJECT: As described in greater detail in the Project Summary, the Project
includes the financing of a 30,000 seat stadium to be located within Innovation Village on the
University’s Boca Raton campus. The total development and construction budget for the
Project (excluding reserve funds, capitalized interest and financing costs) totals $63,500,000.
The construction contract will be a fixed price contract and the general contractor will provide
full payment and performance bonds.
Other than site work and preparatory work related to the laying of foundations which has
commenced, construction of the Project is expected to commence in October 2010, with Project
completion by October 2011. The Project will be constructed with a steel frame and concrete
exterior and, as such, will have an estimated useful life of at least 35 years.
II. DEBT STRUCTURE: The financing for the Project will be provided with proceeds from a
bank loan with Regions Bank or a syndicate of banks led by Regions Bank, in an amount not
exceeding $44,585,000 (the "Debt"), together with $4,906,808 previously raised through the
DSO's Capital Improvement Revenue Bonds, Series 2010 and $20,340,173 of funds contributed
by the University. It is estimated that the Debt will be designated as Build America Bonds and
will thus bear interest at a taxable rate. The Debt will have a term of approximately 30 years,
will be fully amortizing and will be structured to produce level annual debt service.
III. PROJECT CONSTRUCTION FUND / CONSTRUCTION DRAWS: Approximately
$63,500,000 of the proceeds from the bank loan and other funds contributed by the University
will be deposited in the Project Construction Fund to pay the costs of developing and
constructing the Project. Such funds will be drawn monthly to pay these costs. The estimated
construction draw schedule has been included herewith. While moneys are held in the Project
Construction Fund, they will be invested; with such interest earnings remaining in the fund to
pay Project costs or other permitted expenditures, such as interest on the Debt. For purposes of
presenting a conservative analysis, the deposit to the Project Construction Fund has been gross
funded, without a reduction credited for the estimated interest earnings.
IV. CAPITALIZED INTEREST FUND: Approximately $ 2,842,294 (based on a 4.25% interest
rate assumption, which is based upon a formula of 2.59% (7 year Swap Curve) plus 3.36%) of
the proceeds from the bank loan and the other funds contributed by the University will be used
{25579/002/00449994.DOCv5}
to pay capitalized interest on the Debt for a period beginning upon the closing of the Debt and
extending through construction completion plus an additional six months. While moneys are
held in the Capitalized Interest Fund, they will be invested, with such interest earnings
remaining in the fund to pay interest on the Debt. For purposes of presenting a conservative
analysis, the deposit to the Capitalized Interest Fund has been gross funded, without a
reduction credited for the estimated interest earnings.
V. DEBT SERVICE RESERVE FUND: Approximately $2,616,675 (based on a 4.25% interest rate
assumption, which is based upon a formula of 2.59% (7 year Swap Curve) plus 3.36%) of the
proceeds from the bank loan will be used to fund a Debt Service Reserve Fund approximately
equal to maximum annual debt service on the Debt. While moneys are held in the Debt Service
Reserve Fund, they will be invested, the earnings of which will be transferred to the Capitalized
Interest Fund during the capitalized interest period to reduce the Debt size. Thereafter, earnings
will be available to reduce the annual debt service on the Debt. Annual interest earnings on the
Debt Service Reserve Fund are assumed at 2.00%.
VI. ESTIMATED COSTS OF ISSUANCE: For the purposes of this analysis, we have assumed
financing costs due at closing will include issuance costs of approximately 1.50% of the par
amount of the Debt, inclusive of financing fees charged by the bank.
VII. ONGOING FEES: Annual ongoing fees related to the financing that are included in the
cash flow analysis include an ongoing bank servicing fee.
VIII. CLOSING DATE: October 1, 2010
IX. INTEREST RATES: The preliminary financing analysis for the Debt is based on a fixed rate
debt service structure with an assumed interest rate of 4.25% (based upon a formula of 2.59% (7
year Swap Curve) plus 3.36%) which results in a calculated yield (All-In TIC) for arbitrage
purposes of approximately 4.37%. The interest rate assumption is based on prevailing market
conditions as of the week of July 8, 2010 plus 38 basis points in order to account for changing
market conditions.
IX. CASH FLOW ASSUMPTIONS: The cash flow analysis is based on Operating Revenues
which consist of ticket sales revenues, concession sales, catering services, novelty sales, parking
revenues, premium and priority seating revenues, facility service fees, advertising and
sponsorship revenues, capital gifts, naming rights and certain non-operating revenues
including athletic fees (in an amount not exceeding 5% of the athletic fees collected during the
most recent twelve (12) consecutive months for which collection information is available prior
to the sale of the Debt), away game guarantee revenues and conference game revenues in an
aggregate amount equal to $1 million, miscellaneous contractual revenues and investment
earnings on the above revenues.

{25579/002/00449994.DOCv5}

1
2
3
4
5
6
7
8
9
10
11
12
13
14
15
16
17
18
19
20
21
22
23
24
25
26
27
28
29
30
31
32
33
34
35
36
37
38
39
40
41
42
43
44
45
46
47
48
49
50
52
53
54
55
56
57
A B C D E F G H I J K L M N O P Q R S T U V W
2004-05 2005-06 2006-07 2007-08 2008-09 2009-10 Proj 2010-11 Proj 2011-12 2012-13 2013-14 2014-15 2015-16 2016-17 2017-18 2018-19 2019-20 2020-21 2021-22 2022-23 2023-24
Operating Revenue
Student Fees $6,526,527 $7,816,240 $8,092,915 $7,990,719 $8,205,800 $8,700,000 $9,349,650 Scholarships/Other 4,927,304 2,971,770 2,743,388 3,090,988 3,106,098 3,200,000 3,238,613Ticket Sales - Football 270,722 377,137 273,712 618,362 547,480 533,500 563,500 $1,239,000 $1,276,170 $1,314,455 $1,353,889 $1,394,505 $1,436,341 $1,479,431 $1,523,814 $1,569,528 $1,616,614 $1,665,112 $1,715,066 $1,766,518Ticket Sales - Other Events 46,518 82,046 79,002 85,447 87,716 90,000 90,000 250,000 257,500 265,225 273,182 281,377 289,819 298,513 307,468 316,693 326,193 335,979 346,058 356,440Premium Seating, less 7% fulfillment 995,000 1,024,850 1,055,596 1,087,263 1,119,881 1,153,478 1,188,082 1,223,724 1,260,436 1,298,249 1,337,197 1,377,313 1,418,632Priority Seating Donation 757,000 779,710 803,101 827,194 852,010 877,570 903,898 931,015 958,945 987,713 1,017,345 1,047,865 1,079,301Naming Rights less 7% fulfillment 400,000 400,000 400,000 400,000 400,000 400,000 400,000 400,000 400,000 400,000 400,000 400,000 400,000Annual Capital Gifts 949,116 746,459 658,908 1,421,880 544,223 630,000 500,000 250,000 257,500 265,225 273,182 281,377 289,819 298,513 307,468 316,693 326,193 335,979 346,058 356,440Advertising & Sponsorship 466,868 545,384 217,809 403,914 269,937 400,000 400,000 336,000 346,080 356,462 367,156 378,171 389,516 401,202 413,238 425,635 438,404 451,556 465,103 479,056Novelties 40,000 41,200 42,436 43,709 45,020 46,371 47,762 49,195 50,671 52,191 53,757 55,369 57,030Parking 288,000 296,640 305,539 314,705 324,147 333,871 343,887 354,204 364,830 375,775 387,048 398,659 410,619Catering 43,000 44,290 45,619 46,987 48,397 49,849 51,344 52,885 54,471 56,105 57,788 59,522 61,308Concessions 71,652 20,242 99,804 88,324 74,298 75,000 75,000 354,000 364,620 375,559 386,825 398,430 410,383 422,695 435,375 448,437 461,890 475,746 490,019 504,719Facility Service Charges 281,947 178,020 312,027 397,298 488,870 483,875 483,875 98,000 100,940 103,968 107,087 110,300 113,609 117,017 120,528 124,143 127,868 131,704 135,655 139,725Total Revenue $13,540,654 $12,737,298 $12,477,565 $14,096,932 $13,324,422 $14,112,375 $14,700,638 $5,050,000 $5,189,500 $5,333,185 $5,481,181 $5,633,616 $5,790,624 $5,952,343 $6,118,913 $6,290,481 $6,467,195 $6,649,211 $6,836,687 $7,029,788Operating Expense
FixedSalary - Permanent Staff $4,520,054 $4,637,400 $4,761,351 $5,102,711 $4,923,190 $5,100,000 $4,754,300 $150,000 154,500 159,135 163,909 168,826 173,891 179,108 184,481 190,016 195,716 201,587 207,635 213,864General and Administrative 5,037,491 5,492,032 6,099,714 6,750,410 6,691,831 6,750,000 6,885,000 100,000 103,000 106,090 109,273 112,551 115,927 119,405 122,987 126,677 130,477 134,392 138,423 142,576Utilities 175,000 180,250 185,658 191,227 196,964 202,873 208,959 215,228 221,685 228,335 235,185 242,241 249,508Repairs and Maintenance 175,000 180,250 185,658 191,227 196,964 202,873 208,959 215,228 221,685 228,335 235,185 242,241 249,508Insurance 363,250 306,739 111,389 254,973 252,104 260,000 375,000 55,000 56,650 58,350 60,100 61,903 63,760 65,673 67,643 69,672 71,763 73,915 76,133 78,417Advertising 50,000 51,500 53,045 54,636 56,275 57,964 59,703 61,494 63,339 65,239 67,196 69,212 71,288Misc. 25,000 25,750 26,523 27,318 28,138 28,982 29,851 30,747 31,669 32,619 33,598 34,606 35,644Student Aid/Other 4,006,261 3,891,418 3,991,841 3,821,165 3,724,717 3,692,250 4,324,375Gameday Expenses 435,320 403,677 363,000 346,475 376,927 380,000 390,000 50,000 51,500 53,045 54,636 56,275 57,964 59,703 61,494 63,339 65,239 67,196 69,212 71,288Total Expenses $14,362,376 $14,731,266 $15,327,295 $16,275,734 $15,968,769 $16,182,250 $16,728,675 $780,000 803,400 827,502 852,327 877,897 904,234 931,361 959,302 988,081 1,017,723 1,048,255 1,079,702 1,112,093Net Operating Income (Deficit) -$821,722 -$1,993,968 -$2,849,730 -$2,178,802 -$2,644,347 -$2,069,875 -$2,028,037 $4,270,000 $4,386,100 $4,505,683 $4,628,853 $4,755,719 $4,886,391 $5,020,982 $5,159,612 $5,302,400 $5,449,472 $5,600,956 $5,756,985 $5,917,695
Deposit to Maintenance Reserve Account $340,000 $350,200 $360,706 $371,527 $382,673 $394,153 $405,978 $418,157 $430,702 $443,623 $456,932 $470,640 $484,759Net Operating Income (Deficit) Avail. for Debt $3,930,000 $4,035,900 $4,144,977 $4,257,326 $4,373,046 $4,492,237 $4,615,005 $4,741,455 $4,871,698 $5,005,849 $5,144,025 $5,286,346 $5,432,936
Other Non Operating Revenue
Away Game & Conf Guarantees $914,236 $1,900,693 $2,816,386 $2,477,971 $2,757,487 $2,524,875 $2,600,000 $1,000,000 $1,000,000 $1,000,000 $1,000,000 $1,000,000 $1,000,000 $1,000,000 $1,000,000 $1,000,000 $1,000,000 $1,000,000 $1,000,000 $1,000,000Student Fees (limit of 5%) 467,483 481,507 495,952 510,831 526,156 541,940 558,199 574,945 592,193 609,959 628,257 647,105 666,518Miscellaneous Contractual Revenues 250,000 250,000 250,000 250,000 250,000 250,000 250,000 250,000 250,000 250,000 250,000 250,000 250,000Total Other Sources $914,236 $1,900,693 $2,816,386 $2,477,971 $2,757,487 $2,524,875 $2,600,000 $1,717,483 $1,731,507 $1,745,952 $1,760,831 $1,776,156 $1,791,940 $1,808,199 $1,824,945 $1,842,193 $1,859,959 $1,878,257 $1,897,105 $1,916,518 Net Revenue (+/- of Expenses) $92,514 -$93,275 -$33,344 $299,169 $113,140 $455,000 $571,963 $5,647,483 $5,767,407 $5,890,929 $6,018,157 $6,149,202 $6,284,178 $6,423,203 $6,566,399 $6,713,891 $6,865,808 $7,022,282 $7,183,451 $7,349,454
Net Income for Debt Coverage $5,647,483 $5,767,407 $5,890,929 $6,018,157 $6,149,202 $6,284,178 $6,423,203 $6,566,399 $6,713,891 $6,865,808 $7,022,282 $7,183,451 $7,349,454
Debt Service (1) 1,421,147 1,894,863 2,614,863 2,614,263 2,612,388 2,614,238 2,614,600 2,613,475 2,615,863 2,616,550 2,615,538 2,612,825 2,613,413 2,612,088
Coverage Ratio including Other Non-operating Rev 2.98 2.21 2.25 2.30 2.35 2.40 2.46 2.51 2.57 2.63 2.69 2.75 2.81
*Fiscal Year runs from July 1 through June 30
The new Football Stadium is expected to begin operation in September/October 2011
12-Jul-10(1) Based upon Par Amount $44.585 million and 4.25% interest Rate
FAU Football Stadium Financial Projection
FAU Athletics Program Operations Actual and Projected (2005-2011) Incremental Stadium Only Estimates - Fiscal Year*
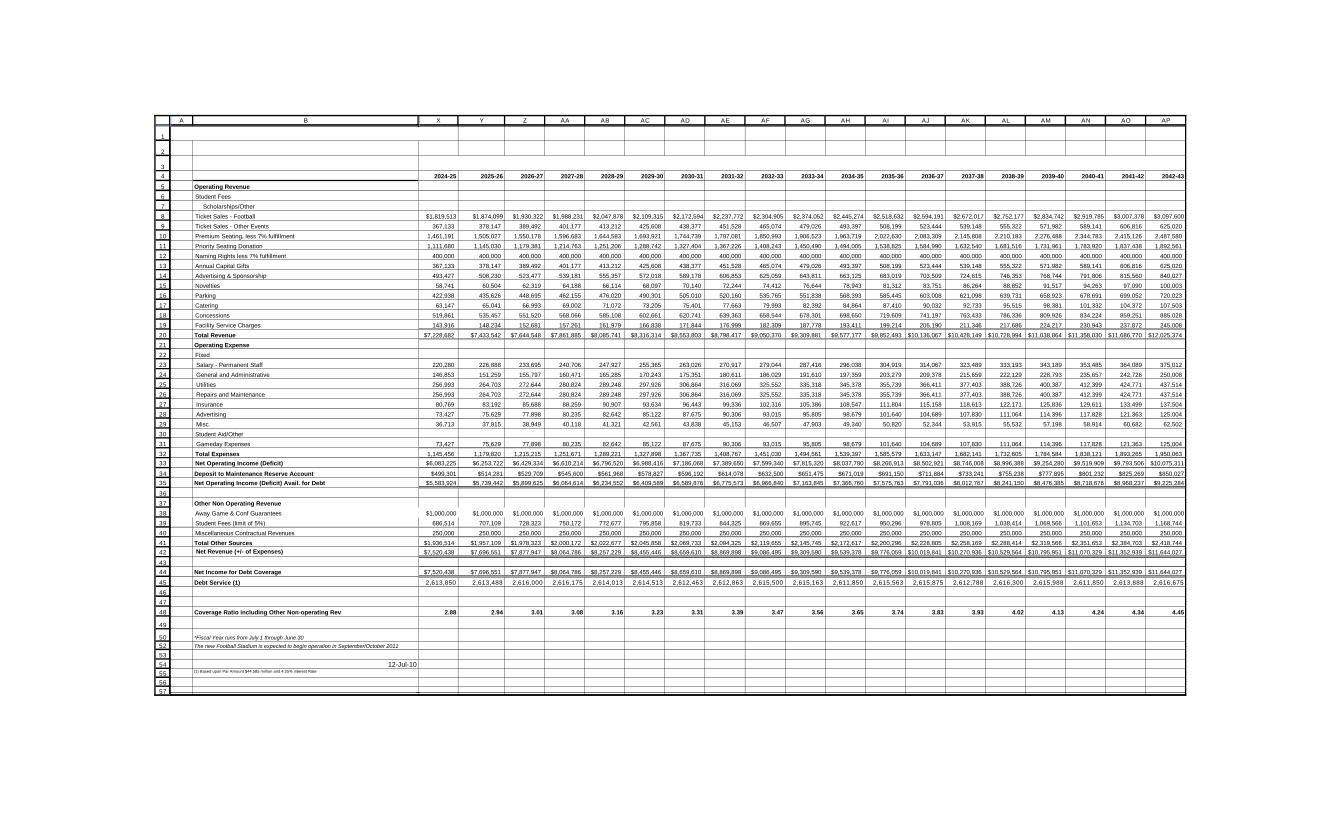
1
2
3
4
5
6
7
8
9
10
11
12
13
14
15
16
17
18
19
20
21
22
23
24
25
26
27
28
29
30
31
32
33
34
35
36
37
38
39
40
41
42
43
44
45
46
47
48
49
50
52
53
54
55
56
57
A B
Operating Revenue
Student Fees Scholarships/OtherTicket Sales - FootballTicket Sales - Other EventsPremium Seating, less 7% fulfillmentPriority Seating DonationNaming Rights less 7% fulfillmentAnnual Capital GiftsAdvertising & SponsorshipNoveltiesParkingCateringConcessionsFacility Service ChargesTotal Revenue
Operating Expense
FixedSalary - Permanent StaffGeneral and AdministrativeUtilitiesRepairs and MaintenanceInsuranceAdvertisingMisc.Student Aid/OtherGameday ExpensesTotal Expenses
Net Operating Income (Deficit)
Deposit to Maintenance Reserve Account
Net Operating Income (Deficit) Avail. for Debt
Other Non Operating Revenue
Away Game & Conf GuaranteesStudent Fees (limit of 5%)Miscellaneous Contractual RevenuesTotal Other Sources
Net Revenue (+/- of Expenses)
Net Income for Debt Coverage
Debt Service (1)
Coverage Ratio including Other Non-operating Rev
*Fiscal Year runs from July 1 through June 30
The new Football Stadium is expected to begin operation in September/October 2011
12-Jul-10(1) Based upon Par Amount $44.585 million and 4.25% interest Rate
FAU Football Stadium Financial ProjectionX Y Z AA AB AC AD AE AF AG AH AI AJ AK AL AM AN AO AP
2024-25 2025-26 2026-27 2027-28 2028-29 2029-30 2030-31 2031-32 2032-33 2033-34 2034-35 2035-36 2036-37 2037-38 2038-39 2039-40 2040-41 2041-42 2042-43
$1,819,513 $1,874,099 $1,930,322 $1,988,231 $2,047,878 $2,109,315 $2,172,594 $2,237,772 $2,304,905 $2,374,052 $2,445,274 $2,518,632 $2,594,191 $2,672,017 $2,752,177 $2,834,742 $2,919,785 $3,007,378 $3,097,600367,133 378,147 389,492 401,177 413,212 425,608 438,377 451,528 465,074 479,026 493,397 508,199 523,444 539,148 555,322 571,982 589,141 606,816 625,020
1,461,191 1,505,027 1,550,178 1,596,683 1,644,583 1,693,921 1,744,739 1,797,081 1,850,993 1,906,523 1,963,719 2,022,630 2,083,309 2,145,808 2,210,183 2,276,488 2,344,783 2,415,126 2,487,5801,111,680 1,145,030 1,179,381 1,214,763 1,251,206 1,288,742 1,327,404 1,367,226 1,408,243 1,450,490 1,494,005 1,538,825 1,584,990 1,632,540 1,681,516 1,731,961 1,783,920 1,837,438 1,892,561
400,000 400,000 400,000 400,000 400,000 400,000 400,000 400,000 400,000 400,000 400,000 400,000 400,000 400,000 400,000 400,000 400,000 400,000 400,000367,133 378,147 389,492 401,177 413,212 425,608 438,377 451,528 465,074 479,026 493,397 508,199 523,444 539,148 555,322 571,982 589,141 606,816 625,020493,427 508,230 523,477 539,181 555,357 572,018 589,178 606,853 625,059 643,811 663,125 683,019 703,509 724,615 746,353 768,744 791,806 815,560 840,02758,741 60,504 62,319 64,188 66,114 68,097 70,140 72,244 74,412 76,644 78,943 81,312 83,751 86,264 88,852 91,517 94,263 97,090 100,003
422,938 435,626 448,695 462,155 476,020 490,301 505,010 520,160 535,765 551,838 568,393 585,445 603,008 621,098 639,731 658,923 678,691 699,052 720,02363,147 65,041 66,993 69,002 71,072 73,205 75,401 77,663 79,993 82,392 84,864 87,410 90,032 92,733 95,515 98,381 101,332 104,372 107,503
519,861 535,457 551,520 568,066 585,108 602,661 620,741 639,363 658,544 678,301 698,650 719,609 741,197 763,433 786,336 809,926 834,224 859,251 885,028143,916 148,234 152,681 157,261 161,979 166,838 171,844 176,999 182,309 187,778 193,411 199,214 205,190 211,346 217,686 224,217 230,943 237,872 245,008
$7,228,682 $7,433,542 $7,644,548 $7,861,885 $8,085,741 $8,316,314 $8,553,803 $8,798,417 $9,050,370 $9,309,881 $9,577,177 $9,852,493 $10,136,067 $10,428,149 $10,728,994 $11,038,864 $11,358,030 $11,686,770 $12,025,374
220,280 226,888 233,695 240,706 247,927 255,365 263,026 270,917 279,044 287,416 296,038 304,919 314,067 323,489 333,193 343,189 353,485 364,089 375,012146,853 151,259 155,797 160,471 165,285 170,243 175,351 180,611 186,029 191,610 197,359 203,279 209,378 215,659 222,129 228,793 235,657 242,726 250,008256,993 264,703 272,644 280,824 289,248 297,926 306,864 316,069 325,552 335,318 345,378 355,739 366,411 377,403 388,726 400,387 412,399 424,771 437,514256,993 264,703 272,644 280,824 289,248 297,926 306,864 316,069 325,552 335,318 345,378 355,739 366,411 377,403 388,726 400,387 412,399 424,771 437,51480,769 83,192 85,688 88,259 90,907 93,634 96,443 99,336 102,316 105,386 108,547 111,804 115,158 118,613 122,171 125,836 129,611 133,499 137,50473,427 75,629 77,898 80,235 82,642 85,122 87,675 90,306 93,015 95,805 98,679 101,640 104,689 107,830 111,064 114,396 117,828 121,363 125,00436,713 37,815 38,949 40,118 41,321 42,561 43,838 45,153 46,507 47,903 49,340 50,820 52,344 53,915 55,532 57,198 58,914 60,682 62,502
73,427 75,629 77,898 80,235 82,642 85,122 87,675 90,306 93,015 95,805 98,679 101,640 104,689 107,830 111,064 114,396 117,828 121,363 125,0041,145,456 1,179,820 1,215,215 1,251,671 1,289,221 1,327,898 1,367,735 1,408,767 1,451,030 1,494,561 1,539,397 1,585,579 1,633,147 1,682,141 1,732,605 1,784,584 1,838,121 1,893,265 1,950,063$6,083,225 $6,253,722 $6,429,334 $6,610,214 $6,796,520 $6,988,416 $7,186,068 $7,389,650 $7,599,340 $7,815,320 $8,037,780 $8,266,913 $8,502,921 $8,746,008 $8,996,388 $9,254,280 $9,519,909 $9,793,506 $10,075,311
$499,301 $514,281 $529,709 $545,600 $561,968 $578,827 $596,192 $614,078 $632,500 $651,475 $671,019 $691,150 $711,884 $733,241 $755,238 $777,895 $801,232 $825,269 $850,027$5,583,924 $5,739,442 $5,899,625 $6,064,614 $6,234,552 $6,409,589 $6,589,876 $6,775,573 $6,966,840 $7,163,845 $7,366,760 $7,575,763 $7,791,036 $8,012,767 $8,241,150 $8,476,385 $8,718,676 $8,968,237 $9,225,284
$1,000,000 $1,000,000 $1,000,000 $1,000,000 $1,000,000 $1,000,000 $1,000,000 $1,000,000 $1,000,000 $1,000,000 $1,000,000 $1,000,000 $1,000,000 $1,000,000 $1,000,000 $1,000,000 $1,000,000 $1,000,000 $1,000,000686,514 707,109 728,323 750,172 772,677 795,858 819,733 844,325 869,655 895,745 922,617 950,296 978,805 1,008,169 1,038,414 1,069,566 1,101,653 1,134,703 1,168,744250,000 250,000 250,000 250,000 250,000 250,000 250,000 250,000 250,000 250,000 250,000 250,000 250,000 250,000 250,000 250,000 250,000 250,000 250,000
$1,936,514 $1,957,109 $1,978,323 $2,000,172 $2,022,677 $2,045,858 $2,069,733 $2,094,325 $2,119,655 $2,145,745 $2,172,617 $2,200,296 $2,228,805 $2,258,169 $2,288,414 $2,319,566 $2,351,653 $2,384,703 $2,418,744$7,520,438 $7,696,551 $7,877,947 $8,064,786 $8,257,229 $8,455,446 $8,659,610 $8,869,898 $9,086,495 $9,309,590 $9,539,378 $9,776,059 $10,019,841 $10,270,936 $10,529,564 $10,795,951 $11,070,329 $11,352,939 $11,644,027
$7,520,438 $7,696,551 $7,877,947 $8,064,786 $8,257,229 $8,455,446 $8,659,610 $8,869,898 $9,086,495 $9,309,590 $9,539,378 $9,776,059 $10,019,841 $10,270,936 $10,529,564 $10,795,951 $11,070,329 $11,352,939 $11,644,027
2,613,850 2,613,488 2,616,000 2,616,175 2,614,013 2,614,513 2,612,463 2,612,863 2,615,500 2,615,163 2,611,850 2,615,563 2,615,875 2,612,788 2,616,300 2,615,988 2,611,850 2,613,888 2,616,675
2.88 2.94 3.01 3.08 3.16 3.23 3.31 3.39 3.47 3.56 3.65 3.74 3.83 3.93 4.02 4.13 4.24 4.34 4.45
Incremental Stadium Only Estimates - Fiscal Year*
{25579/002/00450952.DOCv3}
BOARD OF GOVERNORS
STATE UNIVERSITY SYSTEM OF FLORIDA
Analysis of Method of Sale – Competitive Versus Negotiated Sale
Florida Atlantic University
Innovation Village Stadium Project
On behalf of Florida Atlantic University (the "University"), The FAU Finance
Corporation (the "DSO") proposes to finance the design, development and construction of a
30,000 seat stadium on the west side of the new Innovation Village Housing Project on the Boca
Raton campus of the University (the "Project"). In accordance with the Debt Management
Guidelines established by the Board of Governors, prior to incurring any debt obligations, an
analysis must be completed to assess the relative benefits of employing a negotiated sale versus
a competitive sale of the debt.
In determining that a negotiated sale is desirable for the proposed Project, the University
considered a number of factors. As part of the transaction structure, the newly established
DSO, will borrow the amounts necessary to finance the Project. In early 2010, the University
used a competitive selection process to select the financing method for the Project. Requests for
bids on both direct pay letters of credit to support a public offering of variable rate bonds and
conventional bank loan financing were submitted to financial institutions. In creating the
financing structure, the University is working with a financial advisor with a great deal of
experience in structuring stadium financings. The financial advisor has been beneficial in
preparing a variety of financial analyses and in working with the proposed respondents. Given
the current state of the credit markets, no acceptable proposals for letters of credit were received
from the pool of potential bidders. Two bank loan proposals were received. Negotiations were
opened with both banks which resulted in the selection of one bank to provide the financing.
This process allowed the DSO and the University to explore the possibility of financing the
Project through a public offering of variable rate bonds and a more conventional bank loan
financing. Given the state and current limited availability of credit generally, this competitive
selection process offered the DSO and the University the opportunity to select the most
advantageous method of financing. This particular financing structure is based upon the credit
approval of the proposing bank and will not require an investment grade rating due to the lack
of historical operating results. Therefore, a negotiated bank structure is the only viable
alternative at this time.
The matrix below further outlines factors taken into consideration in determining that a
negotiated sale process would result in the most favorable financing terms and conditions
available in the debt capital markets.
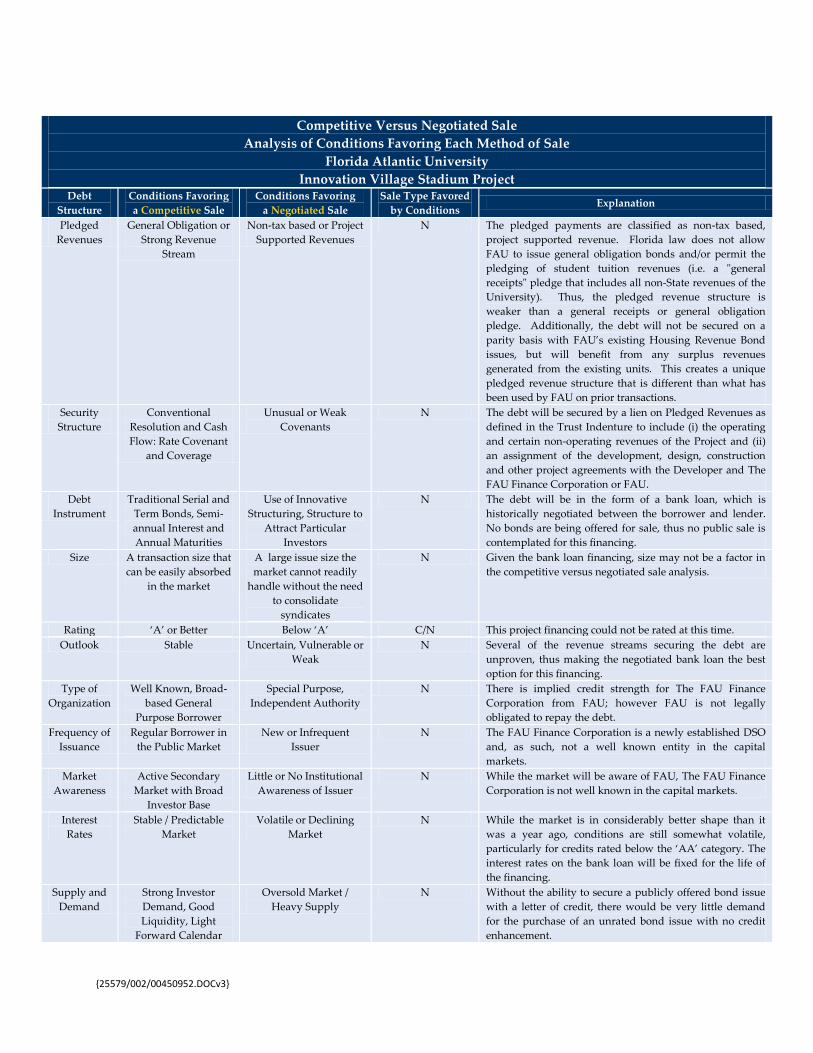
{25579/002/00450952.DOCv3}
Competitive Versus Negotiated Sale
Analysis of Conditions Favoring Each Method of Sale
Florida Atlantic University
Innovation Village Stadium Project
Debt
Structure
Conditions Favoring
a Competitive Sale
Conditions Favoring
a Negotiated Sale
Sale Type Favored
by Conditions Explanation
Pledged
Revenues
General Obligation or
Strong Revenue
Stream
Non-tax based or Project
Supported Revenues
N The pledged payments are classified as non-tax based,
project supported revenue. Florida law does not allow
FAU to issue general obligation bonds and/or permit the
pledging of student tuition revenues (i.e. a "general
receipts" pledge that includes all non-State revenues of the
University). Thus, the pledged revenue structure is
weaker than a general receipts or general obligation
pledge. Additionally, the debt will not be secured on a
parity basis with FAU’s existing Housing Revenue Bond
issues, but will benefit from any surplus revenues
generated from the existing units. This creates a unique
pledged revenue structure that is different than what has
been used by FAU on prior transactions.
Security
Structure
Conventional
Resolution and Cash
Flow: Rate Covenant
and Coverage
Unusual or Weak
Covenants
N The debt will be secured by a lien on Pledged Revenues as
defined in the Trust Indenture to include (i) the operating
and certain non-operating revenues of the Project and (ii)
an assignment of the development, design, construction
and other project agreements with the Developer and The
FAU Finance Corporation or FAU.
Debt
Instrument
Traditional Serial and
Term Bonds, Semi-
annual Interest and
Annual Maturities
Use of Innovative
Structuring, Structure to
Attract Particular
Investors
N The debt will be in the form of a bank loan, which is
historically negotiated between the borrower and lender.
No bonds are being offered for sale, thus no public sale is
contemplated for this financing.
Size A transaction size that
can be easily absorbed
in the market
A large issue size the
market cannot readily
handle without the need
to consolidate
syndicates
N Given the bank loan financing, size may not be a factor in
the competitive versus negotiated sale analysis.
Rating ‘A’ or Better Below ‘A’ C/N This project financing could not be rated at this time.
Outlook Stable Uncertain, Vulnerable or
Weak
N Several of the revenue streams securing the debt are
unproven, thus making the negotiated bank loan the best
option for this financing.
Type of
Organization
Well Known, Broad-
based General
Purpose Borrower
Special Purpose,
Independent Authority
N There is implied credit strength for The FAU Finance
Corporation from FAU; however FAU is not legally
obligated to repay the debt.
Frequency of
Issuance
Regular Borrower in
the Public Market
New or Infrequent
Issuer
N The FAU Finance Corporation is a newly established DSO
and, as such, not a well known entity in the capital
markets.
Market
Awareness
Active Secondary
Market with Broad
Investor Base
Little or No Institutional
Awareness of Issuer
N While the market will be aware of FAU, The FAU Finance
Corporation is not well known in the capital markets.
Interest
Rates
Stable / Predictable
Market
Volatile or Declining
Market
N While the market is in considerably better shape than it
was a year ago, conditions are still somewhat volatile,
particularly for credits rated below the ‘AA’ category. The
interest rates on the bank loan will be fixed for the life of
the financing.
Supply and
Demand
Strong Investor
Demand, Good
Liquidity, Light
Forward Calendar
Oversold Market /
Heavy Supply
N Without the ability to secure a publicly offered bond issue
with a letter of credit, there would be very little demand
for the purchase of an unrated bond issue with no credit
enhancement.
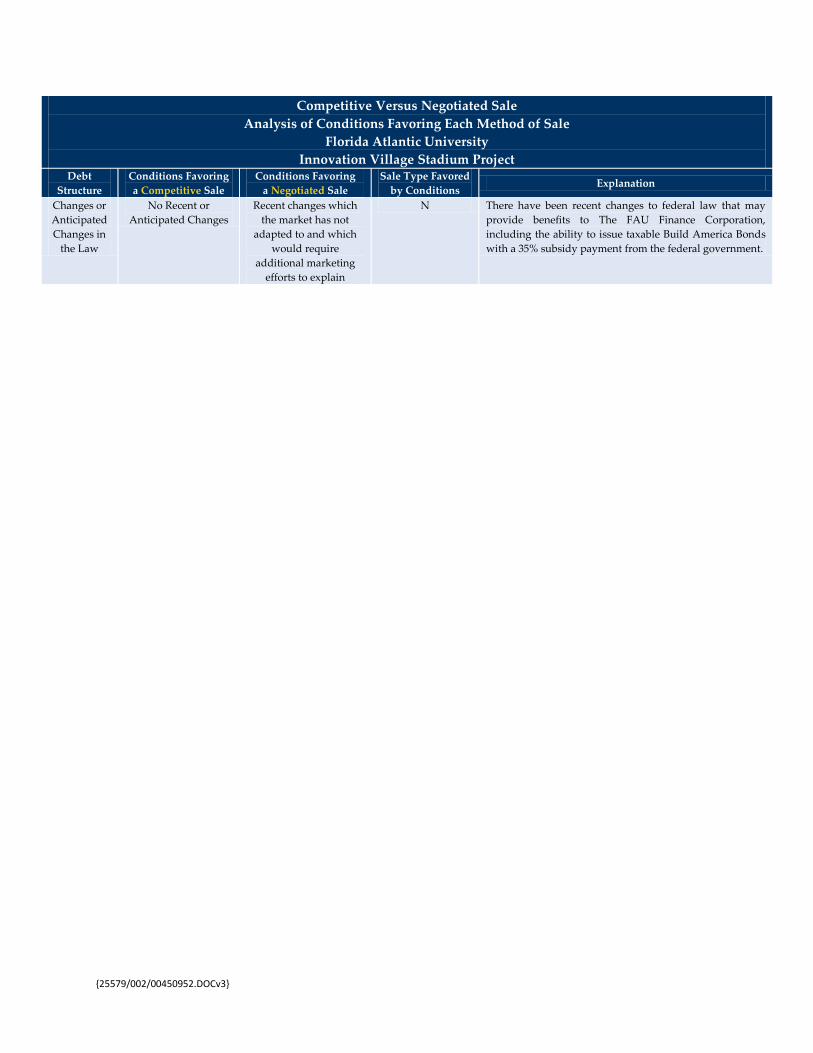
{25579/002/00450952.DOCv3}
Competitive Versus Negotiated Sale
Analysis of Conditions Favoring Each Method of Sale
Florida Atlantic University
Innovation Village Stadium Project
Debt
Structure
Conditions Favoring
a Competitive Sale
Conditions Favoring
a Negotiated Sale
Sale Type Favored
by Conditions Explanation
Changes or
Anticipated
Changes in
the Law
No Recent or
Anticipated Changes
Recent changes which
the market has not
adapted to and which
would require
additional marketing
efforts to explain
N There have been recent changes to federal law that may
provide benefits to The FAU Finance Corporation,
including the ability to issue taxable Build America Bonds
with a 35% subsidy payment from the federal government.