Embed Size (px)
Citation preview
Subject‑specific strength and weaknesses of fourth‑grade students in Europe: a comparative latent profile analysis of multidimensional proficiency patterns based on PIRLS/TIMSS combined 2011Heike Wendt* and Daniel Kasper
Abstract
Background: In 2011 the Progress in International Reading Literacy Study (PIRLS) and the Trends in International Mathematics and Science Study (TIMSS) were conducted at fourth grade in a number of participating countries with a shared representative sample. In this article we investigate whether there are multidimensional proficiency patterns across the competency domains or not.
Methods: In order to derive proficiency patterns across the reading (PIRLS), math-ematics and science (TIMSS) competence domains, latent profile analyses (LPA) of students’ plausible values were conducted. For this, the grade four student sample from 17 countries were combined and analyzed. The international reference model that resulted from this analysis was then applied with constraints to all 17 countries separately so that substantial comparisons between countries became possible. To describe and compare the differences between national profiles a classification system was developed and applied to all countries’ profile patterns.
Results: As a result of these international LPA seven groups of learners were identi-fied. The profiles were approximately equidistant and parallel. For all countries we find that achievement across domains can be explained by a general level of achievement rather than subject-specific strengths or weaknesses of learners. However, subject-specific strengths and weaknesses can be identified but are—with the exception of Malta and Northern Ireland—for most of the countries rather small. For only about half of the countries, a rather uniform pattern of subject-specific strengths and weaknesses can be found on all competence levels. The subject itself varies between countries. In the other countries high, intermediate and low achievers differ in their relative subject-specific strength and weaknesses.
Conclusions: The results suggest that differences in average achievement in TIMSS and PIRLS should also on country level be interpreted with caution. International comparative studies should further investigate potential reasons for the differences between countries.
Keywords: Multidimensional proficiency, Primary school, Europe, PIRLS/TIMSS 2011 combined
Open Access
© 2016 The Author(s). This article is distributed under the terms of the Creative Commons Attribution 4.0 International License (http://creativecommons.org/licenses/by/4.0/), which permits unrestricted use, distribution, and reproduction in any medium, provided you give appropriate credit to the original author(s) and the source, provide a link to the Creative Commons license, and indicate if changes were made.
RESEARCH
Wendt and Kasper Large-scale Assess Educ (2016) 4:14 DOI 10.1186/s40536‑016‑0026‑2
*Correspondence: [email protected] Technische Universitat Dortmund, Dortmund, NRW, Germany
Page 2 of 23Wendt and Kasper Large-scale Assess Educ (2016) 4:14
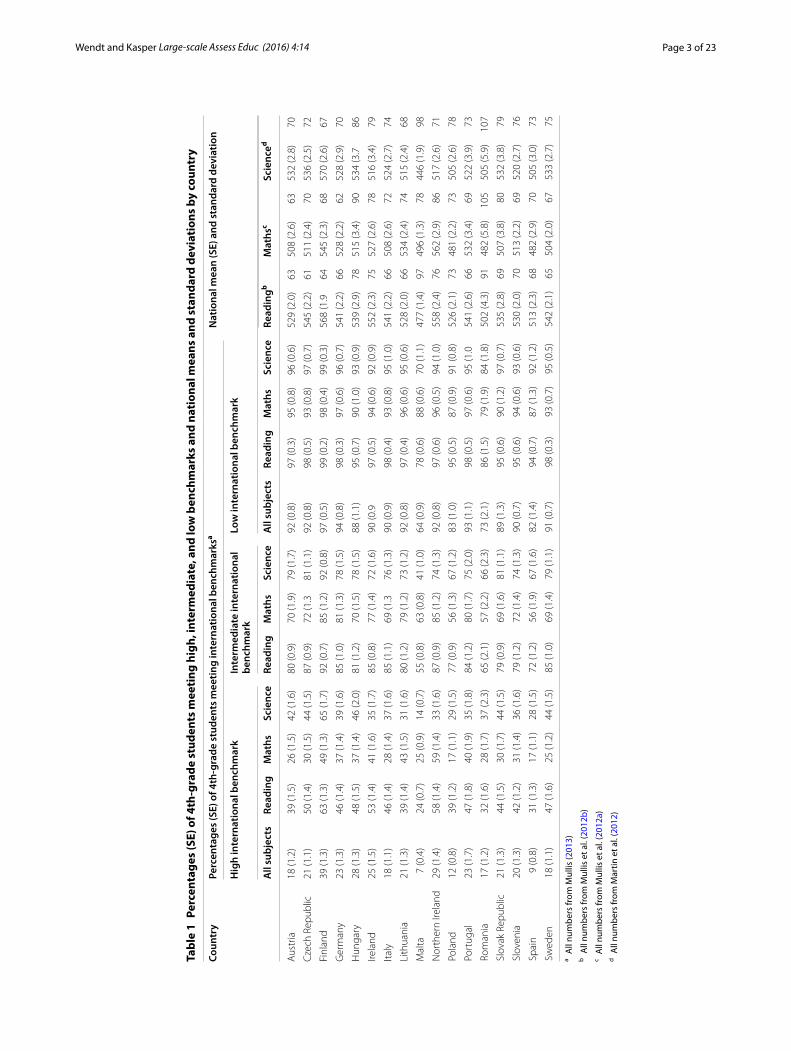
BackgroundResults in reports of national and international large-scale assessment studies are usually contextualized with countries’ achievement in specific domains compared against inter-national benchmarks (Bos et al. 2012a, b; Martin and Mullis 2013). Yet, rough compari-sons—for example, which country has the highest proportion of students meeting the highest benchmark in mathematics or science or reading, or which country ranks below the international average in all three subjects—can often be insensitive to the texture of within-country, and even between-country variation in achievement. For example, how is achievement in one domain related to another? Do the under-achieving students have specific strengths compared to high achievers? Do higher-achieving or lower-achiev-ing students show similar patterns of strengths or weaknesses across countries? With this paper we aim to describe and compare achievement of Grade 4 learners between countries and across domain specific achievement by modelling multidimensional pro-ficiency profiles making use of the combined datasets of the Progress in International Reading Literacy Study (PIRLS) and the Trends in International Mathematics and Sci-ence Study (TIMSS) 2011.
A comprehensive perspective on outcomes
Students’ academic competencies are the results of a complex interplay between factors located at the country, the school, the classroom, and the student level. A lot of these factors shape inter-individual differences in student achievement in a rather similar way (Bergold et al. 2016). This might be a possible explanation for the finding that stu-dents in countries reaching certain levels in one achievement domain tend to reach simi-lar results also in other domains (e.g., Martin et al. 2012; Mullis et al. 2012a, b).
Further, approaches to “interdisciplinary” or cross-subject teaching (Petersen 2000; Gudjons and Traub 2012) emphasize that a student understands his or her reality not contained within the bounds of one subject or another but, instead, across a set of applicable, interdisciplinary constructs (Lenzen 1996; Jonen and Jung 2007). This idea confirms the psychological perspective, which suggests that the development in compe-tence domains is based on transferrable skills and dispositions common to all subjects (Weinert 1999). From this perspective, an individual’s ability to learn is understood as a domain-general competence, which brings together in tandem a set of cognitive skills and strategies as well as prior knowledge and abilities. Regardless which perspective is taken, if learning occurs across domains (Baumert et al. 2000), it can be assumed that primary school students’ acquisition of skills in reading, mathematics, and science devel-ops at least partly parallel to one another (see Schurig et al. 2015).
Empirical research results support the assumption that learning in one subject is related to learning in another, and hence multidimensional, mutually dependent distri-butions achievement patterns should be found. For example, the reading, mathemat-ics, and science scores from PISA were found to inter-correlate from r = .75 to r = .81 (Reilly 2012) or even from r = .95 to r = .99 (Rindermann 2007). In TIMSS and PIRLS 2011, for the German sample the correlations were lower but still substantial, ranging from r = .54 to r = .74 (Bos et al. 2012a).
Page 3 of 23Wendt and Kasper Large-scale Assess Educ (2016) 4:14
Tabl
e 1
Perc
enta
ges
(SE)
of 4
th-g
rade
stu
dent
s m
eeti
ng h
igh,
inte
rmed
iate
, and
low
ben
chm
arks
and
nat
iona
l mea
ns a
nd s
tand
ard
devi
atio
ns b
y co
untr
y
a All
num
bers
from
Mul
lis (2
013)
b All
num
bers
from
Mul
lis e
t al.
(201
2b)
c All
num
bers
from
Mul
lis e
t al.
(201
2a)
d All
num
bers
from
Mar
tin e
t al.
(201
2)
Coun
try
Perc
enta
ges
(SE)
of 4
th-g
rade
stu
dent
s m
eetin
g in
tern
atio
nal b
ench
mar
ksa
Nat
iona
l mea
n (S
E) a
nd s
tand
ard
devi
atio
n
Hig
h in
tern
atio
nal b
ench
mar
kIn
term
edia
te in
tern
atio
nal
benc
hmar
kLo
w in
tern
atio
nal b
ench
mar
k
All
subj
ects
Read
ing
Mat
hsSc
ienc
eRe
adin
gM
aths
Scie
nce
All
subj
ects
Read
ing
Mat
hsSc
ienc
eRe
adin
gbM
aths
cSc
ienc
ed
Aus
tria
18 (1
.2)
39 (1
.5)
26 (1
.5)
42 (1
.6)
80 (0
.9)
70 (1
.9)
79 (1
.7)
92 (0
.8)
97 (0
.3)
95 (0
.8)
96 (0
.6)
529
(2.0
)63
508
(2.6
)63
532
(2.8
)70
Cze
ch R
epub
lic21
(1.1
)50
(1.4
)30
(1.5
)44
(1.5
)87
(0.9
)72
(1.3
81 (1
.1)
92 (0
.8)
98 (0
.5)
93 (0
.8)
97 (0
.7)
545
(2.2
)61
511
(2.4
)70
536
(2.5
)72
Finl
and
39 (1
.3)
63 (1
.3)
49 (1
.3)
65 (1
.7)
92 (0
.7)
85 (1
.2)
92 (0
.8)
97 (0
.5)
99 (0
.2)
98 (0
.4)
99 (0
.3)
568
(1.9
6454
5 (2
.3)
6857
0 (2
.6)
67
Ger
man
y23
(1.3
)46
(1.4
)37
(1.4
)39
(1.6
)85
(1.0
)81
(1.3
)78
(1.5
)94
(0.8
)98
(0.3
)97
(0.6
)96
(0.7
)54
1 (2
.2)
6652
8 (2
.2)
6252
8 (2
.9)
70
Hun
gary
28 (1
.3)
48 (1
.5)
37 (1
.4)
46 (2
.0)
81 (1
.2)
70 (1
.5)
78 (1
.5)
88 (1
.1)
95 (0
.7)
90 (1
.0)
93 (0
.9)
539
(2.9
)78
515
(3.4
)90
534
(3.7
86
Irela
nd25
(1.5
)53
(1.4
)41
(1.6
)35
(1.7
)85
(0.8
)77
(1.4
)72
(1.6
)90
(0.9
97 (0
.5)
94 (0
.6)
92 (0
.9)
552
(2.3
)75
527
(2.6
)78
516
(3.4
)79
Italy
18 (1
.1)
46 (1
.4)
28 (1
.4)
37 (1
.6)
85 (1
.1)
69 (1
.376
(1.3
)90
(0.9
)98
(0.4
)93
(0.8
)95
(1.0
)54
1 (2
.2)
6650
8 (2
.6)
7252
4 (2
.7)
74
Lith
uani
a21
(1.3
)39
(1.4
)43
(1.5
)31
(1.6
)80
(1.2
)79
(1.2
)73
(1.2
)92
(0.8
)97
(0.4
)96
(0.6
)95
(0.6
)52
8 (2
.0)
6653
4 (2
.4)
7451
5 (2
.4)
68
Mal
ta7
(0.4
)24
(0.7
)25
(0.9
)14
(0.7
)55
(0.8
)63
(0.8
)41
(1.0
)64
(0.9
)78
(0.6
)88
(0.6
)70
(1.1
)47
7 (1
.4)
9749
6 (1
.3)
7844
6 (1
.9)
98
Nor
ther
n Ire
land
29 (1
.4)
58 (1
.4)
59 (1
.4)
33 (1
.6)
87 (0
.9)
85 (1
.2)
74 (1
.3)
92 (0
.8)
97 (0
.6)
96 (0
.5)
94 (1
.0)
558
(2.4
)76
562
(2.9
)86
517
(2.6
)71
Pola
nd12
(0.8
)39
(1.2
)17
(1.1
)29
(1.5
)77
(0.9
)56
(1.3
)67
(1.2
)83
(1.0
)95
(0.5
)87
(0.9
)91
(0.8
)52
6 (2
.1)
7348
1 (2
.2)
7350
5 (2
.6)
78
Port
ugal
23 (1
.7)
47 (1
.8)
40 (1
.9)
35 (1
.8)
84 (1
.2)
80 (1
.7)
75 (2
.0)
93 (1
.1)
98 (0
.5)
97 (0
.6)
95 (1
.054
1 (2
.6)
6653
2 (3
.4)
6952
2 (3
.9)
73
Rom
ania
17 (1
.2)
32 (1
.6)
28 (1
.7)
37 (2
.3)
65 (2
.1)
57 (2
.2)
66 (2
.3)
73 (2
.1)
86 (1
.5)
79 (1
.9)
84 (1
.8)
502
(4.3
)91
482
(5.8
)10
550
5 (5
.9)
107
Slov
ak R
epub
lic21
(1.3
)44
(1.5
)30
(1.7
)44
(1.5
)79
(0.9
)69
(1.6
)81
(1.1
)89
(1.3
)95
(0.6
)90
(1.2
)97
(0.7
)53
5 (2
.8)
6950
7 (3
.8)
8053
2 (3
.8)
79
Slov
enia
20 (1
.3)
42 (1
.2)
31 (1
.4)
36 (1
.6)
79 (1
.2)
72 (1
.4)
74 (1
.3)
90 (0
.7)
95 (0
.6)
94 (0
.6)
93 (0
.6)
530
(2.0
)70
513
(2.2
)69
520
(2.7
)76
Spai
n9
(0.8
)31
(1.3
)17
(1.1
)28
(1.5
)72
(1.2
)56
(1.9
)67
(1.6
)82
(1.4
)94
(0.7
)87
(1.3
)92
(1.2
)51
3 (2
.3)
6848
2 (2
.9)
7050
5 (3
.0)
73
Swed
en18
(1.1
)47
(1.6
)25
(1.2
)44
(1.5
)85
(1.0
)69
(1.4
)79
(1.1
)91
(0.7
)98
(0.3
)93
(0.7
)95
(0.5
)54
2 (2
.1)
6550
4 (2
.0)
6753
3 (2
.7)
75
Page 4 of 23Wendt and Kasper Large-scale Assess Educ (2016) 4:14
What these correlations suggest is that high or low achievement in one subject is highly related with high or low achievement in the others. It also gives evidence for fur-ther investigation of achievement as a multidimensional construct. Thus the question arises how such relationships can be modeled and further investigated in an interna-tional comparative context.
Profiles of country specific strength and weaknesses in student achievement
Many studies making using from international large-scale assessment have investigated and established well defined profiles of students within one specific content domain or subject (Lie and Roe 2003; Grønmo et al. 2004; Olsen 2005; Angell et al. 2006). These studies show that the investigation of proficiency profiles enhances the knowledge of differences between countries and therefor provide valuable knowledge for the compar-isons of education systems. For example, Olsen (2005) models profiles to study cross-country variations in the response patterns in mathematics achievement for students participating in PISA 2003. With this approach Olsen was able to distinguish a so-called Nordic profile from a profile for English-speaking countries. For science Olsen (2005) found evidence for a North-West European profile using science cognitive items from PISA 2003.
So far, in all of these studies cluster analysis were performed based on the manifest item scores to derive domain-specific cross-country differences in so-called item specific strengths and weakness within a single achievement domain. It is far beyond the scope of this paper to discuss the methodical challenges that arise when only the item responses of the students are used as the dependent variable instead of the plausible values (and vise versa). However it seems worth to study the question which profile solutions result when the plausible values instead of the item responses are used as the dependent vari-able. Also, for investigations of profiles across achievement domains the multidimen-sional nature of the competencies domains should be taken into account when a profile solution is derived because the dimensions are usually highly correlated (see above).
Using an approach based on the plausible values of the students for the PIRLS/TIMSS 2011 combined sample, Mullis (2013) calculates the proportion of 4th-grade students who meet low and high international benchmarks in one, two, or all three of the com-petence domains by country. Mullis notes that, on the one hand, countries that have large proportions of 4th-graders meeting the high international benchmark in all three domains are best equipping their students for later learning. On the other hand, if any given country has a relative small proportion of students meeting the low international benchmark in any given subject, these would be the students who are considered “left behind” to the extent that schools are failing to teach them the skills that support later achievement. Combined with the information given in the International PIRLS/TIMSS-Reports (Martin et al. 2012; Mullis et al. 2012a, b; see Table 1) on mean achievement and proportions of students reaching different International Benchmarks, it can be found that in ten of the 17 EU-member countries participating in this study (Austria, Czech Republic, Finland, Hungary, Italy, Poland, Slovak Republic, Slovenia, Spain and Sweden), students seem to show a consistent subject-specific weakness in mathematics.
Page 5 of 23Wendt and Kasper Large-scale Assess Educ (2016) 4:14
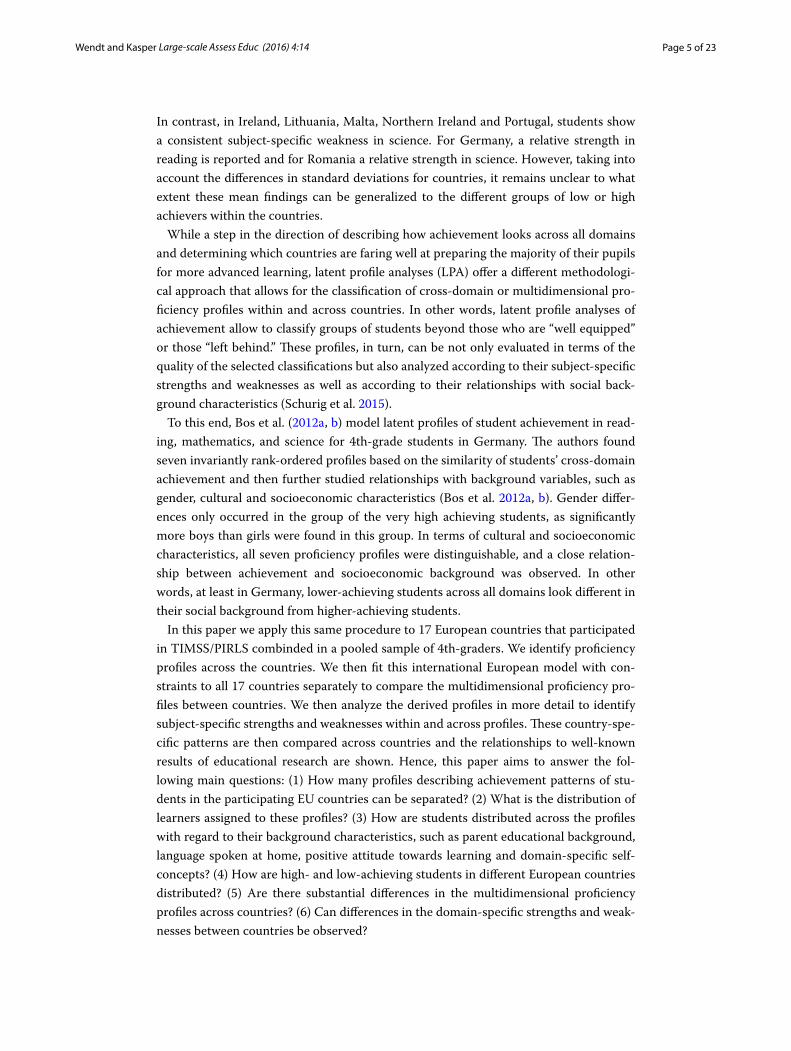
In contrast, in Ireland, Lithuania, Malta, Northern Ireland and Portugal, students show a consistent subject-specific weakness in science. For Germany, a relative strength in reading is reported and for Romania a relative strength in science. However, taking into account the differences in standard deviations for countries, it remains unclear to what extent these mean findings can be generalized to the different groups of low or high achievers within the countries.
While a step in the direction of describing how achievement looks across all domains and determining which countries are faring well at preparing the majority of their pupils for more advanced learning, latent profile analyses (LPA) offer a different methodologi-cal approach that allows for the classification of cross-domain or multidimensional pro-ficiency profiles within and across countries. In other words, latent profile analyses of achievement allow to classify groups of students beyond those who are “well equipped” or those “left behind.” These profiles, in turn, can be not only evaluated in terms of the quality of the selected classifications but also analyzed according to their subject-specific strengths and weaknesses as well as according to their relationships with social back-ground characteristics (Schurig et al. 2015).
To this end, Bos et al. (2012a, b) model latent profiles of student achievement in read-ing, mathematics, and science for 4th-grade students in Germany. The authors found seven invariantly rank-ordered profiles based on the similarity of students’ cross-domain achievement and then further studied relationships with background variables, such as gender, cultural and socioeconomic characteristics (Bos et al. 2012a, b). Gender differ-ences only occurred in the group of the very high achieving students, as significantly more boys than girls were found in this group. In terms of cultural and socioeconomic characteristics, all seven proficiency profiles were distinguishable, and a close relation-ship between achievement and socioeconomic background was observed. In other words, at least in Germany, lower-achieving students across all domains look different in their social background from higher-achieving students.
In this paper we apply this same procedure to 17 European countries that participated in TIMSS/PIRLS combinded in a pooled sample of 4th-graders. We identify proficiency profiles across the countries. We then fit this international European model with con-straints to all 17 countries separately to compare the multidimensional proficiency pro-files between countries. We then analyze the derived profiles in more detail to identify subject-specific strengths and weaknesses within and across profiles. These country-spe-cific patterns are then compared across countries and the relationships to well-known results of educational research are shown. Hence, this paper aims to answer the fol-lowing main questions: (1) How many profiles describing achievement patterns of stu-dents in the participating EU countries can be separated? (2) What is the distribution of learners assigned to these profiles? (3) How are students distributed across the profiles with regard to their background characteristics, such as parent educational background, language spoken at home, positive attitude towards learning and domain-specific self-concepts? (4) How are high- and low-achieving students in different European countries distributed? (5) Are there substantial differences in the multidimensional proficiency profiles across countries? (6) Can differences in the domain-specific strengths and weak-nesses between countries be observed?
Page 6 of 23Wendt and Kasper Large-scale Assess Educ (2016) 4:14
Tabl
e 2
Mea
n ac
hiev
emen
t and
per
cent
ages
for d
iffer
ent i
ndic
ator
s of
eco
nom
ic a
nd c
ultu
ral c
apit
al b
y co
untr
y
a Ach
ieve
men
t mea
ns b
ased
on
the
PIRL
S/TI
MSS
201
1 co
mbi
ned
data
set (
Foy
2013
) for
whi
ch a
chie
vem
ent m
easu
res
are
obta
ined
usi
ng a
mul
tidim
ensi
onal
sca
ling
appr
oach
com
bini
ng a
ll th
ree
subj
ects
. Ach
ieve
men
t m
eans
ther
efor
e di
ffer f
rom
thos
e in
the
TIM
SS a
nd P
IRLS
inte
rnat
iona
l rep
ort (
show
n in
Tab
le 1
) b Dat
a no
t ava
ilabl
e
Coun
try
kA
chie
vem
ent d
omai
naBa
ckgr
ound
cha
ract
eris
tics
of th
e st
uden
ts
Mat
hem
atic
sSc
ienc
eRe
adin
gSE
SPa
rent
. Edu
Book
sLa
ngua
ge
M(S
E)M
(SE)
M(S
E)%
(SE)
%(S
E)%
(SE)
%(S
E)
Aus
tria
4.58
750
5(2
.6)
528
(2.6
)51
2(2
.4)
6.5
(0.2
)6.
5(0
.2)
6.1
(0.2
)6.
5(0
.2)
Cze
ch R
epub
lic4.
433
508
(2.5
)53
3(2
.3)
530
(2.2
)6.
5(0
.2)
6.3
(0.2
)6.
0(0
.2)
6.3
(0.2
)
Finl
and
4.54
154
3(2
.3)
568
(2.2
)55
6(2
.0)
6.8
(0.2
)6.
3(0
.2)
6.2
(0.2
)6.
5(0
.2)
Ger
man
y3.
928
525
(2.2
)52
4(2
.3)
526
(2.4
)4.
6(0
.1)
4.3
(0.1
) 4.
8(0
.1)
5.1
(0.1
)
Hun
gary
5.14
951
2(3
.4)
531
(3.3
)52
4(3
.1)
6.8
(0.2
)6.
9(0
.2)
6.9
(0.2
)7.
4(0
.2)
Irela
nd4.
383
526
(2.8
)51
3(3
.1)
538
(2.7
)6.
0(0
.1)
6.1
(0.1
)5.
9(0
.1)
6.2
(0.1
)
Italy
4.12
550
4(2
.7)
520
(2.6
)52
7(2
.0)
5.7
(0.1
)5.
5(0
.1)
5.5
(0.1
)5.
9(0
.1)
Lith
uani
a4.
584
531
(2.6
)51
0(2
.4)
512
(2.0
)6.
1(0
.1)
6.3
(0.1
)6.
2(0
.1)
6.6
(0.1
)
Mal
ta3.
492
492
(1.3
)44
1(1
.9)
454
( .7)
4.4
(0.0
)4.
2(0
.0)
4.7
(0.0
)4.
9(0
.0)
Pola
nd4.
962
477
(2.3
)50
0(2
.2)
508
(2.1
)7.
1(0
.1)
7.2
(0.1
)6.
7(0
.1)
7.1
(0.1
)
Port
ugal
3.99
153
0(3
.4)
518
(3.8
)52
6(2
.9)
5.3
(0.3
)5.
6(0
.3)
5.4
(0.3
)5.
7(0
.3)
Rom
ania
4.64
347
6(6
.0)
501
(6.1
)48
1(4
.9)
5.7
(0.2
)6.
6(0
.2)
6.1
(0.2
)6.
6(0
.2)
Slov
ak R
epub
lic5.
561
503
(3.9
)52
8(3
.7)
519
(3.1
)7.
6(0
.2)
8.0
(0.2
)7.
5(0
.2)
7.9
(0.2
)
Slov
enia
4.43
351
0(2
.0)
516
(2.1
)51
4(2
.1)
6.4
(0.2
)6.
4(0
.2)
6.0
(0.1
) b
Spai
n4.
105
479
(2.8
)50
1(2
.7)
493
(2.8
)5.
5(0
.1)
5.4
(0.1
)5.
5(0
.1)
5.9
(0.1
)
Swed
en4.
482
502
(2.2
)53
0(2
.6)
527
(2.1
)6.
0(0
.2)
5.4
(0.2
)5.
9(0
.1)
6.4
(0.2
)
Nor
ther
n Ire
land
3.46
956
1(2
.7)
513
(2.5
)54
5(2
.4)
3.0
(0.1
)2.
8(0
.1)
4.7
(0.1
)5.
0(0
.1)
EU-c
ount
ry a
vera
ge74
.868
511
(0.7
)51
6(0
.7)
517
(0.6
)5.
9(0
.0)
5.9
(0.0
)5.
9(0
.0)
5.9
(0.0
)
Page 7 of 23Wendt and Kasper Large-scale Assess Educ (2016) 4:14
MethodsSample
We used representative data from the Progress in International Reading Literacy Study (PIRLS) 2011 and the Trends in International Mathematics and Science Study (TIMSS) 2011. Both studies are usually conducted independently of each other, executed in dif-ferent cycles and focusing on different outcomes. In 2011, however, the studies were in some countries conducted mutually, testing students in mathematics, science, and reading.
Overall, 37 countries and benchmark participants participated in PIRLS/TIMSS com-bined with samples of 4th graders. We used the data from k = 17 countries that both took part in TIMSS/PIRLS 2011 combined and were members of the European Union when data collection took place (i.e., Austria, Czech Republic, Finland, Germany, Hun-gary, Ireland, Italy, Lithuania, Malta, Northern Ireland, Poland, Portugal, Romania, Slo-vak Republic, Slovenia, Spain, and Sweden) as these countries follow a common strategic educational framework (Education and Training 2020 program; European Commission 2015). The 17 samples resulted in a total sample of n = 74,868 4th grade students from 2704 schools. Due to the sampling procedure implemented in PIRLS and TIMSS, it was ensured that the students in the different countries were all comparable regarding their age and their amount of schooling. All countries applied a strict sampling procedure to allow analyses of nationally representative data. Sample selection was strictly monitored in every country to preserve high quality sampling standards (for more details regarding the sampling procedure see Martin and Mullis 2012).
Data
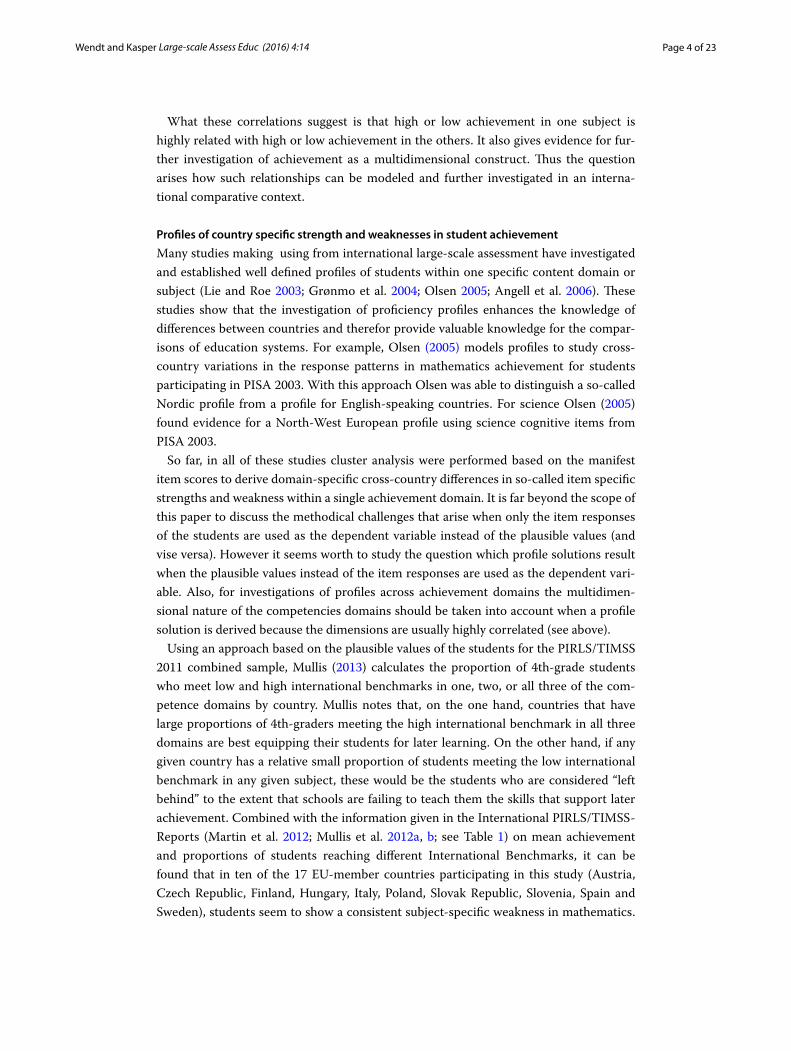
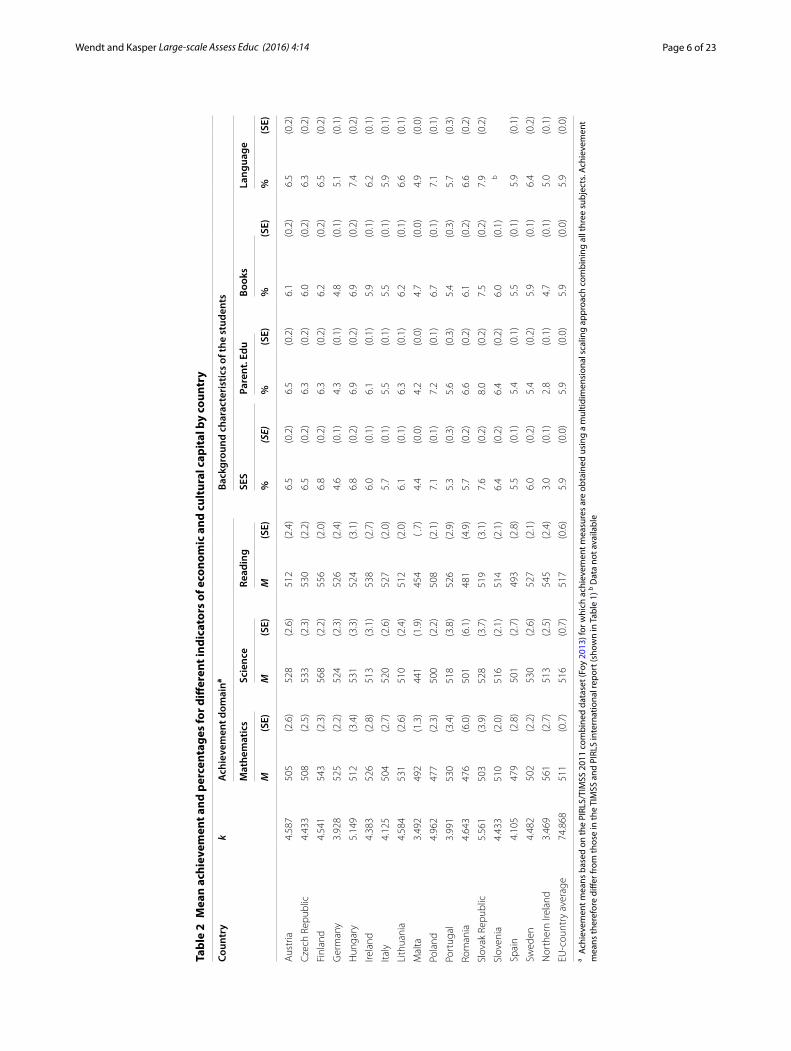
The combined international data sets of fourth grade students of all countries that par-ticipated in TIMSS/PIRLS 2011 are used.1 From these data sets, the country-specific data files ASG***B1 and ASH***B1 are used, where *** stands for a country specific code, ASG are the student background data files, and ASH are the corresponding home back-ground data files. These data files are first merged across data file sources and then com-bined across countries. For the multidimensional proficiency profiles of the students from the 17 countries, the plausible values in reading achievement, mathematic achieve-ment and science achievement (which are part of the ASG***B1 data sets) are analyzed. This scaling procedure differs from the one used for the international reports (Mullis et al. 2012a, b; Martin et al. 2012) as it preserves the correlational structure across the three subjects (multi dimensional model: for a detailed description of the scaling proce-dure and the use of plausible values, see Foy 2013). Each achievement scale is set to its own metric with an international mean of 500 and a standard deviation of 100. The dis-tribution of the students across countries together with sample statistics about charac-teristics of the students is shown in Table 2.
Latent profile models
For deriving the multidimensional proficiency profiles of the fourth grade students, latent profile analyses were conducted (Lazarsfeld and Henry 1968). In this method, the
1 These data sets are freely available under the URL: http://www.timss.bc.edu/timsspirls2011/international-database.html.
Page 8 of 23Wendt and Kasper Large-scale Assess Educ (2016) 4:14
multidimensional marginal distribution of achievement values of all students is sepa-rated into distinct conditional distributions, which are assumed to mix up to the mar-ginal distribution (thus this procedure is also known as mixture model). The distinct conditional distributions are called latent profiles, and these are normally characterized by their conditional means on the dimensions of the multidimensional distribution and by the percentage of students forming the profiles. However, as they are (at least theo-retically) infinite with many possible separations of the marginal distribution into condi-tional distributions, and because the (marginal as well as conditional) distributions are probabilistic in nature, the derived number of latent profiles and the assignment of the students to these profiles are probabilistic as well. Thus, for judging which of these dif-ferent possible separations of the marginal distribution into mixture distributions should be chosen, various fit criteria are available. In this study, the Akaike information crite-rion (AIC; Bozdogan 1987), and the sample-size adjusted Bayesian information criterion (CBIC; Schwarz 1978) are used. Smaller values of these criteria indicating a better fit of the assumed mixture. In addition, the classification error rate, entropie and pseudo-reliability for the final solution are calculated.
Using latent profile analysis, a four-step approach is established. In the first step, the total sample of students (n = 74,868) were separated into two to eight mixtures and the resulting seven different mixture distributions are compared based on the fit criteria (Model 1; international model). After deciding for a concrete mixture out of these seven mixtures, the conditional means of the profiles are calculated.
In the second step, these conditional means are introduced as fixed parameters in national latent profile analysis. That is, the country specific multidimensional marginal distribution of fourth grade student’s achievement values are separated into mixture dis-tributions, in which the number of mixtures and the means of the mixtures are fixed at the values from the international model (Model 2; country specific models with fixed means). Thus, how well the international model fits the national distributions could be assessed, and the probability distribution of the students across the profiles (that is, the percentage of students forming the profiles) could be estimated.
In the third step, the national models are again fitted, but this time the means of the conditional distributions are free parameters (Model 3; country specific models with free means). This allows for different profile patterns across countries.
In the final step, the so-called validation step, Model 1 was again fitted, but this time fixing the number of profiles and the means on the results of Model 1 and with inclusion of students’ background characteristics. Hence, the relationship between the derived international profiles and the background characteristics of the students could be esti-mated and compared.
Indicators for subject-specific strengths and weaknesses
The means of the profiles from Model 1 and Model 3 are used to derive four different indicators of subject-specific strengths and weaknesses. For the first indictor, three com-parisons of the conditional achievement mean values given profile X (X = 1, …, k; k number of assumed profiles) are performed for each model (and country) separately. The first comparison involves the difference between reading and mathematics achieve-ment, the second comparison involves the difference between reading and science
Page 9 of 23Wendt and Kasper Large-scale Assess Educ (2016) 4:14
achievement, and the third comparison involves the difference between mathematics and science achievement.
A subject-specific strength or weakness for subject Y in profile X is designated if the respective comparison results in a difference from at least 10 points, which is the aver-age standard error of the conditional mean across profiles and achievement domain given Model 1. Because there are three competence domains from which none could be the strongest, or from which only one could be the strongest, or in ordered pairs or ordered triples the strongest and the weakest, the procedure for designating subject-spe-cific strengths and weaknesses could result in 16 possible subject-specific achievement combinations or patterns within profiles, from which 13 combinations convey different meanings: (No differences (OOO), Relative strength in Reading (R); Relative strength in Reading and Mathematics (RM & MR, reported as RM), Relative strength in Reading, then in Mathematics and then in Science (RMS), Relative strength in Reading and Sci-ence (RS & SR, reported as RS), Relative strength in Reading, then in Science and then in Mathematics (RSM), Relative strength in Science (S), Relative strength in Science, then in Reading and then in Mathematics (SRM), Relative strength in Science, then in Mathematics and then in Reading (SMR), Relative strength in Mathematics (M), Relative strength in Mathematics and Science (MS & SM, reported as MS), Relative strength in Mathematics, then in Science and then in Reading (MSR) and Relative strength in Math-ematics, then in Reading and then in Science (MRS).
The second indictor (which we term, “mean within profile heterogeneity”) is the aver-age difference between achievement domains (given profile X) across profiles. This indi-cator could be interpreted as the average heterogeneity of achievement across subjects and profiles. Hence, a high value on the mean within profile heterogeneity indicating a large subject-specific strength or weakness, a value of zero indicates no measureable subject-specific strength or weakness.
For the third and fourth indicators, the difference between the mean of the highest profile and the lowest profile for each domain is calculated. To calculate the third indi-cator (mean-between profile variance), these three differences are averaged. For the fourth indicator (mean-between profile heterogeneity), the average absolute differences between this means (e.g. average deviation) is estimated. Hence, the third indicator des-ignated the overall distance between the lowest and highest profile across domains. A value of zero indicates perfect overlapping of the profiles. The fourth indicator could be interpreted as the degree to which the subject-specific differences across profiles are constant across domains. A value of zero on this indicator indicates that there are no subject-specific profile differences.
Analytic strategy
Because plausible values for the achievement domains are used, all analyses in this study were performed five times (for each plausible value once). The results of these analy-ses were combined according to the formula by Rubin (1987). "Senwgt" is used as the weighting variable for the international model, which sums up to a total sample size of students of 500 for each country. This produces equal weighting of the countries in the international profile model. For the country specific profile models, “houwgt” is used, which sums up to the observed sample size of students for every country. Unless
Page 10 of 23Wendt and Kasper Large-scale Assess Educ (2016) 4:14
otherwise stated, all the analyses for this paper were generated using Mplus Version 7.11 (Muthén and Muthén 1998–2012) in combination with the full information maximum likelihood approach.
Results and discussionLatent profile models
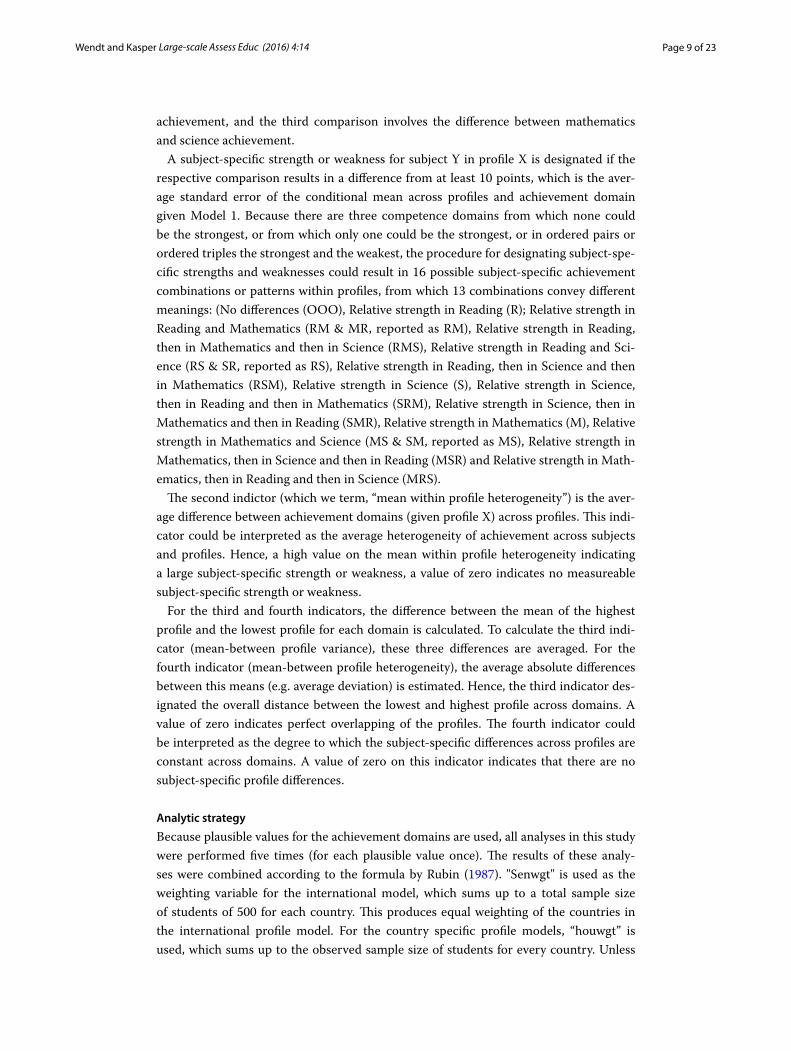
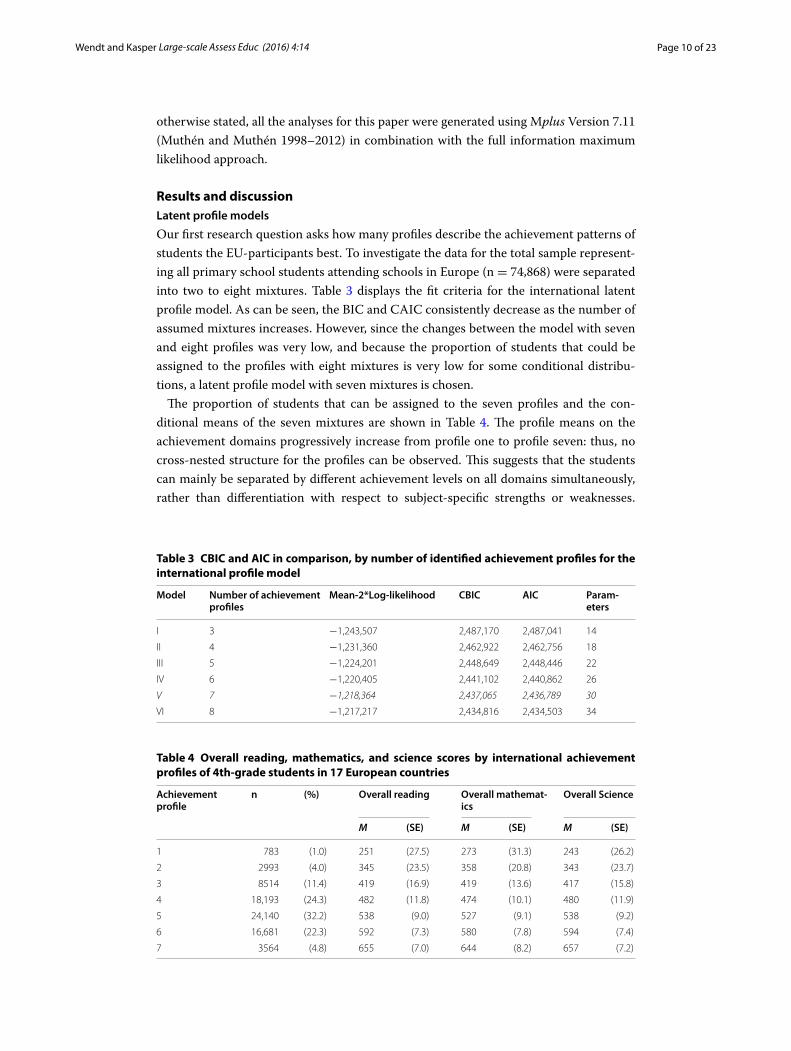
Our first research question asks how many profiles describe the achievement patterns of students the EU-participants best. To investigate the data for the total sample represent-ing all primary school students attending schools in Europe (n = 74,868) were separated into two to eight mixtures. Table 3 displays the fit criteria for the international latent profile model. As can be seen, the BIC and CAIC consistently decrease as the number of assumed mixtures increases. However, since the changes between the model with seven and eight profiles was very low, and because the proportion of students that could be assigned to the profiles with eight mixtures is very low for some conditional distribu-tions, a latent profile model with seven mixtures is chosen.
The proportion of students that can be assigned to the seven profiles and the con-ditional means of the seven mixtures are shown in Table 4. The profile means on the achievement domains progressively increase from profile one to profile seven: thus, no cross-nested structure for the profiles can be observed. This suggests that the students can mainly be separated by different achievement levels on all domains simultaneously, rather than differentiation with respect to subject-specific strengths or weaknesses.
Table 3 CBIC and AIC in comparison, by number of identified achievement profiles for the international profile model
Model Number of achievement profiles
Mean-2*Log-likelihood CBIC AIC Param-eters
I 3 −1,243,507 2,487,170 2,487,041 14
II 4 −1,231,360 2,462,922 2,462,756 18
III 5 −1,224,201 2,448,649 2,448,446 22
IV 6 −1,220,405 2,441,102 2,440,862 26
V 7 −1,218,364 2,437,065 2,436,789 30
VI 8 −1,217,217 2,434,816 2,434,503 34
Table 4 Overall reading, mathematics, and science scores by international achievement profiles of 4th-grade students in 17 European countries
Achievement profile
n (%) Overall reading Overall mathemat-ics
Overall Science
M (SE) M (SE) M (SE)
1 783 (1.0) 251 (27.5) 273 (31.3) 243 (26.2)
2 2993 (4.0) 345 (23.5) 358 (20.8) 343 (23.7)
3 8514 (11.4) 419 (16.9) 419 (13.6) 417 (15.8)
4 18,193 (24.3) 482 (11.8) 474 (10.1) 480 (11.9)
5 24,140 (32.2) 538 (9.0) 527 (9.1) 538 (9.2)
6 16,681 (22.3) 592 (7.3) 580 (7.8) 594 (7.4)
7 3564 (4.8) 655 (7.0) 644 (8.2) 657 (7.2)
Page 11 of 23Wendt and Kasper Large-scale Assess Educ (2016) 4:14
However, as shown later in the results, a more detailed look at the profiles reveals sepa-rable groups of students with relative subject-specific strengths and weaknesses.
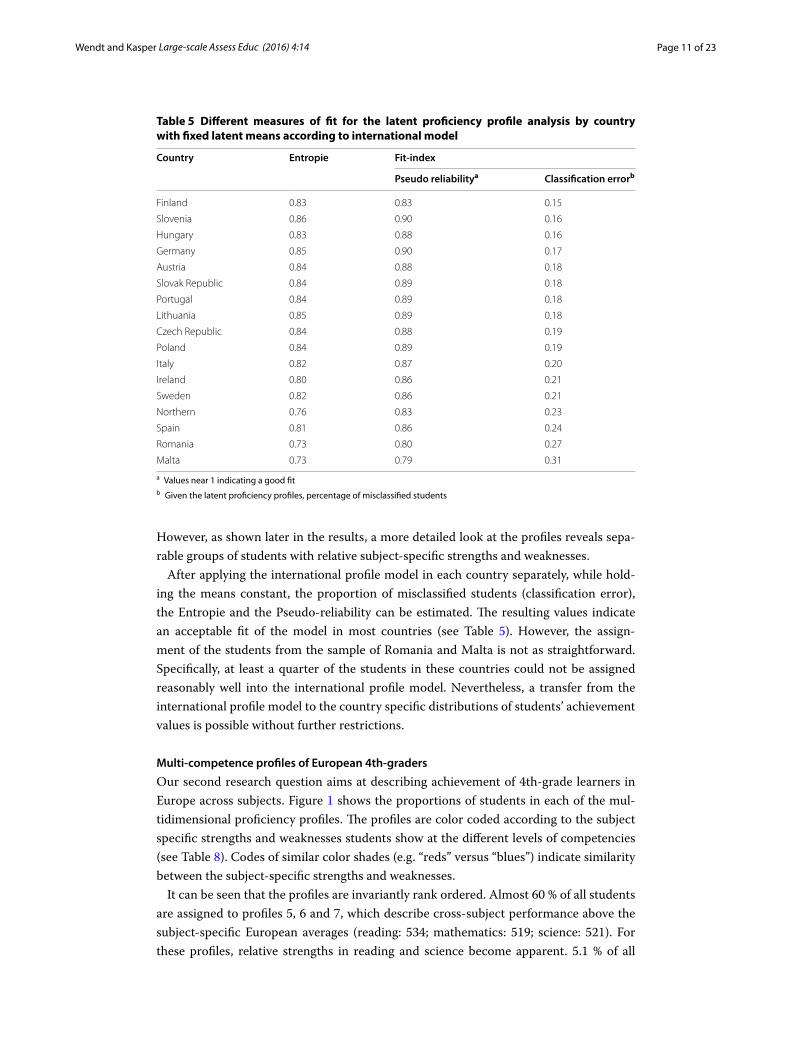
After applying the international profile model in each country separately, while hold-ing the means constant, the proportion of misclassified students (classification error), the Entropie and the Pseudo-reliability can be estimated. The resulting values indicate an acceptable fit of the model in most countries (see Table 5). However, the assign-ment of the students from the sample of Romania and Malta is not as straightforward. Specifically, at least a quarter of the students in these countries could not be assigned reasonably well into the international profile model. Nevertheless, a transfer from the international profile model to the country specific distributions of students’ achievement values is possible without further restrictions.
Multi-competence profiles of European 4th-graders
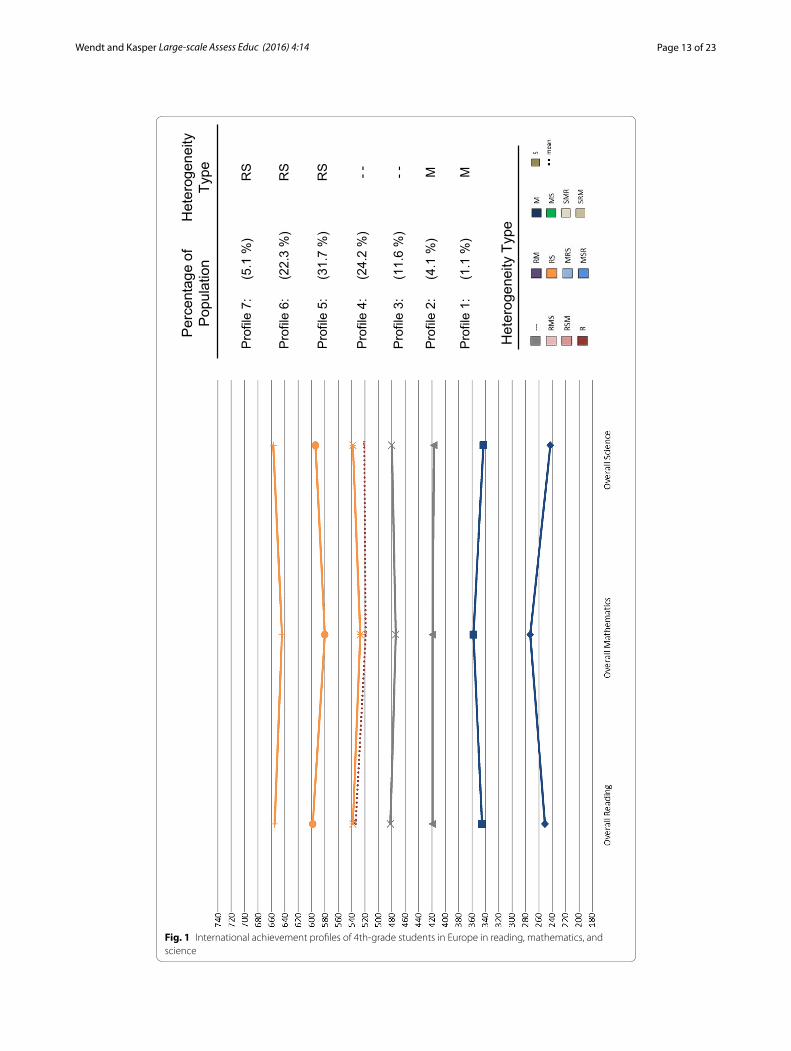
Our second research question aims at describing achievement of 4th-grade learners in Europe across subjects. Figure 1 shows the proportions of students in each of the mul-tidimensional proficiency profiles. The profiles are color coded according to the subject specific strengths and weaknesses students show at the different levels of competencies (see Table 8). Codes of similar color shades (e.g. “reds” versus “blues”) indicate similarity between the subject-specific strengths and weaknesses.
It can be seen that the profiles are invariantly rank ordered. Almost 60 % of all students are assigned to profiles 5, 6 and 7, which describe cross-subject performance above the subject-specific European averages (reading: 534; mathematics: 519; science: 521). For these profiles, relative strengths in reading and science become apparent. 5.1 % of all
Table 5 Different measures of fit for the latent proficiency profile analysis by country with fixed latent means according to international model
a Values near 1 indicating a good fitb Given the latent proficiency profiles, percentage of misclassified students
Country Entropie Fit-index
Pseudo reliabilitya Classification errorb
Finland 0.83 0.83 0.15
Slovenia 0.86 0.90 0.16
Hungary 0.83 0.88 0.16
Germany 0.85 0.90 0.17
Austria 0.84 0.88 0.18
Slovak Republic 0.84 0.89 0.18
Portugal 0.84 0.89 0.18
Lithuania 0.85 0.89 0.18
Czech Republic 0.84 0.88 0.19
Poland 0.84 0.89 0.19
Italy 0.82 0.87 0.20
Ireland 0.80 0.86 0.21
Sweden 0.82 0.86 0.21
Northern 0.76 0.83 0.23
Spain 0.81 0.86 0.24
Romania 0.73 0.80 0.27
Malta 0.73 0.79 0.31
Page 12 of 23Wendt and Kasper Large-scale Assess Educ (2016) 4:14
students are assigned to profile 7. These students show, with an average of 644 points for mathematics, 655 points for reading and 657 points for science, excellent results above the PIRLS/TIMSS Advanced International Benchmarks in all subjects. For profiles 3 and 4, which describe the cross-subject achievement patterns of 35.8 % of all students, no rel-ative strengths can be observed. For profiles 1 and 2, which describe achievement below the PIRLS/TIMSS Low International Benchmarks, a relative strength in mathematics is observable. However, only 5.2 % of all students can be assigned to these profiles.
Relationship between student traits and the European multi-competence proficiency
profiles
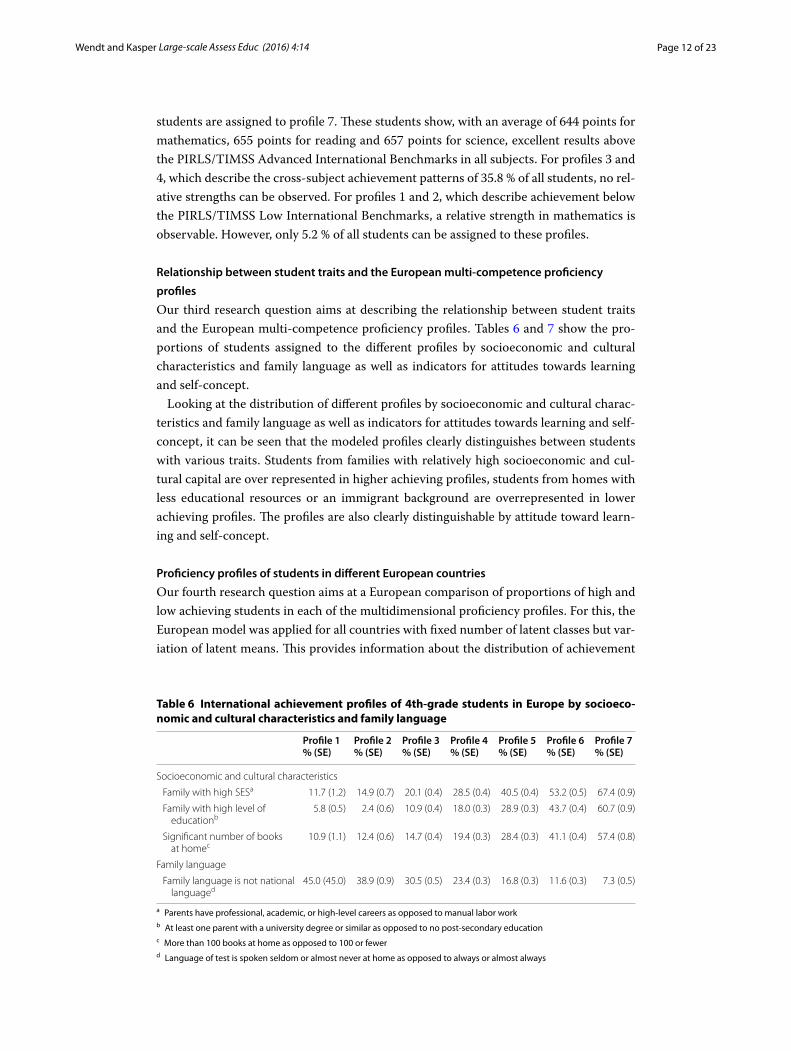
Our third research question aims at describing the relationship between student traits and the European multi-competence proficiency profiles. Tables 6 and 7 show the pro-portions of students assigned to the different profiles by socioeconomic and cultural characteristics and family language as well as indicators for attitudes towards learning and self-concept.
Looking at the distribution of different profiles by socioeconomic and cultural charac-teristics and family language as well as indicators for attitudes towards learning and self-concept, it can be seen that the modeled profiles clearly distinguishes between students with various traits. Students from families with relatively high socioeconomic and cul-tural capital are over represented in higher achieving profiles, students from homes with less educational resources or an immigrant background are overrepresented in lower achieving profiles. The profiles are also clearly distinguishable by attitude toward learn-ing and self-concept.
Proficiency profiles of students in different European countries
Our fourth research question aims at a European comparison of proportions of high and low achieving students in each of the multidimensional proficiency profiles. For this, the European model was applied for all countries with fixed number of latent classes but var-iation of latent means. This provides information about the distribution of achievement
Table 6 International achievement profiles of 4th-grade students in Europe by socioeco-nomic and cultural characteristics and family language
a Parents have professional, academic, or high‑level careers as opposed to manual labor workb At least one parent with a university degree or similar as opposed to no post‑secondary educationc More than 100 books at home as opposed to 100 or fewerd Language of test is spoken seldom or almost never at home as opposed to always or almost always
Profile 1% (SE)
Profile 2% (SE)
Profile 3% (SE)
Profile 4% (SE)
Profile 5% (SE)
Profile 6% (SE)
Profile 7% (SE)
Socioeconomic and cultural characteristics
Family with high SESa 11.7 (1.2) 14.9 (0.7) 20.1 (0.4) 28.5 (0.4) 40.5 (0.4) 53.2 (0.5) 67.4 (0.9)
Family with high level of educationb
5.8 (0.5) 2.4 (0.6) 10.9 (0.4) 18.0 (0.3) 28.9 (0.3) 43.7 (0.4) 60.7 (0.9)
Significant number of books at homec
10.9 (1.1) 12.4 (0.6) 14.7 (0.4) 19.4 (0.3) 28.4 (0.3) 41.1 (0.4) 57.4 (0.8)
Family language
Family language is not national languaged
45.0 (45.0) 38.9 (0.9) 30.5 (0.5) 23.4 (0.3) 16.8 (0.3) 11.6 (0.3) 7.3 (0.5)
Page 13 of 23Wendt and Kasper Large-scale Assess Educ (2016) 4:14
Per
cent
age
ofPo
pula
tion
Prof
ile 7
:(5
.1 %
)R
S
Prof
ile 6
:(2
2.3
%)
RS
Prof
ile 5
:(3
1.7
%)
RS
Prof
ile 4
:(2
4.2
%)
--
Prof
ile 3
:(1
1.6
%)
--
Prof
ile 2
:(4
.1 %
)M
Prof
ile 1
:(1
.1 %
)M
Het
erog
enei
tyTy
pe
Het
erog
enei
tyTy
pe
Fig. 1 International achievement profiles of 4th-grade students in Europe in reading, mathematics, and science
Page 14 of 23Wendt and Kasper Large-scale Assess Educ (2016) 4:14
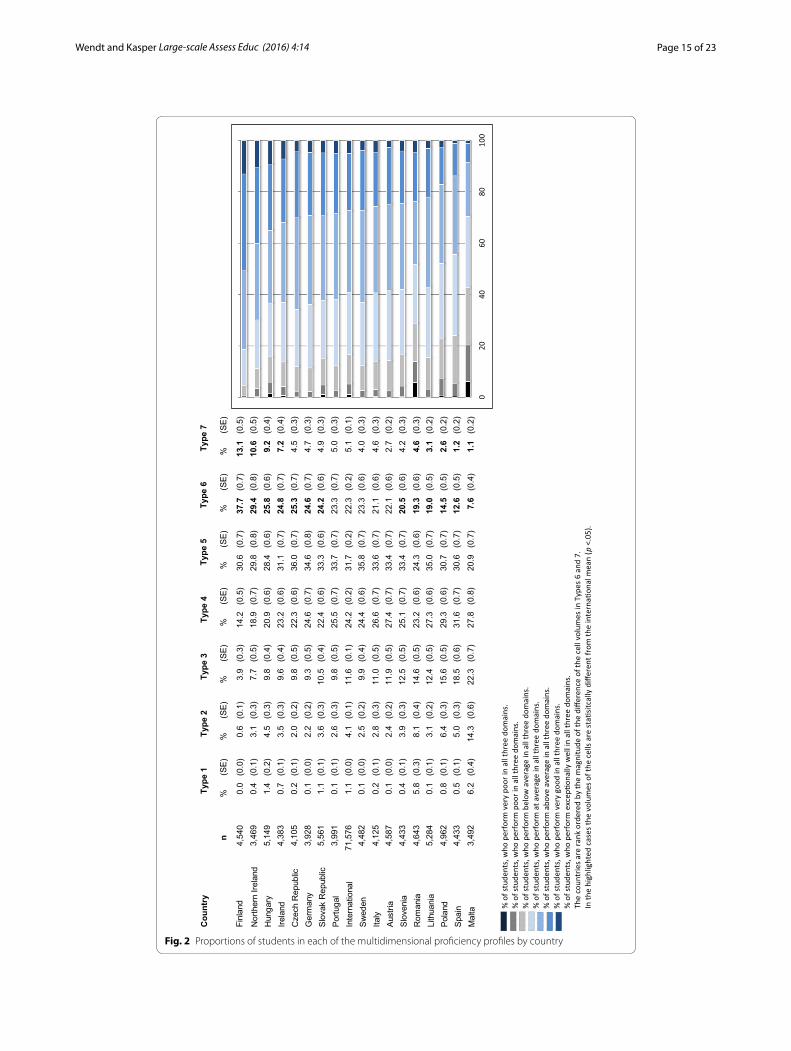
profiles in and between countries. In Fig. 2, these resulting proportions are shown for all profiles by country and for the European model. The results are presented in descending order according to the percentage of students in profiles 6 and 7.
It can be seen that, with the exception of Finland and Northern Ireland that have larger proportions of high achievers, in all countries about half of the students are assigned to profiles 4 and 5. The proportions of students in the profiles that describe the across subject performance of the high and low achievers vary substantially between coun-tries: Finland (13.1 %), Northern Ireland (10.6 %), Hungary (9.2 %) and Ireland (7.2 %) show the largest percentages of students who show excellent results in all three subjects (profile 7), whereas in all other countries, less than 5 % of all students show comparable results. Taking a look at the lower achieving profiles, Malta (20.5 %), Romania (13.9 %), Poland (7.2 %), Hungary (5.9 %) and Spain (5.5 %) show the largest percentages of stu-dents in profile 1 and 2. In all other countries, the percentage of these very low perform-ing students is below 5 %.
Frequencies of relative subject-specific achievement patterns
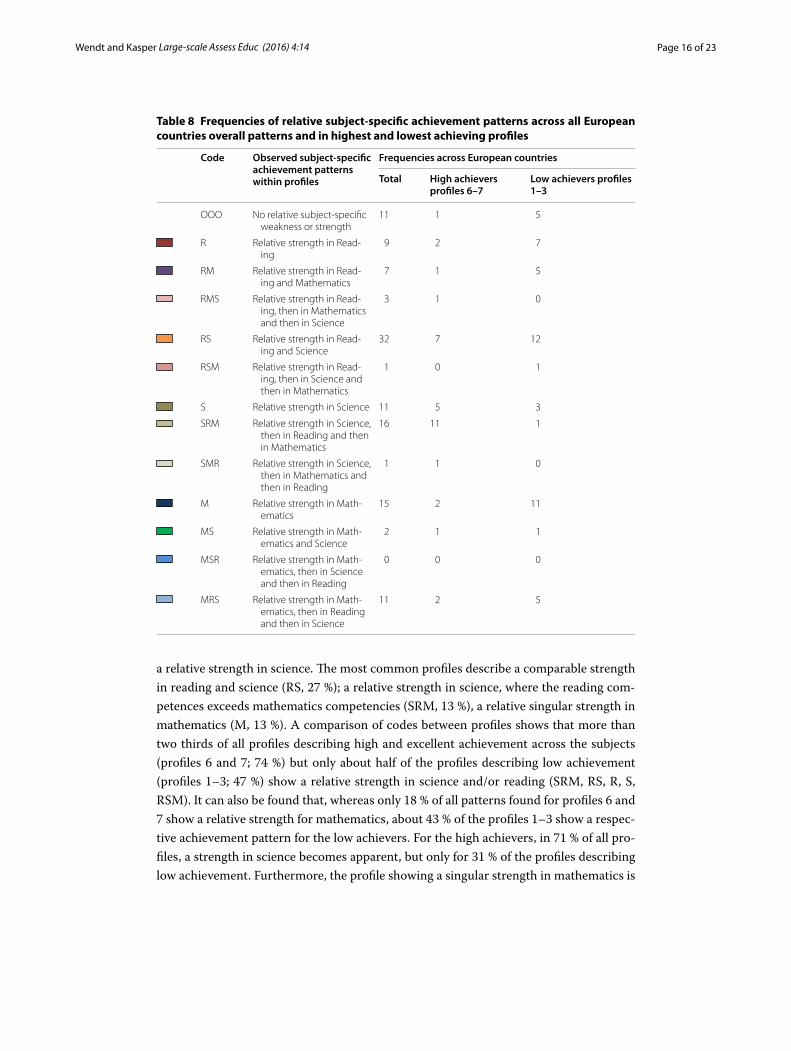
Our fifth research question aims identifying domain-specific strengths and weaknesses between countries. For this, the country-specific achievement profiles (n = 119) were coded according to the relative subject-specific achievement patterns (for country-spe-cific coding see Table 10; Additional file 1: Appendix S1). Table 8 shows the frequencies of relative subject-specific achievement patterns across all European countries in total and for the highest (profile 6–7) and lowest (profile 1–3) achieving profiles.
As shown in Table 8, for about 91 % of all profiles across all European countries, a sub-ject-specific strength or weakness for one or two subjects can be observed, when 10 point within profile achievement difference is considered substantial.2 11 % of all profiles describe a relative strength in reading, 22 % a relative strength in mathematics and 23 %
2 When a 20-point-difference is considered substantial 68 % of all profiles show a relative subject-specific strength or weakness for one or two subjects. When a 30-point-difference is considered substantial only 15 % of all profiles show a relative subject-specific strength or weakness for one or two subjects.
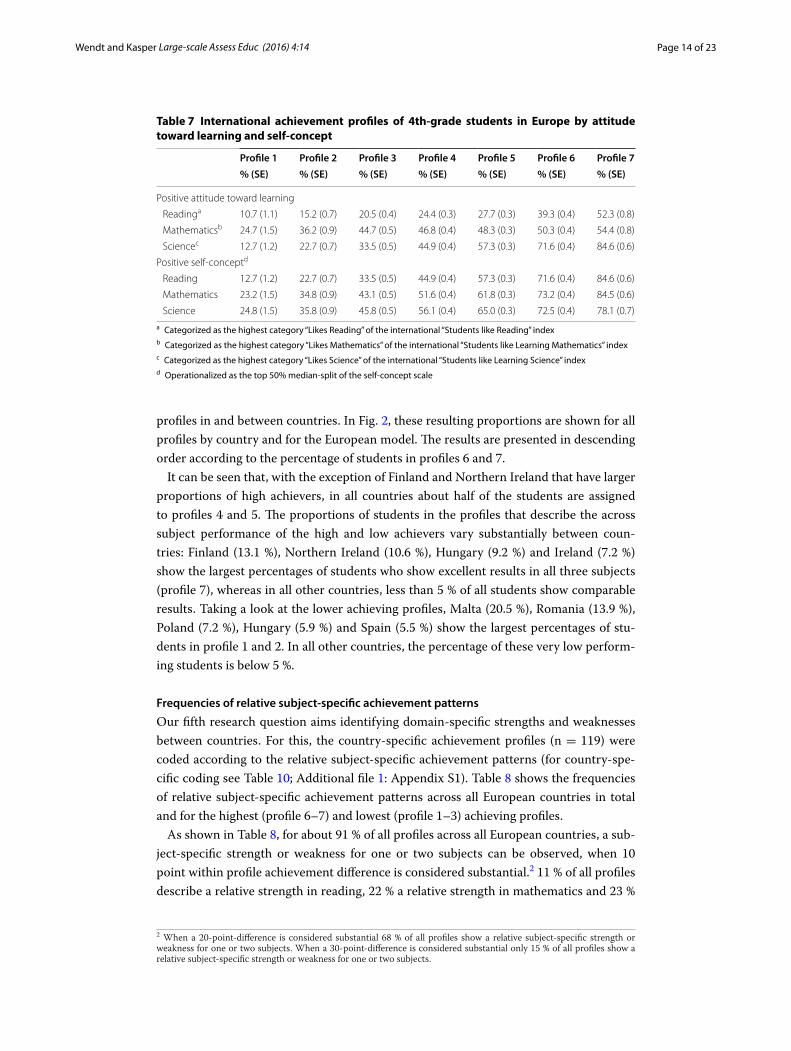
Table 7 International achievement profiles of 4th-grade students in Europe by attitude toward learning and self-concept
a Categorized as the highest category “Likes Reading” of the international “Students like Reading” indexb Categorized as the highest category “Likes Mathematics” of the international “Students like Learning Mathematics” indexc Categorized as the highest category “Likes Science” of the international “Students like Learning Science” indexd Operationalized as the top 50% median‑split of the self‑concept scale
Profile 1 Profile 2 Profile 3 Profile 4 Profile 5 Profile 6 Profile 7% (SE) % (SE) % (SE) % (SE) % (SE) % (SE) % (SE)
Positive attitude toward learning
Readinga 10.7 (1.1) 15.2 (0.7) 20.5 (0.4) 24.4 (0.3) 27.7 (0.3) 39.3 (0.4) 52.3 (0.8)
Mathematicsb 24.7 (1.5) 36.2 (0.9) 44.7 (0.5) 46.8 (0.4) 48.3 (0.3) 50.3 (0.4) 54.4 (0.8)
Sciencec 12.7 (1.2) 22.7 (0.7) 33.5 (0.5) 44.9 (0.4) 57.3 (0.3) 71.6 (0.4) 84.6 (0.6)
Positive self-conceptd
Reading 12.7 (1.2) 22.7 (0.7) 33.5 (0.5) 44.9 (0.4) 57.3 (0.3) 71.6 (0.4) 84.6 (0.6)
Mathematics 23.2 (1.5) 34.8 (0.9) 43.1 (0.5) 51.6 (0.4) 61.8 (0.3) 73.2 (0.4) 84.5 (0.6)
Science 24.8 (1.5) 35.8 (0.9) 45.8 (0.5) 56.1 (0.4) 65.0 (0.3) 72.5 (0.4) 78.1 (0.7)
Page 15 of 23Wendt and Kasper Large-scale Assess Educ (2016) 4:14
Cou
ntry
n%
(SE)
%(S
E)%
(SE)
%(S
E)%
(SE)
%(S
E)%
(SE)
Finl
and
4,54
00.
0(0
.0)
0.6
(0.1
)3.
9(0
.3)
14.2
(0.5
)30
.6(0
.7)
37.7
(0.7
)13
.1(0
.5)
Nor
ther
n Ire
land
3,46
90.
4(0
.1)
3.1
(0.3
)7.
7(0
.5)
18.9
(0.7
)29
.8(0
.8)
29.4
(0.8
)10
.6(0
.5)
Hun
gary
5,14
91.
4(0
.2)
4.5
(0.3
)9.
8(0
.4)
20.9
(0.6
)28
.4(0
.6)
25.8
(0.6
)9.
2(0
.4)
Irela
nd4,
383
0.7
(0.1
)3.
5(0
.3)
9.6
(0.4
)23
.2(0
.6)
31.1
(0.7
)24
.8(0
.7)
7.2
(0.4
)
Cze
ch R
epub
lic4,
105
0.2
(0.1
)2.
0(0
.2)
9.8
(0.5
)22
.3(0
.6)
36.0
(0.7
)25
.3(0
.7)
4.5
(0.3
)
Ger
man
y3,
928
0.1
(0.0
)2.
2(0
.2)
9.3
(0.5
)24
.6(0
.7)
34.6
(0.8
)24
.6(0
.7)
4.7
(0.3
)
Slov
ak R
epub
lic5,
561
1.1
(0.1
)3.
6(0
.3)
10.5
(0.4
)22
.4(0
.6)
33.3
(0.6
)24
.2(0
.6)
4.9
(0.3
)
Portu
gal
3,99
10.
1(0
.1)
2.6
(0.3
)9.
8(0
.5)
25.5
(0.7
)33
.7(0
.7)
23.3
(0.7
)5.
0(0
.3)
Inte
rnat
iona
l71
,576
1.1
(0.0
)4.
1(0
.1)
11.6
(0.1
)24
.2(0
.2)
31.7
(0.2
)22
.3(0
.2)
5.1
(0.1
)
Swed
en4,
482
0.1
(0.0
)2.
5(0
.2)
9.9
(0.4
)24
.4(0
.6)
35.8
(0.7
)23
.3(0
.6)
4.0
(0.3
)
Italy
4,12
50.
2(0
.1)
2.8
(0.3
)11
.0(0
.5)
26.6
(0.7
)33
.6(0
.7)
21.1
(0.6
)4.
6(0
.3)
Aust
ria4,
587
0.1
(0.0
)2.
4(0
.2)
11.9
(0.5
)27
.4(0
.7)
33.4
(0.7
)22
.1(0
.6)
2.7
(0.2
)
Slov
enia
4,43
30.
4(0
.1)
3.9
(0.3
)12
.5(0
.5)
25.1
(0.7
)33
.4(0
.7)
20.5
(0.6
)4.
2(0
.3)
Rom
ania
4,64
35.
8(0
.3)
8.1
(0.4
)14
.6(0
.5)
23.2
(0.6
)24
.3(0
.6)
19.3
(0.6
)4.
6(0
.3)
Lith
uani
a5,
284
0.1
(0.1
)3.
1(0
.2)
12.4
(0.5
)27
.3(0
.6)
35.0
(0.7
)19
.0(0
.5)
3.1
(0.2
)
Pola
nd4,
962
0.8
(0.1
)6.
4(0
.3)
15.6
(0.5
)29
.3(0
.6)
30.7
(0.7
)14
.5(0
.5)
2.6
(0.2
)
Spai
n4,
433
0.5
(0.1
)5.
0(0
.3)
18.5
(0.6
)31
.6(0
.7)
30.6
(0.7
)12
.6(0
.5)
1.2
(0.2
)
Mal
ta3,
492
6.2
(0.4
)14
.3(0
.6)
22.3
(0.7
)27
.8(0
.8)
20.9
(0.7
)7.
6(0
.4)
1.1
(0.2
)
Type
5Ty
pe 6
Type
7Ty
pe 2
Type
3Ty
pe 4
Ty
pe 1
% o
f stu
dent
s, w
ho p
erfo
rm v
ery
poor
in a
ll th
ree
dom
ains
.%
of st
uden
ts, w
ho p
erfo
rm p
oor i
n al
l thr
ee d
omai
ns.
% o
f stu
dent
s, w
ho p
erfo
rm b
elow
ave
rage
in a
ll th
ree
dom
ains
.%
of s
tude
nts,
who
per
form
at a
vera
ge in
all
thre
e do
mai
ns.
% o
f stu
dent
s, w
ho p
erfo
rm a
bove
ave
rage
in a
ll th
ree
dom
ains
.%
of s
tude
nts,
who
per
form
ver
y go
od in
all
thre
e do
mai
ns.
%of
stud
ents
, who
per
form
exc
ep�o
nally
wel
l in
all t
hree
dom
ains
.Th
e co
untr
iesa
re ra
nk o
rder
ed b
y th
e m
agni
tude
of t
he d
iffer
ence
of t
he c
ell v
olum
es in
Typ
es 6
and
7.
In th
ehi
ghlig
hted
cas
es th
e vo
lum
es o
f the
cel
ls ar
e st
a�sit
cally
diff
eren
t fro
m th
e in
tern
a�on
al m
ean
(p<.
05).
020
4060
8010
0
Fig. 2 Proportions of students in each of the multidimensional proficiency profiles by country
Page 16 of 23Wendt and Kasper Large-scale Assess Educ (2016) 4:14
a relative strength in science. The most common profiles describe a comparable strength in reading and science (RS, 27 %); a relative strength in science, where the reading com-petences exceeds mathematics competencies (SRM, 13 %), a relative singular strength in mathematics (M, 13 %). A comparison of codes between profiles shows that more than two thirds of all profiles describing high and excellent achievement across the subjects (profiles 6 and 7; 74 %) but only about half of the profiles describing low achievement (profiles 1–3; 47 %) show a relative strength in science and/or reading (SRM, RS, R, S, RSM). It can also be found that, whereas only 18 % of all patterns found for profiles 6 and 7 show a relative strength for mathematics, about 43 % of the profiles 1–3 show a respec-tive achievement pattern for the low achievers. For the high achievers, in 71 % of all pro-files, a strength in science becomes apparent, but only for 31 % of the profiles describing low achievement. Furthermore, the profile showing a singular strength in mathematics is
Table 8 Frequencies of relative subject-specific achievement patterns across all European countries overall patterns and in highest and lowest achieving profiles
Code Observed subject-specific achievement patterns within profiles
Frequencies across European countries
Total High achievers profiles 6–7
Low achievers profiles 1–3
OOO No relative subject-specific weakness or strength
11 1 5
R Relative strength in Read-ing
9 2 7
RM Relative strength in Read-ing and Mathematics
7 1 5
RMS Relative strength in Read-ing, then in Mathematics and then in Science
3 1 0
RS Relative strength in Read-ing and Science
32 7 12
RSM Relative strength in Read-ing, then in Science and then in Mathematics
1 0 1
S Relative strength in Science 11 5 3
SRM Relative strength in Science, then in Reading and then in Mathematics
16 11 1
SMR Relative strength in Science, then in Mathematics and then in Reading
1 1 0
M Relative strength in Math-ematics
15 2 11
MS Relative strength in Math-ematics and Science
2 1 1
MSR Relative strength in Math-ematics, then in Science and then in Reading
0 0 0
MRS Relative strength in Math-ematics, then in Reading and then in Science
11 2 5
Page 17 of 23Wendt and Kasper Large-scale Assess Educ (2016) 4:14
in 3 of 4 cases found among the profiles 1–3. Also, the profile showing a singular strength in reading is most commonly found among the profiles describing low achievers.
Similarities and differences in relative subject-specific achievement patterns
between countries
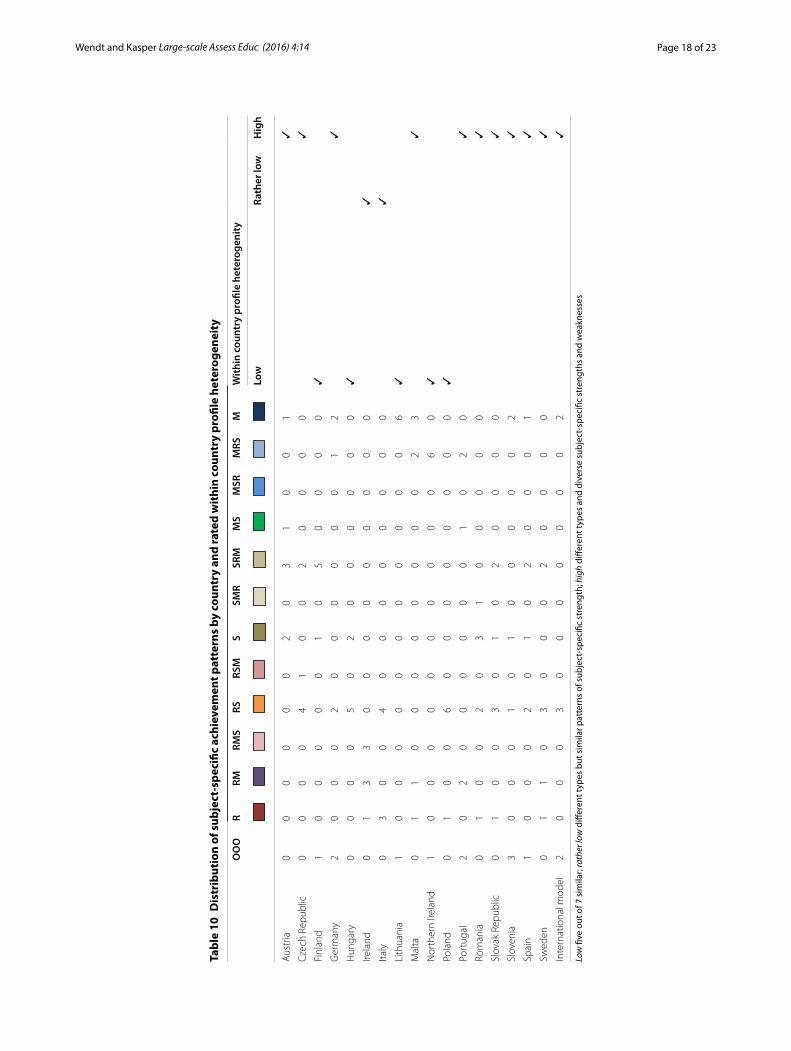
Our sixth research question aims at identifying similarities and differences in relative subject-specific achievement patterns between countries. To describes and compare the within-country differences of achievement profiles in terms of the size of achievement differences between subjects as well as the discrimination of the profiles between com-petence levels and subjects different indicators were defined (see section on indicators for subject-specific strengths and weaknesses).
In a second step, the distribution of subject-specific achievement patterns by coun-try was analyzed and rated according to the within-country profile heterogeneity. Here, the within-country profile heterogeneity was considered “low” when at least five out of seven profiles followed the same pattern of subject-specific strengths and weaknesses, “rather low” if there is a more variety of codes but the found patterns show an equal hierarchy of subjects, and “high” when there is a variety of codes and rather diverse sub-ject-specific strengths and weaknesses.
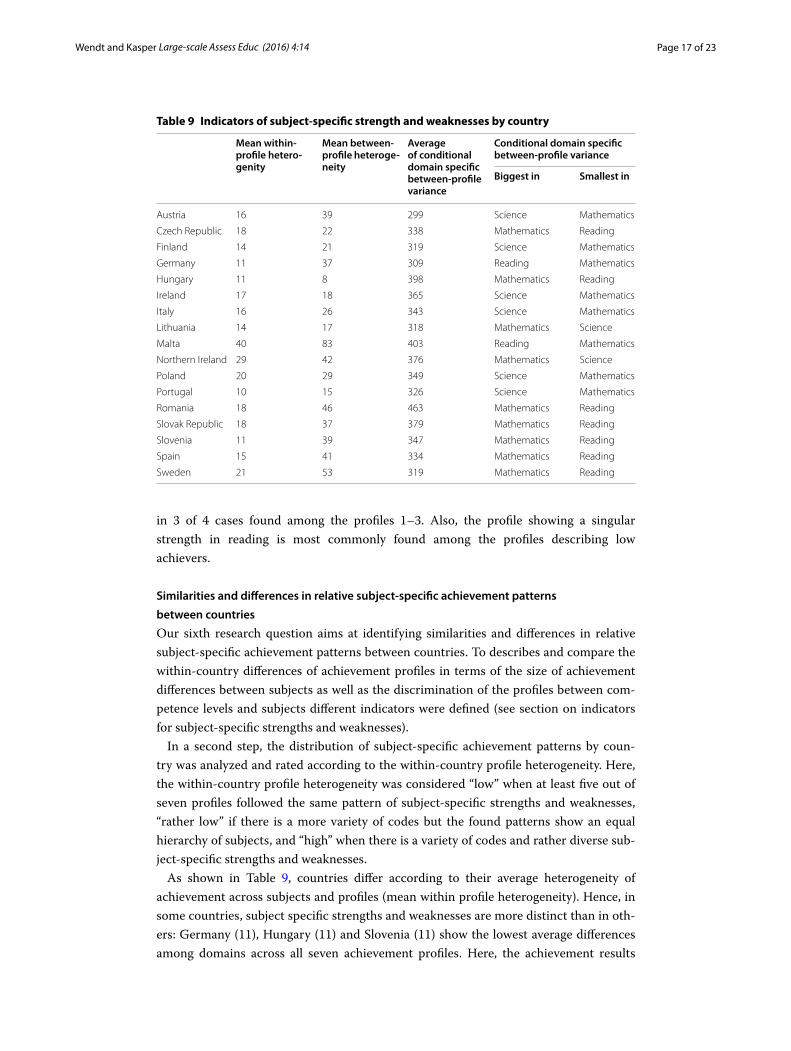
As shown in Table 9, countries differ according to their average heterogeneity of achievement across subjects and profiles (mean within profile heterogeneity). Hence, in some countries, subject specific strengths and weaknesses are more distinct than in oth-ers: Germany (11), Hungary (11) and Slovenia (11) show the lowest average differences among domains across all seven achievement profiles. Here, the achievement results
Table 9 Indicators of subject-specific strength and weaknesses by country
Mean within-profile hetero-genity
Mean between-profile heteroge-neity
Average of conditional domain specific between-profile variance
Conditional domain specific between-profile variance
Biggest in Smallest in
Austria 16 39 299 Science Mathematics
Czech Republic 18 22 338 Mathematics Reading
Finland 14 21 319 Science Mathematics
Germany 11 37 309 Reading Mathematics
Hungary 11 8 398 Mathematics Reading
Ireland 17 18 365 Science Mathematics
Italy 16 26 343 Science Mathematics
Lithuania 14 17 318 Mathematics Science
Malta 40 83 403 Reading Mathematics
Northern Ireland 29 42 376 Mathematics Science
Poland 20 29 349 Science Mathematics
Portugal 10 15 326 Science Mathematics
Romania 18 46 463 Mathematics Reading
Slovak Republic 18 37 379 Mathematics Reading
Slovenia 11 39 347 Mathematics Reading
Spain 15 41 334 Mathematics Reading
Sweden 21 53 319 Mathematics Reading
Page 18 of 23Wendt and Kasper Large-scale Assess Educ (2016) 4:14
Tabl
e 10
Dis
trib
utio
n of
sub
ject
-spe
cific
ach
ieve
men
t pat
tern
s by
cou
ntry
and
rate
d w
ithi
n co
untr
y pr
ofile
het
erog
enei
ty
Low
five
out
of 7
sim
ilar;
rath
er lo
w d
iffer
ent t
ypes
but
sim
ilar p
atte
rns
of s
ubje
ct‑s
peci
fic s
tren
gth;
hig
h di
ffere
nt ty
pes
and
dive
rse
subj
ect‑
spec
ific
stre
ngth
s an
d w
eakn
esse
s
OO
OR
RMRM
SRS
RSM
SSM
RSR
MM
SM
SRM
RSM
With
in c
ount
ry p
rofil
e he
tero
geni
ty
Low
Rath
er lo
wH
igh
Aus
tria
00
00
00
20
31
00
1✓
Cze
ch R
epub
lic0
00
04
10
02
00
00
✓Fi
nlan
d1
00
00
01
05
00
00
✓G
erm
any
20
00
20
00
00
01
2✓
Hun
gary
00
00
50
20
00
00
0✓
Irela
nd0
13
30
00
00
00
00
✓Ita
ly0
30
04
00
00
00
00
✓Li
thua
nia
10
00
00
00
00
00
6✓
Mal
ta0
11
00
00
00
00
23
✓N
orth
ern
Irela
nd1
00
00
00
00
00
60
✓Po
land
01
00
60
00
00
00
0✓
Port
ugal
20
20
00
00
01
02
0✓
Rom
ania
01
00
20
31
00
00
0✓
Slov
ak R
epub
lic0
10
03
01
02
00
00
✓Sl
oven
ia3
00
01
01
00
00
02
✓Sp
ain
10
00
20
10
20
00
1✓
Swed
en0
11
03
00
02
00
00
✓In
tern
atio
nal m
odel
20
00
30
00
00
00
2✓
Page 19 of 23Wendt and Kasper Large-scale Assess Educ (2016) 4:14
across the domains within a profile are rather homogeneous and only minor specific strengths and weaknesses are observed. In contrast, in Malta (40), Northern Ireland (29), Sweden (21) and Poland (20), subject-specific strengths and weaknesses can be observed much more frequently.
The column headed “Average of conditional domain specific between profile vari-ance” shows the overall distances between the lowest and highest profile across domains (shown in Table 10). The values between 299 and 463 indicate that in all countries, the profiles overall cover quite a big range of different achievement levels. Interestingly, in more than half of the countries, the largest difference between the mean of the highest profile and the mean of lowest profile can be found for mathematics whereas only for two countries (Malta and Germany), the largest between-profile variance can be found for reading.
Also the degree to which the domain-specific differences across profiles are constant across domains is shown in Table 9 (mean between-profile heterogeneity). Hungary (8), Lithuania (17) Ireland (18), Finland (21) and the Czech Republic (22) show the smallest differences among the European countries, whereas in Malta (83), Sweden (53), Romania (46) and Spain (41) the biggest differences can be found.
As shown in Table 10 the distributions of achievement patterns vary consider-ably between countries. Looking at the distributions within countries, seven countries exhibit low or rather low heterogeneity, whereas the ten other countries exhibit high. For Finland, Lithuania, Northern Ireland and Poland, the country-specific achievement profile across subjects follows the same pattern at all levels of competencies. Only profile 1 diverges, though it represents the achievement of 1.0–2.6 % of learners at the lowest end of the scale. Here, no differences between the subjects could be found. However, the profiles do differ between countries: In Finland, students at all achievement levels show relative strength in science followed by reading. In Lithuania, students at all levels are stronger in mathematics, whereas science is a clear weakness in Poland and in Northern Ireland in Hungary, for the high achievers (profile 7 and 6), a relative strength in science followed by reading is observed, whereas for all other profiles, students perform equally well in science and reading. For Ireland a relative strength in reading followed by math-ematics. In Italy, a relative strength in reading followed by science is visible. In both the Czech Republic and Sweden a higher degree of heterogeneity a relative strength in sci-ence followed by reading can be found.
For countries with a high degree of within country profile heterogeneity, two groups can be distinguished: in Austria, Germany, Malta, Slovenia and Spain, low performers show a relative strength in mathematics whereas high achievers show a relative strength in reading and science. In the Slovak Republic and Romania, a relative strength in sci-ence is found for the high achievers whereas low achievers show a relative strength in reading.
ConclusionsIn public debates, students are often described as learners with specific strengths or weaknesses in one specific learning area. However, several studies show that achieve-ment results in mathematics, reading literacy and science are highly correlated. In this article we aim at exploring multidimensional proficiency patterns of fourth-grade
Page 20 of 23Wendt and Kasper Large-scale Assess Educ (2016) 4:14
students in Europe across achievement results in reading, mathematics and science. The joint assessment of PIRLS-2011 and TIMSS-2011 in a representative sample of grade-4 students provides a unique dataset to discover common structures across achievement domains and groups of learners with different achievement patterns.
To generate an achievement typology to describe patterns across the three domains, a latent profile analysis (LPA) was performed on the plausible values of the students over-all and by country. All models show a reasonable fit and, in almost all countries, at least 75 % of the students can be reasonably described by the found achievement profiles. These profiles provide an informative approach to identifying and comparing propor-tions of learners at different levels of competences. Our findings on the proportions of low- and high-achieving students are consistent with the findings from Mullis (2013). An additional strength of the profiles is that they can be further explored according to their relationship(s) to different student traits. Here, we find that the profiles were highly distinguishable with regard to their background characteristics and consistent with the findings reported in the international reports. This supports the claim that the profiles allow a useful description of variation between countries on a singular outcome.
In addition, modeling by achievement profiles within countries allows to investigate patterns of achievement by subject-specific strengths and weaknesses. Based on the derivable patterns, a comparison between subject–specific achievement patterns across different proficiencies can reveal differences.
Concerning subject-specific strengths and weaknesses for both the European as well as in the country models, we find no cross-nested structure for the profiles. Hence, achievement across domains can be rather explained by a general level of achievement than subject-specific strengths or weaknesses of learners which suggest that the educa-tion systems of the analyzed member states of the European Union are doing a good job in providing balanced education for their students regardless the profile level. However, some subject-specific strengths and weaknesses can be identified but these are—with the exception of Malta and Northern Ireland—for most of the countries rather small. For the European model, it can be shown that those students who perform above aver-age have a relative strength in reading and science, where low-performing students show a relative strength in mathematics. However, it can also be shown that this international pattern only represents the patterns of Austria, Germany, Malta, Slovenia and Spain rather well. For about half of the countries, a rather uniform pattern of subject-specific strengths and weaknesses can be found on all competence levels. For these countries, it can be stated that they are educating their all their students more successfully in one or two subjects than in the other(s). The subject itself varies between the countries. The country profiles were further distinguished according to their degree of within- and between-profile heterogeneity. Here, for countries with a relatively larger proportion of high achievers (Hungary, Finland, Czech Republic, Northern Ireland), the same pattern of strengths and weaknesses can be identified for all profiles and—with the expectation of Northern Ireland—the degree of the differences within profiles is rather small. This and the finding that profiles that describe a singular strength in mathematics or reading are overrepresented among the low achievers, might suggest that a successful education for all with a sufficient number of high-achievers requires a solid educational basis in all
Page 21 of 23Wendt and Kasper Large-scale Assess Educ (2016) 4:14
subjects. However, the results also support the finding that high achievers show relative strength in science and to a lesser extent in reading.
In order to study various within- and between-country-differences in proficiency pat-terns we classified a 10 point within-profile difference in achievement between domains as substantial. We choose this criterion because 10 points is exactly the average stand-ard error of the (conditional) mean across profiles and achievement domain. Thus, only differences at or above one (average) standard error are considered as relevant in this paper. Also this criterion is somewhat arbitrary: differences less than 10 points should surely not be seen as relevant taken the sampling error (as expressed by the standard error) of the plausible values (and the profile solutions) into account. Therefore the 10 points can be seen as a lower threshold for comparing relative subject-specific strength and weakness. With this lower threshold, about 9 out of 10 profiles where considered to reveal a subject-specific strength or weakness. If a higher threshold is used (for example differences at or above two standard errors) then still 68 % of all profiles would have been considered to reveal a subject-specific strength or weakness. That is, the reported results in this paper will not change considerably even when a higher threshold is used to derive subject-specific strength or weakness. Nevertheless further research is needed to investigate the sensitivity of the herein derived test statistic with respect to different threshold criterions.
In addition the presented results on within-and between-countries differences with regard to subject-specific strength and weaknesses should not be over interpreted. However from an international comparative perspective it might be of interest to fur-ther understand why some countries show rather homogenous patterns of strengths and weaknesses for all students regardless of the proficiency levels, whereas in other coun-tries the subject-specific strengths and weaknesses differ between low and high-achiev-ing students.
What could be further research directions? Generally, it will be highly challenging to develop a coherent framework for deriving useful indictors that explains subject-specific strengths and weakness within profiles, between profiles and across countries. Among others, such indicators should be derived from input factors (e.g. instructional time) and process factors (e.g. cross-cultural differences in emphasis of subjects). The ques-tion arises whether research traditions from economics could be helpful here to. From a statistical point of view, it seems highly challenging to introduce the classes (schools) as a cluster factor in the mixture models, as they are usually only small samples within the classes (schools). Nevertheless, the correlation structure of large-scale assessment samples calls for such techniques. In addition, explaining the variance of profiles within a country and across schools could provide highly valuable information. Furthermore, the extensions of the latent mixture model to the subscales of PIRLS (reading pur-poses; comprehension processes) and TIMSS (content domains; cognitive demands) seem worth consideration. Finally, the interdependent relationship between the well-established benchmarks and the newly developed proficiency profiles could be further studied.
Page 22 of 23Wendt and Kasper Large-scale Assess Educ (2016) 4:14
AbbreviationsLPA: latent profile analysis; PIRLS: Progress in International Reading Literacy Study; TIMSS: Trends in International Math-ematics and Science Study.
Authors’ contributionsHW: conception and design, acquisition of data & drafting the article; DK perfomed the analysis. Both authors interpre-tated of data, revised the manuscript critically for important intellectual content and approved the final manuscript.
Competing interestsThe authors declare that they have no competing interests.
Received: 1 November 2015 Accepted: 3 August 2016
ReferencesAngell, C., Kjærnsli, M., & Lie, S. (2006). Curricular and cultural effects in patterns of students’ responses to TIMSS science
items. In S. J. Howie & T. Plomp (Eds.), Contexts of learning mathematics and science: lessons learned from TIMSS (pp. 277–290). London: Routledge.
Baumert, J., Klieme, E., Neubrand, M., Prenzel, M., Schiefele, U., Schneider, W., et al. (2000). Die Fähigkeit zum Selbstreguli-erten Lernen als fächerübergreifende Kompetenz. Berlin: Max-Planck-Institut für Bildungsforschung.
Bergold S, Wendt H, Kasper D,Steinmayr R. (2016). Academic Competencies: Their Interrelatedness and Gender Differ-ences at Their High End. Journal of Educational Psychology 108(6)
Bos, W., Wendt, H., Ünlü, A., Valtin, R., Euen, B., Kasper, D., et al. (2012b). Leistungsprofile von Viertklässlerinnen und Viertklässlern in Deutschland [Achievement profiles of fourth-graders in Germany]. In W. Bos, H. Wendt, O. Köller, & C. Selter (Eds.), TIMSS 2011. Mathematische und naturwissenschaftliche Kompetenzen von Grundschulkindern in Deutschland im internationalen Vergleich (pp. 269–301). Münster: Waxmann.
Bos, W., Wendt, H., Ünlü, A., Valtin, R., Euen, B., Kasper, D., & Tarelli, I. (2012a). Leistungsprofile von Viertklässlerinnen und Viertklässlern in Deutschland Deutschland [Achievement profiles of fourth-graders in Germany]. In W. Bos, I. Tarelli, A. Bremerich-Vos, & K. Schwippert (Hrsg.), IGLU 2011. Lesekompetenzen von Grundschulkindern in Deutschland im internationalen Vergleich (pp. 227–257). Münster [u.a.]: Waxmann.
Bozdogan H. (1987). Model selection and Akaike’s Information Criterion (AIC): The general theory and its analytical exten-sions. Psychometrika 52 (3):345–370.
Byrnes, J. P., & Miller, D. C. (2007). The relative importance of predictors of math and science achievement: an opportunity-propensity analysis. Contemporary Educational Psychology, 32, 599–629. doi:10.1016/j.cedpsych.2006.09.002.
Chung, K. K. H. (2015). Socioeconomic status and academic achievement. In J. D. Wright (Series Eds.) & C. Byrne, P. Schmidt, & C. McBride-Chang (Vol. Eds.), International encyclopedia of the social and behavioral sciences: education (pp. 924–930). Philadelphia: Elsevier.
European Commission. (2015). Strategic framework—education and training 2020. http://www.ec.europa.eu/education/policy/strategic-framework/index_en.htm.
Foy, P. (2013). TIMSS and PIRLS 2011 user guide for the fourth grade combined international database. Chestnut Hill: TIMSS & PIRLS International Study Center, Boston College.
Grønmo, L. S., Kjærnsli, M., & Lie, S. (2004). Looking for cultural and geographical factors in patterns of response to TIMSS items. In C. Papanastasiou (Ed.), Proceedings of the IRC-2004 TIMSS (Vol. 1, pp. 99–112). Nicosia: Cyprus University Press.
Gudjons, H. & Traub, S. (2012). Pädagogisches Grundwissen. Überblick—Kompendium—Studienbuch (UTB Pädagogik, Bd. 3092, 11., grundlegend überarb. Aufl). Bad Heilbrunn: Klinkhardt.
Jonen, A. & Jung, J. (2007). SINUS-Transfer Grundschule Naturwissenschaften Modul G 6: Fächerübergreifend und fächerverbin-dend unterrichten, IPN. Zugriff am 05.03.2015. Verfügbar unter. http://www.sinus-transfer.uni-bayreuth.de/fileadmin/MaterialienIPN/G6_gesetzt.pdf.
Kellaghan, T. (2015). Family and schooling. In J. D. Wright (Series Eds.), C. Byrne, P. Schmidt, & C. McBride-Chang (Vol. Eds.), International encyclopedia of the social and behavioral sciences: education (pp. 751–757). Philadelphia: Elsevier.
Lazarsfeld, P. F., & Henry, N. W. (1968). Latent structure analysis. Boston: Houghton Mifflin.Lenzen, D. (1996). Handlung und Reflexion. Von pädagogischen Theoriedefizit zur reflexiven Erziehungswissenschaft. Wein-
heim: Beltz.Lie, S., & Roe, A. (2003). Unity and diversity of reading literacy profiles. In S. Lie, P. Linnakylä, & A. Roe (Eds.), Northern lights
on PISA (pp. 147–157). Oslo: Department of Teacher Education and School Development, University of Oslo.Martin, M. O., & Mullis, I. V. S. (Eds.). (2012). Methods and procedures in TIMSS and PIRLS 2011. Chestnut Hill: TIMSS & PIRLS
International Study Center, Boston College.Martin & Mullis (2013). TIMSS and PIRLS 2011: relationship among reading, mathematics and science achievement at the
fourth grade. Implications for early learning. Chestnut Hill: International Study Center, Lynch School of Education, Boston College.
Additional file
Additional file 1. Appendix S1. Additional figures.
Page 23 of 23Wendt and Kasper Large-scale Assess Educ (2016) 4:14
Martin, M. O., Mullis, I. V. S., Foy, P., & Stanco, G. M. (2012). TIMSS 2011 international results in science. Chestnut Hill: TIMSS & PIRLS International Study Center, Boston College.
Mullis, I. V. S. (2013). Profiles of achievement across reading, mathematics, and science at the fourth grade. In M. O. Martin & I. V. S. Mullis (Eds.), TIMSS and PIRLS 2011: relationships among reading, mathematics, and science achievement at the fourth grade—implications for early learning. Chestnut Hill: TIMSS & PIRLS International Study Center, Boston College.
Mullis, I. V. S., Martin, M. O., Foy, P., & Arora, A. (2012a). TIMSS 2011 international results in mathematics. Chestnut Hill: TIMSS & PIRLS International Study Center, Boston College.
Mullis, I. V. S., Martin, M. O., Foy, P., & Drucker, K. T. (2012b). PIRLS 2011 international results in reading. Chestnut Hill: TIMSS & PIRLS International Study Center, Boston College.
OECD. (2014). PISA 2012 results: What students know and can do: student performance in mathematics, reading and science (Vol. 1, revised ed.). OECD Publishing.
Olsen, R. V. (2005). An exploration of cluster structure in scientific literacy in PISA: evidence for a Nordic dimension? Nordina, 1(1), 81–94.
Petersen, W. H. (2000). Fächerverbindender Unterricht. Begriff—Konzept—Planung—Beispiele; ein Lehrbuch (EGS-Texte, 1. Aufl). München: Oldenbourg.
PISA Konsortium. (2004). PISA 2003. Der Bildungsstand der Jugendlichen in Deutschland : Ergebnisse des zweiten internation-alen Vergleichs. Münster: Waxmann.
Prenzel, M., Sälzer, C., Klieme, E., & Köller, O. (Eds.). (2013). PISA 2012. Fortschritte und Herausforderungen in Deutschland. Münster: Waxmann.
Reilly, D. (2012). Gender, culture, and sex-typed cognitive abilities. PLoS ONE, 7(7), e39904. doi:10.1371/journal.pone.0039904.
Rindermann, H. (2007). The g factor of international cognitive ability comparisons: the homogeneity of results in PISA, TIMSS, PIRLS and IQ-tests across nations. European Journal of Personality, 21, 667–706. doi:10.1002/per.634.
Rubin, D. B. (1987). Multiple imputation for nonresponse in surveys. New York: John Wiley & Sons.Schwarz G. (1978). Estimating the Dimension of a Model. The Annals of Statistics, 6(2), 461–464.Schurig, M., Wendt, H., Kasper, D. & Bos, W. (2015). Fachspezifische Stärken und Schwächen von Viertklässlerinnen und
Viertklässlern in Deutschland im europäischen Vergleich. In H. Wendt, T. C. Stubbe, K. Schwippert & W. Bos (Hrsg.), 10 Jahre international vergleichende Schulleistungsforschung in der Grundschule. Vertiefende Analysen zu IGLU und TIMSS 2001 bis 2011 (pp. 35–54). Münster: Waxmann.
Weinert, F. E. (1999). Konzepte der Kompetenz. Paris: OECD.Wendt, H., Kasper, D. & Bos, W. (2014). Multi-competence proficiency profiles of grade 4 learners—a European com-
parison based on TIMSS/PIRLS 2011 combined. In Presentation held at the European conference on educational research (ECER) 2014 in Porto.