Embed Size (px)
Citation preview
Subjective well-being and socio-ecological transition
Policy Paper no 6
Author: Gunther Tichy (WIFO)
September 2013
THEME SSH.2011.1.2-1
Socio-economic Sciences and Humanities Europe
moving towards a new path of economic growth
and social development - Collaborative project
Subjective well-being and socio-ecological transition
Policy Paper no 6
This paper was the basis of a presentation at the
Feedback Conference I in September 2013.
This paper can be downloaded from www.foreurope.eu
The WWWforEurope Policy Paper series is a working paper series that is open to
policy makers, NGO representatives and academics that are interested in contri-
buting to the objectives of the project. The aim of the paper series is to further the
discussion on the development of a new and sustainable growth path in Europe.
Author: Gunther Tichy (WIFO)
1
Subjective well-being and socio-ecological transition* The WWWforEurope project intends to lay the analytical foundation for a new development
strategy that enables a dynamic socio-ecological transition to high levels of employment, social
inclusion, gender equity and environmental sustainability. This task arises from the wide gap
between the broad formal acceptance of these goals and their troublesome realisation. Citizens
are not prepared to change their behaviour, powerful policy instruments are missing, serious
trade-off problems exist, and strong externalities drive a wedge between social and private
goals. To solve these problems potential differences between the urgency and hierarchy of a
society’s goals on the one hand and individuals’ goals on the other must be known. This is
indeed a near-blind spot in mainstream economics. Utility functions are almost unavoidably
based on rational behaviour and purely economic goals, while the widely chosen alternative,
revealed preferences, necessarily has to assume that individuals come to their decisions
‘rationally’ and are aware of longer-term consequences. The rather new field of Subjective-Well-
Being (SWB) research can help to deal with these problems. One must be cautious in applying
it, however, as SWB research has become (too) popular in the last decade, proving an
explosive topic in the media. Marketing-oriented terminology does not differentiate between
subjective well-being and happiness (“Lebenszufriedenheit” versus “Glück” in German). The
quest for happiness has created a specific market (Flora, 2009) and “[i]ncreasing public
happiness has become an overt goal of public policy in many countries, sitting, sometimes
uneasily alongside more familiar goals such as economic growth, national security, and social
justice.” (Mulgan, 2013: 517). In the striving for popularity, the term “happiness” has lost
precision1 and its relevance to policy.
1. Definitions and data
In contrast to psychologists and sociologists, who accurately differentiate between SWB,2
happiness and life satisfaction, economists frequently interchange these terms and, sadly, often
do this in a deliberately marketing-oriented way. The following quotation from the World
Happiness Report provides a good example, as it contains the correct definitions but
nevertheless uses the term ‘happiness’ incorrectly:
* Thanks are due to K. Aiginger and M. Schratzenstaller for inspiring discussion and helpful comments on an earlier
draft. 1 “Thus what the media (and often SWB researchers themselves) have referred to as ‘happiness’ rankings may be a
misnomer. The term happiness (in contrast to life satisfaction) connotes an experience that is emotional and momentary.” (Tov and Au, 2013: 453).
2 Kahneman and Deaton (2010) found “that emotional well-being (measured by questions about emotional experiences yesterday) and life evaluation (measured by Cantril’s Self-Anchoring Scale) have different correlates. Income and education are more closely related to life evaluation, but health, care giving, loneliness, and smoking are relatively stronger predictors of daily emotions.” See also section 3.
2
“‘Subjective well-being’ is the general expression used to cover a range of individual self-
reports of moods and life assessments. The word ‘happiness’ is often used in an equally
general way, as in the title of this report. It does help to focus thinking, and attracts attention
(my emphasis G.T.) more quickly than does ‘subjective well-being’. But there is a risk of
confusion. A bit of advance explanation may help to keep things clear.
Among various measures of subjective well-being, the primary distinction to be made is
between cognitive life evaluations (represented by questions asking how happy or satisfied
people are with their lives as a whole), and emotional reports. Early modern attempts to
classify different types of subjective well-being in psychology have also made a distinction
between two types of emotional reports: positive affect (a range of positive emotions) and
negative affect (a range of negative emotions). The primary distinction between life
evaluations and emotional reports continues to be accepted today. It is also accepted,
although less generally, that positive and negative affect carry different information, and
need to be separately measured and analyzed. In this report we shall present all three types
of measure.
How does happiness come into this classification? For better or worse, it enters in three
ways. It is sometimes used as a current emotional report – ‘How happy are you now?’,
sometimes as a remembered emotion, as in ‘How happy were you yesterday?’, and very
often as a form of life evaluation, as in ‘How happy are you with your life as a whole these
days?’ People answer these three types of happiness question differently, so it is important
to keep track of what is being asked. The good news is that the answers differ in ways that
suggest that people understand what they are being asked, and answer appropriately. Thus
when people are asked about their happiness now or yesterday, the answers are closely
correlated with current activities and events in their lives today or yesterday. By contrast,
when people are asked how happy they are with their lives a whole these days, their
answers match very closely the answers to other similar evaluations of life as a whole.”
(Helliwell and Wang, n.d.: 11; my italics G.T.).
In addition to cognitive (life satisfaction) and affective (happiness, anger, worry) elements of
SWB, which focus on a person’s experiences, the psychological literature further distinguishes a
state of eudaimonia or good psychological functioning (Clark and Senik, 2011). This paper
follows the psychology nomenclature and restricts the term “happiness” to the emotional
aspects (“How happy are you now?” or “How happy were you yesterday?”), while for the
cognitive aspects (“How happy are you with your life as a whole these days?”) the term “life
satisfaction” is used. “Subjective Well-Being” (SWB) comprises both (and eudaimonia
additionally). For the problems of trade-offs between goals and externalities, which drive a
wedge between social and private goals, the cognitive aspects – life satisfaction – are relevant.
These will form the core of this paper. This stands in accordance with the substance (as
3
opposed to terminology) of the economic literature,3 while sociologists and psychologists
concentrate on the emotional aspects, namely happiness (Glück) and to some extent
eudaimonia. Section 3 will nevertheless provide a brief outline of the differing determinants of
life satisfaction and happiness.
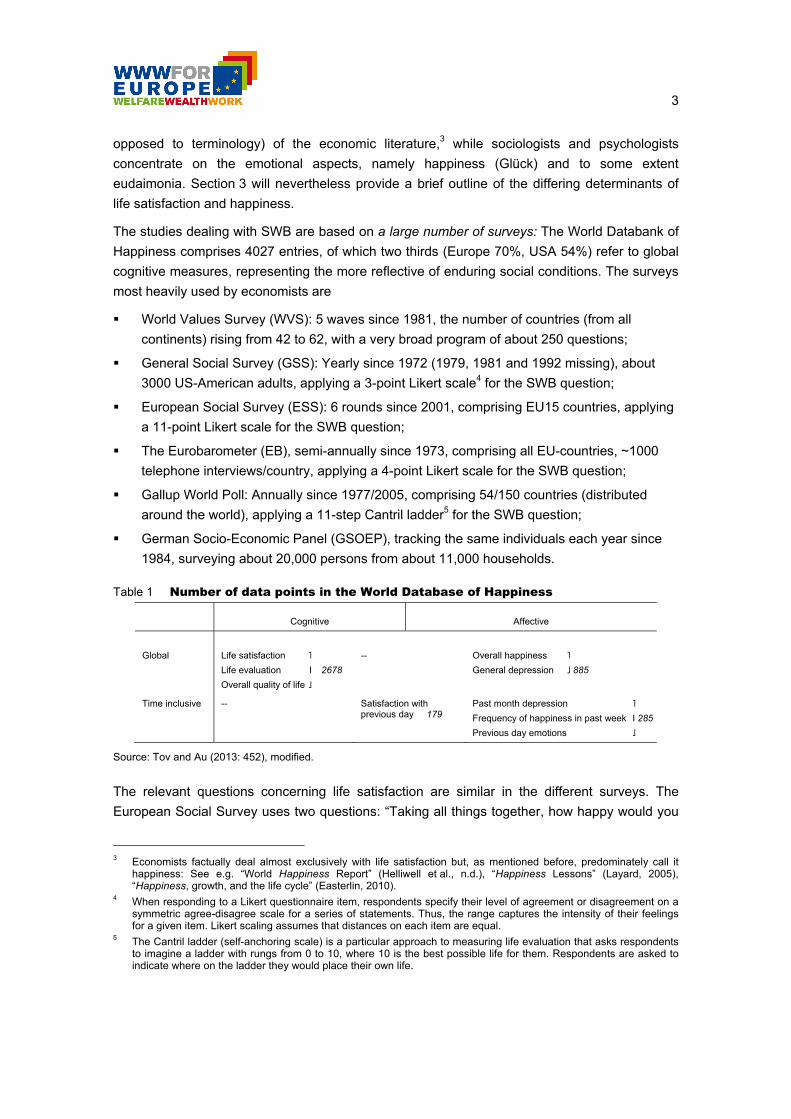
The studies dealing with SWB are based on a large number of surveys: The World Databank of
Happiness comprises 4027 entries, of which two thirds (Europe 70%, USA 54%) refer to global
cognitive measures, representing the more reflective of enduring social conditions. The surveys
most heavily used by economists are
World Values Survey (WVS): 5 waves since 1981, the number of countries (from all
continents) rising from 42 to 62, with a very broad program of about 250 questions;
General Social Survey (GSS): Yearly since 1972 (1979, 1981 and 1992 missing), about
3000 US-American adults, applying a 3-point Likert scale4 for the SWB question;
European Social Survey (ESS): 6 rounds since 2001, comprising EU15 countries, applying
a 11-point Likert scale for the SWB question;
The Eurobarometer (EB), semi-annually since 1973, comprising all EU-countries, ~1000
telephone interviews/country, applying a 4-point Likert scale for the SWB question;
Gallup World Poll: Annually since 1977/2005, comprising 54/150 countries (distributed
around the world), applying a 11-step Cantril ladder5 for the SWB question;
German Socio-Economic Panel (GSOEP), tracking the same individuals each year since
1984, surveying about 20,000 persons from about 11,000 households.
Table 1 Number of data points in the World Database of Happiness
Cognitive Affective
Global
Life satisfaction ˥
Life evaluation I 2678
Overall quality of life ˩
--
Overall happiness ˥
General depression ˩ 885
Time inclusive -- Satisfaction with previous day 179
Past month depression ˥
Frequency of happiness in past week I 285
Previous day emotions ˩
Source: Tov and Au (2013: 452), modified.
The relevant questions concerning life satisfaction are similar in the different surveys. The
European Social Survey uses two questions: “Taking all things together, how happy would you
3 Economists factually deal almost exclusively with life satisfaction but, as mentioned before, predominately call it
happiness: See e.g. “World Happiness Report” (Helliwell et al., n.d.), “Happiness Lessons” (Layard, 2005), “Happiness, growth, and the life cycle” (Easterlin, 2010).
4 When responding to a Likert questionnaire item, respondents specify their level of agreement or disagreement on a symmetric agree-disagree scale for a series of statements. Thus, the range captures the intensity of their feelings for a given item. Likert scaling assumes that distances on each item are equal.
5 The Cantril ladder (self-anchoring scale) is a particular approach to measuring life evaluation that asks respondents to imagine a ladder with rungs from 0 to 10, where 10 is the best possible life for them. Respondents are asked to indicate where on the ladder they would place their own life.
4
say you are?” and “All things considered, how satisfied are you with your life as a whole
nowadays?”, while the World Values Survey asks almost the same question, except that it uses
“these days” instead of “nowadays”, and Eurobarometer asks: “On the whole, are you very
satisfied, fairly satisfied, not very satisfied or not at all satisfied with the life you lead?” The three
separate Cantril ladder questions in the Gallup World Poll ask respondents to evaluate their
lives “at the present time”, five years ago and five years in the future on a ten-point ladder.
According to the similarity of the questions, research has been able to discover very similar
stories about the likely sources of a good life.6
The following section will use the determinants of self-reported life satisfaction to work out the
preferences of individuals and compare them with the necessities of the envisaged socio-
ecological transition. Beforehand, three caveats need to be voiced: general objections to self-
evaluation, the problem of bias due to cultural differences, and the limited qualification of life
satisfaction (and likewise of happiness) as a yardstick of peoples’ assessments and decisions.
Some critics do not trust the reliability of self-evaluations and maintain that they are not
correlated with actual behaviour (e.g. Glaeser et al., 2000). The bulk of evidence contradicts
this, however. Psychological studies confirm that persons who characterize themselves as
satisfied laugh more frequently (Fernandéz-Dols and Ruiz-Belda, 1990), are less suicide-
endangered (Oswald, 1997: 1823ff; Koivumaa et al., 2001), and are considered satisfied by
relatives and friends (Sandvik et al., 1993). Their satisfaction is also reflected in a variety of
objective measures, including facial expressions, brain-wave patterns, cortisol measures and
pulse at the individual level (Shedler et al., 1993). People generally give similar answers when
asked the same question at different points in time, and test-retest results for subjective well-
being measures yield correlations of between 0.6 and 0.7 for self-reports done on the same day
(Krueger and Schkade 2007). Reversing the direction of research, Freeman (1998) and Clark
et al. (2008b: 119ff), demonstrate that one can use the level of life satisfaction of respondents to
assess their behaviour with respect to productivity, unemployment, conjugal behaviour,
mortality, etc. Bjørnskov (2010) demonstrated that Gallup’s Cantril-ladder measure of life
satisfaction correlates highly (0.75) with WWS’s Likert scale. Economic studies have succeeded
in explaining the individual and social determinants of satisfaction consistently over countries
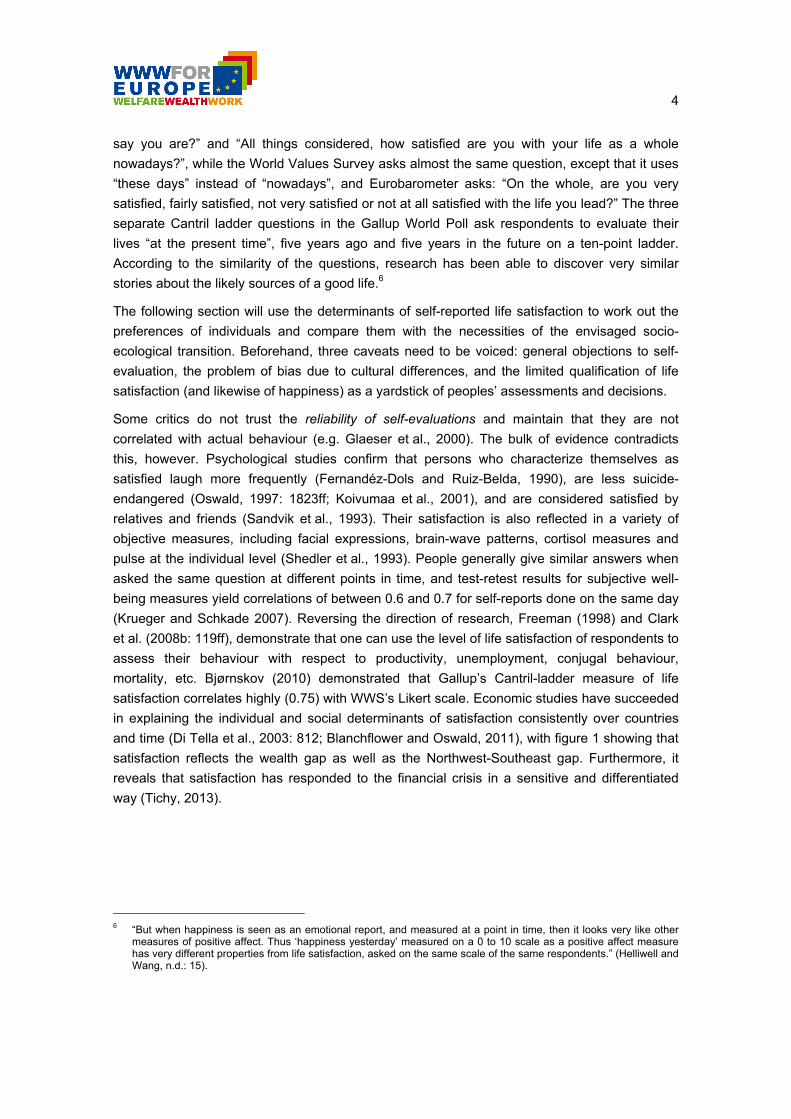
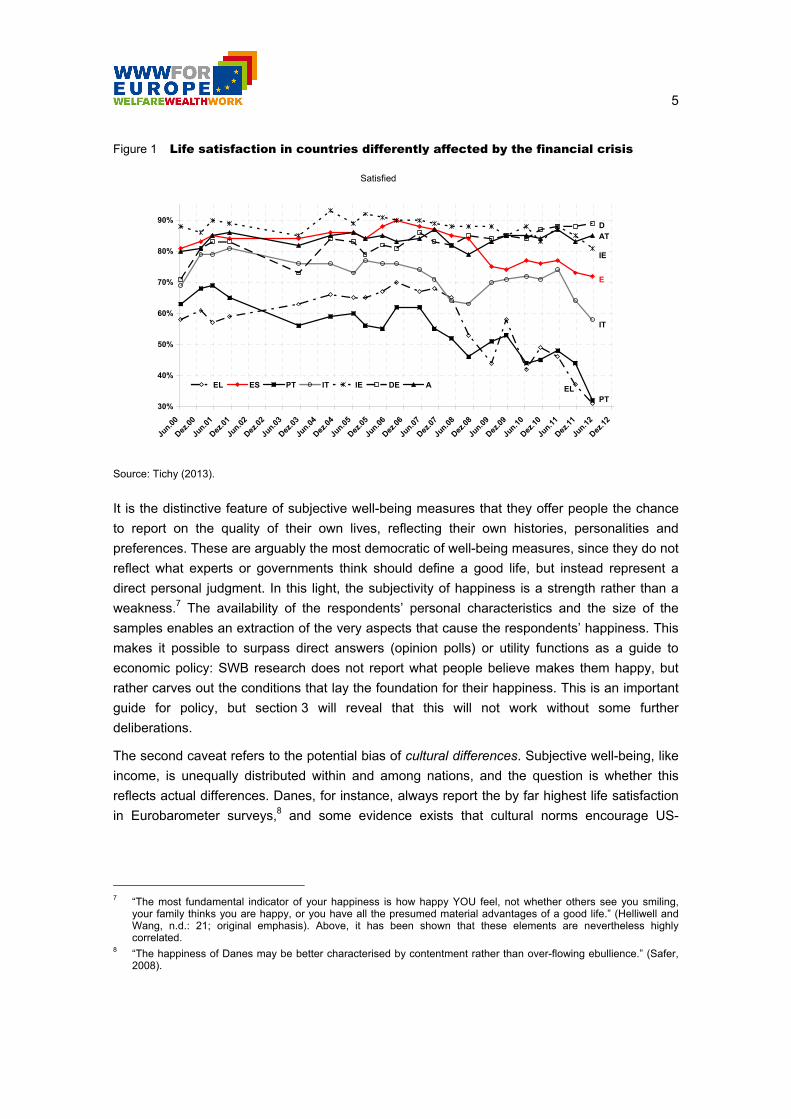
and time (Di Tella et al., 2003: 812; Blanchflower and Oswald, 2011), with figure 1 showing that
satisfaction reflects the wealth gap as well as the Northwest-Southeast gap. Furthermore, it
reveals that satisfaction has responded to the financial crisis in a sensitive and differentiated
way (Tichy, 2013).
6 “But when happiness is seen as an emotional report, and measured at a point in time, then it looks very like other
measures of positive affect. Thus ‘happiness yesterday’ measured on a 0 to 10 scale as a positive affect measure has very different properties from life satisfaction, asked on the same scale of the same respondents.” (Helliwell and Wang, n.d.: 15).
5
Figure 1 Life satisfaction in countries differently affected by the financial crisis
Source: Tichy (2013).
It is the distinctive feature of subjective well-being measures that they offer people the chance
to report on the quality of their own lives, reflecting their own histories, personalities and
preferences. These are arguably the most democratic of well-being measures, since they do not
reflect what experts or governments think should define a good life, but instead represent a
direct personal judgment. In this light, the subjectivity of happiness is a strength rather than a
weakness.7 The availability of the respondents’ personal characteristics and the size of the
samples enables an extraction of the very aspects that cause the respondents’ happiness. This
makes it possible to surpass direct answers (opinion polls) or utility functions as a guide to
economic policy: SWB research does not report what people believe makes them happy, but
rather carves out the conditions that lay the foundation for their happiness. This is an important
guide for policy, but section 3 will reveal that this will not work without some further
deliberations.
The second caveat refers to the potential bias of cultural differences. Subjective well-being, like
income, is unequally distributed within and among nations, and the question is whether this
reflects actual differences. Danes, for instance, always report the by far highest life satisfaction
in Eurobarometer surveys,8 and some evidence exists that cultural norms encourage US-
7 “The most fundamental indicator of your happiness is how happy YOU feel, not whether others see you smiling,
your family thinks you are happy, or you have all the presumed material advantages of a good life.” (Helliwell and Wang, n.d.: 21; original emphasis). Above, it has been shown that these elements are nevertheless highly correlated.
8 “The happiness of Danes may be better characterised by contentment rather than over-flowing ebullience.” (Safer, 2008).
Zufrieden
30%
40%
50%
60%
70%
80%
90%
Jun.0
0
Dez.0
0
Jun.0
1
Dez.0
1
Jun.0
2
Dez.0
2
Jun.0
3
Dez.0
3
Jun.0
4
Dez.0
4
Jun.0
5
Dez.0
5
Jun.0
6
Dez.0
6
Jun.0
7
Dez.0
7
Jun.0
8
Dez.0
8
Jun.0
9
Dez.0
9
Jun.1
0
Dez.1
0
Jun.1
1
Dez.1
1
Jun.1
2
Dez.1
2
EL ES PT IT IE DE A
PTEL
IT
E
IE
ATD
Satisfied
6
Americans to present their lives in a more positive light (Kahneman and Riis, 2005).9 Reported
SWB tends to be higher in individualistic cultures than in collectivist ones, in which more
emphasis is placed on personal modesty, self-criticism and social harmony (Suh, 2000). “The
metaphor people adopt, and the myth they perpetuate shape emotional life and happiness
levels” (Vittersø, 2013: 14). One can, however, easily overemphasise the cultural differences.
The Gallup-World Poll’s Cantril ladder, for example, shows that the variation of subjective well-
being across the world’s population largely takes place within countries (Helliwell and Wang,
n.d., 12). Blanchflower and Oswald (2008), furthermore, find a strong correlation between
psychological well-being and blood pressure among countries, and consider this as a
confirmation of the reliability of country comparisons. Finally, cultural differences, if they exist at
all, are irrelevant in explaining the constituents of happiness within one country or in analysing
time series.
The third caveat hints at the narrow definition of life satisfaction (and even more of happiness)
in this paper (as well in all of the respective economic literature). Philosophy employs much
broader definitions which, furthermore, constantly change over time (see Section III of David
et al., 2013). For Aristippus in Greek antiquity, happiness was the sum of momentary pleasures,
and both Bentham at the turn of the 18th to the 19th century and today’s Kahneman (1999) have
endorsed this interpretation. Defining happiness as the pleasures with life as a whole, Epicurus
was not far from this conception (Kahneman et al., 2010), but in Stoicism happiness was not
considered an end in itself, as the Stoic philosophy preached detachment from emotional life.
Kierkegaard, Nietzsche or Heidegger perceived happiness as an obstacle to the deeper goal of
wisdom, and for Aristotle good life followed from the exercise of virtuous acts. The
Enlightenment saw happiness as the right of all human beings, which is reflected in the US
constitution’s pursuit of happiness as an inalienable right. Happiness may be pleasure, virtue,
fulfilment of human nature, and, similarly to health, may be more than the mere absence of
unhappiness. All this should be kept in mind, but it is not the subject of this paper, whose task it
is to extricate the facts which determine self-reported life satisfaction, and to confront these with
the requirements and policy implications of a socio-ecological transition path to sustainable
development.
Even if it is important to keep in mind this paper’s (and the economic SWB literature’s in
general) restricted conception of life satisfaction, it appears fully appropriate for the problems at
hand in our individualistic and materialistic epoch indeed. “[T]he type of widespread popular
interest in happiness … is particularly characteristic of a consumer culture (Ahuvia and Izberk-
Bilgin, 2013: 485), and “… the new heroes of consumer culture make lifestyle a life project and
display their individuality and the sense of style in the particularity of the assemblage of goods,
clothes, practices, experiences, appearance and bodily dispositions they design together into a
lifestyle.” (Ahuvia and Izberk-Bilgin, 2013: 484)
9 “… the USA appears to have significantly higher levels of life satisfaction than France, yet more detailed analysis of
happiness levels day by day shows Americans doing worse than the French, pointing to the power of cultural norms …” (Mulgan, 2013: 519).
7
2. Determinants of life satisfaction
It is important to bear in mind that the surveys themselves do not ask for the determinants of life
satisfaction, they only ask if the respondent is more or less satisfied with the life he leads. It is
left to SWB research to discover these determinants by comparing the individuals’ degree of life
satisfaction with the characteristics of the respondent (marital status, religion, income, etc.) and
his economic and social environment. The estimation is restricted to orders of magnitude,
however, for three reasons. First, only dichotomous variables, such as divorce or employment,
can be defined clearly, while qualitative but equally important ones, such as health, distribution,
trust or participation, are less easy to isolate. Second, many determinants are correlated, so
that coefficients and causalities may be less reliable. And finally, to compare the importance of
determinants they must be transformed into income equivalents, which is a hazy task to begin
with, but all the more so when income belongs to the less important determinants of life
satisfaction.
For a clearer presentation the following sections will distinguish individual, economic and social
determinants of life satisfaction. This distinction is to some extent arbitrary and not exclusive.
Income, for example, has elements of all three categories. Furthermore, the various
determinants frequently influence each other, with income, for example, positively correlating
with health. The separation of the three categories, however, points to the fact that the
economic rather than individual determinants provide the main starting point for policy, and the
social ones indicate the elements of altruism determining life satisfaction.
2.1 Individual determinants of life satisfaction
Most of the studies concur that health and marital status are among the most important
determinants of life satisfaction. Blanchflower and Oswald (2004: 12) found for the U.S. and
Great Britain that an existing (first) marriage contributes two thirds more to life satisfaction than
being employed. On an OECD-wide basis and roughly a decade later (data for 2009 and 2010),
Boarini et al. (2012: 21) identified marriage as contributing only half as much as employment,
but still the 1.7-fold of a doubling of income. The quality of the marriage, however, as well as
that of social relations, is more important than the marriage itself or the sheer number of
relations (Demir, 2013: 817-18). Divorce reduces life satisfaction by 40% (Gardner and Oswald,
2005), while becoming a widower reduces it somewhat less and separation without divorce
somewhat more. In all these cases, the general adaptation effect applies: about one half of the
original effect is restored within two years.
The satisfaction-heightening effect of health is assessed even more strongly by most
respondents (Oswald, 1997, 1827; Clark and Oswald, 2002; Helliwell, 2002). This information is
less reliable and less suited to quantification, however, for two main reasons: The responses
appear to be identical to those about life satisfaction in general10 and self-assessed health is
10 A 1% better assessment of own health is connected with a 1% increase in life satisfaction (Helliwell, 2002: 9).
8
weakly correlated with actual (measured) health (Diener et al., 1999; Deaton, 2008: 66).
Furthermore, there is good evidence that some of the association between good health and
high life satisfaction is due to high life satisfaction causing good health (Diener and Chan,
2011). Serious illness or being disabled reduces life satisfaction, but again a part this loss wears
off (Donovan and Halpern, 2002: 24). Disabled people are less satisfied with their lives by
½ percentage points (severely disabled by 1 percentage point) on a seven-point scale
according to Oswald and Powdthavee (2005).
A less frequently considered determinant of life satisfaction is relational goods, “the
affective/expressive, non instrumental, side of interpersonal relationships”. The Relational Time
Index, comprising the elements “attend social gatherings”, “attend cultural events”, “participate
in sports”, “perform volunteer work” and “attend church or religious events” is significantly
correlated with satisfaction (Becchetti et al., 2008). “The strongest unique predictors of current
happiness were Mental Control (inversely related), Direct Attempts, Affiliation, Religion,
Partying, and Active Leisure. Gender differences suggest that men prefer to engage in Active
Leisure and Mental Control, whereas women favour Affiliation, Goal Pursuit, Passive Leisure,
and Religion. Relative to Asian and Chicano(a) students, White students preferred using high
arousal strategies.” (Tkach and Lyubomirsky, 2006: 183).
Religion, such as belief in god and regular attendance of church, influences satisfaction
positively (Diener et al., 1999; Helliwell, 2002: 13), especially in bad times. Persons trusting
each other are in general more satisfied (Helliwell, 2002: 13), as are introverted people more
than extroverted people (Kasser and Ryan, 2001).
With respect to age, Blanchflower and Oswald (2004: 9) found a U-shaped relation. The trough
lies between 45 and 55 years (Donovan and Halpern, 2002: 14) and between 35 to 45 years in
the international investigation by Helliwell (2002: 12), both of these studies reflecting the well-
known midlife crisis.
The influence of education on life satisfaction appears contested: Boarini et al. (2012) found a
significant positive effect, especially for tertiary education for 34 OECD countries. Blanchflower
and Oswald (2004: 11) detected a small positive effect in their earlier study for the USA and
Britain; Diener et al. (1999), Helliwell (2002: 11) as well as Kahneman and Deaton (2010) found
no effect exceeding the difference in income. Education, nevertheless, may have some non-
income benefits for individuals who get an education, especially in poor countries. However, this
appears smaller than is often claimed by educationalists, reflecting the well-known gap between
individual and social returns. On top of this, important social effects may work through an
informed electorate and in poor countries through reduced birth rates, better health and reduced
mortality (Layard et al., n.d.: 78).
Contrary to the contested influence of education on life satisfaction, numerous results of
research point towards substantial positive effects of self-determination, as in personal freedom,
employee participation, participation in society and an adequate degree of leisure. Veenhofen
(2000) demonstrated the positive influence of personal freedom on life satisfaction for a broad
sample of countries, and Inglehart and Klingemann (2000: 171f) described this dependence as
9
S-shaped. For the descendents of former Russia, the increase in personal freedom did not
contribute much to life satisfaction, while it was considerably higher in the less suppressed
Eastern European countries11 and Latin America. In Western democracies, the effect of a
further increase in personal freedom on life satisfaction is again small.
A second component of self-determination that increases life satisfaction is participation. Blinder
(1990), Kruse und Blasi (1995) as well as OECD (1995) emphasise the positive influence of
employee participation on life satisfaction.12 Frey and Stutzer (2000) point towards the
satisfaction-increasing effects of political participation, with Swiss direct democracy as an
example. The importance of participation in society has been worked out for the U.S. by Putnam
(2001), for Great Britain by Donovan and Halpern (2002: 26), and by Helliwell (2002: 13) for a
large number of quite different states, with membership in clubs, tax compliance and trust
showing a markedly positive contribution to life satisfaction. Putnam (2001) and Bjørnskov
(2003) emphasise the general contribution of Social Capital to life satisfaction.
Leisure contributes to satisfaction, even in the U.S. (Donovan and Halpern, 2002: 25f). This is
astonishing, as US-Americans work considerably longer hours than Europeans, naming this as
an explanation for their superior economic performance and explaining it as a deliberate
reaction to lower taxation (Prescott, 2004). Life satisfaction research, however, suggests that
US-Americans’ long working hours are not deliberately chosen. In 1955, 49% indicated that they
would prefer to have more leisure, and in 1991 this share had risen to 68% (Donovan and
Halpern, 2002: 25). Alesina et al. (2001b) and Alesina et al. (2005) demonstrated that it is
beyond the power of the individual employee to reduce his working time; only collective action
by labour unions can achieve this. No corresponding studies evidently exist for Europe, but
Englishmen working in the garden or going in for sport once a week – both indicating more
leisure – report a higher amount of life satisfaction (75% satisfied versus 70%), as found by
Donovan and Halpern (2002: 25f).
Social connections and human contact contribute strongly to life satisfaction. Living in a stable
relationship has an effect on life satisfaction roughly half as large as a doubling of income
(Helliwell, 2008). Other measures of social support and trust in others are also positively
associated with life satisfaction (Helliwell and Wang, 2011).
Last but not least, gender aspects appear to have some influence on life satisfaction. Women
are more satisfied with their lives than men in Great Britain and the USA, but not in Switzerland
(Frey and Stutzer, 2000: 925). Similarly to the USA and Great Britain, Boarini et al. (2012) found
that being female was associated with higher levels of life satisfaction in 34 OECD countries,
but with lower levels of affect balance. “Given the consistency in terms of the sign on other
coefficients, this raises questions about the different gender responses to alternative measures
of subjective well-being. One possibility is that women are more willing to report more extreme
11 The difference between Byelorussia and Hungary is equal to the effect of a well-functioning marriage (Helliwell,
2002: 20). 12 According to Freeman (1998: 9) even firms with employee participation, profit sharing or employee ownership profit
from the increased life satisfaction of their employees, as they “seem to do a bit better than other firms.”

10
responses than men, which would be consistent with a higher average score on life satisfaction
(with more women scoring highly overall due to the general rightward skew of the life
satisfaction data distribution), but a lower affect balance (with women reporting both more
positive and more negative emotions).” (Boarini et al., 2012: 22) Contrary to expectations,
women’s life satisfaction declined in the U.S., (Blanchflower and Oswald, 2004: 6). As a rather
curious addition, even images of beauty appear to be relevant for life satisfaction, with images
of ideal beauty bolstering young women’s satisfaction and images of body size boosting that of
men (Argyle, 1987).
2.2 Economic determinants of life satisfaction
Unemployment influences life satisfaction (negatively) more than any other economic
determinant. 40% of Europe’s unemployed are not at all satisfied (compared to 19% of the total
population),13 and only 15% (compared to 26%) are very satisfied (Alesina et al., 2001a: table
2.2). The average American unemployed person attains only 54% of the total population’s
satisfaction (Di Tella et al., 2003: 811). Boarini et al. (2012) estimate that unemployment
decreases life satisfaction three times more strongly than a doubling of (the log of) household
income. Life satisfaction studies distinguish carefully between the effects of unemployment per
se on life satisfaction and the resulting loss of income: for example, to what extent is an
unemployed person less satisfied than an employed person with the same personal
characteristics (sex, age, status, etc.) and the same income? The isolated pure unemployment
effect is the psychological sequel and it corresponds to a plunge from the top income quartile to
the lowest one (Di Tella et al., 2003: 812), or to a loss of $ 60,000/year (Blanchflower and
Oswald, 2004: 13). The bulk of evidence shows that even low quality jobs are associated with
higher life satisfaction than unemployment, and this effect is statistically significant for most
specifications of ‘bad’ jobs. Even concerns about potential job loss considerably reduce life
satisfaction (Uhde, 2010: 425). A study examining the German workfare program (Wulfgramm,
2011) concludes that people’s life satisfaction rises substantially when they go from being
completely out of work to joining the program (Layard et al., n.d.: 67). The loss of income
resulting from the loss of a job, whose size depends on the replacement ratio, must be added to
the psychological loss of satisfaction, but this effect is considerably smaller.
Men of working age suffer most from the psychological impact of unemployment (Blanchflower
and Oswald, 2004: 13), and women over 50 the least (Gerlach and Stephan, 1996: 326). The
psychological impact of unemployment levels off gradually due to the ‘adaptation effect’ (Clark
and Oswald, 1994), but the previous level of satisfaction is never attained, even in subsequent
employment (Lucas et al., 2004). A ‘relativity effect’ reduces the psychological consequences
when marriage partner or friends are also unemployed, when the local unemployment rate is
high, or when the unemployed person can rate his unemployment as ‘normal’ or ‘undeserved’
(Clark, 2001). As section 2.3 will show, a high unemployment rate not only reduces the life
satisfaction of the unemployed, but also that of employed persons (Clark et al., 2008a).
13 As compared with the lowest income quartile in which only 28% are very unsatisfied.
11
The effect of income on life satisfaction is complex. Persons with higher income are more
satisfied, which seems to support the American saying: “Those who say that money can’t buy
happiness don’t know where to shop”. 87% of respondents in the top income quartile consider
themselves highly or fairly satisfied, compared to only 73% in the lowest quartile (Di Tella et al.,
2003: 811). In Boarini’s et al. (2012) study of the 34 OECD countries, (log) household income is
highly significant, with a doubling of income associated with an increase of nearly 0.2 points in
life satisfaction on a 10-rung Cantril ladder. This is somewhat smaller than the coefficient found
by Stevenson and Wolfers (2008), but this may be partly accounted for by the inclusion of
variables referring to “Not having enough money to buy food”, unemployment and education.
The marginal utility of additional income, however, decreases rapidly according to most studies
and stops at an income level of about (then) € 10,000 (Donovan and Halpern, 2002: 10; Layard,
2003, lecture 1; Frey and Stutzer, 2002: 423).14 For a rich person, an additional euro of wealth
brings only one tenth of the life satisfaction it would give to a poor person (with one tenth of the
rich’s income; see Layard et al., 2008). “Whilst money might buy a little happiness, it does not
buy very much” (Dixon, 1997: 1813).
This is the first explanation of the so-called Easterlin paradox (Easterlin, 1974), which rests on
the contrasting evidence that the rich are more satisfied, but that an increase in income does
not increase overall satisfaction. A second, fairly obvious explanation results directly from the
way in which life satisfaction is measured. More than “very satisfied” (the highest point on the
Likert scale or the Cantril ladder) is impossible to attain, suggesting that the share of satisfied
respondents cannot surpass 100%. Thus, even if recent proponents of the hypothesis that rising
income does in fact generally raise life satisfaction (Deaton, 2008; Stevenson and Wolfers,
2008; Sacks et al., 2010; Kahneman and Deaton, 2010) are correct,15 neither the Likert scale
nor the Cantril ladder can indicate it. The third argument explaining the Easterlin paradox rests
on the adaptation effect, which describes the mere temporary satisfaction new goods and
services offer and the adaptation of aspirations. Di Tella et al. (2007) emphasise, for example,
that the satisfaction resulting from a rise in income evaporates within five years. The
observation that the rich are nevertheless more satisfied with their lives, as the fourth argument
says, results from the financial security they enjoy. Income uncertainty definitely reduces life
satisfaction (Uhde, 2010: 425), while income security definitely boosts it (Freiberger Stiftung,
2010: 19; Noll und Weick, 2010).
The last and probably most important explanation of the Easterlin paradox is the ‘relativity
effect’: the consequences of rich people’s consumption for the average consumer, and the
different effects of individual and national increases in income. The literature unanimously
confirms that the effects of relative income on life satisfaction by far dominate those of absolute
14 For the explanation of the differences in life satisfaction within EU, therefore, even the low ones of Portugal and
Greece (see figure 1), income differences are barely relevant. 15 Anecdotal evidence suggests that it is not income per se to which the rich aspire, but certain positional goods or a
specific lifestyle.
12
income.16 Poverty (“Not having enough money to buy food”) strongly reduces life satisfaction
(Boarini at al., 2012). Next to employment, income distribution, is therefore one of the dominant
economic determinants of life satisfaction. Unequal income distribution reduces life satisfaction
in the U.S. and even more significantly in Europe (Alesina et al., 2001a): An increase in the
Gini-coefficient of 10 percentage points – matching a transition from the Austrian to the Italian
income distribution or from the Danish to the British – implies a reduction of the share of “very
satisfied” from 26½% to 21% and an increase of the unsatisfied from 19½% to 25%. One
strange finding is that in the U.S. an unequal distribution primarily reduces the satisfaction of the
rich. Given the heavy unequal distribution in this country, this might point toward a guilty
conscience amongst the rich, which translates into private – not policy-induced – charitable
action.17 Given the importance of the income distribution, it is evident that social security
increases the life satisfaction of the recipients of transfers (Uhde, 2010). Transfers and a more
equal income distribution even increase the life satisfaction of a society in general; the net
effect, however, is reduced by the negative side of the relative-income effect, the loss of
satisfaction of those with higher incomes.
The influence of absolute income on life satisfaction still remains an important topic for further
research, however. Previous unanimity with respect to a limited importance of income level has
been increasingly questioned (Deaton, 2008; Stevenson and Wolfers, 2008; Sacks et al., 2010;
Kahneman and Deaton, 2010). Furthermore, Inglehart and Rabier (1986), found a significant
positive contribution of the increase of income in the preceding 12 months for Western Europe
(1973-83), and Clark et al. (2008a: 127) refers to the fact that life-income profiles with current
modest increases are preferable to those with constant income, a growth boosting perception
that is most relevant for the WWWforEurope project.
The conclusion that relative income is more important than absolute income nevertheless holds
but raises the question as to what is relative. The European Social Survey (ESS) asked people
“Whose income would you be most likely to compare your own with?” Instead of ‘the rich’, and
somewhat surprisingly with respect to widely held preoccupations, ‘colleagues’ was the group
mentioned most often (Layard et al., n.d.: 62). Layard (2005) similarly found that colleagues,
friends and neighbours were the most frequently named reference group, and Runciman (1966)
argued that people tend to compare themselves most with their nearest equals. Comparison is
indeed an important element of life satisfaction, however too much comparison with others
reduces satisfaction: ESS asked “How important is it for you to compare your income with other
people’s incomes?” Those answering that income comparisons were more important for them
were on average less satisfied with their lives – again a fact highly relevant for the
16 90% of the U.S. population prefer a more equal distribution of wealth than today’s historic high inequality (Norton
and Ariely, 2011). 17 The fact is surprising, nevertheless, as 71% of Americans compared to only 40% of EU-Europeans believe that the
poor would be richer if they applied themselves more (Alesina and Angeletos, 2003: 2), and 60% Europeans compared to only 29% of Americans believe that it is not possible to leave a poverty trap through own effort (Alesina et al., 2001b). “Interestingly, the actual facts are actually the other way round: there is more intergenerational social mobility in Europe than the U.S. And there is more mobility where there is greater income equality. But attitudes have an effect on perceptions and thus on happiness.” (Layard et al., n.d.: 71)
13
WWWforEurope project. According to Layard et al. (n.d.: 62), similar results have been found for
the U.S.
The regression studies based on the surveys are unavoidably restricted in comparing the
satisfaction of individuals at the same point of time; they cannot track the satisfaction of specific
individuals over time. The West German Socio-Economic Panel (GSOEP), however, has been
tracking the same individuals over time on an annual basis since 1984. Using the
Eurobarometer series since 1972 and the GSOEP since 1984, Layard et al. (n.d.: 61-62) found
that differences in income explain about 1% of the variance of life-satisfaction in the population;
no effect is left in this study for absolute income, only relative income matters. To this extent the
study explains why average life satisfaction has not risen despite the growth of GDP, but one
should add that income distribution deteriorated markedly as well in this period.
One further argument contributing to the discussion on the influence of absolute income posits
that it is not income per se which people desire but their position in society, which is governed
by the rank in the income hierarchy and/or by commanding specific goods and services which
are inevitably in limited supply – position goods (Hirsch, 1977). The tragedy of the position
goods and their contribution to life satisfaction, as well as to the income-growth race, is that
everybody works hard to catch them, but the goal is attainable for a few only, not to society as a
whole. Whenever a lower income group has come to a position enabling them to obtain these
goods, they lose their character of position goods and other goods, not available to them, take
on this position. And so the race continues indefinitely as one of the main contributors to the
growth race and to un-sustainability.
Summarising the impact of income on life satisfaction, it is uncontested that higher income
contributes to life satisfaction, as it reduces income uncertainty, providing financial safety and
access to position goods. Additional income, however, has – according to most studies –
decreasing marginal returns, but this result has recently been put into question. Life-income
profiles with consecutive modest increases are indeed preferred to those with constant income,
and the race to acquire position goods appears to accelerate even further. The impact of
relative income and income distribution is, nevertheless, considerably stronger than that of
absolute income. However, the desire to improve one’s relative position and the craving for
position goods and rank in society strongly boost growth, even in the richest countries – a set of
conditions evidently detrimental to the potential transition path of the WWWforEurope project.
The impact of inflation on life satisfaction, if investigated at all, is estimated to be relatively small
and weak. Under the aspect of the violent policy debate confronting unemployment with price
stability, this is astonishing and stands in strict conflict with the direct assessment to be reported
in section 3. The coefficient of the inflation term is frequently insignificant in life satisfaction
regressions (Di Tella and MacCulloch, 2004: 14); Alesina et al. (2001a) estimate that increasing
inflation by one standard deviation (5¾ percentage points) reduces the share of the “very
satisfied” by 3 percentage points. This implies a trade-off of 1¾% unemployment to 1% inflation,
compared to the traditional misery index’s 1:1 trade-off. The estimates furthermore reveal
differences in ideological positions: A rise in inflation of 10 percentage points reduces the share
of satisfied right-wing persons by 7 percentage points, which is more than double the average,
14
while left-wingers’ life satisfaction suffers more from unemployment (Di Tella and MacCulloch,
2004: 14, 19).
Few studies deal with the impact of the environment on life satisfaction. As the environment has
many dimensions with a strongly diverse local impact, it is difficult to find relevant indicators in
the SWB regressions, and the environment is frequently assumed to be internalised, such as,
for example, in the case of air pollution in housing prices. Furthermore, while pollution has
strongly decreased in the Western hemisphere, awareness of it has increased since the early
seventies, so that the effects of the two tendencies on life satisfaction may to an unknown
extent compensate each other. According to Rehdanz and Maddison (2005), using data on 67
countries between 1972 and 2000, cold temperatures increase life satisfaction, which implies a
negative impact of global warming. Welsch (2002) found no effect of SO2 concentration on life
satisfaction in a cross section of 54 countries, while Boarini et al. (2012) found a rather small
effect of air and no effect of water quality. In Luechinger’s (2009) careful study for Germany,
which uses regional GSOEP data, SO2 concentration negatively affects life satisfaction to an
extent of about 1% to 1½% of household income. This is larger for individuals concerned about
the environment and, contrary to earlier assumptions, Luechinger finds air pollution incompletely
capitalised in the private housing market.
Geographical mobility definitely reduces life satisfaction: The longer individuals had lived at the
same address, the higher was their well-being (Ballas and Tranmer, 2012), probably as a
consequence of the better chances to build social and support networks. This is in accordance
with the above-mentioned observation that single people appear to be on average less happy
than married couples. Boarini et al. (2012) report significant lower life satisfaction of persons
born abroad.
Life satisfaction studies do not deal with growth explicitly, instead addressing it indirectly via
unemployment. “In the overall balance, happiness rises in booms because a one-point
decrease in unemployment has at least twice as large an effect on happiness as a one-point
increase in the inflation rate. Economic stability is a crucial goal for any society, due largely to
the fact of loss aversion, whereby individuals hate to lose x dollars more than they love to gain x
dollars. But economic stability is a quite different goal from long-term economic growth. Long-
term growth has much less impact on human happiness than do human relationships in all their
dimensions.” (Layard et al., n.d.: 66)
2.3 Social determinants of life satisfaction
A considerable body of knowledge has accumulated, not least in the field of experimental
economics (see Fehr and Gächter, 2000 for an early survey), demonstrating that men’s
decisions not only rely on selfish economic motives but also on social considerations and
fairness. Life satisfaction research enhances these perceptions, with income distribution and
unemployment serving as good examples.
Alesina et al. (2001a) revealed, as already shown above, that unequal income distribution
lowers life satisfaction. The effect is larger for the poor and for those with left-wing political
15
beliefs, but it also affects total population. Corneo and Grüner (2000) distinguish a “homo
oeconomicus-effect”, a “public values-effect” and a “social rivalry-effect”. The first one lowers
the satisfaction of those immediately affected by the unequal distribution, the second affects
those rejecting inequality, while the third involves keeping an eye on one’s respective own
group: life satisfaction declines when reducing inequality enables a rival group to compete for
the same position goods.18 Tests using the International Social Survey programs 1992 for the
USA, Canada, Australia, New Zealand, Norway, East and West Germany as well as five East-
European countries suggest that the selfish homo oeconomicus-effect is the largest, but the
public values-effect is strong as well. Norwegians and Germans have the most positive attitude
toward redistribution, while Americans and Australians see it in the least favourable light.
The social component in the relation of unemployment to life satisfaction appears to be even
stronger. “When we total up all the well-being effects of a rise in the unemployment rate, the
loss to the rest of the population (which is a large number of people) is twice as large as the
loss to the unemployed themselves.” (Layard et al., n.d.: 67) In addition to the psychological
effect and the considerably smaller income effect, a social effect works, reducing the life
satisfaction of those not affected by unemployment. A rise in unemployment by 5 percentage
points – as frequently observed in these days – reduces the life satisfaction of the population
(whether employed or not) by 0.06 units on a four-point scale. This is equivalent to a transition
of more than 10% of the population to the next lower step (Di Tella et al., 2001), which is a
rather strong effect. Even workers with a secure position lose satisfaction when general
unemployment rises (Clark et al., 2008a).
The interpretation of the social effect of unemployment is still under discussion. Life satisfaction
studies emphasise a “fear effect” (Di Tella et al., 2003: 809): High unemployment gives a signal
to the still employed that their jobs could be endangered, and fear and stress reduce life
satisfaction of normal job holders, while government employees are not affected (Luechinger
et al., 2010). At least two arguments raise considerable doubt about this explanation. First,
surveys do not offer evidence for a widespread fear of losing one’s job in normal times, not in
even in ‘normal’ recessions. Second, surveys provide strong evidence that workers consider
their own job to be at least twice as safe as jobs in general (Tichy, 2013), so that a widespread
general fear is rather implausible. Justice and fairness considerations appear to provide a more
plausible explanation.
There are no studies, nor surprisingly even methods, available for an exact comparison of the
relative strength of the determinants of life satisfaction. The frequently used comparisons of
additional income are not very reliable, as (absolute) income belongs to the less important (and
even contested) determinants of life satisfaction, and the monetary evaluation of determinants
such as health, marriage or freedom is already problematic. Given these warnings, some
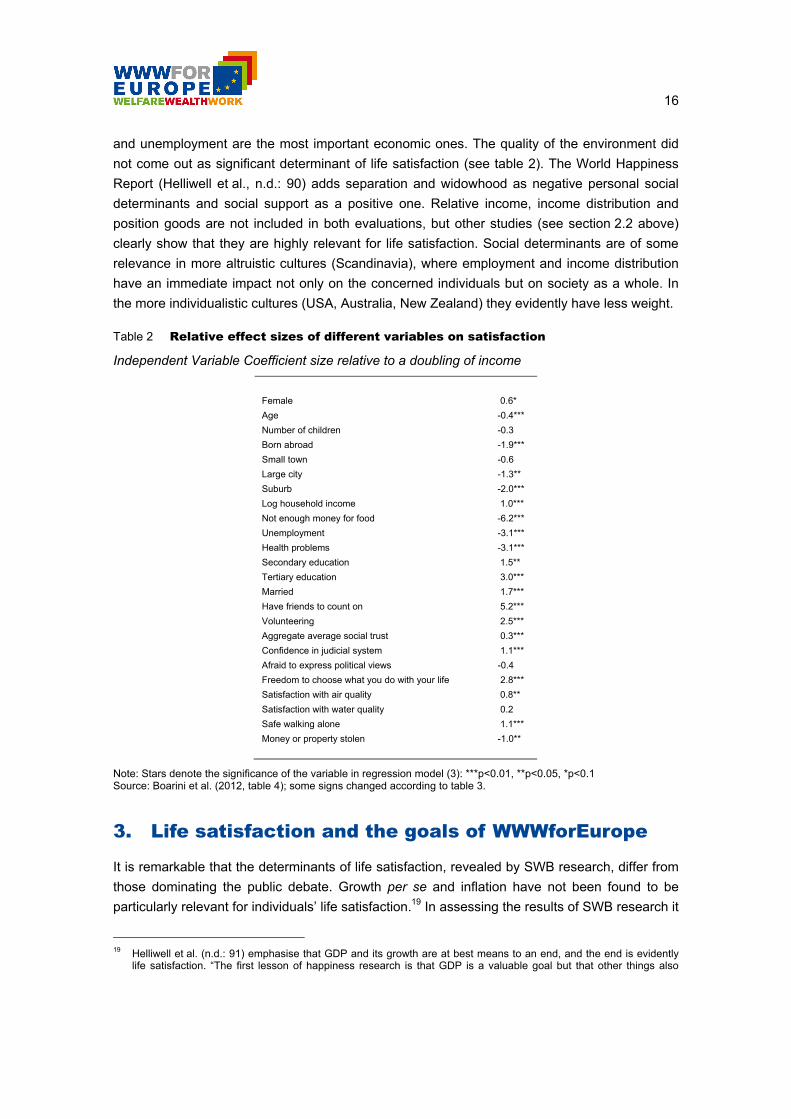
cautious hints are available. Boarini et al. (2012) conclude that sickness, isolation and lack of
freedom are amongst the most important personal obstacles to life satisfaction, while poverty
18 Examples of this are rent provisions, enabling ‘lower classes’ to enter ‘good’ living quarters, or measures that give
immigrants access to good schools. The current Austrian discussion on education can serve as an example as well.
16
and unemployment are the most important economic ones. The quality of the environment did
not come out as significant determinant of life satisfaction (see table 2). The World Happiness
Report (Helliwell et al., n.d.: 90) adds separation and widowhood as negative personal social
determinants and social support as a positive one. Relative income, income distribution and
position goods are not included in both evaluations, but other studies (see section 2.2 above)
clearly show that they are highly relevant for life satisfaction. Social determinants are of some
relevance in more altruistic cultures (Scandinavia), where employment and income distribution
have an immediate impact not only on the concerned individuals but on society as a whole. In
the more individualistic cultures (USA, Australia, New Zealand) they evidently have less weight.
Table 2 Relative effect sizes of different variables on satisfaction
Independent Variable Coefficient size relative to a doubling of income
Female 0.6*
Age -0.4***
Number of children -0.3
Born abroad -1.9***
Small town -0.6
Large city -1.3**
Suburb -2.0***
Log household income 1.0***
Not enough money for food -6.2***
Unemployment -3.1***
Health problems -3.1***
Secondary education 1.5**
Tertiary education 3.0***
Married 1.7***
Have friends to count on 5.2***
Volunteering 2.5***
Aggregate average social trust 0.3***
Confidence in judicial system 1.1***
Afraid to express political views -0.4
Freedom to choose what you do with your life 2.8***
Satisfaction with air quality 0.8**
Satisfaction with water quality 0.2
Safe walking alone 1.1***
Money or property stolen -1.0**
Note: Stars denote the significance of the variable in regression model (3): ***p<0.01, **p<0.05, *p<0.1 Source: Boarini et al. (2012, table 4); some signs changed according to table 3.
3. Life satisfaction and the goals of WWWforEurope
It is remarkable that the determinants of life satisfaction, revealed by SWB research, differ from
those dominating the public debate. Growth per se and inflation have not been found to be
particularly relevant for individuals’ life satisfaction.19 In assessing the results of SWB research it
19 Helliwell et al. (n.d.: 91) emphasise that GDP and its growth are at best means to an end, and the end is evidently
life satisfaction. “The first lesson of happiness research is that GDP is a valuable goal but that other things also
17
is important to keep in mind that the determinants of life satisfaction are not the respondents’
answers to questions in the surveys but rather the results obtained by research: Based on the
self assessment of people who consider themselves as satisfied (or not) with their lives, SWB
studies search for the specific facts that make individuals more or less satisfied. These need not
be the facts the individuals themselves are conscious of. People may misjudge the satisfaction
resulting from their choices (Stutzer and Frey, 2007), they may not be aware of the
consequences of their decisions, and they continuously adapt their aspirations to news, thereby
superimposing previous choices. Furthermore, their satisfaction with material things almost
inevitably wears off within four to five years – the adaptation effect mentioned above. If asked
directly about the problems concerning them most (so to say, the short term inverse of
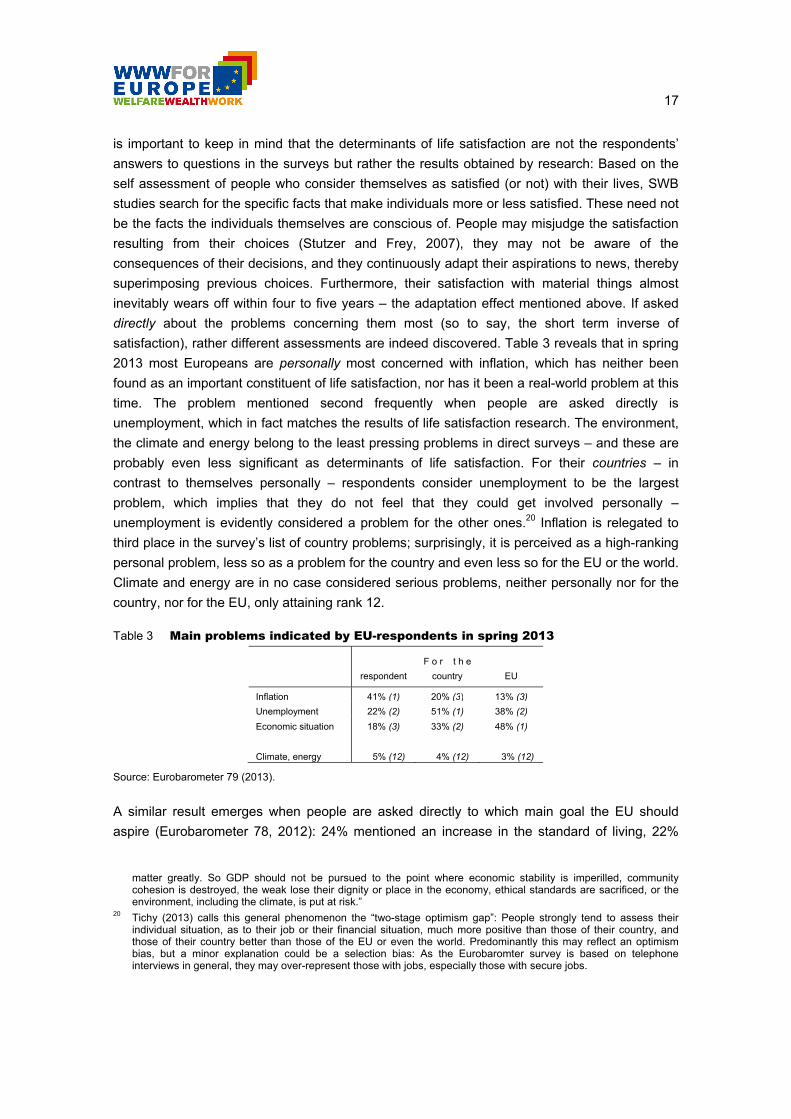
satisfaction), rather different assessments are indeed discovered. Table 3 reveals that in spring
2013 most Europeans are personally most concerned with inflation, which has neither been
found as an important constituent of life satisfaction, nor has it been a real-world problem at this
time. The problem mentioned second frequently when people are asked directly is
unemployment, which in fact matches the results of life satisfaction research. The environment,
the climate and energy belong to the least pressing problems in direct surveys – and these are
probably even less significant as determinants of life satisfaction. For their countries – in
contrast to themselves personally – respondents consider unemployment to be the largest
problem, which implies that they do not feel that they could get involved personally –
unemployment is evidently considered a problem for the other ones.20 Inflation is relegated to
third place in the survey’s list of country problems; surprisingly, it is perceived as a high-ranking
personal problem, less so as a problem for the country and even less so for the EU or the world.
Climate and energy are in no case considered serious problems, neither personally nor for the
country, nor for the EU, only attaining rank 12.
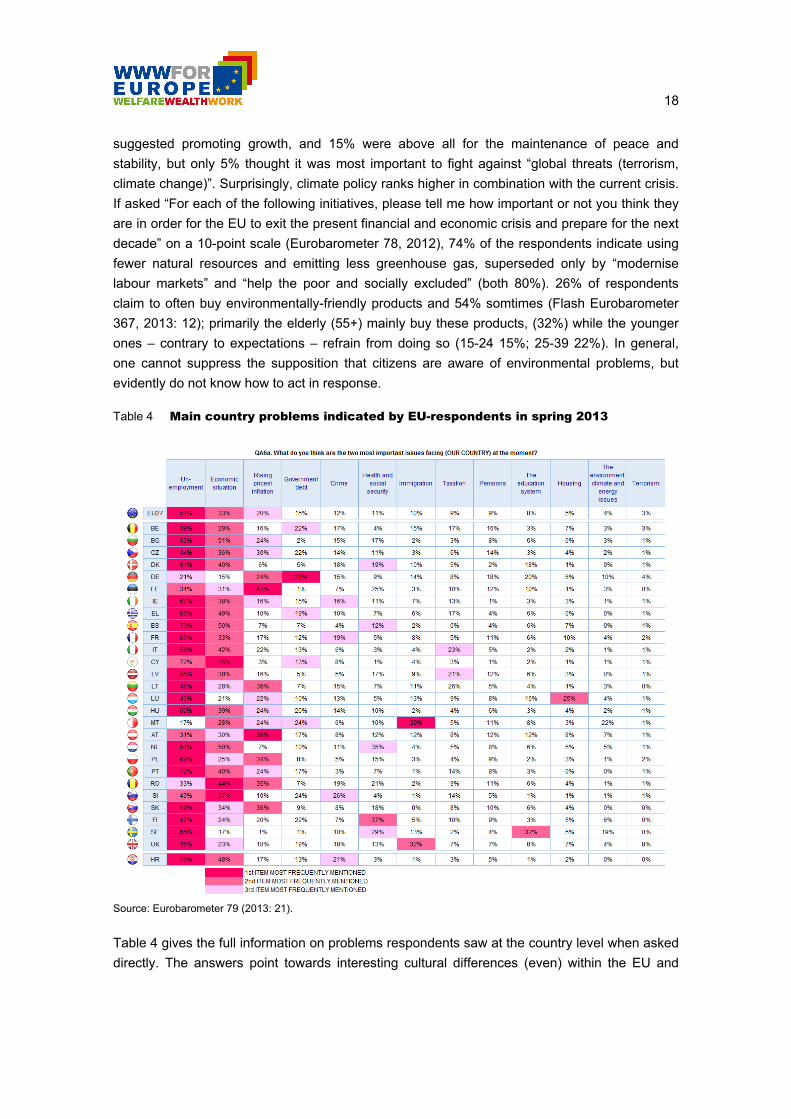
Table 3 Main problems indicated by EU-respondents in spring 2013
respondent
F o r t h e
country
EU
Inflation 41% (1) 20% (3) 13% (3)
Unemployment 22% (2) 51% (1) 38% (2)
Economic situation 18% (3) 33% (2) 48% (1)
Climate, energy 5% (12) 4% (12) 3% (12)
Source: Eurobarometer 79 (2013).
A similar result emerges when people are asked directly to which main goal the EU should
aspire (Eurobarometer 78, 2012): 24% mentioned an increase in the standard of living, 22%
matter greatly. So GDP should not be pursued to the point where economic stability is imperilled, community cohesion is destroyed, the weak lose their dignity or place in the economy, ethical standards are sacrificed, or the environment, including the climate, is put at risk.”
20 Tichy (2013) calls this general phenomenon the “two-stage optimism gap”: People strongly tend to assess their individual situation, as to their job or their financial situation, much more positive than those of their country, and those of their country better than those of the EU or even the world. Predominantly this may reflect an optimism bias, but a minor explanation could be a selection bias: As the Eurobaromter survey is based on telephone interviews in general, they may over-represent those with jobs, especially those with secure jobs.
18
suggested promoting growth, and 15% were above all for the maintenance of peace and
stability, but only 5% thought it was most important to fight against “global threats (terrorism,
climate change)”. Surprisingly, climate policy ranks higher in combination with the current crisis.
If asked “For each of the following initiatives, please tell me how important or not you think they
are in order for the EU to exit the present financial and economic crisis and prepare for the next
decade” on a 10-point scale (Eurobarometer 78, 2012), 74% of the respondents indicate using
fewer natural resources and emitting less greenhouse gas, superseded only by “modernise
labour markets” and “help the poor and socially excluded” (both 80%). 26% of respondents
claim to often buy environmentally-friendly products and 54% somtimes (Flash Eurobarometer
367, 2013: 12); primarily the elderly (55+) mainly buy these products, (32%) while the younger
ones – contrary to expectations – refrain from doing so (15-24 15%; 25-39 22%). In general,
one cannot suppress the supposition that citizens are aware of environmental problems, but
evidently do not know how to act in response.
Table 4 Main country problems indicated by EU-respondents in spring 2013
Source: Eurobarometer 79 (2013: 21).
Table 4 gives the full information on problems respondents saw at the country level when asked
directly. The answers point towards interesting cultural differences (even) within the EU and
19
considerably diverging views of various elements of sustainability. For example, Germany is the
only country whose inhabitants consider government debt as the most pressing problem for
their country (Germany’s government debt ratio is 81% compared to 85% EU average), while for
Greece, Cyprus and Malta government debt ranks only third, and this is not at all considered a
problem in the other GIPS countries. Austrians are similar to Germans in their elevated concern
about government debt and inflation, while, somewhat surprisingly, the Finns are primarily
concerned about health or health insurance and the Swedes about education. Neither pensions
nor the environment are among the problems that seriously preoccupy European citizens. The
same is true for terrorism, which in contrast with U.S. propaganda and media campaigns, is not
considered a problem at all (the UK only to an extent mirrors the U.S.). As supposed by SWB
research (see section 1), direct questions evidently reflect the immediate problems and feelings
(affects) on the day of the poll.
While this paper deals with the life satisfaction aspects of SWB, a few remarks may be worth
making with respect to the affect balance. Boarini et al. (2012) carried out the same regression
for both aspects of SWB and found comparable determinants and signs; only being Female and
Being Afraid To Express Political Views changed signs. The coefficients, however, differed:
Volunteering, Trust, Tertiary Education, Log Income and Unemployment have less than 40% of
the impact on affect balance than they have on life satisfaction, while Children, Personal Safety,
Freedom and Health have almost twice the impact (Boarini et al., 2012: 24).
All of this points towards the necessity of accurately distinguishing three different layers of
contributing factors to social well-being:
what individuals themselves consider the most pressing problems when asked directly;
what turns out to have contributed to individuals’ life satisfaction, as discovered by life
satisfaction research, asking how satisfied people are with their lives on the whole
nowadays; and
what is sustainable in the long run, given the unintended consequences of pursuing
intended and unintended individual goals, as revealed by direct questions or by SWB
research.
The differentiation clearly reveals the most important result that a policy directly based on
opinion polls would turn out to be myopic and unsuitable to bringing about life satisfaction.
However, even a policy attempting to maximise peoples’ (revealed actual) life satisfaction would
be prone to reducing life satisfaction in the long run, as such a policy would necessarily neglect
the externalities reducing life satisfaction in the long run, at least the life satisfaction of the next
generation. The Unique Selling Proposition (USP) of the WWWforEurope project is to extricate
the compatibility of the goals of these three layers and design a dynamic socio-ecological
transition path to the social goals of high levels of employment, social inclusion, gender equity
and environmental sustainability. This is in accordance with the UN General Assembly, which
has invited Member States to “pursue the elaboration of additional measures that better capture
the importance of the pursuit of happiness and well-being in development with a view to guiding
their public policies.” (Helliwell et al., n.d.: 91) This is no easy task for at least three reasons:
20
First, “in terms of public discourse, the well-being and sustainability debates have been
held at some distance from one another. To date, research on thinking on well-being has
often emphasized the contribution of psychological and psychosocial factors over actual
material circumstances (such as individual wealth), with very little explicit consideration of
the role of the environment or of ecological behaviour. …
Second, … popular debate about sustainable development is conducted largely at the
national level. Where reference is made to the impact of environment on individuals’ well-
being, it is usually to ‘future generations’ rather than those living now.” (Thompson et al.,
2013: 500).
Third, it is widely believed that technical or institutional solutions rather a change of
individual behaviour can solve the problems.
Taking the three layers of contribution to subjective well-being into account, it is important to
carefully work out their consistencies and incompatibilities. While compatibility may dominate in
the short run, serious problems can arise in the long run, mainly due to sustainability. A social
dilemma exists in the form of serious tensions between the elements of life satisfaction,
involving behaviour that is not aimed at the environment, yet has a direct impact on it, at least in
the long term. However, environment is not the only aspect of sustainability. Not much less
important are the ‘sustainabilities’ of full employment with secure and humane jobs and an
adequate work-life balance, of pensions21 and health systems, the position-goods rat-race, or of
government finance. All these problems have trade-offs which are considered relevant by most
people indeed, but are far from inducing the majority to change their behaviour. Citizens
frequently find consolation in persuading themselves that they alone can’t change the disaster,
or – as the Eurobarometer reveals – considering themselves not personally involved. In
consequence, they complain about emissions, while marketing and buying high-emission cars,22
fighting violently against higher gasoline prices and striving for traffic-generating and energy-
wasting single family houses. They fear old-age poverty (at least in the media, less so in the
Eurobarometer, as shown in table 4), but are neither prepared to work longer nor to agree to
higher contributions. They lament overly high government debt, but reject a curtailing of public
expenditure. As an excuse, they frequently cling to ‘technical’ solutions (which are supposed to
work ‘automatically’ and do not afford any personal action or renunciation), even if experience
has shown that no one technical solution has ever sufficed to solve environmental problems.
The majority implicitly rejects the idea that a change in behaviour is indispensable and that
policy will have to shift the incentive structure. Experts, however, say that “so-called
‘downshifting’ whereby people consciously adopt simple lower-consumption lifestyles … are
widely assumed to be required for a really substantive effect on the environment” (Thompson
et al., 2013: 507). However, ‘downshifting’ is hampered by people, who are locked-in in
21 The literature on pension reforms almost exclusively suggests an increase in labour input as a solution, either
through a longer life working period or higher participation, both of which imply higher production and consequently higher consumption (see e.g. Börsch-Supan, 2013), clearly contradicting the sustainability goals.
22 The German government, under pressure from the German car lobby, has recently used the trick of postponing a session in Brussels to delay the discussion on stricter emissions standards for cars.
21
individualism and materialism, resisting a change in their patterns of behaviour. In a relative way
and to a lesser extent, absolute income and continuous augmentation of income are still the
dominant targets.23 As a solution, Singapore reports: „Citizens willing to trade civil liberties for a
cleaner, safer and efficient society” (Weir, 2008). This unavoidably implies repressing
regulations, a solution which indeed does not appear adequate for Europe.
4. Some reflections on policy solutions
In determining their goals, “[a]t present many countries use a traditional form of cost-
effectiveness analysis, in which benefits are measured in money units on the basis of what
citizens would be willing to pay for those benefits. This works quite well when the primary
benefits are indeed financial or can be readily transferred into monetary equivalents. This is
often true for policies on industry, transport, education and employment. However expenditure
in these areas is often no more than a quarter or so of public expenditure. The bulk of public
expenditure is on health, social care, law and order, the environment, child welfare, and income
support. In none of these cases does willingness to pay provide adequate guidance to the
benefits that arise. Happiness would be an excellent added criterion for evaluating these
expenditures.” (Helliwell et al., 2013: 95)24 Does this imply that governments should maximise
life satisfaction? Starkly different views exist.
Following liberal conceptions, governments should “confine themselves to being just. We shall
assume the responsibility of being happy for ourselves” (B. Constant in the 19th century,
according to Mulgan, 2013: 518). Even if this is not the position of most of the current European
governments, society inevitably “stopped telling people who they were, and instead it was let up
to the individual to construct his or her own identity” (Baumeister, 1991: 95). “This construction
of identity is not an easy task. … Since both what we purchase and refuse to purchase plays an
important role in defining our sense of identity, consumer choices also become an
overwhelming concern.” (Ahuvia and Izberk-Bilgin, 2013: 484) In Ancient Greece, Aristotle
argued that happiness was the only good that was “good in itself.” This argument still has
relevance, but maximising life satisfaction under the modern aspects of citizens’ uncertainty
would be a mixed blessing, given the evidence of the contrasting goals of the above-mentioned
three layers. Even if they are less problematic than immediately relying on opinion polls (see
section 3), attempts to maximise life satisfaction would combine the election-term myopia of
governments with consumers’ disregard of long-term sustainability goals. The task is to find
ways to maximise life satisfaction under the restrictions of internalising externalities and taking
proper account of sustainability, not life satisfaction per se.
23 Thompson et al. (2013: 508) refer to an increasing literature which purports to demonstrate that holding a strongly
materialistic value orientation is, all else being equal, detrimental to well-being. 24 As mentioned before, the authors use the term “happiness” even if they are fully aware of a risk of confusion,
because “it does help to focus thinking, and attracts attention more quickly than does ‘subjective well-being’.” (Helliwell and Wang, n.d.: 11)
22
Neither national nor EU policies have been successful in this respect up to now. National policy
exculpates itself with arguments of drawbacks in international competition and the inefficiency of
national solo flights. EU policy, on the other hand, is advancing in big steps in some fields as
liberalising markets or promoting competition, but it is much more hesitant towards promoting
sustainable development, and the steps taken in this area are much smaller. To some extent,
this is due to the heavy opposition of national governments, industries and electorates (see
footnote 22 for an example), but to an even greater extent due to the heterogeneity of the EU
and the complexity of the subject. The big differences in income and environmental damage
among members require different country-specific solutions and exacerbate a common EU
policy. Even worse, policy has to act against established consumption patterns and industry
interests, some instruments are heavily contested, powerful instruments are wanting, and the
mode of action and the power of new instruments are under discussion. Strong headwinds
result from the “collective welfare optimism” (Hobsbawm, [1994] 1997: 531ff), increasingly
opposing distribution.25
Kasser (2006) proposed a threefold strategy to shift people’s values and goals, and thus
behaviours: decrease the likelihood that people will be exposed to materialistic messages (e.g.
banning advertisements to children, removing tax-write-offs for advertising), increase people’s
resilience to the materialistic messages that remain in the environment (e.g. by building intrinsic
values, teaching individuals to decode advertisement messages), and help people to act more
consistently with the intrinsic goals that they may value (e.g. encouraging ethical consumption
and investments). This is fully correct but sounds somewhat naïve with regard to
implementation, and one may doubt if it suffices to win the sustainability race. Much more is
needed in order to shift incentives and change peoples’ values and goals. Minority groups
(‘Greens’) in the richer countries are already cautiously trying to approach a sustainable life-
style (e.g. a shift from work/income to leisure, from prestige cars to public transport and
bicycles, from accumulating goods to renting and sharing, etc.), but the development continues
to go in the wrong direction, as majorities’ behaviour over-compensates these hesitant
beginnings. Prisching (2009) has worked out how difficult it is to change the current culture of
consumption, and life satisfaction research has revealed the importance of monetary aspects.
People feel happier if their income increases in the course of their life time, and position goods
and at least relative (but also absolute) income continue to be highly decisive motives for the
majority – despite the fact that position goods are a mixed blessing, immediately ceasing to be
position goods (and therefore worth striving for) whenever they become available to those
desiring them, and thus forcing individuals to aspire to obtaining other (inaccessible) goods – a
vicious cycle, which keeps the growth race in motion.26
25 This is reflected in the efforts of richer regions to separate by splitting (Slovenia, Czech republic, Catalonia, etc.),
and the increasing resistance against the welfare state and redistribution in general. 26 Position goods are the carrot the donkey can never reach, but which keep him going. Nobody knows if the
anecdotal donkey is as disappointed as the consumers, which after having attained a position good after long effort, realise that it is no longer a position good, as others dispose of it as well. And so the race for the new position good begins anew, sustaining growth rather than sustainability.
23
Subjective well-being research teaches us that citizens’ desires and attitudes diverge
substantially from what is required for sustainability. The new WWWforEurope development
strategy will have to strive for ways to get around this problem of changing peoples desires and
attitudes, and devise ways to do so that are less restrictive and at the same time more
comprehensive than Singapore’s confinement of civil liberties. This involves a broad mixture of
instruments. The current policy debate has become stuck in pro- and anti-growth ideologies,
leaving aside the questions of the effects of potential EU solo flight on the world climate as well
as the heterogeneity of the EU. However, the poorer member need both qualitative and
quantitative growth in order to catch up, while the richer members will have to find ways to avoid
further rounds of rising aspirations and induce citizens to downsize their demand at least
quantitatively. Traditional goals will have to be reformulated to take care of trade-offs with other
goals, and well-known instruments will have to be redesigned, with greater attention paid to
their (unintended) side effects.
It cannot be the task of this paper to specify the policy needed to accomplish the new
WWWforEurope transition path; it can merely provide a sketch of the goals to strive towards.
Concentration on full employment will have to be retained as an important goal, but given the
trade-off with environmental sustainability, higher growth should no longer be the dominant and
single instrument applied in the richer countries. Other instruments will have to complement it,
including the proper setting of incentives. The prevailing tax structure, for example, promotes
both labour-saving and resource- and energy-wasting technical progress,27 giving incentives for
decentralised housing and commuting and promoting energy supply (even if renewable) rather
than energy saving. Even if a full-time job should be the goal of a policy, several forms of
reducing working time could help to reduce unemployment. Needless to say, this would involve
workers accepting the shift from work/income to leisure, which is not currently the case. The
goals of social inclusion and gender equity should gain greater weight, and more than taxes,
transfers or minimum shares of women in specific jobs will be required as instruments to
accomplish them. Meanwhile, a broad revision of different facets of the social system, ranging
from education and labour rules to the treatment of part-time work and child-bearing in taxation
and social security, will prove unavoidable. Trade-offs towards budgetary stability, however, will
have to be taken into consideration. Participation in all their dimensions should be promoted, as
it increases life satisfaction; however, given citizens’ goals and attitudes, it will not lead to more
sustainability per se. Environmental sustainability, surely the goal least realised at the moment,
not only affords the traditional instruments as promotion of renewable resources, recycling,
regulation, taxation, internalisation or reliance on the price mechanism,28 etc., which may imply
trade-offs to full employment or international competitiveness; additionally, and more
importantly, they require a far-reaching change in the behaviour of producers and consumers.
Civil society will have a major role to play, in the form of environment-conscious groups setting
27 The economic policy discussion must redirect its focus from boosting labour productivity to boosting both resource
productivity and total factor productivity. 28 A good example is energy policy. The extreme rise of oil and gas prices in the last decades has had less effect on
demand than on supply, exploiting new technologies.
24
the stage for more conservative consumers, as well as by firm-NGO-consumer interaction
exploiting producers’ reputation awareness.
5. Summary
The goal of WWWforEurope – and its unique selling proposition – is to lay the analytical
foundation for a new development strategy that will enable a dynamic socio-ecological transition
to high levels of employment, social inclusion, gender equity and environmental sustainability.
These goals do not appear to rank highly in populations’, and consequently politicians’, order of
priorities. When asked directly, people rank price stability, employment and growth highest,
while SWB research reveals employment, relative income and a continuous (small) rise in
income as the main determinants among those goals, which can be influenced by policy. The
order of preferences, indicated by both approaches, reveals serious sustainability problems,
and, consequently, problems in designing the indispensable transition path to a more
sustainable development: Environmental sustainability, probably the world’s dominant problem
today, ranks rather low in both cases. Growth per se, a goal still considered important, is not the
dominant and only determinant of life satisfaction and has an unavoidable trade-off with
environmental sustainability; the same trade-off exists with full employment, as long as growth is
considered the dominant policy instrument to achieve it. Social inclusion appears to rank
somewhat higher than environmental sustainability amongst citizens’ goals, but again a serious
trade-off exists with the importance of relative-income position (and the acquisition of position
goods) for their life satisfaction.
To change the path towards greater sustainable development, therefore, means carefully
devising a consistent combination of a wide range of instruments. A considerable number of
these have already been proposed and discussed, but they are in most cases isolated and
there has been little consideration of trade-offs and consistency with other goals. The trickiest
problem, however, has not even been afforded appropriate attention up to now, namely how to
change citizens’ goals and attitudes by primarily setting the appropriate incentives. If one can’t
find innovative solutions for this problem, it will prove impossible to design a promising transition
path outside of an authoritarian regime.
25
Literatur Ahuvia, A. and E. Izberk-Bilgin, 2013, “Well-being in consumer societies”, in S. David, I. Boniwell and A.
Conley-Ayers (eds.), Oxford Handbook of Happiness, 482-497.
Alesina, A. et al., 2001a, Inequality and happiness: Are Europeans and Americans different?, NBER Working Paper, (8198).
Alesina, A. et al., 2001b, “Why doesn’t the United States have a European style welfare state?”, Brooking Papers on Economic Activity, Fall, 187-277.
Alesina, A. and G.-M. Angeletos, 2003, Fairness and redistribution, mimeo.
Alesina, A. et al., 2005, “Work and leisure in the United States and Europe: Why so different?”, NBER Macroeconomics Annual 2005, 1-99.
Argyle, M., 1987, The psychology of happiness, London: Methuen.
Ballas, D. and M. Tranmer, 2012, “Happy People or Happy Places?: A Multilevel Modeling Approach to the Analysis of Happiness and Well-Being.”, International Regional Science Review, 35(1), (In-press), eScholarID:150785 | DOI:10.1177/0160017611403737.
Baumeister, R.F., 1991, Meanings in life, New York: Guilford Press.
Becchetti, L., A. Pelloni, F. Rossetti, 2008, “Relational Goods, Sociability, and Happiness”, Kyklos, 61(3), 343-63.
Bjørnskov, Ch., 2003, “The happy few: Cross-country evidence on social capital and life satisfaction”, Kyklos, 56, 3-16.
Bjørnskov, Ch., 2010, “How comparable are Gallup World Poll life satisfaction data?”, Journal of Happiness Studies, 11, 41-60.
Blanchflower, D.G. and A.J. Oswald, 2004, “Well-being over time in Britain and the USA”, Journal of Public Economics, 88(7-8), 1359-86, (NBER Working Paper 7487).
Blanchflower, D.G. and A.J. Oswald, 2008, “Hypertension and happiness across nations”, Journal of Health Economics, 27, 218-33.
Blanchflower, D.G. and A.J. Oswald, 2011, International happiness, NBER Working Paper, (16668).
Blinder, A.S. (ed.), 1990, Paying for productivity: A look at the evidence, Washington, DC: The Brookings Institution.
Boarini, R. et al., 2012, What Makes for a Better Life?: The Determinants of Subjective Well-Being in OECD Countries – Evidence from the Gallup World Poll, OECD Statistics Working Papers, 2012/03, OECD Publishing, http://dx.doi.org/10.1787/5k9b9ltjm937-en.
Börsch-Supan, A., 2013, “Ageing, labour markets and well-being”, Empirica, 40(3), 397-407.
Clark, A.E., 2001, “Unemployment as a social norm: Psychological evidence from panel data”, Journal of Labour Economics, 21(2), 323-51.
Clark, A.E. and A.J. Oswald, 1994, “Unhappiness and unemployment”, Economic Journal, 104(424), 648-59.
Clark, A.E. and A.J. Oswald, 2002, Well-Being in Panels, mimeo, University of Warwick.
Clark, A. et al., 2008a, Boon or Bane? Others’ unemployment, well-being and job insecurity, CESifo Working Paper, (2501).
Clark, A. et al., 2008b, “Relative income, happiness, and utility: An explanation for the Easterlin paradox and other puzzles”, Journal of Economic Literature, 46(1), 95-144.
Clark, A.E. and C. Senik, 2011, Is happiness different from flourishing? Cross-country evidence from the ESS, Working Paper 2011-04, Paris: School of Economics.
Corneo, G. and H.P. Grüner, 2000, “Social limits to redistribution”, American Economic Review, 90(5), 1491-1507.
26
David, S. et al., 2013, “Conclusion: The Future of Happiness“, in S. David, I. Boniwell and A. Conley-Ayers (eds.), Oxford Handbook of Happiness, 1067-70.
Deaton, A., 2008, “Income, health, and well-being around the world: Evidence from the Gallup poll”, Journal of Economic Perspectives, 22(2), 53-72.
Demir, M., 2013, “Introduction to relationships and happiness”, in S. David, I. Boniwell and A. Conley-Ayers (eds.), Oxford Handbook of Happiness, 817-18.
Di Tella, R. et al., 2001, “Preferences over inflation and unemployment”, American Economic Review, 91(1), 335-41.
Di Tella, R. et al., 2003, “The macroeconomics of happiness”, Review of Economics and Statistics, 85(4), 809-27.
Di Tella, R. and R. MacCulloch, 2004, Partisan social happiness, mimeo.
Di Tella, R., J. Haisken-De New and R. MacCulloch, 2007, “Happiness Adaptation to Income and to Status in an Individual Panel”, NBER Working Paper, (13159), http://www.nber.org/papers/w13159.
Diener, E. et al., 1999, “Subjective well being; Three decades of progress”, Psychological Bulletin, 125(2), 276-303.
Diener, E. and M. Chan, 2011, Happy People Live Longer: Subjective Well-being Contributes to Health and Longevity, Applied Psychology: Health and Well-being, March 2011.
Dixon, H.D., 1997, “Controversy: Economics and happiness”, Economic Journal, 107, 1812-14.
Donovan, N. and D. Halpern, 2002, Life satisfaction: the state of knowledge and implications for govern-ment, Strategy Unit.
Easterlin, R.A., 1974, “Does Economic Growth Improve the Human Lot?”, in P.A. David and M.W. Reder (eds.), Nations and Households in Economic Growth: Essays in Honour of Moses Abramovitz, New York: Academic Press.
Easterlin, R.A., 2010, “Happiness, Growth, and the Life Cycle”, in H. Hinte and K. Zimmermann (eds.), Oxford University Press.
Eurobarometer 78, 2012, Public opinion in the European Union, first results, Brussels: European Commission.
Eurobarometer 79, 2013, Public opinion in the European Union, first results, Brussels: European Commission.
Fehr E. and S. Gächter, 2000, “Fairness and Retaliation: The Economics of Reciprocity”, Journal of Economic Perspectives, 14(3), 159-181.
Fernandéz-Dols, J.M. and M.-A. Ruiz-Belda, 1990, Spontaneous facial behaviour during intense emotional episodes: Artistic truth and optical truth, http://smg.media.mit.edu/classes/Identity2004/ FernandezDolsAndRuizBelda.pdf.
Flash Eurobarometer 367, 2013, Attitudes of Europeans towards building the Single market for green products, Brussels: European Commission.
Flora, C., 2009, The pursuit of happiness, http://www.psychologytoday.com/articles/200812/the-pursuit-happiness.
Freeman, R.B., 1998, “War of models; Which labour market institutions for the 21st century?”, Labour Economics, 5, 1-24.
Freiberger Stiftung, 2010, Zufrieden trotz sinkenden materiellen Wohlstands, Amerang.
Frey, B.S. and A. Stutzer, 2000, “Happiness, economy and institutions”, Economic Journal, 110, 918-38.
Frey, B.S. and A. Stutzer, 2002, “What can economists learn from happiness research”, Journal of Economic Literature, 40(2), 402-35, http://people.ucsc.edu/~jhgonzal/100a/files/0-150.pdf.
Gardner J. and A.J. Oswald, 2005, Do divorcing couples become happier by breaking up?, IZA Discussion Papers, (1788).
27
Gerlach, K. and G. Stephan, 1996, “A paper on unhappiness and unemployment in Germany”, Economic Letters, 52(3), 325-30.
Glaeser, E. et al., 2000, “Measuring trust”, Quarterly Journal of Economics, CXV(3), 811-846.
Helliwell, J.F., 2002, How’s life? Combining individual and national variables to explain subjective well-being, NBER Working Paper, (9065).
Helliwell, J.F., 2008, Life Satisfaction and the Quality of Development, NBER Working Paper, (14507).
Helliwell, J.F. and S. Wang, n.d., “The state of world happiness”, in J. Helliwell et al. (eds.), World happiness report, 10-57.
Helliwell, J.F. and S. Wang, 2011, Weekends and Subjective Well-Being, NBER Working Paper, (17180).
Helliwell, J.F. et al., n.d., “Some policy implications”, in J. Helliwell et al. (eds.), World happiness report, 90-107.
Helliwell, J.F. et al., 2013, Social Capital and Well-Being in Times of Crisis, Journal of Happiness Studies, May 2013.
Hirsch, F., 1977, Social limits to growth, London/Henley: Routledge & Kegan Paul.
Hobsbawm, E., [1994] 1997, Das Zeitalter der Extreme. Weltgeschichte des 20. Jahrhunderts, München. Hanser.
Inglehart, R. and J.-J. Rabier, 1986, “Aspirations adapt to situations – but why are the Belgians so much happier than the French? A cross-cultural analysis of the subjective quality of life”, in F.M. Andrews ed, Research in the quality of life, University of Michigan: Ann Arbor, 1-49.
Inglehart, R. and H.-D. Klingemann, 2000, “Genes, culture, democracy, and happiness”, in E. Diener and E.M. Suh (eds.), Culture and subjective well-being, Cambridge MA: MIT Press, 165-83.
Kahneman, D., 1999, “Objective happiness”, in D. Kahneman, E. Diener and N. Schwarz (eds.), Well-being: The foundations of Hedonic Psychology, New York: Russell Sage, 3-25.
Kahneman, D. and J. Riis, 2005, “Living, and thinking about: Two perspectives on life”, in F. Huppert et al. (eds.), The science of well-being,185-304, Oxford, UK: Oxford UP.
Kahneman, D. and A. Deaton, 2010, High income improves evaluation of life but not emotional well-being, http://www.pnas.org/content/107/38/16489.long.
Kahneman, D. et al., 2010, “The structure of well-being in two cities: Life satisfaction and experienced happiness in Columbus, Ohio and Rennes, France”, in E. Diener, J.F. Helliwell and D. Kahneman (eds.), International differences in well-being, Oxford: Oxford UP, 16-33.
Kasser, T. and R.M. Ryan, 2001, “Be careful what you wish for: Optimal functioning and the relative attain-ment of intrinsic and extrinsic goals”, in P. Schmuck and K.M. Sheldon (eds.), Life goals and well-being. Towards a positive psychology of human strifing, Kirkland WA: Hogrefe and Huber.
Kasser, T., 2006, “Materialism and its alternatives”, in M. and I.S. Csikszentmihalyi (eds.), A life worth living: Contributions to positive psychology, Oxford, UK: Oxford UP.
Koivumaa, H.H. et al., 2001, “Life satisfaction and suicide: A 20-year follow-up study”, American Journal of Psychiatry, 158(3), 433-39.
Krueger, A. and D. Schkade, 2007, “The reliability of subjective well-being measures”, Journal of public Economics, 92, 1833-45.
Kruse, D. and J. Blasi, 1995, Employee ownership, employee attitudes, and firm performance, NBER Working Paper, (5277).
Layard, R., 2003, Happiness: Has social science a clue? Lionel Robbins Memorial Lecture 2002, http://cep.lse.ac.uk/events/lectures/layard/RL050303.pdf
Layard, R., 2005, Happiness: Lessons from a New Science, Penguin UK, 2005.
Layard, R. et al., 2008, “The marginal utility of income”, Journal of Public Economics, 92(8-9), 1846-1857.
Layard, R. et al., n.d., “The causes of happiness and misery”, in J. Helliwell et al. (eds.), World happiness report, n.d., 58-89.
28
Lucas, R.E. et al., 2004, “Unemployment alters the set-point for life satisfaction”, Psychological Science, 15, 8-13.
Luechinger, S., 2009, “Valuing air quality using the life satisfaction approach”, Economic Journal, 119 (March), 482-515.
Luechinger, S. et al., 2010, “Why does unemployment hurt the employed? Evidence from the life-satisfaction gap between private and public sector”, Journal of Human Resources, 45(4), 998-1045.
Mulgan, G., 2013, “Well-being and public policy”, in S. David, I. Boniwell and A. Conley-Ayers (eds.), Oxford Handbook of Happiness, 517-32.
Noll, H. and S. Weick, 2010, “Subjective well-being in Germany: evolutions, determinants and policy implications”, in B. Greve (ed.), Happiness and social policy in Europe, Cheltenham: Elgar, 70-88.
Norton, M.I. and D. Ariely, 2011, “Building a better America – One wealth quintile at a time”, Perspectives on Psychological Science, 6, 9-12.
OECD, 1995, Employment Outlook, Paris: OECD.
Oswald, A.J., 1997, “Happiness and economic performance”, Economic Journal, 107, 1815-31.
Oswald, A.J. and N. Powdthavee, 2005, Does happiness adapt? A longitudinal study of disability with implications for economists and judges, Department of Economics, University of Warwick.
Prescott, E.C., 2004, “Why do Americans work so much more than Europeans?”, Federal Reserve Bank of Minneapolis Quarterly Review, 28(1), 2-13.
Prisching M., 2009, “Fetisch Wachstum. Die politische Ausweglosigkeit der Steigerungsprogrammatik”, Wissenschaft und Umwelt interdisziplinär, 13, 136-49.
Putnam, R.D., 2001, Bowling alone: The collapse and revival of American community, New York: Simon & Schuster.
Rehdanz, K. and D. Maddison, 2005, “Climate and Happiness”, Ecological Economics, 52(1), 111-125.
Runciman, W.G, 1966, Relative deprivation and social justice, Henley, UK: Routledge.
Sacks, D.W. et al., 2010, Subjective well-being, income, economic development and growth, NBER Working Paper, (16441).
Safer, M., 2008, And the happiest place on earth, CBS News, cited in Tov and Au, 2013, 453.
Sandvik, E. et al., 1993, “Subjective well-being: The convergence and stability of self and non self report measures”, Journal of Personality, 61(3), 317-42.
Shedler, J. et al., 1993, “The illusion of mental health”, American Psychologist, 48(11), 117-31.
Stevenson, D. and J. Wolfers, 2008, “Economic growth and subjective well-being: Reassessing the Easterlin Paradox”, Brookings Papers on Economic Activity Spring 2008, 1-87.
Stutzer, A. and B.S. Frey, 2007, “What happiness research can tell as about self-control problems and utility misprediction”, in B.S. Frey and A. Stutzer, Economics and psychology. A new promising cross-disciplinary field, Cambridge, MA: MIT Press, 169-95.
Suh, E.M., 2000, “Self, the hyphen between culture and subjective well-being”, in E. Diner and E.M. Shu (eds.), Culture and subjective well-being, Cambridge, MA: MIT Press, 63-86.
Thompson, S. et al., 2013, “Well-being and Sustainable Development”, in S. David, I. Boniwell and A. Conley-Ayers (eds.), Oxford Handbook of Happiness,498-516.
Tichy, G., 2013, Finanzkrise und Lebenszufriedenheit, Wirtschaft und Gesellschaft 39(3), 323-42.
Tkach, C. and S. Lyubomirsky, 2006, “How do people pursue happiness? Relating personality, happiness increasing strategies and well-being”, Journal of Happiness Studies, 7, 183-225.
Tov, W. and E.W.M. Au, 2013, “Comparing well-being across nations: Conceptual and empirical issues”, in S. David, I. Boniwell and A. Conley-Ayers (eds.), Oxford Handbook of Happiness,(ed.), 448-64.
Uhde, N. 2010, “Soziale Sicherheit und Lebenszufriedenheit: Empirische Ergebnisse”, Perspektiven der Wirtschaftspolitik, 11(4), 407-39.

29
Veenhofen, R., 2000, “Freedom and happiness in forty-four nations”, in E. Diener and E.M. Suh (eds.), Culture and subjective well-being, Cambridge MA: Cambridge University Press, 257-88.
Vittersø, J., 2013, “Introduction to psychological approaches to happiness”, in S. David, I. Boniwell and A. Conley-Ayers (eds.), Oxford Handbook of Happiness, 11-16.
Weir, B., 2008, “Has Singapore found the secret to satisfaction?”, ABC News, cited in Tov and Au, 2013, 456.
Welsch, H., 2002, “Preferences over prosperity and pollution: environmental valuation based on happiness surveys”, Kyklos, 55(4), 473-94.
Wulfgramm, M., 2011, “Can activating labour market policy offset the detrimental life satisfaction effect of unemployment?”, Socio-Economic Review, 9, 477-501, doi:10.1093/ser/mwr006.
Project Information
Welfare, Wealth and Work for Europe
A European research consortium is working on the analytical foundations for a socio-ecological transition
Abstract
Europe needs a change: The financial crisis has exposed long neglected deficiencies in the
present growth path, most visibly in unemployment and public debt. At the same time Europe
has to cope with new challenges ranging from globalisation and demographic shifts to new
technologies and ecological challenges. Under the title of Welfare, Wealth and Work for Europe
– WWWforEurope – a European research consortium is laying the analytical foundations for a
new development strategy that enables a socio-ecological transition to high levels of
employment, social inclusion, gender equity and environmental sustainability. The four year
research project within the 7th Framework Programme funded by the European Commission
started in April 2012. The consortium brings together researchers from 33 scientific institutions
in 12 European countries and is coordinated by the Austrian Institute of Economic Research
(WIFO). Project coordinator is Karl Aiginger, director of WIFO.
For details on WWWforEurope see: www.foreurope.eu
Contact for information
Kristin Smeral
WWWforEurope – Project Management Office
WIFO – Austrian Institute of Economic Research
Arsenal, Objekt 20
1030 Vienna
T: +43 1 7982601 332
Domenico Rossetti di Valdalbero
DG Research and Innovation
European Commission

Partners
Austrian Institute of Economic Research WIFO Austria
Budapest Institute Budapest Institute Hungary
Nice Sophia Antipolis University UNS France
Ecologic Institute Ecologic Germany
University of Applied Sciences Jena EAH Jena Germany
Free University of Bozen/Bolzano FUB Italy
Institute for Financial and Regional Analyses GEFRA Germany
Goethe University Frankfurt GUF Germany
ICLEI - Local Governments for Sustainability ICLEI Germany
Institute of Economic Research Slovak Academy of Sciences IER SAVBA Slovakia
Kiel Institute for the World Economy IfW Germany
Institute of World Economics, RCERS, HAS KRTK MTA Hungary
KU Leuven KUL Belgium
Mendel University in Brno MUAF Czech Republic
Austrian Institute for Regional Studies and Spatial Planning OIR Austria
Policy Network policy network United Kingdom
Ratio Ratio Sweden
University of Surrey SURREY United Kingdom
Vienna University of Technology TU WIEN Austria
Universitat Autònoma de Barcelona UAB Spain
Humboldt-Universität zu Berlin UBER Germany
University of Economics in Bratislava UEB Slovakia
Hasselt University UHASSELT Belgium
Alpen-Adria-Universität Klagenfurt UNI-KLU Austria
University of Dundee UNIVDUN United Kingdom
Università Politecnica delle Marche UNIVPM Italy
University of Birmingham UOB United Kingdom
University of Pannonia UP Hungary
Utrecht University UU Netherlands
Vienna University of Economics and Business WU Austria
Centre for European Economic Research ZEW Germany
Coventry University COVUNI United Kingdom
Ivory Tower IVO Sweden