Embed Size (px)
Citation preview
i
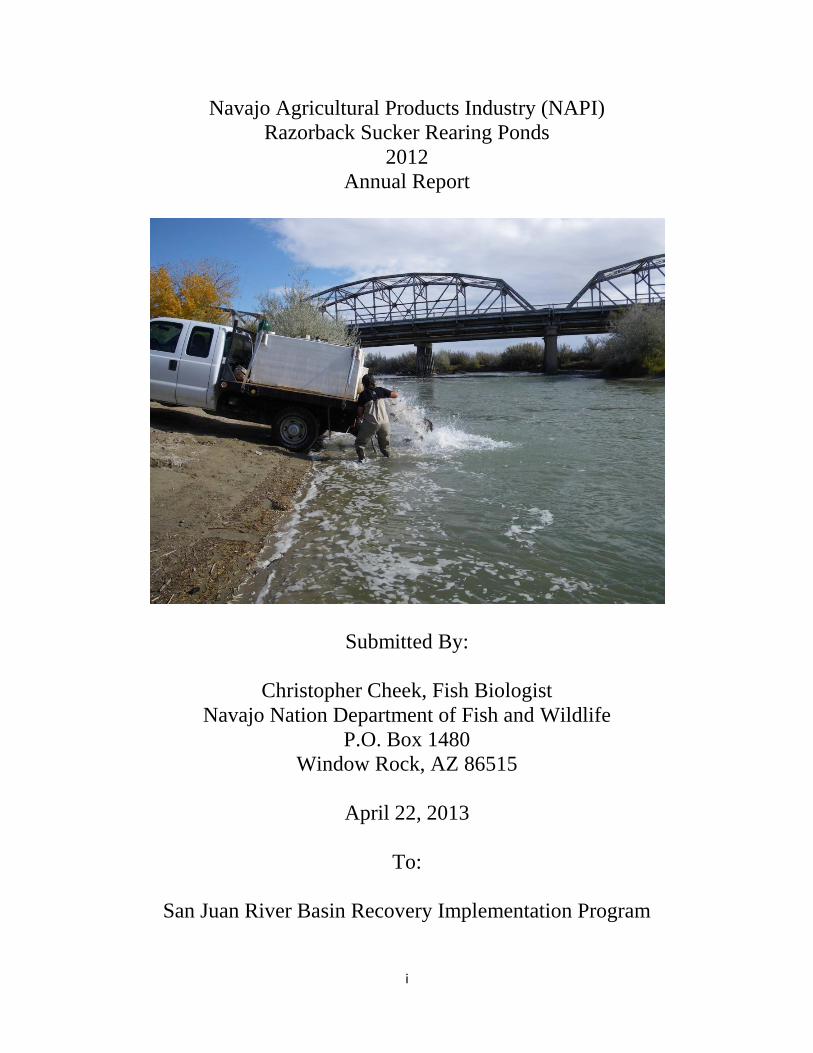
Navajo Agricultural Products Industry (NAPI)
Razorback Sucker Rearing Ponds
2012
Annual Report
Submitted By:
Christopher Cheek, Fish Biologist
Navajo Nation Department of Fish and Wildlife
P.O. Box 1480
Window Rock, AZ 86515
April 22, 2013
To:
San Juan River Basin Recovery Implementation Program
ii
Executive Summary
6000 razorback suckers received from Dexter National Fish Hatchery and stocked in
NAPI ponds
o 4268 harvested- 71% overall return rate
1992 fish harvested from East Avocet- 49.8% return rate
2276 fish harvested from Hidden Pond- 56.9% return rate
1458 fish were passively harvested
2810 fish were actively harvested
Reproduction occurred in Hidden Pond resulting in two size classes
NAPI stocking accounted for 27% of the 15,852 razorback suckers stocked by the SJRIP
into the San Juan River in 2012
iii
Table of Contents Pg
I. Executive Summary ……………………………………………………………………….. ii
II. Introduction ……………………………………………………………………….. 1
1. Justification/Relationship to SJRIP………………………….. 1
2. Razorback Augmentation/NAPI ponds……………………… 2
III. Methods sdd ……………………………………………………………………….. 3
1. Pond Preparation/Receiving Fish……………………………. 4
2. Daily Operations……………………………………………... 5
3. Monthly Operations………………………………………….. 6
4. Harvest and Stocking………………………………………… 7
5. Contingency Plan…………………………………………….. 8
IV. Results ……………………………………………………………………….. 9
1. Harvest……………………………………………………….. 9
2. Water Quality………………………………………………... 11
V. Discussion ……………………………………………………………………...... 11
VI. Literature Cited ……………………………………………………………………….. 12
1
INTRODUCTION
Justification/Relationship to SJRIP
The San Juan River, located in the upper portion of the Colorado River basin (Colorado, New
Mexico, Utah) harbors a native fish community which is severely threatened by both human induced
and natural, biotic and abiotic influences. The razorback sucker, Xyrauchen texanus, is one of eight
historically occurring native fish species, accompanied by 21 established populations of non-native
fishes (Holden 2000, SJRRIP 2006). The razorback sucker was listed as endangered under the
Endangered Species Act in 1991 as a result of severe declines in population numbers and lack of
recruitment across its native range, and is currently protected by federal, state, and tribal agencies
(USFWS 1991, Furr 2009). The decline in historical abundances of San Juan River endangered fishes
is thought to be a function of altered flow regime, loss of physical habitat through water
development, and negative interspecific species interactions attributed largely to the introduction of
non-native fish populations (Platania 1990, Brooks et al. 2000, SJRRIP 2010a). Protection and
recovery efforts of two endangered fish species (razorback sucker, and Colorado pikeminnow,
Ptychocheilus lucius) were initiated in 1992 through the formation and direction of the San Juan
River Basin Recovery Implementation Program (SJRRIP). Principal to the program are two over-
arching goals (SRRJIP 2010a);
1. To conserve populations of Colorado pikeminnow and razorback sucker in the Basin
consistent with the recovery goals established under the Endangered Species Act of 1973,
as amended, 16 U.S.C. §§ 1531 et seq. (ESA).
2. To proceed with water development in the Basin in compliance with federal and state
laws, interstate compacts, U.S. Supreme Court decisions, and federal trust responsibilities
to the Southern Ute Tribe, Ute Mountain Ute Tribe, Jicarilla Apache Nation, and Navajo
Nation.
2
The Navajo Nation did not initially participate in the program under the cooperative
agreement developed with other tribal, state, and federal agencies in 1992. However, through
consultation with the Navajo Nation tribal government and the SJRRIP program coordinator, the
Navajo Nation agreed to become an active participant in 1996 (SJRRIP 2010b). This cooperative
agreement, which was extended through 2023 in 1996, commits the Navajo Nation to represent tribal
interests in flow releases from Navajo Dam as it relates to endangered fish recovery (SJRRIP 2010b).
The Nation has also committed to operating the Navajo Agricultural Products Industry (NAPI)
razorback sucker rearing ponds managed for razorback sucker augmentation and recovery efforts,
through the Navajo Department of Fish and Wildlife (NNDFW). Under the broader goals and actions
developed by the SJRRIP and outlined in the Long Range Plan, the Navajo Nation’s obligation is
specifically characterized under task 1.2.2.2 as “RBS will be stocked annually into three NAPI grow-
out ponds with 3,000-3,500 (> 200 mm TL) hatchery-reared RBS produced at Dexter NFH
(expectation to harvest 40-60%) using a single cohort strategy; pit tag and stock 300 mm fish in 12
months. Eight-year time period, 2003-2011” (SJRIP 2010a).
Razorback Augmentation/NAPI Ponds
Experimental stocking of razorback sucker occurred between 1994 and 1996 which led to a
five year augmentation plan that called for the stocking of 73,482 razorback suckers in the San Juan
River (Furr 2009). After shortfalls of stocking during the five-year plan, a revised augmentation plan
was drafted in 2002 that called for the stocking of 11,400 age 2 (> 300 mm total length, TL)
razorback sucker annually for a period of eight years (Ryden 2003). These fish would be produced
and stocked by Uvalde National Fish Hatchery (Uvalde NFH) and the NAPI grow-out ponds.
Augmentation efforts in 2008 were complicated by problems with moving fish off station at Uvalde
NFH and only one of the three NAPI grow-out ponds were utilized for production (Furr 2009).
Razorback suckers provided by Dexter National Fish Hatchery and Technology Center (Dexter
NFHTC) were stocked into three ponds on NAPI lands beginning in 1998, and in 2001 an additional
3
six ponds were constructed for rearing razorback sucker. Young-of-year (YOY) razorback sucker
were stocked in the spring and harvested in late summer/fall. Due to recommendations in size of fish
stocked into the San Juan River, fish < 300 mm TL were left in ponds for one more year of growth.
Overwintering fish, stocking YOY in the spring, and some limited in-pond reproduction, created
multiple cohorts in the ponds (Furr 2009). Beginning in 2007, the SJRRIP adjusted the multiple
cohort strategy in favor of a single cohort strategy to limit problems associated with harvesting
multiple cohorts. Due to difficulties in harvesting the “six-pack” ponds constructed in 2001, in the
fall of 2007 the SJRRIP Biology Committee requested that the six-pack ponds be taken out of
production in 2008 and efforts focused on the three NAPI grow-out ponds (East Avocet, West
Avocet, and Hidden Ponds) (Furr 2009).
METHODS
Management of the NAPI razorback sucker grow-out ponds is the responsibility of the
NNDFW aided by U.S. Fish and Wildlife Service, Region 2 (hereafter known as the Service),
under direction and guidance from the SJRRIP. Fish are spawned and reared at Dexter NFHTC
prior to rearing efforts at the NAPI facility, and the remaining grow-out period to target size is
achieved through active management of daily monitoring, monthly population sampling, and
ultimately harvest and stocking into the San Juan River. The grow-out period typically spans
from mid-April through the first week of November.
Pond Preparation/Receiving Fish
Prior to receiving fish, each pond is evaluated post-harvest during the de-watered period
for structural integrity by examining bank erosion, bed slope, invasive vegetation, and graveled
slopes. If modifications or repairs are needed, consultation with SJRIP is conducted and typically
work is implemented through NAPI or Keller-Bliesner Engineering. Also examined for structural
soundness are the irrigation lines that feed water to the ponds from the NAPI distribution units
4
(DU), the draining siphons, pond kettles, and associated valves. If repairs or replacement parts
are needed, NAPI typically provides parts and labor if NNDFW is unable to implement the
repairs.
Water becomes available through the NAPI irrigation network for pond filling by early to
mid March, and NNDFW coordinates with the NAPI control center to pressurize the DU’s
associated with each pond and commence filling. Hidden pond fills in approximately 7 days,
whereas Avocet East and West fill in approximately 9 days. The Avocet ponds are pressurized
by the same DU, but achieve simultaneous filling through a split irrigation line. Once filling is
completed, each pond’s siphon is tested to ensure adequate drainage. Water quality (dissolved
oxygen, pH, and temperature) is monitored each day to ensure an optimal environment before
fish are released into the ponds. Typically, water quality monitoring is conducted no less than
two weeks prior to receiving fish to establish there are no widely fluctuating metrics that may
have negative effects on fish; however, the availability of the fish and the need to distribute fish
from DNFHTC and water availability often will dictate the amount of time available for pre-
stocking water quality monitoring. Razorback sucker stocking into NAPI ponds is coordinated
through the Service, DNHFTC, and NNDFW. Fish are received in early to mid April at
approximately 3,500 fish per pond, with an average total length that ranges yearly from 150-
250mm TL.
Daily Operations
Active management is achieved through daily water quality monitoring, feeding, and
invasive aquatic vegetation removal. Water quality parameters include dissolved oxygen
concentrations, pH, water temperature, and conductivity. Measurements are conducted twice a
day, morning and afternoon, at three locations of each pond (middle, east side, and west side). At
5
each location measurements are taken at the surface and one foot above the bottom. This
monitoring schedule allows evaluation of changes in abiotic conditions over day and night. It
also allows evaluations of subtle changes that may be trending toward lower water quality
standards and provides time to implement measures to reverse the trends.
Optimum D.O. concentrations range from 7 – 10 mg/L and pH from 7-9. No large
fluctuations of pH outside of optimum range have been observed; however, liming would be
implemented if extended periods of acidic conditions occurred. Protocol for liming will be
developed and included in a NAPI pond management plan, currently being drafted. D.O.
concentrations become a stressor for fish when levels drop to or below 5 mg/L for extended
periods. If these levels are observed for greater than 24 hours, pond flushing is initiated and will
last until a desired increase in D.O. is observed (usually 24-48 hours).
Fish are fed each morning (if needed) based upon growth rate calculations from monthly
sampling efforts (elaborated further under “Monthly Operations”). If aquatic vegetation is
relatively dense, feeding is reduced, as razorback sucker will also feed on the vegetation. This
helps minimize the potential of having too many nutrients in the system which can rapidly
increase vegetation densities, thus decreasing oxygen availability as it decomposes, as well as
adding excessive nitrogen. Both place unintentional stress upon the fish by limiting oxygen and
limiting their ability to regulate nitrogen concentrations. Feed is distributed evenly throughout
the pond via boat and manual hand feeding.
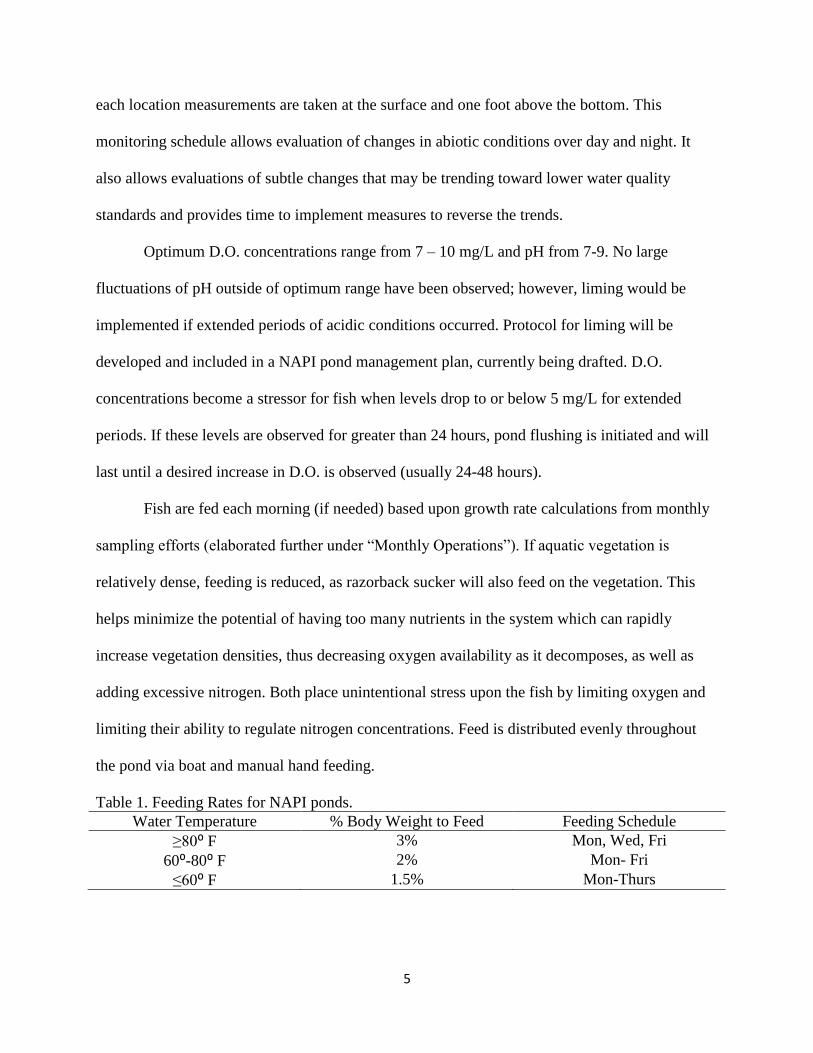
Table 1. Feeding Rates for NAPI ponds.
Water Temperature % Body Weight to Feed Feeding Schedule
≥80⁰ F 3% Mon, Wed, Fri
60⁰-80⁰ F 2% Mon- Fri
≤60⁰ F 1.5% Mon-Thurs
6
Aquatic vegetation poses problems with each pond through rapid growth of pond weed,
Potamogeton spp., often growing in densities above the recommended management target level
of less than 30% surface area (Lamarra 2005). Some vegetation is welcome, as it helps produce
oxygen and contributes to suspended solids, limiting light penetration, which in turn aids in
limiting further vegetative growth. However, high densities of aquatic vegetation can
dramatically reduce DO levels as it decomposes, a condition typically occurring in the hottest
and longest days of the summer. Manual removal occurs when vegetation becomes too
extensive. Vegetation can effectively be kept at manageable levels by towing an 8’x 1” diameter
cable d behind a boat at approximately twenty feet. We estimated that approximately 100-200
pounds of vegetation can be removed per week to maintain optimal water quality when
vegetation is extensive.
Monthly Operations
Once each month (generally the 15th of each month), standardized sampling is conducted
in each pond to track growth rates, calculate feeding rates, and evaluate the general condition of
the fish. Three fyke nets (two throated, 3’x4’ rectangle front entrance, twelve feet long) are set in
each pond the afternoon prior to sampling and left overnight with an effort of approximately 14
hours per net. A minimum of 30 fish must be captured for adequate representation and if there
are greater than 30 individuals, all fish in the net are sampled to avoid biasing the sample. If
there are less than 30 individuals, those fish are processed, as well as all the fish in the next net,
and so on until a sufficient representation is met. Total length (mm) and weight (g) are recorded,
as well as the general condition of the fish. As fish approach the target San Juan River stocking
size (300mm), the ponds may be sampled more frequently to ensure target size is reached before
harvesting fish. Feeding rates are calculated on a monthly basis according to growth rates. The
7
calculation is based upon water temperature and average weight of the sampled individuals
extrapolated to the total number of fish per pond (Table 1).
Harvesting and Stocking
Active and passive methods of harvest are implemented for removing fish from the pond.
Fyke nets are used for passive harvest and active harvest consists of draining the ponds and
capturing fish using a seine. By reducing the total number of fish requiring immediate capture,
passive harvest reduces stress that occurs when the ponds are drained. It also allows a more
logistically feasible method for capturing a large number of individuals with limited personnel.
Passive harvest begins when at least 80% of the population has reached or surpassed the target
stocking size of 300mm. This usually occurs after approximately 4 ½ to 5 months of grow-out
after receiving the fish from Dexter NFHTC. During passive harvest, nine fyke nets of the same
size are set overnight, for a total of approximately 126 fyke-net hours. Captured fish are held in
an aerated tank located on the boat and each fish is measured for TL (mm), SL (mm), and weight
(g). Fish captured which do not meet target size are returned to the pond for further growing.
Each individual harvested receives a 134.2 kHz Passive Integrated Transponder (PIT) tag and
placed into a hauling tank with aeration and supplemental oxygen.
Active harvest generally occurs during the first week in November (approximately 7
months of growing) when pond temperatures and river temperatures are relatively similar, target
size has been met for all individuals, and the Service is available to aid with the effort. Each
pond is drained separately for harvesting to avoid de-watering and stranding fish. Each pond
drains in roughly 30 to 36 hours. As a pond drains, fish are funneled toward a kettle (a low lying
channel) where the siphon is located. The fish are then captured in a seine and hauled to portable
aerated tanks where the fish are processed as described for passive harvest. Total length,
8
standard length, and weight are recorded for a sample of the first 100 to 200 individuals, and
total length is the only metric recorded for the remaining fish. All fish receive a PIT tag and are
placed into an aerated, oxygenated hauling tank.
San Juan River stocking of NAPI fish occurs in several areas of the river, generally
between river mile 147.9 (Shiprock bridge) and 196.1 (Bloomfield Riverwalk Park). Before
releasing, water temperatures of the tank and river are measured and the fish are acclimated
according to the temperature differential one hour for every three degrees Celsius (Manuel
Ulibarri, personal communication).
Contingency Planning
There are currently few protocols in place for managing the NAPI ponds during
emergency periods of unforeseen water quality problems, fish health issues, and complications
with physical aspects of the ponds (i.e., structure, irrigation, etc). The existing nature of
management during problems with water quality (most commonly associated with low D.O.
levels) is to flush the ponds, resetting water quality parameters. If issues occur regarding water
quality or fish health that the NNDFW cannot attribute the cause to, personal communication
with Manual Ulibarri (Dexter NFHTC) and various personnel within the SJRRIP (e.g., Jason
Davis and Weston Furr –the Service), is conducted and management actions are implemented
upon expert recommendations. Matters regarding pond structural and irrigation repair are
typically implemented through NAPI personnel or through consultation with the SJRRIP and a
recommended action is taken.
9
Results
Harvest
We received 6000 razorback suckers from DNFHTC in April 2012. East Avocet and
Hidden pond were stocked with 3000 razorback suckers each. West Avocet was left fallow
during the 2012 season because the kettle and drain required major repairs. Passive harvest
occurred between August 8 and September 18, 2012 resulting in the capture of 1458 fish, 34% of
the total harvest. A total 2810 (66% of total harvest) fish were actively harvested from the two
ponds. All fish were acclimated to river temperatures and stocked at various locations in the
upstream reaches of the river (Table 3). A total of 4268 fish were harvested from all ponds with an
overall return rate of 71.1%.
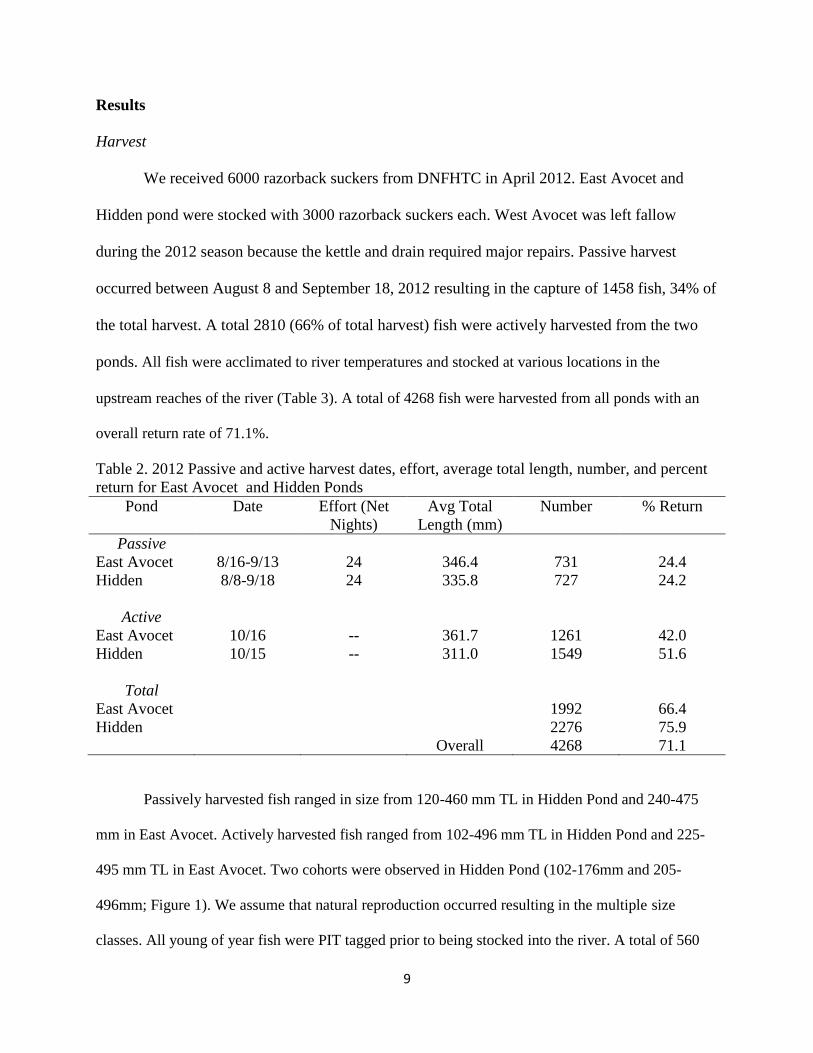
Table 2. 2012 Passive and active harvest dates, effort, average total length, number, and percent
return for East Avocet and Hidden Ponds
Pond Date Effort (Net
Nights)
Avg Total
Length (mm)
Number % Return
Passive
East Avocet 8/16-9/13 24 346.4 731 24.4
Hidden 8/8-9/18 24 335.8 727 24.2
Active
East Avocet 10/16 -- 361.7 1261 42.0
Hidden 10/15 -- 311.0 1549 51.6
Total
East Avocet 1992 66.4
Hidden 2276 75.9
Overall 4268 71.1
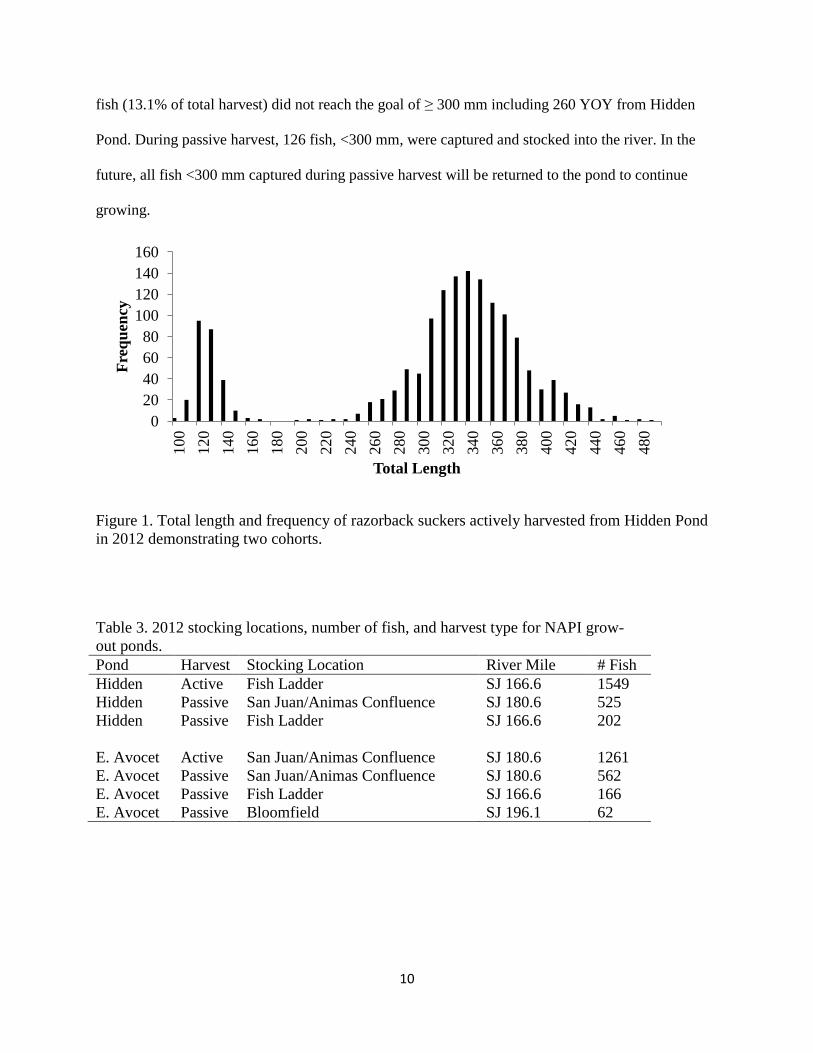
Passively harvested fish ranged in size from 120-460 mm TL in Hidden Pond and 240-475
mm in East Avocet. Actively harvested fish ranged from 102-496 mm TL in Hidden Pond and 225-
495 mm TL in East Avocet. Two cohorts were observed in Hidden Pond (102-176mm and 205-
496mm; Figure 1). We assume that natural reproduction occurred resulting in the multiple size
classes. All young of year fish were PIT tagged prior to being stocked into the river. A total of 560
10
fish (13.1% of total harvest) did not reach the goal of ≥ 300 mm including 260 YOY from Hidden
Pond. During passive harvest, 126 fish, <300 mm, were captured and stocked into the river. In the
future, all fish <300 mm captured during passive harvest will be returned to the pond to continue
growing.
Figure 1. Total length and frequency of razorback suckers actively harvested from Hidden Pond
in 2012 demonstrating two cohorts.
Table 3. 2012 stocking locations, number of fish, and harvest type for NAPI grow-
out ponds.
Pond Harvest Stocking Location River Mile # Fish
Hidden Active Fish Ladder SJ 166.6 1549
Hidden Passive San Juan/Animas Confluence SJ 180.6 525
Hidden Passive Fish Ladder SJ 166.6 202
E. Avocet Active San Juan/Animas Confluence SJ 180.6 1261
E. Avocet Passive San Juan/Animas Confluence SJ 180.6 562
E. Avocet Passive Fish Ladder SJ 166.6 166
E. Avocet Passive Bloomfield SJ 196.1 62
0
20
40
60
80
100
120
140
160
100
120
140
160
180
200
220
240
260
280
300
320
340
360
380
400
420
440
460
480
Fre
qu
ency
Total Length
11
Water Quality
Water quality was evaluated on a daily basis; however because of a change in personnel and
theft of a computer, the water quality data were incomplete. The available data suggests that over the
course of the grow-out period, water quality parameters remained adequate for optimum growth, with
the possible exception of times of extensive aquatic vegetation growth. During the low D.O. events,
each pond underwent intensive vegetation removal along with pond flushing, resulting in a return to
optimum water quality conditions. Special attention should be paid to data management and
electronic backup (using external hard drives) in the future to reduce the likelihood of lost data.
DISCUSSION
Several aspects of 2012 NAPI management seemed to contribute significantly to the overall
successful return rates. The ability to passively harvest a large number of fish by dramatically
increasing catch effort greatly reduced the stress placed upon the remaining fish during active
harvest, as there were less fish congregated together in the de-watered pond and less time
required for processing. Active management of the ponds through increased effort and consistent
water quality monitoring allowed a much faster response to poor water quality events and the
ability to better predict the likelihood of poor water quality under certain conditions. We were
able to preemptively flush ponds to regain adequate water quality before any major problems
occurred.
Overall return rates were slightly less than those in 2010 and 2011. Return rates seem to
fluctuate on an annual basis with no one pond having significantly higher return rates. For
example, in 2010 East Avocet had the highest return rate of 90%, but in 2011 and 2012 had the
lowest return rate of 56% and 66%, respectively. With the limited data available (2010-2012),
Hidden Pond had the highest average return rate of 78.3%, compared to 70.6% and 74.5% at East
and West Avocet, respectively. With better monitoring of water quality and feeding rates, we
12
may be able to gain a better understanding of why some ponds are producing more than others.
Also, more years of data may allow us to better understand underlying trends. Significantly less
fish were stocked into the river from the NAPI ponds in 2012 due to inability to operate West
Avocet pond.
The most interesting event of the 2012 harvest was the discovery of YOY fish. These fish are
assumed to have been spawned during the grow-out period between April and October. This is
the first known reproduction that has occurred in the NAPI ponds since the implementation of
the single cohort strategy. We now know that hatchery reared razorback suckers can produce
viable eggs and larvae that are capable of recruiting under the right condition. In the future, we
should consider the importance of lentic habitats for razorback sucker reproduction and
recruitment.
Considering the deficiencies and successes in 2012, there are several aspects which the
Navajo Nation will improve upon and consider under SJRRIP direction and consultation for
2013 and future management;
1) All data will be digitally updated and backed up every week to minimize the potential for
lost data. This will ensure having the necessary data to conduct a full analysis for future
reporting and assessment of trends over the grow-out period.
2) Feeding rates will be calculated and recorded daily to insure proper feeding rates.
3) Repairs are completed and gravel was added to West Avocet and is in use for the 2013
season.
4) We will experiment with passive harvest techniques to increase capture rates and begin
passive harvest as soon as target size is achieved.
5) Multiple new stocking locations will be considered under SJRIP guidance.
13
LITERATURE CITED
Brooks, J.E., Buntjer, M.J., and Smith, J.R., 2000. Non-native species interactions:
Management implications to aid in the recovery of the Colorado pikeminnow
Ptychocheilus lucius and Razorback sucker Xyrauchen texanus in the San Juan River,
CO-NM-UT. San Juan River Basin Recovery Implementation Program, USFWS,
Albuquerque, NM.
Furr, W. D., 2009. San Juan River Razorback Sucker Augmentation 2009 Annual Report.
San Juan River Basin Recovery Implementation Program, USFWS, Albuquerque, NM
Holden, P.B., 2000. Program evaluation report for the 7-year research period (1991-1997).
San Juan River Basin Recovery Implementation Program, USFWS, Albuquerque, NM.
Lamarra, V. A. 2005. Razorback Sucker Growout Ponds Operation Manual: Navajo Indian
Irrigation Project. San Juan River Recovery Implementation Project, U.S. Fish and
Wildlife Service, Albuquerque, NM. 26 pp
Platania, S. P. 1990. Biological summary of the 1987-1989 New Mexico-Utah ichthyofaunal
study of the San Juan River. Report to the New Mexico Dept. of Game and Fish, Santa
Fe, NM, and the U.S. Bureau of Reclamation, Salt Lake City, UT. 143 pp.
Ryden, D. W. 2003. An augmentation plan for razorback sucker in the San Juan River:
An addendum to the five-year augmentation plan for razorback sucker in the San Juan
River (Ryden 1997). U.S. Fish and Wildlife Service, Grand Junction, CO. 32 pp.
San Juan River Basin Recovery Implementation Program. 2010a. Long-range plan. San Juan
River Basin Recovery Implementation Program, U.S. Fish and Wildlife Service,
Albuquerque, New Mexico.
San Juan River Basin Recovery Implementation Program. 2010b. Program Document. San Juan
River Basin Recovery Implementation Program, U.S. Fish and Wildlife Service,
Albuquerque, New Mexico.
San Juan River Basin Recovery Implementation Program, 2006. Final program
Document. San Juan River Basin Recovery Implementation Program, USFWS,
Albuquerque, NM
U.S. Fish and Wildlife Service. 1991. Endangered and threatened wildlife and plants: the
razorback sucker (Xyrauchen texanus) determined to be an endangered species. Dept. of
the Interior, U.S. Fish and Wildlife Service, Federal Register, 23 October 1991,
56:54957-54967.