Embed Size (px)
Citation preview

MIDLANDS STATE UNIVERSITY
FACULTY OF COMMERCE
DEPARTMENT OF MARKETING MANAGEMENT
The effects of product positioning on company performance. A case of grain marketing
board.
By
SITHOLE ANGELLA
R102089V
SUBMITTED TO THE MIDLANDS STATE UNIVERSITY
IN PARTIAL FULFILMENT OF THE BACHELOR OF COMMERCE
HONOURS DEGREE IN MARKETING MANAGEMENT
(HMRK)
YEAR 2014

i
MIDLANDS STATE UNIVERSITY
APPROVAL FORM
The undersigned certify that they have supervised the student, R102089V dissertation
entitled: The effects of product positioning on company performance, submitted in Partial
fulfilment of the requirements of the Bachelor of Commerce Honours Degree in Marketing
Management at Midlands State University.
………………………………… ……………………………..
SUPERVISOR DATE
…….…………………………… ……………………………..
CHAIRPERSON DATE

ii
MIDLANDS STATE UNIVERSITY
RELEASE FORM
STUDENT REGISTRATION NO: R102089V
DISSERTATION TITLE: The effect of product positioning on company performance. A
case of Grain Marketing Board Zimbabwe.
DEGREE TITLE: Bachelor of Commerce Marketing Management Honours Degree
YEAR THIS DEGREE GRANTED: 2014
Permission is hereby granted to the Midlands State
University Library to produce single copies of this
dissertation and to lend or sell such copies for private,
scholarly or scientific research purpose only.
PERMAMENT ADDRESS : 444 Pazororo
Mutare
CONTACT NUMBERS 0779399219/0773068830
SIGNED………………………………………………………………….
DATE: April 2014
.

iii
DEDICATION
This reseach is dedicated to my late parents, my young sister and my young brother, will always
thank God for making your dreams come true.

iv
ACKNOWLEDGEMENT
My first acknowledgements goes to my supervisor who worked with me for the completion
of my reseach. Also my sincere gratitude goes to Capernaum Trust who helped me a lot
through financial assistance. I also offer my deepest appreciation to my little son and my
husband for their consistent love, care and support. Their encouragements were of great
importance this study. Lastly l would like to acknowledge all my university friends whom l
shared ideas with during the course of this study.

v
ABSTRACT
The research was meant to assess the effects of product positioning on company performance.
A case study of Grain Marketing Board Zimbabwe was used. The objectives of this study were
to assess consumers brand association of the Silo products, to evaluate the impact of Silo brand
communication on brand awareness and to assess if Silo brand identity matches consumer
perceptions. Literature gaps were identified on the areas like the match between brand identity
and consumer perceptions. There were very few scholars that did the reseach on this area. In
this reseach, exploratory and descriptive research design was used. The researcher used non
probability sampling techniques which were convenience sampling and judgemental sampling.
Judgemental sampling was used in the administering of questionnaires to employees while
convenience was used while administering questionnaires to customers. A sample of 180
respondents was used and it contains 5 management, 5 wholesalers, 19 employees, 19 retailers
and 132 individual customers. Consumers have a negative perception towards the Silo brand.
Responses from the questionnaires show that the Silo brand is associated with poor quality and
the company relies heavily on salespeople and exhibitions to communicate the Silo brand to
the market. Brand awareness of the Silo brand is poor since it was noted that customers could
not distinguish the Silo brand logo from competitors. Moreover the Silo brand identity
mismatches with consumer perceptions. The perceptions of the customers’ shows that
customers have no trust in G.M.B products and that they associate the brand with poor quality.
Moreover they said the brand has no unique products and also that the products have short shelf
life. Also they complained that even their unique selling proposition is not matching with
consumer perceptions. The researcher recommends that G.M.B should run away from the
features/attributes approach of product positioning which emphasise a lot on the unique
features of products and services and should rather adopt competitor’s approach of product

vi
positioning where it deliberately compares itself to competitors as a means of gaining the
competitive advantage.

vii
TABLE OF CONTENTS
CONTENTS
APPROVAL FORM ................................................................................................................... i
RELEASE FORM ...................................................................................................................... ii
DEDICATION ......................................................................................................................... iii
ACKNOWLEDGEMENT ........................................................................................................ iv
ABSTRACT ............................................................................................................................... v
CHAPTER 1 .............................................................................................................................. 1
GENERAL INTRODUCTION .................................................................................................. 1
1.0 Introduction ...................................................................................................................... 1
1.1 Background of study ........................................................................................................ 1
1.2. Statement of the problem ................................................................................................ 3
1.3. Objectives ........................................................................................................................ 3
1.4 Research questions ........................................................................................................... 4
1.5Assumptions ...................................................................................................................... 4
1.6 Significance of study ........................................................................................................ 4
1.6.1To the company .......................................................................................................... 4
1.6.2To the researcher ........................................................................................................ 4
1.7 Delimitations .................................................................................................................... 5
1.8Conceptual Framework ..................................................................................................... 5
1.9Limitations ........................................................................................................................ 5
1.11Summary ...................................................................................................................... 6
CHAPTER TWO ....................................................................................................................... 7
LITERATURE REVIEW .......................................................................................................... 7
2.0 Introduction ...................................................................................................................... 7
2.1 Brief history of product positioning ................................................................................. 7
2.2To assess consumers’ brand association of Silo products. ................................................ 8
2.3Features of Brand Associations and their effect on intention to purchase ...................... 10
2.3.1 Strength .................................................................................................................... 10
2.3.2 Favourability ............................................................................................................ 10
2.3.3 Uniqueness............................................................................................................... 11
2.3.4 Relevance ................................................................................................................. 11
2.3.5 Number .................................................................................................................... 11
2.4Types of Brand Associations .......................................................................................... 11

viii
2.4.1 Self-Relevance ......................................................................................................... 12
2.4.2 Service ..................................................................................................................... 12
2.4.3 Merchandise............................................................................................................. 13
2.4.4 Store environment.................................................................................................... 13
2.5 Purpose for brand Associations and their contribution on intention to purchase........... 13
2.5.1 Differentiation ......................................................................................................... 13
2.5.2 Generation of positive brand attitudes ..................................................................... 14
2.5.3 Aiding consumer Information retrieval ................................................................... 14
2.6 To evaluate the impact of brand communication on brand awareness .......................... 14
2.6.1 Effects of Social media activities on brand awareness ............................................ 16
2.6.2 Effects of corporate social responsibility on brand awareness. ............................... 16
2.6.3 Effects of advertising on brand awareness .............................................................. 17
2.6.4 Empirical evidence of the effect of brand parody on brand awareness. .................. 17
2.6.5 Effects of Trade shows and exhibitions on brand awareness .................................. 18
2.7 To explore if Silo brand identity matches consumer perceptions .................................. 20
2.7.1 Empirical evidence on impact of brand identity on consumer perceptions. A case of
Cinthol soap brand. ........................................................................................................... 22
2.7.2 Benefits of brand identity that matches with consumer perceptions. ...................... 22
2.8Summary ......................................................................................................................... 23
CHAPTER THREE ................................................................................................................. 24
RESEARCH METHODOLOGY............................................................................................. 24
3.0 Introduction .................................................................................................................... 24
3.1 Research Methodology ................................................................................................... 24
3.2 Research Design ............................................................................................................. 24
3.3 Population.................................................................................................................. 25
3.4 Sampling.................................................................................................................... 26
3.4.1 Sample Frame ........................................................................................................ 26
3.4.2 Sampling procedure and Technique................................................................... 26
3.4.3 The Sample size ................................................................................................. 27
3.5 Sources of Data ......................................................................................................... 28
3.5.1 Secondary data ................................................................................................... 28
3.5.2 Primary data ....................................................................................................... 28
3.6 Reseach Instruments. ...................................................................................................... 28
3.6.1 Questionnaire ........................................................................................................... 28
3.6.2 Interview ............................................................................................................ 29

ix
3.6.3 Document Analysis ............................................................................................ 29
3.7 Data Collection Procedures ............................................................................................ 30
3.8 Validity and Reliability ............................................................................................. 30
3.9 Data Analysis and Presentation ................................................................................. 30
3.10 Summary ................................................................................................................... 31
CHAPTER 4 ............................................................................................................................ 32
DATA PRESENTATION, ANALYSISAND INTERPRETATION ...................................... 32
4.0 Introduction .................................................................................................................... 32
4.1 Response rate.................................................................................................................. 32
4.3 Respondents Demographics ........................................................................................... 33
4.4 Consumers brand association of the Silo products......................................................... 36
4.5 Impact of Silo brand communication on brand awareness. ........................................... 45
4.5.1 Sales Persons ........................................................................................................... 46
4.5.2Exhibitions ................................................................................................................ 48
4.5.3Logo .......................................................................................................................... 49
4.5.4 Choice ...................................................................................................................... 51
4.6 Silo brand identity matches consumer perceptions. ....................................................... 52
4.6.1Search for Silo brand ................................................................................................ 53
4.7 Summary ........................................................................................................................ 56
CHAPTER 5 ............................................................................................................................ 57
CONCLUSIONS AND RECOMMENDATIONS .................................................................. 57
5.0 Summary ........................................................................................................................ 57
5.2 Conclusions .................................................................................................................... 58
5.2.1 Consumers brand association of the Silo brand. ...................................................... 58
5.2.2 Impact of Silo brand communication on brand awareness. ..................................... 58
5.2.3 If Silo brand identity matches consumer perceptions. ............................................. 59
5.3Recommendations ........................................................................................................... 59
5.3.2Consumers brand association of the Silo brand. ....................................................... 59
5.3.3 Impact of brand communication on brand awareness. ............................................ 60
5.3.4 Recommendation on assessment of if Silo brand identity matches consumer
perceptions. ....................................................................................................................... 60
5.4Areas for further research. ............................................................................................... 60
REFFERENCE ........................................................................................................................ 61
APPENDIX 1: QUESTIONNAIRE FOR G.M.B EMPLOYEES ........................................... 64
APPENDIX 2: QUESTIONNAIRE FOR THE INDIVIDUAL CUSTOMERS ..................... 67

x
APPENDIX 3: QUESTIONNAIRE FOR RETAILERS AND WHOLESALERS. ................ 69
APPEDIX 4: INTERVIEW GUIDE FOR MANAGEMENT ............................................... 72

xi
LIST OF FIGURES
Figure 4.1 Age groups for individual customers 35
Figure 4.2 Individual customer’s Silo brand association on quality 39
Figure 4.3 Consumers Silo brand association on uniqueness of the products 41
Figure 4.4 Individual customers Silo brand association on shelf life 43
Figure 4.5 Individual customers Silo brand awareness through sales persons 47
Figure 4.6 Individual customer ability to differentiate Silo brand logo from competitors 50
Figure4.7 Customers first choice for Silo brand 51
Figure 4.8 Customers trust in Silo products 54
Figure 4.9 Retailers customer’s complaints of the Silo brand 56

xii
LIST OF TABLES
Table 3.1 Sample composition 27
Table 4.1 Questionnaire response rate 32
Table 4.2 Interview response rate 33
Table 4.3 Demographic for individual customers 34
Table 4.4 Employees period of working at G.M.B 35
Table 4.5 Silo brand association for individual customers 37
Table 4.6 Silo brand association for retailers 37
Table 4.7 Silo brand association for wholesalers 38
Table 4.8 Employees Silo brand association on quality 40
Table 4.9 Employees Silo brand association on uniqueness of the products 42
Table 4.10 Wholesalers Silo brand association on positive perceptions 44
Table 4.11 Retailers Silo brand association on positive perceptions. 44
Table 4.12 Individual customer Silo brand awareness. 45
Table 4.13 Company brand communication through sales persons. 48
Table 4.14 Individual customer Silo brand awareness through exhibitions 49
Table 4.15 Silo brand identity match with consumer perceptions. 52

xiii
Table 4.16 Individual customer’s perceptions towards Silo brand. 53
Table 4.17 G.M.B new products meeting customer of expectations. 55

1
CHAPTER 1
GENERAL INTRODUCTION
1.0 Introduction
This chapter mainly focused on introducing the study to the reader and the following key
features of this study are be highlighted, background of study, statement of the problem, main
objective aim of the research, methodology, delimitation of the study, limitations of the study
and the significance of the study.
1.1 Background of study
A lot of organizations are trying to manage the positions occupied by their products and are
using different positioning strategies to change consumer’s perceptions of the products. For a
product to be successful in the market, good quality and popularity of a brand are not enough,
brand positioning focuses on the process of creating and altering perceptions of consumers
about a firm’s products or brands (Crawford 1985).The product must occupy a clear,
distinctive, and desirable place relative to competing products in the minds of target consumers
(Kotler 2010, 45).
Within the beverage sector, Coca-Cola is one of the best recognized brands since the company
managed to strategically position itself in the market. By adopting strategic positioning, where
the company wants to have the same image around the world, the company built a strong brand
position. Consumers have come to perceive Coca-Cola as a part of their daily life where they
associate the brand with joy and happiness (www.coca-colacompany.com). This perception by
consumers leads to a high degree of loyalty and makes purchasing decision more automatic.
Moreover O.K Zimbabwe was successful in implementing is brand position.O.K brand is

2
associated with quality which then enhances it to have a competitive advantage
(www.okziminvestor.com).
Grain Marketing Board (G.M.B) is one organization that has been trying to change consumer’s
perception of its Silo products. The birth of the Silo brand in 1996 resulted in easy acceptance
of the brand on the market but it also faced stiff competition from Red Seal, Blue Ribbon, and
Chibataura. Silo products were known by customers as high quality products. This was further
enhanced by their unique selling proposition “Silo real taste for life”. The Silo brand managed
to build a positive perception in the mind of consumers. The G.M.B Silo products include silo
rice, silo roller meal, silo refined meal, silo ground coffee, silo coarse salt, silo fine salt, silo
chunks, silo jam pagoda rice, munch chewy maputi and also stock feeds. To effectively
communicate with its customers, G.M.B used aggressive advertising through newspapers.
Moreover, sales representatives and marketers also played a role in making the products well
known. These communication channels had a positive effect on sales performance.
Unfortunately things changed in 2005 when sales started to decline. This resulted in 50% sales
reduction by the end of 2006.According to the G.M.B Annual Report( December 2006 ) the
50% decline was from July 2006 to December 2006.In 2007 the Silo brand performed very
badly in the market and this was worsened by the economic hardships in the country. According
to the annual general meeting that was held in 2011, the statistics showed that the company’s
market share had decreased from 40% to 10% starting from 2009.To regain its market share
the company started to introduce new products. Pagoda rice was introduced in 2012 and it was
to compete with quality premium rice in the market such as Mahatma Rice. In 2013 G.M.B
also introduced Silo jam, Silo chunks, Dely flour and Munch chewy maputi. The products
failed to perform as per the company expectations. Kotler at al (2010) postulates that the
brand’s positioning must serve the needs and preferences of well-defined target market. The
introduction of Pagoda Rice which was positioned as G.M.B’s best quality rice did not satisfy

3
the customers. Pagoda was priced at a slightly higher price than Silo Rice. However, consumers
were not pleased to the extent that they lost their trust in G.MB’s products. Customers
complained that the rice did not cook well. Apart from that, their packaging quality changed to
low quality as evidenced by high breakages that were returned from deliveries. Also Dely Flour
which was said to be a ‘self-raising flour’ failed to do so. Customers complained and orders
for flour declined to zero (G.M.B Mutare Coffee sales report for May 2013).Also the awareness
of Silo brand by customers went down. According to the markets visits reports that are
conducted by the sales representatives, they showed that many consumers are not aware of Silo
brands and they also do not know that the brand belongs to G.M.B as compared to the
awareness of Probrands, Red Seal and many others.
1.2. Statement of the problem
G. M.B is facing stiff competition from its competitors and also a continuous decline in its
sales performance.G.M.B Silo products were known to be of high quality and it occupied 40%
of market share in 2009.However the market share decreased to 10% in 2011.Customers
complained that the packaging quality changed to poor quality since there seem to be a lot of
breakages. Moreover, customers complained that the rice does not cook well and also the self-
raising flour was not raising. What should G.M.B do to maintain its positioning for high
quality?
1.3. Objectives
To assess consumers’ brand association of the Silo products.
To evaluate the impact of Silo brand communication on brand awareness.
To explore if Silo brand identity matches consumer perceptions.

4
1.4 Research questions
Does brand association affect Silo products?
What are the effects of brand communication on brand awareness?
Does Silo brand identity matches consumer perceptions?
1.5Assumptions
The researcher assumed that:
Customers’ perceptions to the silo brand would remain the same during the period of
the study.
The respondents would be a true reflection of the population under study.
The respondents would be honest and faithful in providing the data.
The researcher would get maximum cooperation from Grain Marketing Board employees,
management and customers.
1.6 Significance of study
1.6.1To the company
This area of study might help the organization to improve on its overall performance through
implementation of good brand positioning. The results will also provide in with some brand
positioning strategies and how these strategies would improve the company’s competitive
advantage in the market.
1.6.2To the researcher
The study will help the researcher to broaden knowledge on the area of the study .Also at the
end of the study the researcher will have knowledge on how to carry out a reseach and would
be able to research in future.

5
1.7 Delimitations
The research considered respondents from Mutare region.
The research focused on product positioning strategies to be implemented.
The data used for this research range from 2011 to 2014.
1.8Conceptual Framework
1.9Limitations
The management was not disclosing all the information that they felt was sensitive
although the researcher emphasised that the data was strictly for academic purpose only.
Brand association towards
Silo
Effects of
product
positionin
g
Performance of
Silo brand
Intention to
purchase
Customer
perception
Awareness of
Silo brand Brand communication
towards Silo
Brand identity towards Silo

6
The researcher also faced challenges due to the shortage of time however the researcher
worked with the sample that could give accurate results.
1.10 Definition of terms and Abbreviations
The terms used in this study should be understood within the context below
G.M.B-Grain Marketing Board of Zimbabwe.
Product positioning-designing of company products or services and image based
on consumers perceptions relative to those of competitors.
1.11Summary
Looking at the general introduction of the company while describing the reseach problem of
the company, the chapter had also laid the foundation of the entire study by stating the
objectives of the reseach. Limitations, delimitations and general assumptions, of the study were
also laid. Reviewing of literature from different scholars was done in the next chapter so as to
gain some insights of what product positioning is all about and how it can help an organisation
to improve its sales performance.

7
CHAPTER TWO
LITERATURE REVIEW
2.0 Introduction
In this chapter the researcher aim was to provide literature that is relevant to the problem,
Literature was critically evaluated and comparisons and evaluations of where the scholars and
authorities differ was carried out. In this chapter the researcher will also go on further to
contextualise literature, making it relevant to the problem, summarise major findings and trends
,establish gaps in knowledge and state the role of current research.
2.1 Brief history of product positioning
In the historical development of marketing communications, product positioning is perceived
by other researchers as the final stage after product and image stages. (Karadeniz 2009).The
scholar further reviews that in the 1950’s and early 1960’s the product life cycle was more
considered however as a result of changes in the environment the basic features of that stage
become less competitive and each product was seen as almost a discovery where unique sales
proposal (U.S.P) had dominated the market. Product features and benefits become the most
important staff in communication themes after the late 1950’s and earl 1960’s.The period
where product features and benefits become more considered resulted when “me too products”
were produced and being the duplicates of the powerful brands that were leading in the market.
(Karadeniz 2009)

8
2.2To assess consumers’ brand association of Silo products.
Till et al (2011) propose that being generated to save the brand image and create meaning for
consumers, brand image can be unintentional or intentional. The scholars also added that by
using these brand associations managers are able to differentiate the brand from competitors
and also to position their brands without resulting in problems. In addition, the scholars
proposes that in order to positive influence consumer attitudes and purchase intentions it is
accepted that management of brand equity should demand associations that need to be
carefully selected, created and also maintained.
This is supported by Ergin et al (2006) who postulates that when consumers positively associate
with a particular brand, they accept, favour and desire that brand and this will eventually affects
their repurchase decisions. Ergin et al (2006) further expresses that it is therefore crucial for
companies to put a great effort in creating strong, unique, one -of-a-kind associations with their
brands. By doing so, they will be able to leave an imprint, a distinct position in the minds of
their consumers. Several theorists put forward that a web of associations assist to place a brand
in consumer’s memory and help them to remember (Till et al 2011).
Uggla (2005) postulates that brand associations may be referred to as corporate brand
association where corporate brand association is the links that a brand establishes to internal
and external partner associations such as brands, persons, places, product categories and
institutions and these associations add or subtract to end consumer image and equity derived
from the corporate brand. This is supported by scholar Dean (2004), who notes that anything
linked in a memory in relation to a brand is what is called brand associations. Dean (2004)
further expresses that brand associations that are positive provide marketers with the ways to
direct future product development, create advertising that appeals and also to secure and
develop market share. The scholar proposes that before considering how positive brand
associations can be made by marketers, organisations should first consider what they are doing,
9
the reason for them to pay attention to brand association in designing marketing strategies. An
analysis of the above scholars views reviews that for a customer to have intention to purchase,
brand association contributes a lot. This is because ability of a customer to associate a brand
with either personal experience or any other linkage will then enhance a customer to quickly
make a decision.
Brand associations if handled properly can create good brand image hence contributes to
customer intention to purchase. This was reviewed by the empirical evidence study by Cass
and Lim (2002) to find whether the consumer’s perceptions held by young consumers in
Singapore consisted of the non-product-related associations and also whether the associations
were related to consumers purchase intention and brand preference. The results showed that
non product related associations (personality, feelings, image congruency, perceptions and
price) affect customer’s intention to purchase. Dean (2004), goes on to say favourable opinions
(preference and intention to purchase) will be beard by consumers to brands that have:
Affordability and also value for money to its target market.
A brand-user-imaginary that is congruent with the self-image of the consumers in the
brand’s target market.
Feelings attached to it by consumers are positive.
Positive valuation of the brand personality traits by the consumers target market.
If the association is favoured by consumers, the good things about the association may be
carried over to a brand and hence drive to purchase intention. This is supported by Hyun Um
(2013), when he reviewed that consumers build an associative link between two nodes, such
as celebrity and the brand he or she endorses. However, the scholar also looked at the bad side
of this. He reviewed that when scandal or bad press occurs, the associative link forged through
the celebrity endorsement process will affect the evaluation of the celebrity endorser, the brand,

10
and purchase intention. This means that negative publicity about the celebrity endorser that is
being associated with the brand will negatively affect the purchase intention of the brand.
2.3Features of Brand Associations and their effect on intention to purchase
Till et al (2011) proposes five features of brand associations that are strength,
favourability/valence, uniqueness, relevance and number.
2.3.1 Strength
Till et al (2011) reviews that the intensity of the connection between the brand node and the
association is what is defined as the strength of association. According to the scholar,
associations have different strengths that is they are characterised by stronger or weaker
connections to the brand node. The more accessibility of the brand via spreading activation is
enhanced by the stronger the association is. This is also supported by James (2005) in his view
that brands with a very strong positioning based on intangible association have an advantage
over brands with a more practical or market positioning that is associations with feelings,
impressions and images.
2.3.2 Favourability
Till et al (2011), also reviews that favourability is the degree to which association is perceived
to be positive or negative feature for a brand. They added that marketers actually fight to create
more favourable associations since some associations are seen as more negative or positive
than others. Thus for the association to be well favoured by consumers, companies need to use
associations that are applicable to the marketed product. Thus for example if a company choses
to associate their brand with the celebrity, that celebrity should be popular and well favoured
by people. If the association is favoured, this will improve chances of intention to purchase.

11
2.3.3 Uniqueness
Till et al (2011), reviews uniqueness association as the degree to which the association is
perceived as a distinct and different brand feature within the product category. They argue that
some associations are more unique than others and this means that some associations may be
shared with many competing brands and be typical for a product category while others may be
unique to just one or a smaller number of brands.
2.3.4 Relevance
The relevance of the association is viewed as the number of people who perceive the
association as valuable, important and purchase decision driving feature for a brand within the
product category (Till et al 2011). In their addition to that, Till et al (2011) proposes that some
brand associations are more relevant to consumers than others and they gave an example of
Coca-Cola where the colour red is typically strongly associated with Coca-Cola.
2.3.5 Number
Till at al (2011), postulates that number is the number of associations in the consumer’s
associative network for a brand. However French and Smith (2013) argued that the number of
associations is insufficient to measure brand association strength. French and Smith (2013),
further express that the number of associations is important but so too is the structure (number
of first order, second order and tertiary associations) and how these associations are linked
together.
2.4Types of Brand Associations
James (2005) in his research notes that there are types of brand associations and they fall into
4 broad categories namely usage situations, product categories, product attributes and
customer benefits. According to Uggla (2006), brand association types are put under the word
partner associations. Uggla (2006) postulates that Partner associations are defined here as

12
associations secondary to the identity and more immediate territory of the corporate brand.
The author further expresses that associations are linked to the corporate brand and these
partner associations can be components, product categories, persons or even places with
desirable reputation and high levels of brand awareness. Uggla (2006) further subdivide these
partner associations into four broad categories that are brands products, places, product
categories and institutions. Summing up both Uggla’s and James’s types of brand
associations, Kwon and Lennon (2011) in their reseach come up with different types of brand
associations where they postulates that consumers associate brands in accordance with self-
relevance, service, merchandise and store environment.
2.4.1 Self-Relevance
Kwon and Lennon (2011), postulates that self-relevance associations include factors like user
imaginary, self-image congruency, institutional factors, uniqueness, overall brand impression
and popularity. The scholars further express that by user imaginary the consumer evaluate types
of consumers that may buy and use the brand’s merchandise, by self-image congruency
consumers evaluate whether the brand’s image fits his or her self-image or life style, by
institutional factors consumers evaluate how unique or similar the brand is in comparison with
other brands and lastly the social recognition of the brand.
2.4.2 Service
Kwon and Lennon (2011), postulates that by service associations’ consumers take into
consideration elements like sales people service, ease of return, service general and promotion
or advertising. Consumers will be evaluating sales people’s service performance, return and
refund policies, overall service evaluation and specific aspects of the brand’s advertisement.

13
2.4.3 Merchandise
Kwon and Lennon (2011), postulates that by merchandise associations’ consumers also
consider factors like merchandise style, price, merchandise quality, assortment variety, usage
occasion and also value for money. Here consumers evaluate styling and fashion ability of
merchandise, merchandise price range, material or construction quality of merchandise, level
of merchandise assortment variety, merchandise price and value comparison and lastly times,
places and occasions where the company’s merchandise may be used.
2.4.4 Store environment
Kwon and Lennon (2011),also notes that consumers associations on store environment also
include factors like experience and preference where consumers will be evaluating level of
experience with the brand and liking or disliking of the brand.
However Ergin et al (2006), reveals types of brand associations as linked to most effective
factors on brand associations which are the logo of the brand, the colour of the brand, country
that the brand belongs to, the cingle of the brand and the slogan of the brand.
2.5 Purpose for brand Associations and their contribution on intention to purchase
Dean (2004), notes 3 main purpose for brand associations which are differentiation, generating
positive brand attitudes and aiding consumer information retrieval.
2.5.1 Differentiation
Dean (2004) reviews that brand associations are able to differentiate the brands from
competitors since they give a certain brand an identity that is unique. The scholar postulates
that such differentiation is necessary and useful if the brand is to be defined and secure the
sales by promoting it.The scholar further expresses that differentiation can come from different
associations that include both positive and negative and also from those that are tangible and
intangible. However, there is need for marketers to understand the attributes of their brand that

14
sets it apart from competitors and also to believe that the attributes will enhance positive
difference.
2.5.2 Generation of positive brand attitudes
According to Dean (2004), the consumer’s attitude to the brand is a function of how the
consumer reacts to what he or she sees as the most important associations. Thus associating a
brand to certain links can generate in building up positive brand attitudes to the consumers and
when positive attitudes are build there are high chances of customers to want to purchase the
brand. In this study, the researcher seems to know whether the associations attached to Silo
brand are generating positive brand attitudes and also their effect on intention to purchase.
However Dean (2004), further express that different associations have different impacts on the
consumer and organisations should take note of that for example may be less significant than
the consumer’s experience of the product.
2.5.3 Aiding consumer Information retrieval
Dean (2004) review that consumer information about a brand is inconsistent and incomplete.
He proposes that the consumer’s ability to recall is assisted by the existence of positive brand
associations-“it’s the one in the big green box” or “Peter Kay does the advertising” and, as
already, noted some associations are far more important, stronger than others. Consumers of
course has some information about brands but for them to quickly remember they need to
associate the brand with something. When a consumer is able to retrieve information about a
brand its more likely that the consumer will have a high chance of intention to purchase than a
consumer who can’t even remember and have no information about that brand.
2.6 To evaluate the impact of brand communication on brand awareness
Marketing communication which is the strategy that organisations are using to persuade
consumers to buy their products is contained in the marketing communication programme or
15
promotional mix. Sagar et al (2011), states that effectiveness of brand communication is based
on identification of the right communication mix, media planning and the right impact on the
customer. Situma (2012), reviews that the communication mix consists of a set of tools that
could be used in different combinations and different degrees of intensity in order to
communicate with the target audience. These marketing communication tools include
advertising, personal selling, direct marketing, sales promotion, corporate social responsibility
and public relations. Effective implementation of these communication tools will then result
brand awareness.
Sagar et al (2011), note that there are 3 factors that determines overall awareness of a brand
and these are brand recall, top of the mind awareness and brand recognition. The scholars
further express that brand recognition is when the consumer is able to recognise the brand by
knowing their slogans, mascots, logos, ambassadors, symbols, jingles and many others. Also
they move on to say brand recall includes unaided and aided recall. Recalling a brand is the
ability of a consumer to list the brands in a particular product category. Top of the mind
awareness is higher position of the brand in the consumers mind and the consumer has the
highest chances of purchasing that brand if want to make a purchase in that product category.
In contradiction of that, Rudolf Esch et al (2006) review that brand awareness is important, but
a limited measure of success. Sawant (2012),postulates that brand awareness is when a buyer
is aware of the existence of the brand but the knowledge about it is limited and obviously has
no particular emotional attachment to it as a result he may or may not think of purchasing the
brand. In analysing Sawant’s and Sagar et al views of brand awareness, they seem to agree that
when a consumer is aware of the brand there is an element of knowledge about that brand.
However Sawant fail to express the degree of awareness which is to what level is the consumer
knowledge of the brand. Therefore the researcher prefers Sagar et al views of brand awareness.

16
2.6.1 Effects of Social media activities on brand awareness
Hutter et al (2013), on their reseach on how social media networks affect brand awareness
review that social media is a relevant marketing communication for brands. They further
express that the growing importance of applications like Facebook, YouTube and others in
consumers’ lives has an increasing influence on their communication habits. With consumers
spending more and more time in the social media realm, an increasing share of communication
occurs within these new social network environments. In respect to marketing communication,
this means that brand related interactions and exposure to marketing campaigns increasingly
take place within social media thus social media networks are now contributing a lot to brand
awareness. This is because we are now operating in a new technological environment where
everyone is spending most of time on these social media networks. Organisations should
therefor take advantage of that to aggressively market their brands on these social media. By
doing so there are high chances that every person who tends to use that social media will come
across the brand that is being marketed hence increase brand awareness. However Hutter et al
(2013), reviews that for social media to be effective companies should not engage in them
because other companies are doing it or because it is thought to be improvement for modern
and open image of brands. They further proposes that management should realise that social
media is a vibrant instrument of marketing which if applied correctly can build brand awareness
of the company
2.6.2 Effects of corporate social responsibility on brand awareness.
Scharf at al (2012), in their study to find out if organisations can achieve brand awareness
through marketing efforts like corporate social responsibility, in their study to analyse Bradesco
bank’s corporate social responsibility advertising as a contributor to brand awareness, results
showed that corporate social responsibility advertising can get results without using
commercial appeals. Bradesco has done corporate social responsibility specific advertising

17
with no commercial appeal, and has achieved significant brand awareness results. Evidence
showed that corporate social responsibility communication can be more effective when
performed without the use of commercial appeals. Moreover the study also reviews that
organisations belonging to segments that already have negative corporate images have no
impediment to build brand awareness through corporate social responsibility advertising. Thus
corporate social responsibility can be a success strategy to communicate the brand and enhance
brand awareness. This is because in this market environment consumers seem to favour brands
that are known by cooperating in their lives, community and many others (Scharf at al 2012).
2.6.3 Effects of advertising on brand awareness
It is argued that since brands are coming increasingly, every organisation’s need is the
confidence to deliver by none other than advertising which forms a vast superstructure with an
autonomous existence and an immense influence (Sawat 2012).The current business market
full of brands imitations, it is genuine that brand awareness becomes the main objective of
advertising. Advertising is the communication link between the seller and the buyer and it does
not simply provide information about the products and services but is an active attempt to
influencing people to action (Sawat 2012). Advertising enhances a brand to be easily
recognised since consumers will now be aware of that brand.Jean (2011), notes an advertising
communication strategy that can be used to improve brand awareness. Jean (2011), expresses
that brand parody can be used and it is mainly used to attack the competitors. Parody in
advertising is mostly linked to a well-known character, a book, an event, a movie, television
series. A competitor can be given permission to do brand parody in advertising.
2.6.4 Empirical evidence of the effect of brand parody on brand awareness.
In July 2006, Sony U.K authorised Tango to parody its bravia television spot. Indeed it was the
same scenario (different coloured balls, representing the pixels of an LCD screen, hurtle down
the streets of San Francisco).Tango a maker of fruit juices, simply transformed the balls into

18
fruits and used the same set and music. This authorised parody was perhaps linked to Sony’s
desire to appear in as many media as possible during the football world cup and to demonstrate
to competitors that only the best are copied (Jean 2011).The main aim of parody is to bring a
message that has the power to evoke laughter and this will improve the awareness of a specific
brand and inspire prescribed position towards it. Experiences are showing that remembrance
of advertisements is at its highest level when people are disclosed to humour. Thus when
consumers are able to remember the brands because they have seen it being advertised, the
results then is brand awareness (Jean 2011). However the scholar argued that parody is
effective if the audience targeted is aware of the original brand which is parodied.
2.6.5 Effects of Trade shows and exhibitions on brand awareness
Trade shows and exhibition are another communication tools that organisations can use to
market their products hence increase in brand awareness. It is when organisations are given
chance to display their products at a chosen area and have the opportunity to market their brands
to potential and existing customers and as a result this will increase brand awareness even to
those who were not familiar of the brand. Situma (2012) review that trade shows provided the
right environment through which exhibitors could advertise their products and services. The
scholar proposes that trade shows and exhibitions are the right place where personal selling is
put into place and customers who were not aware of the product will be aware. However Situma
(2012) postulates that the choice of trade show as marketing method is often influenced by the
organisation’s marketing objectives. The scholar put forward that there different reasons for
organisations to participate in trade shows and they include building brand awareness,
introducing new products, reach customers cost effectively, generate additional sales and gain
information about competitors.

19
2.6.6 Effects of Sponsorship on brand awareness
Sponsorship is also another communication strategy which organisations can use to gain
awareness. By sponsorship organisations choose to offer help or to donate activities. This can
be done by means of money or the organisation can offer its products so that they can be
consumed at the event. Companies usually offer to sponsor sports activities since there will be
a lot of people gathered hence brand awareness is enhanced.Tanvir and Shahid (2012),
reviewed that in today’s environment sports sponsorship plays a very wonderful function
towards consumers and people give a lot of value. Thus sports sponsorship plays a wonderful
function on establishing more prominent brand image which leads to brand awareness hence
more purchase intention.Tanvir and Shahid (2012),postulated that the companies that are
sponsoring the sports can influence the demand of purchasing products more effectively as
compared to other modes of promoting tools. This is because when an organisation chooses to
sponsor an event e.g. by offering its products, there are high chances that not all of the audience
at the event were aware of the product maybe in terms of its taste, function etc. As a result
those people that were not aware of the brand will be hence increased awareness to the brand.
Ghodeswar (2008), postulates that companies need to position their brands in the minds of
consumers. To achieve desired goals of their communication strategy, companies have to break
the clutter by evolving innovative ways to attract the attention of the target audience. Alongside
the traditional media channels like newspapers, magazines, television, hoardings, public
relations, etc., new media vehicles such as Internet, outdoor communications, sponsoring
events, etc. offer opportunities for consumer involvement. Such innovative approaches can
enable managers to minimize the impact of competition on their brands. Integrated brand
communications and creative repetition through various types of media is a key to success in
brand communications. Use of emotions in advertising appeals to the hearts and minds of the

20
consumers. A brand image should be created to establish an emotional relationship with the
target audience (Ghodeswar 2008).
2.7 To explore if Silo brand identity matches consumer perceptions
Srivastava (2010), postulated that brand identity are unique set of associations that the brand
strategist aspires to create or maintain. It is the way the organisation aspires to present itself to
consumers. The scholar further expressed that those associations represent what the brand
stands for and imply a promise to customers for the organisation. Srivastava (2010), also
reviewed that it is important that the unique selling proposition of a company’s product should
match with the unique customer perception. Srivastava (2010), further reviewed that the
difference between company realness and consumer perceptual experience has to be reduced
or rejected. Therefore marketers should play a big role so make sure that the identity of their
brands does not go out of control.
In support of the above views, Ghodeswar (2008) reveals that brand identity is a unique set of
brand associations implying a promise to customers and includes a core and extended identity.
The scholars seem to agree on the notion that brand identity involves the associations and these
associations tend to portray what it want to be perceived as by consumers. However Ghodeswar
(2008), divided brand identity into core and extended identity where core identity is the central,
timeless essence of the brand that remains constant as the brand moves to new markets and
new products. Core identity broadly focuses on product attributes, service, user, profile, and
store ambiance and product performance. Extended identity is woven around brand identity
elements organised into cohesive and meaningful groups that that provide brand texture and
completeness, and focuses on brand personality, relationship and strong symbol association
(Ghodeswar 2008).

21
In addition to that, Linderberg et al (2012), states that brand identity is a set of distinct
characteristics, applied in brand communication, making the brand meaningful and unique. In
their thesis on how brand identity and brand image are connected and gaps that can occur
between them, they proposed that it is important for a company’s brand identity to match their
customers’ brand image. Brand managements must continually monitor the relationship
between them, otherwise communication gaps can occur. Linderberg et al (2012), come up
with a conceptual model which divides brand identity into four concepts which are personality,
positioning, vision and culture and relationship. The gaps found in those elements can affect
the brand identity negatively. Overall, the gaps found in personality can negatively influence
customers’ brand perception and affect the customers’ benefit evaluation regarding the brand,
the gaps found in positioning can eventually affect customers’ brand perception and
memorization of the brand and also disturb the customers’ evaluation of the brand, the gaps
found in Vision & Culture could provide unfavourable associations to the brand and also the
gaps found in relationship could lead to negative effect on the differentiating factors and
indicates that the company has not managed to add value to their brand. It could also stagnate
innovation and success for the brand and have negative effects for profits (Linderberg et al
2012).
Brand identity is the company’s definition of itself. The identity structure has different levels
of identity associations the company wants to be attached to the brand that possess different
importance depending on the context. The brand identity structure includes the notion of brand
personality. As persons, brands have their roots in some origin that is most likely to affect their
personality (Valin 2012). Even though the brand identity provides a deeper understanding
about a brand, the brand image needs to be taken into considerations as well as it represents the
way consumers perceive the brand. None of the brand identity elements matter if these are not
communicated to the consumers and they will not associate these to the brand. A brand has

22
value only if consumers acknowledge its existence and associate the correct elements to it, in
other words, only if consumers’ brand image matches the brand identity defined by the
corporation (Valin 2012).According to viot (2011), brand identity warrants closer
consideration. Different conceptualizations of the construct prevail and essentially reflect the
various associations a marketer will generate for a brand in order to project a specific meaning
and differentiate it from rival offerings.
An analysis of the above views of brand identity shows that the scholars were talking the same
think but only that they expressed it in different ways. In simple words brand identity is the
opposite of brand image, it is what the brand is, its communication to the market and what it
wishes the consumers to perceive it.
2.7.1 Empirical evidence on impact of brand identity on consumer perceptions. A case
of Cinthol soap brand.
Cinthol is a contemporary brand and was launched by positioning itself as a masculine soap
with unique selling proposition of “protection from bad odour”. However soon the company
realised that it had to experiment by trying out new things and coming out with different
variants to be in tune with the changing consumer trends, the fast changing times and the
growing power of today’s women, Cinthol was repositioned to appeal to women. Cinthol has
flip-flopped between the macho male, the bubby flesh family and confident “women-about-
town”, resulting in a confused brand identity of the soap (Srivastava 2010)(Cinthol report 2006)
2.7.2 Benefits of brand identity that matches with consumer perceptions.
A strong brand identity that is well understood and experienced by the customers helps in
developing trust which, in turn, results in differentiating the brand from competition
Ghodeswar (2008). Moreover, by having a clear outward expression, companies can add
perceived value to the brand, which can affect customers’ evaluation process positively. It

23
could also make the brand stronger and more unique, considering more positive associations
would be connected to the brand Linderberg et al (2012).When brand identity is well
understood by consumers they tend to have a favourable perceptions to the brand and this could
lead to a positive influence over other messages related to the brand. Well managed brand
identity which matches with consumer perceptions can be of useful when a company decide to
introduce new products or to do product extensions. Viot (2011), postulates that through
attributes linked to its personal or social dimensions, brand identity enables greater accuracy
in estimating how a new product fits the parent brand. Additionally Viot (2011) believes that
brand identity helps to better predict which extensions will be accepted. However Viot (2011),
also review that negative impact on parent brand equity is possible even with extensions that
are coherent with brand identity. One suggestion here is that certain brands become too “widely
stretched”, resulting in extensions that are distant from original categories.
2.8Summary
This chapter searched at the literature related to the reseach topic and that has been derived by
different scholars and authors. Areas covered include brand communication, brand
association, brand identity and their contributions to brand awareness and consumer
perceptions. However literature gaps were identified on the areas like the match between brand
identity and consumer perceptions. There were very few scholars that did the reseach on this
area. The next chapter stresses on the procedures, processes and methods of collecting data.
24
CHAPTER THREE
RESEARCH METHODOLOGY
3.0 Introduction
In this chapter, the researcher give information and explanation on how the research was
conducted. In this way the chapter looked at the research methodology and the design of the
research. The population and sampling methods are explained along with the data collection
techniques, the data analysis plan and finally the summary.
3.1 Research Methodology
The researcher used both qualitative and quantitative research. The researcher choose to
employ qualitative reseach since it enables the researcher to reveal the target audience’s range
of behaviour and perceptions towards the Silo brand. Moreover by employing qualitative
reseach, the researcher was able to observe, record and interpret nonverbal communication
during the course of carrying out interviews. Quantitative research was also used by the
researcher since the researcher used some structured closed questionnaires for both customers
and employees.
3.2 Research Design
Basically there are three types of research designs which are exploratory research, descriptive
research and causal research. In this reseach, the researcher used both exploratory and
descriptive reseach. The researcher chose to employ exploratory reseach as it enabled the
researcher to interview those who have knowledge and also a deep understanding of the Silo
brand in terms of its association, awareness and also its identity. Moreover the researcher chose
to employ exploratory reseach since there is flexibility and the researcher was not forced to set
of questions.

25
Descriptive reseach design was selected by the researcher because during the interviews to
employees, customers and management there were some questions that requires to know
whether the respondents are aware of what really Silo is, about how they came to know about
the Silo, what marketing strategies are being used by G.M.B to achieve awareness. The
descriptive design allows the researcher to quantify the responses.
3.3 Population
The population for this reseach is made up of G.M.B management, employees and also its
customers. However the target population for this reseach is management and employees from
G.M.B Mutare Coffee and also the G.M.B customers (retailers, wholesalers and individual
customers) based in Mutare. The targeted population amounted to 250 (5 management, 20
employees, 5 wholesalers, 20 retailers and 200 individual customers). The researcher decide to
include employees in the target population since they are the ones who seem to have much of
interaction with customers during service delivery and they might be aware of some customer
perceptions towards Silo brand. Moreover, reseach objectives like evaluation of Silo brand
communication can be better answered by employees especially those in the marketing
department since they are the ones who are responsible for the implementation of marketing
strategies. Also management was included in case of questions that are a little bit complicated
and that employees cannot understand. Questions about the brand identity required the
management to attempt to them since they are the ones who are well versed with the company
vision, mission and objectives. Customers were chosen since they were going to contribute a
lot to the reseach results. Researcher’s objectives like assessment of the Silo brand awareness
and customer perceptions needed the views of the customers hence gave the researcher the
position to know the performance of the Silo brand.

26
3.4 Sampling
During the primary research, the researcher dealt with problems presented by large populations
of study units especially when the researcher was dealing with customers. The researcher used
non-probability sampling that is convenience and judgmental sampling methods.
3.4.1 Sample Frame
The whole management was sampled by the researcher and employees were chosen from the
marketing department, sales department and production department since they were the
departments that contain knowledge of how the Silo brand is performing .The production
department was chosen since they are the ones who are responsible for all the production
process and also delivering of orders.
3.4.2 Sampling procedure and Technique
3.4.2.1 Selection of management
Since the population of the management was small and also since the management were drawn
from different sections that is production department, marketing department and also the
human resource department, the researcher used census that is all the management were
sampled.
3.4.2.2 Selection of employees
The researcher used judgmental sampling to choose various employees from various
departments that is sales department, marketing department and production department so that
they would answer the questionnaires. This method was selected by the researcher because it
enabled the researcher to select only those who are more likely to give detailed information
required on the purpose of assessing the Silo brand performance.

27
3.4.2.3 Selection of customers
The researcher used convenience sampling on the selection of individual customers and
retailers. The researcher visited retailers that were convenient in terms of accessibility. Also
while the visited retailers were responding to the questionnaires the researcher was busy giving
questionnaires to individual customers in that particular retailer. However in the selection of
wholesalers the researcher used census sampling since there were few wholesalers hence all of
them were given questionnaires. The researcher also gave questionnaires to retailers who would
have come to order their goods in an in a particular wholesaler thus convenient sampling was
employed.
3.4.3 The Sample size
With the use of Krejcie and Morgan model (1970) of sample size determination, a total sample
of 180 respondents was used by the researcher.
Table 3.1: Sample Composition
Respondents Sample Size Selected
Management 5
Employees 19
Wholesalers 5
Retailers 19
Individual
Customers
132
Total sample units 180
28
3.5 Sources of Data
Primary and secondary data was used by the researcher.
3.5.1 Secondary data
The researcher also collected data from market visits reports, order book, sales reports and
annual reports so as to evaluate the Silo brand performance in terms of different variables which
are related to the reseach objectives.
3.5.2 Primary data
Primary sources included G.M.B customers, management and employees. Primary data was
obtained from employees and management at G.M.B Mutare Coffee with the means of a survey
that was be conducted through questionnaires to employees and face to face interviews with
management. Primary data was also used to add up to secondary data. Primary data was chosen
by the researcher because of its more reliability, more accuracy and also gave the actual
information required by the researcher.
3.6 Reseach Instruments.
The researcher used questionnaire, interviews and document analysis.
3.6.1 Questionnaire
Questionnaires were used by the researcher because they enable the employees to answer the
questions at their free time hence less chances of mistakes to be made. Also by leaving the
questionnaires, employees were able to fully understand the questions without rushing.
However in the case of customers, questionnaires were used since they enable the researcher
to ask closed ended questions that customers can easily understand hence easy analysis of data
by the researcher. Distribution of questionnaires was done to G.M.B customers and employees
at G.M.B Mutare Coffee. Closed ended questions was used by the researcher in the collection
of data. The corded structured questionnaire were targeting the employees and customers and

29
they were asked to make one choice from a list of possible responses. Information that was
collected using questionnaire include customers and employees perceptions towards the Silo
products, the customers awareness of the Silo products, the association of customers and
employees with Silo products and the employees communication of their brand. This
information enabled the researcher to evaluate the performance of the Silo brand.
3.6.2 Interview
The researcher chose to interview G.M.B management since it then allows them to express
their views and perceptions in relation to the Silo brand. Information of the Silo brand identity
was also be collected through interviewing management. This enabled the researcher to have
feedback regarding the performance of the Silo brand. Interviews to the management were
chosen by the researcher since the management seemed to have less time to attend to
questionnaires. In asking the questions, the researcher was guided by the set of questions which
were written down and responses from management were noted in a note book.
3.6.3 Document Analysis
An analysis of market visit reports, sales reports, order book and annual reports will be done
by the researcher. In the order book the researcher wanted to see whether there are new
customers especially retailers and wholesalers who has joined to place their orders at G.M.B
and the researcher was able to evaluate the Silo brand communication. In the market visit
reports the researcher was looking for customers’ views and perceptions hence was also able
to evaluate the consumers Silo brand association. Also by analysing the sales reports and annual
reports the researcher was looking for whether sales are increasing or decreasing hence be able
to evaluate the performance of the Silo brand.

30
3.7 Data Collection Procedures
To enable the researcher to conduct the research without some hindering factors, a letter from
the faculty was granted to the researcher so that it can be used for introductory purpose. After
collecting the letter, appointments were made by the researcher at G.M.B so as to avoid
inconveniences. This was be done by use of telephone. While approaching the organisation,
the researcher gave the faculty letter and his own letter to the receptionist who then proceeded
to the G.M.B top management. Questionnaires were first revised by the management before
distributed to other employees and after that they were distributed to the employees and
management was then interviewed. The researcher left the questionnaires so that employees
would attend them at their free time. After 2 days the researcher came back to collect the
questionnaires, this was also applied to retailers and wholesalers but as for the individual
customers the researcher waited for the customer to respond to the questionnaire. Interviews of
management took 3 days since they have different appointment days. The whole data collection
procedure took 10 days.
3.8 Validity and Reliability
The questions were designed in such a way that they were able to answer reseach objectives so
as to enhance their validity to the reseach. By the implementation of questionnaires to
customers and employees and conducting interviews G.M.B management, the data that was
gathered was reliable.
3.9 Data Analysis and Presentation
After the process of gathering data, the data was presented with the use of tables and graphs.
For qualitative data the researcher is recorded what the management says and where necessary
quotations of what they say was be made. As for quantitative data the researcher used SPSS
version 22 to analyse the data.

31
3.10 Summary
This chapter highlighted the methods used by the researcher in the reseach process. It shows
the research design, population and the sampling procedure attempted. The next chapter is
about the data presentation, analysis and interpretation of data.

32
CHAPTER 4
DATA PRESENTATION, ANALYSISAND INTERPRETATION
4.0 Introduction
This chapter concentrate on the results that were obtained from the reseach using the selected
research design, the research instruments, and the data collection procedures. The raw data was
sorted, grouped, analysed and was also translated to give meaning to it. The analysis was done
with the use of SPSS.This conclusions about the research findings were obtained by the
researcher.
4.1 Response rate
The reseach response rate for both questionnaires and interviews was high as indicated in the
tables below.
Table 4.1 Questionnaire response rate
Category Questionnaires
given to
respondents
Questionnaires
returned from
respondents
% of total
questionnaires
returned
Employees 19 15 78.95
Wholesalers 5 5 100
Retailers 19 15 78.95
Individual
customers
132 100 75.76
Total 175 135 83.415
Source: Primary data

33
Since most of the respondents were cooperative the researcher managed to get 83.415 response
rate from questionnaires. The researcher distributed a total of 175 questionnaires to G.M.B
employees and customers. From employees, 19 questionnaires were distributed and only 15
employees managed to answer the questionnaire correctly thus 4 of them were spoiled. As for
retailers, 19 questionnaires were distributed and only 15 were taken back by the researcher,
this is because 4 of those retailers were closed when the researcher went back to collect
questionnaires. However wholesalers’ questionnaires were all answered without any mistakes
thus giving 100% response rate. Although the researcher waited for customers while answering
questionnaires, out of 132 distributed only 100 were retrieved back by the researcher.20
customers did not answer the questionnaire correctly and 10 of them went away with the
questionnaire while the researcher was attending to other customers.
Table 4.2 Interview response rate
Category Number of
management
Interviewed
management
% of total
interviews
Management 5 5 100%
Total 5 5 100%
Source: Primary data
The researcher was able to interview all the management and a 100% response rate was
obtained. This is because the researcher had previously made appointments with the
management.
4.3 Respondents Demographics
The findings from the reseach showed that the overall responses that was obtained from
individual customers was mainly dominated by more females than males. The findings are
represented by the table below.

34
Table 4.3 Demographic sex for individual customers
Frequency Percent Valid Percent
Cumulative
Percent
Valid Male 35 35.0 35.0 35.0
Female 65 65.0 65.0 100.0
Total 100 100.0 100.0
The above table showed that 65% of the respondents were females and 35% were males. This
showed that more women tends to be more familiar with the Silo brand since they are the ones
who did the cooking.
However between the males and females, the findings showed that 33% are of 15-25 years,
40% is of 25-40 years and 27% is of above 40 years. Thus the sample contains respondents
from various age groups hence reduced bias.

35
Figure4.1 Age groups for individual customers.
Moreover the response rate for employees in terms of their period of working in G.M.B shows
that many of them have been working in G.M.B for long time. This is represented by the table
below.
Table 4.4 Employees period of working at G.M.B
Frequency Percent Valid Percent
Cumulative
Percent
Valid 1 yr. 2 13.3 13.3 13.3
3 yrs. 2 13.3 13.3 26.7
above 6yrs 11 73.3 73.3 100.0
Total 15 100.0 100.0

36
The findings showed that 13.3% have been working in G.M.B for 1 year, 13.3% have been
also working in G.M.B for 3years and the larger percent which is 73.3% have been working
in G.M.B for more than 6 years. This gives the accurate data since the large respondents who
were responding have been working in G.M.B for long time hence they know much about the
Silo brand.
4.4 Consumers brand association of the Silo products.
Brand association of the Silo brand was overall measured in terms of quality, shelf life and
uniqueness. From the overall findings, the reseach showed that customers associate Silo brand
with bad performance in relation to quality, shelf life and uniqueness. While answering
questionnaires customers were saying the Silo brand is of poor quality since their rice does not
cook well and also their self-rising flour does not raise. This is represented by the table below.
Table 4.5 Silo brand association for Individual customers
Quality Uniqueness Shelf
N Valid 100 100 100
Missing 0 0 0
Mean 2.8300 2.7100 2.8200
Median 3.0000 3.0000 3.0000
Mode 3.00 2.00 3.00
The above table shows that out of the 100 respondents from individual customers the mean
response from the added response of 1 strongly disagree and 5 strongly agree is 2.8300 for
quality, 2.7100 for Silo products uniqueness and 2.8200 for shelf life. Thus on average the
customers tends to disagree with Silo brand’s association to good performance in terms of

37
quality, unique products and long shelf life as shown by the means. Moreover this is also
supported by the responses derived from retailers who said the brand has a short shelf life as
evidenced by large breakages, weaves in Silo rice. This is represented by the showed table
below.
The above table shows responses from retailers in relation to the Silo brand association. Out of
the 15 responses from retailers, they showed that the mean for those that were saying Silo brand
sells fast is 2, those that were saying it has unique products were 1.9333 and those that were
saying it has poor quality products was 3.667 and it’s the highest from the other means implying
that retailers also associate the Silo brand with poor quality. Moreover the responses that were
obtained from wholesalers were also in support of the individual customers and retailers. The
responses for wholesalers in relation to the Silo brand association is represented by the table
below on the next page.
Table 4.6 Silo brand association for retailers.
Sell Unique Poor
N Valid 15 15 15
Missing 0 0 0
Mean 2.0000 1.9333 3.6667
Median 2.0000 2.0000 4.0000
Mode 2.00 2.00 5.00

38
Table 4.7 Silo brand association for wholesalers.
Sale Unique Poor
N Valid 5 5 5
Missing 0 0 0
Mean 1.6000 1.6000 2.0000
Median 2.0000 1.0000 2.0000
Mode 2.00 1.00 2.00
The table also shows that the mean responses from the added response of 1 strongly disagree
and 5 strongly agree is 1.600 for the quick sell of the Silo brand, 1.6000 for the uniqueness of
the Silo products and 2.000 for the poor quality of the Silo brand. Overally, the mean for the
quick sell of Silo products and uniqueness showed a greater extent that wholesalers were
disagreeing that the brand sell quickly than its competitors and also that it has unique products.
The mean for poor quality shows the extent that wholesalers were agreeing that the Silo brand
is a poor quality brand.
4.4.3.1 Silo brand is a quality brand
To evaluate the consumers brand association of Silo brand, quality was also used to measure
and below are the findings.

39
Figure 4.2 Individual customer Silo brand association on quality
The above information from individual customers showed that 19% strongly disagree that Silo
brand is a quality brand, 17% also disagree that Silo brand is a quality brand. The total
percentage of customers that were not supporting that Silo brand is a quality brand is 36%.10
% strongly agree that Silo is a quality brand and 18% also agree that it is a quality brand and
they add up to 28% and 36% are saying the quality for Silo brand is on moderate. The reseach
findings also showed that those that agreed that Silo brand is a quality brand were those above
40 years who used to know Silo as a quality brand and they still perceive it as quality brand.
However comparing those that agree and those that disagree, the large percentage tends to
disagree that Silo is a quality brand.

40
From the employee’s perspective, the findings showed that even the employees were not
supporting the question that Silo brand is a quality brand. The table below represent responses
from employees.
Table 4.8 Employees Silo brand association on quality
Frequency Percent Valid Percent
Cumulative
Percent
Valid strongly disagree 2 13.3 13.3 13.3
Disagree 6 40.0 40.0 53.3
Moderate 5 33.3 33.3 86.7
Agree 1 6.7 6.7 93.3
strongly agree 1 6.7 6.7 100.0
Total 15 100.0 100.0
The above table shows that 13.3% strongly disagree that Silo brand is a quality brand while
40% disagree giving a total percentage of 53.3.Employees that agree were6.7% while6.7% also
strongly agree giving a total of 13.4 .However 33.3% said the brand is on moderate in terms of
quality. Employees were saying this is not the Silo brand that they used to know and they were
saying they are now receiving more customer complaints pertaining to the quality than in the
past. Moreover the employees from the production department were saying they are also
experiencing large sales returns of breakages. Moreover when management were interviewed,
they said their customers associate their brand with quality. However one manager is quoted
as saying “the quality has deteriorated”. Moreover the researcher also interviewed the
management on the reasons for customers to buy their products rather than competitors. The

41
management were saying the brand has been in the market for a long time and customers has
become loyal to the brand. This implies that management know that some customers don’t buy
their products because of good quality but because they have been loyal to the brand.
4.4.3.2 Silo brand has unique products
Uniqueness was also used to measure the consumers brand association and the following
findings were obtained.
Figure 4.3 Consumers Silo brand association on uniqueness of the products.
The above data which was obtained from customers showed that 11% strongly disagree that
Silo brand has unique products, 34% disagree that Silo brand has unique products, 32 % are at
moderate, 19 % agree and 4% strongly agree. Overall the responses shows that Silo brand does

42
not have unique products. This was also supported by the employee’s responses on whether
the Silo brand has unique products which is shown in the table below.
Table 4.9 Employees Silo brand association on uniqueness of the products.
Frequency Percent Valid Percent
Cumulative
Percent
Valid strongly disagree 1 6.7 6.7 6.7
Disagree 5 33.3 33.3 40.0
Moderate 7 46.7 46.7 86.7
Agree 2 13.3 13.3 100.0
Total 15 100.0 100.0
Findings on the measurement of whether Silo brand has unique products reviewed that many
employees were disageering.6.7% strongly disagree and 33.3% disagree and gives a total of
40%.However 13.3% agreed that Silo brand contains unique products but its far less to those
who disagree.46.7 said Silo products are on moderate in terms of uniqueness. In support of
the above data, through the analysis of the secondary source(order book) by the researcher ,
the researcher noted that there are no new customers who have joined to order their goods at
G.M.B rather the existing customers are even lowering the quality of order they used to take.
This implies that the G.M.B products are not unique since they are even failing to attract new
customers.

43
4.4.3.3 Long shelf life
Also in trying to find out what exactly does customer associate Silo brand with, its shelf life
was also used.
Figure 4.4 Individual customers Silo brand association on shelf life
The above data which was obtained from customers showed that 13% strongly disagree that
Silo products has a long shelf life,23 disagree that Silo products has a long shelf life,39% were
at moderate,19% agree that it has a long shelf life and 6% strongly agree. An analysis of the
above responses showed that a larger percentage seem to disagree that Silo products has a long
shelf life. This implies that maybe the packaging is poor or maybe the products themselves are
not of high quality that they quickly get infested. This was also supported by the responses
from wholesalers.

44
Moreover in trying to find out the consumers associations of Silo brand in terms of whether
they associate the brand with positive things or anything good, a question on whether the Silo
brand sell quickly was asked to retailers and wholesalers. The responses that are shown on the
diagram below are for wholesalers.
Table 4.10 Wholesalers Silo brand association on Positive perceptions.
Frequency Percent Valid Percent
Cumulative
Percent
Valid strongly disagree 2 40.0 40.0 40.0
Disagree 3 60.0 60.0 100.0
Total 5 100.0 100.0
The above findings shows that 40% strongly disagreed that Silo products sells quickly and 60%
also disagree with that. Overall there is no even a small percentage that supported that the Silo
products sells quickly and this implies that customers tends to purchase the Silo products after
long periods. This may also because customers already associate the Silo products with
negative perceptions and they seem to avoid purchasing the brand. This was also supported by
the responses from retailers as seen by the responses below.
Table 4.11 Retailers Silo brand association on Positive perceptions.
Frequency Percent Valid Percent
Cumulative
Percent
Valid strongly disagree 3 20.0 20.0 20.0
Disagree 9 60.0 60.0 80.0
Moderate 3 20.0 20.0 100.0
Total 15 100.0 100.0

45
The findings shows that 20% of retailers were strongly disagreeing that the Silo products sell
quickly, 60% also disagree and 20% were saying the rate at which the Silo brand is sold is on
moderate. Another retailer while returning the questionnaire to the researcher was commenting
that when a customer comes and want to purchase rice, if there is only Silo rice left the customer
would move to other retailer searching for a different brand. This implies that customers
already associate the brand with poor quality.
4.5 Impact of Silo brand communication on brand awareness.
The impact of Silo brand communication on brand awareness was measured in terms of the
media of advertising that is used by G.M.B to make the customers aware of the products, ability
of the customers to distinguish the Silo brand logo from others and also the top of mind brand
awareness which is measured by the customers first choice of Silo brand in purchase decisions.
The overall results showed that customers are not well aware of the Silo brand as thought by
the company. This is shown by the results below.
Table 4.12 Individual customer Silo brand awareness
Salespersons Exhibitions Logo Choice
N Valid 100 100 100 100
Missing 0 0 0 0
Mean 3.8600 3.7600 2.8600 2.2000
Median 4.0000 4.0000 3.0000 2.0000
Mode 5.00 4.00 3.00 2.00
46
The table shows that the mean for customers who get to know about Silo through sales persons
is 3.8600 and through exhibitions is 3.7600.This implies that G.M.B is only using sales persons
and exhibitions to make their products to be known by customers and the mean showed that
the two media are trying in terms of their performance to make the Silo brand awareness.
However the data also showed that the mean for those who are able to distinguish Silo brand
logo from competitors is 2.8600 which implies that on average people are not able to
distinguish the brand logo from competitors and the mean for those that first search for Silo
when want to make a purchase is 2.2000 which also implies that on average the rate at which
customers will first search for Silo brand is very low. This implies that on average, customers
are not able to distinguish the logo from competitors and also their first choice is not the Silo
brand when purchasing. This is caused by methods of brand communication that is being used
by G.M.B is not effective since they are not enhancing brand recognition, top of the mind
awareness and brand recall as postulated by Sagar et al (2011), when they said brand awareness
is characterise by the customers’ ability to recognise the brand by their logos, jingles, symbols,
slogans, mascots, ambassadors and many others.
4.5.1 Sales Persons
The results from customers showed that those who strongly agree that they get to know about
Silo through sales persons were 38%,20% also agree that they get to know about Silo brand
through sales persons,32% were on moderate and10% disagree that they get to know about Silo
through sales people. The percentages showed that G.M.B is effective in its sales persons
though its awareness is still poor. This means that maybe the sales people are not well
explaining the real Silo brand to customers. The graph below represent the responses from
customers.

47
Figure4.5 Individual customer Silo brand awareness through sales persons.
This is also supported by responses from employees who in their responses indicate that they
are heavily using Sales people and exhibitions in communicating their brand. This was also
previously seen by the customer’s responses on how they come up to know about the Silo
brand. The diagram below shows the employees responses on their ways of communicating
their brand.

48
Table 4.13 Company brand communication through sales persons.
Frequency Percent Valid Percent
Cumulative
Percent
Valid Moderate 5 33.3 33.3 33.3
Agree 5 33.3 33.3 66.7
strongly agree 5 33.3 33.3 100.0
Total 15 100.0 100.0
The above findings shows that 33.3% of the employees strongly agree that they communicate
their brand through sales persons, Again 33.3% agree and 33.3% are on moderate.
4.5.2Exhibitions
Exhibitions is also playing a major role in making a brand awareness to the customers. This is
evidenced by the high percentages of customers who agree that they also get to know about
Silo through exhibitions. This is shown by the table below.

49
Table 4.14 Individual customer silo brand awareness through exhibitions.
Frequency Percent Valid Percent
Cumulative
Percent
Valid strongly disagree 3 3.0 3.0 3.0
Disagree 7 7.0 7.0 10.0
Moderate 26 26.0 26.0 36.0
Agree 39 39.0 39.0 75.0
strongly agree 25 25.0 25.0 100.0
Total 100 100.0 100.0
4.5.3Logo
In trying to find whether the customers were aware of the Silo brand, question that asked
whether customers are able to differentiate Silo brand logo from others was asked in
questionnaires. Below are the responses that were obtained from individual customers.

50
Figure4.6 Individual customer’s ability to differentiate Silo brand logo from competitors.
The diagram findings shows that 16% strongly disagree that they are able to distinguish Silo
brand logo from competitors, 19% also disagree while 33% is on moderate. However 27%
agree that they can be able to distinguish Silo brand logo from .other brands while 5% strongly
agree. The percentages of those who said they are able to distinguish silo brand logo from
competitors is less than those who said they can implying that customers are not aware of the
Logo. During the interviews with the management, the researcher asked the management on
how customers were able to differentiate their brand from competitors and it seems that were
not sure and one manager is quoted saying think it’s our packaging but lam not sure”. The
researcher also asked the management on how their logo look like and it seems that they were
facing difficulties to express what their logo looks like. This implies that maybe the logo is not
designed in a way that even customers can easily recall it.

51
4.5.4 Choice
In trying to measure top of mind brand awareness that states that when a customer is aware of
the brand, the position of the brand in the consumers mind is high and the consumer has the
highest chances of purchasing that brand if want to make a purchase in that product category,
a question that evaluate whether the customers has high chances of purchasing the Silo brand
was asked. Below are the responses that were obtained.
Figure 4.7 Customers first choice for Silo brand.
The researcher found that 29% strongly disagree that their first choice is the Silo brand
whenever they want to make a purchase in food category, 36% also disagree, 23% moderate,
10% agree and 2% strongly agree. The overall high percentage rate showed that many
customers prefer to purchase other brand as compared to Silo brand. This shows they are not
aware of the brand.

52
4.6 Silo brand identity matches consumer perceptions.
The researcher’s results on if Silo brand identity matches with consumer perception reviewed
that they mismatch. Overall what G.M.B want it to be seen by customers is different from what
customers are seeing from G.M.B. Below is the table that shows the results.
Table 4.15 Silo brand identity match with consumerperceptions.
Search Taste Expectations
N Valid 100 100 100
Missing 0 0 0
Mean 2.3400 2.1800 2.2300
Median 2.0000 2.0000 2.0000
Mode 2.00 2.00 2.00
The table shows the means for elements that were asked so as to find whether Silo brand
identity is matching with its brand image. On average the results showed that the mean for
customers to first search for Silo brand in their purchase decisions is 2.3400 which is very low
and this implies that customers maybe has a negative perception of the Silo brand and this is
not matching with its brand identity. Also the mean for customers who said that the Silo
products taste better than its competitors was 2.1800 which is also low and it seem not to match
with the company’s unique selling proposition “Silo real taste for life”. Srivastava (2010),
postulates that it is important that the unique selling proposition of a company’s product should
match with the unique customer perception. Moreover the mean for customers who said the
products that are introduced by G.M.B are meeting their expectations is represented by 2.2300
which is also very low.

53
4.6.1Search for Silo brand
The table below shows the responses from individual customers when the researcher was
measuring the perceptions that they have in relation to the brand hence an evaluation of if
they are matching with brand identity.
Table 4.16 Individual customer’s perceptions towards Silo brand.
Frequency Percent Valid Percent
Cumulative
Percent
Valid strongly disagree 23 23.0 23.0 23.0
Disagree 37 37.0 37.0 60.0
Moderate 26 26.0 26.0 86.0
Agree 11 11.0 11.0 97.0
strongly agree 3 3.0 3.0 100.0
Total 100 100.0 100.0
The responses shows that 23%stongly disagree that they first search for the Silo brand when
want to make a purchase in food category, 37% also disagree, 26% are on moderate, 11%
agree and 3% strongly disagree. The responses implies that consumers have negative
perception of the Silo brand as shown by the large percent that was disagreeing and this does
not match with its brand identity. This is also supported by the employees’ responses when
they were asked if their customers have trust in Silo brand. The diagram below shows the
response from employees.

54
Figure 4.8 Customers trust in Silo products.
The findings shows that 13.3% of the employees strongly disagree that their customers have
trust in Silo brand, 46.7% also disagree, 20% are on moderate and 20% agree that their
customers have trust in their brand. An analysis of the responses shows that many of the
employee disagree that their customers have trust in the Silo brand as shown by the large
percentages. Employees were commenting that when new products are introduced they are
facing difficulties to convince customers to try the new products especially the wholesalers as
they will be saying they fear that the product will perform badly in terms of sales.
The element of whether all the products that are introduced by the by G.M.B are meeting
customers’ expectations was asked by the researcher and the following table shows the
responses that were obtained from customers.

55
Table 4.17 G.M.B new products meeting of customer expectations.
Frequency Percent Valid Percent
Cumulative
Percent
Valid strongly disagree 24 24.0 24.0 24.0
Disagree 39 39.0 39.0 63.0
Moderate 27 27.0 27.0 90.0
Agree 10 10.0 10.0 100.0
Total 100 100.0 100.0
The findings shows that 24% strongly disagree that all the introduced Silo products are meeting
their expectations, 39%disagree, 27% is on moderate and only 10% agree. Customers were
commenting that they now even fear to purchase new product of G.M.B as the want to avoid
disappointment from bad performance of the product.
The above data is also supported by the responses from the retailers when they were asked if
get customer complains pertaining to the Silo brand. Below is the presentation of the data that
was obtained

56
Figure 4.9 Retailer’s customer complains of the Silo brand.
4.7 Summary
The chapter looked at the data presentation, analysis and interpretation of the responses that
were obtained from the reseach. Tables and bar graphs were used to present the data while
SPSS version 22 was used to analyse the data. The next chapter focuses on summary,
conclusions and recommendations for the study.

57
CHAPTER 5
CONCLUSIONS AND RECOMMENDATIONS
5.0 Summary
The previous chapter looked on the findings which the researcher obtained and were analysed
and presented using tables, pie charts and bar graphs. This chapter outlines the conclusions
coming from the research as well as the recommendations that the researcher feels will be
appropriate and can help improve the performance of their brand. However the researcher
found it necessary to revisit the reseach objectives while concluding. The objectives of this
study were to assess consumers brand association of the Silo products, to evaluate the impact
of Silo brand communication on brand awareness and to assess if Silo brand identity matches
consumer perceptions. Secondly the reseach sought to effectively answer the research
questions in relation to the effect of product positioning on company performance, a research
was carried out at G.M.B Mutare Coffee and to customers based in Mutare through the use of
questionnaires and interviews.
Product positioning has been found to be the important factor that enhances company
performance. Organisations need to invest and embark on product positioning strategies that
enhance good company performance. Product positioning in this study is more or less the same
as brand positioning with the following elements brand identity, brand image, brand association
and brand communication. Basically, this research sought to determine the effect of product
positioning on company performance by evaluating the contribution of the consumers brand
association of the Silo brand looking on the elements like quality, product shelf life and
uniqueness, evaluating the impact of brand communication on brand awareness and identifying
the contribution of brand identity that matches with brand image on company performance.
The researcher therefore conducted surveys with G.M.B employees, management and

58
customers to find the effects of product positioning element on the company performance. On
whether management understand the concept of product positioning, the researcher discovered
that management still believes that in terms of quality they are still performing like what they
used to do in the past hence this gave them the thought that consumers still associate their brand
with quality which is different from the customers view. Moreover, in terms of the brand
communication, the company thinks it is performing up to the best through the use of sales
people and exhibitions and they are very sure that the market is aware of the Silo brand which
is different from the customer’s side. Additionally the questions that were asked to customers
by the researcher so as to find out whether Silo brand identity matches with consumer’s
perceptions showed that consumers have built a negative perception towards the Silo brand.
5.2 Conclusions
5.2.1 Consumers brand association of the Silo brand.
Consumers have a negative perception towards the Silo brand. Responses from the
questionnaires show that the Silo brand is associated with poor quality as shown by 53.3% of
employees who disagreed that customers associate their brand with quality and even the
management confirmed that the quality has deteriorated.
5.2.2 Impact of Silo brand communication on brand awareness.
G.M.B relies heavily on salespeople and exhibitions to communicate the Silo brand to
the market. This was supported by 66.6 % of employees who agree that they are using
sales people and 64% of customers who said they get to know about the Silo brand
through exhibitions.
Brand awareness of the Silo brand is poor since 88% of the customers noted that they
could not distinguish the Silo brand logo from competitors.
59
5.2.3 If Silo brand identity matches consumer perceptions.
It is concluded that the Silo brand identity mismatches with consumer perceptions. The
perceptions of the customer’s shows that customers have no trust in G.M.B products, that they
associate the brand with poor quality, they said the brand has no unique products, the products
have short shelf life and that even their unique selling proposition is not matching with
consumer perceptions. This is shown by 45% of customers who disagree that the Silo brand
has unique products and 32 % said the products are on moderate while the remainder disagree.
Also 80% of wholesalers disagree that the Silo products sell much faster than its competitors
implying that customers don’t buy because they have a negative perception of the Silo brand
which does not match with their brand identity.
5.3Recommendations
G.M.B should run away from the features/attributes approach of product positioning which
emphasise a lot on the unique features of products and services. The company unique selling
proposition “Silo real taste for life”, G.M.B is actual the opposite of the customer’s perceptions
and the quality of the product is poor. G.M.B should rather adopt competitor’s approach of
product positioning where it deliberately compares itself to competitors as a means of gaining
the desired position for their product in the mind of the consumer. Moreover, the company can
adopt price and quality approach of product positioning which are the dimensions used by
consumers in evaluating alternative brands.
5.3.2Consumers brand association of the Silo brand.
The findings from the reseach showed that brand association contributes a lot to company
performance. The researcher recommends the G.M.B to focus on improving the product quality
and durability so that the customers can have strong attribute to associate the brand.

60
5.3.3 Impact of brand communication on brand awareness.
The findings gave a proof that brand communication has a large impact on the brand
awareness which also affect company performance. The researcher recommend that G.M.B to
uses marketing strategies that are able to communicate their brand to a large audience. The
findings showed that despite the company use of sales people and exhibitions and yet customers
are not aware of the Silo brand. The researcher recommend G.M.B to use bill boards, social
media advertising, engage in social responsibility programmes and also sponsor events to
improve their brand awareness. The researcher also recommend G.M.B TO also celebrity
endorsement advertisement so as to improve its brand association. Moreover the company need
to further train their sales people so that they can be able to well communicate their brand to
customers. In addition to that, the company can also give free samples to consumers. This will
increase brand awareness.
5.3.4 Recommendation on assessment of if Silo brand identity matches consumer
perceptions.
The findings shows that Silo brand identity does not match with consumer perceptions. To
maintain their identity that they are known for producing quality products, the researcher
recommend the company to revisit their quality control measures. Also the researcher
recommend the company that before they introduce their new products they should benchmark
with those of competitors so that they can be able to come up with unique products thus
matching the consumers perceptions with their brand identity.
5.4Areas for further research.
The reseach could be extended to a private milling company .A parastatal like G.M.B usually
has management decision challenges.

61
REFFERENCE
Bell. J and Opie. C (2002), learning from Research: Getting more from your data, Open
University Press, Buckingham
Burns, A.C and Bush, R.F (2010) Marketing Reseach, 6th edition, prentice hall, New Jersey
Carson D. et al, (2001), Qualitative Marketing Research, Sage Publications, London
Chambers
Crawford, M.C. (1985), “A new positioning typology”, Journal of Product Innovation
Dean D, H. (2004) “Evaluating potential brand associations through conjoint analysis and
market simulation”, journal of product and brand management, vol. 13, no.7 pp 506-513
Ergin E.A et al (2006) “The effect of brand associations: a field study on Turkish consumers”,
international business & economics research journal, vol.5, no.8
Esch F.R et al, (2006) “Are brands forever? How brand knowledge and relationships affect
current and future purchases” journal of product and brand management, vol.15, no.2, pp
98-105
French A and Smith G. (2013) “measuring brand association strength a consumer based brand
equity approach”, European journal of marketing, vol. 47, no.8 pp 1356-1367[online]
Ghodeswar, B.M. (2008) “Building brand identity in competitive markets: a conceptual
model”, journal of product and brand management, vol.17, no.1 pp 4-12
Hutter K et al. (2013) “The impact of user interactions in social media on brand awareness and
purchase intention”, journal of product and brand management, vol. 22, no. 5/6 pp 342-351
Hyun Um N. (2013) “effects of negative brand information: measuring impact of celebrity
identification and brand commitment”, journal of global marketing, vol. 26, no. 2 pp 68-79

62
James D (2005). “Guilty through association: brand association transfer to brand alliances”,
journal of consumer marketing, vol. 15, no. 1 pp 14-24
Jean S. (2011) Brand parody: “A communication strategy to attack a competitor”, journal of
consumer marketing, vol. 28, no.1 pp 19-26
Kothari C. R, (2004), Research Methodology: Methods and Techniques, 2nd Edition, New
Age International, New Delhi, India
Kotler P et al (2010), Principles of Marketing, 13th Edition, Prentice Hall, New Delhi, India
Kwon W, S and Lennon S, J. (2011) “Assessing college women’s associations of American
specialty apparel brands”, journal of fashion marketing and management, vol.15, no.2 pp
242-256
Linderberg A et al (2012) “Understanding the relationship between Brand identity and Brand
image – A case study of Coop”, school of business and economics.
Mahim Sagar, Rishabh Khandelwal, Amit Mittal, Deepali Singh. (2011) “Ethical Positioning
Index (EPI): an innovative tool for differential brand positioning”, corporate communications:
an International Journal, Vol. 16, no. 2 pp 124-138
O’Cass A and Lim K. (2002) “The influence of brand association on brand preference and
purchase intention”, journal of international consumer marketing, vol. 14, no.2-2 pp 41-71
Sawant R. (2012) “Impact of advertising on brand awareness and consumer preference (with
special reference to men’s wear)”, IOSR journal of business and management, vol. 5, no.6
pp54-61
Scharf E.R and Fernandes J. (2013) “The advertising of corporate social responsibility in a
Brazilian bank”, international journal of bank marketing, vol. 31, no.1 pp 24-37

63
Situma S, P. (2012) “The effectiveness of trade shows and exhibitions as organisational
marketing tool”, international journal of business and social sciences, vol.3, no.22 pp 219-
230
Srivastava R.K. (2011) “understanding brand identity confusion”, marketing intelligence and
planning, vol.29, no.4 pp 340-352
Tanvir A and Shahid M. (2012) “Impact of sports sponsorship on brand image and purchase
intention”, interdisciplinary journal of contemporary research in business vol.4, no.2 pp
659-667
Till, B.D et al (2011) “Strategic brand association maps: developing brand insight”, journal of
product and brand management, vol. 20, no 2 pp 92-100
Uggla H. (2006) “The corporate brand association base”, European journal of marketing,
vol. 40, no. 7/8 pp785-802
Valin I (2012), “Consumers’ brand origin perceptions through visual appeals in international
fashion advertisement”, school of business Journal of Product & Brand Management, vol.
20, no.3 pp 216–227
Viot C. (2011) “Can brand identity predict brand extensions ’success or failure?”
www.coca-colacompany.com
www.okziminvestor.com
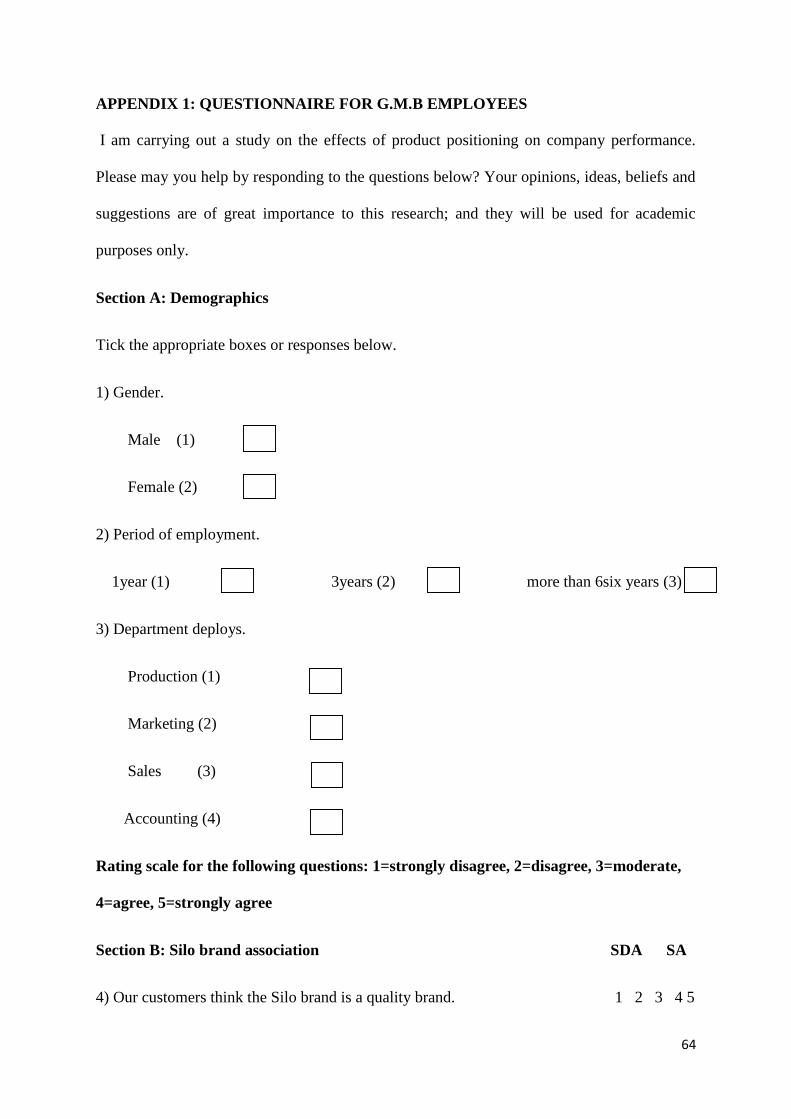
64
APPENDIX 1: QUESTIONNAIRE FOR G.M.B EMPLOYEES
I am carrying out a study on the effects of product positioning on company performance.
Please may you help by responding to the questions below? Your opinions, ideas, beliefs and
suggestions are of great importance to this research; and they will be used for academic
purposes only.
Section A: Demographics
Tick the appropriate boxes or responses below.
1) Gender.
Male (1)
Female (2)
2) Period of employment.
1year (1) 3years (2) more than 6six years (3)
3) Department deploys.
Production (1)
Marketing (2)
Sales (3)
Accounting (4)
Rating scale for the following questions: 1=strongly disagree, 2=disagree, 3=moderate,
4=agree, 5=strongly agree
Section B: Silo brand association SDA SA
4) Our customers think the Silo brand is a quality brand. 1 2 3 4 5

65
5) Our customers think the Silo brand has a long shelf life. 1 2 3 4 5
6) Our customers think the Silo brand has unique products. 1 2 3 4 5
Section C: Silo brand image.
7) Our customers have trust in Silo products. 1 2 3 4 5
8) Our customers know that the Silo products taste good. 1 2 3 4 5
9) Silo brand sales are high in the market. 1 2 3 4 5
Section D: Silo brand awareness
10) We advertise through: national media (1)
Exhibitions (2)
Road shows (3)
Direct marketing (4)
Bill boards (5)
Celebrity endorser (6)
Social responsibility (7)
Sponsorship (8)
Sales people (9)
11) Our packaging is distinct. 1 2 3 4 5

66
YOUR COOPERATION IS WELL APPRECIATED.
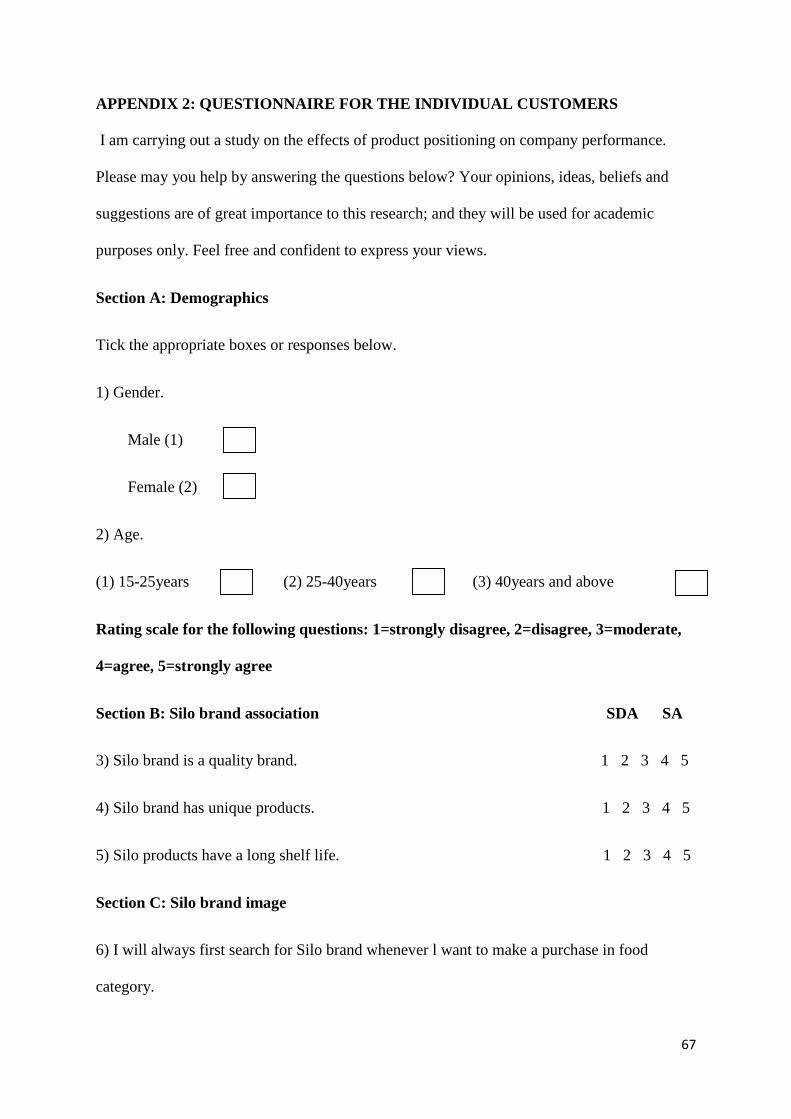
67
APPENDIX 2: QUESTIONNAIRE FOR THE INDIVIDUAL CUSTOMERS
I am carrying out a study on the effects of product positioning on company performance.
Please may you help by answering the questions below? Your opinions, ideas, beliefs and
suggestions are of great importance to this research; and they will be used for academic
purposes only. Feel free and confident to express your views.
Section A: Demographics
Tick the appropriate boxes or responses below.
1) Gender.
Male (1)
Female (2)
2) Age.
(1) 15-25years (2) 25-40years (3) 40years and above
Rating scale for the following questions: 1=strongly disagree, 2=disagree, 3=moderate,
4=agree, 5=strongly agree
Section B: Silo brand association SDA SA
3) Silo brand is a quality brand. 1 2 3 4 5
4) Silo brand has unique products. 1 2 3 4 5
5) Silo products have a long shelf life. 1 2 3 4 5
Section C: Silo brand image
6) I will always first search for Silo brand whenever l want to make a purchase in food
category.

68
1 2 3 4 5
7) Silo products tastes better than its competitors. 1 2 3 4 5
8) All the products that are introduced by G.M.B are meeting our expectations. 1 2 3 4 5
Section D: Silo brand awareness
I came to know of Silo brand through: national media (1)
Exhibitions (2)
Road shows (3)
Direct marketing (4)
Bill boards (5)
Celebrity endorser (6)
Social responsibility (7)
Sponsorship (8)
Sales people (9)
9) I am able to distinguish Silo brand logo from other brands. 1 2 3 4 5
10) Whenever l want to make a purchase in the food category my first choice is the Silo
brand.
1 2 3 4 5
YOUR COOPERATION IS WELL APPRECIATED.

69
APPENDIX 3: QUESTIONNAIRE FOR RETAILERS AND WHOLESALERS.
I am carrying out a study on the effects of product positioning on company performance.
Please may you help by answering the questions below? Your opinions, ideas, beliefs and
suggestions are of great importance to this research; and they will be used for academic
purposes only. Feel free and confident to express your views
Section A: Demographics
Tick the appropriate boxes or responses below
1) Type of business.
Retailer (1)
Wholesaler (2)
2) Period of operation.
5-10 years (1)
10-20 years (2)
20-40 years (3)
40 and above (4)
3) Period of doing business with G.M.B.
5-10 years (1)
10-20 years (2)
20-40 years (3)

70
40 and above (4)
Rating scale for the following questions: 1=strongly disagree, 2=disagree, 3=moderate,
4=agree, 5=strongly agree
Section B: Silo brand association SDA SA
3) Silo products sell quickly 1 2 3 4 5
4) Silo brand has unique products. 1 2 3 4 5
5) Silo brand has poor quality products. 1 2 3 4 5
Section C: Silo brand image
6) Silo products sell much faster than its competitors. 1 2 3 4 5
7) Whenever we want to order food products that are found within the Silo brand, we always
prefer to order the Silo brand. 1 2 3 4 5
8) We get customer complains pertaining to the Silo Brand. 1 2 3 4 5
Section D: Silo brand awareness
9) We have come to know Silo brand through: National media (1)
Exhibitions (2)
Road shows (3)
Direct marketing (4)
Bill boards (5)
Celebrity endorser (6)

71
Social responsibility (7)
Sponsorship (8)
Sales people (9)
10) Silo brand packaging is attractive. 1 2 3 4 5
.
YOUR COOPERATION IS WELL APPRECIATED.
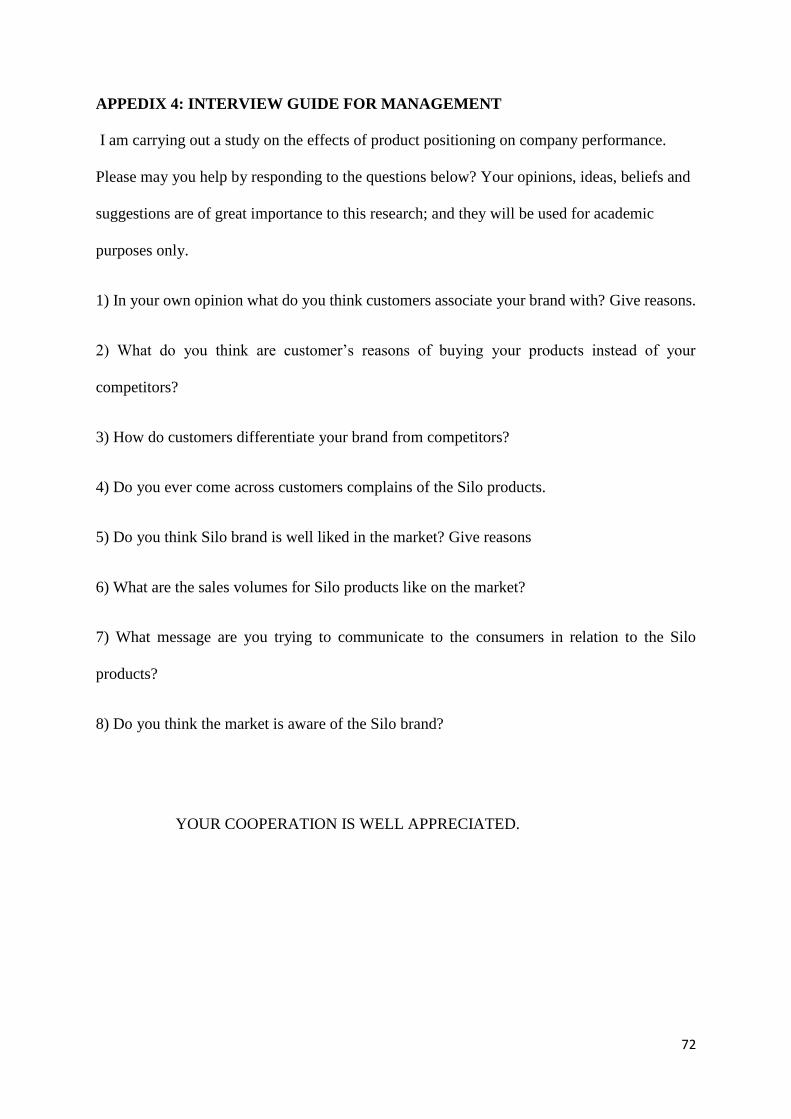
72
APPEDIX 4: INTERVIEW GUIDE FOR MANAGEMENT
I am carrying out a study on the effects of product positioning on company performance.
Please may you help by responding to the questions below? Your opinions, ideas, beliefs and
suggestions are of great importance to this research; and they will be used for academic
purposes only.
1) In your own opinion what do you think customers associate your brand with? Give reasons.
2) What do you think are customer’s reasons of buying your products instead of your
competitors?
3) How do customers differentiate your brand from competitors?
4) Do you ever come across customers complains of the Silo products.
5) Do you think Silo brand is well liked in the market? Give reasons
6) What are the sales volumes for Silo products like on the market?
7) What message are you trying to communicate to the consumers in relation to the Silo
products?
8) Do you think the market is aware of the Silo brand?
YOUR COOPERATION IS WELL APPRECIATED.

73