Embed Size (px)
Citation preview

1/19/2017
Substance Use Disorder Treatment Capacity in Baltimore City:
Focus on Opioid Treatment Programs and Buprenorphine
Providers

1
Introduction
This report provides a summary of the activities undertaken by Behavioral Health System Baltimore to
understand the capacity of substance related disorder (SRD) treatment in Baltimore City, with a focus
on findings for opioid treatment programs (OTPs) and Buprenorphine providers. The number of
providers was assessed primarily through SAMHSA treatment locator and ASO (publicly-funded) paid
claims for services provided to Baltimore City residents with public funds. The need for medication-
assisted treatment (MAT) was estimated by previous work conducted by the Baltimore Mayor’s Heroin
Treatment and Prevention Task Force and Hilltop Institute, University of Maryland Baltimore County.
Information about service gaps and provider needs were generated from a provider survey conducted in
July 2016. Finally, this report will discuss and put in context recent results reported by BHA, which report
that Baltimore City capacity exceeds its current need by almost 3,000 individuals.
Key Findings
The number of individuals potentially in need of MAT is estimated to be 24,887 opioid users,
18,916 of which are heroin users based on the Heroin Task Force calculations.
The MAT treatment capacity in Baltimore City is 17,587, derived from OTP and buprenorphine
provider self-report of capacity.
Based on Heroin Task Force estimates of need, the actual difference between need and capacity
is likely not a capacity excess of 2,959 but a capacity deficit of 7,300.
There are 26 OTPs in Baltimore City. An additional 10 OTPs are available in the surrounding
counties to Baltimore City residents with the means to travel outside of the City. There are an
additional 62 non-OTP providers that prescribe buprenorphine in Baltimore City (n=40) and
surrounding counties (n=22).
Because lack of housing and transportation was a commonly reported unmet need by providers,
it is unlikely that capacity in counties bordering Baltimore City is accessible to most individuals in
need of publicly-funded MAT.
Given the growing opioid overdose epidemic, addressing the MAT service gap should be a high
priority.
Estimated Baltimore City Population of those in Need of MAT
Commissioned by the Mayor’s Baltimore City Heroin Treatment and Prevention Task Force, the Hilltop
Institute of University of Maryland Baltimore County estimated the annual number of individuals with
opioid use disorders (OUDs) in BC based on three publicly maintained medical administrative data sets:
1) Medicaid transactions, 2) opioid treatment episodes at clinics supported by state or federal block
grant funds, and 3) hospital (i.e., inpatient and emergency department (ED)) discharge transactions.
Using a combined data set, Hilltop Instituted estimated that there were 24,887 unique individuals with
opioid use disorder in the year leading up to July 1, 20141. Because the analysis used treatment
databases, the Hilltop estimate does not account for individuals with an OUD who are not connected to

2
the medical system. Based on the Baltimore City Heroin Task Force estimates of the prevalence of
heroin use2 (n=18,916) a majority of those in need of MAT are individuals that use heroin.
1. Abrams, Unick, Vanderwerker, et al. 2015. The Hilltop Insitute, UMD
2. Baltimore Mayor’s Heroin Treatment & Prevention Task Force Report. http://www.bhsbaltimore.org/site/wp-
content/uploads/2015/07/Mayors-Heroin-Task-Force-Report_071015.pdf
BHSB Survey of Providers in Baltimore City
In July of 2016, BHSB requested all behavioral health providers to report on the levels of care they
provide, treatment capacity and service gaps. A total of 36 providers responded, 32 of which were
located in Baltimore City or primarily treated Baltimore City residents. Among the 32 Baltimore City
providers that responded, 22% (n=7) were mental health (MH) providers, 34% (n=11) were substance
use disorder (SUD) providers and 44% (n=14) provided both MH and SUD services. Of note, additional
efforts were made to call Opioid Treatment Providers (OTPs) therefore they represent 40% of the
respondents. Providers were asked to report on capacity for each level of care provided. A summary of
the results for both MH and SUD providers can be found in Appendix A. The following summarizes
survey responses for the 16 organizations that identified as an OTP or that provided buprenorphine.
OTP and Buprenorphine Providers (N=16)
Fifty-six percent (n=9) organizations reported providing both MH and SUD services.
Three providers reported being able to prescribe buprenorphine but currently did not
prescribe it.
Of those that provided mental health services, 6 organizations provided outpatient mental
health services and 3 identified as offering a psychiatric rehabilitation program.
Twelve (92%) were aware of the Crisis, Information and Referral Line
OTP Survey Respondents - SUD Levels of Care % Count
0.5 Early Intervention 18.75% 3
1.0 Outpatient 87.50% 14
2.1 Intensive Outpatient 62.50% 10
3.1 Halfway House 12.50% 2
3.3 Long-term Residential 6.25% 1
3.5 Therapeutic Community 0.00% 0
3.7 Medically-monitored Inpatient 6.25% 1

3
3.7D Residential Detox 0.00% 0
Opioid Treatment Program 81.25% 13
Buprenorphine 75.00% 12
Care Coordination 31.25% 5
Other (Responses: SUD PHP, Ambulatory Detox, Supportive Housing)
18.75% 3
Total 100% 16
Capacity of OTP and Buprenorphine Providers (N=16)
Eleven OTPs reported seeing a range of 65-1800 clients per day, with a mean of 479 patients.
OTP providers reported that 92% of those they served were Baltimore City residents
With current staff and resources, OTPs estimated they could increase their patient volume to
a mean of 693 patients. With additional staff and resources, they estimated they could
increase patient volume to optimal capacity to a mean of 978 patients.
Three OTP providers (27%) kept a waitlist. Waitlist size ranged from 7-15 patients, with a
mean of 11 patients. Two OTPs had a wait time of less than one week and one had a two-four
week wait time.
Nine buprenorphine providers reported seeing a range of 3-150 patients per day, with a mean
of 32 patients.
BUP providers reported that 86% of their patients were Baltimore City residents
With current staff and resources, BUP providers estimated they could increase their patient
volume to a mean of 66 patients per day. With additional staff and resources, they estimated
they could increase patient volume to optimal capacity to a mean of 117 patients.
One BUP provider (11%) reported that their current patient volume exceeds capacity. They
reported turning away about one patient per week due to capacity limitations, and kept a
wait list with a wait time of two-four weeks
OTP/Bup providers offering outpatient MH services reported between 5 and 30 patients on
the waitlist for MH services (mean 13.3).
Eleven (85% of 13 that responded) provided “open access” (hours when a patient may walk
in and be seen without an appointment).
Roles of respondents were primarily director-level and respondents reported on capacity
estimates with about 95% confidence

4
Needs and Expanded Services - OTP and Buprenorphine Providers (N=16)
Most MAT providers either already provided ambulatory withdrawal management (N=5) or would
have the ability to expand services to provide ambulatory withdrawal management (N=5).
Nine providers (69%) saw a consumer demand for mental health services that they were unable
to meet
Answer % Count
Psychiatric services (e.g. appointment with a psychiatrist)
55.56% 5
Psychotropic medication 44.44% 4
Psychiatric emergency walk-in services 33.33% 3
Individual psychotherapy 22.22% 2
Couples/family therapy 22.22% 2
Group therapy 22.22% 2
Integrated dual disorders treatment 44.44% 4
Trauma therapy or Trauma-responsive therapy 22.22% 2
Mental health crisis intervention/response team 22.22% 2
Telemedicine therapy 33.33% 3
Chronic disease/illness management 22.22% 2
Integrated primary care services 44.44% 4
Diet and exercise counseling 11.11% 1
Family psychoeducation 33.33% 3
Supported housing 55.56% 5
Care coordination 22.22% 2
Psychosocial rehabilitation services 11.11% 1
Vocational rehabilitation 44.44% 4
Supported employment 44.44% 4
Therapeutic foster care 11.11% 1
Legal advocacy 33.33% 3
Suicide prevention services 22.22% 2

5
Peer support services 44.44% 4
Smoking cessation assistance or programs 44.44% 4
Immigration and/or refugee services 22.22% 2
Other (please describe): 55.56% 5
Total 100% 9
Other (please describe):
Transportation 2
Youth or adolescent services 1
Child and Adolescent Therapy 1
We cannot afford to stay in business to provide any of these without OMHC status which we are applying for
1
Ten providers (76%) saw a consumer demand for SUD services that they could not meet

6
Other (please describe): Count
Residential care 2
Transportation or housing 3
Detox 2
Non-medication assisted services 1
Contingency management for cocaine 1
Gambling 1
Educational or vocational services 3
Case management 1
Total 8
Eleven providers stated they had an interest in expanding services

7
Types of Expansion Count
Mental health/psychiatric services 4
Job placement, vocational services 2
Health home 2
Other level of care (i.e., IOP, Residential, detox, buprenorphine) 4
Number of people served/treatment slots 4
Peer support 1
Another location 1
Different population (i.e., women with children) 2
Multi-modality drop-in center 1
Housing, transitional/supportive housing 1
Total 11
Among those with the interest but no ability…
Reasons why unable to expand Count
Financial 3
Lack of qualified staff 2
Support from the city and the government. 1
Coordination of services 1
Zoning 1
State reimbursement 2
Need help with application to become certified for addition services 1
Total 8

8
Number of Providers and Treatment Capacity
The number of providers was estimated using SAMHSA’s treatment locator. There are 36 OTPs in Baltimore and surrounding counties, 26 of which are in
Baltimore City. An additional 10 OTPs are available in Baltimore County and Anne Arundel County. There are an additional 62 non-OTP providers that prescribe
buprenorphine in Baltimore City (n=40) and surrounding counties (n=22). Four (11.1%) of the 36 OTPs and 17(27.4%) of the 62 non-OTP Bup prescribers did not
accept Medicaid/Medicare payment. These data do not depict the number of providers within each MAT facility, nor do they indicate services provided by
primary care physicians. However, 15 (15%) of the 98 MAT providers in Baltimore City and surrounding counties were located in a general health setting or had a
primary focus of general health.
OTP BUP only All MAT
Not a general health setting
General health setting
Total Not a general health setting
General health setting
Total
Anne Arundel 4 0 4 11 1 12 16 Baltimore County 6 0 6 10 0 10 16 Baltimore City 19 7 26 33 7 40 66
29 7 36 54 8 62 98
MAT capacity for Baltimore City residents was calculated using the number of SAMHSA providers and self-reported capacity from the 16 MAT providers (n=13
OTPs) responding to the BHSB provider survey. For those providers that did not respond, values were imputed using the average capacity for OTP (479 patients)
and Bup (32 patients). Based on survey responses, 14% of patients served by Bup providers and 8% of patients served by responding OTPs were not Baltimore
City residents; therefore, capacity estimates reflect the number of Baltimore City residents served only.
BUP (non-OTP) providers in Baltimore City and surrounding counties = 62
Estimated treatment capacity for Baltimore City residents = 1,708
Number of OTPs in Baltimore City and surrounding counties = 36
Estimated treatment capacity for Baltimore City residents = 15,879
The MAT treatment capacity in Baltimore City is 17,587
Based on Heroin Task Force estimates of need (n=24,887), the actual difference between need and capacity is a capacity deficit of 7,300.
There are a number of limitations to this calculation. First, providers were asked to estimate their “capacity given their current resources,” which could have
been interpreted as the number that touch their facility daily, weekly or annually or the number of patients on their patient roster at any given point and time.
Providers reported capacity anywhere from 65 to 1800 patients which is a notable range. Second, closer inspection suggests that duplicates are likely in both the
SAMHSA treatment locator and ASO data, as demonstrated by the provider list in the pages that follow. Additional examination is needed to identify true
duplicates versus providers with multiple locations or service groups.

9
SAMHSA OTP Providers (n=36)
Provider Name County
A Helping Hand LLC Baltimore
Addiction Treatment Services Baltimore City
Addiction Treatment Services Baltimore City
Adult Addiction Clinic Anne Arundel
BD Health Services Baltimore
BNJ Health Services LLC Anne Arundel
BNJ Health Services LLC Baltimore City
Belair Road Health Solutions Baltimore City
Bon Secours Hospital Baltimore City
By Grace Inc Baltimore City
Center for Addiction Medicine Baltimore City
Concerted Care Group Baltimore City
Deaf Addiction Services at Maryland Baltimore City
EJAL Health Services Inc Anne Arundel
Eastern Avenue Health Solutions Inc Baltimore City
Glenwood Life Counseling Center Baltimore City
Hampden Health Solutions at Baltimore City
Institutes for Behavior Resources Inc Baltimore City
SAMHSA OTP Providers (n=36)
Provider Name County
Johns Hopkins Hospital Broadway Center
Baltimore City
Man Alive Inc Baltimore City
MedMark Treatment Centers Baltimore City
MedMark Treatment Centers Baltimore
MedMark Treatment Centers Baltimore
MedMark Treatment Centers Baltimore
MedMark Treatment Centers Baltimore City
MedMark Treatment Centers Baltimore City
MedMark Treatment Centers Daybreak Baltimore City
New Journey Inc Anne Arundel
Northern Parkway Trt Servs Inc Baltimore City
Pikesville Health Services Baltimore
Pine Heights Comp Treatment Center Baltimore City
Reflective Treatment Center Baltimore City
Sinai Hospital Baltimore City
Starting Point Baltimore City
University of Maryland Baltimore City
VA Maryland Healthcare System Baltimore City

10
SAMHSA Non-OTP Buprenorphine Providers (n=62)
Provider Name County
All Joshua LLC Anne Arundel
Allcare Treatment Services LLC Anne Arundel
American Counseling & Education Center Baltimore
American Counseling and Education Ctr Baltimore City
Baltimore Crisis Response Inc Baltimore City
Behavioral Health Clinic Baltimore City
Bergand Group Baltimore
Bon Secours Next Passage Baltimore City
Carrington House Baltimore City
Chrysalis House Inc Anne Arundel
DeVaughn Intervention Teach and Trt Baltimore
EPOCH Counseling Center Baltimore City
EPOCH Counseling Center Baltimore
EPOCH Counseling Center Baltimore
Echo House Multi Service Center Inc Baltimore City
Family Health Centers of Baltimore Baltimore City
Family Health Centers of Baltimore Baltimore City
Gaudenzia Crownsville Anne Arundel
Gaudenzia Inc Baltimore City
Gaudenzia Severna Park Outpatient Anne Arundel
Healthcare Living for Families Baltimore
Healthcare for the Homeless Inc Baltimore City
Hidden Garden Keepers Club at Baltimore City
Hope Horizon Baltimore
Hope House Treatment Center Anne Arundel
Integrative Counseling LLC Anne Arundel
Johns Hopkins Bayview Medical Center Baltimore City
Kolmac Clinic Baltimore City
Kolmac Outpatient Recovery Centers Baltimore
Lane Treatment Center Baltimore City
Mi Casa Es Su Casa Baltimore City
SAMHSA Non-OTP Buprenorphine Providers (n=62)
Provider Name County
Mi Casa Es Su Casa Behaviorial Health Baltimore City
Mountain Manor Treatment Center Baltimore City
Mountain Manor Treatment Center Baltimore City
Mountain Manor Treatment Center Baltimore City
NIH/NIDA Baltimore City
New Life Addiction Csl and Mental Anne Arundel
Pathways Alcohol/Drug Treatment Ctr Anne Arundel
Paul T Barbera Baltimore City
Polaris Recovery Center LLC Baltimore
Positive Steps LLC Baltimore City
Recovery Network Baltimore City
Recovery Network Baltimore City
Recovery Network Baltimore City
Recovery Network Baltimore City
Recovery Network Baltimore City
Recovery Network Baltimore City
Recovery Network Baltimore City
Recovery Network Baltimore City
Recovery Network Baltimore City
Recovery Network Baltimore City
Riverside Treatment Services Baltimore
Serenity Acres Treatment Center LLC Anne Arundel
Serenity and Wellness Clinic Baltimore City
Therapeutic Living for Families Baltimore City
Total Health Care Inc Baltimore City
Tuerk House Baltimore City
Turning Point Clinic Baltimore City
Universal Counseling Services Inc Anne Arundel
University of Maryland Medical Center Baltimore City
University of Maryland Medical Center Baltimore City
We Care Arundel Health Services Inc Anne Arundel

11
Publicly-Funded Providers Serving Baltimore City Residents, ASO Data – NOT USED FOR MAT CAPACITY CALCULATION
BILLING CITY* SUD Inpatient
SUD OP
SUD Partial Hospitalization
SUD Labs
SUD MD Recovery Net
SUD MAT
SUD Residential ICFA
SUD Intensive OP
SUD OP Detox
SUD IP Detox
SUD Court
SUD Women
Total
City UNK** (Assumed Baltimore Provider) 1 23 0 3 25 6 0 4 0 0 0 1 63
BALTIMORE 33 142 3 12 11 18 2 44 4 1 1 1 272
Other City 40 204 13 59 20 46 2 47 6 4 2 3 446
Total 74 369 16 74 56 70 4 95 10 5 3 5 781 Note: Services provided Jan – Dec 2015 paid through June 2016 *Billing City does not necessarily reflect the facility location. Additional analyses are needed to identify unique providers located within Baltimore City **Provider location crosswalk only available for mental health providers through ASO
Number of ASO Unique Individuals by service category; Services provided Jan – Dec 2015 paid through June 2016)
SUD
Inpatient SUD
Outpatient SUD Partial
Hospitalization SUD Labs
SUD MD Recovery
Net SUD MAT
SUD Residential
ICFA
SUD Intensive
OP
SUD OP Detox
SUD IP Detox
SUD Court
SUD Women
Total*
1,088 13,872 1,068 13,290 1,663 11,707 110 3,977 799 800 50 56 48,480*
*Individuals can contribute to multiple categories
Number of ASO Claims by provider city (Services provided Jan – Dec 2015 paid through June 2016)
BILLING CITY*
SUD Inpatient
SUD Outpatient
SUD Partial Hospitalization
SUD Labs
SUD MD Recovery Net
SUD MAT
SUD Residential ICFA
SUD Intensive Outpatient
SUD OP detox
SUD IP Detox
SUD Court
SUD Women
Total
City UKN** 16 886 0 6 12,831 14,011 0 2,815 0 0 0 67 30,632
BALTIMORE 3,286 112,187 5,332 14,875 52,448 341,508 334 77,420 2,473 188 1,840 3,451 615,342
Other City 2,951 46,778 10,732 518,292 13,378 156,405 21 21,457 1,132 885 1,700 235 773,966
Total 6,253 159,851 16,064 533,173 78,657 511,924 355 101,692 3,605 1,073 3,540 3,753 1,419,940 *Billing City does not necessarily reflect the facility location. Additional analyses are needed to identify unique providers located within Baltimore City **Provider location crosswalk only available for mental health providers through ASO

12
BHA report
BHA recently released a report that estimated the total number of consumers in need of MAT and the
treatment capacity by jurisdiction. According to BHA estimates, 12,504 individuals are in need of MAT
services and providers in Baltimore City and surrounding counties have the capacity to provide services
for 15,463 individuals. This equates to an estimated excess capacity of 2,959 individuals.
To place the estimates in context, while representing only 13% of the Maryland residents eligible for
publicly-funded services, Baltimore City residents consistently accounts each year for 30% of all
admissions to state-supported SRD treatment programs according to BHA analyses between 2009 and
20141,2. The current estimate of need places Baltimore City at 20% of the need for the state, which is
significantly less than expected. A much more detailed analysis was conducted by the Hilltop Institute
and Baltimore City Heroin task force that estimated the need at 24,887.
While BHA estimates that 12,504 (the midpoint of a range 6,364 and 18,644) individuals are
needed of MAT, the true value is likely to be closer to the high end of their range.
Based on the analyses for the current report, the MAT treatment capacity in Baltimore City is
17,587, an estimate which is greater than the BHA estimate of 15,463. Both estimates are
derived from OTP and buprenorphine provider self-report of capacity.
Based on Heroin Task Force estimates of need, the actual difference between need and capacity
is likely not a capacity excess of 2,959 but a capacity deficit of 7,300.
1Behavioral Health Administration. Outlook and Outcomes in Substance-Related Disorder Treatment FY 14.
http://bha.dhmh.maryland.gov/Documents/Publications/FY14OandO_6edited2.pdf 2Behavioral Health Administration. FY 2016/2017 – State behavioral health assessment and plance – Substance abuse
prevention and treatment block grant.
http://bha.dhmh.maryland.gov/Documents/FY2016%20Behavioral%20Health%20Assessment%20and%20Plan%20Public%20Co
mment.pdf

13
Appendix A: Baltimore City Behavioral Capacity Assessment Survey
The present survey includes responses from thirty-six unique substance abuse disorder (SUD) and mental
health providers in Baltimore, MD.
Type of Services Offered
% n
Substance Use Disorder (SUD) 34 11
Mental Health (MH) 22 7
Both Mental Health and Substance Use Disorder
44 14
Total 100 32
Levels of Care Offered
Substance Use Disorders (SUD)
Answer % n
0.5 Early Intervention 20 5
1.0 Outpatient 80 20
2.1 Intensive Outpatient 60 15
3.1 Halfway House 16 4
3.3 Long-term Residential 12 3
3.5 Therapeutic Community 4 1
3.7 Medically-monitored Inpatient 8 2
3.7D Residential Detox 8 2
Opioid Treatment Program 52 13
Buprenorphine 48 12
Care Coordination 24 6
Other 12 3
Total 100 25

14
Mental Health
% n
Outpatient 72 13
Partial Hospitalization 6 1
Inpatient Acute 0 0
Residential Crisis 6 1
Targeted Case Management 11 2
Mobile Treatment 6 1
Assertive Community Treatment 6 1
Supported Employment Program 11 2
Residential Rehabilitation Program 17 3
Psychiatric Rehabilitation Program 44 8
Youth - School-based services 6 1
Youth - Respite Services 0 0
Youth - Therapeutic Behavioral Services
6 1
Other 22 4
Total 100 18
Patient Volume and Capacity
The most frequently offered mental health services among respondent providers were outpatient and
psychiatric rehabilitation. Amount substance use disorder providers, the most frequently offered services
were outpatient, intensive outpatient, opioid treatment and buprenorphine services.
The following describe providers’ capacity assessments for these services.
Several providers noted methodological limitations to this survey. Many track patient volume on a
monthly basis, or track a gross patient profile. Providing daily estimates of patient volume was therefore
difficult. Additionally, some respondents were confused by the service categories included in the survey.
For example, many included opioid treatment as an outpatient service. These limitations may explain the
wide range for some figures.
Outpatient SUD
Nineteen outpatient SUD providers reported seeing a range of 1-1800 patients per day, with
a mean of 210 patients.
With current staff and resources, providers estimated they could increase their patient
volume to a mean of 366 patients per day. With additional staff and resources, they estimated
they could increase patient volume to a mean of 540 patients.
Two providers (11%) reported that their current patient volume exceeds capacity. They
reported turning away a mean of 13 patients per week due to capacity limitations.
15
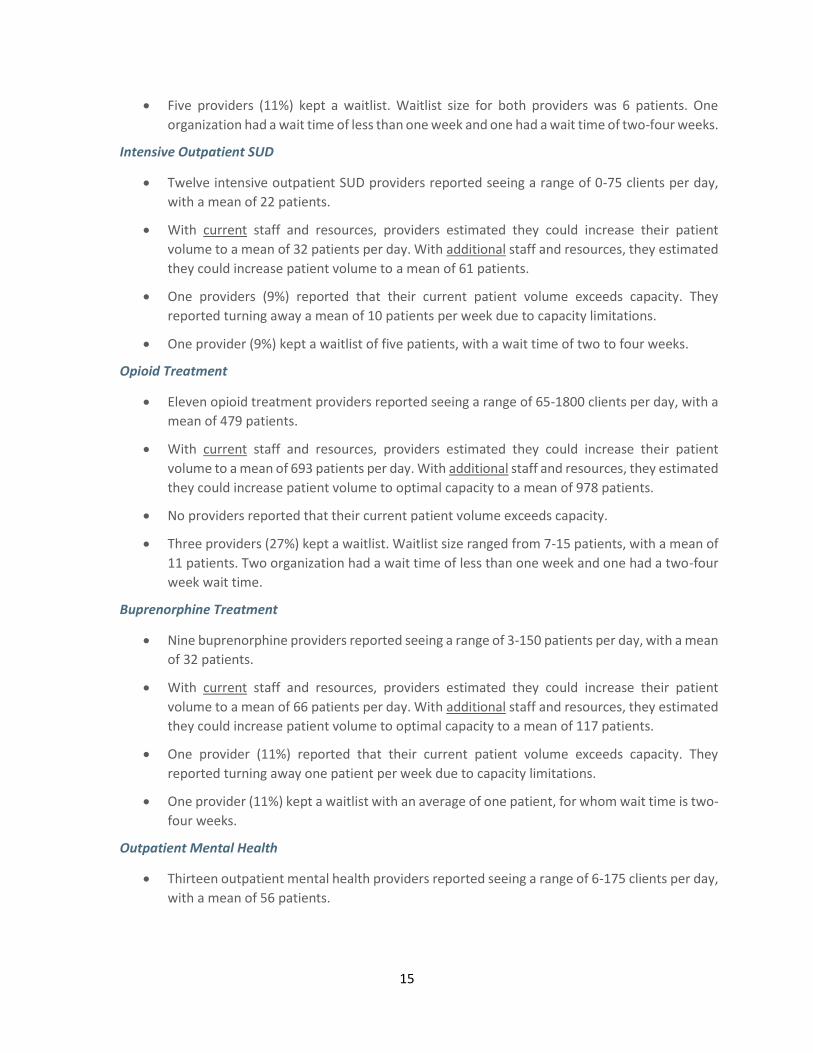
Five providers (11%) kept a waitlist. Waitlist size for both providers was 6 patients. One
organization had a wait time of less than one week and one had a wait time of two-four weeks.
Intensive Outpatient SUD
Twelve intensive outpatient SUD providers reported seeing a range of 0-75 clients per day,
with a mean of 22 patients.
With current staff and resources, providers estimated they could increase their patient
volume to a mean of 32 patients per day. With additional staff and resources, they estimated
they could increase patient volume to a mean of 61 patients.
One providers (9%) reported that their current patient volume exceeds capacity. They
reported turning away a mean of 10 patients per week due to capacity limitations.
One provider (9%) kept a waitlist of five patients, with a wait time of two to four weeks.
Opioid Treatment
Eleven opioid treatment providers reported seeing a range of 65-1800 clients per day, with a
mean of 479 patients.
With current staff and resources, providers estimated they could increase their patient
volume to a mean of 693 patients per day. With additional staff and resources, they estimated
they could increase patient volume to optimal capacity to a mean of 978 patients.
No providers reported that their current patient volume exceeds capacity.
Three providers (27%) kept a waitlist. Waitlist size ranged from 7-15 patients, with a mean of
11 patients. Two organization had a wait time of less than one week and one had a two-four
week wait time.
Buprenorphine Treatment
Nine buprenorphine providers reported seeing a range of 3-150 patients per day, with a mean
of 32 patients.
With current staff and resources, providers estimated they could increase their patient
volume to a mean of 66 patients per day. With additional staff and resources, they estimated
they could increase patient volume to optimal capacity to a mean of 117 patients.
One provider (11%) reported that their current patient volume exceeds capacity. They
reported turning away one patient per week due to capacity limitations.
One provider (11%) kept a waitlist with an average of one patient, for whom wait time is two-
four weeks.
Outpatient Mental Health
Thirteen outpatient mental health providers reported seeing a range of 6-175 clients per day,
with a mean of 56 patients.

16
With current staff and resources, providers estimated they could increase their patient
volume to a mean of 50 patients per day. With additional staff and resources, they estimated
they could increase patient volume to a mean of 196 patients.
Three providers (23%) reported that their current patient volume exceeds capacity. They
reported turning away a mean of 17 patients per week due to capacity limitations.
Five providers (39%) kept a waitlist. Waitlist size ranged from 5-30 patients, with a mean of
13 patients. One organization had a wait time of less than one week; three had two-four
weeks; and one had one-three months.
Psychiatric Rehabilitation
Eight outpatient mental health providers reported seeing a range of 0-225 patients per day,
with a mean of 50 patients.
With current staff and resources, providers estimated they could increase their patient
volume to a mean of 68 patients per day. With additional staff and resources, they estimated
they could increase patient volume to a mean of 55 patients.
No providers reported that their current patient volume exceeds capacity.
No providers kept a waitlist.
Ability to Prescribe Buprenorphine
% n
Currently prescribe 47 15
Able to prescribe but do not 9 3
Do not prescribe 44 14
Total 100 32
Naloxone-Trained Staff
% n
Staff trained to administer naloxone
66 21
Staff trained to provide overdose education and dispense take-home naloxone
44 14
Staff are not trained to administer naloxone
28 9
Total 100 32

17
Ambulatory Withdrawal Management
Six of twenty-seven respondent organizations (22%) currently provide ambulatory withdrawal
management services. Those who do not rated their ability to expand to provide this service as follows:
% n
Definitely able 7 2
Probably able 15 4
Probably unable 22 6
Definitely unable 22 9
Total 100 27
Service Gaps
Seventeen of twenty-seven respondents (63%) reported that there are mental health services their
patients demand but they are unable to provide. The most common of these was psychiatric services
(n=10, 59%).
Seventeen of twenty-seven respondents (63%) also said there are substance use disorder services their
patients demand but they are unable to provide. The most common of these was housing (n=12, 44%).
Expansion Capacity
Overall, the respondent providers rated their interest and ability to expand service provision as follows.
% n
Both interested in and able to expand
52 14
Interested in expanding but unable 30 8
No interest in expanding 7 2
Don’t know 11 3
Total 100 27
Walk-In Hours
% n
Yes 74 20
No 26 7
Total 100 27
Aware of Baltimore City Crisis, Information, and Referral Line
% n
Yes 93 25
No 7 2
Total 100% 27


![aquaservices.co.inaquaservices.co.in/Attachment/tonner.pdf · Heat Treatment Corrosion Allowance Water Capacity [Approx] Chlorine Capacity [Approx] Normal Capacity Approval Of Design](https://img.pdfslide.net/doc/110x75/5ce741cb88c99304558c703f/-heat-treatment-corrosion-allowance-water-capacity-approx-chlorine-capacity.jpg)