Embed Size (px)
Citation preview

Ikumbur et al., 2019 304
Nigerian Journal of Environmental Sciences and Technology (NIJEST)
www.nijest.com
ISSN (Print): 2616-051X | ISSN (electronic): 2616-0501
Vol 3, No. 2 October 2019, pp 304 - 316
Subsurface Structural Mapping over Koton Karifi and Adjoining
Areas, Southern Bida Basin, Nigeria, using High-Resolution
Aeromagnetic Data
Ikumbur E.B.1,*, Ogah V.E.1 and Akiishi M.2
1Department of Geology, Benue State Polytechnic Ugbokolo, Nigeria 2Department of Physics, College of Education Oju, Benue State, Nigeria
*Corresponding Author: [email protected]
https://doi.org/10.36263/nijest.2019.02.0151
ABSTRACT
In this current work, we aim to delineate the subsurface structural trends, determine the depth to
basement surface, and provide an illustrative 3D model for its subsurface structure. Four digitized
aeromagnetic maps were acquired from the Nigerian Geological Survey Agency, Abuja. The total
field aeromagnetic anomalies over Koton Karifi and adjoining areas have been evaluated. In order
to map the subsurface structures and estimate the depth to basement surface the spectral analysis
method was applied. To achieve such goals, a detailed analysis of the aeromagnetic data for the
study area was performed. 2D interpretation was carried out for the aeromagnetic data. The
processes used include contouring of the Total Magnetic Intensity (TMI) data, separation of
regional and residual anomalies, structural detection methods such as analytic signal, vertical
derivatives, and magnetic lineament mapping were used to map the contacts and faults within the
study area. The first vertical derivative and the magnetic lineament maps show major geologic
lineaments trending in East-West with minor ones trending Northeast-Southwest. In the south-
eastern part of the study area, there is a dome-shaped linear feature. The result obtained using the
spectral analysis method reveals two source depth models. The depths to deeper magnetic sources
range from 2.81 km to 3.24 km with an average depth of 2.90 km. The deeper magnetic source
bodies are identified with the magnetic basement. The shallower magnetic sources which range
from 0.45 km to 1.81 km with an average depth of 1.13 km could be attributed to near surface
magnetic sources which are magnetic rocks that intruded into the sedimentary formations or
magnetised bodies within the sedimentary cover. Based on the sedimentary thickness range of 0.45
to 3.24 km, there is an indication that the possibility of hydrocarbon generation in the study area is
feasible.
Keywords: Spectral analysis, aeromagnetic anomalies, analytic signal, vertical derivative, depths-
to-basement, subsurface structures.
1.0. Introduction
Magnetic lineaments over sedimentary basins are zones of gradient interruptions or zones marked by
sharp changes of the orientation of anomalies. These anomalies may be as a result of the faults
affecting the underlying basement alone or both the basement and the sedimentary formations.
Lineament is a mappable linear or curvilinear feature of a surface whose parts align in a straight or
slightly curving relationship (Hung et al., 2005). Magnetic anomalies depend on rock magnetism
(Telfold et al., 1990). Most sedimentary rocks and surface cover are non-magnetic so the observed
anomalies are related to the underlying igneous and metamorphic rocks. Potential field data especially
aeromagnetic surveys are used commonly to map basement structure beneath sediment cover. We
used the term ‘subsurface structure’ as defined by Ross et al., 2017, which is described as structural
fabrics within the crystalline basement. Some of these are shear zones that have maintained their
coherence during ductile deformation and some are faults or fault zones where coherence has been

Nigerian Journal of Environmental Sciences and Technology (NIJEST) Vol 3, No. 2 October 2019, pp 304 - 316
Ikumbur et al., 2019 305
lost and slip in the brittle regime has occurred. Such structures can be identified and delineated
accurately by using regional magnetic field data sets.
Magnetic survey is aimed at investigating the subsurface geology on the basis of magnetic anomalies
in the earth’s magnetic field resulting from the magnetic properties of the underlying rocks (Ikumbur
et al., 2013). Aeromagnetic survey is one of the most important tools used in modern geological
mapping. The aeromagnetic survey is applied in mapping the magnetic anomalies in the earth’s
magnetic field and this is correlated with the subsurface geological structure (Chinwuko et al., 2012;
Onuba et al., 2012; Udensi and Osazuwa, 2004). In addition, aeromagnetic surveys are used to
determine depth and structure of crystalline basement rocks underlying sedimentary basins
(Abdulsalam et al., 2011; Akanbi and Udensi, 2006). Previous studies on spectral analysis of
aeromagnetic data were carried out in other parts Nigeria. Such works include that of Onwuemesi
(1997) who applied 1D spectral analysis to aeromagnetic anomalies in the Anambra basin; Anakwuba
et al., (2011) used spectral methods to interpret aeromagnetic anomalies over Maiduguri-Dikwa
depression of Chad basin. Onuba et al., (2012) applied spectral analysis to evaluate aeromagnetic
anomalies over Okigwe area, South-eastern Nigeria; while Chinwuko et al., (2012) also applied
spectral analysis to evaluate aeromagnetic anomalies over parts of Upper Benue Trough/Southern
Chad basin, Nigeria. Aeromagnetic method been recognized as an effective tool for mapping
structures within basement rocks where measured magnetic anomalies usually indicate magnetic
susceptibility contrasts within crystalline basement (Elebiju et al., 2010; Sunmonu et al., 2000).
The present study involves the mapping of subsurface structures over Koton Karifi and Adjoining
areas using high-resolution aeromagnetic data. The objectives of this study are to delineate the
possible subsurface structural trends, to determine the approximate depth to basement, and to provide
a 3D structural model to illustrate the subsurface structures found in the study area.
1.1. Location and geology
The area of study, which is part of the southern Bida basin, is bounded by latitude 80001 N and
90001N, and longitude 60001E and 70001E. It is an area of about 12,000 km2 situated at the West-
Central Nigeria (Figure 1). The Bida Basin is an elongated NW-SE trending depression perpendicular
to the main axis of the Benue Trough of Nigeria. The entire basin is bounded by latitudes 80001N and
100301N and longitudes 40301E and 70301E. It covers an area of about 90,760 km2 (Nwankwo et al.,
2008). The basin is a gentle down-warped shallow trough filled with Campanian-Maastrichtian
marine to fluviatle strata believed to be more than 300m thick (Jones, 1958; Adeleye, 1976). The
Basin might be regarded as north-western extension of Anambra basin and is found in the western
part of central Nigeria. Both the Anambra and Bida basin were major depocenters during the second
major sedimentary cycle of southern Nigeria in the Upper Cretaceous time (Obaje, 2009).
Figure 1: Map of study area showing its location and geology (After Obaje, 2009)
STUDY AREA

Nigerian Journal of Environmental Sciences and Technology (NIJEST) Vol 3, No. 2 October 2019, pp 304 - 316
306 Ikumbur et al., 2019
The original rock of the area could have been subjected to considerable erosion before the Upper
Cretaceous beds were laid down. Tertiary earth movements impacted low dips to this Formation
leading to erosion over wider areas. The youngest rocks of the area are laterites and alluvial, terrace
and terrestrial deposits of tertiary and recent age (Russ, 1957).
Both surface and subsurface information available is suggestive of Post-Santonian origin as sediments
in Bida basin are generally undisturbed (Agyingi, 1991). Maximum sedimentary thickness of up to
3.30km has been recorded in the basin from aeromagnetic interpretation (Agyingi, 1991).
Unconformity surface, different form of beddings (cross, parallel and graded), deformation and
diagenetic features, such as fractures, slumps and concretions are prominent features in the basin. The
features show characteristics of continental rift basin development (Obaje, 2009). The geological map
of the southern part of Bida basin shown in Figure 1 consists of Lokoja, Patti and Agbaja Formations.
According to Akande et al., (2005), the Patti Formation which is the only stratigraphic unit containing
carbonaceous shale in the Bida basin is sand-witched between the order Campanian-Maastrichtian
Lokoja Formation (conglomerates, sandstones and claystones) and younger Agbaja Formation
(mainly ironstones).
2.0. Materials and Methods
Four digitized high-resolution aeromagnetic maps (sheets 205, 206, 226 and 227) were acquired from
Nigerian Geological Survey Agency, Abuja; assembled and interpreted. The data set is from the new
high-resolution airborne survey coverage in Nigeria carried out by Fugro Airborne Surveys between
2006 and 2009. The aeromagnetic surveys were flown along a series of NW-SE flight lines, spaced
500m, with 2000m tie-line spacing in a NE-SW direction and 80m nominal flight height. The data
were recorded at 0.1 second interval. Since the survey was flown closer to ground (80m flight height)
with narrow line spacing and very small recording interval, the resolution of anomalies is more
superior to that of conventional high-altitude surveys.
The first step in the present study was to assemble the four maps covering the study area. The next
was to re-contour the map to produce the total field aeromagnetic intensity map (Figure 2). The
contoured total-field intensity map contains both the regional and residual anomaly. The regional
gradient was removed from the map by fitting a linear surface to the digitized aeromagnetic data using
the least square method. The surface linear equation on the data can be given according to Likkason
(1993) as;
𝑝(𝑥, 𝑦) = 𝑎𝑥 + 𝑏𝑦 + 𝑐 (1)
Where, a, b and c are constants; x and y are distances in x and y axes; 𝑝(𝑥, 𝑦) is the magnetic value
at 𝑥 and 𝑦 co-ordinates. The Least squares method of statistical analysis was used to obtain the
constants (a, b and c) and the trend surface equation (regional gradient) becomes;
𝑝(𝑥, 𝑦) = 1.8013𝑥 − 0.4575𝑦 + 7989.78 (2)
The trend surface equation (eq. 2) was then subtracted from the aeromagnetic (observed) data and the
resultant residual aeromagnetic anomaly data was obtained and contoured (Figure 3) using contouring
software (Surfer Version 32). The analytical signal and first vertical derivative maps of the study area
were produced using Geosoft software-Oasis Montaj (Figures 4 and 5).

Nigerian Journal of Environmental Sciences and Technology (NIJEST) Vol 3, No. 2 October 2019, pp 304 - 316
Ikumbur et al., 2019 307
Figure 2: Total Magnetic Intensity map of the study area (Contour Interval ≈ 30nT)
Figure 3: Residual Anomaly Map of the study area with cross-sections
Baro Gulu
Kirri Koton karifi

Nigerian Journal of Environmental Sciences and Technology (NIJEST) Vol 3, No. 2 October 2019, pp 304 - 316
308 Ikumbur et al., 2019
Figure 4: Analytical Signal Map of the Study Area
Figure 5: First Vertical Derivative Map of the Study Area
The lineament map was produced by drawing the lines parallel to the structures (faults and contact
systems). Contact location and their trends were traced from the analysis and interpretation of
analytical signal and first vertical derivative maps (figures 4 and 5). The traced magnetic structural
lineaments map (figure 6) represents faults and / or contacts between rocks type with different
magnetic susceptibilities.
Baro
Gulu
Kirri Kotonkarifi
Baro Gulu
Kirri Kotonkarifi

Nigerian Journal of Environmental Sciences and Technology (NIJEST) Vol 3, No. 2 October 2019, pp 304 - 316
Ikumbur et al., 2019 309
Figure 6: Magnetic Lineament map of the study area
3.0. Results and Discussion
3.1. Qualitative interpretation
The qualitative interpretation was done by visual inspection of the total magnetic intensity, residual
magnetic anomaly, analytic signal, first vertical derivative and magnetic lineament maps. The residual
magnetic anomaly map was produced by subtracting the regional magnetic field from the total
magnetic intensity field. The total magnetic field range from 7600 to 8380 nanotesla (nT) in the study
area, where higher values are found in the northern and southern parts, and lower values in the central
region (Figures 2 and 4).The closely spaced linear sub-parallel orientation of contours in the northern
and southern parts of the study area suggests the presence of faults or local fractured zones in the
study area (Figure 5). Most of the anomalous features trend in the East-West direction, while minor
ones trend Northeast-Southwest. Such geologic features may appear as thin elliptical closures or
nosing on an aeromagnetic map. These features represent geologic lineaments and their positions are
indicated by lines drawn parallel to the elongation and through the centre of the anomalies represented
in Figure 6. The main trend of the lineaments is East-West, while few trend Northeast-Southwest.
A visual inspection of aeromagnetic map over the study area shows that the contour lines are widely
spaced in the central part which shows thicker sediments in the region indicating that the depth to
basement is higher compared to the closely spaced contours in the northern and southern parts which
suggest shallow sedimentary thickness (Figure 3). The analytic signal map shows areas of higher
intensity (high signal) in the north and south of the study area, while the central region has lower
intensity (low signal) (Figure 4). Also, the residual anomaly map shows positive magnetic anomaly
and larger sedimentary thickness indicating deeper depths at the central region, while the northern and
southern portions show negative anomaly with smaller sediment thickness indicating shallower
depths. In the south-eastern part of the study area (Koton-Karifi), there is a dome-shaped linear
feature (Figures 2, 3 and 5). The general indication is that this linear feature is of intermediate depth
and seems to be hosted in the basement structure and is thought to be a major divide (fault or fracture)
making a boundary (Abdulsalam et al., 2011). Several contour closures are found south of this
lineament, which indicate shallow basement. This may be due to the fact that the Niger-Benue River
confluence is an uplifted area, similar to a model earlier proposed by Wright (1976) and Likkason
(1993).

Nigerian Journal of Environmental Sciences and Technology (NIJEST) Vol 3, No. 2 October 2019, pp 304 - 316
310 Ikumbur et al., 2019
3.2. Quantitative interpretation
3.2.1. Depth estimation
In order to estimate depths to basement across the study area using spectral methods, five profiles
were taken cutting across anomalous features for the interpretation of the geophysical anomalies in
the area under study (Figure 3). The anomalies identified on these profiles were then subjected to the
spectral analysis. The Spectral analysis method is represented mathematically (according to
Onwuemesi, 1997) as:
𝑌𝑖(𝑥)= ∑𝑁𝑛=1 [𝑎𝑛 𝑐𝑜𝑠 𝑐𝑜𝑠 (
2𝜋𝑛𝑥𝑖
𝐿) + 𝑏𝑛 𝑠𝑖𝑛 𝑠𝑖𝑛 (
2𝜋𝑛𝑥𝑖
𝐿) ] (3)
where: 𝑌𝑖(𝑥) = Reading at 𝑥𝑖 position
L = length of the cross-section of the anomaly
n = harmonic number of the partial wave
N = number of data points
𝑎𝑛= real part of the amplitude spectrum
𝑏𝑛= imaginary part of the amplitude spectrum
i = 0, 1, 2, 3, -------------------------, n
Figure 7 shows the magnetic anomaly graphs drawn from five cross-sections. Graphs of the natural
logarithms of the amplitude (An) against frequency (n) were plotted and the linear segments from the
low frequency portion of the spectral were drawn from the graphs (Figure 8). The gradient of the
linear segments were computed and the depths to the basement were determined using the equation
according to Negi et al., (1983), given as;
Z = -ML/2п (4)
where,
Z = depth to the basement
M = gradient of the linear segment
L = length of the cross-section of the anomaly
Figure 7: Anomaly graphs drawn from the cross-sections AAl-EEl
Partial Amplitude

Nigerian Journal of Environmental Sciences and Technology (NIJEST) Vol 3, No. 2 October 2019, pp 304 - 316
Ikumbur et al., 2019 311
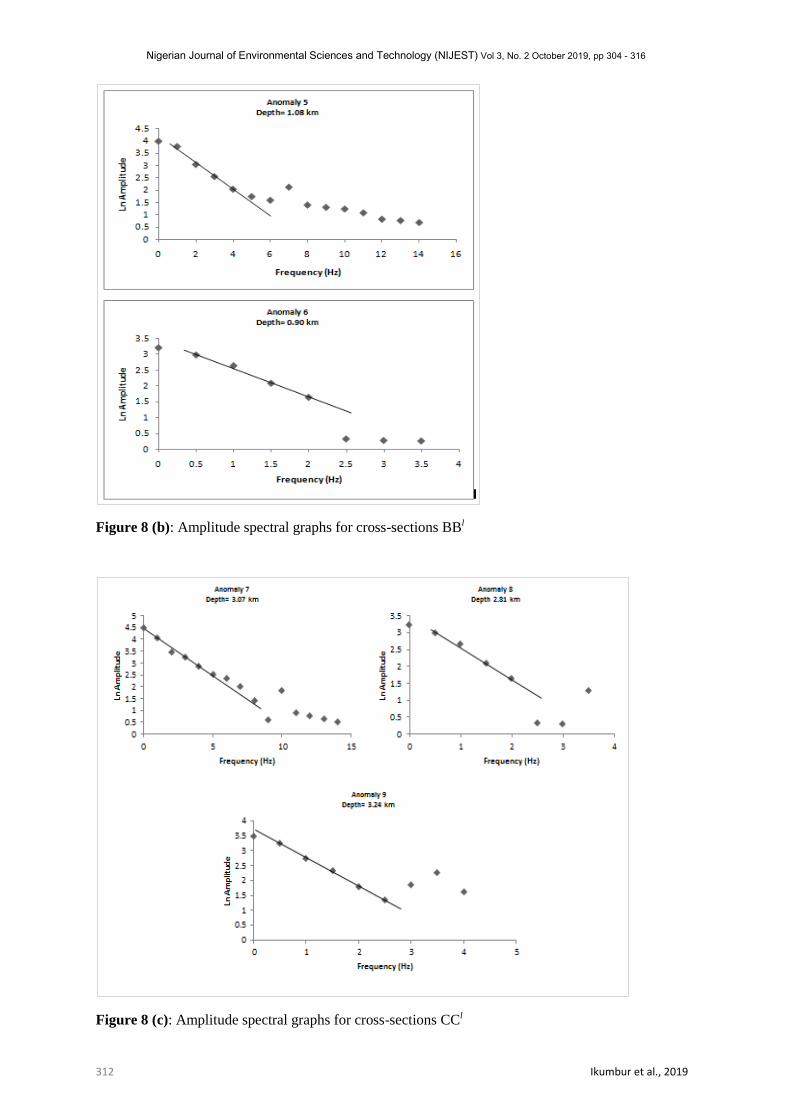
Graphs of the natural logarithms of the amplitude against frequencies for the selected profiles are
shown in Figure 8 (a) – (d). The gradient of the linear segments were computed by dividing the
change in values of y by change in values of x (i.e. Δy/Δx) and used to estimate the depth to magnetic
sources. The depths to magnetic sources range from 0.45 to 3.24 km (Table 1).
Figure 8 (a): Amplitude spectral graphs for cross-sections AAl
Nigerian Journal of Environmental Sciences and Technology (NIJEST) Vol 3, No. 2 October 2019, pp 304 - 316
312 Ikumbur et al., 2019
Figure 8 (b): Amplitude spectral graphs for cross-sections BBl
Figure 8 (c): Amplitude spectral graphs for cross-sections CCl

Nigerian Journal of Environmental Sciences and Technology (NIJEST) Vol 3, No. 2 October 2019, pp 304 - 316
Ikumbur et al., 2019 313
Figure 8 (d): Amplitude spectral graphs for cross-sections DDl
Table 1: Basement Depths (in km) obtained from Spectral Analysis
Profile name Profile direction Anomaly Gradients Depth(km)
AAl
Along Kirri
NW-SE 1 -0.79224 0.45
NW-SE 2 -2.77850 0.88
NW-SE 3 -4.10821 1.31
NW-SE 4 -1.40014 0.45
BBl
Along Kirri & Kotonkarfi
NW-SE 5 -0.48680 1.08
NW-SE 6 -0.80529 0.90
CCl
Along Baro, Kirri &
Kotonkarfi
NW-SE 7 -1.37781 3.07
NW-SE 8 -2.94263 2.81
NW-SE 9 -2.03576 3.24
DDl
Along Baro & Gulu
NW-SE 10 -2.25295 2.82
NW-SE 11 -0.55996 0.62
NW-SE 12 -1.33840 1.49
NW-SE 13 -0.59960 0.67
EEl
Along Gulu
NW-SE 14 -0.55870 0.56
NW-SE 15 -0.67950 0.76
NW-SE 16 -0.98914 1.10

Nigerian Journal of Environmental Sciences and Technology (NIJEST) Vol 3, No. 2 October 2019, pp 304 - 316
314 Ikumbur et al., 2019
3.3. Basement topography
The computed depths to basement were used to construct both the basement map and 3-D surface map
for the basement topography of the area (Figures 9 and 10). The two maps show that the depth to
basement is deeper in the central region and shallower in the northern and southern parts of the study
area. The 3-D surface map also shows a linear depression with thicker sediments at the central region
of the study area trending E-W direction.
Figure 9: Depth to basement map of the study area
Figure 10: 3D Surface Plot for the basement topography of the study area
4.0. Conclusions
Spectral analysis method has been applied to a set of high-resolution aeromagnetic data over Koton-
Karifi and Adjoining Areas. The result shows that two depth sources were obtained in the study area;
the deeper sources range from 2.81-3.24km, while the shallower sources range from 0.45-1.49km.
The depths to basement are deeper in the central part trending East-West direction and shallower in
the northern and southern parts of the study area. The deeper magnetic source bodies are identified
with the magnetic basement, while the shallower magnetic sources may be attributed to near surface
magnetic sources which are magnetic rocks that intruded into the sedimentary formations or
Gulu
Baro
Koton-Karifi
Kirri
Km
Km
S

Nigerian Journal of Environmental Sciences and Technology (NIJEST) Vol 3, No. 2 October 2019, pp 304 - 316
Ikumbur et al., 2019 315
magnetized bodies within the sedimentary cover. The result also shows a linear depression with
sedimentary accumulation trending East-West. The general trend of the anomalies in the study area is
East-West, minor ones trend Northeast-Southwest directions. Based on the sedimentary thicknesses
(0.45-3.24 km) obtained from the study area, there is an indication that the possibility of hydrocarbon
generation is feasible if all other conditions for hydrocarbon accumulation are favourable.
References
Abdulsalam, N.N., Mallam, A., and Likkason, K.O., (2011). Identification of linear Features using
continuation filters over Koton-Karifi Area, Nigeria, from Aeromagnetic Data, World Rural
Observations, vol. 3, No.1, pp. 1-8.
Adeleye, D.R., (1976). The geology of the Middle Niger Basin, In: Geology of Nigeria (C. Kogbe,
Ed.) Elizabethan Publishing Co. Lagos, pp. 283-287.
Agyingi, C.M., (1991). Geology of Upper Cretaceous rocks in the eastern Bida Basin, Central
Nigeria, Unpublished PhD Thesis, University of Ibadan, Nigeria, 501p.
Akanbi, E.S. and Udensi, E.E., (2006). Structural trends and spectral depth analysis of the residual
field of Pategi Area, Nigeria, using aeromagnetic data, Nigerian Journal of physics, vol. 18, No.2, pp.
271- 276.
Akande, S.O., Ojo, O.J. and Ladipo, K., (2005). Upper Cretaceous sequences in the Southern Bida
Basin, Nigeria. A Field guide book, Mosuro Publishers, Ibadan, 60p.
Anakwuba, E.K., Onwuemesi, A.G., Chinwuko, A. I. and Onuba, L. N., (2011). The Interpretation of
Aeromagnetic anomalies over Maiduguri-Dikwa depression, Chad Basin Nigeria: A Structural View,
Scholars research library, Archives of Applied Science Research, vol. 3, No. 4, pp. 499-508.
Chinwuko, A. I., Onwuemesi, A.G., Anakwuba, E.K. and Nwokeabia, N.C., (2012). Interpretation of
aeromagnetic anomalies over parts of Upper Benue Trough and Southern Chad Basin, Nigeria,
Advances in Applied Science Research, vol. 3, No. 3, pp. 1757-1766.
Elebiju, O.O., Keller, G.R. and Marfurt, K.J., (2010). Investigation of links between Precambrian
basement structure and Paleozoic strata in the Fort Worth basin, Texas, U.S.A., using high-resolution
aeromagnetic (HRAM) data and seismic attributes: Geophysics, vol. 75, No.4, pp.157-168.
Hung L.Q., Batelaan O., and De Smedt F., (2005). Lineament extraction and analysis, comparison of
LANDSAT ETM and ASTER imagery, Case study: Suoimuoi tropical karst catchment,
Vietnam, Proceedings of SPIE - The International Society for Optical Engineering.
Ikumbur, E. B., Onwuemesi, A. G., Anakwuba, E. K., Chinwuko, A. I., Usman, A. O., Okonkwo, C.
C., (2013). Spectral Analysis of Aeromagnetic data over part of the Southern Bida Basin, west-central
Nigeria, International Journal of Fundamental Physical Sciences, vol. 3, No. 2, pp. 27-31.
Jones, H. A., (1958). The occurrence of Oolitic Ironstones in Nigeria: Their Origin, Geological
history and Petrology, Oxford, D.Phil. Thesis.
Likkason, O.K., (1993). Application of Trend Surface analysis gravity data over the Middle Niger
Basin, Nigeria, Journal of Mining and Geology, vol. 29, No.2, pp. 11-19.
Negi, J.G., Agrawal, P.K. and Rao, K. N.N., (1983). Three dimensional Model of the Moyan area of
Maharshiatra state (India) based on the spectral analysis of aeromagnetic data, Geophysics, vol. 48,
No.7, pp. 964-974.
Nwankwo, L.I., Olasehinde, P.I and Akoshile, C.O., (2008). Spectral Analysis of Aeromagnetic
Anomalies of the Northern Nupe Basin, West-central Nigeria, Global Journal of Pure and Applied
Science, vol. 14, No. 2, pp. 247-252.

Nigerian Journal of Environmental Sciences and Technology (NIJEST) Vol 3, No. 2 October 2019, pp 304 - 316
316 Ikumbur et al., 2019
Obaje N.G., (2009). Geology and Mineral Resources of Nigeria, Springer, Heidelberg, 221p.
Onuba, L. O., Chinwuko, A. I. , Onwuemesi, A. G., Anakwuba, E. K., and Nwokeabia, N .C.,
(2012). Interpretation of Aeromagnetic Anomalies over parts of Upper Benue Trough and Southern
Chad Basin, Nigeria, Pelagia Research Library, Advances in Applied Science Research, vol. 3, No. 3,
pp. 1757-1766.
Onwuemesi, A.G., (1997). One Dimensional Spectral Analysis of Aeromagnetic Anomalies and Curie
Depth Isotherm in the Anambra Basin of Nigeria, Journal of Geodynamics, vol. 23, No.2, pp. 95-107.
Ross, Z.E., Hauksson, E. and Ben-Zion, Y., (2017). Abundant off-fault seismicity and orthogonal
structures in the San Jacinto fault zone, Sci. Adv., vol. 3, pp. 1-9.
Russ, W., (1957). The geology of parts of Niger, Zaria and Sokoto Provinces: Geological Survey of
Nigeria Bulletin No.27, 31p.
Sunmonru, L.A., Adabanija, M.A. and Olowofela, J.A., (2000). 2 - Dimensional Spectral Analysis of
magnetic Anomalies of South-eastern part of middle - Niger Basin, Central Nigeria, Nigeria Journal
of physics, vol. 12, pp. 39 - 44.
Telfold, W.M., Geldart, L.P. and Sheriff, R.E., (1990). Applied Geophysics, Second edition,
Cambridge University Press, 772p.
Udensi, E. E. and Osazuwa, I. B., (2004). Spectral determination of depth to Buried magnetic rocks
under the Nupe Basin, Nigeria; Nigeria Association of Petroleum Explorationists, Bulletin, vol. 17,
No.1, pp. 22 - 27.
Wright, J.B., (1976). Fracture systems in Nigeria and initiation of fracture Zones in The South
Atlantic, Tectonophysics, vol. 34, pp. 43 - 47.
Cite this article as:
Ikumbur, E.B., Ogah, V.E. and Akiishi, M., 2019. Subsurface Structural Mapping over Koton Karifi and
Adjoining Areas, Southern Bida Basin, Nigeria, using High-Resolution Aeromagnetic Data. Nigerian Journal of
Environmental Sciences and Technology, 3(2), pp. 304-316. https://doi.org/10.36263/nijest.2019.02.0151


![Mapping Subsurface Alteration Using Gravity and · PDF fileMapping Subsurface Alteration Using Gravity and Magnetic Inversion Models Williams, N. [1], Dipple, G. [1] _____ 1. Mineral](https://img.pdfslide.net/doc/110x75/5abe32647f8b9ad8278cdba9/mapping-subsurface-alteration-using-gravity-and-subsurface-alteration-using.jpg)