Embed Size (px)
Citation preview
www.osram-licht.ag
Q4 FY13 Management Presentation (preliminary figures)(preliminary figures)
Successful FY13 with a strongyear-end finishy
OSRAM Licht AGNovember 12 2013November 12, 2013

Safe Harbor StatementSafe Harbor Statement
This presentation may contain forward-looking statements that are subject to risks and uncertainties,including those pertaining to the anticipated benefits to be realized from the proposals describedherein. Forward-looking statements may include, in particular, statements about future events, futurefinancial performance plans strategies expectations prospects competitive environmentfinancial performance, plans, strategies, expectations, prospects, competitive environment,regulation and supply and demand. OSRAM Licht AG has based these forward-looking Statementson its views and assumptions with respect to future events and financial performance. Actualfinancial performance could differ materially from that projected in the forward-looking Statementsdue to the inherent uncertainty of estimates forecasts and projections and financial performancedue to the inherent uncertainty of estimates, forecasts and projections, and financial performancemay be better or worse than anticipated. Given these uncertainties, readers should not put unduereliance on any forward-looking statements. The information contained in this presentation is subjectto change without notice and OSRAM Licht AG does not undertake any duty to update the forward-looking statements and the estimates and assumptions associated with them except to the extentlooking statements, and the estimates and assumptions associated with them, except to the extentrequired by applicable laws and regulations.
Due to rounding, numbers presented throughout this and other documents may not add up preciselyto the totals provided and percentages may not precisely reflect the absolute figuresto the totals provided and percentages may not precisely reflect the absolute figures.
Management presentation Q4 FY13 (preliminary figures) | November 12, 20132© OSRAM Licht AG 2013. All rights reserved.
2

G hi hli ht FY13Group highlights FY13
Successful FY13 with a strong year-end finishMajority of announced FY12-FY14 restructuring program doneRestructuring in Luminaires and Services initiatedDuring FY13 new product pipeline filled for profitable growth in FY14During FY13 new product pipeline filled for profitable growth in FY14
Outlook FY13 guidance delivered Comparable growth: 2% Adj. EBITA margin1): 7.7% Net income: €34m FCF: €284met co e €3 C € 8
OSRAM Push execution ahead of schedule€433m cumulated PUSH gross savings reached in FY13€433m cumulated PUSH gross savings reached in FY13OSRAM Push pipeline for FY14 well filled with measures
OSRAM‘s transformation towards SSL continuedOSRAM s transformation towards SSL continued29% SSL revenue share (vs. 25% FY12) of total salesInvestments in SSL product pipeline starts to pay-off; SSL gross margins rising in all reporting segments
Management presentation Q4 FY13 (preliminary figures) | November 12, 20133© OSRAM Licht AG 2013. All rights reserved.
1) Adjusted for “Special items”

S t hi hli ht FY13Segment highlights FY13
Specialty Lighting (SP)Long-term growth above market continuedDesign win for laser light front lights; advanced development projects for OLED rear lights
Opto Semiconductors (OS)€1 bn in revenue exceeded for the first time everFlash light design wins at two leading smartphone makersFlash light design wins at two leading smartphone makers
Lamps & Components (LC)Growth in Q4 after quarters of declineGrowth in Q4 after quarters of declineIntroduction of new LEDr lamps, light engines and SSL drivers
Luminaires & Solutions (LS)Luminaires & Solutions (LS)Restructuring in Luminaires and Services initiatedSubstantial growth of professional SSL outdoor luminaires
Management presentation Q4 FY13 (preliminary figures) | November 12, 20134© OSRAM Licht AG 2013. All rights reserved.

OSRAM Push – Execution ahead of scheduleNew OSRAM Push targets
OSRAM Push: Overall, comprehensive, sustainable performance improvement program
New OSRAM Push targets
>8%1)
OSRAM Push execution track record “old”
>80%
As of Q3 FY13
As of Q4 FY13 Progress Target
Transformation costs (€m)(FY12 – 14)
388 498 ≤ 600
Structure Growth
63%83%
64%
(FY12 14)
Plant reductions(FY12 – 14) 5 7 11
Headcount reduction (‘000)(FY12 – 14)
5.2 6.6 2) c.8.0
OSRAM Push gross
Operation CultureEBITA Margin: 8% 43%
OSRAM Push gross savings, cum. (€m)(FY13 – 15)
316 433 c.1,000
OSRAM Push execution track record “new”As of Q3 As of Q4
New OSRAM Push targets:
>8% as average over the cycle
64%
>80%
FY13 FY13 Progress Target Transformation costs (€m)(FY12 – 14)
388 498 ≤ 600
Plant reductions(FY12 – 14) 5 7 11
New OSRAM Push targets: Cum. gross savings raised to €1.2bn by FY15
Headcount reduction increased to 8,700 by FY14
Reduction of manufacturing sites unchanged
36%
76%Headcount reduction (‘000)(FY12 – 14)
5.2 6.6 2) c.8.7
OSRAM Push gross savings, cum. (€m)(FY13 – 15)
316 433 c.1,200
g g
OPEX targets unchanged:
SG&A1): Reduce by ~8-10% by FY14 vs. FY12
R&D: Keep absolute terms flat until FY14 vs. FY121) w/o logistics costs
Management presentation Q4 FY13 (preliminary figures) | November 12, 20135© OSRAM Licht AG 2013. All rights reserved.
2) Including impact of Tangerang (closure of production)Cumulated, as of Q3 FY13 Cumulated, as of Q4 FY13
1) w/o logistics costs
E t ti f FY14Expectations for FY14
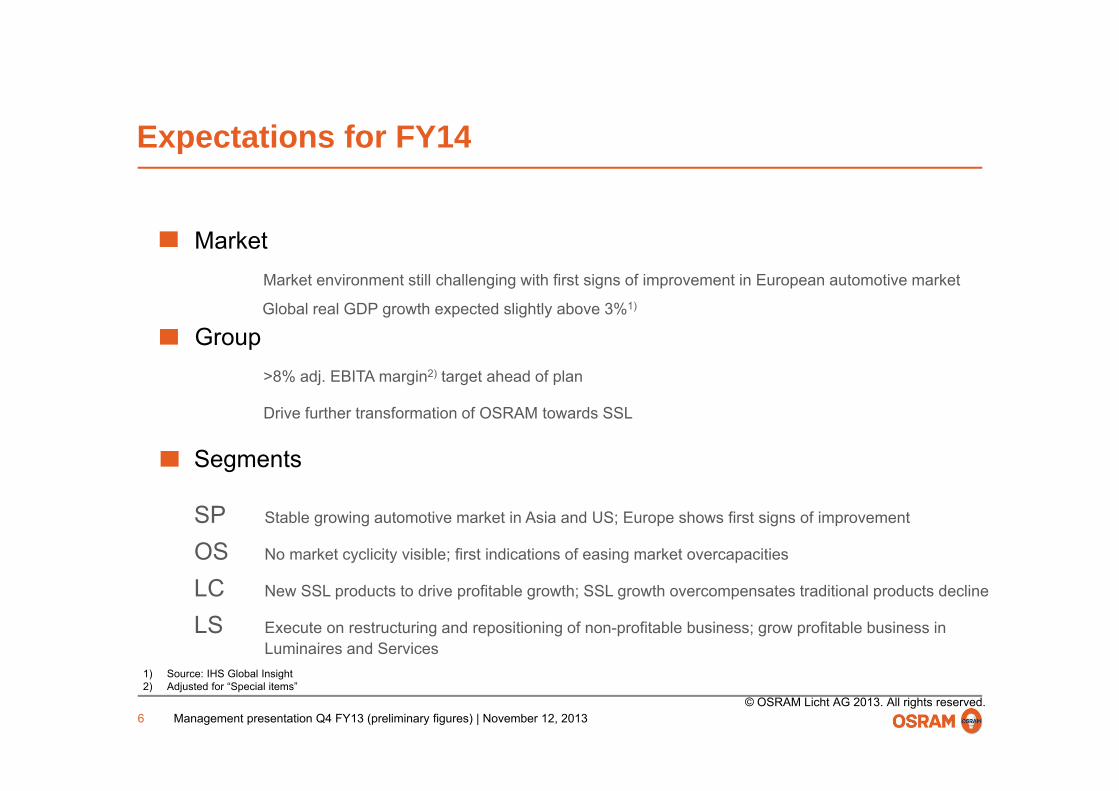
MarketSMarket environment still challenging with first signs of improvement in European automotive market
S Global real GDP gro th e pected slightl abo e 3%1)
GroupS>8% adj. EBITA margin2) target ahead of plan
S Global real GDP growth expected slightly above 3%1)
SDrive further transformation of OSRAM towards SSL
Segments
SP Stable growing automotive market in Asia and US; Europe shows first signs of improvement
OS No market cyclicity visible; first indications of easing market overcapacities
LC New SSL products to drive profitable growth; SSL growth overcompensates traditional products decline
LS Execute on restructuring and repositioning of non-profitable business; grow profitable business in Luminaires and Services
Management presentation Q4 FY13 (preliminary figures) | November 12, 20136© OSRAM Licht AG 2013. All rights reserved.
1) Source: IHS Global Insight2) Adjusted for “Special items”

Broad based growthBroad-based growth
Comments Q4 y-o-yRevenue developmentGroup (€m)
Comments Q4 y-o-yRevenue development
Quarterly revenue Strong year-end finish: Revenue +4% (comp.) backed by all segments and regions
SSL revenue growth +19% (comp.)5,2895,400
Comp. th (%)
Revenue(in €m)
g ( p )
SSL share at 31%, up from 27% y-o-y
EMEA: comp. growth driven especially by OS and SP
APAC comp gro th backed b SP
1,3321,2781,3221,3571,371
( ) 0 2 41 2
growth (%)
Growth (%) (1)3 (3) (2)(3) 7(2)
APAC: comp. growth backed by SP
Americas: comp. growth turned positive including strong OS sales and recovering lamps business
FY13FY12Q4FY13
Q3FY13
Q2FY13
Q1FY13
Q4FY12
(3) (1) 0 1
Revenue by Region1) Q4Revenue by Segment1) Q4
Americas34% EMEA42%nom (3%)
Opto Semiconductors19%
Lamps & Components
nom. 10%comp. 13% 34%
APAC
23%
EMEA42% nom. 2%comp. 4%
nom. (3%)comp. 5%
nom. (10%)5%
Specialty Lighting26%
Luminaires & Solutions11%
Lamps & Components44%nom. (8%)comp. 2%
nom. 2%comp. 8% nom. 1%
comp 4%
Management presentation Q4 FY13 (preliminary figures) | November 12, 20137© OSRAM Licht AG 2013. All rights reserved.
1) Based on sum of Segments´ revenue, w/o considering corp. items & consolidation; nom. (nominal growth) / comp. (comparable growth, adjusted for FX and portfolio effects)
comp. 5%comp. 4%

OSRAM Push translates into bottom line performanceOSRAM Push translates into bottom-line performance
EBITA development Comments Q4 y o y
Group (€m)
EBITA development Comments Q4 y-o-y
7.47.9 8.1
5.8
7.5 7.77.4 Transformation progress impacted reported EBITA
heavily with €133m Special items
Profitability before Special items continued to
EBITAMargin (%) (1 8)
0.90.5 0.1
1.91.71.0
Adj. EBITAMargin1) (%)
y pincrease to 8.1% (+710bps) with OSRAM Push measures materializing
Strong EBITA contributions from SP and OS; improving results of LC and LS before Special items
2012 2013Q4 FY Q1 Q2 Q3 Q4 FY
Margin (%)
Special items2)
(1.8) FY13 Net income at €34m
99100
incl. (133)Special items Q4 FY Q1 Q2 Q3 Q4 FY
EBITA reported 7 51 100 1 222 (24) 99
therein:
OSRAM Push transformation costsincl. personnel restructuring (15) (199) (36) (90) (64) (110) (300)
p
EBITA(€ )
51
22
17
Special items
Spin-off/stand alone-related costs 12 (31) 29) (8) (9) (22) (10)
Substantial legal and regulatory matters (FY12: trademark & license case)
(4) (34) –) –) – – –
Total Special items (7) (264) (7) (98) (72) (133) (310)
(€m)
-24
Q4FY13
Q3FY13
Q2FY13
Q1FY13
Q4FY12
FY13FY12
Management presentation Q4 FY13 (preliminary figures) | November 12, 20138© OSRAM Licht AG 2013. All rights reserved.
Total Special items (7) (264) (7) (98) (72) (133) (310)
1) Adjusted for “Special items” 2) "Special items” in this context include certain items, e.g. (personnel) restructuring costs, that will also occur in future periods
FY13FY13FY13FY13FY12

FY13 and FY12 burdened by Special Items, adjusted EBITA with strong contribution from OSRAM Push
€433m
Margin 7.7%
Margin5.8% Margin
1.9%Margin
0.9%
1) EBITA adjusted for Special Items. The definition of Special Item is company specific and includes also topics which could occur in following periods, especially (personnel) restructuring costs
EBITA FY13 as reported
EBITA FY13 adjusted1)
Cost Reduction Measures
(OSRAM Push)
Volume / Degression / Product
Mix / Others
InflationCustomer Price Change
EBITA FY12 adjusted1)
EBITA FY12 as reported
Management presentation Q4 FY13 (preliminary figures) | November 12, 20139© OSRAM Licht AG 2013. All rights reserved.
especially (personnel) restructuring costs
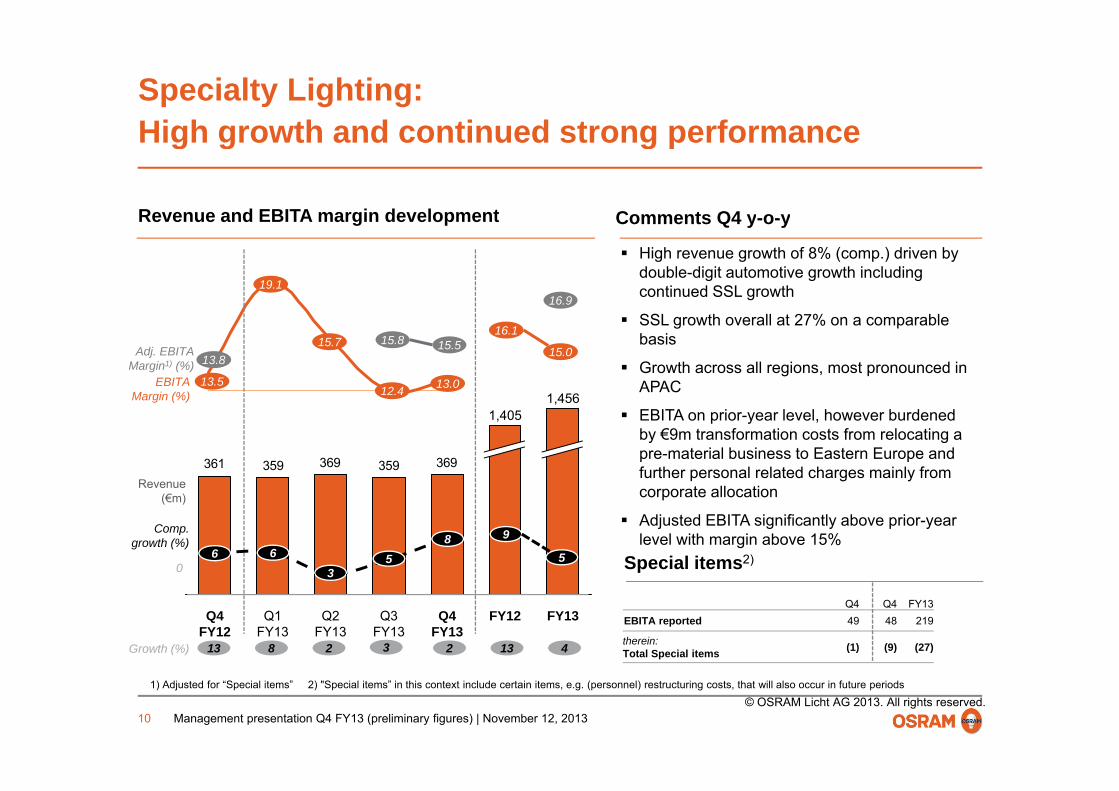
Specialty Lighting: High growth and continued strong performanceHigh growth and continued strong performance
Revenue and EBITA margin development Comments Q4 y o yRevenue and EBITA margin development
High revenue growth of 8% (comp.) driven by double-digit automotive growth including continued SSL growth
Comments Q4 y-o-y
16.919.1
16.1 SSL growth overall at 27% on a comparable
basis
Growth across all regions, most pronounced in APACEBITA
Margin (%)
Adj. EBITAMargin1) (%)
13.512.4
15.013.8
1 456
15.8 15.515.7
13.0
EBITA on prior-year level, however burdened by €9m transformation costs from relocating a pre-material business to Eastern Europe and further personal related charges mainly from
Margin (%)
369359369359361
1,4561,405
Revenue
Special items2)
corporate allocation
Adjusted EBITA significantly above prior-year level with margin above 15%
0
Revenue(€m)
Comp. growth (%)
663
8 9
55
Growth (%) 813 2 42 133
Q4 Q4 FY13EBITA reported 49 48 219
therein:Total Special items (1) (9) (27)
Q1FY13
Q4FY12
FY13FY12Q4FY13
Q3FY13
Q2FY13
3
Management presentation Q4 FY13 (preliminary figures) | November 12, 201310© OSRAM Licht AG 2013. All rights reserved.
1) Adjusted for “Special items” 2) "Special items” in this context include certain items, e.g. (personnel) restructuring costs, that will also occur in future periods

Opto Semiconductors: Double digit top line growth and high profitabilityDouble-digit top-line growth and high profitability
Revenue and EBITA margin development Comments Q4 y-o-y
Revenue growth of 13% (comp.), again double-digit the fourth consecutive quarter
14 6
EBITAMargin (%)
12.2
8.5
Growth across all regions, most pronounced in EMEA and Americas, fueled by infrared business and components for general lighting
Strong EBITA margin benefited from favorable 1,0189.8
14.6
10.2
13.5
8.3Margin (%)product mix as well as OSRAM Push productivity
268279241230244
899
Revenue(€m)
241230244
Comp. growth (%)
0
10714 13
1
1418
Growth (%) 1214 14 1310 517
Q3FY13
Q2FY13
Q1FY13
Q4FY12
FY12Q4FY13
FY13
Management presentation Q4 FY13 (preliminary figures) | November 12, 201311© OSRAM Licht AG 2013. All rights reserved.
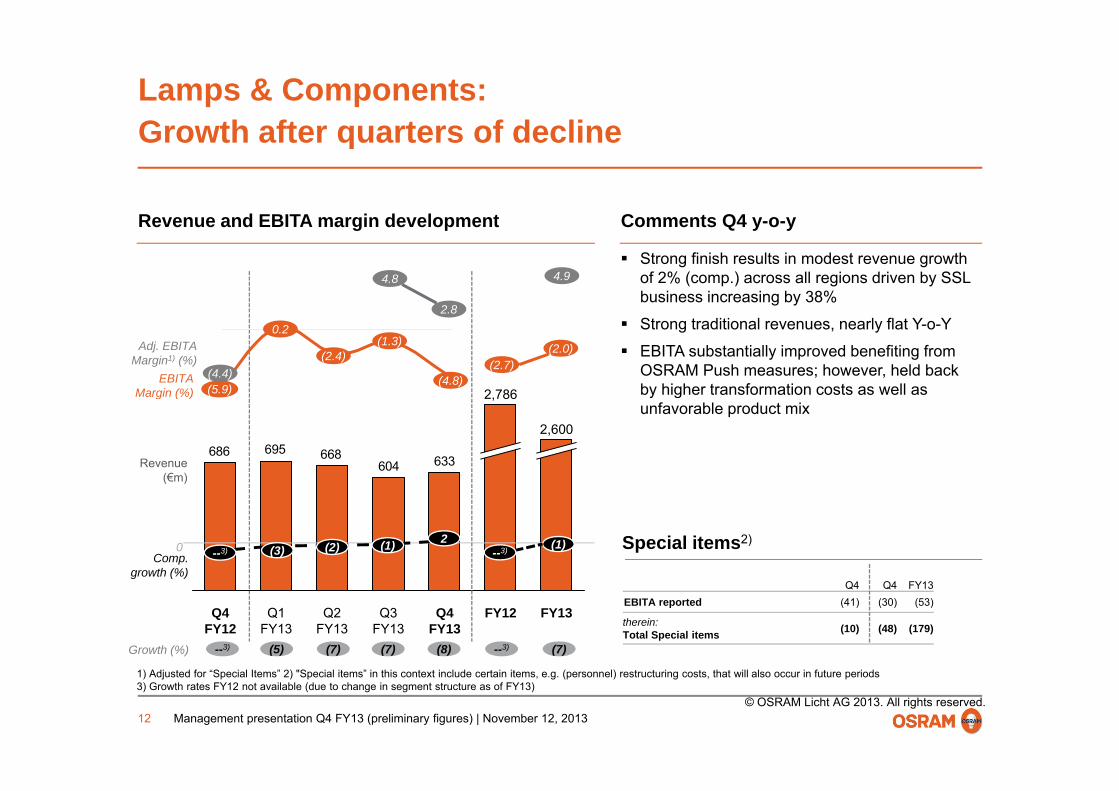
Lamps & Components: Growth after quarters of declineGrowth after quarters of decline
R d EBITA i d l t C t Q4Revenue and EBITA margin development Comments Q4 y-o-y
Strong finish results in modest revenue growth of 2% (comp.) across all regions driven by SSL business increasing by 38%
4.9
2 8
4.8
EBITAMargin (%)
Adj. EBITAMargin1) (%)
Strong traditional revenues, nearly flat Y-o-Y
EBITA substantially improved benefiting from OSRAM Push measures; however, held back by higher transformation costs as well as 2 786
0.2
(4.8)(2.7)
(2.0)(2.4)(1.3)
(5.9)(4.4)
2.8
Margin (%)
Revenue(€m)
y gunfavorable product mix
604668695686
633
2,786
2,600
( )
Special items2)Comp.
growth (%)
02 (1)(2) (1)(3)--3) --3)
Q4 Q4 FY13EBITA reported (41) (30) (53)
therein:Total Special items (10) (48) (179)
Q2FY13
Q1FY13
Q4FY12
Q3FY13
Q4FY13
FY13FY12
growth (%)
Growth (%) (7)(8) --3)(7)(7)(5)--3)
Management presentation Q4 FY13 (preliminary figures) | November 12, 201312© OSRAM Licht AG 2013. All rights reserved.
1) Adjusted for “Special Items” 2) "Special items” in this context include certain items, e.g. (personnel) restructuring costs, that will also occur in future periods3) Growth rates FY12 not available (due to change in segment structure as of FY13)
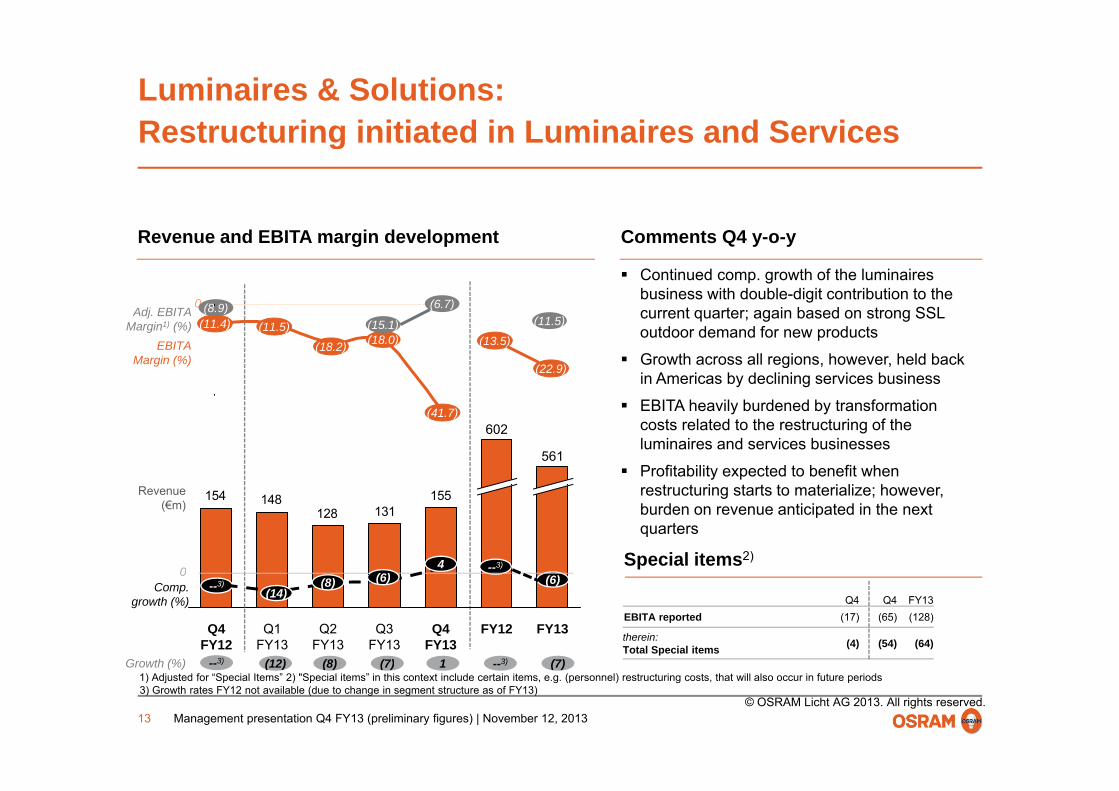
Luminaires & Solutions: Restructuring initiated in Luminaires and ServicesRestructuring initiated in Luminaires and Services
Revenue and EBITA margin development
0
Comments Q4 y-o-y
Continued comp. growth of the luminairesbusiness with double-digit contribution to the
(8 9) (6 7)0
EBITAMargin (%)
(11.4)Adj. EBITA
Margin1) (%)current quarter; again based on strong SSL outdoor demand for new products
Growth across all regions, however, held back in Americas by declining services business
(11.5)(13.5)(18.2)
(22.9)
(11.5)(18.0)
(8.9) (6.7)
(15.1)
EBITA heavily burdened by transformation costs related to the restructuring of the luminaires and services businesses
Profitability expected to benefit when t t i t t t t i li h
602
561
(41.7)
Revenue(€m)
Special items2)
restructuring starts to materialize; however, burden on revenue anticipated in the next quarters
155131128
148154
0 --3)
( )(6)4
Q4 Q4 FY13EBITA reported (17) (65) (128)
therein:Total Special items (4) (54) (64)
FY12 FY13Q4FY13
Q3FY13
Q2FY13
Q1FY13
Q4FY12
Comp.growth (%)
0 (6)
Growth (%) (7)1 --3)(7)(8)(12)--3)
--3)(14)
(8) (6)
Management presentation Q4 FY13 (preliminary figures) | November 12, 201313© OSRAM Licht AG 2013. All rights reserved.
1) Adjusted for “Special Items” 2) "Special items” in this context include certain items, e.g. (personnel) restructuring costs, that will also occur in future periods3) Growth rates FY12 not available (due to change in segment structure as of FY13)
Growth (%) (7)1 -- )(7)(8)(12))
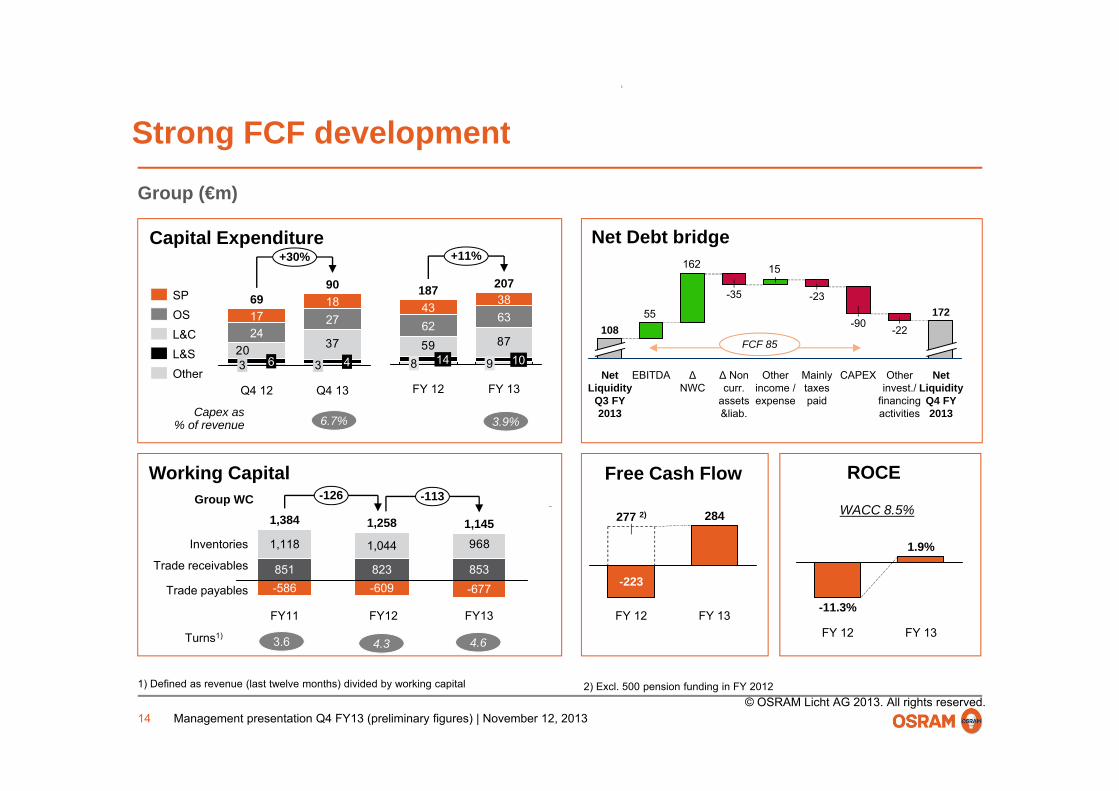
St FCF d l tStrong FCF development
Group (€m)
Net Debt bridgeCapital Expenditure+30%
901869SP 38
18743
+11%
20715162
-23-35
3720
Q4 13
3 4
2718
Q4 12
3 6
2417
L&COS
OtherL&S
59 87
63
FY 12
8 14
6243
FY 13
9 10
55
Δ Non curr.
ΔNWC
EBITDANet Liquidity
108
Other income /
Mainly taxes
-90
CAPEX
-22
Other invest./
172
Net Liquidity
FCF 85
Capex as% of revenue 6.7% 3.9%
Working Capital
assets &liab.
Q3 FY 2013
expense paid financing activities
Q4 FY 2013
Free Cash Flow ROCEGroup WC
284277 2)
968
1,145
-113-126
Trade receivables
Inventories
853
1,258
823
1,044
1,384
851
1,118 1.9%
WACC 8.5%
Turns1)4.3
FY 13FY 12
-223-677Trade payables
FY13FY12
-609
FY11
-586
3.6 4.6FY 13FY 12
-11.3%
Management presentation Q4 FY13 (preliminary figures) | November 12, 201314© OSRAM Licht AG 2013. All rights reserved.
1) Defined as revenue (last twelve months) divided by working capital 2) Excl. 500 pension funding in FY 2012
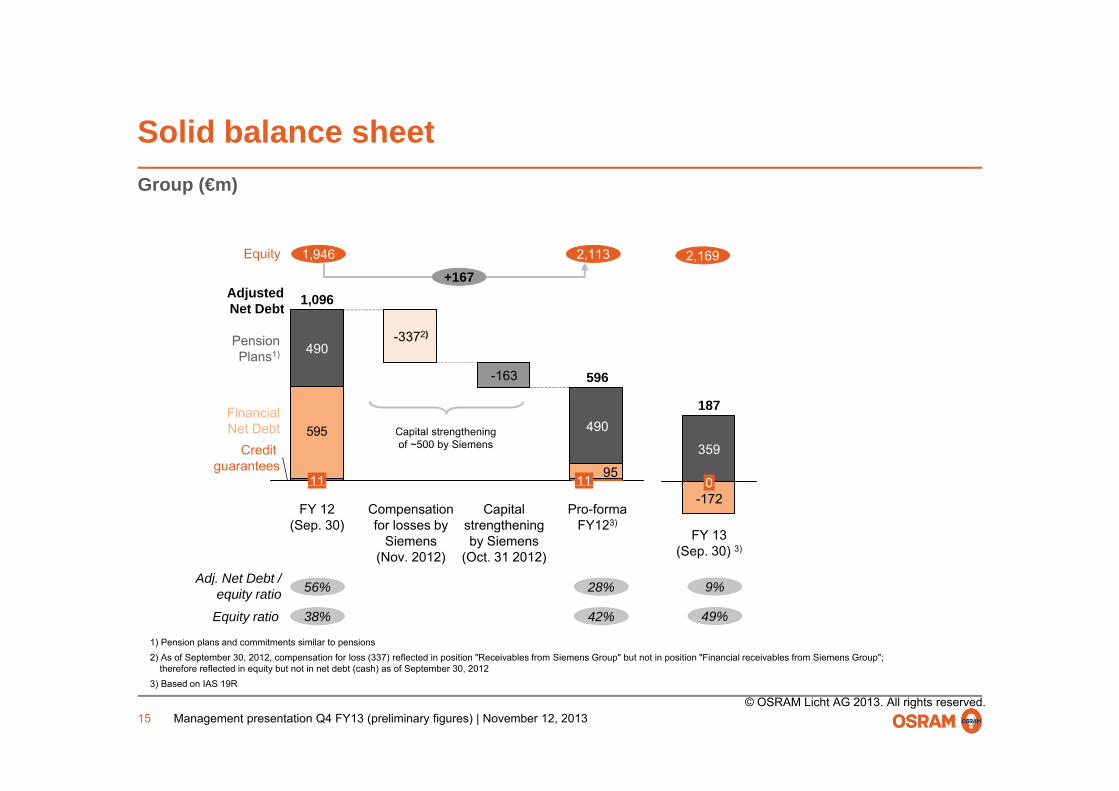
Solid balance sheetSolid balance sheetGroup (€m)
Adjusted N t D bt
Equity 1,946 2,113
+1671,096
2,169
Net Debt
PensionPlans1)
596-163
-3372)
,
490
595Credit
guarantees
FinancialNet Debt
11 95
490
11
187
0
359Capital strengtheningof ~500 by Siemens
Adj N t D bt /
Pro-forma FY123)
Capital strengtheningby Siemens
(Oct. 31 2012)
Compensation for losses by
Siemens(Nov. 2012)
FY 12 (Sep. 30)
FY 13 (Sep. 30) 3)
-1720
Adj. Net Debt / equity ratio 56% 28% 9%
Equity ratio 38% 42% 49%
1) Pension plans and commitments similar to pensions2) As of September 30, 2012, compensation for loss (337) reflected in position "Receivables from Siemens Group" but not in position "Financial receivables from Siemens Group";
f f ( ) f S
Management presentation Q4 FY13 (preliminary figures) | November 12, 201315© OSRAM Licht AG 2013. All rights reserved.
therefore reflected in equity but not in net debt (cash) as of September 30, 20123) Based on IAS 19R
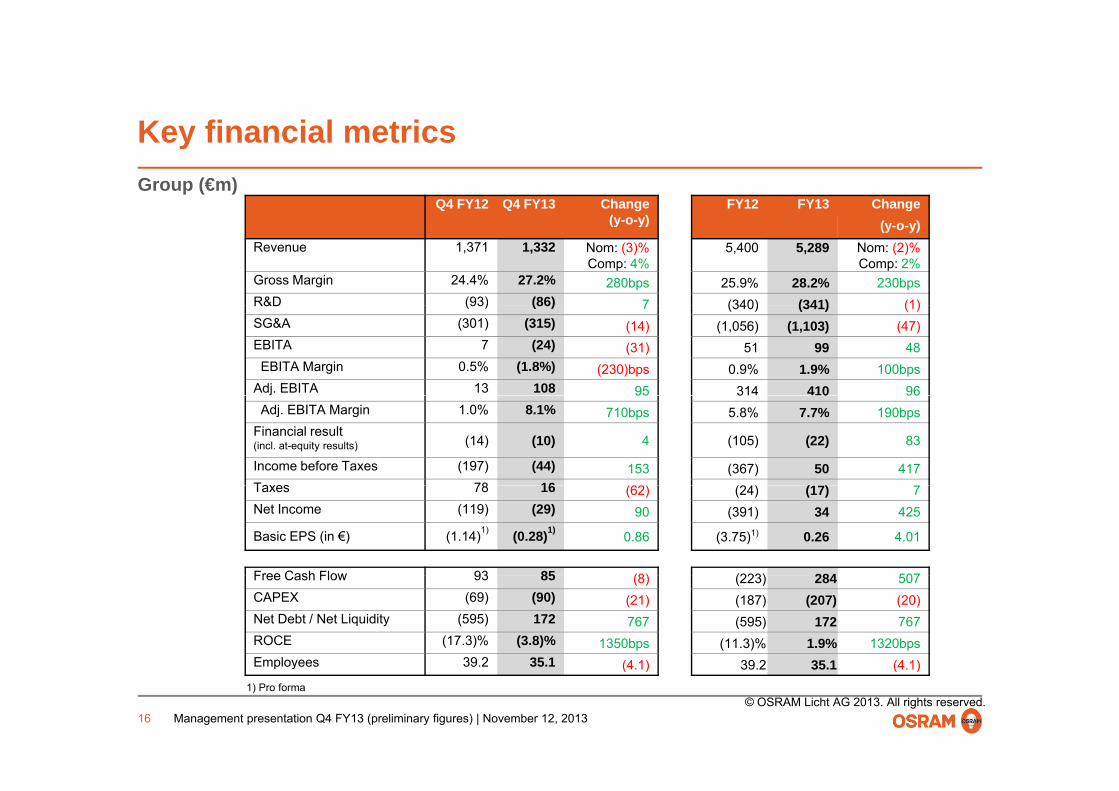
Key financial metricsKey financial metricsGroup (€m)
Q4 FY12 Q4 FY13 Change ( )
FY12 FY13 Change (y-o-y) (y-o-y)
Revenue 1,371 1,332 Nom: (3)%Comp: 4%
5,400 5,289 Nom: (2)%Comp: 2%
Gross Margin 24.4% 27.2% 280bps 25.9% 28.2% 230bpsR&D (93) (86) 7 (340) (341) (1)R&D (93) (86) 7 (340) (341) (1)SG&A (301) (315) (14) (1,056) (1,103) (47)EBITA 7 (24) (31) 51 99 48EBITA Margin 0.5% (1.8%) (230)bps 0.9% 1.9% 100bps
Adj. EBITA 13 108 95 314 410 9695 3 0 96Adj. EBITA Margin 1.0% 8.1% 710bps 5.8% 7.7% 190bps
Financial result(incl. at-equity results) (14) (10) 4 (105) (22) 83
Income before Taxes (197) (44) 153 (367) 50 417Taxes 78 16 (62) (24) (1 )Taxes 78 16 (62) (24) (17) 7Net Income (119) (29) 90 (391) 34 425
Basic EPS (in €) (1.14)1) (0.28)1) 0.86 (3.75)1) 0.26 4.01
Free Cash Flow 93 85 (8) (223) 284 507Free Cash Flow 93 85 (8) (223) 284 507CAPEX (69) (90) (21) (187) (207) (20)Net Debt / Net Liquidity (595) 172 767 (595) 172 767ROCE (17.3)% (3.8)% 1350bps (11.3)% 1.9% 1320bpsEmployees 39 2 35.1 (4 1) 39 2 35 1 (4 1)
Management presentation Q4 FY13 (preliminary figures) | November 12, 201316© OSRAM Licht AG 2013. All rights reserved.
Employees 39.2 35.1 (4.1) 39.2 35.1 (4.1)1) Pro forma
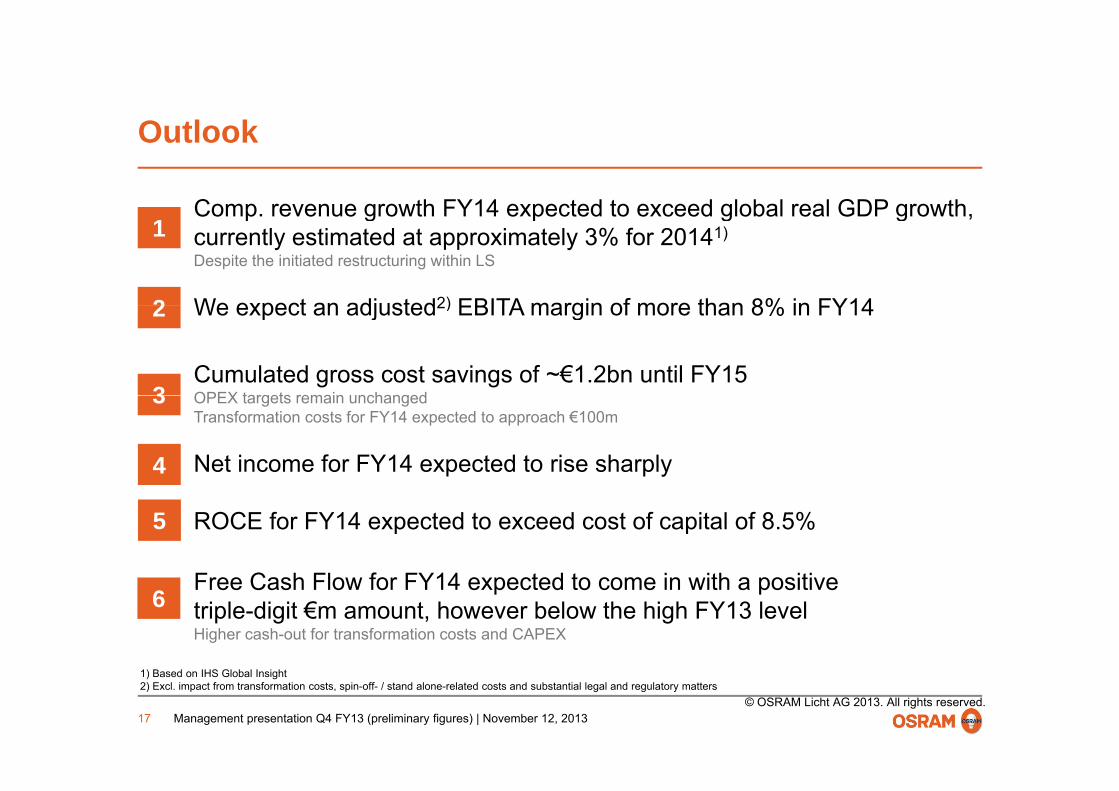
Outlook
Comp. revenue growth FY14 expected to exceed global real GDP growth,
Outlook
Comp. revenue growth FY14 expected to exceed global real GDP growth, currently estimated at approximately 3% for 20141)
Despite the initiated restructuring within LS
We expect an adjusted2) EBITA margin of more than 8% in FY142
1
We expect an adjusted2) EBITA margin of more than 8% in FY14
Cumulated gross cost savings of ~€1.2bn until FY15 OPEX targets remain unchanged3
2
OPEX targets remain unchangedTransformation costs for FY14 expected to approach €100m
Net income for FY14 expected to rise sharply
3
4
ROCE for FY14 expected to exceed cost of capital of 8.5%
F C h Fl f FY14 t d t i ith iti
5
Free Cash Flow for FY14 expected to come in with a positivetriple-digit €m amount, however below the high FY13 levelHigher cash-out for transformation costs and CAPEX
6
Management presentation Q4 FY13 (preliminary figures) | November 12, 201317© OSRAM Licht AG 2013. All rights reserved.
1) Based on IHS Global Insight 2) Excl. impact from transformation costs, spin-off- / stand alone-related costs and substantial legal and regulatory matters
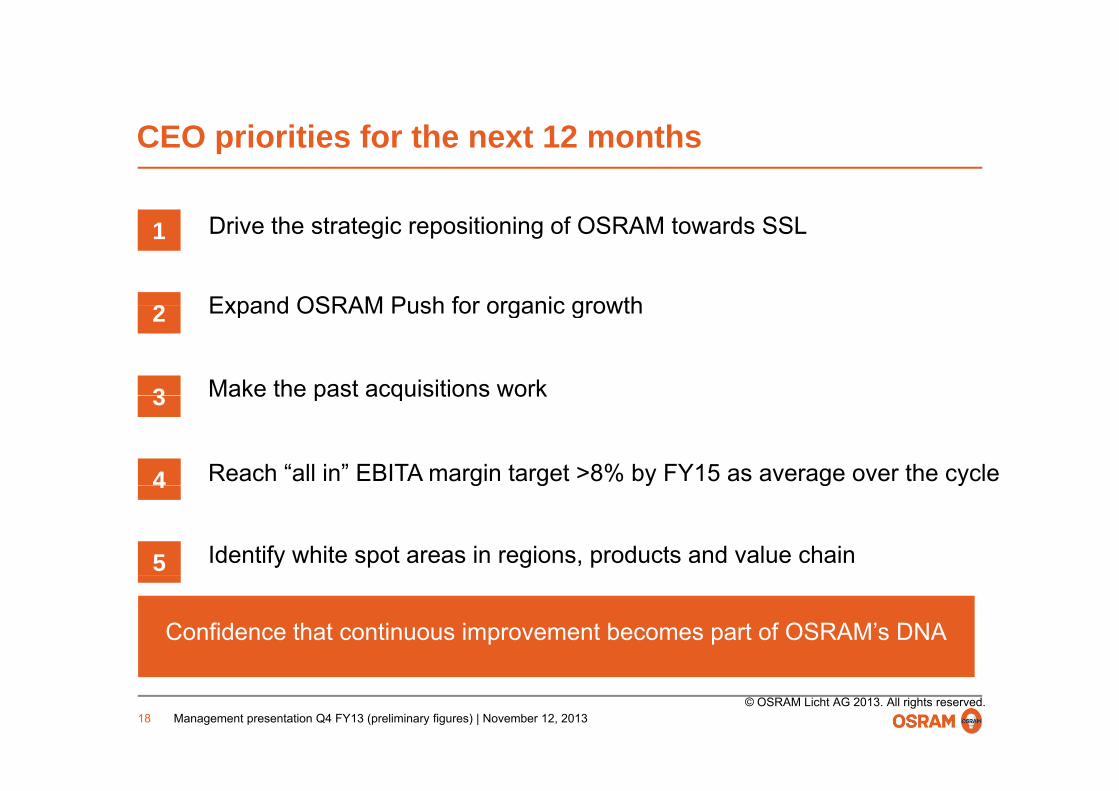
CEO i iti f th t 12 thCEO priorities for the next 12 months
2
1 Drive the strategic repositioning of OSRAM towards SSL
Expand OSRAM Push for organic growth
3
2 Expand OSRAM Push for organic growth
Make the past acquisitions work3
4
Make the past acquisitions work
Reach “all in” EBITA margin target >8% by FY15 as average over the cycle 4 g g y g y
5 Identify white spot areas in regions, products and value chain
Confidence that continuous improvement becomes part of OSRAM’s DNA
Management presentation Q4 FY13 (preliminary figures) | November 12, 201318© OSRAM Licht AG 2013. All rights reserved.
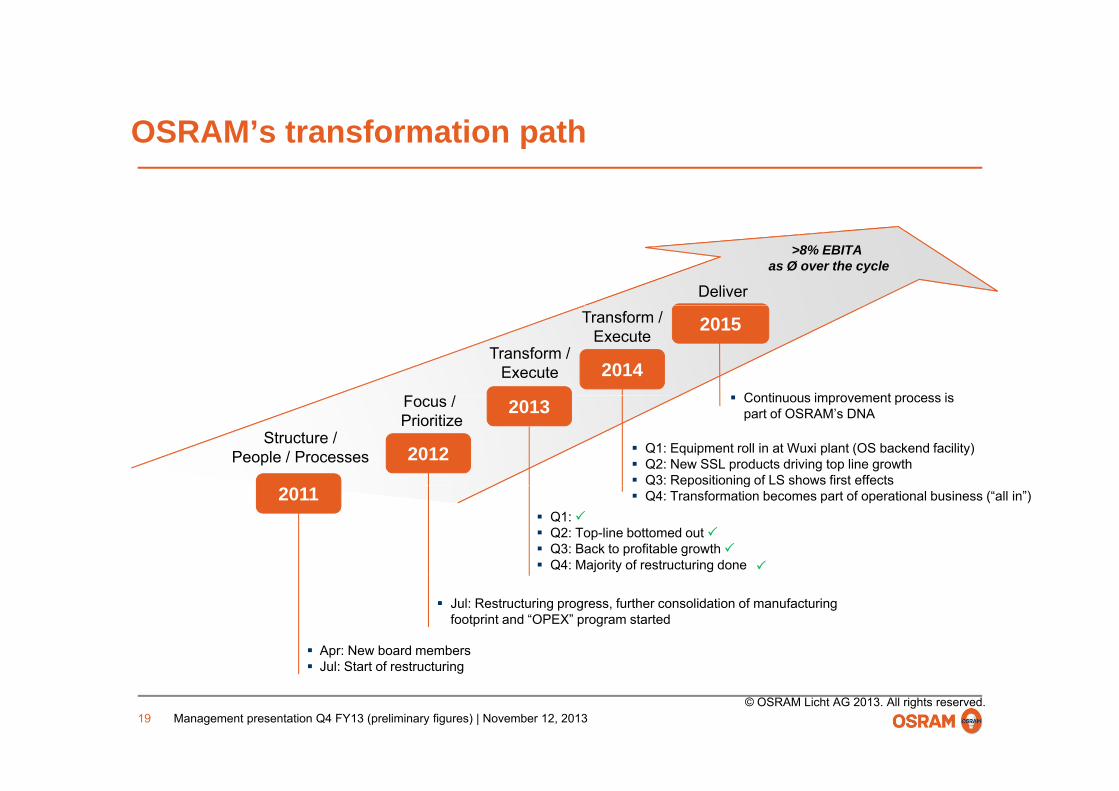
OSRAM’s transformation pathOSRAM’s transformation path
>8% EBITA as Ø over the cycle
Deliver
2014
2015
F /
Transform / Execute
Transform / Execute
Continuous improvement process is
Structure /People / Processes
Focus / Prioritize
2012
2013
Q1: Equipment roll in at Wuxi plant (OS backend facility) Q2: New SSL products driving top line growth Q3: Repositioning of LS shows first effects
Continuous improvement process is part of OSRAM’s DNA
2011 Q1: Q2: Top-line bottomed out Q3: Back to profitable growth Q4: Majority of restructuring done
p g Q4: Transformation becomes part of operational business (“all in”)
Apr: New board members Jul: Start of restructuring
Jul: Restructuring progress, further consolidation of manufacturing footprint and “OPEX” program started
Management presentation Q4 FY13 (preliminary figures) | November 12, 201319© OSRAM Licht AG 2013. All rights reserved.
Jul: Start of restructuring
Financial Calendar and Investor contactsFinancial Calendar and Investor contacts
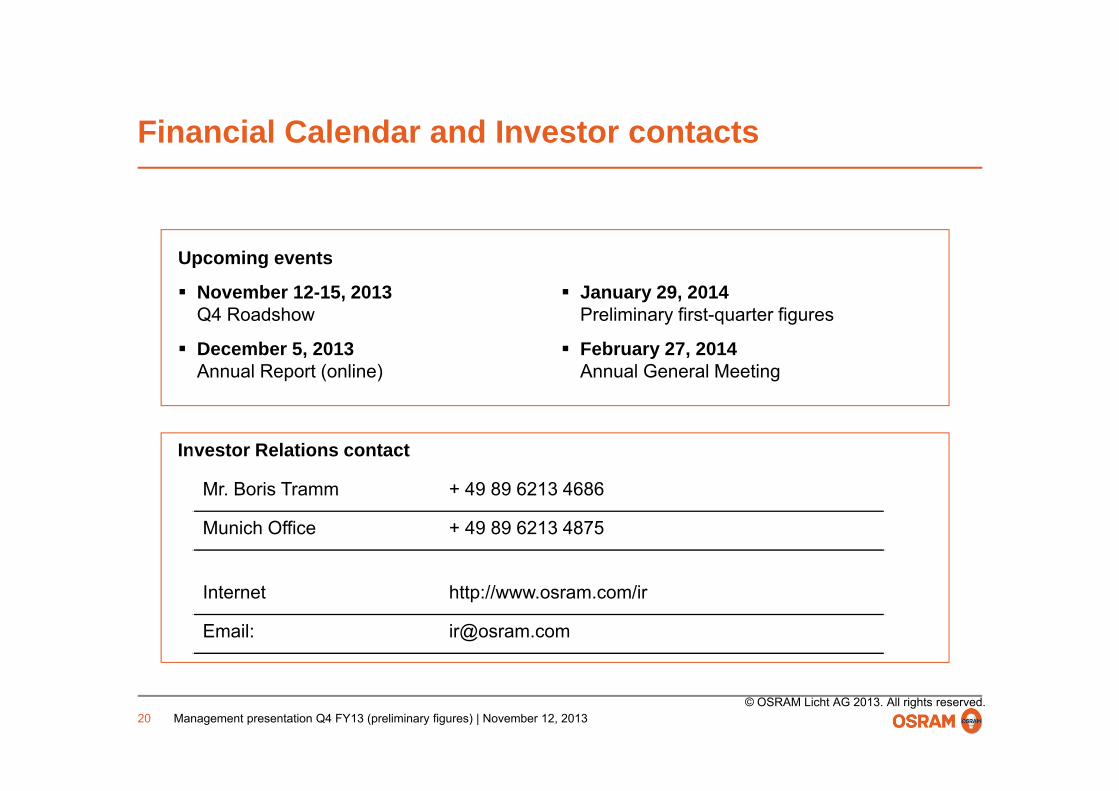
Upcoming events
November 12-15, 2013 January 29, 2014Q4 Roadshow
December 5, 2013Annual Report (online)
Preliminary first-quarter figures
February 27, 2014Annual General Meeting
Investor Relations contact
M B i T + 49 89 6213 4686Mr. Boris Tramm + 49 89 6213 4686
Munich Office + 49 89 6213 4875
Internet http://www.osram.com/ir
Email: [email protected]
Management presentation Q4 FY13 (preliminary figures) | November 12, 201320© OSRAM Licht AG 2013. All rights reserved.
DisclaimerDisclaimer
This presentation contains certain non-IFRS measures. FCF, EBITDA, EBITA, EBIT, EBITA margin, capital expenditures, capitalexpenditures as percentage of revenues and other operating income, net financial debt, net working capital and certain other itemsincluded herein are not recognized measures in accordance with IFRS and should not be considered as an alternative to theapplicable IFRS measures. We have provided these measures and other information in this presentation because we believe they
id i t ith dditi l i f ti t f O f th t FCF EBITDA EBITA EBITprovide investors with additional information to measure our performance. Our use of the terms FCF, EBITDA, EBITA, EBIT,EBITA margin, capital expenditures, capital expenditures as percentage of revenues and other operating income, net financialdebt, net working capital varies from others in our industry and should not be considered as an alternative to net income (loss),cash flows from operating activities, revenues or any other performance measures derived in accordance with IFRS as measuresof operating performance or to cash flows as measures of liquidity. FCF, EBITDA, EBITA, EBIT, EBITA margin, capitalexpenditures capital expenditures as percentage of revenues and other operating income net financial debt and net workingexpenditures, capital expenditures as percentage of revenues and other operating income, net financial debt and net workingcapital have important limitations as analytical tools and should not be considered in isolation or as substitutes for analysis of ourresults as reported under IFRS.
Certain numerical data, financial information and market data (including percentages) in this presentation have been roundedaccording to established commercial standards. As a result, the aggregate amounts (sum totals or interim totals or differences or ifnumbers are put in relation) in this presentation may not correspond in all cases to the amounts contained in the underlying(unrounded) figures appearing in the consolidated financial statements. Furthermore, in tables and charts, these rounded figuresmay not add up exactly to the totals contained in the respective tables and charts.
Management presentation Q4 FY13 (preliminary figures) | November 12, 201321© OSRAM Licht AG 2013. All rights reserved.