Embed Size (px)
Citation preview

Successful Performance MeasuresSuccessful Performance Measures
How Can We Achieve Them?How Can We Achieve Them?


Smith Travel Research
* Hotel Industry Performance Tracking - STAR
- Occupancy- Average Rate- Revenue Per Available Room- Market Share
* Competitive Benchmarking

Smith Travel Research
* Data Collection
- Rooms Available- Rooms Sold - Room Revenue
* Monthly & Daily Reporting

U. S. Monthly Star Sample
Total Census 40K 4.1MM
20K 2.6MM Star Sample
* Over 60% of U.S. Rooms Reported
Hotels Rooms

STR Segmentation
177 U.S. Markets- MSA//County
573 U.S. Tracts- Zip Code/County

Successful Performance MeasuresSuccessful Performance Measures
Rich Carollo,Rich Carollo,Director Research, CCTBDirector Research, CCTB

IACVB Foundation IACVB Foundation Research CommitteeResearch Committee Established in 1999
1999 Information Needs Assessment Survey
1999 Software Survey
1999 Visitor Profile Project
2000 Compensation Survey
2001 CVB Organization and Financial Profile
Convention Income Survey Methodology
2001 Research Activities Survey

Needs Assessment SurveyNeeds Assessment Survey
Visitor Counts
Economic Impact
Conversion Rate
AccountabilitySTANDARDIZATIONSTANDARDIZATION

Standardization ChallengesStandardization Challenges Visitor/Delegate Counts
50, 100 mile or other definition? City, County, DMA or other?
Impact/Expenditures Model type? Avg. Spending Method
Attendance x exp. Peak x avg. stay x exp. Attendance(day and night) x exp. Exhibitors x exp.
Performance Measures (Sales Divisions ROI)

Successful Performance Measures
Kerri KapichVP Marketing
San Diego CVB IACVB Annual Convention
July 17, 2001

San Diego Convention& Visitors Bureau
Founded in 1954 Mission
– To ensure success of San Diego’s convention and visitor industry for the benefit of the greater San Diego community and its visitors
Total operating budget = $16.2 million– 89% funded by Local Government– 11% funded by Members and Other

Tourism Infrastructure
460 Hotel/Motels - 108 convention/conference
Over 6,500 Restaurants San Diego Convention Center Corporation 4 Major Attractions - Sea World, San
Diego Zoo, Wild Animal Park, LEGOLAND 92 Golf courses Rich arts and culture scene - 90
museums/historic sites and monuments, 125 performing arts organizations, over 300 festivals and events

San Diego Tourism
$5.2 billion economic impact 26.5 million visitors annually
– 15.1 million overnight Primarily Leisure Destination
– 85% Leisure– 8% Meetings/Conventions– 5% Commercial/Business
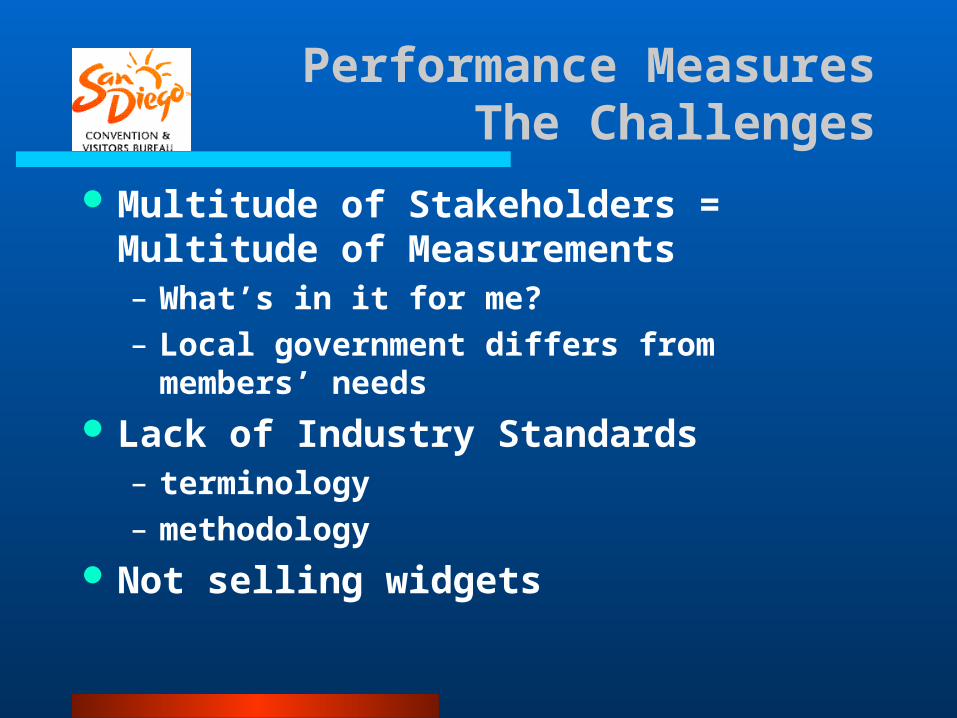
Performance MeasuresThe Challenges
Multitude of Stakeholders = Multitude of Measurements– What’s in it for me?– Local government differs from
members’ needs Lack of Industry Standards
– terminology– methodology
Not selling widgets

Where We Are
Invest in Research– 6% of budget allocated to department
and contracts– foundation for strategic planning– essential to measure success
Audit of all reporting systems Building a better tomorrow

Key Performance Measures
Visitor Industry Statistics– Health of industry
Program Analysis– Measure effectiveness of specific
campaigns– Market Share
Marketing Return on Investment

Industry Performance
Overnight Visitors Visitor Spending Hotel Room Nights Hotel Occupancy Rate Hotel ADR Airport Arrivals Attraction Attendance Convention/Meeting Attendance

Program Effectiveness
Sales Measurements– Leads– Room Nights
Advertising Measurements– Pre- and post-awareness studies– Image perception studies– Conversion studies - inquiries
Market Reports– Market share and competitive set
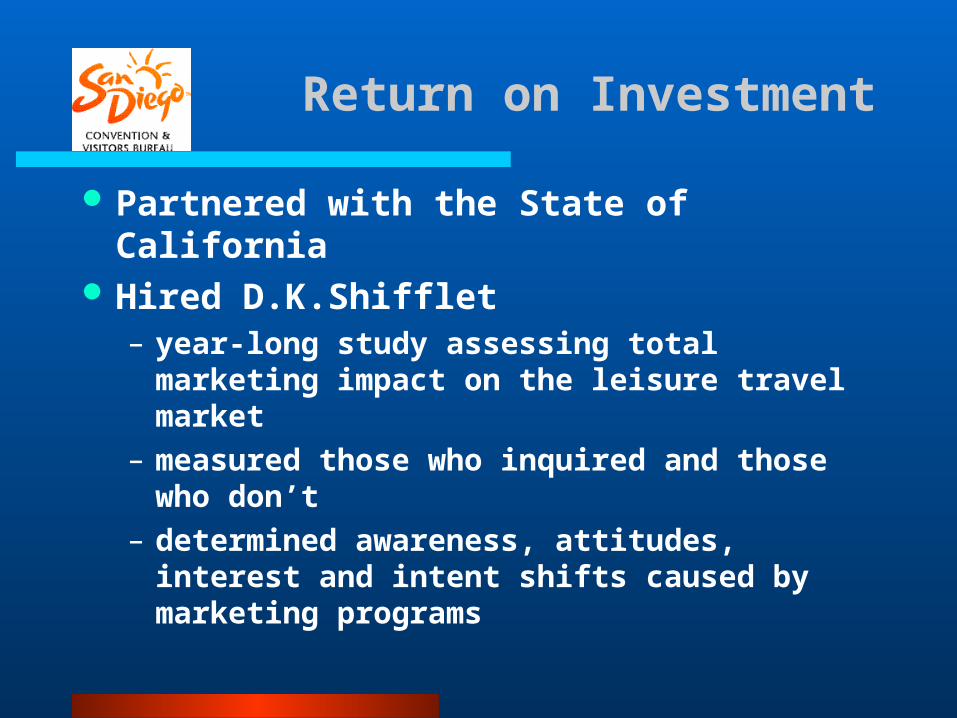
Return on Investment
Partnered with the State of California
Hired D.K.Shifflet– year-long study assessing total
marketing impact on the leisure travel market
– measured those who inquired and those who don’t
– determined awareness, attitudes, interest and intent shifts caused by marketing programs

ROI Study - Key Findings
Budget issues– Low share of voice - messages are
received favorably but difficult to stay top of mind
We move the meter in some markets better than others
Branding is working– Consumer perceptions are changing– Travel experience is delivering on
promise

Key Findings cont.
Better origin market analysis data– Valuation tools beyond volume
• Avg. Los Angeles Trip Expenditure = $309• Avg. Denver Trip Expenditure = $1,471
Insights into consumer motivation and behavior

The Bottom Line
For every $1 we spend on marketing San Diego, we generate $54 in return
In spot markets, we increase our ROI to $77

We’re Not There Yet
There is still a gap– Industry performance and marketing
ROI don’t address other stakeholders’ needs
Reporting audit conclusions– Drowning in data– Fragmented– Requires coordination of financial,
research, IT, marketing, sales, membership

The Future Vision
Centralized database Centralized reporting through
Research Department Customized reports and analysis
for members, local government and employees
Visitor Relationship Management - maximize ROI

From Beans to Bucks to Clout:
Jogging the Winding Path toward Accountability
Ed McWilliams, Ph.D.VP Destinations
D.K. Shifflet & Associates Ltd
“ Setting the Standard”

Beans Versus Budgets
Principle 1:
More Beans = More Budget ?
D.K. Shifflet & Associates Ltd
“Setting the Standard”

Counting the Beans How many sales Leads/calls?
How many convention delegates?
How many delegate room nights?
What are Occupancy Rates?
How many articles written?
How many Column Inches of PR generated?
How many consumer impressions?
How many people converted?
D.K. Shifflet & Associates Ltd“ Setting the Standard”

Counting the Bucks
Visitor Spending
Delegate Spending
Room Night Sales
Economic Impact
D.K. Shifflet & Associates Ltd‘Setting the Standard”

Accountability = Connecting the Dots
Cause versus Effect
Programs versus Impacts
Return versus Investment
D.K. Shifflet & Associates Ltd“Setting the Standard”

Performance Based Budgeting
Goals
Objectives = Budget $ , FTEs
Strategies D.K. Shifflet & Associates Ltd“Setting the Standard”
Linking Activities, Beans and Bucks

Program Measures: A few Definitions
D.K. Shifflet & Associates Ltd“Setting the Standard”
Input ->
->
->
->
Output
Outcome Impact
Efficiency

Program Measures: A few Definitions
Input Measures: Budget and Staff
Output Measures: Program/staff Activity.
For example: # of sales calls, # of consumer impressions generated, # of inquiries fulfilled.
D.K. Shifflet & Associates Ltd“Setting the Standard”

Program Measures: A few Definitions
Outcome Measures: Measures the results from programs.
For example: Room Nights generated by convention delegates, travelers generated in response to advertising, etc.
D.K. Shifflet & Associates Ltd“Setting the Standard”

Program Measures: A few Definitions
Impact Measures: Translation of program results (outcomes) into Bucks, or other tangible measures. e.g.
Total Spending by Visitors Influenced by Advertising, $ value of Convention Room Nights sold, Total Spending of Convention Delegates D.K. Shifflet & Associates Ltd
“Setting the Standard”

Program Measures: A few Definitions
D.K. Shifflet & Associates Ltd“Setting the Standard”
Input $
->
->
BEANS=“Activity Stuff”
Impacts$
BEANS=“Outcome Stuff”

Program Measures: A few Definitions
Efficiency Measures: Estimate cost per unit generated by a program. For Example.
Cost per consumer inquiry,
cost per consumer converted,
cost per convention delegate, D.K. Shifflet & Associates Ltd“Setting the Standard”

Program Measures: A few Definitions
Ultimate Efficiency Measure: Return on Investment
ROI: dollars returned per dollar invested
Ideal to measure each program (allows like comparisons across programs).
D.K. Shifflet & Associates Ltd“Setting the Standard”

Common Accountability Research: Conversion Study
Strengths: Ideal for consumer Marketing budgets under $1 million.
Measure differences across target markets. Aides marketing/media decisions.
Good overall consumer marketing accountability
Limitations: Miss those who saw or heard Ads and traveled,
but never inquired Usually a small percentage of actual visitors Often not measured for specific marketsD.K. Shifflet & Associates Ltd
“Setting the Standard”

Audience Audience PenetrationPenetration
Audience – 100%Aware - 24%Confirmed Aware 13%Traveled – 3%Influenced – 2%Inquired - 1%
D.K. Shifflet & Associates Ltd“Setting the Standard”

TravelerTravelerPenetrationPenetration
Travelers – 100%Aware – 62%Confirmed Aware 50%Influenced – 34%Inquired – 11%
D.K. Shifflet & Associates Ltd“Setting the Standard”
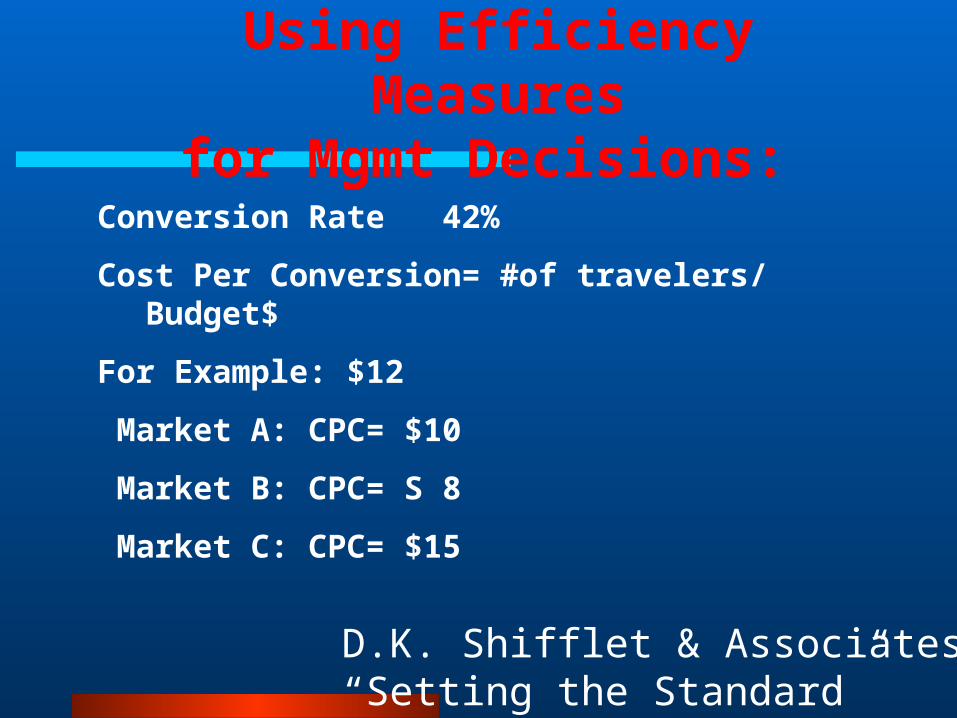
Using Efficiency Measuresfor Mgmt Decisions:
Conversion Rate 42%
Cost Per Conversion= #of travelers/ Budget$
For Example: $12
Market A: CPC= $10
Market B: CPC= S 8
Market C: CPC= $15
D.K. Shifflet & Associates Ltd“Setting the Standard”

Using Efficiency Measuresfor Mgmt Decisions:
Advertising Example 1:
Market A: CPC= $10 ROI = $ 25
Market B: CPC= $ 8 ROI = $ 10.
Market C: CPC= $15 ROI = $ 35.
D.K. Shifflet & Associates Ltd“Setting the Standard”

Using Efficiency Measuresfor Mgmt Decisions:
Program Output Outcome Impacts ROI
Budget Convention Sales
Sales Leads
# Room Nights
$ Value of Delegates
Impact/Budget
D.K. Shifflet & Associates Ltd“Setting the Standard”

Cost per Visitor by Market
3.44
1.79
3.433.12
A B C D
D.K. Shifflet & Associates Ltd“Setting the Standard”

$184.00
$241.00
$171.00$189.00 $177.00
Mkt A Mkt B Mkt C Mkt D Mkt E
Marketing Return on Investment by Market
D.K. Shifflet & Associates Ltd“Setting the Standard”

DKS&A “Advertising Impact Monitor”Answers Your Fundamental Advertising Questions
1. How is consumer awareness, interest, intent, and travel behavior changing in response to advertising?
2. What is the ROI of TV advertising in spot markets?
3. Is television worth the premium over print?
4. How much does it cost to draw a customer from Market A versus Market B?
5. What is the Return on Investment for Market A versus Market B?D.K. Shifflet & Associates Ltd
“Setting the Standard”
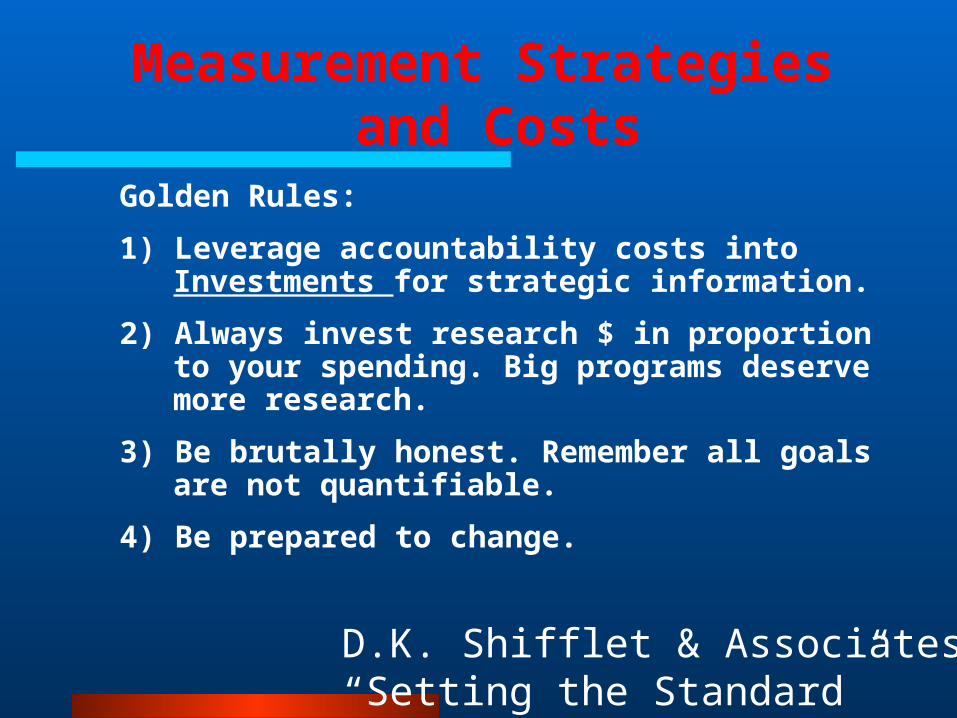
Measurement Strategies and Costs
Golden Rules:
1) Leverage accountability costs into Investments for strategic information.
2) Always invest research $ in proportion to your spending. Big programs deserve more research.
3) Be brutally honest. Remember all goals are not quantifiable.
4) Be prepared to change.
D.K. Shifflet & Associates Ltd“Setting the Standard”

Measurement Strategies
Next Steps:
1) IACVB – Set agenda to Establish Industry Definitions
2) IACVB – Develop standard accountability prinicpals
3) IACVB: Publish, promote, educate & advocate for use of standards.
D.K. Shifflet & Associates Ltd“Setting the Standard”

From Beans to Bucks to Clout:
Jogging the Winding Path toward Accountability
D.K. Shifflet & Associates Ltd“Setting the Standard”

Successful Performance MeasuresSuccessful Performance Measures
How Can We Achieve Them?How Can We Achieve Them?