Embed Size (px)
Citation preview

Department of Equine and Small Animal Medicine Faculty of Veterinary Medicine
University of Helsinki Finland
Sucrose permeability as a marker of gastric mucosal integrity in the horse
Feasibility, assay development and field validation of a blood test for diagnosis of gastric ulcers in horses
Michael Hewetson
ACADEMIC DISSERTATION
To be presented, with the permission of the Faculty of Veterinary Medicine of the University of Helsinki, for public examination in Auditorium XII, University Main
Building, Fanianinkatu 33, on 7th December 2018, at 12:00 noon.
Helsinki 2018

Directed by Professor Thomas Spillmann, Dipl.med.vet., Dr. med. vet., Dipl. ECVIM-CA Department of Equine and Small Animal Medicine Faculty of Veterinary Medicine University of Helsinki, Finland Supervised by:
Professor Riitta-Mari Tulamo DVM, PhD, Dipl. ECVS Department of Equine and Small Animal Medicine Faculty of Veterinary Medicine University of Helsinki, Finland Professor Sandy Love BVMS PhD FRCVS School of Veterinary Medicine University of Glasgow, United Kingdom Reviewed by: Associate Professor Barbora Bezdekova Jabloňany 77 Skalice nad Svitavou Česká republika Professor Frank M. Andrews Department of Large Animal Clinical Sciences College of Veterinary Medicine The University of Tennessee, Knoxville, Tennessee Opponent: Dr. Cornelie Westermann PhD Dipl. ECEIM Department of equine Sciences Faculty of Veterinary Medicine Utrecht University, The Netherlands
© Michael Hewetson ISBN 978-951-51-4720-2 (paperback) ISBN 978-951-51-4721-9 (PDF) http://ethesis.helsinki.fi Unigrafia OY Helsinki 2018

Table of Contents
Table of Contents 3
Abstract 5
Acknowledgements 7
List of original publications 8
Abbreviations 9
1 Introduction 10
2 Review of the literature 13
2.1 The intestinal barrier 13
2.1.1 Historical perspective 14
2.1.2 Intestinal permeability 16
2.1.3 Mechanisms of altered intestinal permeability in disease 19
2.2 Gastric permeability 21
2.2.1 Factors that influence gastric permeability 22
2.2.2 Methods of measuring gastric permeability 27
2.3 Equine gastric ulcer syndrome (EGUS) 32
2.3.1 Terminology 32
2.3.2 Pathogenesis 32
2.3.3 Prevalence 33
2.3.4 Clinical signs 34
2.3.5 Diagnosis 35
3 Aims of the study 40
4 Materials and methods 41
4.1 Feasibility 41
4.1.1 Determination of the feasibility of the sucrose blood test for assessment of gastric permeability in horses with gastric ulceration (I) 41

4.2 Assay development and standardization 43
4.2.1 Development and analytical validation of a GC-FID method for measurement of sucrose (II) 43
4.3 Determination of the performance characteristics of the test 49
4.3.1 Diagnostic accuracy of blood sucrose as a screening test for equine gastric ulcer syndrome in adult horses and weanling foals (III, IV) 49
5 Results 56
5.1 Feasibility 56
5.1.1 Determination of the feasibility of the sucrose blood test for assessment of gastric permeability in horses with gastric ulceration (I) 56
5.2 Assay development and standardization 59
5.2.1 Development and analytical validation of a GC-FID method for measurement of sucrose (II) 59
5.3 Determination of the performance characteristics of the test 62
5.3.1 Diagnostic accuracy of blood sucrose as a screening test for equine gastric ulcer syndrome in adult horses and weanling foals (III, IV) 62
6 Discussion 81
6.1 Feasibility 81
6.2 Assay development and standardization 85
6.3 Determining the performance characteristics of the test 88
6.3.1 Adult horses 88
6.3.2 Weanling Foals 93
6.3.3 Bayesian latent class analysis 96
7 Conclusions 97
References 99
Original publications (I-IV) 119
5
Abstract
Sucrose permeability as a marker of gastric mucosal integrity in the horse - feasibility, assay development and field validation of a blood test for diagnosis of gastric ulcers in horses Department of Equine and Small Animal Medicine, Faculty of Veterinary Medicine, University of Helsinki, Finland
Gastric ulcers can develop in foals and horses of all breeds and uses, and the term equine gastric ulcer syndrome (EGUS) has been coined to describe this disease because of its multifactorial and complicated nature. Currently, detection of EGUS by gastroscopy is the only reliable ante mortem method for definitive diagnosis in horses, and is considered the gold standard against which all other diagnostic tests are compared. Disadvantages of gastroscopy are that it requires the horse to be sedated, it is not readily available to most veterinarians, it is an inefficient expenditure of time, and requires a minimum level of expertise to perform and interpret. A urine sucrose test has been reported to be a reliable method of detecting gastric ulcers in horses; however, technical difficulties associated with urine collection have limited the practical value of the test. It was hypothesized that blood sucrose concentration following nasogastric administration of sucrose can be used as a simple, economical alternative to reliably and practically detect gastric ulcers in horses; and a series of studies were subsequently conducted to develop and validate the test, including determination of the feasibility of the method; sucrose assay development and standardization; and field validation through determination of the performance characteristics of the test in selected populations of horses.
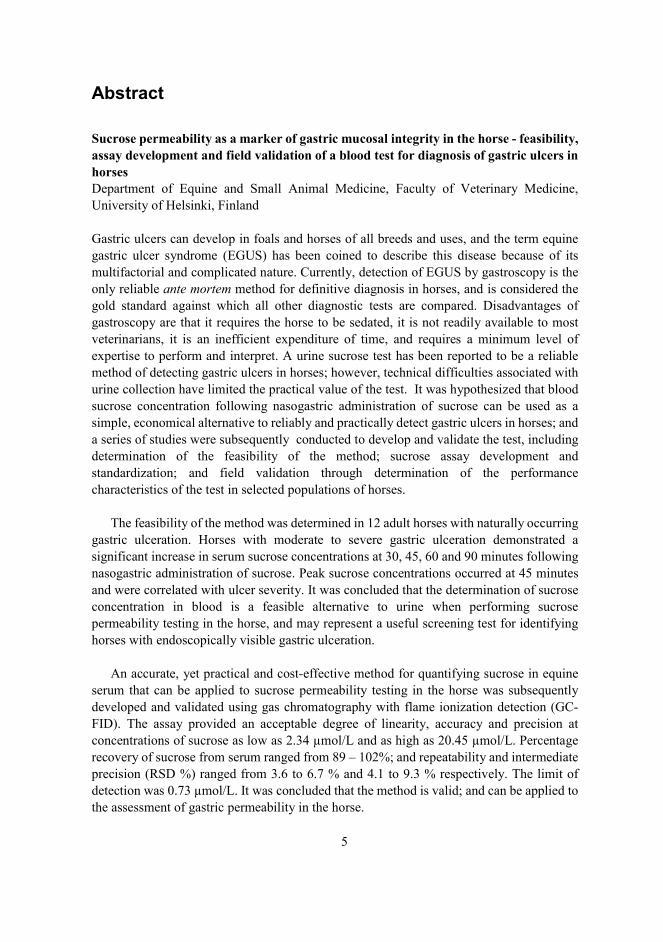
The feasibility of the method was determined in 12 adult horses with naturally occurring
gastric ulceration. Horses with moderate to severe gastric ulceration demonstrated a significant increase in serum sucrose concentrations at 30, 45, 60 and 90 minutes following nasogastric administration of sucrose. Peak sucrose concentrations occurred at 45 minutes and were correlated with ulcer severity. It was concluded that the determination of sucrose concentration in blood is a feasible alternative to urine when performing sucrose permeability testing in the horse, and may represent a useful screening test for identifying horses with endoscopically visible gastric ulceration.
An accurate, yet practical and cost-effective method for quantifying sucrose in equine
serum that can be applied to sucrose permeability testing in the horse was subsequently developed and validated using gas chromatography with flame ionization detection (GC-FID). The assay provided an acceptable degree of linearity, accuracy and precision at concentrations of sucrose as low as 2.34 μmol/L and as high as 20.45 μmol/L. Percentage recovery of sucrose from serum ranged from 89 – 102%; and repeatability and intermediate precision (RSD %) ranged from 3.6 to 6.7 % and 4.1 to 9.3 % respectively. The limit of detection was 0.73 μmol/L. It was concluded that the method is valid; and can be applied to the assessment of gastric permeability in the horse.
6
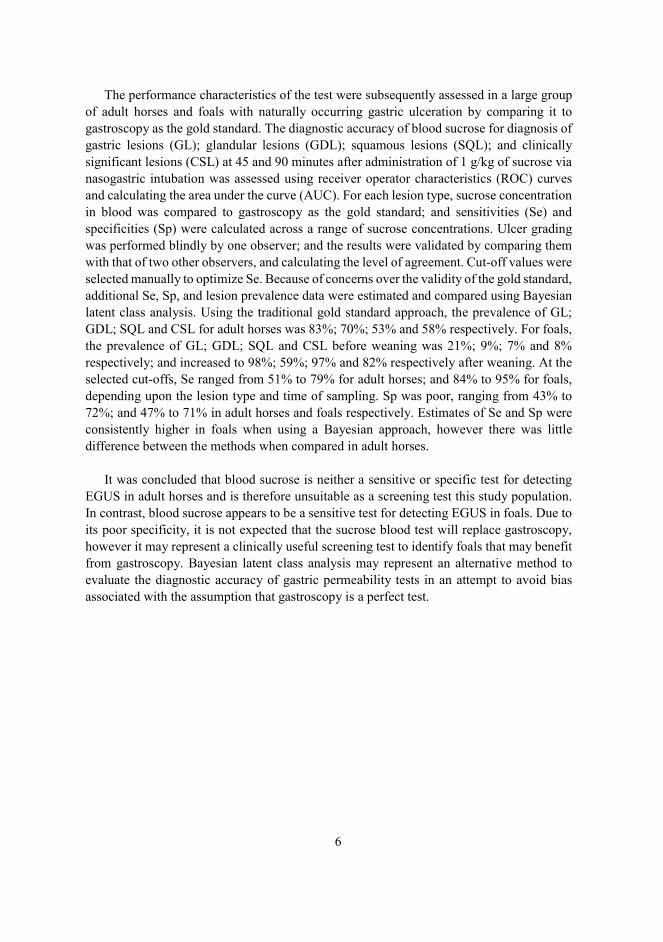
The performance characteristics of the test were subsequently assessed in a large group of adult horses and foals with naturally occurring gastric ulceration by comparing it to gastroscopy as the gold standard. The diagnostic accuracy of blood sucrose for diagnosis of gastric lesions (GL); glandular lesions (GDL); squamous lesions (SQL); and clinically significant lesions (CSL) at 45 and 90 minutes after administration of 1 g/kg of sucrose via nasogastric intubation was assessed using receiver operator characteristics (ROC) curves and calculating the area under the curve (AUC). For each lesion type, sucrose concentration in blood was compared to gastroscopy as the gold standard; and sensitivities (Se) and specificities (Sp) were calculated across a range of sucrose concentrations. Ulcer grading was performed blindly by one observer; and the results were validated by comparing them with that of two other observers, and calculating the level of agreement. Cut-off values were selected manually to optimize Se. Because of concerns over the validity of the gold standard, additional Se, Sp, and lesion prevalence data were estimated and compared using Bayesian latent class analysis. Using the traditional gold standard approach, the prevalence of GL; GDL; SQL and CSL for adult horses was 83%; 70%; 53% and 58% respectively. For foals, the prevalence of GL; GDL; SQL and CSL before weaning was 21%; 9%; 7% and 8% respectively; and increased to 98%; 59%; 97% and 82% respectively after weaning. At the selected cut-offs, Se ranged from 51% to 79% for adult horses; and 84% to 95% for foals, depending upon the lesion type and time of sampling. Sp was poor, ranging from 43% to 72%; and 47% to 71% in adult horses and foals respectively. Estimates of Se and Sp were consistently higher in foals when using a Bayesian approach, however there was little difference between the methods when compared in adult horses.
It was concluded that blood sucrose is neither a sensitive or specific test for detecting
EGUS in adult horses and is therefore unsuitable as a screening test this study population. In contrast, blood sucrose appears to be a sensitive test for detecting EGUS in foals. Due to its poor specificity, it is not expected that the sucrose blood test will replace gastroscopy, however it may represent a clinically useful screening test to identify foals that may benefit from gastroscopy. Bayesian latent class analysis may represent an alternative method to evaluate the diagnostic accuracy of gastric permeability tests in an attempt to avoid bias associated with the assumption that gastroscopy is a perfect test.

7
Acknowledgements
The author would like to thank Sandy Love, Allen Roussel, Noah Cohen, Satu Sankari, Thomas Spillmann, Ritta-Mari Tulamo, Randy Buddington, William Holmes, Ben Sykes, Gayle Hallowell, Monica Venner, Ingrid Vervuert and Anna-Maija Virtala for their support, guidance and vision; Sam Wigington, Marco Duz, Catherine Ruoff, Kaisa Aaltonen, Marc Laemmer, Judith Winter, Jan Volquardsen, Yukiko Sasada and Anne Sjöhölm for their technical assistance; and Jouni Junnila and Geoffory Fossgate for their assistance with the statistical analysis.
The author is also grateful to all of the veterinarians, owners and trainers who
contributed horses to this study. Generous financial support was received from the Link Equine Research Endowment
and the Robertson Trust, the University of Glasgow, Texas A&M and the University of Helsinki.

8
List of original publications
This thesis is based on the following publications which are referred to in the text by their Roman numerals (I-IV)
I Hewetson M, Cohen ND, Love S, Buddington RK, Holmes W, Innocent GT, Roussel AJ (2006). Sucrose concentration in blood: a new method for assessment of gastric permeability in horses with gastric ulceration. J Vet Intern Med 20:388-394.
II Hewetson M, Aaltonen K, Tulamo RM, Sankari S (2014). Development and
validation of a gas chromatography-flame ionization detection method for quantifying sucrose in equine serum. J Vet Diagn Invest 26:232-239.
III Hewetson M, Sykes BW, Hallowell GD, Tulamo RM (2017). Diagnostic
accuracy of blood sucrose as a screening test for equine gastric ulcer syndrome (EGUS) in adult horses. Acta Vet Scand 59(1):15.
IV Hewetson M, Venner M, Volquardsen J, Sykes BW, Hallowell GD, Vervuert
I, Fosgate GT, Tulamo, RM (2018). Diagnostic accuracy of blood sucrose as a screening test for equine gastric ulcer syndrome (EGUS) in weanling foals. Acta Vet Scand Acta Vet Scand 60:24.
The author has had a primary role in all aspects of the research reported in these papers.
The original publications have been reprinted with the permission of the copyright holders.
9
Abbreviations
AJC Apical Junctional Complex AUC Area Under the Curve BW Body Weight Bayesian LC Bayesian Latent Class CSL Clinically Significant Lesion EGUS Equine Gastric Ulcer Syndrome EGGD Equine Gastric Glandular disease EGSD Equine Gastric Squamous disease FID Flame Ionization Detector GC Gas Chromatography GC-FID Gas Chromatography with Flame Ionization Detection GDL Glandular Lesion GL Gastric Lesion ICH International Conference on Harmonisation LC/MS Liquid chromatography-mass spectrometry MPRT Margo Plicatus Right Side MPGC Margo Plicatus Greater Curvature MPLC Margo Plicatus Lesser Curvature NPV Negative Predictive Value NSAIDs Non-Steroidal Anti-Inflammatory Drugs PPV Positive Predictive Value PDA Photodiode Array PI Probability Interval PUD Peptic Ulcer Disease ROC Receiver Operator Characteristic RSD% Relative Standard Deviation SD Standard Deviation Se Sensitivity Sp Specificity SQL Squamous Lesion TJ Tight Junction TMS Trimethylsilyl TMSI Trimethylsilylimidazole UV Ultraviolet VRS Verbal Rating Scale 95% CI 95% Confidence Intervals

10
1 Introduction
A gastric ulcer is defined as acid injury to the gastric mucosa that destroys cellular elements, resulting in a defect that could extend to the level of the submucosa (Lanas and Chan 2017). Equine Gastric Ulcer Syndrome (EGUS) is a term used to describe erosive and ulcerative diseases of the equine stomach and is comparable to the term peptic ulcer disease (PUD) in man (Malfertheiner et al. 2009). EGUS can be further classified into Equine Squamous Gastric Disease (ESGD) and Equine Glandular Gastric Disease (EGGD) based on the anatomical region affected (Sykes et al. 2015).
Equine gastric ulcer syndrome is common in adult horses, and although the clinical ramifications of this disease have as yet, not been completely elucidated, it remains an important disease in the equine industry. Performance horses are particularly susceptible, with 47-100% of Thoroughbred racehorses (Murray et al. 1996, Vatistas et al. 1999, Begg and O'Sullivan 2003, Sykes et al. 2015); 44-87% of Standardbred racehorses (Rabuffo et al. 2002, Dionne et al. 2003, Jonsson and Egenvall 2006); 33-93% of endurance horses (Nieto et al. 2004, Tamzali et al. 2011) and 58-64% of show and sport horses (McClure et al. 1999, Hartmann and Frankeny 2003) found to have gastric lesions on gastroscopy. Non-performance horses are also susceptible to EGUS, with ulcers found in the gastric mucosa of 11-67% of sedentary horses and horses that partake in less strenuous activities (Chameroy et al. 2006, le Jeune et al. 2009, Luthersson et al. 2009). Equine gastric ulcer syndrome is also an important cause of morbidity in foals, with a reported prevalence ranging from 22-57% (Murray et al. 1990, Elfenbein and Sanchez 2012). Although it is most commonly recognized in older weanling foals, gastric ulceration has also been reported in neonatal foals as young as 24 hours (Nappert et al. 1989, Lewis 2003, Elfenbein and Sanchez 2012).
Currently, detection of EGUS by gastroscopy is the only reliable ante mortem method
for definitive diagnosis in horses (Andrews et al. 1999), and is considered the gold standard against which all other diagnostic tests are compared (Sykes et al. 2015). Disadvantages of gastroscopy are that it requires the horse to be sedated; it is not readily available to most veterinarians, it is an inefficient expenditure of time, and it requires a minimum level of expertise to perform and interpret. Furthermore, horses are usually selected for gastroscopy on the basis of characteristic clinical signs; including inappetance, intermittent colic, weight loss, bruxism, lethargy and suboptimal athletic performance (Andrews and Nadeau 1999, Sykes et al. 2015). However, many horses and foals affected by gastric ulceration do not demonstrate clinical signs and therefore, are not subjected to gastroscopy. These animals are considered to have 'silent' or non-clinical gastric ulceration (Murray et al. 1989, Murray et al. 1990, Andrews and Nadeau 1999, Bell et al. 2007, Luthersson et al. 2009), and may perform sub optimally, or in the case of foals, develop debilitating pyloric/duodenal outflow obstruction or in some cases, fatal perforating ulcers (Zedler et al. 2009). In addition to the obvious welfare concerns; these horses represent a potentially major cause of lost income to the racing, sport horse and stud industries, and given the current economic climate and the rising costs of veterinary medicines, it is easy then to imagine that owners and veterinarians would be interested in a simple, convenient and cost-effective screening test

11
that could be used to identify horses that require gastroscopy and also have the potential to be used to monitor the efficacy of treatment. Such a screening test should ideally have a high sensitivity, as it will correctly identify most horses with gastric ulcers, remembering that many horses with EGUS will not demonstrate obvious clinical signs.
Despite interspecies variation in the permeability characteristics of the gastrointestinal
tract (Jezyk et al. 1992); permeation of sucrose across the gastric mucosa has been demonstrated to be a reliable marker for gastric permeability and a useful tool to diagnose the presence and severity of gastric ulceration in a variety of species, including rats, rabbits, dogs, and people (Meddings et al. 1993, Sutherland et al. 1994, Meddings et al. 1995a, Meddings et al. 1995b). Because of its large molecular size (molecular mass 342 Da), sucrose is not able to permeate across healthy gastric mucosa, but it has been reported to cross the mucosa in the presence of gastric disease, presumably due to changes in intestinal tight junction permeability or directly through gaps in the epithelium caused by erosion or ulceration alterations in epithelial restitution (Lindemann and Solomon 1962, Gryboski et al. 1963, Pantzar et al. 1993, Gitter et al. 2001, Mankertz and Schulzke 2007, Iizuka and Konno 2011). The efficiency of the mucosal disaccharidases and the monosaccharide transport systems in the equine small intestine have been established by a series of oral disaccharide and monosaccharide tolerance tests, and it has been demonstrated that horses are fully capable of rapidly hydrolyzing sucrose (Roberts 1975a, Roberts 1975b). Furthermore, sucrase has the highest activity in the duodenum of the horse, with concentrations similar to those reported in the intestine of other non-ruminant species (Dyer et al. 2002). If present in blood, sucrose is cleared via the urine; it is not metabolized and the body does not produce it (Keith and Power 1937, Peterson et al. 1959, Vettorazzi and MacDonald 1988, Bauer et al. 1990). Therefore, increased amounts of sucrose in blood after an oral dose is site specific for increased gastric permeability, and can be used to predict the presence of gastric ulceration (Meddings et al. 1993, Sutherland et al. 1994, Meddings et al. 1995, Rabassa et al. 1996, Goodgame et al. 1997, Meddings 1997, Borch et al. 1998, Erlacher et al. 1998, Kawabata et al. 1998).
Based on the premise that sucrose permeability can be used to detect the presence and
severity of gastric ulcers in other species, quantitation of sucrose in urine has been reported to be a reliable screening method for detecting gastric ulcers in horses (O'Conner et al. 2004); however the technical difficulties associated with collection of urine from the horse has limited the practicality of this test. For testing, a horse’s bladder must be evacuated by catheterization prior to administration of sucrose and again 2 hours later; thus, the method is therefore technically intensive and involves a 2-hour lag from administration to specimen collection. To circumvent these difficulties and make the test more practical, quantitation of sucrose in blood using a similar approach has been suggested (O'Conner et al. 2004, Shishido et al. 2005).

12
The purpose of this research project was therefore to develop and validate a simple, accurate blood test for diagnosis of gastric ulcers in horses, including feasibility testing, sucrose assay development and standardization; field validation of the test; and determination of its performance characteristics in selected populations of horses. It was hypothesized that blood sucrose concentration following nasogastric administration of sucrose would be a practical and reliable indicator of the presence and severity of gastric ulcers in adult horses and foals; and that the test would be practical i.e. sampling would be completed within one hour after administration of sucrose by nasogastric intubation, and would only require a single venipuncture for blood collection. Furthermore, it was expected that a cut-off point for the presence of EGUS, EGGD and ESGD would be identified; and possibly for ulcer severity. Using these cut-off points, the sensitivity and specificity of the test was expected to be comparable to those reported for urine-based testing (O'Conner et al. 2004). Such a test would (1) improve the welfare of the individual horse; (2) provide veterinarians with a simple, non-invasive tool for detecting and monitoring response to treatment and preventive strategies of gastric ulceration; and (3) provide a diagnostic method for future intervention studies which ultimately will improve the health and welfare of horses.
.
13
2 Review of the literature
This review comprises three parts. The first part reviews the nature of the intestinal barrier, our current understanding of the putative pathways of permeation and the mechanisms by which permeability can be altered in disease. The second part reviews gastric permeability in more detail, including the factors that influence gastric permeability and the methods that are available for measuring gastric permeability in vivo. The third part reviews the clinical circumstances in which gastric permeability can be altered, with specific emphasis on gastric ulceration in the horse. The vast majority of work in the field of gastrointestinal permeability has been done in human medicine, and therefore a large proportion of this review will be based on the human literature. Where relevant however, an attempt will be made to compare and contrast specific aspects of gastric permeability in man with that of the horse.
2.1 The intestinal barrier
The intestinal mucosa consists of an epithelium, lamina propria and muscularis mucosae. The epithelium is a single cell layer, and consists of five types of cells: enterocytes, enteroendocrine, goblet, Paneth and microfold (M) cells. The distribution of these cells throughout the intestinal epithelial monolayer varies according to the function of that region (Lodish et al. 2000). Cell polarity and cohesion between intestinal epithelial cells is maintained by the apical junctional complex (AJC) (Farquhar and Palade 1963), which join the cells together to form a contiguous monolayer. The enterocytes are the most common cell type in the intestinal epithelium; and are classified as simple columnar epithelial cells. Their primary role is to (1) selectively absorb nutrients, electrolytes and water; and (2), to act as a barrier against harmful substances in the gut lumen. This barrier separates intestinal luminal contents from the interstitium, and plays an important role in protecting the body from luminal antigens, microorganisms and toxins through selective restriction of micromolecular permeation and [almost] complete restriction of macromolecular permeation (Sun et al. 1998). This barrier function is primarily determined by the integrity of the epithelial cell membranes and the AJC that seals the paracellular space; with additional interactions from other components of the intestinal barrier, including the unstirred water layer, mucosal surface hydrophobicity, surface mucous coat, and endothelial factors.
Intestinal barrier function is affected by a variety of factors including disease (Pearson et al. 1982, Peeters et al. 1994, Pascual et al. 2003), diet (Bosi et al. 2006), stress (Santos et al. 2001, Vanuytsel et al. 2014), exercise (Pals et al. 1997), inflammatory cytokines (Wild et al. 2003, Hu et al. 2013), osmotic stress (Wheeler et al. 1978), drugs (Farhadi et al. 2010), hormones (Hu et al. 2013) and the environment itself (Snipe et al. 2018). Disturbances in this barrier function can occur through structural alterations of the epithelium (e.g. erosions/ulcers) or changes in the integrity of tight junctions; and results in permeation of a

14
myriad of potentially threatening luminal compounds. The consequences of this impaired barrier function; and the potential of using site-specific permeability probes for non-invasive assessment of disease and therapeutic interventions are reasons for the ongoing interest in intestinal permeability research.
2.1.1 Historical perspective
The first documented experiments using markers to follow the passage of substances through the intestinal wall were performed as far back as the 17th centuary. These pioneers infused milk mixed with indigo (molecular mass 262 Da) into the small intestine of living dogs to demonstrate that dyes pass from the intestinal lumen into the lacteals (Lister 1673, Musgrave 1701). In 1924 the rates of absorption of dilute solutions of glucose, fructose and galactose were compared in loops of rabbit and cat intestine and it was found that glucose was absorbed at a faster rate than fructose or galactose. When the intestinal mucosa was inactivated by hot water or sodium choride however, all three sugars were absorped at equal rates, suggesting that glucose was actively (and selectively) absorbed (Hewett 1924). The comparative rates of absorption of other monosaccharide sugars (rhamnose, xylose and arabinose) was subsequently studied in man by McCance and Madders (1930) and it was established that similar differences in the rates of absorbtion of sugars exists in human intestine. In 1937, the absorption rate of a variety of organic solutes were studied using rats. Using this model, researchers identified that the rate of absorption is dependent upon molecular size as well as lipid solubility (Hober and Hober 1937). More importantly, it was noted that absorption was restricted above a certain size (molecular mass 180 Da), later identified as corresponding to a molecular radius of about 0.4 nm (Schultz and Soloman 1961). This generated interest in the fate of larger molecules within the intestinal lumen, and the term ‘permeability’ was adopted to describe that property of the intestinal epithelium which refers to “the facility with which it allows molecules to pass through by non-mediated diffusion” (Menzies 1984).
Following this ground-breaking work, the focus shifted to human intestinal
permeability, and was first investigated in detail by Fordtran et al. (1965). Lipid-insoluble molecules of differing molecular size were infused as a hyperosmotic solution into the small intestine and the osmotic water flux was assessed by measuring the dilution of polyethylene glycol (PEG)-4000; a non-absorbable reference marker. Their findings suggested that intestinal epithelial cell membranes contained water-filled pores in their apical cell membrane which enabled permeation of small non-lipid polar molecules across their luminal surface. Furthermore, the degree of permeability was determined by the molecular size of the given substance in relation to the size of the water-filled pores in the membrane. Following on from this work, physiologists and electron microscopists began to define the properties of epithelial barriers (Farquhar and Palade 1963, Ussing and Windhager 1964, Fromter and Diamond 1972). Farquhar and Palade (1963) described tight junctions, Ussing and Windhager (1964) recognized the importance of the paracellular pathway between epithelial cells as a route of passive transepithelial ion transfer and Fromter and Diamond

15
(1972) established the terms ‘tight’ and ‘leaky’ for epithelia demonstrating different permeabilities.
The concept of non-invasive tests that could be used for clinical assessment of intestinal
permeability was first described in 1963 following observation that patients with celiac disease have disacchariduria, suggesting that they may have increased intestinal permeability (Gryboski et al. 1963, Weser and Sleisenger 1965). Using an iso-osmolar solution of lactulose (molecular mass 342 Da), Menzies (1972) went on to demonstrate that the urinary excretion of lactulose was increased in celiac patients when compared with controls, and this work represents one of the earliest reports of using a non-invasive permeability test in clinical practice. A combination of lactulose, raffinose, stachyose (molecular mass 342, 504 and 666 Da respectively) and a fluoresceinlabelled dextran was subsequently used for non-invasive assessment of intestinal permeability in celiac patients. The results confirmed an increase in permeability in patients with celiac disease, but also identified that permeability to these markers was dependent on molecular size; suggesting the presence of more than one population of pores (Wheeler et al. 1978). Additional permeability tests using monosaccharide/disaccharide combinations such as cellobiose/mannitol (Cobden et al. 1978) and lactulose/L-rhamnose (Menzies et al. 1979) were introduced during the late 1970s. Low molecular mass PEGs (Chadwick et al. 1977a, Chadwick et al. 1977b) and 51Cr-EDTA (Bjarnason et al. 1983) were introduced in the late 1970s and early 1980s. Because both these probes were resistant to bacterial degradation, they were considered to be ideal for use in those parts of the intestine that support an active bacterial flora where mono- and disaccharide probes would be rapidly metabolized (Travis and Menzies 1992).
As interest in intestinal permeability for non-invasive assessment of disease grew, a
myriad of other diseases that were also characterized by abnormal intestinal permeability were identified; and many clinical conditions that are associated with abnormal measurements of intestinal permeability were defined. Specific fields of research have developed. Some relate to whether increased permeability is an etiological factor (Fasano 2012) or simply a consequence of intestinal disease (Peeters et al. 1994); while other have focused on the diagnostic value of permeability tests for assessing patients with suspected intestinal disease (Juby et al. 1989, Juby et al. 1989). More recently, molecular biologists have begun to characterize the structural correlate of epithelial barrier dysfunction (Madara and Marcial 1984), and the mechanisms by which epithelial tight junction permeability may become altered (Zeissig et al. 2007, Groschwitz and Hogan 2009, Fasano 2011). Interest in intestinal permeability in veterinary medicine science has been slower to develop, and it is only over the last two decades that significant progress has been made in the development and validation of non-invasive permeability tests for the assessment of intestinal function in animals (Suchodolski and Steiner 2003).

16
2.1.2 Intestinal permeability
Permeability is that property of the intestinal epithelium that ebables molecules to pass through by non-mediated diffusion, whereas permeation describes the act of non-mediated diffusion itself (Travis and Menzies 1992). Non-mediated diffusion is defined as the passage of molecules down a concentration or pressure gradient without the benefit of a passive or active biochemical carrier system (Travis and Menzies 1992). The degree of permeability is determined by the molecular size of the given substance in relation to the size of the water-filled pores in the intestinal barrier (Lifschitz and Shulman 1990, Pantzar et al. 1993). In a clinical context, intestinal permeability involves the permeation of molecules with a molecular mass >180 Da, rather than ions such as sodium or chloride, to which the term membrane permeability is usually applied (Travis and Menzies 1992). Intestinal transport is a term used to describe the rate of permeation, and is defined as the number of molecules crossing the intestinal epithelium in a given time (Menard et al. 2010).
2.1.2.1 Permeation pathways
Molecules are able to permeate across a healthy intestinal epithelium in two ways: (1) through the cell wall with specific pumps and channels (transcellular uptake) or (2) between cells through tight junctions (paracellular uptake). The intestinal epithelium consists of a heteroporous barrier penetrated by a large population of small electroneutral pores (0.4 – 0.7 nm radius) located in the apical membrane (transcellular); and by a small population of large electroneutral pores (6.5 nm radius) and small cation-selective pores (0.7 nm) located between cells (paracellular) (Pappenheimer et al. 1951, Lindemann and Solomon 1962, Menzies 1984). Large molecules will therefore be restricted to large pores; whereas small molecules are able to pass through both large and small pores (Pantzar et al. 1993). Changes in permeation of smaller molecules are therefore affected by changes in the intestinal absorptive surface area, whereas changes in the permeation of larger molecules reflect changes in ‘mucosal leakiness’ (Cooper 1984). In context of in vivo measurement of intestinal permeability using permeability probes, routes for permeation of the low molecular weight monosaccharides (e.g. rhamose, mannitol etc.) are therefore likely to be transcellular, whereas routes for permeation of disaccharides, EDTA and other larger molecules are likely to be paracellular.
2.1.2.1.1 Paracellular pathway
At the junction between intestinal epithelial cells, solute movement may occur via a paracellular pathway without regulation by the enterocyte brush border transporters or channels. It is believed that molecules larger than monosaccharides (i.e. molecular mass > 180 Da < 600 Da) permeate through this paracellular route exclusively (Menard et al. 2010). There are several possible explanations for this: (1) these molecules remain in the extracellular compartment after intravenous injection and it is therefore assumed that they

17
are unable to pass through cell membranes (Travis and Menzies 1992); (2) AJCs represent a natural break in membrane continuity and therefore represent a potential pathway for these molecules (Travis and Menzies 1992); (3) AJCs constitute only a small proportion (< 5%) of the total surface area of the intestinal epithelium (Marcial et al. 1984), which is consistent with the location of a small population of large pores.
The paracellular pathway is sealed by the AJC, which consists of the tight junction (TJ)
and the subadjacent adherens junction (Farquhar and Palade 1963). The adherens junction (together with desmosomes and gap junctions) provides the adhesive bond which maintains cellular proximity; and is essential for assembly of the TJ, which is ultimately responsible for sealing the paracellular space. While not part of the paracellular pathway per se, permeation of molecules through gaps in the epithelium caused by exfoliation of dead cells (extrusion zones) or erosions/ulceration is also considered part of the paracellular pathway (Madara 1990).
Tight junctions - The TJs are the most apical structures of the AJC, and as such, they are responsible for regulating solute movement through the paracellular pathway and maintaining compositionally distinct fluid compartments in the body (Menard et al. 2010). Because the paracellular pathway is considered to be more permeable than the transcellular pathway, it is widely accepted that the TJ is the rate limiting step in transepithelial transport and therefore the primary determinant of intestinal permeability (Groschwitz and Hogan 2009, Turner 2009). The TJ encircles epithelial cells at the apical pole, and forms a narrow belt that both connects adjacent cells and maintains cell polarity (Cereijido et al. 1998). Tight junctions are multi-protein complexes consisting of transmembrane proteins, peripheral membrane proteins and regulatory molecules that are connected with the cytoskeleton. The most important transmembrane proteins are the claudins which (together with another transmembrane protein, occludin) are considered to be the major sealing proteins (Baumgart and Dignass 2002). Zonula occludens are the most important peripheral membrane proteins, and are responsible for TJ assembly and maintenance. Intestinal TJs are highly dynamic areas and their permeability can change in response to both external and intracellular stimuli, including bacterial toxins, cytokines, hormones, osmolality and drugs. Tight junction permeability also differs depending upon the type of cell (i.e. goblet vs. villus columnar cells), and cell location (junctions between cells in the crypts are more permeable than those in the villi) (Madara and Trier 1982).
Intercellular space - While the TJ is primarily responsible for regulating solute movement through the paracellular pathway, the narrow tortuous nature of the intercellular space may in itself restrict movement of larger molecules, however the size of the space is not constant and depends in part on the rate of fluid transport (Travis and Menzies 1992).
Extrusion zones - Large molecules may also permeate between cells through gaps left by the extrusion of dead cells or through larger gaps caused by mucosal erosions and ulcers (Clarkson 1967). Increased permeability of large molecules through gaps caused by extrusion of dead cells seems less likely as it has been demonstrated that this occurs through

18
a process of villus contraction from base to apex as the cell is extruded (zipper effect), and is therefore unlikely to disrupt the intestinal barrier (Moore et al. 1989, Madara 1990). The effect of mucosal erosions and ulcerations on intestinal barrier permeability is less well established, but it is logical to think that such lesions would increase permeability to larger molecules, and it has been demonstrated that erosion/ulcer-type intestinal lesions in the human colon contribute up to 65% to the overall epithelial conductivity in moderate-to-severe inflammation (Gitter et al. 2001).
2.1.2.1.2 Transcellular pathway
The transcellular pathway is considered to be less permeable than the paracellular pathway and is typically limited to low molecular weight solutes (e.g. monosaccharides) that are able to diffuse directly though the apical membrane (Menzies 1984). The unstirred fluid layer adjoining the apical membrane and the surface mucous coat are also likely contribute to this part of the intestinal barrier. Cell membranes - The plasma cell membrane of the intestinal epithelium cell plays a critical role in mucosal barrier function. It is interspersed with two types of pores: (1) small (0.4 nm radius) electroneutral pores in the apical membrane and (2) larger (6.5 nm radius) pores in the basolateral membrane (Naftalin and Tripathi 1985). While it is accepted that the membrane is impermeable to most hydrophilic solutes in the absence of specific transporters (Turner 2009), molecules of a low molecular weight are able to permeate through these pores, although the exact mechanism has not yet been determined. In addition to membrane pores, molecules with some degree of lipid solubility are also able to diffuse directly across the membrane. In some cases transcellular transport of larger molecules via endocytosis into vesicles and subsequent exocytosis may also occur (Schaerer et al. 1991). Both of these latter mechanisms are unlikely to have a significant impact on membrane permeability.
Unstirred layer and the surface mucus coat - The unstirred layer consists of a relatively stationary 40 μm thick fluid layer that overlies the surface of the intestinal epithelial cells (Thomson and Dietschy 1984, Strocchi and Levitt 1991). Maintenance of the unstirred later at a thickness of only 40 μm is postulated to be due to efficient stirring by contraction of villi and microvilli (Strocchi and Levitt 1991); and is considered essential for absorption of nutrients, as an unstirred layer that was any thicker would represent a major barrier to diffusion even in the presence of an active transport system. This means that both epithelial function and the efficiency of luminal stirring has the ability to influence absorption of molecules, and implies that the unstirred layer still constitutes a considerable barrier to molecules that permeate by non-mediated diffusion. Intestinal mucous glycoproteins (mucins) may also contribute to the intestinal permeability barrier by influencing the viscosity of the aqueous layer (Walker and Owen 1990), and may be altered by diseases such as ulcerative colitis (Rhodes 1989).
19
2.1.2.1.3 Common pathways
Although unlikely to cause any significant barrier to diffusion of molecules smaller than the size of a protein, this discussion would be incomplete without mentioning movement of molecules through the basement membrane, the extracellular matrix and across the lymphatic or capillary endothelium that is common to both transcellular and the paracellular pathways. Increases in interstitial volume secondary to edema may increase the distance that molecules have to diffuse before moving into the circulation, but this is only relevant for larger molecules, as small molecules are able to rapidly equilibrate in the interstitial space (Granger et al. 1980). Poor splanchnic blood flow may also alter measured permeation through variability in removal of water soluble molecules by the intestinal microcirculation as is the case with patients affected by severe falciparum malaria, who have been demonstrated to have markedly impaired absorption of sugars (Molyneux et al. 1989).
2.1.3 Mechanisms of altered intestinal permeability in disease
Any disease causing physical or functional abnormalaties of the mucosal barrier can result in changes to intestinal permeability. The major factor that determines the rate of intestinal permeability is the opening or closure of the TJs between intestinal epithelial cells and the paracellular space; however structural alterations in the intestinal epithelium (i.e. epithelial leaks), including (1) erosions/ulcerations and/or epithelial restitution arrest; (2) epithelial cell apoptosis; and (3) transcytotic uptake of luminal antigens should also be considered (Mankertz and Schulzke 2007, Schulzke et al. 2009).
2.1.3.1 Alterations in tight junction complexity
It has been demonstrated that TJ complexity is reduced in inflamed intestinal segments, with a reduction of TJ strands, strand breaks, and changes in TJ protein content and composition (Schulzke et al. 2009). Using Crohn's disease as a model of intestinal inflammation, Zeissig et al. (2007) reported that the TJ proteins occludin; and the sealing proteins claudin 5 and claudin 8 were all downregulated and redistributed off the TJ following an inflammatory insult. In contrast, the pore-forming TJ protein claudin 2 was strongly upregulated. These proteins comprise the molecular basis of TJs, and changes in their composition lead to ‘leaky’ tight junctions. Large molecules are consequently able to permeate across the impaired mucosal barrier, and this can be measured as increased intestinal permeability using probe molecules.
A variety of mechanisms have been reported to control the degree of leakiness of the TJs, including the dietary state of the patient (Nusrat et al. 2000, Ventura et al. 2006, Ulluwishewa et al. 2011), inflammatory cytokines (Capaldo and Nusrat 2009), mast cell products (Santos et al. 2001), and dysregulation of cellular pathways by microbial pathogens (Urao et al. 1997, Fasano and Nataro 2004).
20
2.1.3.2 Erosions, ulcerations and epithelial restitution arrest
In ulcerative diseases of the intestine, increased permeability of the mucosal barrier may occur secondary to erosion/ulcer-type lesions in addition to generalized alterations in TJ complexity. The contribution of this mechanism to increased intestinal ion permeability was investigated by comparing epithelial conductance in inflamed colon specimens for patients with ulcerative colitis (Gitter et al. 2001). Controls, and specimens with and without visible mucosal defects (i.e. erosions/ulcers) were studied. Overall conductivity was increased three-fold in specimens with visible epithelial lesions. In addition, the spatial distribution of conductivity showed dramatic leaks which corresponded with epithelial erosion/ulcer-type lesions or crypt abscesses. The authors conclude that with moderate-to-severe ulcerative disease, erosion/ulcer-type lesions are highly conductive; and that focal leaks contribute 65% to the overall epithelial conductivity in moderate-to-severe inflammation (Gitter et al. 2001).
Cytokine mediated arrest of epithelial restitution also appears to play a role in barrier dysfunction by inhibiting or retarding normal wound healing of intestinal epithelial cells (Mankertz and Schulzke 2007, Iizuka and Konno 2011)
2.1.3.3 Epithelial cell apoptosis
Epithelial cell apoptosis has also been identified as an important mechanism for altered intestinal permeability (Heller et al. 2008). Proinflammatory cytokines (e.g. TNF-α and Interleukin -13) that are associated with intestinal inflammation upregulate both the apoptotic rate and single apoptotic conductivity. These apoptotic sites form conductive leaks in the intestinal epithelium, thus increasing the “leakiness” of the intestinal barrier (Schulzke et al. 2006).
2.1.3.4 Transcytotic uptake of luminal antigens
Schurmann et al. (1999) investigated whether antigens pass through the intestinal epithelial barrier by a transcellular or a paracellular pathway, and identified that there is enhanced transcellular transport of luminal antigens via endocytosis and transcytotic transport in inflamed intestinal tissue. Bacterial translocation across inflamed intestinal barrier is thought to occur via similar transcytotic pathways, although recent evidence suggests that E.coli alpha-haemolysin is able to penetrate the epithelium directly via small defects in epithelial integrity i.e. focal leaks (Troeger et al. 2007).

21
2.2 Gastric permeability
There appears to be significant variation in permeability when comparing the anatomical regions of the gastrointestinal tract. In an attempt to determine the passive permeability characteristics of the human intestine in vivo, Davis et al. (1982) measured the potential difference in the jejunum, ileum, proximal colon, and distal colon during perfusion of various test solutions, and found that there are significant differences in the pathways for passive ion movement in the regions of the intestine that were under investigation. A similar pattern of anatomical variation on the permeability of larger marker molecules (e.g. 14C-mannitol) was later confirmed in a series of experiments that compared regional intestinal mucosal permeability in several species using an in vitro technique (Nejdfors et al. 2000).
The gastric mucosa is similar to the intestinal epithelium in that it is also lined by simple columnar epithelial cells, however it differs from other parts of the intestine in that specialized cardiac, fundic and pyloric glands are interspersed throughout the stomach in mucosal invaginations called gastric pits. The epithelial lining of these glands is also comprised of simple columnar epithelium and is contiguous with the rest of the epithelial lining of the stomach. As such, the permeability of the gastric mucosa to probe molecules is likely to be similar to other regions of the gastrointestinal tract, although this is speculative, as there are no studies to date that have made direct comparisons. Interestingly, TJ permeability in rat small intestine has been reported to differ between villus absorptive cells (enterocytes) and goblet cells, presumably because the TJs between absorptive cells were similar in structure while those associated with goblet cells displayed structural variability (Madara and Trier 1982). Whilst there is no comparable data for the gastric mucosa, it does suggest that epithelia such as the glandular mucosa of the stomach that contain high numbers of mucous producing foveolar cells may in fact be inherently more permeable when compared to other intestinal epithelia.
Furthermore, a fundamental difference between the gastric and intestinal barriers is the
fact that the gastric epithelium needs to be able to protect itself from autodigestion, and this implies an “intrinsic resistance of the epithelial apical surface” (Allen et al. 1993). This should be taken into consideration when making direct comparisons regarding permeability. In addition to the epithelial layer itself, which provides a permeability barrier, the gastric mucosa is protected by active peristalsis, an adherent mucus gel layer; and specially adapted vasculature that supplies HCO3- for transport across the epithelial cell membrane and into the mucus gel layer (Allen et al. 1993). The gastric epithelium itself is further adapted in that it can undergo rapid epithelial restitution from the gastric pits in response to superficial damage; however this process is also presumably susceptible to cytokine mediated arrest and consequential inhibition or retardation of normal wound healing of the gastric epithelial cells (Mankertz and Schulzke 2007, Iizuka and Konno 2011).

22
2.2.1 Factors that influence gastric permeability
2.2.1.1 Species
Considerable variation exists when comparing gastrointestinal permeability between humans and other species, and again, it would be prudent to consider such variation when making direct comparisons. Delahunty and Hollander (1987) demonstrated that the permeability of the human gut to probe molecules is different from that of three common laboratory rodents, but is closest to that of guinea pigs. Jezyk et al. (1992) investigated the permeability of different intestinal segments from various species in order to try and identify an appropriate in vitro intestinal permeability model that could predict intestinal absorption in humans; and found that rabbit jejunum is twice as permeable as monkey and dog jejunum, while the colonic tissues of monkey, rabbit, and dog demonstrate similar permeabilities. Bijlsma et al. (1995) investigated differential in vivo and in vitro intestinal permeability to lactulose and mannitol in animals and humans, and found differences in urinary recovery ratios when comparing rodents, cats and humans. Most recently, Nejdfors et al. (2000) investigated species differences in mucosal in vitro permeability in the intestinal tract of the pig, the rat, and man in order to determine if it was appropriate to extrapolate findings from permeability experiments on animals to man. By using the same probe molecules and in vitro technique on intestinal tissues from each species, the authors were able to demonstrate that permeability data from the pig correlated fairly well with those of man, whereas there were significant differences in the rat, thus making extrapolation from the rat to man difficult (Nejdfors et al. 2000). Unfortunately there is currently no direct comparative data for gastric permeability between the different species, however it would seem likely that differences do exist. For example, in man and most other monogastric species, there is an abrupt transition from simple columnar epithelium to stratified squamous epithelium at the junction between the stomach and the oesophagus. In the horse however, this arrangement is unique in that the stomach is divided into a non-glandular and a glandular portion by the margo plicatus (Fink, Hembes et al. 2006) (Figure 1). The portion of the stomach proximal to the margo plicatus is comprised of stratified squamous epithelium that is contiguous with the oesophagus. In contrast, the glandular portion of the stomach is lined with simple columnar epithelium and is histologically indistinct from other monogastric species. This variation in the cellular makeup of the equine gastric mucosa has potential implications for gastric barrier function that are unique to this species.

23
Kuva 1 Anatomy of the equine stomach. A- non glandular portion of the stomach comprised of stratified squamous epithelium; B-margo plicatus; C-glandular portion of the stomach comprised of simple columnar epithelium
2.2.1.2 Age
The effects of age on site-specific gastrointestinal permeability testing has been investigated in several species. Udall et al. (1981) reported the effect of age on intestinal permeability to macromolecules in humans, and was the first to provide objective evidence that the intestinal mucosal barrier of newborn children may not be completely developed at birth, thus increasing the risk of intestinal transport of antigens into the circulation. Old age also appears to have an effect on intestinal permeability. Recent data has shown that intestinal permeability was higher in colonic biopsies collected from old baboons when compared with young baboons. In addition, colonic tissue from the older animals had decreased zonula occluden-1, occludin, and junctional adhesion molecule-A tight junction protein expression and increased claudin-2 expression; suggesting age-associated remodeling of intestinal epithelial TJ proteins (Tran and Greenwood-Van Meerveld 2013). The influence of age on intestinal permeability has also been investigated in dogs. Intestinal permeability was assessed in healthy dogs of different age groups using the ratio of urinary lactulose to L-rhamnose; and on analysis of the data, young dogs (< 12 weeks old) were found to have higher intestinal permeability than adults (Weber et al. 2002). Unfortunately there is no

24
direct comparative data on gastric permeability in different age groups, however Vera et al. (1997) did report sucrose permeability data in children with gastric damage and Helicobacter pylori infection; and in that study, urinary sucrose excretion in children with gastric damage was comparable to that of adults.
2.2.1.3 Physical factors
2.2.1.3.1 Osmolality
Ingestion of hyperosmolar solutions causes a relative increase in intestinal permeability when compared with low- or iso-osmolar solutions (Menzies 1972a, Menzies 1974, Laker and Menzies 1977, Uil et al. 2000). It has been postulated that the increase in permeability is due to an increase in the size and/or frequency of a range of smaller pores which are activated as the solute concentration in the ingested solution is increased (Wheeler et al. 1978). This relative increase in permeability for hyperosmolar test solutions (e.g. lactulose and mannitol) has been used to increase their sensitivity for detecting mucosal abnormalities in diseases such as coeliac disease and small intestinal villous atrophy in man (Uil et al. 2000, Johnston et al. 2001). There is currently no data on the effect of hyperosmolar solutions on gastric permeability.
2.2.1.3.2 Exercise
Strenuous exercise (e.g. running) has been associated with an increase in gastric permeability in man and dogs (Oktedalen et al. 1992, Pals et al. 1997, Davis et al. 2005), particularly if the subject is dehydrated (Lambert et al. 2008) or concurrently medicated with non-steroidal anti-inflammatory drugs (Ryan et al. 1996, Lambert et al. 2007). The increase in gastric permeability during exercise is likely due to splanchnic hypoperfusion and subsequent intestinal ischemia that damages gastric epithelial cells and ultimately compromises the gastric barrier (van Wijck et al. 2011, ter Steege and Kolkman 2012). This results in increased exposure to luminal acid and other noxious agents (e.g. bile acids, bacteria and proteolytic enzymes) and ultimately leads to gastric mucosal damage/ulceration. The effect that exercise has on gastric permeability is particularly relevant to the horse, as these animals often engage in strenuous exercise, and should therefore be taken into account when interpreting the magnitude of gastric permeability in this species.
2.2.1.4 Drugs
Meddings et al. (1993) was the first to demonstrate that NSAIDs disrupt the integrity of the gastric barrier following his ground-breaking work on sucrose permeability testing in 1993.

25
Subsequent to this, there have been a number of studies that have reported the deleterious effects of NSAIDs on gastric permeability in several species (Sutherland et al. 1994, DeMeo 1995, Meddings et al. 1995a, Erlacher et al. 1998, Smecuol et al. 2001, Khazaeinia and Jamali 2003, Craven et al. 2007, Lambert et al. 2007). Several pathophysiological mechanisms are believed to be associated with NSAID induced gastric injury: (1) inhibition of prostaglandin synthesis leading to impaired mucosal blood flow, mucus gel layer production and delayed mucosal repair (Bastaki and Wallace 1999); (2) uncoupling oxidative phosphorylation leading to reduced cellular ATP and as a consequence, altered tight junction function (Somasundaram et al. 1995); and (3) local recruitment and activation of neutrophils (Wallace 1993). The effect of NSAIDs on gastric permeability has recently been reported in horses and it been shown that they are also susceptible to NSAID induced gastric injury (D'Arcy-Moskwa et al. 2012).
Corticosteroids also appear to augment gastric permeability in man, and the proposed
mechanism is an alteration in the permeability of the gastric epithelial TJs by corticosteroid mediated modulation of intracellular second messengers (e.g. Ca2+, cAMP) and inflammatory mediators (Kiziltas et al. 1998). Other drugs that have been associated with increased gastric permeability include copper, alcohol, omeprazole and a variety of chemotherapeutic agents (Keshavarzian et al. 1994, Gotteland et al. 2001a, Gotteland et al. 2002, Hopkins et al. 2002, Inutsuka et al. 2003, Melichar and Zezulova 2011). The likely mechanism for alcohol induced alterations in gastric barrier function is mucosal vascular injury and subsequent ischemia (Szabo 1987).
The effect of omeprazole on gastric permeability is surprising considering its function
as an acid suppressant in patients with gastric ulceration. In an in-vitro rat model, Hopkins et al. (2002) studied fluxes of a radiolabeled marker molecule through the interepithelial tight junctions of gastric mucosa under the influence of omeprazole and discovered that exposure of the gastric mucosa to omeprazole interferes with TJ integrity (Hopkins et al. 2002). This leads to widening of the interepithelial space and facilitates enhanced macromolecular permeability. This increase in paracellular permeability of the gastric epithelium following treatment with omeprazole may have relevance for permeability testing, and implies that the validity of gastric permeability tests should be questioned in the face of concurrent medication with omeprazole.
2.2.1.5 Diseases
2.2.1.5.1 Erosive and non-erosive gastritis
Gastritis is defined as inflammation of the gastric mucosa and can be erosive or non-erosive (Varbanova et al. 2014). Erosive gastritis is characterized by acid injury to the gastric mucosa that destroys cellular elements and results in erosions and ulcers that could extend to the level of the submucosa (Lanas and Chan 2017). In human medicine the term peptic

26
ulcer disease is used as an umbrella term to describe a large number of specific individual diseases that cause erosive gastritis, the most common of which are Helicobacter pylori and NSAID associated gastric ulceration (Malfertheiner et al. 2009, Lanas and Chan 2017). While some of these diseases have a similar pathophysiology and are treated in a similar manner, it is clear in human medicine that direct extrapolation of either from one specific disease to another is inappropriate (Malfertheiner et al. 2009, Lanas and Chan 2017).
A number of studies have reported increased gastric permeability in patients with erosive (and non-erosive) forms of gastritis (Meddings et al. 1995a, Soderholm et al. 1996, Goodgame et al. 1997, Vera et al. 1997, Borch et al. 1998, Graham 2000, Fukuda et al. 2001, Gotteland et al. 2001b, Sjostedt Zsigmond et al. 2005). Increased gastric permeability is likely to be caused by similar mechanisms to those which cause increased intestinal permeability in cases of inflammatory bowel disease; and in particular those with ulcerative colitis. These include alterations in TJ junction protein content and composition; apoptotic leaks; gross mucosal lesions, and epithelial restitution arrest (Mankertz and Schulzke 2007). Epithelial leaks develop early in the course of the disease as a result of microerosions, upregulated epithelial apoptosis and TJ protein changes with significant increases in claudin-2 (Mankertz and Schulzke 2007). Gastric ulceration in the horse will be reviewed in detail later in this review.
2.2.1.5.2 Other diseases
Crohn’s disease is a subcategory of inflammatory bowel disease in man that causes inflammation and ulceration of the intestine. The terminal ileum and colon are most commonly affected, but the disease can affect any part of the intestine, including the stomach and proximal duodenum (Head and Jurenka 2004). Not surprisingly therefore, increased gastric permeability has been reported in patients with Crohn's disease, suggesting involvement of the stomach in a high proportion of patients with this disease (Wyatt et al. 1997, Puspok et al. 1998). Puspok et al. (1998) compared gastric permeability with histological findings and the lactulose-mannitol ratio (as a marker of intestinal permeability) in 100 patients with Crohn’s disease, and demonstrated that (1) gastric permeability is increased; and (2) that increased gastric permeability in conjunction with an increased lactulose-mannitol ratio can be used to predict the presence of Crohn’s disease in the stomach with a likelihood of 86%. Again, the mechanism for this increased permeability is related to inflammatory changes and their associated effects on gastric barrier function (Mankertz and Schulzke 2007).
Celiac disease is a genetic disease associated with a gluten intolerance that results in
severe villous atrophy of the small intestine that responds to gluten exclusion (Cox et al. 1998). Curiously, patients with Celiac disease have also been reported to have increased gastric permeability, and it has been suggested that this may be due to the presence of a concurrent lymphocytic gastritis (Vogelsang et al. 1996, Smecuol et al. 1997, Smecuol et al. 1999). This has been refuted by Cox et al. (1997b) however, who believe that the increase
27
in blood sucrose in patients with Celiac disease is not related to increased gastric permeability, but rather due to a loss of brush border disaccharidase activity in conjunction with increased small intestinal permeability. Increased quantities of undigested sucrose thus accumulate in the small intestine and permeate across the compromised intestinal barrier (Cox et al. 1997b, Cox et al. 1998). While this is a valid argument, Vogelsang et al. (1996) did take the possibility of small intestinal sucrose absorption into account in their study, and report that in contrast to oral administration, urinary sucrose excretion decreased after duodenal administration, thus proving that the increased sucrose excretion was due to increased gastric permeability (Vogelsang et al. 1996).
Patients with irritable bowel syndrome (IBS) have also been found to have increased
gastric permeability, suggesting that an impaired gastric epithelial barrier may be implicated in the pathogenesis of this disease (Vicario et al. 2009, Del Valle-Pinero et al. 2013, Mujagic et al. 2014). Other diseases that have been sporadically associated with increased gastric permeability include Behcet's disease (Koc et al. 2004), Plasmodium falciparum malaria (Wilairatana et al. 1997), pseudoallergic reactions in chronic urticaria (Buhner et al. 2004), limited systemic sclerosis (Catanoso et al. 2001), and liver cirrhosis (Keshavarzian et al. 1999, Giofre et al. 2000, Di Leo et al. 2003, Norman et al. 2012).
2.2.2 Methods of measuring gastric permeability
2.2.2.1 Properties of an ideal permeability probe
Determination of intestinal permeability as a tool for evaluating gastrointestinal disease has been utilized in human medicine for many years. The best and most extensively used example of this methodology in a clinical setting is the lactulose/mannitol test (van Elburg et al. 1993, Sequeira et al. 2014). This dual sugar test is used routinely as a non-invasive method to measure intestinal permeability in patients with inflammatory bowel disease (Munkholm et al. 1994, Vogelsang et al. 1995, Halme et al. 2000). Lactulose and mannitol are ideally suited for measuring intestinal permeability as they fulfil all the criteria for a permeability probe (Pearson et al. 1982, Cooper 1984). They are (1) nontoxic; (2) hydrophilic; (3) lipophilic; (4) absorbed entirely by passive diffusion (permeation); (5) not modified through enzymatic action (lactulose is not hydrolyzed by lactase); (6) not a normal part of the diet; (7) not produced endogenously; (8) not metabolized; (9) limited to the extracellular compartment once absorbed; (10) excreted rapidly and completely; and (11) are relatively easily quantified in bodily fluids.
Following ingestion of a single test dose, the rate of absorption of mannitol and lactulose from the intestine is determined by the rate of their subsequent renal excretion during the first five hours, and represents non-carrier-mediated transcellular and paracellular transport respectively across the diseased intestinal mucosa. Because lactulose and mannitol differ with respect to their molecular size, their permeation across diseased intestinal mucosa is

28
thought to occur via different pathways (Pantzar et al. 1993). Lactulose is a larger molecule (molecular mass 342 Da), and therefore it crosses via “leaky” TJs (Zeissig et al. 2007, Schulzke et al. 2009) and structural alterations in the intestinal epithelium (e.g. erosions/ulcerations) (Menzies et al. 1979, Pearson et al. 1982), thus reflecting damage/inflammation to the intestinal epithelium. In contrast, mannitol is a smaller molecule (molecular mass 182 Da), and can therefore cross the intestinal barrier via aqueous pores in the apical cell membrane of the enterocytes (Fordtran et al. 1967, Wheeler et al. 1978, Pearson et al. 1982). Decreased mannitol excretion rates therefore reflect a reduction in the total villous surface area of the intestine. The results are reported as a ratio, with an increase in the ratio of lactulose to mannitol associated with an increased likelihood of disease (Johnston et al. 2001). Calculation of a ratio compensates for differences in individual variables such as gastric emptying, small intestinal transit times and differences in urinary excretion/incomplete urinary collection (Pearson et al. 1982, Sequeira et al. 2014).
So why not use the dual sugar test for assessing gastric permeability? Although it would seem logical, the surface area of the stomach is much smaller than that of the intestine, and therefore any detectable changes in gastric permeability are obscured by relatively small changes in intestinal permeability, rendering the test useless as a specific marker of gastric mucosal permeability. In order to overcome this problem, a disaccharide that has similar attributes to that of lactulose and mannitol, but that is specific to the stomach is required. Sucrose fulfils these requirements, and has been reported to be a reliable marker for gastric permeability in a variety of species, including rats, rabbits, dogs, and people (Meddings et al. 1993, Sutherland et al. 1994, Meddings et al. 1995a, Meddings et al. 1995b)
2.2.2.2 Sucrose test
Sucrose is a disaccharide that is very similar in size and physiochemical structure to lactulose. Because of its large molecular size (molecular mass 342 Da), sucrose is not able to permeate across healthy gastric mucosa, but it has been reported to cross the mucosa in the presence of gastric disease (Meddings et al. 1993). The mechanism for this is thought to be very similar to lactulose (Meddings 1997) i.e. via “leaky” TJs (Zeissig et al. 2007, Schulzke et al. 2009) or directly through gaps in the epithelium caused by erosion, ulceration or alterations in epithelial restitution (Gryboski et al. 1963, Gitter et al. 2001, Mankertz and Schulzke 2007, Iizuka and Konno 2011). The key difference between lactulose and sucrose however, is the fact that sucrose is rapidly hydrolyzed to fructose and glucose by the brush border enzyme sucrase once it is emptied from the stomach, and only trace quantities of sucrose can be detected in the urine/blood of normal test subjects (Meddings et al. 1993, Sutherland et al. 1994, Cox et al. 1998). If present in blood, sucrose remains in the extracellular fluid where it is completely elimated via the kidneys (Keith and Power 1937, Peterson et al. 1959, Bauer et al. 1990). It is not metabolized and the body does not produce it (Vettorazzi and MacDonald 1988). Therefore, increased amounts of sucrose in blood/urine after an oral dose is site specific for increased gastric permeability, and can be

29
used to predict the presence of diseases of the stomach such as gastric ulceration, upper dyspepsia, Helicobacter pylori gastritis, atrophic gastritis, portal hypertensive gastropathy or carcinoma (Sutherland et al. 1994, Meddings et al. 1995b, Rabassa et al. 1996, Goodgame et al. 1997, Borch et al. 1998, Erlacher et al. 1998, Kawabata et al. 1998, Giofre et al. 2000, Cibicek et al. 2004, Shishido et al. 2005, Sjostedt Zsigmond et al. 2005, Yamaguchi et al. 2009). When using the sucrose test to predict the presence of ulcers, it has been reported to be strongly correlated with ulcer size but not ulcer location (Kawabata et al. 1998). Therefore it would appear that the size of the mucosal defect and the surface area affected is the most important factor in determining the quantity of sucrose entering the circulation following testing. As is the case with other clinical permeability tests, the exact nature of the disease cannot be ascertained using this technique, and therefore its primary function is as a screening test to identify individuals that would benefit from gastroscopy.
In the first validated study in humans, Sutherland et al. (1994) administered a 450 mL solution containing 100 grams of table sugar to 189 patients that had been admitted to the hospital for upper gastrointestinal bleeding. The patients were subsequently subjected to gastroscopy, and the sucrose concentrations in urine following a 5-hour urine collection were compared to the gastroscopy findings. Gastric ulcers and severe gastritis were associated with an increased urinary sucrose excretion. Using a cut-off of 180mg (total quantity of sucrose in the collected urine sample), the specificity of the test for identifying abnormal gastroscopy findings was 96%; while the sensitivity of the test for identifying gastric ulcers and severe gastritis was 84% and 68.8% respectively. The authors were not however, able to demonstrate a significant association between increased urinary excretion of sucrose and esophagitis, mild gastritis or duodenal ulcers. The authors concluded that sucrose permeability can be used to detect the presence and severity of gastric ulcers/gastritis, and thus may represent a simple screening method for gastric disease.
Based on this premise, quantitation of sucrose in urine has been reported to be a reliable screening method for detecting gastric ulcers in horses (O'Conner et al. 2004). The efficiency of the mucosal disaccharidases and the monosaccharide transport systems in the equine small intestine have been established by a series of oral disaccharide and monosaccharide tolerance tests, and it has been demonstrated that horses are also fully capable of rapidly hydrolyzing sucrose (Roberts 1975a, Roberts 1975b). Furthermore, sucrase has the highest activity in the proximal duodenum of the horse, with concentrations similar to those reported in the intestine of humans and other non-ruminant species (Dyer et al. 2002). Therefore it stands to reason that the test should also be effective in this species. In the study by O’Conner et al. (2004), 13 adult horses were subjected to sucrose permeability testing following induction of gastric ulcers by intermittent feed deprivation. Each horse was administered 500 grams of sucrose as a 10% solution via nasogastric intubation, followed by collection of urine two and four hours later. This protocol was directly extrapolated from earlier studies by Sutherland et al. (1994). Gastroscopy was performed approximately 60 minutes after the last urine collection. Gastroscopy findings were recorded using an established scoring system. Horses were then administered omeprazole for 21 days to ensure complete healing of the gastric mucosa, and sucrose

30
testing and endoscopy were subsequently repeated. When comparing urinary sucrose concentrations in the horses before and after treatment with omeprazole, there was a significant association between the presence (and severity) of gastric ulcers and increased urinary sucrose concentration. Using a cut-off of 2 μmol/L, the sensitivity and specificity of urinary sucrose to detect moderate to severe gastric ulcers was 83% and 90% respectively; which was similar to that reported by Sutherland et al. (1994). The authors concluded from this study that sucrose permeability testing may represent a simple screening test to detect and monitor gastric ulcers in horses (O'Conner et al. 2004).
Unfortunately technical difficulties associated with collection of urine from the horse
has limited the practicality of this test. For testing, a horse’s bladder must be evacuated by catheterization prior to administration of sucrose and again two hours later; thus, the method is technically intensive and involves a two hour lag from administration to specimen collection. Variations in urine volume during the collection period may also affect interpretation of the results (Addobbati et al. 2013). To circumvent these difficulties and make the test more practical, quantitation of sucrose in blood using a similar approach has been suggested (O'Conner et al. 2004, Shishido et al. 2005). In addition, there were concerns over the validity of the results considering the fact that gastric permeability was assessed while under the influence of omeprazole (Hopkins et al. 2002).
Although the objectives of this study are to specifically investigate the role of sucrose
permeability testing for the detection of gastric ulceration in horses, it is conceivable that sucrose permeability testing may also be useful for detecting any condition that causes generalized or focal mucosal damage in the stomach of the horse. For example, it has been used to detect gastric carcinoma in man (Kawabata et al. 1998, Shishido et al. 2005, Yamaguchi et al. 2009) and it stands to reason that it may be useful for investigation of gastric squamous carcinoma and other neoplasms affecting the stomach of the horse. Clinicians that do not have access to gastroscopy may find this test particularly useful for the investigation of weight loss or recurrent colic. The index of suspicion for gastric neoplasia or gastric ulceration will be high in those horses that demonstrate increased blood sucrose concentrations following testing. Such horses can be referred for endoscopic evaluation on the basis of the test. Sucrose permeability testing has also been used routinely in human medicine to identify patients with NSAID induced gastric mucosal damage (Erlacher et al. 1998, Smecuol et al. 2001) and again, it stands to reason that it may also be useful for assessing the deleterious effects of NSAIDs on the gastric mucosa of horses (Andrews and McConnico 2009, Fennell and Franklin 2009, D'Arcy-Moskwa et al. 2012). Another potential application for sucrose permeability testing in the equine industry is for monitoring hospitalized neonatal foals. It is well documented that neonatal foals are at risk for gastric ulceration (Becht and Byars 1986). Of major concern is that severe disease can develop with only minimal symptomology (Murray et al. 1990). A simple screening test that obviates the need for gastroscopy would be of great value in predicting those foals that require therapy, thus ensuring timely intervention and avoiding unnecessary prophylaxis.

31
In man it has been reported that test doses of sucrose for permeability testing may sometimes cause loose stools (Wheeler et al. 1978); however the test is otherwise considered very safe. In the horse, the greatest concern from a safety point of view is the potential of inducing acute laminitis by administering large quantities of soluble carbohydrate (Garner et al. 1975). This risk appears small however, as preliminary sucrose permeability testing in horses using a dose of 500 grams did not induce laminitis in any of the horses that were tested (O'Conner et al. 2004). Other potential disadvantages of sucrose as a permeability probe include the fact that it can theoretically be metabolized by bacteria in the stomach (Cooper 1984), it is present in most feeds, and some sucrose may be absorbed in the proximal duodenum prior to being fully hydrolyzed by sucrase. The fact that sucrose may be absorbed in the proximal duodenum is of concern, as diseases of the proximal small intestine may be associated with increased sucrose permeability in the absence of gastric disease, particularly if they are associated with villous atrophy causing impaired sucrose hydrolysis (Cox et al. 1998). Fortunately this risk can be mitigated by direct visualization of the proximal duodenum during gastroscopy and obtaining biopsies for histopathological examination if there is any doubt. Furthermore, it has been reported that increased sucrose permeability is not associated with duodenitis in children; and is only increased in a small proportion of adults with duodenal ulceration (Sutherland et al. 1994). This is most probably due to the small surface area of the duodenum and the relatively short period of time that the sucrose molecule is in contact with the diseased mucosa in this region (Kawabata et al. 1998).
Quantitation of sucrose in blood challenging. Sucrose is a highly polar, non-volatile molecule that exhibits poor absorbance in the ultraviolet (UV) range, and is therefore not able to be detected using standard UV and photodiode array (PDA) methods (D'Arcy-Moskwa et al. 2011). Furthermore, serum is a complex matrix that contains a variety of sugars, lipids, amino acids and proteins; all of which can potentially affect resolution and sensitivity of the assay. Despite these limitations, several methods for quantifying sucrose in blood have been reported, including enzymatic assays (Holmes 1997, Vinet et al. 1998, Seimiya et al. 2004), high performance liquid chromatography-mass spectrometry (Buddington et al. 2006, Hewetson et al. 2006, D'Arcy-Moskwa et al. 2011), electrochemical HPLC (Cox et al. 1997a), HPLC-pulsed amperometric detector (Steiner et al. 2002), HPLC-fluorescence detector (Katamaya et al. 2006), and gas chromatography with mass spectrometry (Rodriguez et al. 2009). Liquid chromatography-mass spectrometry (LC/MS) is considered to be the method of choice as it offers highest sensitivity and mass selectivity without the need for extensive sample derivatization (D'Arcy-Moskwa et al. 2011). Unfortunately LC/MS is expensive, and the equipment is not routinely available in most veterinary laboratories. The development of a valid, yet practical and cost-effective method for quantifying sucrose in equine blood is therefore a key step in the development and validation of a simple, convenient and cost-effective screening test that could be used detecting gastric ulcers in horses. Gas chromatography with flame ionization detection (GC-FID) may represent such a method as it is accurate and can be used to measure minute amounts of a substance, an attribute that suits its applicability for quantitation of sucrose in equine serum, where expected concentrations of sucrose are low. Furthermore, GC-FID is

32
simple to use, comparatively cheap and the equipment is relatively widespread, making it an ideal analytical method for developing a practical and affordable diagnostic test. Gas chromatography with flame ionization detection has been used for quantifying sucrose in urine (Abazia et al. 2003, Farhadi et al. 2006); however a GC-FID method for quantifying sucrose in blood has not been previously reported.
2.3 Equine gastric ulcer syndrome (EGUS)
Gastric ulcers can develop in foals and horses of all breeds and uses, and the term EGUS has been used to describe this disease because of its multifactorial and complicated nature (Andrews et al. 1999, Sykes et al. 2015).
2.3.1 Terminology
Equine gastric ulcer syndrome is a general term used to describe erosive and ulcerative diseases of the equine stomach and is consistent with the use of the term PUD in man (Malfertheiner et al. 2009, Lanas and Chan 2017). In the horse however, it is also important to distinguish between diseases of the squamous and glandular mucosa, because significant differences exist between the two with respect to epidemiology, prevalence, risk factors, pathophysiology and response to treatment (Sykes et al. 2015). The terms ESGD and EGGD have therefore recently been recommended to clearly distinguish the anatomical region of the stomach affected when communicating clinical and research findings (Sykes et al. 2015).
2.3.2 Pathogenesis
There is no clear relationship between the presence of ESGD and EGGD, and the presence of both conditions concurrently does not indicate that they are associated (Murray et al. 2001, Begg and O'Sullivan 2003, Luthersson et al. 2009). The pathogenesis of ESGD is well understood, with a variety of managemental factors contributing to an increase in the exposure of the squamous mucosa to acid (Sykes et al. 2015). The squamous mucosa is inherently susceptible to injury, and prolonged acid exposure leads to erosions and ulcers. Furthermore, it is well recognized that within ESGD, both primary and secondary disease occurs. Primary ESGD occurs in response to the factors associated with intensive management in an animal with an otherwise normal gastrointestinal tract; while secondary ESGD occurs as a result of delayed gastric outflow secondary to an underlying pathophysiological mechanism (e.g. pyloric stenosis) (Sykes et al. 2015).
In contrast to ESGD, the pathophysiology of EGGD is poorly understood. The glandular mucosa is fundamentally different from the squamous mucosa in that it is exposed to a highly acidic environment under normal physiological conditions (Merritt et al. 2003). As
33
such, EGGD is believed to result from a breakdown of the normal defense mechanisms that protect the mucosa from acidic gastric contents. Although acid injury is not thought to be the primary cause of EGGD, a low pH may perpetuate mucosal damage and to inhibit mucosal healing (Sykes et al. 2015). There is also evidence to suggest that stress may play role (Monki et al. 2016, Scheidegger et al. 2017). Stress may influence gastrin production and blood supply to the glandular mucosa, and therefore may be a factor in the perpetuation, if not the initiation, of glandular lesions (Herszenyi et al. 2015, Levenstein et al. 2015). In contrast to ESGD, the lesions of EGGD are inflammatory in nature and are not ulcerative per se. The condition is therefore best described as a glandular gastritis (Martineau et al. 2009, Husted et al. 2010).
2.3.3 Prevalence
In adult horses, the prevalence of EGUS appears to vary with age, breed, use, level of training, as well as between ESGD and EGGD (Sykes et al. 2015).
The prevalence of ESGD in adult horses is highest in performance horses, with 37-100% of Thoroughbred racehorses (Murray et al. 1996, Vatistas et al. 1999, Begg and O'Sullivan 2003, Bell et al. 2007b); 44-87% of Standardbred racehorses (Rabuffo et al. 2002, Dionne et al. 2003, Jonsson and Egenvall 2006); 48-93% of endurance horses (Nieto et al. 2004, Tamzali et al. 2011) and 17-58% of show and sport horses (McClure et al. 1999, Hartmann and Frankeny 2003) found to have gastric lesions on gastroscopy. Non-performance horses are also susceptible to ESGD, with ulcers found in the squamous mucosa of 11-59% of pleasure horses and horses that partake in less strenuous activities (Chameroy et al. 2006, le Jeune et al. 2009, Luthersson et al. 2009). Pregnant and non-pregnant brood mares kept on pasture have a reported ESGD prevalence of 67% and 76% respectively, which is surprisingly high (le Jeune et al. 2009).
The prevalence of EGGD in adult horses has been less well reported. Studies in have
demonstrated prevalences of between 47% and 65% in Thoroughbred racehorses (Sykes et al. 2015); 16-33% in endurance horses (Nieto et al. 2004, Tamzali et al. 2011); 54-64% of sport horses (Hepburn 2014); and 57% of non-performance horses (Luthersson et al. 2009, Husted et al. 2010). In all of the above studies, the majority of lesions were reported in the pyloric antrum.
In foals, the reported prevalence of EGUS ranges from 22% to 57% (Rebhun et al. 1982,
Wilson 1985, Becht and Byars 1986, Murray 1989, Murray et al. 1990, Roberts 1990, Borrow 1993, Elfenbein and Sanchez 2012). Although it is most commonly recognized in older weanling foals, EGUS has also been reported in neonatal foals as young as 24 hours (Nappert et al. 1989, Lewis 2003, Elfenbein and Sanchez 2012). Ulcers have been reported in the squamous, glandular and duodenal epithelium, however ESGD appears to be most common, with the majority of lesions reported in the stratified squamous epithelium adjacent to the margo plicatus (Acland et al. 1983, Murray 1989, Elfenbein and Sanchez

34
2012). EGGD is less common, but when present, it is more likely to be associated with clinical signs (Murray 1989). It has also been shown that the presence of EGUS is significantly associated with a primary diagnosis of gastrointestinal disease in foals (Elfenbein and Sanchez 2012).
2.3.4 Clinical signs
Gastric ulcers have been associated with a variety of clinical signs in adult horses and foals. There is currently however, very little epidemiological evidence to support an association between perceived clinical signs of EGUS and the presence or absence of a specific type of lesion seen on gastroscopy. Most of the clinical signs associated with EGUS are non-specific and are often subjective. This is complicated further by the fact that (1) a large proportion of horses and foals with EGUS will not demonstrate clinical signs (Murray et al. 1989, Murray et al. 1990); and (2) horses with EGGD and ESGD will often manifest with different clinical symptomology (Sykes et al. 2015).
In foals, four distinct clinical syndromes have been recognized: (1) asymptomatic or
“silent” ulcers, occurring most commonly in the squamous epithelium of the stomach along the margo plicatus; (2) symptomatic ulcers, which can occur in the squamous, glandular or duodenal epithelium, and which often manifest as ill thrift, inappetence, ptyalism, bruxism or colic; (3) pyloric or duodenal outflow obstruction with secondary ulceration of the gastric squamous epithelium and esophagus, presumably due to reflux acid exposure; and (4) perforating ulcers that cause severe peritonitis and are invariably fatal (Traub-Dagartz et al. 1985, Becht and Byars 1986, Murray et al. 1990, Murray 1991, Borrow 1993, Andrews and Nadeau 1999, Zedler et al. 2009).
Clinical signs of EGUS in adult horses are less well recognized than in foals, however
there is some evidence to suggest that the prevalence and severity of gastric ulceration in horses with clinical signs is significantly greater than in horses without clinical signs (Murray et al. 1989). The most commonly reported clinical signs include poor appetite or ‘picky eating’ (Murray et al. 1989, Andrews and Nadeau 1999, Vatistas et al. 1999, Bezděková et al. 2008), poor body condition or weight loss (Murray et al. 1989, Andrews and Nadeau 1999, Dionne et al. 2003), chronic diarrhea (Murray et al. 1989, Andrews and Nadeau 1999, Vatistas et al. 1999), poor coat condition (Vatistas et al. 1999), bruxism (Bell et al. 2007a), changes in temperament (including an aggressive or nervous disposition) (Andrews and Nadeau 1999, McClure et al. 1999, Nicol et al. 2002), acute or recurrent colic (often manifested as post prandial discomfort) (Murray et al. 1989, Murray 1992, Andrews and Nadeau 1999, Vatistas et al. 1999, Dukti et al. 2006, Videla and Andrews 2009); changes in rideability (including reduced willingness to work and reluctance to go forward) (Hepburn 2014); and poor performance (Andrews and Nadeau 1999, Vatistas et al. 1999, Kollias-Baker et al. 2001, Jonsson and Egenvall 2006, Franklin et al. 2008).

35
2.3.5 Diagnosis
2.3.5.1 Gastroscopy
Currently, gastroscopy is the only reliable ante mortem method for definitive diagnosis of EGUS and is considered the gold standard against which all other diagnostic tests are compared (Sykes et al. 2015). Endoscopically guided biopsies are rarely indicated but if more severe pathological changes are suspected or if cases are refractory to treatment, then biopsies should be considered. Gastroscopy technique - the technique for equine gastroscopy is well described (Brown et al. 1985, Andrews et al. 1999, Sykes and Jokisalo 2014a). Food is usually withheld from the horse for 16 hours and water for 6 hours prior to gastroscopy. Following completion of fasting, the horse is sedated and a 3-m equine videoendoscope is passed into the stomach via the ventral nasal meatus and the oesophagus. The stomach is then distended by insufflation with air through the biopsy channel of the endoscope until the squamous and glandular mucosae are visible. To ensure proper identification of all mucosal defects, gastric contents should be rinsed from the mucosa with tap water flushed through the biopsy channel and excessive gastric fluid should be aspirated through the biopsy channel. At the conclusion of the examination, the stomach should be deflated by suctioning air through the biopsy channel. Endoscopic examinations are usually captured with still-frame images or video, and are routinely archived for medicolegal reasons. When performing gastroscopy, it is important to visualize the entire stomach, including the pylorus and proximal duodenum, as lesions in these regions are easily overlooked (Sykes et al. 2015). Furthermore, as discussed previously, several studies have reported that no relationship exists between the presence of ESGD and EGGD (Murray et al. 2001, Begg and O'Sullivan 2003, Luthersson et al. 2009). The presence or absence of one cannot therefore be used as predictor for the presence or absence of the other (Sykes et al. 2015).
Grading - assessment of the severity of squamous gastric lesions in horses is most commonly done by using an observational rating scale to assign a score that represents the mucosal appearance at the time of gastroscopy. A variety of different systems have been published for the horse, with scales ranging from 0-3 (Andrews et al. 1999) to 0-10 (MacAllister et al. 1997). In 1999, the Equine Gastric Ulcer Council proposed the use of a composite verbal rating scale (Andrews et al. 1999) that is currently recommended for both clinical purposes and research (Sykes et al. 2015). The scale consists of a list of adjectives describing different levels of gastric ulcer severity based upon lesion depth, size and number lameness intensity (Table 1). The scale is then scored by listing the adjectives in order of severity, and assigning each one a score as a function of its rank (Figure 2) (Downie et al. 1978a).

36
Table 1. Verbal rating scale used to assign a severity score for squamous gastric disease in horses (Andrews et al. 1999)
Grade Appearance of squamous gastric mucosa
0 Intact epithelium 1 Intact mucosa, evidence of hyperkeratosis or hyperemia 2 Small, single or multifocal lesions 3 Large, single or multifocal lesions or extensive superficial lesions 4 Extensive lesions with areas of apparent deep ulceration
Kuva 2 Examples of ESGD severity as scored using a verbal rating scale (Andrews et al. 1999). A=grade 0; B=grade 1; C=grade 2; D=grade 3; E=grade 4
Currently there are no means of assigning scores to glandular gastric lesions in horses as their relative severity and clinical importance is unknown (Sykes et al. 2015). On gastroscopic examination there is a wide variation in the gross appearance of glandular lesions that can also be appreciated histologically (Martineau et al. 2009, Hepburn 2012). Furthermore, lesions can differ in their mucosal appearance (erythematous, hemorrhagic or fibrinosuppurative) and in their mucosal contour (nodular, raised, flat or depressed) (Sykes et al. 2015). The use of descriptive terminology with a clear distinction of the anatomical region affected (cardia, fundus, antrum and/or pylorus); distribution (focal, multifocal or diffuse); severity (mild, moderate or severe); and the gross appearance of the lesion is therefore recommended (Figure 3) (Sykes et al. 2015).

37
Kuva 3 Examples of the terminology used to describe the gross appearance of EGGD lesions (Sykes et al. 2015). A=erythematous; B=flat fibrinosuppurative; C=flat hemorrhagic; D= raised fibrinosuppurative; E=nodular hemorrhagic; F=depressed (ulcerative). Image F courtesy of Barbora Bezdekova
Disadvantages of gastroscopy - gastroscopy is not readily available to most veterinarians, it is an inefficient expenditure of time, it requires that the horse be sedated; and it requires a minimum level of expertise to perform and interpret.
In addition, horses are usually selected for gastroscopy on the basis of clinical
symptomology suggestive of EGUS (Andrews et al. 1999). However, it is known that up to 52% of adult horses and 57% of foals affected by EGUS do not demonstrate clinical signs (Murray et al. 1989, Murray et al. 1990) and therefore, are not subjected to gastroscopy. These animals are considered to have 'silent' or non-clinical gastric ulceration (Murray et al. 1989, Murray et al. 1990, Andrews and Nadeau 1999, Bell et al. 2007a, Luthersson et al. 2009). In addition to the obvious welfare concerns; these animals may perform sub optimally and as such, are potentially a major cause of lost income to the racing, sport horse and stud industries. In the case of foals, this may even have potentially fatal consequences (Traub-Dagartz et al. 1985).
Despite their widespread use, few of the scoring systems used to subjectively assess the
severity of gastric ulceration have been validated for intra- or inter-observer variability. The assessment of lesion severity (and even the presence or absence of lesions) using gastroscopy is subjective, and agreement between observers for endoscopic diagnosis is notoriously poor, particularly if they are inexperienced (Amano et al. 2006, Hyun et al. 2013). Furthermore, it has been demonstrated that there is a poor correlation between endoscopic assessment of gastric ulcers ante mortem and histological appearance at necropsy (Andrews et al. 2002, Pietra et al. 2010). Another potential disadvantage of

38
gastroscopy is that it only enables the clinician to assign significance to gastric lesions based on their endoscopic appearance and cannot be used to infer clinical significance (Sykes et al. 2015). Although it has been suggested that there is a correlation between the severity of gastric ulceration and the severity of clinical signs (Bell et al. 2007a, Videla and Andrews 2009, Sykes and Jokisalo 2014a), this relationship is unlikely to be linear or temporally consistent; and there is currently very little evidence in the literature suggesting a direct cause-and-effect relationship between clinical signs and the presence, severity or location of gastric ulcers in adult horses (Sykes et al. 2015).
Gastroscopy is also costly to the client, and with an increase in public awareness of
EGUS and its popularity as a ‘catch-all’ diagnosis for poor performance in sport horses, many owners are electing to treat their horses on an empirical basis without the benefit of a definite diagnosis. Given the current economic climate and the rising costs of veterinary medicines, it is easy then to imagine that owners and veterinarians would be interested in using a convenient, economical screening test to rule out gastric ulcers; and also to monitor the efficacy of treatment.
2.3.4.2 Fecal blood test
A fecal blood test has been reported to be helpful in the diagnosis of EGUS (Pellegrini 2005). Unfortunately a recent study was unable to demonstrate an association between the presence of gastric ulcers and the detection of either fecal albumin or hemoglobin (Sykes et al. 2014b), and the test is therefore not currently recommended (Sykes et al. 2015).
2.3.4.3 Sucrose permeability testing
As discussed previously, sucrose permeability testing may represent a simple, economical alternative to gastroscopy for screening purposes and has been reported to be a reliable method for detecting gastric ulcers in horses, however technical aspects limit the practicality of this approach (O'Conner et al. 2004). These difficulties can be circumvented by the development of a simple, blood based test (Shishido et al. 2005); and is the ultimate objective of this doctoral thesis.
When determining the diagnostic accuracy of such a blood test, it would be customary
to compare it to gastroscopy as the recognized gold standard (i.e. how closely do the results approximate that which would be seen on gastroscopy) (Sykes et al. 2015). As discussed previously however, gastroscopy is not a perfect test. In particular, the fact that there is poor correlation between endoscopic assessment of gastric ulcers and histological appearance has the potential to significantly affect the diagnostic performance characteristics of the test, as gastroscopy may under or overestimate the severity or depth of gastric lesions, leading to an erroneous comparison with sucrose concentration in blood. Given the limitations of gastroscopy as a gold standard, due consideration should be given to alternative methods
39
for comparison of the sucrose blood test with a gold standard. Bayesian latent class models are mathematical frameworks used to study the prevalence and the performance of diagnostic tests in the absence of a gold standard test, and can potentially be used to validate the sucrose blood test based on the assumption that gastroscopy is an imperfect test i.e. the true disease state in the population was assumed to be unknown (Pfeiffer and Castle 2005, Toft et al. 2005).

40
3 Aims of the study
The overall aim of this doctoral thesis was to develop and validate the sucrose blood test for diagnosis of gastric ulcers in horses, including determination of the feasibility of the method; sucrose assay development and standardization (analytical validation); and field validation through determination of the performance characteristics of the test in selected populations of horses (field validation).
Specific objectives included:
1. Determination of the feasibility of the sucrose blood test by determining the correlation
between ulcer severity score and serum sucrose concentration following nasogastric administration of sucrose to a small number of horses with and without naturally occurring gastric ulcer disease (I);
2. Development and analytical validation of a gas chromatography-flame ionization detection method for measurement of sucrose in equine serum (II);
3. Determination of the diagnostic accuracy of the sucrose blood test by comparing it to gastroscopy in selected populations of horses and foals with and without naturally occurring gastric ulcer disease (III, IV);
4. Selection of optimal cut-off points for detecting gastric ulcers in horses and foals using receiver operator curve analysis (III, IV);
5. Determination of the inter-observer variability for assessment of gastric ulcer severity when using gastroscopy (III, IV); and
6. Investigate and compare the use of a Bayesian statistical approach that is based on the assumption that gastroscopy is an imperfect test i.e. estimation of sensitivity, specificity and disease prevalence when the true disease state is unknown (III, IV).
Completing these objectives will provide practicing veterinarians and horse owners with
important information regarding the validity of this testing method.

41
4 Materials and methods
4.1 Feasibility
4.1.1 Determination of the feasibility of the sucrose blood test for assessment of gastric permeability in horses with gastric ulceration (I)
4.1.1.1 Study design
Descriptive (observational pilot study)
4.1.1.2 Study population
Twelve clinically healthy horses were used in the study. Horses were sourced from various backgrounds, and were randomly selected on the assumption that at least 37 % of them would be affected by naturally occurring gastric ulceration (Murray et al. 1989). All horses were kept in a paddock with a covered area for shade. Each horse was fed a diet consisting of 2 kg of a concentrate ration (Horsechow 100, Purina Mills, St Louis, MO, USA) fed twice daily and coastal Bermuda grass hay ad libitum. Water was provided ad libitum. During the course of the study, horses were visually monitored for clinical signs of disease and results of daily monitoring and feeding were recorded.
4.1.1.3 Ethics approval
The protocol for this study was approved by the Texas A&M University Laboratory Animal Care Committee and the Ethics and Welfare Committee of the University of Glasgow.
4.1.1.3. Administration of sucrose and collection of samples
After a 20-hr period of food deprivation, each horse was restrained in stocks and a 14-gauge, 12.7-cm polyurethane catheter (Angiocath, Becton-Dickinson Infusion Therapy Systems Inc, Sandy, UT, USA) was inserted into the left jugular vein and secured with a nylon suture. A pre-sucrose administration blood sample was collected and then 250 grams of sucrose (Extra-fine granulated cane sugar, Domino Sugar, Domino Foods Inc, Baltimore, MD, USA) was administered as a 10% solution in tap water via a nasogastric tube. Following administration of sucrose, blood samples (20 ml) were collected at 15, 30, 45, 60 and 90 minutes and placed into vacuumed clot tubes. The intravenous catheter was flushed after

42
each use with 10 ml of heparinized saline (Heparin, Vedco Inc, St Joseph, MO, USA) (3u heparin/ml). Following blood collection, the serum was separated by centrifugation (10 minutes at 2000 x g) and then stored in a freezer at -80 °C until analysis.
4.1.4 Gastroscopy
In order to assess correlation of sucrose permeability with endoscopically visible gastric ulceration, horses were subjected to gastroscopy of the stomach four hours after sucrose administration. Gastroscopy was performed using a 3-m equine videoendoscope (Olympus GIF-100, Olympus America Inc, Melville, NY, USA). Horses were sedated with intravenous xylazine hydrochloride (Xylazine, Vedco Inc, St Joseph, MO, USA) (0.6 mg/kg body weight BW); and gastroscopy was performed using a previously reported technique (Brown et al. 1985, Andrews et al. 1999, Sykes and Jokisalo 2014). In brief, a 1-m equine stomach (naso-esophageal) tube was inserted into the esophagus to protect the endoscope from pharyngeal retroflexion. The stomach was then distended by insufflation with air through the biopsy channel of the endoscope until the squamous and glandular mucosae were visible, and the entire squamous epithelium of each horse was examined. To ensure identification of all mucosal defects, gastric contents were rinsed from the mucosa with tap water flushed through the biopsy channel and excessive gastric fluid was aspirated through the biopsy channel. At the conclusion of the gastric examination, the stomach was deflated by suctioning air through the biopsy channel. This was done to ensure that at the time that the sucrose solution was administered, the entire gastric mucosa would be exposed to sucrose.
All endoscopic examinations were captured with still-frame images and archived. Images were taken of the gastric squamous epithelium from the right side of the stomach along the margo plicatus (MPRT), the dorsal part of the fundus, the greater curvature along the margo plicatus (MPGC), the lesser curvature along the margo plicatus (MPLC), and the glandular mucosa in the region of the pylorus (Murray and Eichorn 1996).
4.1.5. Lesion scoring
Following completion of data collection, still-frame images from each of the 12 horses were reviewed and scored independently by five experienced veterinarians that were blinded to the results of the sucrose assay using a published 4-point verbal rating scale (Table 1). Observer agreement was evaluated and the mode for each horse was determined.
4.1.6 Sample processing
Serum was analyzed for sucrose using a validated LC/MS method (D'Arcy-Moskwa et al. 2011).

43
4.1.7 Statistical analysis
The association between the mode gastric ulcer score and sucrose concentration was analyzed by use of a linear mixed-effects model, with horse as a random effect and ulcer score as a fixed effect. Both were nested within time, which was also treated as a fixed effect. For the gastric ulcer scores allocated by five experienced veterinarians, inter-observer agreement was summarized by calculating the percentage of exact agreements, 1-point disagreements and 2-point disagreements (maximum disagreement observed). Perfect agreement would have been achieved if the 5 investigators rated the severity of ulceration for each horse identically. The Kendall coefficient of concordance (W) was used as an index of the divergence of the actual agreement shown in the data from the maximal possible or perfect agreement (Siegel and Castellan Jr 1988).
All statistical analyses were performed by use of a computer software package (R
Foundation for Statistical Computing, Vienna, Austria), and a p value < 0.05 was considered significant for all analyses.
4.2 Assay development and standardization
4.2.1 Development and analytical validation of a GC-FID method for measurement of sucrose (II)
4.2.1.1 Study design
Experimental study for analytical method development and validation (International Conference on Harmonisation 1995, International Conference on Harmonisation 1997).
4.2.1.2 Study population
Ten adult horses were recruited from horses that had been referred to the University of Helsinki equine teaching hospital for gastroscopy. The horses were used for a range of equestrian activities, and were recruited on the assumption that up to 53% of them would be affected by naturally occurring gastric ulceration of EGUS severity score ≥ 2 (Andrews et al. 1999, Luthersson et al. 2009). Horses comprised 1 Finn Horse, 3 Standardbreds and 6 Warmbloods. Two horses were geldings and 8 horses were mares. Horses ranged from 2 to 20 years of age (median, 9 years). Body weight ranged from 397 to 600 kg (median, 525 kg). Informed consent from the owner, or the trainer acting as an agent for the owner, was obtained at the time of enrolment to the study.
44
4.2.1.3 Ethics approval
The experimental work that formed the basis of this study was evaluated and accepted by the National Animal Experiment Board of Finland.
4.2.1.4 Sucrose permeability testing and gastroscopy
Owners were asked to withhold food from their horses for 16 hours and water for 6 hours prior to sucrose testing. On the morning after fasting, blood samples (20 mL) were collected in vacuumed clot tubes from the jugular vein. Horses were then sedated with a combination of detomidine hydrochloride (3mg) (Domosedan, Elanco Animal Health, UK) and butorphanol (0.6mg) (Butador, Chanelle Vet animal health, UK); and gastroscopy was performed as previously described to determine the presence or absence of gastric ulceration. Gastric ulcer severity was scored using a published 4-point verbal rating scale (Table 1).
Following gastroscopy, 1g/kg of sucrose (Kidesokeri 530, Sucros Oy, Finland) was
administered as a 10% solution via nasogastric tube to each horse. Serial blood samples (20 ml) were then collected by venipuncture from the jugular vein at 45 and 90 minutes after administration of sucrose. These time points were chosen based upon data from a previous study which indicated that peak sucrose concentrations occur approximately between 45 and 90 minutes after sucrose administration (Hewetson et al. 2006).
Following blood collection, the serum was separated by centrifugation (10 minutes at
2000 x g) and then stored in a freezer at -80 °C.
4.2.1.5 Collection of sucrose-free serum
Blood samples (20 mL) were collected in vacuumed clot tubes from the jugular vein of healthy horses that had been fasted for 16 hours. The serum was separated by centrifugation (10 minutes at 2000 x g) and was then pooled and stored in a freezer at -80 °C. In order to ensure that the serum was sucrose-free, a sample from each horse was analyzed for sucrose prior to pooling and was discarded if any sucrose was detected.
4.2.1.6 Preparation of solutions
Standard preparation - Stock solutions of analytical grade sucrose (Kidesokeri 530, Sucros Oy, Finland) and trehalose (d-(+)-trehalose dihydrate, Sigma-Aldrich, St. Louis, MO, USA) (29.2 and 26.4 mmol/L respectively) were prepared independently by dissolving each compound in ultrapure water (Milli-Q Gradient purification system, EMD Millipore Corp., Billerica, MA, USA). Working solutions were made by diluting the stock solutions 1:100

45
in water. Stock and working solutions were stored in a refrigerator at 4 °C. Standards were prepared in sucrose-free serum by spiking sucrose to yield final concentrations of 2.34; 2.92; 5.84; 8.76; 14.61 and 20.45 μmol/L; and trehalose 26.4 μmol/L as an internal standard. Standards were prepared as samples and they were made weekly. Sample preparation - Depending upon the application, test samples were prepared by spiking known concentrations of sucrose in sucrose-free serum or they were obtained from horses that had been subjected to sucrose permeability testing. Prior to analysis, test samples were thawed and mixed using a vortex. Two hundred μL of test sample was transferred to an Eppendorf tube and 20 μL of a working solution of trehalose was added as an internal standard. Proteins were precipitated by adding 0.6 mL acetonitrile-water (HPLC-grade acetonitrile, LabScan, Gliwice, Poland) (90:10), vortexing and then centrifuging for 10 min at 10 000 x g (Figure 4). The resulting supernatant was evaporated to dryness in a vacuum evaporator at 60 °C. The dried residues were purged with nitrogen for 10 seconds, dissolved in 0.1 mL anhydrous pyridine (Anhydrous pyridine, Sigma-Aldrich, St. Louis, MO, USA) and then sonicated for 5 min. Sucrose and trehalose were converted to their trimethylsilyl (TMS) derivatives by adding 0.1 mL of N-trimethylsilylimidazole (TMSI) (N-trimethylsilylimidazole (TMSI), Pierce Biotechnology Inc., Rockford, IL, USA). The vials were capped tightly and heated at 100 °C for 1h. After reaction, the samples were centrifuged for 5 min at 1711 x g at 4 °C. An aliquot of the mixture was then transferred to a new autosampler vial and the samples were analyzed immediately.
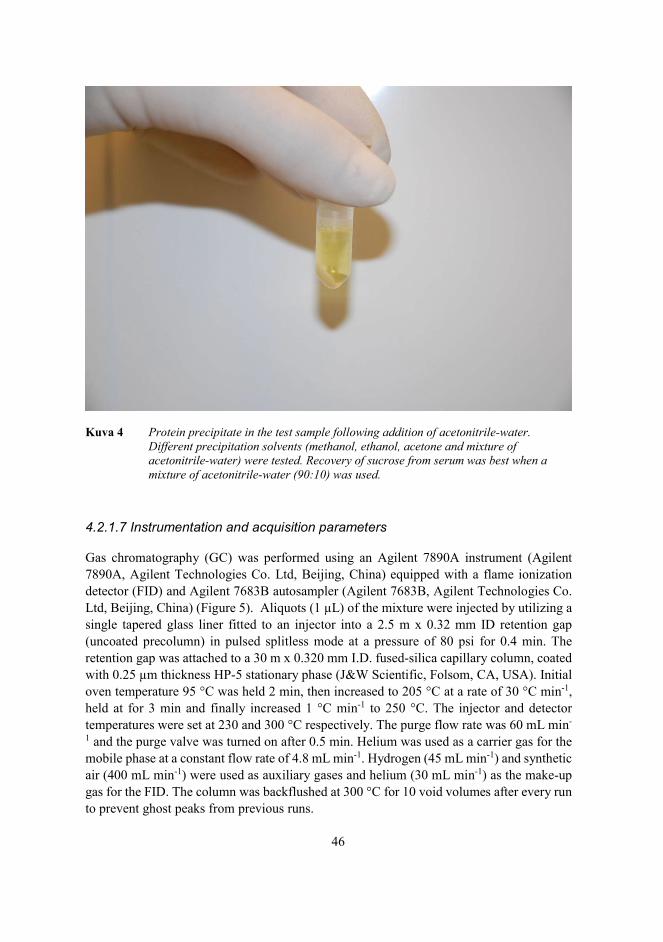
46
Kuva 4 Protein precipitate in the test sample following addition of acetonitrile-water. Different precipitation solvents (methanol, ethanol, acetone and mixture of acetonitrile-water) were tested. Recovery of sucrose from serum was best when a mixture of acetonitrile-water (90:10) was used.
4.2.1.7 Instrumentation and acquisition parameters
Gas chromatography (GC) was performed using an Agilent 7890A instrument (Agilent 7890A, Agilent Technologies Co. Ltd, Beijing, China) equipped with a flame ionization detector (FID) and Agilent 7683B autosampler (Agilent 7683B, Agilent Technologies Co. Ltd, Beijing, China) (Figure 5). Aliquots (1 μL) of the mixture were injected by utilizing a single tapered glass liner fitted to an injector into a 2.5 m x 0.32 mm ID retention gap (uncoated precolumn) in pulsed splitless mode at a pressure of 80 psi for 0.4 min. The retention gap was attached to a 30 m x 0.320 mm I.D. fused-silica capillary column, coated with 0.25 μm thickness HP-5 stationary phase (J&W Scientific, Folsom, CA, USA). Initial oven temperature 95 °C was held 2 min, then increased to 205 °C at a rate of 30 °C min-1, held at for 3 min and finally increased 1 °C min-1 to 250 °C. The injector and detector temperatures were set at 230 and 300 °C respectively. The purge flow rate was 60 mL min-
1 and the purge valve was turned on after 0.5 min. Helium was used as a carrier gas for the mobile phase at a constant flow rate of 4.8 mL min-1. Hydrogen (45 mL min-1) and synthetic air (400 mL min-1) were used as auxiliary gases and helium (30 mL min-1) as the make-up gas for the FID. The column was backflushed at 300 °C for 10 void volumes after every run to prevent ghost peaks from previous runs.

47
Kuva 5 Gas chromatography (GC) was performed using an Agilent 7890A instrument equipped with a flame ionization detector (FID) and Agilent 7683B autosampler.
4.2.1.8 Validation
The method was validated according to the guidelines of the International Conference on Harmonisation for validation of analytical methods (International Conference on Harmonisation 1995, International Conference on Harmonisation 1997). Validation criteria included determination of specificity, linearity, range, accuracy, precision, detection limit, quantitation limit, robustness and system suitability. Specificity - The assay was compared for resolution of carbohydrates (fructose, glucose, lactose and maltose) which are likely to be present in equine serum. Linearity - The linearity of the method was assessed across the expected range of the analytical procedure by comparing the recovery of serial dilutions of sucrose in serum relative to the internal standard, trehalose. The calibration curves were constructed with seven concentrations of sucrose ranging from 2.34 to 20.45μmol/L. The integrated peak areas of sucrose were normalized by dividing them by the peak area of trehalose, and the ratios were plotted against the concentrations. Linearity was evaluated by linear regression analysis, calculated using the least squares regression method.

48
Range - The specified range of the analytical procedure was derived from the linearity studies by confirming that the assay provided an acceptable degree of linearity, accuracy and precision when applied to serum samples containing amounts of sucrose within or at the extremes of the specified range. Accuracy - The accuracy of the assay was established across the specified range by spiking three known concentrations of sucrose (2.92; 8.76; and 20.45 μmol/L) in sucrose-free serum and analyzing each sample a minimum of 3 times to compare the measured and actual values. Accuracy was reported as the percentage recovery of the known added amount of sucrose in each sample. Precision (repeatability and intermediate precision) - The precision of the assay was established across the specified range by spiking three known concentrations of sucrose (2.92; 8.76; and 20.45 μmol/L) in sucrose-free serum and analyzing each sample a minimum of three times in one day (repeatability or intra-assay variability) and a minimum of 3 different days (intermediate precision or inter-assay variability). The precision was expressed as the relative standard deviation (RSD %). Detection and quantitation limits - The detection limit was defined as the minimum concentration of sucrose in equine serum that resulted in a peak height of three times that of base line noise. The quantitation limit was defined as the minimum concentration of sucrose that resulted in a peak height of ten times that of baseline noise. Robustness - To evaluate the stability of sucrose during storage, sucrose concentration was measured in duplicate equine serum samples (1) immediately i.e. serum was separated, and frozen immediately; (2) following storage of whole blood for 6 and 18 hours at room temperature; (3) following storage of serum for 24 hours at room temperature and at 4° C; (4) following storage of serum for 48 hours at 4°C, and (5) following storage of serum for 72 hours at 4°C. Results were expressed as the percentage recovery (%). System suitability testing - To evaluate the suitability of the method for quantifying sucrose in serum samples from horses with naturally occurring gastric ulceration, 10 horses with and without endoscopically visible gastric ulceration were subjected to sucrose permeability testing. The method was considered to be suitable for sucrose permeability testing if 1) sucrose could be quantified in the serum of horses that had been subjected to permeability testing; and 2) if there was a significant difference in sucrose concentrations when comparing horses with and without naturally occurring gastric ulceration following administration of sucrose.
4.2.1.9 Statistical analysis
GC ChemStation (Agilent Technologies Co. Ltd, Böblingen, Germany) was used to integrate the chromatographic peaks and Stata (Stata11, StataCorp LP, College Station, TX,

49
USA) was used for the statistical analysis. Comparisons between horses with and without gastric ulceration for individual time points were made using a two-sample Wilcoxin rank-sum test for non-parametric data. A p-value <0.05 was considered significant. All data given are means ± standard deviation (SD).
4.3 Determination of the performance characteristics of the test
4.3.1 Diagnostic accuracy of blood sucrose as a screening test for equine gastric ulcer syndrome in adult horses and weanling foals (III, IV)
4.3.1.1 Study design
The studies were conducted as a blind comparison to a gold standard.
4.3.1.2 Study populations
Adult horses - One hundred and one adult horses were eligible for inclusion in the study and were recruited from horses that had been referred to the University of Helsinki equine teaching hospital for gastroscopy and from a local riding center. The horses were used for a wide range of equestrian activities, ranging from dressage to racing, and were recruited on the assumption that up to 53% of them would be affected by naturally occurring gastric ulceration of EGUS severity score ≥ 2 (Andrews et al. 1999, Luthersson et al. 2009).
Weanling foals - Forty-five weanling foals were included in the study. Each foal was subjected to gastroscopy and sucrose permeability testing on two occasions; 7 days before and 14 days after weaning. The foals were sourced from the same breeding farm and were randomly selected on the assumption that up to 20% of foals would be affected by naturally occurring gastric ulceration prior to weaning and 60% of foals would be affected post-weaning (Murray 1989, Elfenbein and Sanchez 2012).
4.3.1.3 Exclusion criteria
Animals were excluded from the study if they had received non-steroidal anti-inflammatory drugs or omeprazole within seven days prior to testing. This was done to avoid confounding changes in gastric permeability secondary to administration of these drugs (Jenkins et al. 1991, Hopkins et al. 2002, D'Arcy-Moskwa et al. 2012).

50
4.3.1.4 Ethics approval
The experimental work that formed the basis of these studies was evaluated and accepted by the National Animal Experiment Board of Finland (III) and the ethical committee of the Authorities of Agriculture, Nutrition and Fishing, State of Mecklenburg-Vorpommern, Germany (IV). Where relevant, informed consent from the owner, or the trainer acting as an agent for the owner, was obtained at the time of enrolment to the study.
4.3.1.3 Gastroscopy
Adult horses - Owners were asked to withhold food from their horses for 16 hours and water for 6 hours prior to sucrose testing. Following completion of fasting, blood samples (10 ml) were collected in vacuumed clot tubes from the jugular vein; horses were sedated with a combination of intravenous detomidine hydrochloride (10 μg/kg body weight BW) (Domosedan, Elanco Animal Health, UK) and butorphanol (0.025 mg/kg BW) (Butador, Chanelle Vet animal health, UK); and gastroscopy was performed as previously described. All endoscopic examinations were recorded and archived. For each horse, video recordings and still-frame images were taken of the stomach from the MPRT, the dorsal part of the fundus, the MPGC, the MPLC, the glandular mucosa in the region of the pylorus and the proximal duodenum (Murray and Eichorn 1996). Weanling foals - Foals were fasted for six hours prior to gastroscopy. Following completion of fasting, blood samples (10 mL) were collected in vacuumed clot tubes from the jugular vein; foals were sedated with detomidine hydrochloride (Domosedan, Elanco Animal Health, UK) (0,02 – 0,04 mg/kg IV); and gastroscopy performed as previously described. Again, all endoscopic examinations were recorded and archived. For each foal, still-frame images were taken of the stomach from the MPRT, the dorsal part of the fundus, the MPGC, the MPLC, the glandular mucosa in the region of the pylorus and the proximal duodenum (Murray and Eichorn 1996).
4.3.1.4 Administration of sucrose and collection of samples
Immediately following gastroscopy, 1 g/kg body weight (BW) of sucrose (Kidesokeri 530, Sucros Oy, Finland) was administered as a 10% solution via nasogastric tube to each animal. Blood samples (10 ml) were then collected in vacuumed clot tubes from the jugular vein at 45 and 90 minutes after administration of sucrose. These time points were chosen based upon data from a previous study which indicated that peak sucrose concentrations occur approximately between 45 and 90 minutes after sucrose administration (Hewetson et al. 2006). Animals were not given access to food until the final blood sample had been collected to prevent ingestion of sucrose that may have been present in the food. Foals that were not yet weaned were also prevented from suckling milk until the final blood sample had been collected, as it has been demonstrated that lactose may permeate across a damaged gastric
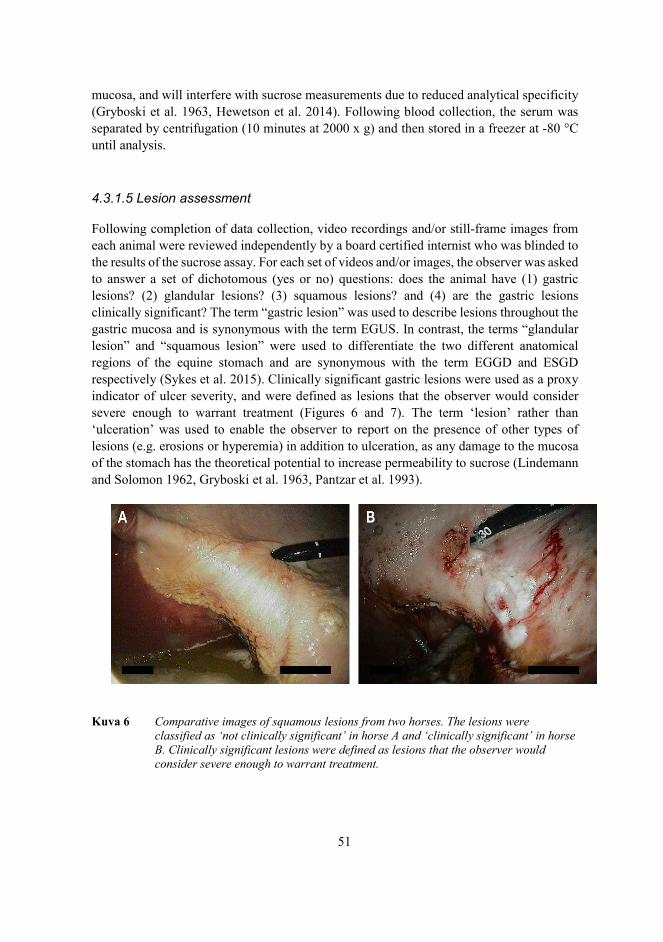
51
mucosa, and will interfere with sucrose measurements due to reduced analytical specificity (Gryboski et al. 1963, Hewetson et al. 2014). Following blood collection, the serum was separated by centrifugation (10 minutes at 2000 x g) and then stored in a freezer at -80 °C until analysis.
4.3.1.5 Lesion assessment
Following completion of data collection, video recordings and/or still-frame images from each animal were reviewed independently by a board certified internist who was blinded to the results of the sucrose assay. For each set of videos and/or images, the observer was asked to answer a set of dichotomous (yes or no) questions: does the animal have (1) gastric lesions? (2) glandular lesions? (3) squamous lesions? and (4) are the gastric lesions clinically significant? The term “gastric lesion” was used to describe lesions throughout the gastric mucosa and is synonymous with the term EGUS. In contrast, the terms “glandular lesion” and “squamous lesion” were used to differentiate the two different anatomical regions of the equine stomach and are synonymous with the term EGGD and ESGD respectively (Sykes et al. 2015). Clinically significant gastric lesions were used as a proxy indicator of ulcer severity, and were defined as lesions that the observer would consider severe enough to warrant treatment (Figures 6 and 7). The term ‘lesion’ rather than ‘ulceration’ was used to enable the observer to report on the presence of other types of lesions (e.g. erosions or hyperemia) in addition to ulceration, as any damage to the mucosa of the stomach has the theoretical potential to increase permeability to sucrose (Lindemann and Solomon 1962, Gryboski et al. 1963, Pantzar et al. 1993).
Kuva 6 Comparative images of squamous lesions from two horses. The lesions were classified as ‘not clinically significant’ in horse A and ‘clinically significant’ in horse B. Clinically significant lesions were defined as lesions that the observer would consider severe enough to warrant treatment.

52
Kuva 7 Comparative images of glandular lesions from two horses. The lesions were classified as ‘not clinically significant’ in horse A and ‘clinically significant’ in horse B. Clinically significant lesions were defined as lesions that the observer would consider severe enough to warrant treatment.
4.3.1.6 Inter-observer agreement
In order to assess the validity of the gastroscopy assessment, the observations for each animal were compared with observations made by two other board certified internists on the same set of video recordings and/or still-frame images, and the level of agreement was calculated. These observers were also blinded to the results of the sucrose assay.
4.3.1.7 Sample analyses
Serum was analyzed for sucrose using the previously validated GC-FID assay for quantifying sucrose in equine serum (Hewetson et al. 2014).
4.3.1.8 Statistical analysis
All statistical analyses were interpreted at the 5% level of significance. The distributional form of quantitative data was assessed by calculating descriptive statistics, plotting histograms and performing the Anderson-Darling test using commercially available software (MINITAB Statistical Software, Release 13.32, Minitab Inc, State College, PA, USA).
a. Traditional “gold standard” approach
Adult horses - The overall diagnostic accuracy of blood sucrose for diagnosis of GL; GDL; SQL; and CSL was assessed using ROC curves and calculating the AUC. For each

53
diagnostic criterion, sucrose concentration in blood at 45 and 90 minutes was compared with gastroscopy as the gold standard; and sensitivities and specificities were calculated across a range of sucrose concentrations. Optimal cut-off values were then selected manually to optimize sensitivity and provide a practical threshold for practitioners in the field when screening adult horses for EGUS.
Weanling foals - The prevalence of gastric lesions identified using gastroscopy was estimated pre-weaning and post-weaning and formally compared using mixed-effects logistic regression that incorporated a random effect term to account for the repeated measures study design. For each lesion type, sucrose concentration in blood at 45 and 90 minutes was then compared to gastroscopy as the gold standard; and sensitivities and specificities were calculated across a range of sucrose concentrations using mixed-effects logistic regression to account for the repeated observations on the same foals. All mixed effects regression models were implemented using commercially available software (IBM SPSS Statistics Version 23, International Business Machines Corp., Armonk, NY, USA). The overall diagnostic accuracy of blood sucrose for diagnosis of GL; GDL; SQL; and CSL was assessed using ROC curves and calculating the AUC. The area under the curve was estimated using a bootstrap simulation approach that has been described previously but modified to account for the repeated measures study design (Fosgate et al. 2003, Liu et al. 2005). AUC of the two sucrose concentration measurements were statistically compared within the same bootstrap algorithm. Simulations were performed by writing Visual Basic code in a spreadsheet program (Excel, MS Office 2010, Microsoft Corporation, Redmond, WA, USA) and iterating using commercially available software (@Risk, Version 6.3.1, Palisade Corporation, Ithaca, NY, USA). The optimal cut-off for blood sucrose concentration was determined by calculating Youden’s index (Youden 1950) and a modified version that weighted sensitivity twice as important as specificity (sensitivity * 1.33 + specificity * 0.67 – 1). Sensitivity was optimized to provide a practical threshold for practitioners in the field when screening foals for EGUS.
b. Bayesian latent class analysis Sensitivity, specificity and lesion prevalence were subsequently estimated for adult horses and weanling foals using a Bayesian latent class (LC) model that was based on the assumption that gastroscopy is an imperfect test. The model is based on the Hui-Walter paradigm but modified for a Bayesian analysis (Hui and Walter 1980, Enøe et al. 2000). The model included adjustment for conditional dependence (Vacek 1985) between the two sucrose concentration tests and similar diagnostic test models have been described in more detail elsewhere (Scott et al. 2007, Fosgate et al. 2010). The base model was a three test [Sucrose_45, Sucrose_90, endoscopy]; and single population model (adult horses) or two population [pre-weaning, post-weaning] model (weanling foals), that included adjustment for conditional dependence in sensitivity and specificity estimates for the two sucrose concentration assays.

54
For adult horses, sucrose concentrations measured at 45 and 90 minutes post-administration were dichotomized into positive and negative using the selected cut-off values for diagnosis of GL; GDL; SQL; and CSL respectively. For weanling foals, sucrose concentrations measured at 45 minutes and 90 minutes were dichotomized into positive and negative based on the optimal cut-off identified using Youden’s index in the traditional analysis that assumed gastroscopy was a perfect gold standard
Diffuse, mildly informative, prior probability distributions (Tables 2a and 2b) were
elicited based on published literature and expert opinion (Andrews et al. 2002, Elfenbein and Sanchez 2012). Non-informative priors were used for the sucrose concentrations assay since prior information was lacking at the time of the study. Markov chain Monte Carlo (MCMC) techniques were implemented in available statistical software (WinBUGS Version 1.4, MRC Biostatistics Unit, Cambridge, UK). Iterate values of the MCMC process were expected to be highly correlated and only every 10th iterate was retained to alleviate this concern. Convergence was determined by evaluating plots of model parameter iterates and by calculating the Gelman-Rubin statistic (Toft et al. 2005). The first 200,000 iterations were discarded as the burn-in and deductions were made based on the subsequent 40,000. Median values were used as point estimates and 95% probability intervals (PI) were calculated as the 2.5th to 97.5th percentiles of the posterior distributions.
Table 2a. Beta prior probability distributions used in the Bayesian latent class analysis to estimate sensitivity and specificity of test to identify EGUS in adult horses.
Population and tests Measure
Prior probability
distribution ( ) Mean Median
90% probability
interval Ulcer Prevalence 5,5 0.50 0.50 0.251, 0.749
Endoscopy Sensitivity 8, 2 0.80 0.82 0.571, 0.959
Specificity 99, 1 0.99 0.99 0.970, 0.999
Sucrose 45 Sensitivity 5,5 0.50 0.50 0.251, 0.749 Specificity 5,5 0.50 0.50 0.251, 0.749
Sucrose 90 Sensitivity 5,5 0.50 0.50 0.251, 0.749 Specificity 5,5 0.50 0.50 0.251, 0.749
*Uniform (non-informative) prior where all values between 0 and 1 are equally likely.

55
Table 2b. Beta prior probability distributions used in the Bayesian latent class analysis to estimate sensitivity and specificity of test to identify EGUS in weanling foals.
Population and tests Measure
Prior probability
distribution ( ) Mean Median
90% probability
interval Pre-weaning Prevalence 2,8 0.20 0.18 0.041, 0.388
Post-weaning Prevalence 6,4 0.60 0.61 0.345, 0.831
Endoscopy Sensitivity 8, 2 0.80 0.82 0.571, 0.959 Specificity 99, 1 0.99 0.99 0.970, 0.999
Sucrose 45 Sensitivity 1, 1 0.50 0.50 0.025, 0.975 Specificity 1, 1 0.50 0.50 0.025, 0.975
Sucrose 90 Sensitivity 1, 1 0.50 0.50 0.025, 0.975 Specificity 1, 1 0.50 0.50 0.025, 0.975
*Uniform (non-informative) prior where all values between 0 and 1 are equally likely.
c. Inter-observer agreement
Inter-observer agreement was summarized as the percentage of perfect (100%) agreements between observers for each diagnostic criterion. For the purposes of this study, the Kappa coefficient (K) was calculated. The Kappa coefficient was used in this study rather than the Kendall’s W as it measures agreement between two or more observers on nominal data, where the numbers are simply labels (yes or no) and have no scaler relationship, as was the case for the feasibility study, in which the observers were ranking the gastric ulcers observed on a four-point verbal rating scale.

56
5 Results
5.1 Feasibility
5.1.1 Determination of the feasibility of the sucrose blood test for assessment of gastric permeability in horses with gastric ulceration (I)
5.1.1.1 Study population
Horses comprised 1 Thoroughbred, 8 Quarter horses, 2 Arabians and 1 Peruvian Paso. Nine horses were geldings and 3 horses were mares. Horses ranged from 3 to 14 years of age (median, 7 years). Body weight ranged from 380 to 560 kg (median, 480 kg).
5.1.1.2 Gastroscopy
The overall prevalence of gastric ulcers was 83%. The frequency and severity of gastric ulceration was greatest in the squamous epithelium on the right side of the stomach and the lesser curvature along the margo plicatus. Ulceration was less severe or not evident at all along the greater curvature and in the dorsal fundus. No ulcers were detected at the pylorus or in the endoscopically visible glandular portion of the stomach in any of the 10 affected horses.
Ulcer scores ranged from 0 to 3 (median ulcer score, 1). Two horses had a mode ulcer
score of 0 (17%), five horses had a mode ulcer score of 1 (42%), three horses had a mode ulcer score of 2 (25%), and two horses had a mode ulcer score of 3 (17%). None of the aforementioned horses demonstrated abdominal discomfort or other clinical signs consistent with gastric ulceration.
5.1.1.3 Gastric sucrose permeability
All 12 horses that were subjected to sucrose permeability testing tolerated nasogastric intubation and no adverse effects were noted following administration of the sucrose solution. On analysis of the serum samples, all horses demonstrated an increase in serum sucrose concentration following nasogastric administration of sucrose (Figure 8). The increase from baseline was significant for horses with moderate to severe ulceration [grade 2 and grade 3] at 30, 45, 60 and 90 minutes [p<0.05].
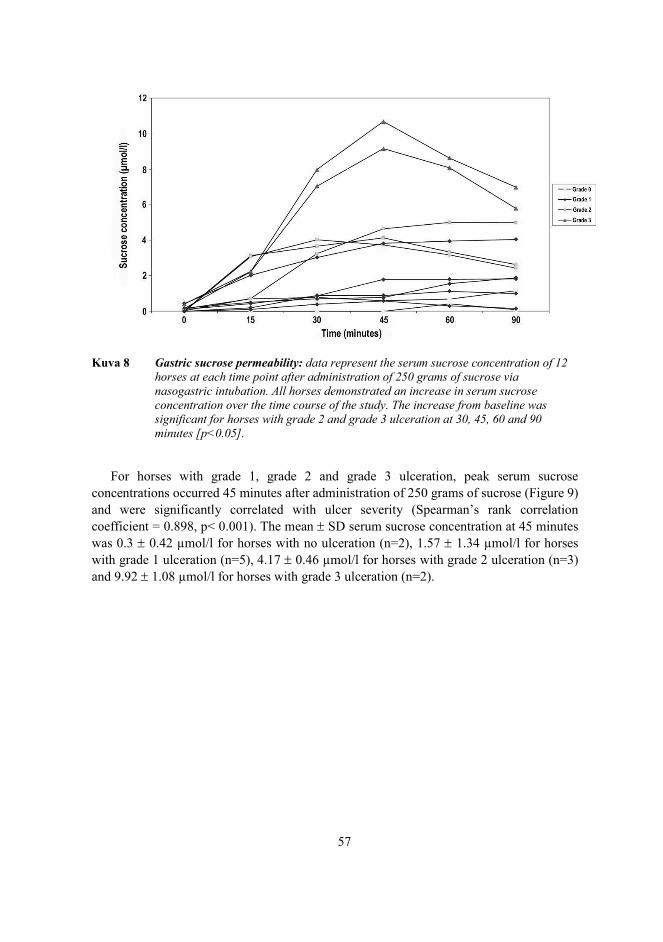
57
Kuva 8 Gastric sucrose permeability: data represent the serum sucrose concentration of 12 horses at each time point after administration of 250 grams of sucrose via nasogastric intubation. All horses demonstrated an increase in serum sucrose concentration over the time course of the study. The increase from baseline was significant for horses with grade 2 and grade 3 ulceration at 30, 45, 60 and 90 minutes [p<0.05].
For horses with grade 1, grade 2 and grade 3 ulceration, peak serum sucrose concentrations occurred 45 minutes after administration of 250 grams of sucrose (Figure 9) and were significantly correlated with ulcer severity (Spearman’s rank correlation coefficient = 0.898, p< 0.001). The mean SD serum sucrose concentration at 45 minutes was 0.3 0.42 μmol/l for horses with no ulceration (n=2), 1.57 1.34 μmol/l for horses with grade 1 ulceration (n=5), 4.17 0.46 μmol/l for horses with grade 2 ulceration (n=3) and 9.92 1.08 μmol/l for horses with grade 3 ulceration (n=2).
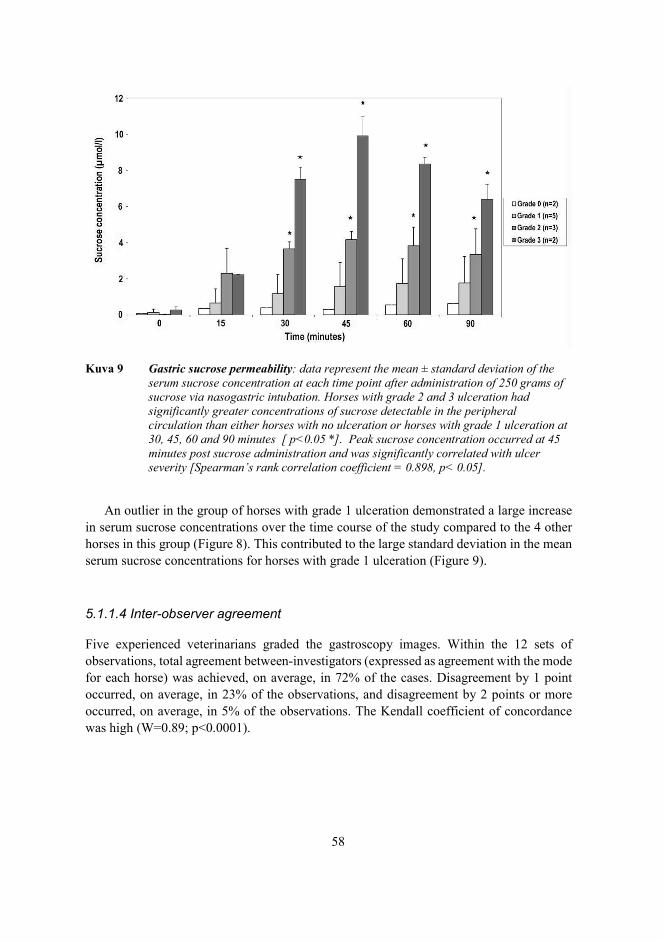
58
Kuva 9 Gastric sucrose permeability: data represent the mean ± standard deviation of the serum sucrose concentration at each time point after administration of 250 grams of sucrose via nasogastric intubation. Horses with grade 2 and 3 ulceration had significantly greater concentrations of sucrose detectable in the peripheral circulation than either horses with no ulceration or horses with grade 1 ulceration at 30, 45, 60 and 90 minutes [ p<0.05 *]. Peak sucrose concentration occurred at 45 minutes post sucrose administration and was significantly correlated with ulcer severity [Spearman’s rank correlation coefficient = 0.898, p< 0.05].
An outlier in the group of horses with grade 1 ulceration demonstrated a large increase in serum sucrose concentrations over the time course of the study compared to the 4 other horses in this group (Figure 8). This contributed to the large standard deviation in the mean serum sucrose concentrations for horses with grade 1 ulceration (Figure 9).
5.1.1.4 Inter-observer agreement
Five experienced veterinarians graded the gastroscopy images. Within the 12 sets of observations, total agreement between-investigators (expressed as agreement with the mode for each horse) was achieved, on average, in 72% of the cases. Disagreement by 1 point occurred, on average, in 23% of the observations, and disagreement by 2 points or more occurred, on average, in 5% of the observations. The Kendall coefficient of concordance was high (W=0.89; p<0.0001).
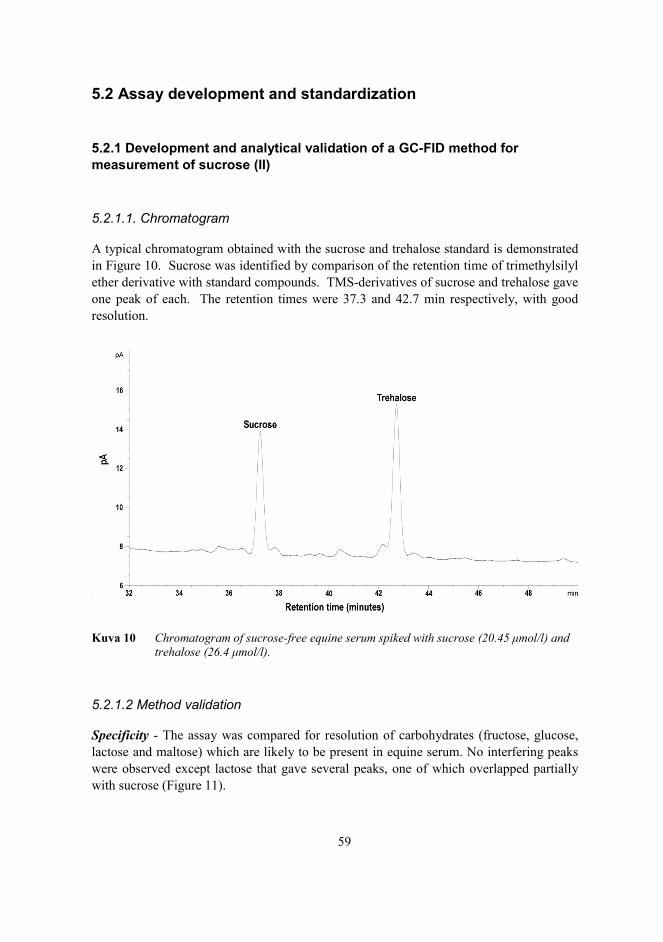
59
5.2 Assay development and standardization
5.2.1 Development and analytical validation of a GC-FID method for measurement of sucrose (II)
5.2.1.1. Chromatogram
A typical chromatogram obtained with the sucrose and trehalose standard is demonstrated in Figure 10. Sucrose was identified by comparison of the retention time of trimethylsilyl ether derivative with standard compounds. TMS-derivatives of sucrose and trehalose gave one peak of each. The retention times were 37.3 and 42.7 min respectively, with good resolution.
Kuva 10 Chromatogram of sucrose-free equine serum spiked with sucrose (20.45 μmol/l) and trehalose (26.4 μmol/l).
5.2.1.2 Method validation
Specificity - The assay was compared for resolution of carbohydrates (fructose, glucose, lactose and maltose) which are likely to be present in equine serum. No interfering peaks were observed except lactose that gave several peaks, one of which overlapped partially with sucrose (Figure 11).

60
Kuva 11 Chromatogram separation of lactose and maltose. The first lactose peak partially overlaps with sucrose, which has a retention time of 37.3 min. Glucose and fructose eluted earlier and are not shown in this figure.
Linearity - The calibration curve was linear over the concentration range. The linearity parameters are summarized in Table 3.
Range - The assay provided an acceptable degree of linearity, accuracy and precision at concentrations of sucrose as low as 2.34 μmol/L and as high as 20.45 μmol/L.
Accuracy - Percentage recovery of sucrose from serum was 89 – 102%.
Precision (repeatability and intermediate precision) - Repeatability and intermediate precision (RSD%) ranged from 3.6 to 6.7 % and 4.1 to 9.3 % respectively.
Detection and quantitation limits - The minimum concentration of sucrose that could be reliably detected in equine serum was 0.73 μmol/L (signal to noise ratio of 3:1); and the minimum concentration of sucrose that could be quantitatively determined was 2.34 μmol/L (signal to noise ratio 10:1) (Table 3).
Robustness - The assay was precise under a variety of storage conditions, with % recovery ranging from 72 to 105 % (Table 4).

61
Table 3. Detection properties of gas chromatography (GC) flame ionization detection (FID) for sucrose in equine serum
GC-FID detection properties Sucrose Calibration range 2.34 to 20.45 μmol/L Linearity r2 0.9998 Slope of regression line 0.0001 Regression line intercept 0.0055 Detection limit 0.73 μmol/L Quantitation limit 2.34 μmol/L
Table 4. Robustness of gas chromatography (GC) flame ionization detection (FID) for detection of sucrose in equine serum when exposed to different storage conditions
Storage conditions Recovery % Storage of whole blood 6h at room temperature 100 Storage of whole blood 18h at room temperature 72-102 Storage of serum 24h at room temperature 88-102 Storage of serum 24h at + 4C 87-102 Storage of serum 48h at + 4C 92-99 Storage of serum 72h at + 4C 93-105
System suitability - Ten horses with and without gastric ulceration were subjected to sucrose permeability testing. Five horses had endoscopic evidence of gastric ulceration and 5 horses had normal stomachs. The median ulcer score for horses with gastric ulceration was 3 (range 3 to 4), and lesions were distributed in the glandular and non-glandular mucosa in all cases. On analysis of the serum samples, all horses demonstrated an increase in serum sucrose concentration over time following nasogastric administration of sucrose. The increase from baseline was significant for horses with gastric ulceration at 45 minutes (p = 0.082) and 90 minutes (p = 0.082) when compared to healthy horses (Figure 12). The mean ± SD serum sucrose concentration at 45 minutes was 2.57 ± 0.32 μmol/L for horses with no ulceration (n=5), and 11.16 ± 3.52 μmol/L for horses with ulceration (n=5). The mean ± SD serum sucrose concentration at 90 minutes was 2.97 ± 0.97 μmol/L for horses with no ulceration (n=5), and 12.75 ± 4.68 μmol/L for horses with ulceration (n=5). Peak serum sucrose concentrations occurred 90 minutes after administration of sucrose.

62
Kuva 12 Gastric sucrose permeability: box and whisker plot of serum sucrose concentrations from horses with (n = 5) and without (n = 5) gastric ulceration at 0, 45, and 90 min after administration of 500 g of sucrose via nasogastric intubation. Horses with gastric ulceration (shaded boxes) had significantly greater concentrations of sucrose detectable in the peripheral circulation than horses with no ulceration (non-shaded boxes) at 45 and 90 min (*P < 0.05).
5.3 Determination of the performance characteristics of the test
5.3.1 Diagnostic accuracy of blood sucrose as a screening test for equine gastric ulcer syndrome in adult horses and weanling foals (III, IV)
5.3.1.1 Study populations
Adult horses - One hundred and one adult horses were accepted into the study. There were 59 mares, 4 stallions, and 38 geldings. Horses ranged from 2 to 22 years of age (median, 9.9 years). Body weight ranged from 400 to 683 kg (median, 518 kg). Breeds included 37/101 Warmbloods, 25/101 Finnhorses, 34/101 Standardbreds, 3/101 Welsh Ponies, 1/101 Trakhener, and 1/101 Arab. Horses were used for a variety of purposes, including eventing,

63
show jumping, dressage, trotting and general riding purposes. Fifty three horses were demonstrating clinical signs suggestive of EGUS at the time of gastroscopy.
Weanling foals - A total of 90 data sets were collected, comprising 45 weanling Warmblood foals that were subjected to gastroscopy and sucrose permeability testing on 2 occasions: 7 days before and 14 days after weaning. There were 26 colts and 19 fillies. At the time of testing, foals ranged from 182 to 200 days of age (median, 190 days). Body weight ranged from 207 to 303 kg (median, 253 kg). None of the foals in this study had been reported to be demonstrating clinical signs consistent with gastric ulceration at the time of gastroscopy.
5.3.1.2 Gastroscopy
Adult horses - Using the traditional gold standard approach, overall prevalence of gastric lesions (ulcers or erosions) was 83%. Lesions were most common in the glandular mucosae (70%), followed by the squamous mucosae (53%). Fifty eight percent of the horses had gastric lesions that were severe enough to be considered clinically significant i.e. requiring treatment (Table 5). Squamous lesions were most frequently observed in the region of the cardia and along the lesser curvature of the stomach adjacent to the margo plicatus; and consisted primarily of small single ulcers characteristic of EGUS severity score ≤ 2 (Figure 13). Glandular lesions were exclusively observed around the pylorus and consisted primarily of focal raised hemorrhagic or fibrinous lesions.
Table 5. Prevalence of gastric lesions identified via endoscopy in 101 adult horses
Gold standard* Bayesian LC† Lesion type Prevalence % (95% CI) Prevalence % (95% PI) GL 83 (75, 90) 85 (75, 93) GDL 70 (61, 79) 82 (72, 92) SQL 53 (44, 63) 73 (62, 85) CSL 58 (49, 68) 77 (64, 89)
LC = latent class. CI = confidence interval. PI = probability interval; Bayesian analog of the confidence interval. GL = gastric lesion. GDL = glandular lesion. SQL = squamous lesion. CSL = clinically significant lesion *Calculated relative to direct observation of lesions via endoscopy as the gold standard †Based on Bayesian latent class analysis and endoscopy assumed to be an imperfect test

64
Kuva 13 Representative images of the type of gastric lesions seen on gastroscopy in adult horses that were subjected to gastroscopy and subsequent sucrose testing. Squamous lesions were most frequently observed in the region of the cardia and along the lesser curvature of the stomach adjacent to the margo plicatus; and consisted primarily of small single ulcers characteristic of EGUS severity score ≤ 2 (black arrow) (A). Glandular lesions were exclusively observed around the pylorus and consisted primarily of focal raised hemorrhagic or fibrinous lesions (black arrow) (B).
Weanling foals - Using the traditional gold standard approach, the prevalence of gastric lesions in foals prior to weaning was 21%; with a similar proportions of foals affected by squamous lesions (7%) and glandular lesions (9%) (Table 6). In comparison, the prevalence of gastric lesions in foals after weaning was 98%, with a predominance of squamous lesions (97%) over glandular lesions (59%) (Table 6). The incidence rate over the period between samplings was 30% new cases with gastric lesions per foal week. Squamous lesions were most frequently observed in the region of the cardia and along the lesser curvature of the stomach adjacent to the margo plicatus. The lesions varied from large focal ulcers to extensive lesions with areas of apparent deep ulceration and active hemorrhage (Figure 14). Glandular lesions were most frequently observed around the pylorus and consisted of focal or multifocal flat hemorrhagic or fibrinous lesions, often surrounded by a region of intense hyperemia (Figure 14). Ulcer severity varied from mild to severe, with a marked increase in the prevalence of clinically significant lesions following weaning (Table 6).

65
Table 6. Prevalence of gastric lesions identified via endoscopy in 45 weanling foals
Pre-weaning Post-weaning
Gold standard* Bayesian LC† Gold standard* Bayesian LC†
Lesion type
Prevalence %
(95% CI)
Prevalence %
(95% PI)
Prevalence %
(95% CI)
Prevalence %
(95% PI)
GL 21 (9, 42) 42 (29, 57) 98 (93, 100) 92 (83, 98)
GDL 9 (4, 20) 36 (23, 51) 59 (40, 76) 88 (77, 95)
SQL 7 (3, 19) 36 (21, 50) 97 (89, 99) 92 (83, 98)
CSL 8 (3, 19) 37 (24, 51) 82 (65, 92) 91 (81, 97)
LC = latent class. CI = confidence interval. PI = probability interval; Bayesian analog of the confidence interval. GL = gastric lesion. GDL = glandular lesion. SQL = squamous lesion. CSL = clinically significant lesion *Calculated relative to direct observation of lesions via endoscopy as the gold standard but adjusted for repeated measurements using mixed-effects logistic regression †Based on Bayesian latent class analysis with sucrose tests evaluated at the 24 μmol/L cut-off and endoscopy assumed to be an imperfect test
Kuva 14 Representative images of the type of gastric lesions seen on gastroscopy in weanling foals that were subjected to gastroscopy and subsequent sucrose testing pre- and post-weaning. Squamous lesions were most frequently observed in the region of the cardia and along the lesser curvature of the stomach adjacent to the margo plicatus. The lesions varied from large focal ulcers to extensive lesions with areas of apparent deep ulceration and active hemorrhage (black arrow) (A). Glandular lesions were most frequently observed around the pylorus and consisted of focal or multifocal flat hemorrhagic or fibrinous lesions, often surrounded by a region of intense hyperemia (black arrow) (B)
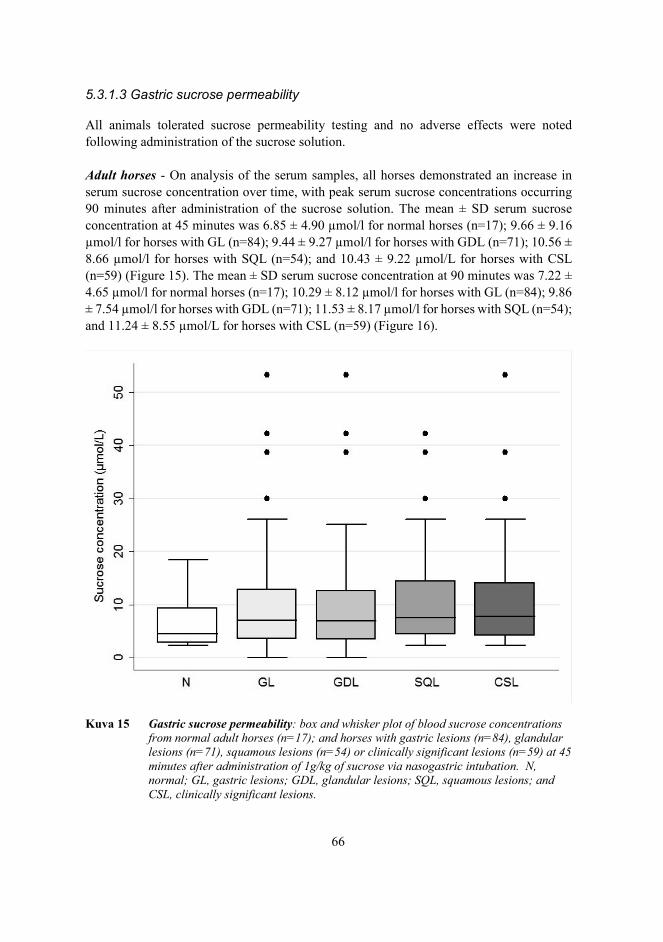
66
5.3.1.3 Gastric sucrose permeability
All animals tolerated sucrose permeability testing and no adverse effects were noted following administration of the sucrose solution. Adult horses - On analysis of the serum samples, all horses demonstrated an increase in serum sucrose concentration over time, with peak serum sucrose concentrations occurring 90 minutes after administration of the sucrose solution. The mean ± SD serum sucrose concentration at 45 minutes was 6.85 ± 4.90 μmol/l for normal horses (n=17); 9.66 ± 9.16 μmol/l for horses with GL (n=84); 9.44 ± 9.27 μmol/l for horses with GDL (n=71); 10.56 ± 8.66 μmol/l for horses with SQL (n=54); and 10.43 ± 9.22 μmol/L for horses with CSL (n=59) (Figure 15). The mean ± SD serum sucrose concentration at 90 minutes was 7.22 ± 4.65 μmol/l for normal horses (n=17); 10.29 ± 8.12 μmol/l for horses with GL (n=84); 9.86 ± 7.54 μmol/l for horses with GDL (n=71); 11.53 ± 8.17 μmol/l for horses with SQL (n=54); and 11.24 ± 8.55 μmol/L for horses with CSL (n=59) (Figure 16).
Kuva 15 Gastric sucrose permeability: box and whisker plot of blood sucrose concentrations from normal adult horses (n=17); and horses with gastric lesions (n=84), glandular lesions (n=71), squamous lesions (n=54) or clinically significant lesions (n=59) at 45 minutes after administration of 1g/kg of sucrose via nasogastric intubation. N, normal; GL, gastric lesions; GDL, glandular lesions; SQL, squamous lesions; and CSL, clinically significant lesions.

67
Kuva 16 Gastric sucrose permeability: box and whisker plot of blood sucrose concentrations from normal adult horses (n=17); and horses with gastric lesions (n=84), glandular lesions (n=71), squamous lesions (n=54) or clinically significant lesions (n=59) at 90 minutes after administration of 1g/kg of sucrose via nasogastric intubation. N, normal; GL, gastric lesions; GDL, glandular lesions; SQL, squamous lesions; and CSL, clinically significant lesions.
Weanling foals - On analysis of the serum samples pre- and post-weaning, all foals demonstrated an increase in sucrose concentration over time following nasogastric administration of sucrose, and there was a strong positive correlation between sucrose concentrations at 45 and 90 minutes (Figure 17).
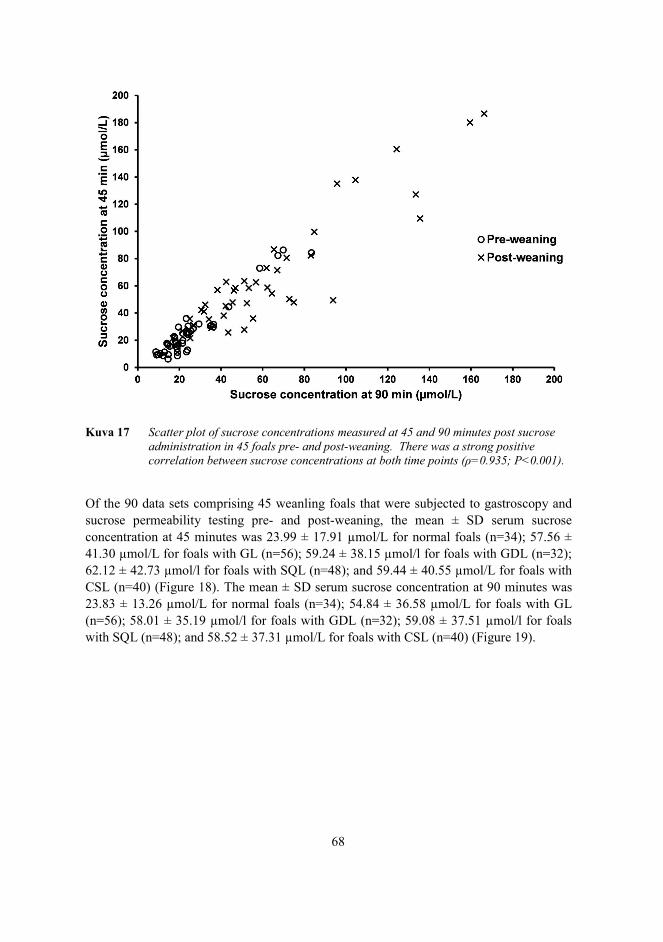
68
Kuva 17 Scatter plot of sucrose concentrations measured at 45 and 90 minutes post sucrose administration in 45 foals pre- and post-weaning. There was a strong positive correlation between sucrose concentrations at both time points (ρ=0.935; P<0.001).
Of the 90 data sets comprising 45 weanling foals that were subjected to gastroscopy and sucrose permeability testing pre- and post-weaning, the mean ± SD serum sucrose concentration at 45 minutes was 23.99 ± 17.91 μmol/L for normal foals (n=34); 57.56 ± 41.30 μmol/L for foals with GL (n=56); 59.24 ± 38.15 μmol/l for foals with GDL (n=32); 62.12 ± 42.73 μmol/l for foals with SQL (n=48); and 59.44 ± 40.55 μmol/L for foals with CSL (n=40) (Figure 18). The mean ± SD serum sucrose concentration at 90 minutes was 23.83 ± 13.26 μmol/L for normal foals (n=34); 54.84 ± 36.58 μmol/L for foals with GL (n=56); 58.01 ± 35.19 μmol/l for foals with GDL (n=32); 59.08 ± 37.51 μmol/l for foals with SQL (n=48); and 58.52 ± 37.31 μmol/L for foals with CSL (n=40) (Figure 19).

69
Kuva 18 Gastric sucrose permeability: Box and whisker plot of blood sucrose concentrations from normal weanling foals (n=34); and foals with gastric lesions (n=56), glandular lesions (n=32), squamous lesions (n=48) or clinically significant lesions (n=40) at 45 minutes after administration of 1g/kg of sucrose via nasogastric intubation. N, normal; GL, gastric lesions; GDL, glandular lesions; SQL, squamous lesions; and CSL, clinically significant lesions.
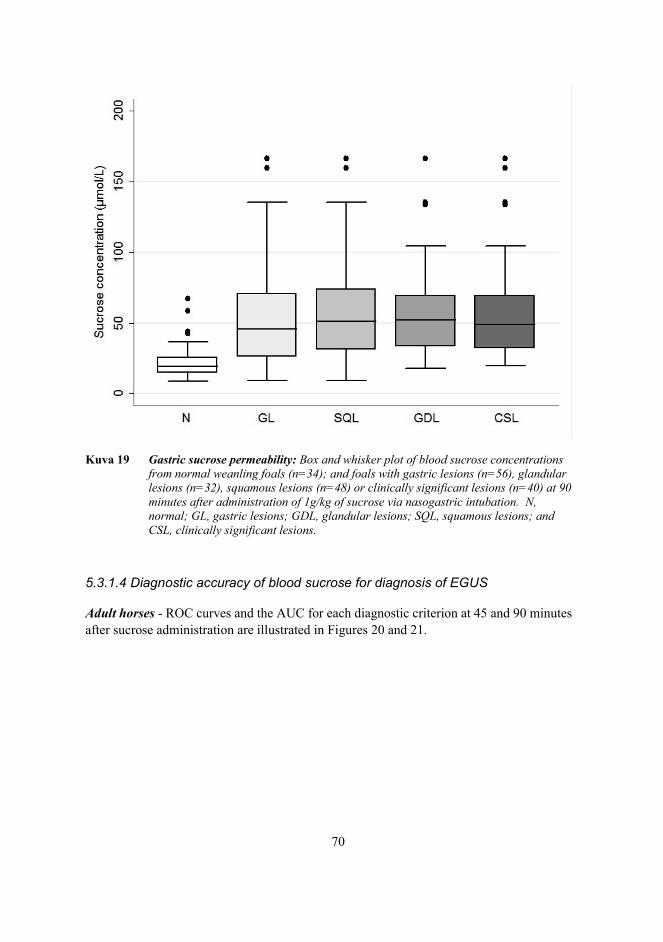
70
Kuva 19 Gastric sucrose permeability: Box and whisker plot of blood sucrose concentrations from normal weanling foals (n=34); and foals with gastric lesions (n=56), glandular lesions (n=32), squamous lesions (n=48) or clinically significant lesions (n=40) at 90 minutes after administration of 1g/kg of sucrose via nasogastric intubation. N, normal; GL, gastric lesions; GDL, glandular lesions; SQL, squamous lesions; and CSL, clinically significant lesions.
5.3.1.4 Diagnostic accuracy of blood sucrose for diagnosis of EGUS
Adult horses - ROC curves and the AUC for each diagnostic criterion at 45 and 90 minutes after sucrose administration are illustrated in Figures 20 and 21.

71
Kuva 20 Receiver-operating characteristic (ROC) curves depicting the ability of blood sucrose concentration to predict the presence of gastric lesions, glandular lesions, squamous lesions or clinically significant lesions in adult horses at 45 mins after administration of 1g/kg of sucrose via nasogastric intubation. AUC, area under the curve; GL, gastric lesions; GDL, glandular lesions; SQL, squamous lesions; and CSL, clinically significant lesions.

72
Kuva 21 Receiver-operating characteristic (ROC) curves depicting the ability of blood sucrose concentration to predict the presence of gastric lesions, glandular lesions, squamous lesions or clinically significant lesions in adult horses at 90 mins after administration of 1g/kg of sucrose via nasogastric intubation. AUC, area under the curve; GL, gastric lesions; GDL, glandular lesions; SQL, squamous lesions; and CSL, clinically significant lesions.
Sucrose concentrations of 4.61 μmol/l at 45 minutes and 4.57 μmol/l at 90 minutes were selected as the optimal cut-offs for discriminating between normal horses and horses with GL. Sucrose concentrations of 5.80 μmol/l at 45 minutes and 6.05 μmol/l at 90 minutes were selected as the optimal cut-offs for discriminating between normal horses and horses with GDL. Sucrose concentrations of 7.86 μmol/l at 45 minutes and 8.24 μmol/l at 90 minutes were selected as the optimal cut-offs for discriminating between normal horses and horses with SQL. Sucrose concentrations of 4.61 μmol/L at 45 minutes and 5.87 μmol/L at 90 minutes were selected as the optimal cut-offs for discriminating between normal horses

73
and horses with CSL. Using the selected cut-off values, the sensitivity and specificity of blood sucrose at 45 and 90 minutes for diagnosis of GL; GDL; SQL; and CSL was calculated using traditional gold standard and Bayesian latent class analyses (Table 7).
Table 7. Diagnostic accuracy of blood sucrose for diagnosis of EGUS using traditional and Bayesian latent class analyses in 101 adult horses. Lesion type Test Parameter Gold standard* Bayesian LC†
Estimate % (95% CI) Estimate % (95% PI)
GL Sucrose 45a Sensitivity 67.9 (57.3, 77.2) 65.3 (54.9, 74.8) Specificity
52.9 (29.7, 75.2) 48.7 (26.8, 69.2)
Sucrose 90b Sensitivity 78.6 (68.8, 86.4) 78.3 (68.6, 85.8) Specificity
47.1 (24.8, 70.3)
57.3 (36.6, 78.4)
Endoscopy Sensitivity NA 79.4 (69.4, 88.6) Specificity NA 99.3 (96.1, 1.0) GDL Sucrose 45a Sensitivity 54.9 (43.3, 66.2) 52.3 (41.9, 62.5) Specificity 56.7 (38.7, 73.4) 71.2 (46.6, 88.8) Sucrose 90b Sensitivity 66.2 (54.6, 76.5) 64.4 (54.2, 73.5) Specificity 43.3 (26.6, 61.3) 31.6 (12.6, 57.3) Endoscopy Sensitivity NA 78.9 (67.0, 89.3) Specificity NA 99.3 (96.1, 1.0) SQL Sucrose 45a Sensitivity 50.0 (36.8, 63.2) 48.2 (37.3, 59.2) Specificity 68.1 (53.8, 80.2) 54.0 (29.4, 73.1) Sucrose 90b Sensitivity 57.4 (44.0, 70.0) 52.2 (41.0, 63.2) Specificity 72.3 (58.3, 83.7) 81.0 (60.9, 93.0) Endoscopy Sensitivity NA 76.9 (63.1, 88.3) Specificity NA 99.3 (96.1, 1.0) CSL Sucrose 45a Sensitivity 74.6 (62.4, 84.4) 68.3 (57.3, 78.1) Specificity 50.0 (35.1, 64.9) 56.3 (34.4, 76.2) Sucrose 90b Sensitivity 76.3 (64.2, 85.8) 69.6 (58.6, 79.3) Specificity 52.4 (37.4, 67.1) 61.0 (39.3, 80.4) Endoscopy Sensitivity NA 67.9 (56.3, 80.5) Specificity NA 99.3 (96.2, 1.0)
CI = confidence interval. PI = probability interval; Bayesian analog of the confidence interval. NA = not able to calculate since endoscopy is considered the gold standard reference test. *Calculated relative to direct observation of lesions via endoscopy as the gold standard †Based on Bayesian latent class analysis with sucrose tests evaluated at the respective cutoffsa,b and endoscopy assumed to be an imperfect test. aEvaluated cutoffs were 4.61 μmol/L, 5.80 μmol/L, 7.86 μmol/L, and 4.61 μmol/L for sucrose concentrations measured 45 minutes post-administration for diagnosis of GL, GDL, SQL, and CSL, respectively. bEvaluated cutoffs were 4.57 μmol/L, 6.05 μmol/L, 8.24 μmol/L, and 5.87 μmol/L for sucrose concentrations measured 90 minutes post-administration for diagnosis of GL, GDL, SQL, and CSL, respectively.

74
Weanling foals - ROC curves and the AUC for each diagnostic criterion at 45 and 90 minutes after sucrose administration are illustrated in figures 22-25.
Kuva 22 Receiver-operating characteristic (ROC) curves depicting the ability of blood sucrose concentration to predict the presence of a gastric lesion in weanling foals at 45 and 90 mins after administration of 1g/kg of sucrose via nasogastric intubation. The area under the curve (AUC) and 95% confidence intervals were 0.83 (0.74, 0.91) and 0.83 (0.75, 0.90) for 45 min and 90 min respectively (P=0.967).

75
Kuva 23 Receiver-operating characteristic (ROC) curves depicting the ability of blood sucrose concentration to predict the presence of a glandular lesion in weanling foals at 45 and 90 mins after administration of 1g/kg of sucrose via nasogastric intubation. The area under the curve (AUC) and 95% confidence intervals were 0.75 (0.64, 0.84) and 0.77 (0.66, 0.86) for 45 min and 90 min respectively (P=0.458).

76
Kuva 24 Receiver-operating characteristic (ROC) curves depicting the ability of blood sucrose concentration to predict the presence of a squamous lesion in weanling foals at 45 and 90 mins after administration of 1g/kg of sucrose via nasogastric intubation. The area under the curve (AUC) and 95% confidence intervals were 0.84 (0.76, 0.91) and 0.85 (0.77, 0.91) for 45 min and 90 min respectively (P=0.829).

77
Kuva 25 Receiver-operating characteristic (ROC) curves depicting the ability of blood sucrose concentration to predict the presence of a clinically significant lesion in weanling foals at 45 and 90 mins after administration of 1g/kg of sucrose via nasogastric intubation. The area under the curve (AUC) and 95% confidence intervals were 0.78 (0.67, 0.87) and 0.80 (0.69, 0.89) for 45 min and 90 min respectively (P=0.172).
A sucrose concentration of 24 μmol/L was selected as the optimal cut-off for discriminating between normal foals and foals with EGUS, irrespective of the type of lesion that was evident on gastroscopy (Figure 26). This was done to improve the practicality of the test for field purposes. Using the selected cut-off value, the sensitivity and specificity of blood sucrose at 45 and 90 minutes for diagnosis of GL; GDL; SQL; and CSL was calculated using traditional gold standard and Bayesian latent class analyses (Table 8).

78
Table 8. Diagnostic accuracy of blood sucrose for diagnosis of EGUS using traditional and Bayesian latent class analyses in 45 foals evaluated pre and post weaning Lesion type Test Parameter Gold standard* Bayesian LC†
Estimate % (95%CI)
Estimate % (95% PI)
GL Sucrose 45 Sensitivity 89 (78, 95) 89 (77, 97) Specificity
65 (47, 79)
83 (65, 95)
Sucrose 90 Sensitivity 84 (72, 92) 81 (69, 91) Specificity 71 (53, 84) 95 (80, 100) Endoscopy Sensitivity NA 81 (70, 90) Specificity NA 99 (95, 100) GDL Sucrose 45 Sensitivity 95 (79, 99) 97 (90, 100) Specificity 47 (34, 60) 87 (69, 98) Sucrose 90 Sensitivity 90 (73, 97) 91 (80, 99) Specificity 55 (42, 67) 97 (83, 100) Endoscopy Sensitivity NA 47 (36, 59) Specificity NA 99 (95, 100) SQL Sucrose 45 Sensitivity 89 (77, 96) 90 (78, 98) Specificity 55 (39, 70) 77 (55, 91) Sucrose 90 Sensitivity 87 (74, 94) 84 (72, 94) Specificity 64 (48, 78) 94 (76, 100) Endoscopy Sensitivity NA 75 (62, 87) Specificity NA 99 (94, 100) CSL Sucrose 45 Sensitivity 94 (80, 98) 95 (88, 99) Specificity 52 (38, 66) 89 (71, 99) Sucrose 90 Sensitivity 90 (75, 96) 89 (79, 97) Specificity 58 (44, 71) 98 (85, 100) Endoscopy Sensitivity NA 60 (48, 71) Specificity NA 99 (96, 100)
CI = confidence interval. PI = probability interval; Bayesian analog of the confidence interval. NA = not able to calculate since endoscopy is considered the gold standard reference test. GL = gastric lesion. GDL = glandular lesion. SQL = squamous lesion. CSL = clinically significant lesion *Calculated relative to direct observation of lesions via endoscopy as the gold standard †Based on Bayesian latent class analysis with sucrose tests evaluated at the 24 umol/L cutoff and endoscopy assumed to be an imperfect test

79
Kuva 26 Clinically significant gastric lesions in a foal characterized by deep ulceration in the squamous epithelium and active hemorrhage (black arrow). The image was obtained from the lesser curvature of the stomach along the margo plicatus. Blood sucrose concentration at 45 and 90 minutes for this foal was 35.4 and 34.3 μmol/L respectively. This foal would have been correctly identified as positive for EGUS using the blood sucrose test.
5.3.1.5 Inter-observer agreement
Adult horses - When asked to answer if each horse has (1) gastric lesions; (2) glandular lesions; (3) squamous lesions; and (4) are the gastric lesions clinically significant?; perfect agreement between-observers within the 101 sets of observations was achieved on average, in 83% (K = 0.50; P<0.0001; 95% CI = 0.24 to 0.76); 78% (K = 0.57; P<0.0001; 95% CI = 0.39 to 0.75); 74% (K = 0.65;P<0.0001; 95% CI = 0.53 to 0.77); and 75% (K = 0.62; P<0.0001; 95% CI = 0.48 to 0.75) of the cases respectively.
Weanling foals - When asked to answer if each foal has (1) gastric lesions; (2) glandular lesions; (3) squamous lesions; and (4) are the gastric lesions clinically significant?; perfect agreement between-observers within the 90 sets of observations was achieved on average,
80
in 62% (K = 0.46; P<0.0001; 95% CI = 0.28 to 0.64); 52% (K = 0.42; P<0.0001; 95% CI = 0.30 to 0.54); 68% (K = 0.67; P<0.0001; 95% CI = 0.55 to 0.79); and 75% (K = 0.56; P<0.0001; 95% CI = 0.29 to 0.54) of the cases respectively.

81
6 Discussion
The sensitivity, cost-effectiveness and non-invasive nature of permeability testing lends itself toward application for diagnostic screening and has been employed for many applications in the investigation of gastrointestinal disease in human medicine (Travis and Menzies 1992). This technology has recently been added to the diagnostic armoury of the veterinarian, where it has been particularly useful for the assessment of gastrointestinal mucosal integrity and its responses to therapeutic interventions (Hall and Batt 1990, Meddings et al. 1995, Rutgers et al. 1995, Rutgers et al. 1996, O'Conor et al. 2004, Klenner et al. 2009). To date, most of the permeability testing that has been done in animals involves the urinary recovery of ingested permeability markers like 51Cr-labelled EDTA, iohexol, lactulose, rhamnose and sucrose.
For the purposes of this doctoral thesis, the focus was on gastric ulceration in horses,
and the primary objective was to determine if increased permeability of the gastric mucosa could be used to detect gastric mucosal injury in horses. O’Conner and others have evaluated urine sucrose concentration for detection of gastric ulcers in horses (O'Conner et al. 2004), and reported that the apparent sensitivity and specificity of the test for detecting moderate to severe ulceration was 83% and 90%, respectively. These values are similar to those reported for sucrose permeability testing in other species (Sutherland et al. 1994, Kawabata et al. 1998) and indicates that sucrose permeability testing may be a useful non-invasive test for the detection and monitoring of gastric ulceration in the horse. Urine collection is unfortunately cumbersome, time consuming, and in the case of the horse, technically demanding to perform, and therefore the recovery of ingested sucrose in blood as a simple alternative to urine collection was of particular interest. This discussion summarises the development and validation of a sucrose blood test for diagnosis of gastric ulcers in horses, and includes initial feasibility testing, sucrose assay development and standardization; and subsequent field validation of the test; including determination of its performance characteristics in selected populations of horses and foals.
6.1 Feasibility
Using a small pilot study, it was demonstrated that blood would be a feasible alternative to urine when performing sucrose permeability testing in the horse (Hewetson et al. 2006). Data from twelve adult horses with naturally occurring gastric ulceration indicated that determination of sucrose concentration in equine blood following nasogastric administration of 250 grams of table sugar may be a useful test for identifying horses with endoscopically visible gastric ulceration; and formed the foundation for subsequent field validation of the test. Horses with moderate to severe gastric ulceration had a significant increase in serum sucrose concentration after administration of sucrose, and serum sucrose concentrations at 45 minutes post sucrose administration were correlated with ulcer severity. It was postulated that although a blood test will not replace gastroscopy, it will facilitate

82
diagnosis and may be a useful field screening test which can be used to identify animals affected with gastric ulceration. These animals could then be investigated further by endoscopic evaluation of the stomach and informed decisions about treatment could be made based upon the severity of ulceration observed. This would represent a significant cost saving for horse owners, particularly those who engage in performance related equine disciplines. From a veterinary perspective, a blood test would also have the added advantage of practicality, and would present veterinarians with an opportunity to screen for gastric ulcers in centers that do not have access to gastroscopy.
A prerequisite for a screening test is simplicity. Administration of sucrose and collection
of blood samples in this study was simple and was not associated with any complications. Consumption of large quantities of soluble carbohydrate has been associated with the development of laminitis (Garner et al. 1975) and was perceived to be a potential risk when administering sucrose to horses for the purposes of sucrose permeability testing. In order to try and minimise the risk, the dose of sucrose used in this feasibility study was reduced to half that which was used by O’Conner and others (O'Conner et al. 2004). At this dose, no clinical evidence of laminitis or other gastrointestinal disorders was noticed, yet it was still possible to detect sucrose in concentrations well above the detection limits of the assay; a factor that can be attributed to the enhanced sensitivity of LC/MS. The dose of sucrose in this study was fixed at 250 grams per horse. This was done in a bid to make the test as practical as possible for practitioners in the field, as in most cases they would not have access to a weigh scale. Unfotunately this resulted in a substantial variation in the total dose of sucrose received by each horse, as body weight ranged from 380 to 560 kg (median, 480 kg). This may have confounded the results, and consequently a dose per kilogram was used in subsequent studies.
The volume of the sucrose solution administered prior to testing was also carefully
considered. It was assumed that the volume of an empty, collapsed stomach is distinct from its volumic capacity (approximately 10 litres) and that 2.5 litres would be sufficient to expose the entire gastric mucosa to the probe molecule. It is possible however, that a significant quantity of air is introduced when passing the nasogastric tube, thereby increasing the volume of the stomach and potentially limiting the area of gastric mucosa exposed to sucrose. In practical terms, this limitation is offset by the fact that the large majority of gastric ulcers occur in the squamous epithelium at the level of margo plicatus and in the glandular mucosa; anatomical regions that are almost certainly bathed in sucrose, even when the solution is administered at low volumes. Despite this, the volume of the solution in subsequent studies was increased to approximately 5 liters to maximise the likelihood of the entire gastric mucosa being exposed to sucrose.
Serum sucrose concentrations in horses with moderate to severe gastric ulceration
(grades 2 or 3) were significantly elevated in comparison to normal horses and horses with mild ulceration (grades 0 and 1) at 30, 45, 60 and 90 minutes, with peak sucrose concentrations occurring between 45 and 90 minutes following sucrose administration. This suggests that there may be a range of times for collection of blood samples. Furthermore,
83
the half-life of sucrose in serum is approximately 70 minutes (Keith and Power 1937, Bauer et al. 1990). This would indicate that there is a window of approximately 2-3 hours following sucrose administration during which the veterinarian can obtain a meaningful blood sample for assessment of EGUS. Blood was therefore collected at 45 and 90 minutes after administration of sucrose in subsequent studies based on the premise that peak sucrose concentrations would likely occur at these time points.
For the purposes of this study, horses were fasted prior to sucrose administration and
were not fed concentrates as was done by O’Conner and others (O'Conner et al. 2004). It has been reported that serum samples obtained from horses that had not undergone a fasting period often contained high levels of saccharides, resulting in column overloading; and subsequently poor peak resolution and inability to detect treatment differences (D'Arcy-Moskwa et al. 2011). Furthermore, concentrate feed contains high concentrations of sucrose (as much as 9% for racehorses in training). Feeding concentrates to horses with gastric ulcers prior to sucrose testing will thus elevate sucrose concentrations in serum above baseline and result in decreased overall performance of the test by causing signal to noise interference and an inability to identify observable treatment effects. Concentrate feeding may also delay solid-phase gastric emptying (Wyse et al. 2001). While this may be perceived to be advantageous from the point of view of prolonging the time that sucrose has to permeate across the gastric mucosa, it may complicate interpretation of the results, as the rate of gastric emptying will depend on the type and amount of feed consumed and will differ from one horse to the other. Against this background, feed was withheld for a period of 16 hours (overnight fast) prior to sucrose testing in subsequent studies. Considering the fact that the half life of sucrose is approximately 70 minutes (Keith and Power 1937, Bauer et al. 1990), an overnight fast will allow ample time for urinary excretion of the majority of ration derived sucrose that may have permeated across the gastric mucosa; and in addition, will decrease variability in the rate of gastric emptying by excluding solid-phase emptying.
In this small study, high serum sucrose concentrations were detected in a single animal
deemed to have mild (grade 1) gastric ulceration. There may be several reasons for this discrepancy. On close examination of the still frame images for this horse, it was evident that several of the ulcers were actively bleeding. These ulcers may have represented a more severe pathological process than that which could have been accounted for using a visual scoring system. In a recent study which compared endoscopic and histological scoring of equine gastric ulcers in horses (Andrews et al. 2002), the endoscopist misclassified 57% of the ulcers as superficial, when, in fact, the ulcers were deep, involving the submucosa and tunica muscularis. This suggests that endoscopy may underestimate the severity of gastric ulceration and poses the question: Is sucrose permeability a more sensitive indicator of gastric ulcer severity than endoscopy in the horse? Investigators concluded in one study that increased sucrose permeability in dogs was correlated more closely with generalized mucosal damage than with discretely visible ulcers (Meddings et al. 1995) and this makes sense if you consider that sucrose permeability testing assesses the functional integrity of the entire gastric mucosa, and is not limited to that which is visually accessible. An alternative explanation is that the high serum sucrose concentrations in this individual may

84
have been the result of ulcers in the gastric glandular mucosa that were not detected during endoscopy. In the same study, Andrews et al. (2002) demonstrated that the number of gastric ulcers may be underestimated by the endoscopist and small glandular ulcers (approximately 5 mm diameter) may be missed due to inexperience, the presence of gastric contents or improper insufflation. Although great care was taken to ensure that as much of the gastric mucosa as possible could be visualised in every case, some horses still had fluid in the ventral portion of their stomachs on endoscopy, and the possibility exists that glandular lesions were missed. A third explanation as to why serum sucrose concentrations may have been elevated above that which was expected for this horse is because of variations in the rate of liquid-phase gastric emptying. In one study, investigators found that the rate of liquid phase emptying in normal horses varied from 27.9 to 87.3 minutes (Lohmann et al. 2000). Such variation could potentially complicate interpretation of the sucrose test, as delayed gastric emptying would mean that the sucrose solution has a longer period of time to permeate across the gastric mucosa.
A published verbal rating scale was used to grade ulcer severity in this study (Andrews
et al. 1999). The scale affords the observer one of four possible choices which are mutually exclusive (i.e. as an example, the scale does not make allowance for a score between 1 and 2). A mean or median score for 5 observers using such a scale would not necessarily be a whole number, and consequently the most frequently occurring, or repetitive value (mode) was chosen. Unfortunately there are limitations to this grading system. While it can be used to assess ulcer severity on a graded scale, it does not lend itself towards use as a measure of outcome in validation studies where a dichotomous (positive or negative) result is required for blind comparison to a gold standard. More importantly, this grading system is only relevant for ESGD, and there are currently no grading systems that can be used interchangeably for horses with both ESGD and EGGD (Sykes et al. 2015). Due consideration was given to the aforementioned limitations of this grading system when considering the study design for field validation of the test; and the four-point verbal rating rating scale was subsequently replaced by alternative measures of outcome which could be reported as a dichotomous result i.e. GL; GDL; SQL; and CSL.
Unfortunately the small sample size (n=12) and the limited number of controls (n=2)
was a major limiting factor in this study, however it must be pointed out that this was a pilot study, purely designed to assess the feasibility of a sucrose blood test for the detection of gastric ulcers in horses. A non-randomized cross over study design was initially considered, in which the same 12 horses would be studied after induction of gastric ulceration (Murray and Eichorn 1996) and then again following 28 days of treatment with omeprazole. Results after ulcer induction would be compared statistically with those after treatment with omeprazole to determine the feasibility of blood sucrose as a test for stomach ulceration. This methodology was never implemented however, primarily because of concerns that omeprazole may enhance paracellular permeability across the gastric mucosa, thus confounding the results (Hopkins et al. 2002). In addition, there were also concerns that treatment with omeprazole would not necessarily eliminate ulcers completely in all the treated horses, as reported healing rates in horses are only in the region of 70–80% following

85
a 28 days of treatment (Murray et al. 1997). Because of these limitations, a simple cross-sectional study design was used as an alternative. The same 12 horses were used, on the assumption that at least 37 % of them would be affected by naturally occurring gastric ulceration (Murray et al. 1989). Although it is not possible to draw definitive conclusions from such a small group of horses; the aim of the study was to use these preliminary data as a basis for subsequent cross-sectional studies in larger populations of horses and foals with and without naturally occurring gastric ulcer disease. By conducting the study using a small numbers of horses, any potential problems in methodology and data collection were identified, and preliminary estimates for planning a larger study were obtained without incurring unreasonable costs.
6.2 Assay development and standardization
In the feasibility study, serum sucrose concentrations were measured using liquid chromatography operating in tandem with electrospray mass spectrometry. The advantage of LC/MS over other reported methods is that it offers high sensitivity and mass selectivity without the need for extensive sample derivatization (D'Arcy-Moskwa et al. 2011). Liquid chromatography-mass spectrometry is expensive however, and the equipment is not routinely available in most veterinary laboratories. The development of a valid, yet practical and cost-effective method for quantifying sucrose in equine serum was therefore the first step in a larger project to develop and validate a blood test for detecting gastric ulcers in horses. In pursuit of this goal, a GC-FID method was developed, optimised and validated as a quantitative test intended to measure minute concentrations of sucrose present in equine serum, and its validity for this purpose was tested using the international conference on harmonisation (ICH) guidelines for validation of analytical procedures (International Conference on Harmonisation 1995, International Conference on Harmonisation 1997). The results of this study indicate that the GC-FID method is valid; and can be applied to the assessment of gastrointestinal permeability in the horse (Hewetson et al. 2014).
From a technical point of view, the development of a GC-FID method for determination
of sucrose in equine serum was based upon the innate chemical properties of sucrose and the fact that low concentrations of sucrose needed to be identified and quantified in equine serum. Standards and selected test samples were prepared in sucrose-free serum that was obtained by pooling serum from healthy horses that had been fasted for 16 hours. The average half-empty time (t1/2) for solid phase and liquid phase emptying of the equine stomach is 3.8 and 1.5 hours respectively (Sutton et al. 2003, Sasaki et al. 2005), and the approximate half-life of sucrose is 70 minutes (Keith and Power 1937, Bauer et al. 1990). Thus, a 16 hour fast should have allowed ample time for passage of ingesta from the stomach into the small intestine, and urinary excretion of any food derived sucrose that may have permeated across the gastric mucosa, therefore ensuring that the serum was free of sucrose prior to pooling.

86
The final concentrations for the sucrose standards were selected based on data from the feasibility study which indicated that the analytical range for sucrose in serum for the purposes of permeability testing was approximately 2.34 to 20.45 μmol/L (Hewetson et al. 2006). The samples were quantified using the peak area ratio between sucrose and the internal standard, trehalose. This method of quantification was used because it has been reported to be more reproducible than the use of absolute peak area for sucrose (Rodriguez et al. 2009). Trehalose was used as an internal standard because 1) it does not normally exist in equine serum, 2) its retention time differs significantly from sucrose, and 3) like sucrose, it is a non-reducing sugar and thus can be derivatized without oximation. Different precipitation solvents (methanol, ethanol, acetone and mixture of acetonitrile-water) were tested. Recovery of sucrose from serum was best when a mixture of acetonitrile-water (90:10) was used.
Sucrose is a highly polar, non-volatile substance, thus it requires chemical derivatization
before gas chromatography (GC) analysis. When analysing with GC under normal circumstances, reducing sugars have to be transformed to an oxime before TMS derivatization to decrease the number of chromatographic peaks. However, because sucrose is a non-reducing sugar, it can be directly derivatized without oximation; a process which has been reported to cause the degradation of sucrose (Gullberg et al. 2004). Trimethylsilylimidazole was used as a silylating agent for derivatization of sucrose in this method. TMSI is a well described silylating agent used for quantitative analysis of sucrose by gas chromatography in the sugar industry (Nurok and Reardon 1975). TMSI reacts quickly and smoothly with hydroxyls and carboxylic acids and is thus easy and quick to prepare. One potential problem with the TMSI was that it crystallized due to humidity in the air and caused blockage of the syringe. This made the injection technique unrepeatable. The problem was resolved by washing the syringe immediately after every injection with acetonitrile and pyridine. Precision of the method may be improved further by using an extra underivatized standard to monitor the repeatability of the injections. Silylating reagents also contaminate the flame ionization detector (FID) and may cause a loss of sensitivity. During method development, the FID was cleaned after every 60 runs to prevent this problem, but later it was determined that even after 100 runs, there did not appear to be any significant loss of sensitivity. Different derivatization circumstances were tested. The derivatization was found to be complete after 1 hour at 100 °C, measured as the FID response. Following derivatization, the samples were analysed by the GC immediately, but because of the long run times, the last samples to be analysed were left standing in the autosampler tray at room temperature for up to 24 hours. A control sample was therefore injected prior to running the samples and immediately after the last sample was finished to confirm the stability of TMS-derivates. No significant degradation of TMS-derivates was observed despite this unavoidable delay in analysis.
The pulsed splitless injection technique was used to shorten the analyte residence time
in the hot injection port, resulting in lower analyte degradation and adsorption in the inlet. The glass injection liner was replaced after every 60 injections. Different temperature

87
programs were investigated for the GC oven and a final temperature program with a total run time of 53.7 minutes was selected based upon the best possible resolution.
Validation of the method was based upon the ICH guidelines ( International Conference
on Harmonisation 1995, International Conference on Harmonisation 1997) and included determination of the specificity, range of linearity, accuracy, precision, detection limit, quantitation limit, robustness and system suitability of the assay. Specificity of the assay was demonstrated by comparing the resolution of sucrose with various carbohydrates which are likely to be present in equine serum. No interfering peaks were observed except lactose. This interference is unlikely to affect the specificity of the assay when determining sucrose concentration in adult horses, as lactose is not a normal component of an adult horse’s diet. Lactose peak interference may be a problem when determining sucrose concentrations in foal serum however, as foals drink milk which contains high concentrations of lactose. Some of this lactose may permeate across a damaged gastric mucosa and accumulate in the serum, where it will interfere with sucrose and reduce assay specificity. This problem can be solved by fasting foals for at least 6 hours prior to sucrose testing to ensure adequate time for excretion of any milk derived lactose that may have permeated across the gastric mucosa (Umar et al. 1998).
The method was demonstrated to be linear in the range of 2.34 μmol/L to 20.45 μmol/L.
This range constituted 80 to 120 percent of the sucrose concentration expected in clinical cases (Hewetson et al. 2006). Accuracy and precision testing demonstrated a high degree of reproducibility. Using the GC-FID method, it appears that accuracy at low concentrations of sucrose is improved when compared with comparable data, where percentage recovery of sucrose at low concentrations in canine serum was only 56.7% (Rodriguez et al. 2009). The robustness study demonstrated that the methods’ performance remained unchanged despite variations in storage conditions. This is important, as there may be a substantial lag phase between blood collection and analysis under field conditions, and stability of sucrose in whole blood at room temperature is imperative for method validity.
System suitability testing using a small number of horses with and without gastric
ulceration demonstrated that the GC-FID method was able to quantify sucrose in horses with gastric ulcers and that there appeared to be a significant association between sucrose concentration and the presence of gastric ulceration (p<0.05). These data indicate that sucrose can be quantified in the serum of horses that have been subjected to sucrose permeability testing using the GC-FID method. Again, it is not possible to draw definitive conclusions regarding the validity of the sucrose permeability test from such a small group of horses; however it must be remembered that the purpose of this small sample set was simply to demonstrate that the GC-FID method is suitable for sucrose permeability testing in horses, and conclusions on the validity of the sucrose blood test for diagnosis of EGUS should not be inferred on the basis of these data.
88
6.3 Determining the performance characteristics of the test
Feasibility data in a small group of horses indicated that the determination of sucrose concentration in equine blood may be a useful test for identifying horses with endoscopically visible gastric ulceration, and therefore the aim of this study was to determine the true diagnostic accuracy of the test in selected populations of horses and foals with and without naturally occurring gastric ulcer disease.
ROC curve analysis was used to visually demonstrate the cut-off dependency of the test across a range of sucrose concentrations and to provide an estimate of the overall diagnostic accuracy of the test that is independent of specific cut-off values or prevalence of gastric lesions in the study populations. ROC curves of true positive rates (Se) against false positive rates (1 - Sp) were plotted using blood sucrose concentrations from normal horses/foals; and for horses/foals with GL, GDL, SQL and CSL at 45 and 90 minutes after administration of sucrose.
The AUC in each plot represent a summary of the overall diagnostic accuracy of the test
by combining accuracy over a range of cut-offs, with a value approaching 1.0 indicating perfect discrimination and 0.5 representing zero discrimination. Using an arbitrary guideline, the AUC can be used to distinguish between a non-informative (AUC=0.5); less accurate (0.5<AUC≤0.7); moderately accurate (0.7<AUC≤0.9); highly accurate (0.9<AUC<1); and perfect test (AUC=1) (Swets 1988). Because the AUC summarizes the ROC curve as a whole, and therefore attributes the same weighting to both relevant and irrelevant parts of the curve (Greiner et al. 2000), cut-off values were inserted on the continuous scale of test results that allowed calculation of Se and Sp for horses and foals with GL, GDL, SQL and CSL at each time point.
6.3.1 Adult horses
The primary objective of this particular study was to validate the sucrose blood test as a screening test for EGUS in adult horses by determining its performance characteristics in a large group of horses with and without naturally occurring gastric disease. Depending upon the lesion type and time of sampling, the AUC for the blood sucrose test ranged from 0.51 to 0.68, indicating that blood sucrose concentration is poor at discriminating between normal horses and horses with EGUS and is therefore not considered to be a very accurate test in this specific population of horses (Swets 1988). Using the selected cut-offs, the Se and Sp of the blood sucrose test for detecting the presence or absence of EGUS was low (Table 7), confirming the poor diagnostic accuracy of the test in this study population.
It is not immediately evident why the sucrose blood test has a poor diagnostic accuracy
in adult horses despite previous literature to suggest otherwise (O'Conner et al. 2004, Hewetson et al. 2006, D'Arcy-Moskwa et al. 2012, Hewetson et al. 2014). In this study, there was a predominance of glandular lesions (70%) whereas in previous studies, sucrose

89
permeability was assessed primarily on horses with squamous lesions (O'Conner et al. 2004, Hewetson et al. 2006); and it may be that there are fundamental differences in the permeability of the sucrose molecule between the glandular and squamous epithelium. It has been found that gap junctional intercellular communication (GJIC) plays an important role in the gastric mucosal defense system, and loss of GJIC is associated with ulcer formation. A recent study demonstrated the presence of specific gap junctions in the glandular mucosa of the equine stomach, however these gap junctions were absent in the squamous mucosa of the stomach (Fink et al. 2006). This suggests that there are significant differences in the paracellular permeation pathway of the glandular vs. the squamous epithelium which may explain [in part] why in this study population, with a predominace of glandular ulcers, the sucrose blood test had a poorer diagnostic accuracy than expected. Furthermore, glandular lesions are often smaller in cross-sectional area and are usually not ulcerative per se, but rather erosive or may even consist of intact mucosa with hyperemia (Sykes et al. 2015). In such cases, it is possible that sucrose is less likely to permeate in quantities large enough to appreciate differences between affected and unaffected horses, although this has yet to be substantiated.
The author does recognize however, that the sensitivity and specificity for squamous
lesions was also poor, albeit less so than for glandular ulcers. Another factor to consider therefore, is the fact that in this particular study, very few of the squamous lesions were extensive or demonstrated areas of apparent deep ulceration characteristic of EGUS severity score ≥ 3 (Sykes et al. 2015). It has been reported that the size of the mucosal defect and the surface area affected is the most important factor in determining the quantity of sucrose entering the circulation following sucrose permeability testing (Kawabata et al. 1998). It is therefore possible that the total surface area for sucrose permeation in this study was too small to differentiate between affected and unaffected horses. Based on this premise, re-analysis of the data using a scoring system that takes into account not only the severity of the lesion, but also the number of lesions (or cross-sectional area) affected should be considered (Andrews et al. 2002).
Alternatively, the validity of the gold standard itself can be questioned. It may be that
the sucrose test is too sensitive and may detect slight and clinically insignificant mucosal damage that cannot be seen on gastroscopy, thus limiting its use in clinical decision-making regarding gastric ulceration (Erlacher et al. 1998). It is postulated that sucrose permeability is in fact an accurate representation of the true mucosal integrity of the stomach based on a number of previous publications documenting its effectiveness in both humans and other species (Meddings et al. 1993, Sutherland et al. 1994, Meddings et al. 1995a, Craven et al. 2007); and that assessment via endoscopy is under- or overestimating the severity or depth of gastric lesions. This is based on the fact that assessment of lesion severity (and even the presence or absence of lesions) using gastroscopy is subjective, and agreement between observers for endoscopic diagnosis is notoriously poor, particularly if they are inexperienced (Amano et al. 2006, Hyun et al. 2013). Furthermore, it has been demonstrated that there is a poor correlation between endoscopic assessment of gastric ulcers ante mortem and histological appearance at necropsy (Andrews et al. 2002, Pietra et al. 2010). Because

90
of these limitations, an attempt was made in this study to determine if the gold standard was reproducible between-observers. All assessments made by the observer were compared with assessments made by two other board certified internists that have experience with gastroscopy, and the level of agreement for each outcome was determined. Agreement was moderate to poor (Viera and Garrett 2005), and it is thus possible that in the hands of different observers, the diagnostic accuracy of the test will vary. Considering these limitations, it is the authors’ opinion that histopathology rather than gastroscopy should be utilized as a gold standard for comparison in future gastric permeability studies. Due consideration should also be given to other analytical methods for determining gastrointestinal permeability that could potentially be used as a gold standard against which the blood sucrose test could be compared. A good example of this technology is 1H-NMR spectroscopy (Jayalakshmi et al. 2009).
Another important point to take into account when considering why the sucrose blood
test has a poor diagnostic accuracy in adult horses despite previous literature to suggest otherwise is the effect that sedation has on sucrose permeability in the stomach of the horse. In the feasibility study, sucrose was administered to all horses four hours prior to sedation and gastroscopy. In the subsequent field validation studies, the sucrose solution was administered immediately after sedation and gastroscopy. This was done for practical purposes, as horses in this study were recruited from a referral hospital and from a local riding school, and thus owners were unlikely to be willing to wait around for four hours while the data collection was completed. It is well recognized that sedation has an effect on the rate of gastric emptying in horses (Doherty et al. 1999), and thus a small study was performed prior to emarking on the field validation trials to determine the effects of sedation on the sucrose permeability curve (Rosenqvist-Salo 2014). The hypothesis was that sedation would increase gastric transit time (Merritt et al. 1998, Doherty et al. 1999, Elfenbein et al. 2009), consequently increasing the time that sucrose was able to permeate across the gastric mucosa, thus causing a relative increase in mucosal permability when compared to horses with normal gastric emptying. This would theoretically increase the likelihood that the sucrose blood test would be able to discriminate between normal and damaged mucosa, thus improving the diagnostic accuracy of the test. The sedatives used in the studies that comprise this doctoral thesis consisted of a combination of detomidine and butorphanol at routine doses. Merritt et al. (1998) reported a profound suppressive effect on duodenal motility for up to one hour following administration of a routine dose of detomidine or xylazine/butorphanol combination, and this was later corroborated by Elfenbein et al. (2009) who reported an immediate decrease in the amplitude of duodenal contractions for 50 minutes following administration of detomidine. Similarily, Doherty et al. (1999) investigated the effects of α2 agonists (xylazine) and butorphanol on liquid phase gastric emptying in normal ponies, and concluded that these sedatives caused a significant decrease in the rate of gastric emptying in normal ponies, as determined by the absorption of acetaminophen. For the purposes of determining the effects of sedation on the sucrose permeability curve, 10 horses were studied using a cross-over design (Rosenqvist-Salo 2014). All horses were sucrose tested routinely without prior sedation and gastroscopy. After a washout period of two days, the same group of horses was sucrose tested again after

91
routine sedation and gastroscopy, and the sucrose concentration in blood at each time point was compared. Gastroscopy revealed endoscopically visible gastric ulceration in 80% of horses. As expected, there was a delay in the time taken to reach peak serum concentrations in horses that were sedated, with peak sucrose concentrations occurring on average, 45 minutes later in sedated horses when compared with non-sedated horses. What was suprising however, was the fact that despite the sucrose permeability curve being similar for both groups, mean sucrose concentrations at each time point were significantly lower in sedated horses than non-sedated horses. These results were contrary to the hypothesis and may be another reason why the feasibility results were not reproducible in the field validation studies, as it appeared that sedation inexplicably reduced the relative mucosal permeability of sucrose at all time points. One explanation for this is that the sedatives used may have reduced splanchnic perfusion, thus causing variability in the uptake of sucrose by the intestinal microcirculation (Yuasa et al. 1997, Owczuk et al. 2016). An alternative explanation could be the gastroscopy procedure itself, as gastroscopy was only performed on the sedated horses. The stomach was routinely distended by insufflation of air in all horses in order to visualise the luminal surface of the stomach. After gastroscopy the stomach was deflated as previously described. It is conceivable that insufficient air was removed following conclusion of the gastric examination, and therefore only a limited area of gastric mucosa was exposed to sucrose. In contrast, horses in the group that were not sedated did not undergo gastroscopy, and therefore a greater surface area of their gastric mucosa would have been exposed to the sucrose solution. This is speculative however, and irrespective of the underlying mechanism, further studies are needed to determine the true effect of sedation on the permeability of the equine gastric mucosa to sucrose, particularly with reference to how it affects the diagnostic accuracy of the test.
Several studies have demonstrated that the osmolarity of oral sugar solutions could
potentially increase gastrointestinal mucosal permeability (Menzies 1972a, Menzies 1974, Laker and Menzies 1977, Wheeler et al. 1978). In particular, hyperosmolar solutions appear to cause a relative increase in mucosal permeability of test sugars when compared with low-osmolar solutions (Laker and Menzies 1977, Uil et al. 2000), presumably due to an increase in either the size or frequency of a range of smaller intestinal pores (Wheeler et al. 1978). This would suggest that the use of a hyperosmolar solution is more likely to discriminate between normal and damaged mucosa than isotonic or hypotonic solutions. In the case of sucrose, the osmolarity of the sucrose solution used in this study was 300 mOsm/L, which is only marginally higher than the osmolarity of plasma (290 mOsm/L), and is thus considered to be a low-osmolar or isotonic solution. Based on the premise that a hyperosmolar solution is more likely to discriminate between normal and damaged mucosa, increasing the osmolarity of the sucrose test solution may improve its overall diagnostic accuracy by causing a relative increase in gastric mucosal permeability (Uil et al. 2000). The only conceivable disadvantage to this approach would be the increased risk of laminitis associated with increasing the carbohydrate load in the colon (Garner et al. 1975, Pollitt and Visser 2010). There is also some concern over the fact that hyperosmolar solutions may cause gastric muscosal injury, as was demonstrated by the fact that oral supplementation of

92
hyperosmolar electrolyte solutions used commonly in endurance horses was found to be associated with an increased risk of gastric ulceration (Holbrook et al. 2005).
The choice to include the severity of gastric ulceration as a measure of outcome in the
study was based on the premise that the sucrose blood test would be able to differentiate between severe and less severe lesions, thus enabling practitioners to select cases for treatment based upon the outcome of the test. As dicussed previously, there are no grading systems that can be used interchangeably for horses with both ESGD and EGGD (Sykes et al. 2015), and so for the field validation studies, the concept of a ‘clinically significant gastric lesion’ as a proxy indicator of ulcer severity was adopted, where clinically significant lesions were defined as lesions that the observer would consider severe enough to warrant treatment if seen in a clinical case. While this is clearly not a perfect solution, as clinicians will usually use both gastroscopic appearance of lesions in combination with the clinical history to determine clinical significance, this proxy was considered the best possible compromise. While a scoring system (e.g. EGUS 0-4) would have been more objective, the fact that it cannot be used for EGGD makes it impossible to be used in this study. In future, assessment of both clinical and endoscopic outcomes when determining the diagnostic accuracy of the sucrose test is recommended.
When conducting a validation study to determine the diagnostic accuracy of a test, it is
essential that the study includes an appropriate spectrum of subjects which is representative of the population for which the test is intended. In this study, the objective was to determine the diagnostic accuracy of the sucrose blood test as a screening test for EGUS. When determining the performance characteristics of the test in adult horses, horses used for a wide spectrum of activities were selected, ranging from dressage to racing. Eighty four percent of the horses in the study population had gastric lesions, which is similar to previously reported prevalence data for this geographical region (Luthersson et al. 2009). Unfortunately there was a limited spectrum of disease in the study population, with a predominance of small single lesions, and a noticeable absence of extensive lesions with areas of apparent deep ulceration. As discussed earlier, this has the potential to skew the results by virtue of the fact that permeability of sucrose is directly proportional to the surface area of the damaged gastric mucosa available for permeation. An additional limitation of the study was the fact that that a large proportion of the horses in this study (48%) showed no clinical signs of gastric ulceration at the time of sucrose testing. There is currently little evidence to suggest a direct cause-and-effect relationship between clinical signs of EGUS and the presence, severity or location of gastric ulcers in adult horses (Sykes et al. 2015), and therefore it is possible that the diagnostic accuracy of the sucrose test would be improved when testing a population of horses that were all demonstrating clinical signs at the time of gastroscopy.

93
6.3.2 Weanling Foals
The primary objective of this study was to evaluate the sucrose blood test as a screening test for EGUS in foals by determining its performance characteristics in a group of foals pre- and post-weaning. ROC curve analysis was again used as a graphical representation of the cut-off dependency of the test across a range of sucrose concentrations; with the AUC representing the overall diagnostic accuracy of the test. In contrast to adult horses, the AUC in foals ranged from 0.75 to 0.85 depending upon the lesion type and time of sampling, indicating that blood sucrose concentration effectively discriminates between normal foals and foals with (1) gastric lesions; (2) glandular lesions; (3) squamous lesions; and (4) clinically significant lesions at 45 and 90 minutes after administration of sucrose, and is therefore considered to be a moderately accurate test (Swets 1988).
A cut-off value was inserted on the continuous scale of test results that allowed
calculation of Se and Sp for foals with EGUS. In the case of weanling foals, the prevalence of EGUS is high (Murray et al. 1990), and missing any diseased animal has potentially serious consequences (Traub-Dagartz et al. 1985, Borrow 1993, Zedler et al. 2009), therefore a cut-off value towards the upper part of the ROC curve that maximised Se was selected. Using the selected cut-off, the Se of the blood sucrose test for detecting EGUS was high (84 to 95%), irrespective of whether the sample is taken at 45 or 90 minutes after sucrose administration (Table 8). This allows for a certain amount of leeway for the practitioner to collect the sample within 90 mins but no less than 45 minutes after administration of the sucrose, thus improving the practicality of the test. A high Se is ideal for a screening test as it correctly identifies most foals with gastric ulcers, remembering that many weanling foals do not show clinical signs of gastric ulceration, even in the face of severe disease (Murray et al. 1990). Another way of looking at this is that a negative result is a very reliable way to rule out gastric ulcers, as the blood sucrose test rarely misses foals with gastric ulcers. The Sp is poor however (47 to 71%), which means that a positive test is not a very good way of correctly excluding foals without gastric ulcers, as there is a high false positive rate. In the context of how the test is intended to be used (i.e. as a screening test), this is of no major consequence however, as the risk of a foal without gastric lesions being incorrectly classified as positive for gastric ulceration and undergoing an unnecessary confirmatory gastroscopy far outweighs the risk of incorrectly classifying a foal with a gastric ulcer as normal, and dealing with the potentially fatal and far more expensive consequences of a pyloric stricture or perforating ulcer.
It is in fact not unusual for non-invasive permeability tests to be characterised by a high
sensitivity and a low specificity for the very reasons outlined above; a good example being the lactulose/mannitol excretion ratio test which is currently used for non-invasive screening against celiac disease in human patients (Gatti et al. 2013). Vogelsang et al. (1995) investigated the value of a variety of non-invasive tests used to screen for celiac disease by comparing them to an intestinal biopsy as the gold standard, and found that the urinary lactulose/mannitol excretion ratios had a sensitivity of 100% but a specificity of only 55%.

94
Despite this, the test is still considered to be a very useful cost-effective screening tests to correctly identify patients that would benefit from more invasive diagnostic tests, including an intestinal biopsy (Vogelsang et al. 1995).
The objective of this study was to determine the diagnostic accuracy of the sucrose blood
test in weanling foals. Therefore foals that were approximately 6 months of age at the time of testing were selected and tested on two occasions; 7 days before and 14 days after weaning. The prevalence of gastric lesions prior to weaning was 21% and increased to a staggering 98% within two weeks of weaning. This is the first study that has reported prevalence data for foals immediately after weaning despite a wealth of anecdotal evidence suggesting weaning as a risk factor for EGUS, and underscores the importance of gastric ulceration in this age group. A wide spectrum of disease was represented in the study population, ranging from normal to extensive bleeding lesions with areas of apparent deep ulceration characteristic of EGUS severity score 4 (Sykes et al. 2015). Despite the severity of disease in some foals, none demonstrated clinical symptoms at the time of testing, making the results of this study very relevant to the general population, where many foals with severe ulcers do not demonstrate clinical signs, and therefore the benefit of a sensitive screening test cannot be underestimated (Murray et al. 1990).
Sucrose is safe and non-toxic, and is therefore suitable as a permeability marker in foals
(Vettorazzi and MacDonald 1988). Although specific studies on the safety of oral sucrose administration in weanling foals are not available, oral tolerance tests to investigate disaccharide digestion in neonatal foals have been performed, and at a dose of 1g/kg BW as a 20% solution w/v, no deleterious effects were seen (Rice et al. 1992). Oral administration of hyperosmolar solutions has the potential risk of causing an osmotic diarrhoea, however none of the foals in this study or the aforementioned study developed diarrhoea, suggesting that a dose of 1g/kg BW as a 10% or 20% solution w/v is well tolerated.
During analytical validation of the blood sucrose test, it was demonstrated that lactose
may interfere with sucrose during GC-FID analysis of serum (Hewetson et al. 2014). This may present a problem when determining serum sucrose concentrations in unweaned foals, as milk contains high concentrations of lactose. Some of this lactose may permeate across a damaged gastric mucosa and accumulate in the serum, where it will interfere with sucrose measurements due to reduced analytical specificity (Gryboski et al. 1963, Hewetson et al. 2014). This problem can be solved by fasting unweaned foals for at least 6 hours prior to sucrose testing to ensure adequate time for excretion of any milk derived lactose that may have permeated across the gastric mucosa (Umar et al. 1998).
This study focused on validating the blood sucrose test for weanling foals. It is
conceivable that the test would also be of value for screening neonatal foals for gastric ulcers. Rather than prophylactic treatment of hospitalized neonatal foals with acid suppressing drugs, which have been demonstrated to increase the odds of developing diarrhoea, and may in fact not actually reduce the incidence of gastric ulceration, perhaps a more reasonable approach would be to rule out ulcers using the non-invasive blood sucrose

95
test, and only target treatment to those foals that are positive (Furr et al. 2012). There are however, some important physiological differences in neonatal foals that may limit the usefulness of the test. While older foals have been shown to have normal sucrose activity in the small intestine, oral tolerance tests performed on neonatal foals between the ages of one and five days postpartum have demonstrated that foals of this age do not yet have the ability to digest sucrose (Rice et al. 1992). This is likely to be related to age related changes in sucrose hydrolysis and monosaccharide absorption along the small intestine, with older animals showing an improved ability to hydrolyse sucrose and to absorb monosaccharides (Darmenton et al. 1989). This will of course have significant implications for the sucrose permeability test, as it implies that in neonates, sucrose most likely passes through the gastrointestinal tract unaltered, and therefore has the potential to permeate through any diseased mucosa, irrespective of its anatomical location in the gastrointestinal tract. This means that in the neonatal foal, it is likely that the test is not specific for the stomach. From this point of view, sucrose permeability testing in neonatal foals may be a more useful test for generalized gastrointestinal disease and further studies are certainly warranted. For example, in man, increased intestinal permeability has been documented in premature infants compared to healthy term infants and non-invasive assessment of intestinal permeability using sugar tests has been demonstrated to be useful in monitoring the effects of experimental (nutritional) therapy in these patients, as they are throught to be predisposed to necrotising enterocolitis due to their enhanced intestinal permeability (Smith et al. 1992, Corpeleijn et al. 2011).
When considering gastric permeability in the foal, changes in the gastric mucosal lining
of the stomach (epithelial desquamation) that occurs in the first six months of life may alter epithelial permeability to sucrose when compared with adult horses (Murray 1989, Murray and Mahaffey 1993, Okai et al. 2015). In this study, the blood sucrose cut-off for discriminating between normal foals and foals with EGUS was approximately five times higher when compared with adult horses, suggesting that foals in this age group do in fact have increased gastric permeability, irrespective of their disease status. The reason for this is not immediately clear, but it is likely to be associated with age related changes in intestinal tight junction permeability that is independent of the increased permeability caused by erosion or ulceration, which is thought to occur as a direct result of gaps in the epithelium (Lindemann and Solomon 1962, Gryboski et al. 1963, Pantzar et al. 1994). Alternatively, epithelial desquamation in this age group of foals may result in increased paracellular permabilty through the formation of ‘extrusion zones’ left following removal of dead cells from the muscosal surface (Clarkson 1967). Irrespective of the underlying reason, this relative increase in permeability of the gastric mucosa in foals may be one explanation as to why the diagnostic accuracy of the sucrose blood test was better in this population group. It is interesting to note that a similar age related change in gastric permability occurs in human patients, with a decline in the recovery of urinary sucrose reported in adults when compared to children (McOmber et al. 2010). Further in vitro investigations using endoscopic biopsies in Ussing chambers may help elucidate the reasons for this age related difference in gastric permeability in horses; and help guide future clinical research in the field of equine

96
gastrointestinal permeability (Weiss et al. 2000, Bajka et al. 2003, Wallon et al. 2005, Davis et al. 2006).
6.3.3 Bayesian latent class analysis
Because of the perceived limitations of gastroscopy as a valid gold standard, a Bayesian statistical approach that is used for evaluation of diagnostic tests in the absence of a gold standard test was also investigated (Toft et al. 2005). By using a Bayesian statistical approach in addition to the traditional ‘gold standard’ approach, the limiting implications of gastroscopy on the diagnostic performance characteristics of the blood sucrose test was explored in more detail. Bayesian latent class models are important mathematical frameworks to study the prevalence and the performance of diagnostic tests in the absence of a gold standard test, and in this case, the model was used based on the assumption that gastroscopy is an imperfect test i.e. the true disease state in the population was assumed to be unknown. In a Bayesian analysis, data are combined with prior information that expresses expert opinions and other sources of knowledge. As such the model allows for the inclusion of prior probabilities to account for current knowledge that is subsequently combined with the information contained in the experimental data to determine posterior probabilities. The elicitation of an informative prior is a difficult and subjective process that requires a careful dialogue between the statistician and the expert (Goncalves et al. 2012). In this study, informative priors were elicited based on published literature reporting the prevalence of EGUS in similar populations of adult horses and foals (Murray 1989, Chameroy et al. 2006, Luthersson et al. 2009, Elfenbein and Sanchez 2012); and where such information was conflicting or lacking, the expert opinion of the author and collaborators. When compared to the traditional gold standard approach, estimates of Se and Sp were consistently higher in foals when using a Bayesian approach, with Se ranging from 81% to 97%; and Sp ranging from 77% to 97%, depending upon the lesion type and time of sampling (Table 8). In constrast, there was little difference between the methods when compared in adult horses, with Se ranging from 48.2 to 78.3; and Sp ranging from 31.6 to 81, depending upon the lesion type and time of sampling (Table 7).

97
7 Conclusions
The four publications that form the basis of this thesis were designed to address the problem of diagnosis and monitoring of EGUS in the horse. The hypothesis was that sucrose permeability (as evaluated by blood sucrose concentration) can be used to reliably and practically detect gastric ulcers in horses; and a series of studies were subsequently conducted to develop and validate a simple blood sucrose test, including determination of the feasibility of the method (I); sucrose assay development and standardization (II); and field validation through determination of the performance characteristics of the test in selected populations of horses (III-IV).
1. It was demonstrated in a small pilot study that following nasogastric administration of sucrose to adult horses with and without naturally occurring gastric ulcers; and by determining the concentration of sucrose in blood 45-90 minutes later, horses with EGUS could be differentiated from horses with a healthy gastric mucosa. Furthermore, the concentration of sucrose in serum appeared to be correlated with ulcer severity. It was concluded that the determination of sucrose concentration in equine blood is a feasible alternative to urine when performing sucrose permeability testing in the horse, and may represent a useful screening test for identifying horses with endoscopically visible gastric ulceration.
2. It was recognized that there is a need for a valid, yet practical and cost-effective method for quantifying sucrose in equine serum, as previously published analytical methods were either too expensive, not routinely available, or too imprecise. A GC-FID method for measurement of sucrose in equine serum was consequenty developed and validated. It was concluded that the method is valid; and can be applied to the assessment of gastric permeability in the horse. GC-FID is simple to use, comparably cheap and the equipment is relatively widespread, making it an ideal analytical method for developing a practical and affordable screening test.
3. The performance characteristics of the test were subsequently assessed in a large group of adult horses with and without naturally occurring gastric disease by comparing it to gastroscopy as the gold standard. The horses in the study were used for a wide range of equestrian activities, ranging from dressage to racing, and were recruited on the assumption that up to 53% of them would be affected by naturally occurring gastric ulceration. It was concluded that blood sucrose is neither a sensitive nor specific test for detecting EGUS in adult horses and is therefore unsuitable as a screening test in this population. It is not clear why the sucrose blood test has a poor diagnostic accuracy in this population, however it was speculated that it may be related to fundamental differences in the permeability of the sucrose molecule between the glandular and squamous epithelium. The confounding effect of lesion number and severity, and the effects of sedation on gastric emptying times may also have played a role. It was recommend that further studies aimed at evaluating the

98
performance characteristics of the test in specific populations of horses (e.g. racehorses or endurance horses) or for different lesion type and severity may be warranted.
4. The performance characteristics of the test were also assessed in a group of foals before and after weaning. In contrast to adult horses, it was concluded that blood sucrose is a sensitive test for detecting EGUS in weanling foals and has the potential to be a useful screening test as it fulfils all the major criteria for a screening test: it is (1) economical, so that a large proportion of the population can be tested at a relatively low cost; (2) minimally invasive and acceptable to owners; (3) easy to perform; and (4) accurate, with good sensitivity. Due to its poor specificity, it is not expected that the sucrose blood test would replace gastroscopy, however it may represent a clinically useful screening test that can be used to identify foals that may benefit from gastroscopy. It is not clear why the diagnostic accuracy of the test was so much better in foals when compared to adult horses, but it was speculated that it may be related to a relative increase in permeability of the gastric mucosa in foals associated with changes in the gastric mucosal lining of the stomach that occur in the first six months of life, that may alter epithelial permeability to sucrose when compared with adult horses. The usefulness of this test for diagnosis of gastric ulceration in neonatal foals is yet to be determined, however there are some important physiological differences in neonatal foals that may limit the usefulness of the test.
5. In order to assess the validity of the gastroscopy assessments (III, IV), the inter-observer variability for each assessment was determined. Agreement was moderate to poor, with a Kappa coefficient ranging from 0.50 to 0.65 for adult horses and 0.42 to 67 for foals; depending upon the lesion type that was assessed. It would thus appear that observational rating scales are an inappropriate measure of outcome for gastric permeability studies unless the report specifies the amount and type of error inherent in the analysis technique and takes this into consideration when making conclusions based on the results. Considering these limitations, it was concluded that histopathology rather than gastroscopy should be utilized as a gold standard for comparison in future gastric permeability studies. Due consideration should also be given to alternative analytical methods for comparison of blood sucrose with a gold standard.
6. Because of concerns over the validity of the gold standard, additional Se, Sp, and lesion prevalence data were investigated and compared using Bayesian latent class analysis (III, IV). When compared to the traditional gold standard approach, estimates of Se and Sp were consistently higher in foals when using a Bayesian approach, however there was little difference between the methods when compared in adult horses. It was concluded that Bayesian latent class analysis may represent an alternative method to evaluate the diagnostic accuracy of the blood sucrose test in an attempt to avoid bias associated with the assumption that gastroscopy is a perfect test.

99
References
Abazia C, Ferrara R, Corsaro MM, Barone G, Coccoli P, Parrilli G (2003). Simultaneous gas-chromatographic measurement of rhamnose, lactulose and sucrose and their application in the testing gastrointestinal permeability. Clin Chim Acta 338:25-32. Acland HM, Gunson DE, Gillette DM (1983). Ulcerative duodenitis in foals. Vet Pathol 20:653-661. Addobbati R, Pascolo L, Di Toro N, Sebastiani GB, Martellossi S, Not T (2013). Influence of urine volume on the assessment of intestinal permeability in affected children by multiple sugar probes. Clin Chem Lab Med 9:1-9. Allen A, Flemstrom G, Garner A, Kivilaakso E (1993). Gastroduodenal mucosal protection. Physiol Rev 73:823-857. Amano Y, Ishimura N, Furuta K, Okita K, Masaharu M, Azumi T, Ose T, Koshino K, Ishihara S, Adachi K, Kinoshita Y (2006). Interobserver agreement on classifying endoscopic diagnoses of nonerosive esophagitis. Endoscopy 38:1032-1035. Andrews FM, Bernard WV, Byars TD, Cohen ND, Divers TJ, MacAllister CG, McGladdery A, Merritt AM, Murray MJ, Orsini JA, Snyder JR ,Vatistas NJ (1999). Recommendations for the diagnosis and treatment of equine gastric ulcer syndrome (EGUS). Equine Vet Edu 1:122-134. Andrews FM, McConnico R (2009). Cause for concern: Evidence that therapeutic dosing of nonselective NSAIDS contributes to gastrointestinal injury. Equine Vet Edu 21:663-664. Andrews FM, Nadeau JA (1999). Clinical syndromes of gastric ulceration in foals and mature horses. Equine Vet J Suppl: 30-33. Andrews FM, Reinemeyer CR, McCracken MD, Blackford JT, Nadeau JA, Saabye L, Sotell M ,Saxton A (2002). Comparison of endoscopic, necropsy and histology scoring of equine gastric ulcers. Equine Vet J 34:475-478. Andrews FM, Sifferman RL, Bernard W, Hughes FE, Holste JE, Daurio CP, Alva R ,Cox JL (1999). Efficacy of omeprazole paste in the treatment and prevention of gastric ulcers in horses. Equine Vet J Suppl:81-86. Bajka BH, Gillespie CM, Steeb CB, Read LC, Howarth GS (2003). Applicability of the Ussing chamber technique to permeability determinations in functionally distinct regions of the gastrointestinal tract in the rat. Scand J Gastroenterol 38:732-741. Bastaki SM, Wallace JL (1999). Pathogenesis of nonsteroidal anti-inflammatory drug gastropathy: clues to preventative therapy. Can J Gastroenterol 13:123-127. Bauer K, Versmold H, Prolss A, De Graaf SS, Meeuwsen-Van der Roest WP, Zijlstra WG (1990). Estimation of extracellular volume in preterm infants less than 1500 g, children, and adults by sucrose dilution. Pediatr Res 27:256-259. Baumgart DC, Dignass AU (2002). Intestinal barrier function. Curr Opin Clin Nutr Metab Care 5:685-694. Becht JL, Byars TD (1986). Gastroduodenal ulceration in foals. Equine Vet J 18:307-309.
100
Begg LM, O'Sullivan CB (2003). The prevalence and distribution of gastric ulceration in 345 racehorses. Aust Vet J 81:199-201. Bell RJ, Mogg TD, Kingston JK (2007a). Equine gastric ulcer syndrome in adult horses: a review. N Z Vet J 55:1-12. Bell RJW, Kingston JK, Mogg TD, Perkins NR (2007b). The prevalence of gastric ulceration in racehorses in New Zealand. N Z Vet J 55:13-18. Bezděková B, Jahn P, Vyskočil M (2008). Gastric Ulceration, Appetite and Feeding Practices in Standardbred Racehorses in the Czech Republic. Acta Vet Brno 77:603-607. Bijlsma PB, Peeters RA, Groot JA, Dekker PR, Taminiau JA, Van Der Meer R (1995). Differential in vivo and in vitro intestinal permeability to lactulose and mannitol in animals and humans: a hypothesis. Gastroenterology 108:687-696. Bjarnason I, Peters TJ ,Veall NA (1983). A persistent defect in coeliac disease demonstrated by a 51Cr-labelled EDTA absorbtion test. Lancet 1(8320): 323-325. Borch K, Sjostedt C, Hannestad U, Soderholm JD, Franzen L, Mardh S (1998). Asymptomatic Helicobacter pylori gastritis is associated with increased sucrose permeability. Dig Dis Sci 43:749-753. Borrow HA (1993). Duodenal perforations and gastric ulcers in foals. Vet Rec 132:297-299. Bosi E, Molteni L, Radaelli MG, Folini L, Fermo I, Bazzigaluppi E, Piemonti L, Pastore MR, Paroni R (2006). Increased intestinal permeability precedes clinical onset of type 1 diabetes. Diabetologia 49:2824-2827. Brown CM, Slocombe RF, Derksen FJ (1985). Fiberoptic gastroduodenoscopy in the horse. J Am Vet Med Assoc 186:965-968. Buddington KK, Holmes WE, Clemons-Chevis CL, Solangi MA, Vanderpool D, Buddington RK (2006). Oral administration of sucrose solutions and measurement of serum sucrose concentrations to evaluate gastric permeability in adult bottlenose dolphins (Tursiops truncatus). Am J Vet Res 67:931-935. Buhner S, Reese I, Kuehl F, Lochs H, Zuberbier T (2004). Pseudoallergic reactions in chronic urticaria are associated with altered gastroduodenal permeability. Allergy 59:1118-1123. Capaldo CT, Nusrat A (2009). Cytokine regulation of tight junctions. Biochim Biophys Acta 1788:864-871. Catanoso M, Lo Gullo R, Giofre MR, Pallio S, Tortora A, Lo Presti M, Frisina N, Bagnato G, Fries W (2001). Gastro-intestinal permeability is increased in patients with limited systemic sclerosis. Scand J Rheumatol 30:77-81. Cereijido M, Valdes J, Shoshani L, Contreras RG (1998). Role of tight junctions in establishing and maintaining cell polarity. Annu Rev Physiol. 60:161-177.

101
Chadwick VS, Phillips SF, Hofmann AF (1977a). Measurements of intestinal permeability using low molecular weight polyethylene glycols (PEG 400). I. Chemical analysis and biological properties of PEG 400. Gastroenterology. 73:241-246. Chadwick VS, Phillips SF, Hofmann AF (1977b). Measurements of intestinal permeability using low molecular weight polyethylene glycols (PEG 400). II. Application to normal and abnormal permeability states in man and animals. Gastroenterology. 73:247-251. Chameroy KA, Nadeau JA, Bushmich SL, Dinger JE, Hoagland TA, Saxton AM (2006). Prevalence of non-glandular gastric ulcers in horses involved in a university riding program. J Equine Vet Sci 26:207-211. Cibicek N, Cibicková L, Kohout P, Zd'ánský P (2004). Use of sucrose permeability test (SaLM) for detection of lesions of upper gastrointestinal tract mucosa in upper dyspepsia patients - a pilot study. Acta Medica (Hradec Kralove) Suppl 47:23-28. Clarkson TW (1967). The transport of salt and water across isolated rat ileum. Evidence for at least two distinct pathways. J Gen Physiol 50:695-727. Cobden I, Dickinson RJ, Rothwell J, Axon AT (1978). Intestinal permeability assessed by excretion ratios of two molecules: results in coeliac disease. Br Med J 2:1060. Cooper BT (1984). Small intestinal permeability in clinical practice. J Clin Gastroenterol 6:499-501. Corpeleijn WE, van Elburg RM, Kema IP, van Goudoever JB (2011). Assessment of intestinal permeability in (premature) neonates by sugar absorption tests. Methods Mol Biol 763:95-104. Cox MA, Iqbal TH, Cooper BT, Lewis KO (1997a). An analytical method for the quantitation of mannitol and disaccharides in serum: a potentially useful technique in measuring small intestinal permeability in vivo. Clin Chim Acta 263:197-205. Cox MA, Iqbal TH, Lewis KO, Cooper BT (1997b). Gastric permeability in celiac disease. Gastroenterology 112(1):314-317. Cox MA, Lewis KO ,Cooper BT (1998). Sucrosemia in untreated celiac disease: a potential screening test. Dig Dis Sci 43:1096-1101. Craven M, Chandler ML, Steiner JM, Farhadi A, Welsh E, Pratschke K, Shaw DJ ,Williams DA (2007). Acute effects of carprofen and meloxicam on canine gastrointestinal permeability and mucosal absorptive capacity. J Vet Intern Med 21:917-923. D'Arcy-Moskwa E, Noble GK, Weston LA, Boston R, Raidal SL (2012). Effects of meloxicam and phenylbutazone on equine gastric mucosal permeability. J Vet Intern Med 26:1494-1499. D'Arcy-Moskwa E, Weston L, Noble GN, Raidal SL (2011). Determination of sucrose in equine serum using liquid chromatography-mass spectrometry (LC/MS). J Chromatogr B Analyt Technol Biomed Life Sci 879:3668-3671. Darmenton P, Raul F, Doffoel M ,Wessely JY (1989). Age influence on sucrose hydrolysis and on monosaccharide absorption along the small intestine of rat. Mech Ageing Dev 50:49-55.

102
Davis G, Santa Ana C, Morawski S, Fordtran J (1982). Permeability characteristics of human jejunum, ileum, proximal colon and distal colon: results of potential difference measurements and unidirectional fluxes. Gastroenterology 83:844-850. Davis JL, Little D, Blikslager AT, Papich MG (2006). Mucosal permeability of water-soluble drugs in the equine jejunum: a preliminary investigation. J Vet Pharmacol Ther 29:379-385. Davis MS, Willard MD, Williamson KK, Steiner JM, Williams DA (2005). Sustained strenuous exercise increases intestinal permeability in racing Alaskan sled dogs. J Vet Intern Med 19:34-39. Del Valle-Pinero AY, Van Deventer HE, Fourie NH, Martino AC, Patel NS, Remaley AT, Henderson WA (2013). Gastrointestinal permeability in patients with irritable bowel syndrome assessed using a four probe permeability solution. Clin Chim Acta 418:97-101. Delahunty T, Hollander D (1987). A comparison of intestinal permeability between humans and three common laboratory animals. Comp Biochem Physiol A Comp Physiol 86:565-567. DeMeo M (1995). Sucrose permeability as a marker for nonsteroidal anti-inflammatory gastroduodenal injury: how sweet is it? Nutr Rev 53:13-16. Di Leo V, Venturi C, Baragiotta A, Martines D, Floreani A (2003). Gastroduodenal and intestinal permeability in primary biliary cirrhosis. Eur J Gastroenterol Hepatol 15:967-973. Dionne RM, Vrins A, Doucet MY, Pare J (2003). Gastric ulcers in standardbred racehorses: prevalence, lesion description, and risk factors. J Vet Intern Med 17:218-222. Doherty TJ, Andrews FM, Provenza MK, Frazier DL (1999). The effect of sedation on gastric emptying of a liquid marker in ponies. Vet Surg 28:375-379. Downie WW, Leatham PA, Rhind VM, Wright V, Branco JA, Anderson JA (1978a). Studies with pain rating scales. Ann Rheum Dis 37:378-381. Dukti SA, Perkins S, Murphy J, Barr B, Boston R, Southwood LL, Bernard W (2006). Prevalence of gastric squamous ulceration in horses with abdominal pain. Equine Vet J 38:347-349. Dyer J, Fernandez-Castano Merediz E, Salmon KS, Proudman CJ, Edwards GB, Shirazi-Beechey SP (2002). Molecular characterisation of carbohydrate digestion and absorption in equine small intestine. Equine Vet J 34:349-358. Elfenbein JR, Sanchez LC (2012). Prevalence of gastric and duodenal ulceration in 691 nonsurviving foals (1995-2006). Equine Vet J Suppl:76-79. Elfenbein JR, Sanchez LC, Robertson SA, Cole CA, Sams R (2009). Effect of detomidine on visceral and somatic nociception and duodenal motility in conscious adult horses. Vet Anaesth Analg 36:162-172. Enøe C, Georgiadis MP, Johnson WO (2000). Estimation of sensitivity and specificity of diagnostic tests and disease prevalence when the true disease state is unknown. Prev Vet Med 45:61-81.
103
Erlacher L, Wyatt J, Pflugbeil S, Koller M, Ullrich R, Vogelsang H, Smolen JS, Graninger W (1998). Sucrose permeability as a marker for NSAID-induced gastroduodenal injury. Clin Exp Rheumatol 16:69-71. Farhadi A, Keshavarzian A, Fields JZ, Sheikh M, Banan A (2006). Resolution of common dietary sugars from probe sugars for test of intestinal permeability using capillary column gas chromatography. J Chromatogr B Analyt Technol Biomed Life Sci 836:63-68. Farhadi A, Keshavarzian A, Kwasny MJ, Shaikh M, Fogg L, Lau C, Fields JZ, Forsyth CB (2010). Effects of aspirin on gastroduodenal permeability in alcoholics and controls. Alcohol 44:447-456. Farquhar MG, Palade GE (1963). Junctional complexes in various epithelia. J Cell Biol 17:375-412. Fasano A (2011). Zonulin and its regulation of intestinal barrier function: the biological door to inflammation, autoimmunity, and cancer. Physiol Rev 91:151-175. Fasano A (2012). Leaky gut and autoimmune diseases. Clin Rev Allergy Immunol 42:71-78. Fasano A, Nataro JP (2004). Intestinal epithelial tight junctions as targets for enteric bacteria-derived toxins. Adv Drug Deliv Rev 56:795-807. Fennell LC, Franklin RP (2009). Do nonsteroidal anti-inflammatory drugs administered at therapeutic dosages induce gastric ulcers in horses? Equine Vet Edu 21:660-662. Fink C, Hembes T, Brehm R, Weigel R, Heeb C, Pfarrer C, Bergmann M, Kressin M (2006). Specific localisation of gap junction protein connexin 32 in the gastric mucosa of horses. Histochem Cell Biol 125:307-313. Fordtran JS, Rector FC, Ewton MF, Soter N, Kinney J (1965). Permeability characteristics of the human small intestine. J Clin Invest 44:1935-1944. Fordtran JS, Rector FC, Locklear TW, Ewton MF (1967). Water and solute movement in the small intestine of patients with sprue. J Clin Invest 46:287-298. Fosgate GT, Adesiyun AA, Hird DW, Johnson WO, Hietala SK, Schurig GG, Ryan J (2003). Estimation of receiver-operating characteristic curves to determine accuracy of a competitive enzyme-linked immunosorbent assay for the serodiagnosis of Brucella infection in domestic water buffalo (Bubalus bubalis) and cattle. Am J Vet Res. 64:57-64. Fosgate GT, Urdaz-Rodriguez JH, Dunbar MD, Rae DO, Donovan GA, Melendez P, Dobek GL, Alleman AR (2010). Diagnostic accuracy of methods for detecting Anaplasma marginale infection in lactating dairy cattle of Puerto Rico. J Vet Diagn Invest 22:192-199. Franklin SH, Brazil TJ, Allen KJ (2008). Poor performance associated with equine gastric ulceration syndrome in four Thoroughbred racehorses. Equine Vet Edu 20:119-124. Fromter E, Diamond J (1972). Route of passive ion permeation in epithelia. Nature New Biol 235:9-13. Fukuda Y, Bamba H, Okui M, Tamura K, Tanida N, Satomi M, Shimoyama T, Nishigami T (2001). Helicobacter pylori infection increases mucosal permeability of the stomach and intestine. Digestion 63 Suppl 1:93-96.

104
Furr M, Cohen ND, Axon JE, Sanchez LC, Pantaleon L, Haggett E, Campbell R, Tennent-Brown B (2012). Treatment with histamine-type 2 receptor antagonists and omeprazole increase the risk of diarrhoea in neonatal foals treated in intensive care units. Equine Vet J Suppl:80-86. Garner HE, Coffman JR, Hahn AW, Hutcheson DP, Tumbleson ME (1975). Equine laminitis of alimentary origin: an experimental model. Am J Vet Res 36:441-444. Gatti S, Caporelli N, Galeazzi T, Francavilla R, Barbato M, Roggero P, Malamisura B, Iacono G, Budelli A, Gesuita R, Catassi C, Lionetti E (2013). Oats in the diet of children with celiac disease: preliminary results of a double-blind, randomized, placebo-controlled multicenter Italian study. Nutrients 5:4653-4664. Giofre MR, Meduri G, Pallio S, Calandra S, Magnano A, Niceforo D, Cinquegrani M, di Leo V, Mazzon E, Sturniolo GG, Longo G, Fries W (2000). Gastric permeability to sucrose is increased in portal hypertensive gastropathy. Eur J Gastroen Hepat 12:529-533. Gitter AH, Wullstein F, Fromm M, Schulzke JD (2001). Epithelial barrier defects in ulcerative colitis: characterization and quantification by electrophysiological imaging. Gastroenterology 121:1320-1328. Goncalves L, Subtil A, de Oliveira MR, do Rosario V, Lee PW, Shaio MF (2012). Bayesian Latent Class Models in malaria diagnosis. PLoS One 7(7): e40633. Goodgame RW, Malaty HM, el-Zimaity HM, Graham DY (1997). Decrease in gastric permeability to sucrose following cure of Helicobacter pylori infection. Helicobacter 2:44-47. Gotteland M, Araya M, Pizarro F, Olivares M (2001a). Effect of acute copper exposure on gastrointestinal permeability in healthy volunteers. Dig Dis Sci 46:1909-1914. Gotteland M, Corvalan A, Sarmiento F, Chavez E, Backouse C, Palma M, Kakarieka E, Vial MT, Figueroa G (2001b). Gastric permeability is not increased in children colonized by CagA-positive strains of Helicobacter pylori. Dig Liver Dis 33:750-754. Gotteland M, Cruchet S, Frau V, Wegner ME, Lopez R, Herrera T, Sanchez A, Urrutia C, Brunser O (2002). Effect of acute cigarette smoking, alone or with alcohol, on gastric barrier function in healthy volunteers. Dig Liver Dis 34:702-706. Graham DY (2000). Pathogenesis of increased sucrose permeability in H. pylori gastritis. Dig Dis Sci 45:889. Granger DN, Mortillaro NA, Kvietys PR, Rutili G, Parker JC, Taylor AE (1980). Role of the interstitial matrix during intestinal volume absorption. Am J Physiol 238:G183-189. Greiner M, Pfeiffer D, Smith RD (2000). Principles and practical application of the receiver-operating characteristic analysis for diagnostic tests. Prev Vet Med 45:23-41. Groschwitz KR, Hogan SP (2009). Intestinal barrier function: molecular regulation and disease pathogenesis. J Allergy Clin Immunol 124:3-20. Gryboski JD, Thayer WR, Jr., Gabrielson IW, Spiro HM (1963). Disacchariduria in gastrointestinal disease. Gastroenterology 45:633-637.

105
Gullberg J, Jonsson P, Nordstrom A, Sjostrom M, Moritz T (2004). Design of experiments: an efficient strategy to identify factors influencing extraction and derivatization of Arabidopsis thaliana samples in metabolomic studies with gas chromatography/mass spectrometry. Anal Biochem 331:283-295. Hall EJ ,Batt RM (1990). Enhanced intestinal permeability to Cr-labelled EDTA in dogs with small intestinal disease. JAVMA 196:91-95. Halme L, Turunen U, Tuominen J, Forsstrom T, Turpeinen U (2000). Comparison of iohexol and lactulose-mannitol tests as markers of disease activity in patients with inflammatory bowel disease. Scand J Clin Lab Invest 60:695-701. Hartmann AM, Frankeny RL (2003). A preliminary investigation into the association between competition and gastric ulcer formation in non-racing performance horses. J Equine Vet Sci 23:560-561. Head K, Jurenka JS (2004). Inflammatory bowel disease. Part II: Crohn's disease-pathophysiology and conventional and alternative treatment options. Altern Med Rev 9:360-401. Heller F, Fromm A, Gitter AH, Mankertz J, Schulzke JD (2008). Epithelial apoptosis is a prominent feature of the epithelial barrier disturbance in intestinal inflammation: effect of pro-inflammatory interleukin-13 on epithelial cell function. Mucosal Immunol 1 Suppl 1:S58-61. Hepburn RJ (2012). Equine glandular ulceration: Pathophysiology and epidemiology. American College of Veterinary Internal Medicine Annual Congress. Hepburn RJ (2014). Endoscopic examination of the squamous and glandular gastric mucosa in sport and 562 leisure horses: 684 horses (2005-2011). BMC Vet Res 10(S1):11. Herszenyi L, Juhasz M, Mihaly E, Tulassay Z (2015). Peptic ulcer disease and stress. Orv Hetil 156:1426-1429. Hewetson M, Aaltonen K, Tulamo RM, Sankari S (2014). Development and validation of a gas chromatography-flame ionization detection method for quantifying sucrose in equine serum. J Vet Diagn Invest 26:232-239. Hewetson M, Cohen ND, Love S, Buddington RK, Holmes W, Innocent GT, Roussel AJ (2006). Sucrose concentration in blood: a new method for assessment of gastric permeability in horses with gastric ulceration. J Vet Intern Med 20:388-394. Hewett (1924). Biochem Journal 18. Hober R, Hober J (1937). Experiments on the absorbtion of organic solutes in the small inestine of rats. J Cell Comp Physiol 10:401-410. Holbrook TC, Simmons RD, Payton ME, MacAllister CG (2005). Effect of repeated oral administration of hypertonic electrolyte solution on equine gastric mucosa. Equine Vet J 37:501-504. Holmes EW (1997). Coupled enzymatic assay for the determination of sucrose. Anal Biochem 244:103-109.

106
Hopkins AM, McDonnell C, Breslin NP, O'Morain CA, Baird AW (2002). Omeprazole increases permeability across isolated rat gastric mucosa pre-treated with an acid secretagogue. J Pharm Pharmacol 54:341-347. Hu YJ, Wang YD, Tan FQ, Yang WX (2013). Regulation of paracellular permeability: factors and mechanisms. Mol Biol Rep 40:6123-6142. Hui SL, Walter SD (1980). Estimating the error rates of diagnostic tests. Biometrics 36:167-171. Husted L, Jensen TK, Olsen SN, Molbak L (2010). Examination of equine glandular stomach lesions for bacteria, including Helicobacter spp. by fluorescence in situ hybridisation. BMC Microbiol 10:84. Hyun YS, Han DS, Bae JH, Park HS, Eun CS (2013). Interobserver variability and accuracy of high-definition endoscopic diagnosis for gastric intestinal metaplasia among experienced and inexperienced endoscopists. J Korean Med Sci 28:744-749. Iizuka M, Konno S (2011). Wound healing of intestinal epithelial cells. World J Gastroenterol 17:2161-2171. Inutsuka S, Takesue F, Yasuda M, Honda M, Nagahama S, Kusumoto H, Nozoe T, Korenaga D (2003). Assessment of the intestinal permeability following postoperative chemotherapy for human malignant disease. Eur Surg Res 35:22-25. International Conference on Harmonisation (1995). Guideline on “Text on Validation of Analytical Procedures”. Federal Register 60:11260. International Conference on Harmonisation (1997). Guideline on “Validation of Analytical Procedures: Methodology”. Federal Register 62:27463-27467. Jayalakshmi K, Ghoshal UC, Kumar S, Misra A , Roy R , Khetrapal CL (2009). Assessment of small intestinal permeability using 1H-NMR spectroscopy. J Gastrointestin Liver Dis 18:27-32. Jenkins AP, Trew DR, Crump BJ, Nukajam WS, Foley JA, Menzies IS, Creamer B (1991). Do non-steroidal anti-inflammatory drugs increase colonic permeability? Gut 32:66-69. Jezyk N, Rubas W, Grass GM (1992). Permeability characteristics of various intestinal regions of rabbit, dog, and monkey. Pharm Res 9:1580-1586. Johnston SD, Smye M, Watson RP (2001). Intestinal permeability tests in coeliac disease. Clin Lab 47:143-150. Jonsson H, Egenvall A (2006). Prevalence of gastric ulceration in Swedish Standardbreds in race training. Equine Vet J 38:209-213. Juby LD, Rothwell J, Axon AT (1989a). Cellobiose/mannitol sugar test--a sensitive tubeless test for coeliac disease: results on 1010 unselected patients. Gut 30:476-480. Juby LD, Rothwell J, Axon AT (1989b). Lactulose/mannitol test: an ideal screen for celiac disease. Gastroenterology 96:79-85. Katamaya M, Matsuda Y, Kobayashi K, Kaneko S, Ishikawa H (2006). Simultaneous determination of glucose, 1,5-anhydro-D-glucitol and related sugar alcohols in serum by

107
high-performance liquid chromatography with benzoic acid derivation. Biomedical Chromatography 20:440-445. Kawabata H, Meddings JB, Uchida M, Matsuda K, Sasahara K, Nishioka M (1998). Sucrose permeability as a means of detecting diseases of the upper digestive tract. J Gastroenterol Hepatol 13:1002-1006. Keith NM, Power MH (1937). The urinary excretion of sucrose and its distribution in the blood after intravenous injection into normal men. Am J Physiol - Legacy Content 120:203-211. Keshavarzian A, Fields JZ, Vaeth J, Holmes EW (1994). The differing effects of acute and chronic alcohol on gastric and intestinal permeability. Am J Gastroenterol 89:2205-2211. Keshavarzian A, Holmes EW, Patel M, Iber F, Fields JZ, Pethkar S (1999). Leaky gut in alcoholic cirrhosis: a possible mechanism for alcohol-induced liver damage. Am J Gastroenterol 94:200-207. Khazaeinia T, Jamali F (2003). A comparison of gastrointestinal permeability induced by diclofenac-phospholipid complex with diclofenac acid and its sodium salt. J Pharm Pharm Sci 6:352-359. Kiziltas S, Imeryuz N, Gurcan T, Siva A, Saip S, Dumankar A, Kalayci C , Ulusoy NB (1998). Corticosteroid therapy augments gastroduodenal permeability to sucrose. American J Gastroenterol 93:2420-2425. Klenner S, Coenen M, Failing K, Hewicker-Trautwein M, Ternes W, Verspohl J, Spillmann T (2009). Estimation of intestinal permeability in healthy dogs using the contrast medium iohexol. Vet Clin Pathol 38:353-360. Koc B, Aymelek S, Sonmez A, Yilmaz MI, Kocar H (2004). Increased sucrose permeability in Behcet's disease. Rheumatol Int 24:347-350. Kollias-Baker C, Cox K, Jones J (2001). Evaluation of the effects of omeprazole on physiological indices of performance of horses during incremental treadmill exercise. Vet Ther 2:361-369. Laker MF, Menzies IS (1977). Increase in human intestinal permeability following ingestion of hypertonic solutions. J Physiol. 265:881-894. Lambert GP, Boylan M, Laventure JP, Bull A, Lanspa S (2007). Effect of aspirin and ibuprofen on GI permeability during exercise. Int J Sports Med 28:722-726. Lambert GP, Lang J, Bull A, Pfeifer PC, Eckerson J, Moore G, Lanspa S, O'Brien J (2008). Fluid restriction during running increases GI permeability. Int J Sports Med 29:194-198. Lanas A, Chan FKL (2017). Peptic ulcer disease. Lancet 390:613-624. le Jeune SS, Nieto JE, Dechant JE, Snyder JR (2009). Prevalence of gastric ulcers in Thoroughbred broodmares in pasture: a preliminary report. Vet J 181:251-255. Levenstein S, Rosenstock S, Jacobsen RK, Jorgensen T (2015). Psychological stress increases risk for peptic ulcer, regardless of Helicobacter pylori infection or use of nonsteroidal anti-inflammatory drugs. Clin Gastroenterol Hepatol 13:498-506.e491.

108
Lewis S (2003). Gastric ulceration in an equine neonate. Can Vet J 44:420-421. Lifschitz CH, Shulman RJ (1990). Intestinal permeability tests: are they clinically useful? J Pediatr Gastroenterol Nutr. 10:283-287. Lindemann B, Solomon AK (1962). Permeability of luminal surface of intestinal mucosal cells. J Gen Physiol 45:801-810. Lister M (1673). A letter. Philos. Trans. R. Soc. London 8:6060-6065. Liu H, Li GF, Cumberland WG, Wu T (2005). Testing statistical significance of the area under a receiving operating characteristics curve for repeated measures design with bootstrapping. J Data Sci 3:257-278. Lodish H, Berk A, Zipursky LS, Matsudaira P, Baltimore D, Darnell J (2000). Intestinal Architecture and Development. In: Molecular Cell Biology. Freeman WH. New York, W. H. Freeman. Lohmann KL, Roussel AJ, Cohen ND, Boothe DM, Rakestraw PC, Walker MA (2000). Comparison of nuclear scintigraphy and acetaminophen absorption as a means of studying gastric emptying in horses. Am J Vet Res 61:310-315. Luthersson N, Nielsen KH, Harris P, Parkin TD (2009). The prevalence and anatomical distribution of equine gastric ulceration syndrome (EGUS) in 201 horses in Denmark. Equine Vet J 41:619-624. MacAllister CG, Andrews FM, Deegan E, Ruoff W, Olovson SG (1997). A scoring system for gastric ulcers in the horse. Equine Vet J 29:430-433. Madara JL (1990). Maintenance of the macromolecular barrier at cell extrusion sites in intestinal epithelium: physiological rearrangement of tight junctions. J Membr Biol 116:177-184. Madara JL, Marcial MA (1984). Structural correlates of intestinal tight-junction permeability. Kroc Found Ser 17:77-100. Madara JL, Trier JS (1982). Structure and permeability of goblet cell tight junctions in rat small intestine. J Membr Biol 66:145-157. Malfertheiner P, Chan FK, McColl KE (2009). Peptic ulcer disease. Lancet 374:1449-1461. Mankertz J, Schulzke JD (2007). Altered permeability in inflammatory bowel disease: pathophysiology and clinical implications. Curr Opin Gastroenterol 23:379-383. Marcial MA, Carlson SL, Madara JL (1984). Partitioning of paracellular conductance along the ileal crypt-villus axis: a hypothesis based on structural analysis with detailed consideration of tight junction structure-function relationships. J Membr Biol 80:59-70. Martineau H, Thompson H, Taylor D (2009). Pathology of gastritis and gastric ulceration in the horse. Part 1: range of lesions present in 21 mature individuals. Equine Vet J 41:638-644.

109
McCance RA, Madders K (1930). Comparative rates of absorbtion from human intestine. Biochem J 24:795-804. McClure SR, Glickman LT, Glickman NW (1999). Prevalence of gastric ulcers in show horses. J Am Vet Med Assoc 215:1130-1133. McOmber ME, Ou CN, Shulman RJ (2010). Effects of timing, sex, and age on site-specific gastrointestinal permeability testing in children and adults. J Pediatr Gastroenterol Nutr 50:269-275. Meddings J (1997). Sucrose-how sweet is it? J Pediatr Gastroenterol Nutr 24:621-622. Meddings JB, Kirk D, Olson ME (1995a). Noninvasive detection of nonsteroidal anti-inflammatory drug-induced gastropathy in dogs. Am J Vet Res 56:977-981. Meddings JB, Wallace JL, Sutherland LR (1995b). Sucrose Permeability: A Novel Means of Detecting Gastroduodenal Damage Noninvasively. Am J Ther 2:843-849. Meddings JB, Sutherland LR, Byles NI, Wallace JL (1993). Sucrose: a novel permeability marker for gastroduodenal disease. Gastroenterology 104:1619-1626. Melichar B, Zezulova M (2011). The significance of altered gastrointestinal permeability in cancer patients. Curr Opin Support Palliat Care 5:47-54. Menard S, Cerf-Bensussan N, Heyman M (2010). Multiple facets of intestinal permeability and epithelial handling of dietary antigens. Mucosal Immunol 3:247-259. Menzies IS (1972a). Alimentary disacchariduria in adults related to osmolality of ingested solutions. Biochem J 126:19P-20P. Menzies IS (1972b). Intestinal permeability in coeliac disease. Gut 13:847. Menzies IS (1974). Absorbtion of intact oligosaccharide in health and disease. Biochem Soc Trans 2:1042-1047. Menzies IS (1984). Transmucosal passage of inert molecules in health and disease. In: Intestinal absorbtion and secretion. Skadhauge E, Heintze K. Lancaster, MTP Press Ltd: 527-543. Menzies IS, Laker MF, Pounder R, Bull J, Heyer S, Wheeler PG, Creamer B (1979). Abnormal intestinal permeability to sugars in villous atrophy. Lancet 2:1107-1109. Merritt AM, Burrow JA, Hartless CS (1998). Effect of xylazine, detomidine, and a combination of xylazine and butorphanol on equine duodenal motility. Am J Vet Res 59:619-623. Merritt AM, Sanchez LC, Burrow JA, Church M, Ludzia S (2003). Effect of GastroGard and three compounded oral omeprazole preparations on 24 h intragastric pH in gastrically cannulated mature horses. Equine Vet J 35:691-695. Molyneux ME, Looareesuwan S, Menzies IS, Grainger SL, Phillips RE, Wattanagoon Y, Thompson RP, Warrell DA (1989). Reduced hepatic blood flow and intestinal malabsorption in severe falciparum malaria. Am J Trop Med Hyg 40:470-476.

110
Monki J, Hewetson M, Virtala AM (2016). Risk Factors for Equine Gastric Glandular Disease: A Case-Control Study in a Finnish Referral Hospital Population. J Vet Intern Med 30:1270-1275. Moore R, Carlson S, Madara JL (1989). Villus contraction aids repair of intestinal epithelium after injury. Am J Physiol 257:G274-283. Mujagic Z, Ludidi S, Keszthelyi D, Hesselink MA, Kruimel JW, Lenaerts K, Hanssen NM, Conchillo JM, Jonkers DM, Masclee AA (2014). Small intestinal permeability is increased in diarrhoea predominant IBS, while alterations in gastroduodenal permeability in all IBS subtypes are largely attributable to confounders. Aliment Pharmacol Ther 40:288-297. Munkholm P, Langholz E, Hollander D, Thornberg K, Orholm M, Katz KD, Binder V (1994). Intestinal permeability in patients with Crohn's disease and ulcerative colitis and their first degree relatives. Gut 35:68-72. Murray MJ (1989). Endoscopic appearance of gastric lesions in foals: 94 cases (1987-1988). J Am Vet Med Assoc 195:1135-1141. Murray MJ (1991). The Pathogenesis and Prevalence of Gastric-Ulceration in Foals and Horses. Vet Med 86:815-819. Murray MJ (1992). Gastric ulceration in horses: 91 cases (1987-1990). J Am Vet Med Assoc 201:117-120. Murray MJ, Eichorn ES (1996). Effects of intermittent feed deprivation, intermittent feed deprivation with ranitidine administration, and stall confinement with ad libitum access to hay on gastric ulceration in horses. Am J Vet Res 57:1599-1603. Murray MJ, Grodinsky C, Anderson CW, Radue PF, Schmidt GR (1989). Gastric ulcers in horses: a comparison of endoscopic findings in horses with and without clinical signs. Equine Vet J Suppl:68-72. Murray MJ, Haven ML, Eichorn ES, Zhang D, Eagleson J, Hickey GJ (1997). Effects of omeprazole on healing of naturally-occurring gastric ulcers in thoroughbred racehorses. Equine Vet J 29:425-429. Murray MJ, Mahaffey EA (1993). Age-related characteristics of gastric squamous epithelial mucosa in foals. Equine Vet J. 25:514-517. Murray MJ, Murray CM, Sweeny HJ, Weld J, Wingfield-Digby NJ, Stoneham SJ (1990). Prevalence of gastric lesions in foals without signs of gastric disease: an endoscopic survey. Equine Vet J 22:6-8. Murray MJ, Nout YS, Ward DL (2001). Endoscopic findings of the gastric antrum and pylorus in horses: 162 cases (1996-2000). J Vet Intern Med 15:401-406. Murray MJ, Schusser GF, Pipers FS, Gross SJ (1996). Factors associated with gastric lesions in thoroughbred racehorses. Equine Vet J 28:368-374. Musgrave W (1701). A letter concerning some experiments made for transmitting a blue coloured liquor into the lacteals. Philos Trans R Soc London 22:996-998. Naftalin RJ, Tripathi S (1985). Passive water flows driven across the isolated rabbit ileum by osmotic, hydrostatic and electrical gradients. J Physiol 360:27-50.

111
Nappert G, Vrins A, Larybyere M (1989). Gastroduodenal ulceration in foals. Compend Contin Educ:338-345. Nejdfors P, Ekelund M, Jeppsson B, Westrom BR (2000). Mucosal in vitro permeability in the intestinal tract of the pig, the rat, and man: species- and region-related differences. Scand J Gastroenterol 35:501-507. Nicol CJ, Davidson HP, Harris PA, Waters AJ, Wilson AD (2002). Study of crib-biting and gastric inflammation and ulceration in young horses. Vet Rec 151:658-662. Nieto JE, Snyder JR, Beldomenico P, Aleman M, Kerr JW, Spier SJ (2004). Prevalence of gastric ulcers in endurance horses-a preliminary report. Vet J 167:33-37. Norman K, Pirlich M, Schulzke JD, Smoliner C, Lochs H, Valentini L, Buhner S (2012). Increased intestinal permeability in malnourished patients with liver cirrhosis. Eur J Clin Nutr 66:1116-1119. Nurok D, Reardon TJ (1975). Quantitative determination of sugars in factory products by gas chromatography using open tubular columns. Proceedings of The South African Sugar Technologists' Association:94-97. Nusrat A, Turner JR, Madara JL (2000). Molecular physiology and pathophysiology of tight junctions. IV. Regulation of tight junctions by extracellular stimuli: nutrients, cytokines, and immune cells. Am J Physiol Gastrointest Liver Physiol 279:G851-857. O'Conner MS, Steiner JM, Roussel AJ, Williams DA, Meddings JB, Pipers F, Cohen ND (2004). Evaluation of urine sucrose concentration for detection of gastric ulcers in horses. Am J Vet Res 65:31-39. Okai K, Taharaguchi S, Orita Y, Yokota H, Taniyama H (2015). Comparative endoscopic evaluation of normal and ulcerated gastric mucosae in Thoroughbred foals. J Vet Med Sci 77:449-453. Oktedalen O, Lunde OC, Opstad PK, Aabakken L, Kvernebo K (1992). Changes in the gastrointestinal mucosa after long-distance running. Scand J Gastroenterol 27:270-274. Owczuk R, Dylczyk-Sommer A, Wojciechowski J, Paszkiewicz M, Wujtewicz M, Stepnowski P, Twardowski P, Sawicka W, Domzalski M, Wujtewicz MA (2016). The influence of epidural blockade on gut permeability in patients undergoing open surgical repair of abdominal aortic aneurysm. Anaesthesiol Intensive Ther 48:122-127. Pals KL, Chang RT, Ryan AJ, Gisolfi CV (1997). Effect of running intensity on intestinal permeability. J Appl Physiol (1985) 82:571-576. Pantzar N, Ekstrom GM, Wang Q, Westrom BR (1994). Mechanisms of increased intestinal [51Cr]EDTA absorption during experimental colitis in the rat. Dig Dis Sci 39:2327-2333. Pantzar N, Weström BR, Luts A, Lundin S (1993). Regional small-intestinal permeability in vitro to different-sized dextrans and proteins in the rat. Scand J Gastroenterol 28:205-211. Pappenheimer JR, Renkin EM, Borrero LM (1951). Filtration, diffusion and molecular sieving through peripheral capillary membranes; a contribution to the pore theory of capillary permeability. Am J Physiol. 167:13-46.

112
Pascual S, Such J, Esteban A, Zapater P, Casellas JA, Aparicio JR, Girona E, Gutierrez A, Carnices F, Palazon JM, Sola-Vera J, Perez-Mateo M (2003). Intestinal permeability is increased in patients with advanced cirrhosis. Hepatogastroenterology 50:1482-1486. Pearson AD, Eastham EJ, Laker MF, Craft AW, Nelson R (1982). Intestinal permeability in children with Crohn's disease and coeliac disease. Br Med J (Clin Res Ed) 285:20-21. Peeters M, Ghoos Y, Maes B, Hiele M, Geboes K, Vantrappen G, Rutgeerts P (1994). Increased permeability of macroscopically normal small bowel in Crohn's disease. Dig Dis Sci 39:2170-2176. Pellegrini FL (2005). Results of a large-scale necroscopic study of equine colonic ulcers. J Equine Sci 25:113-117. Peterson RE, O'Toole JJ, Kirkendall WM, Kempthorne O (1959). The variability of extracellular fluid space (sucrose) in man during a 24 hour period. J Clin Invest 38:1644-1658. Pfeiffer RM, Castle PE (2005). With or without a gold standard. Epidemiology 16:595-597. Pietra M, Morini M, Perfetti G, Spadari A, Vigo P, Peli A (2010). Comparison of endoscopy, histology, and cytokine mRNA of the equine gastric mucosa. Vet Res Commun 34 Suppl 1:S121-124. Pollitt CC, Visser MB (2010). Carbohydrate alimentary overload laminitis. Vet Clin North Am Equine Pract 26:65-78. Puspok A, Oberhuber G, Wyatt J, Maier-Dobersberger T, Hammer J, Pfeffel F, Wrba F, Potzi R, Vogelsang H (1998). Gastroduodenal permeability in Crohn's disease. Eur J Clin Invest 28:67-71. Rabassa AA, Goodgame R, Sutton FM, Ou CN, Rognerud C, Graham DY (1996). Effects of aspirin and Helicobacter pylori on the gastroduodenal mucosal permeability to sucrose. Gut 39:159-163. Rabuffo TS, Orsini JA, Sullivan E, Engiles J, Norman T, Boston R (2002). Associations between age or sex and prevalence of gastric ulceration in Standardbred racehorses in training. J Am Vet Med Assoc 221:1156-1159. Rebhun WC, Dill SG, Power HT (1982). Gastric ulcers in foals. J Am Vet Med Assoc 180:404-407. Rhodes JM (1989). Colonic mucus and mucosal glycoproteins: the key to colitis and cancer? Gut 30:1660-1666. Rice L, Ott EA, Beede DK, Wilcox CJ, Johnson EL, Lieb S, Borum P (1992). Use of Oral Tolerance-Tests to Investigate Disaccharide Digestion in Neonatal Foals. J Anim Sci 70:1175-1181. Roberts MC (1975a). Carbohydrate digestion and absorption in the equine small intestine. J S Afr Vet Assoc 46:19-27. Roberts MC (1975b). Carbohydrate digestion and absorption studies in the horse. Res Vet Sci 18:64-69.
113
Roberts MC (1990). Gastric lesions and gastric ulceration in foals. Equine Vet J 22:2-4. Rodriguez H, Suchodolski JS, Berghoff N, Steiner JM (2009). Development and analytic validation of a gas chromatography-mass spectrometry method for the measurement of sugar probes in canine serum. Am J Vet Res 70:320-329. Rosenqvist-Salo M (2014). The effect of sedation on the sucrose permeability curve. Kliininen hevos- ja pieneläinlääketieteen laitos, Eläinlääketieteellinen tiedekunta. Helsinki, Helsingin yliopisto. Lisensiaatin tutkielma. Rutgers HC, Batt RM, Hall EJ, Sorensen SH, Proud FJ (1995). Intestinal permeability testing in dogs with diet-responsive intestinal disease. J Small Anim Pract. 36:295-301. Rutgers HC, Batt RM, Proud FJ, Sorensen SH, Elwood CM, Petrie G, Matthewman LA, Forster-van Hijfte MA, Boswood A, Entwistle M ,Fensome RH (1996). Intestinal permeability and function in dogs with small intestinal bacterial overgrowth. Journal of Small Animal Practice. 37:428-434. Ryan AJ, Chang RT, Gisolfi CV (1996). Gastrointestinal permeability following aspirin intake and prolonged running. Med Sci Sports Exerc 28:698-705. Santos J, Yang PC, Soderholm JD, Benjamin M, Perdue MH (2001). Role of mast cells in chronic stress induced colonic epithelial barrier dysfunction in the rat. Gut 48:630-636. Sasaki N, Aiuchi H, Yamada H (2005). Use of 13C-acetate breath test for assessment of gastric emptying in horses. J Vet Med Sci 67:993-997. Schaerer E, Neutra MR, Kraehenbuhl JP (1991). Molecular and cellular mechanisms involved in transepithelial transport. J Membr Biol 123:93-103. Scheidegger MD, Gerber V, Bruckmaier RM, van der Kolk JH, Burger D, Ramseyer A (2017). Increased adrenocortical response to adrenocorticotropic hormone (ACTH) in sport horses with equine glandular gastric disease (EGGD). Vet J 228:7-12. Schultz SG, Soloman AK (1961). Determination of the effective hydrodynamic radii of small molecules by viscometry. J Gen Physiol 44:1189-1199. Schulzke JD, Bojarski C, Zeissig S, Heller F, Gitter AH, Fromm M (2006). Disrupted barrier function through epithelial cell apoptosis. Ann N Y Acad Sci 1072:288-299. Schulzke JD, Ploeger S, Amasheh M, Fromm A, Zeissig S, Troeger H, Richter J, Bojarski C, Schumann M, Fromm M (2009). Epithelial tight junctions in intestinal inflammation. Ann N Y Acad Sci 1165:294-300. Schurmann G, Bruwer M, Klotz A, Schmid KW, Senninger N, Zimmer KP (1999). Transepithelial transport processes at the intestinal mucosa in inflammatory bowel disease. Int J Colorectal Dis 14:41-46. Scott HM, Fosgate GT, Jordan E, Libal M, Sneed L (2007). Field testing of an enhanced direct-fecal polymerase chain reaction procedure, bacterial culture of feces, and a serum enzyme-linked immunosorbent assay for detecting Mycobacterium avium subsp paratuberculosis infection in adult dairy cattle. Am J Vet Res 68:236-245.

114
Seimiya M, Osawa S, Hisae N, Shishido T, Yamaguchi T, Nomura F (2004). A sensitive enzymatic assay for the determination of sucrose in serum and urine. Clin Chim Acta 343:195-199. Sequeira IR, Lentle RG, Kruger MC, Hurst RD (2014). Standardising the lactulose mannitol test of gut permeability to minimise error and promote comparability. PLoS One 9:e99256. Shishido T, Yamaguchi T, Odaka T, Seimiya M, Saisho H, Nomura F (2005). Significance of a novel sucrose permeability test using serum in the diagnosis of early gastric cancer. World J Gastroenterol 11:6905-6909. Siegel S, Castellan Jr NJ (1988). In: Nonparametric Statistics for the Behavioral Sciences. New York, McGraw-Hill Book Company: 262-272. Sjostedt Zsigmond C, Hannestad U, Franzen L, Soderholm JD, Borch K (2005). Atrophic gastritis is associated with increased sucrose permeability related to chronic inflammation. Digestion 72:201-206. Smecuol E, Bai JC, Sugai E, Vazquez H, Niveloni S, Pedreira S, Maurino E, Meddings J (2001). Acute gastrointestinal permeability responses to different non-steroidal anti-inflammatory drugs. Gut 49:650-655. Smecuol E, Bai JC, Vazquez H, Kogan Z, Cabanne A, Niveloni S, Pedreira S, Boerr L, Maurino E, Meddings JB (1997). Gastrointestinal permeability in celiac disease. Gastroenterology 112:1129-1136. Smecuol E, Vazquez H, Sugai E, Niveloni S, Pedreira S, Cabanne A, Fiorini A, Kogan Z, Maurino E, Meddings J, Bai JC (1999). Sugar tests detect celiac disease among first-degree relatives. Am J Gastroenterol 94:3547-3552. Smith SD, Cardona MA, Wishnev SA, Kurkchubasche AG, Rowe MI (1992). Unique characteristics of the neonatal intestinal mucosal barrier. J Pediatr Surg 27:333-336; discussion 336-338. Snipe RMJ, Khoo A, Kitic CM, Gibson PR, Costa RJS (2018). The impact of exertional-heat stress on gastrointestinal integrity, gastrointestinal symptoms, systemic endotoxin and cytokine profile. Eur J Appl Physiol 118:389-400. Soderholm JD, Olaison G, Franzen L, Borch K (1996). Increased gastric absorption of polyethylene glycols in atrophic gastritis. Digestion 57:191-195. Somasundaram S, Hayllar H, Rafi S, Wrigglesworth JM, Macpherson AJ, Bjarnason I (1995). The biochemical basis of non-steroidal anti-inflammatory drug-induced damage to the gastrointestinal tract: a review and a hypothesis. Scand J Gastroenterol 30:289-299. Steiner JM, Williams DA, Moeller EM (2002). Kinetics of urinary recovery of five sugars after orogastric administration in healthy dogs. Am J Vet Res 63:845-848. Strocchi A, Levitt MD (1991). A reappraisal of the magnitude and implications of the intestinal unstirred layer. Gastroenterology 101:843-847. Suchodolski JS, Steiner JM (2003). Laboratory assessment of gastrointestinal function. Clin Tech Small Anim Pract 18:203-210.
115
Sun Z, Wang X, Andersson R (1998). Role of intestinal permeability in monitoring mucosal barrier function. History, methodology, and significance of pathophysiology. Dig Surg 15:386-397. Sutherland LR, Verhoef M, Wallace JL, Van Rosendaal G, Crutcher R, Meddings J (1994). A simple, non-invasive marker of gastric damage: sucrose permeability. Lancet 343:998-1000. Sutton DGM, Bahr A, Preston T, Christley RM, Love S, Roussel AJ (2003). Validation of the 13C-octanoic acid breath test for measurement of equine gastric emptying rate of solids using radioscintigraphy. Equine Vet J 35:27-33. Swets JA (1988). Measuring the accuracy of diagnostic systems. Science 240:1285-1293. Sykes BW, Hewetson M, Hepburn RJ, Luthersson N, Tamzali Y (2015). European College of Equine Internal Medicine Consensus Statement-Equine Gastric Ulcer Syndrome in Adult Horses. J Vet Intern Med. 29:1288-1299. Sykes BW, Jokisalo JM (2014a). Rethinking equine gastric ulcer syndrome: Part 1 – Terminology, clinical signs and diagnosis. Equine Vet Educ. 26:543-547. Sykes BW, Jokisalo J, Hallowell GD (2014b). Evaluation of a commercial faecal blood test for the diagnosis 636 of gastric ulceration in Thoroughbred racehorses: A preliminary report [abstract]. BMC Vet Res 10. Szabo S (1987). Mechanisms of mucosal injury in the stomach and duodenum: time-sequence analysis of morphologic, functional, biochemical and histochemical studies. Scand J Gastroenterol Suppl 127:21-28. Tamzali Y, Marguet C, Priymenko N, Lyazrhi F (2011). Prevalence of gastric ulcer syndrome in high-level endurance horses. Equine Vet J 43:141-144. ter Steege RW, Kolkman JJ (2012). Review article: the pathophysiology and management of gastrointestinal symptoms during physical exercise, and the role of splanchnic blood flow. Aliment Pharmacol Ther 35:516-528. Thomson ABR, Dietschy JM (1984). The Role of the Unstirred Water Layer in Intestinal Permeation. In: Pharmacology of intestinal permeation II. Csáky TZ. New York, Springer: 165-269. Toft N, Jorgensen E, Hojsgaard S (2005). Diagnosing diagnostic tests: evaluating the assumptions underlying the estimation of sensitivity and specificity in the absence of a gold standard. Prev Vet Med 68:19-33. Tran L, Greenwood-Van Meerveld B (2013). Age-associated remodeling of the intestinal epithelial barrier. J Gerontol A Biol Sci Med Sci 68:1045-1056. Traub-Dagartz J, Bayly W, Riggs M, Thomas N, Pankowski R (1985). Exsanguination due to gastric ulceration in a foal. J Am Vet Med Assoc 186:280-281. Travis S, Menzies I (1992). Intestinal permeability: functional assessment and significance. Clin Sci (Lond) 82:471-488. Troeger H, Richter JF, Beutin L, Gunzel D, Dobrindt U, Epple HJ, Gitter AH, Zeitz M, Fromm M, Schulzke JD (2007). Escherichia coli alpha-haemolysin induces focal leaks in

116
colonic epithelium: a novel mechanism of bacterial translocation. Cell Microbiol 9:2530-2540. Turner JR (2009). Intestinal mucosal barrier function in health and disease. Nat Rev Immunol 9:799-809. Udall JN, Pang K, Fritze L, Kleinman R, Walker WA (1981). Development of gastrointestinal mucosal barrier. I. The effect of age on intestinal permeability to macromolecules. Pediatr Res 15:241-244. Uil JJ, van Elburg RM, Janssens PM, Mulder CJ, Heymans HS (2000). Sensitivity of a hyperosmolar or "low"-osmolar test solution for sugar absorption in recognizing small intestinal mucosal damage in coeliac disease. Dig Liver Dis 32:195-200. Ulluwishewa D, Anderson RC, McNabb WC, Moughan PJ, Wells JM, Roy NC (2011). Regulation of tight junction permeability by intestinal bacteria and dietary components. J Nutr 141:769-776. Umar IA, Ameh DA, Esievo KA (1998). Normal plasma lactose concentrations and kinetics of intravenously infused lactose in cattle. Res Vet Sci 65:1-4. Urao M, Okuyama H, Drongowski RA, Teitelbaum DH, Coran AG (1997). Intestinal permeability to small- and large-molecular-weight substances in the newborn rabbit. J Pediatr Surg 32:1424-1428. Ussing HH, Windhager EE (1964). Nature of shunt path and active sodium transport path through frog skin epithelium. Acta Physiol Scand 61:484-504. Vacek PM (1985). The effect of conditional dependence on the evaluation of diagnostic tests. Biometrics 41:959–968. van Elburg RM, Kokke FT, Uil JJ, Mulder CJ, de Monchy JG, Heymans HS (1993). Measurement of selective intestinal permeability using a new, simple sugar absorption test. Ned Tijdschr Geneeskd 137:2091-2095. van Wijck K, Lenaerts K, van Loon LJ, Peters WH, Buurman WA, Dejong CH (2011). Exercise-induced splanchnic hypoperfusion results in gut dysfunction in healthy men. PLoS One 6:e22366. Vanuytsel T, van Wanrooy S, Vanheel H, Vanormelingen C, Verschueren S, Houben E, Salim Rasoel S, Tomicronth J, Holvoet L, Farre R, Van Oudenhove L, Boeckxstaens G, Verbeke K, Tack J (2014). Psychological stress and corticotropin-releasing hormone increase intestinal permeability in humans by a mast cell-dependent mechanism. Gut 63:1293-1299. Varbanova M, Frauenschlager K, Malfertheiner P (2014). Chronic gastritis - an update. Best Pract Res Clin Gastroenterol 28:1031-1042. Vatistas NJ, Snyder JR, Carlson G, Johnson B, Arthur RM, Thurmond M, Zhou H, Lloyd KL (1999). Cross-sectional study of gastric ulcers of the squamous mucosa in thoroughbred racehorses. Equine Vet J Suppl:34-39. Ventura MT, Polimeno L, Amoruso AC, Gatti F, Annoscia E, Marinaro M, Di Leo E, Matino MG, Buquicchio R, Bonini S, Tursi A, Francavilla A (2006). Intestinal permeability in patients with adverse reactions to food. Dig Liver Dis 38:732-736.
117
Vera JF, Gotteland M, Chavez E, Vial MT, Kakarieka E ,Brunser O (1997). Sucrose permeability in children with gastric damage and Helicobacter pylori infection. J Pediatr Gastroenterol Nutr 24:506-511. Vettorazzi G, MacDonald I (1988). In: Sucrose. Nutritional and safety aspects. New York, Springer-Verlag Vicario M, Alonso C, Santos J (2009). Impaired intestinal molecular tightness in the mucosa of irritable bowel syndrome: what are the mediators? Gut 58:161-162. Videla R, Andrews FM (2009). New perspectives in equine gastric ulcer syndrome. Vet Clin North Am Equine Pract 25:283-301. Viera AJ, Garrett JM (2005). Understanding interobserver agreement: the kappa statistic. Fam Med. 37:360-363. Vinet B, Panzini B, Boucher M, Massicotte J (1998). Automated enzymatic assay for the determination of sucrose in serum and urine and its use as a marker of gastric damage. Clin Chem 44:2369-2371. Vogelsang H, Genser D, Wyatt J, Lochs H, Ferenci P, Granditsch G, Penner E (1995). Screening for celiac disease: a prospective study on the value of noninvasive tests. American J Gastroenterol 90:394-398. Vogelsang H, Oberhuber G, Wyatt J (1996). Lymphocytic gastritis and gastric permeability in patients with celiac disease. Gastroenterology 111:73-77. Walker RI, Owen RL (1990). Intestinal barriers to bacteria and their toxins. Annu Rev Med 41:393-400. Wallace JL (1993). Gastric ulceration: critical events at the neutrophil-endothelium interface. Can J Physiol Pharmacol 71:98-102. Wallon C, Braaf Y, Wolving M, Olaison G, Soderholm JD (2005). Endoscopic biopsies in Ussing chambers evaluated for studies of macromolecular permeability in the human colon. Scand J Gastroenterol 40:586-595. Weber MP, Martin LJ, Dumon HJ, Biourge VC, Nguyen PG (2002). Influence of age and body size on intestinal permeability and absorption in healthy dogs. Am J Vet Res 63:1323-1328. Weiss DJ, Evanson OA, Green BT, Brown DR (2000). In vitro evaluation of intraluminal factors that may alter intestinal permeability in ponies with carbohydrate-induced laminitis. Am J Vet Res 61:858-861. Weser E, Sleisenger MH (1965). Lactosuria and lactase deficiency in adult celiac disease. Gastroenterology 48:571-578. Wheeler PG, Menzies IS, Creamer B (1978). Effect of hyperosmolar stimuli and coeliac disease on the permeability of the human gastrointestinal tract. Clin Sci Mol Med 54:495-501.

118
Wilairatana P, Meddings JB, Ho M, Vannaphan S, Looareesuwan S (1997). Increased gastrointestinal permeability in patients with Plasmodium falciparum malaria. Clinical Infectious Diseases 24:430-435. Wild GE, Waschke KA, Bitton A, Thomson AB (2003). The mechanisms of prednisone inhibition of inflammation in Crohn's disease involve changes in intestinal permeability, mucosal TNFalpha production and nuclear factor kappa B expression. Aliment Pharmacol Ther 18:309-317. Wilson JH (1985). Gastric and duodenal ulcers in foals: A retrospective study. Proceedings of the Second Equine Colic Research Symposium. Wyatt J, Oberhuber G, Pongratz S, Puspok A, Moser G, Novacek G, Lochs H, Vogelsang H (1997). Increased gastric and intestinal permeability in patients with Crohn's disease. Am J Gastroenterol 92:1891-1896. Wyse CA, Murphy DM, Preston T, Sutton DGM, Morrison DJ, Christley RM, Love S (2001). The 13C-octanoic acid breath test for dtection of effects of meal composistion on the rate of solid-phase gastric emptying in ponies. Res Vet Sci 71:81-83. Yamaguchi T, Shishido T, Hara T, Ohyama N, Sudo K, Nakamura K, Denda T, Ishihara T, Yokosuka O, Nomura F (2009). Significance of sucrose permeability test in detecting early gastric cancer and changes of permeability after endoscopic mucosal resection. Hepatogastroenterology 56:561-564. Youden WJ (1950). Index for rating diagnostic tests. Cancer 3. Yuasa H, Kuno C, Watanabe J (1997). Comparative assessment of D-xylose absorption between small intestine and large intestine. J Pharm Pharmacol 49:26-29. Zedler ST, Embertson RM, Bernard WV, Barr BS, Boston RC (2009). Surgical treatment of gastric outflow obstruction in 40 foals. Vet Surg 38:623-630. Zeissig S, Burgel N, Gunzel D, Richter J, Mankertz J, Wahnschaffe U, Kroesen AJ, Zeitz M, Fromm M, Schulzke JD (2007). Changes in expression and distribution of claudin 2, 5 and 8 lead to discontinuous tight junctions and barrier dysfunction in active Crohn's disease. Gut 56:61-72.

119
Original publications (I-IV)