Embed Size (px)
Citation preview

SUEZ LNG NA: A Leading Player in the
U.S. LNG Market
Clay Harris, CEO of SUEZ LNG NA LLCMay 30,2007

2Houston, May 30, 2007
Disclaimer
Important InformationThis communication does not constitute an offer to sell or the solicitation of an offer to sell any securities of Suez, nor shall there be any sale of securities in any jurisdiction (including the United States, Germany, Italy and Japan) in which such offer, solicitation or sale would be unlawful prior to the registration or qualification under the laws of such jurisdiction. The distribution of this communication may, in some countries, be restricted by law or regulation. Accordingly, persons who come into possession of this document should inform themselves of and observe these restrictions. To the fullest extent permitted by applicable law, Suez disclaim any responsibility or liability for the violation of such restrictions by any person.
Forward-Looking statementsThis communication contains forward-looking information and statements about Suez. Forward-looking statements are statements that are not historical facts. These statements include financial projections, synergies, cost-savings and estimates and their underlying assumptions, statements regarding plans, objectives, savings, and expectations with respect to future operations, products and services, and statements regarding future performance. Forward-looking statements are generally identified by the words “expect,” “anticipates,” “believes,” “intends,” “estimates” and similar expressions. Although the managements of Suez believe that the expectations reflected in such forward-looking statements are reasonable, investors and holders of Suez ordinary shares are cautioned that forward-looking information and statements are not guarantees of future performances and are subject to various risks and uncertainties, many of which are difficult to predict and generally beyond the control of Suez, that could cause actual results, developments, synergies, savings and expectations to differ materially from those expressed in, or implied or projected by, the forward-looking information and statements. These risks and uncertainties include those discussed or identified in the public filings with the Autorité des marchésfinanciers (“AMF”) made by Suez, including those listed under “Facteurs de Risques” in the Document deRéférence and its update filed by Suez on April 4, 2007 (under no: D.07-0272), as well as documents filed by Suez with the SEC, including those listed under “Risk Factors” in the Annual Report on Form 20-F for 2006 that Suez filed with the SEC on June 26, 2006, and in the Amended Annual Report on Form 20-F/A filed with the SEC on February 1, 2007. Except as required by applicable law, Suez doesn’t undertake any obligation to update any forward-looking information or statements.

3Houston, May 30, 2007
SUEZ LNG NA/Distrigas Profile
Key Facts & FiguresCurrently, one of the top 2 importers of LNG into the U.S.Owns or holds long-term charters for multiple LNG tankers Owns and operates the Everett LNG Terminal north of Boston Long-term LNG sales contract with EcoElectrica in Puerto RicoSpot contracts with capacity holders at Cove Point, Maryland and elsewhereHas delivered LNG to all 6 U.S. LNG terminals: Everett, MA (SUEZ terminal); Cove Point, MD; Elba Island, GA; Lake Charles, LA; Puerto Rico; and Gulf Gateway
Elba Island, Georgia
Everett, Massachusetts
Cove Point, Maryland
Lake Charles, Louisiana
Puerto Rico
Gulf Gateway

4Houston, May 30, 2007
U.S. Natural Gas Market Overview
U.S. natural gas market continues to evolve from a regional market to a more global one through the increasing importance of LNG
Today, the U.S. market is contributing substantially to global gas trade liquidity due to:
Transparency and depth of the U.S. market
Increased LNG supply diversification, linking the U.S. market more closely to Europe and Asia
More than 50% of the imported LNG volumes into the U.S. in recent years being cargoes not originally contracted to serve the U.S. market

5Houston, May 30, 2007
U.S. Natural Gas Production, Consumption, and Net Imports,1960-2030 (trillion cubic feet)
0
5
10
15
20
25
30
1960 1970 1980 1990 2000 2010 2020 2030
16%
21%Net ImportsConsumption
Production
Natural Gas Net Imports, 2005 and 2030 (trillion cubic feet)
2.9
0.60.9
4.5
0
1
2
3
4
5
6
7
Pipeline Liquefied Natural Gas
20052030
U.S. EIA Annual Energy Outlook 2007
History Projections

6Houston, May 30, 2007
U.S. Net Imports of Natural Gas, 1990-2030(trillion cubic feet)
-1
0
1
2
3
4
5
1990 1995 2000 2005 2010 2015 2020 2025 2030
Overseas LNG
Mexico
Canada
History Projections
U.S. EIA Annual Energy Outlook 2007

7Houston, May 30, 2007
Liquefaction Shipping Regasification
Supply Terminalling Marketing & Distribution
Exploration & Production
LNG Supply Chain
End Users
SUEZ is present in all links of the LNG supply chain, save E&P

8Houston, May 30, 2007
Import Terminal Investment Is Small Relative to Total Supply Chain Investment
An LNG import terminal is but one piece of a large and capital-intensive supply chain
Capital cost imbalance in the LNG Chain—Indicative costs for a typical 1 billion cubic feet per day/7.8 metric tonnes per annum LNG project
n.75-2.25
7- 82.5-4.5
Today, producers are facing greater investments given the rising costs of specialty materials, equipment manufacturing constraints, and scarcity of skilled laborers
1 - 1.2

9Houston, May 30, 2007
U.S. Markets Must Compete with Other World Gas Markets for LNG Supplies
LNG is a global commodity more tightly linking energy markets around the world. Price is the means by which markets balance supply and demandFundamentally, high NYMEX prices will attract cargoes and increase supply, while lower prices will result in LNG moving to other markets such as Europe or AsiaThe price tightrope is both short and long term. Prices must be low enough for consumers, yet sufficiently high to attract necessary supplies

10Houston, May 30, 2007
SUEZ’s Everett LNG Import Terminal
The Everett LNG Import Terminal is the longest-operating in the U.S., and the only continuously operating one
Opened in 1971 as a peak shaving facility to help meet New England’s relatively small natural gas demand
Today it is an essential part of the region’s energy supply mix
Trucking Capacity100 million cubic feet/day
Vaporization Capacity715 million cubic feet/day – sustainable1 billion cubic feet/day – maximum installed

11Houston, May 30, 2007
Importance of LNG in New England
LNG’s role in New England’s power production is critical.
Diversity of energy supply is essential and LNG is a cleaner alternative.
Distrigas supplies the fuel for the Mystic Generating Station, the largest power plant in New England.
SUEZ/Distrigas serves most gas utilities in New England and currently meets 20% of the region’s gas demand.
New England’s projected demand growth for natural gas is 1-2% per year for the foreseeable future.
New England is at the end of U.S. interstate pipeline system and near the end of Canadian pipelines.
The SUEZ/Distrigas terminal in Everett provides the necessary back pressure on the pipeline system.
Only with LNG is New England “first in line.”

12Houston, May 30, 2007
The Everett Terminaldirectly connects into:
Algonquin PipelineTennessee Gas Pipeline
KeySpan local distribution systemMystic Generating power plant
The Everett Terminal supplies LNG via truck to nearly all of the 46 customer-owned LNG storage tanks in region. (LNG is how natural gas is stored in New England.) Today, LNG
from Everett and these facilities can meet 35% to 40% of the natural gas demand on
peak days.
Importance of LNG in New England

13Houston, May 30, 2007
Growth Opportunity: Neptune Deepwater Port
The Shuttle and Regasificationvessel is based on a modified standard LNG ship

14Houston, May 30, 2007
Neptune Deepwater Port Overview
The deepwater port will consist of:
Specially designed LNG vessels called Shuttle and Regasification Vessels “SRVs”with onboard regasification systems and a receiving cone for the buoy connection
An unloading buoy system
A 13.4 mile 24” pipeline that will connect into the existing natural gas pipeline system that serves eastern Massachusetts
Each SRV will average a sendout of 400 million cubic feet of natural gas per day, with a peak sendout capability of 750 million cubic feet/day
Approximately 1 vessel visit per week
Dedicated Support Vessel
First shipment of LNG expected in Fall 2009

15Houston, May 30, 2007
Growth Opportunity: Calypso LNG Deepwater Port

16Houston, May 30, 2007
Calypso LNG Overview

17Houston, May 30, 2007
SUEZ LNG NA’s Market “Pull” Strategy
E&P Liquefaction Shipping Regasification Sales
Concentrate our resources on the downstream markets, where we have considerable expertise
Start from the customer, secure market access (regasificationpositions) and thus attract competitive supply
Develop portfolio flexibilities (FOB and shipping) & market arbitrage in order to increase profitability
18Houston, May 30, 2007
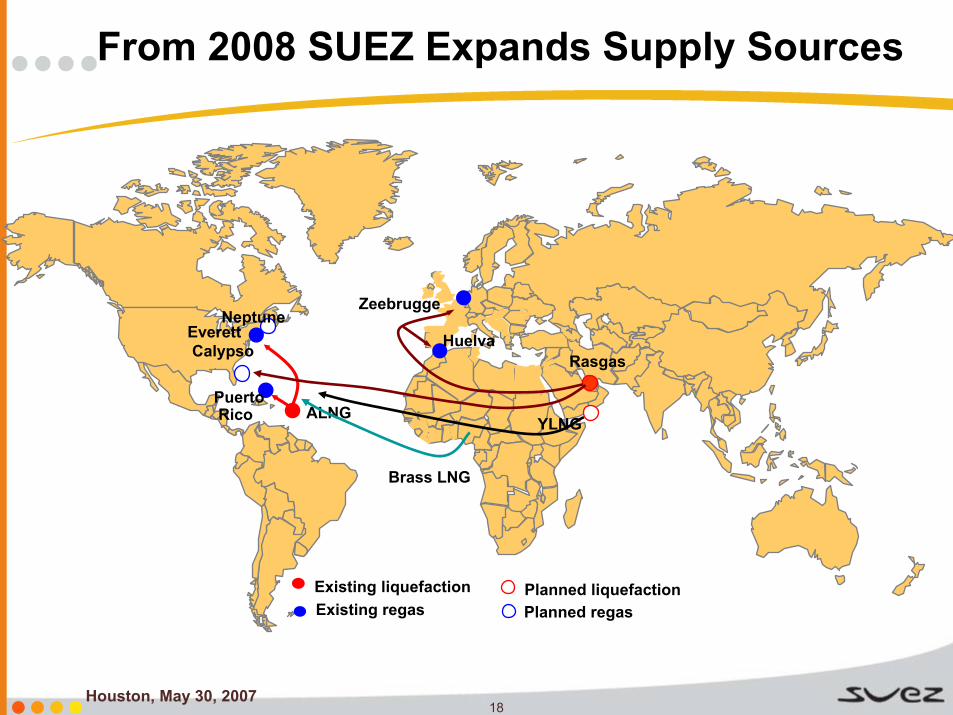
From 2008 SUEZ Expands Supply Sources
PuertoRico ALNG
Everett
Zeebrugge
YLNG
Neptune
RasgasCalypso
Existing liquefaction Existing regas
Planned liquefactionPlanned regas
Huelva
Brass LNG

19Houston, May 30, 2007
SUEZ LNG NA: A Leading LNG Player in the U.S.
LNG is playing an increasingly important role in the U.S.LNG enables cost effective gas transportation over long distancesThe U.S. is short of natural gas
SUEZ has a global LNG asset portfolio and strong foothold in thegrowing U.S. LNG market
One of the top two LNG importers into the U.S.35+ year track record- Most experienced importer and operator in the U.S./Excellent technical
capabilities- Strong reputation as a pacesetter operationally, technically, and in the
communities we operate
Ongoing development projects present opportunities for continued growth

20Houston, May 30, 2007
Appendix

21Houston, May 30, 2007
Major Sources of Incremental U.S. Natural Gas Supply2006-2030 (trillion cubic feet)
16
18
20
22
24
26
28
2005 2010 2015 2020 2025 2030
Growth in Alaskan Production
Growth inNon-Associated
Unconventional Sources
Growth in LNG Imports
Base Production (all sources)
U.S. EIA Annual Energy Outlook 2007

22Houston, May 30, 2007
2006 Daily U.S. LNG Imports
0.0
0.5
1.0
1.5
2.0
2.5
3.0
Jan-0
6
Feb-06
Mar-06
Apr-06
May-06
Jun-06
Jul-0
6
Aug-06
Sep-06
Oct-06
Nov-06
Dec-06
BC
F/d
$0
$2
$4
$6
$8
$10
$12
$14
$16
$18
Everett COVE POINT ELBA ISLANDLAKE CHARLES NYMEX - Front Month Price Zeebrugge
NBP

23Houston, May 30, 2007
What Accounts for the Peaks and Valleys?
Prices were stronger in Europe and Asia overall in 2006
Warmer than normal winter in the U.S. in 2005/2006
Colder than normal winter in Europe
Continued growth in demand last year in AsiaOverall demand increase in Korea
Nuclear facility outages in Japan
Preparation for summer peaking needs in India and Taiwan
Plus, there has been an increase in non-U.S. import capacity
Those LNG supplies not under long-term contract for the U.S. found more inviting destinations in Europe and Asia
The exception was during the summer months when prices in the U.S. and overseas were more in line with each other

24Houston, May 30, 2007
Key NYMEX Price Drivers
Weather
Supply disruptions – actual or perceived – ex. hurricane activity in the Gulf of Mexico
Oil prices
Growth in natural gas demand from the power generation sector
Strength of new supplies from the Rocky Mountains, Gulf of Mexico, and Canada (ex. Mackenzie Delta)
LNG imports
Overall economic health of the U.S. economy
25Houston, May 30, 2007
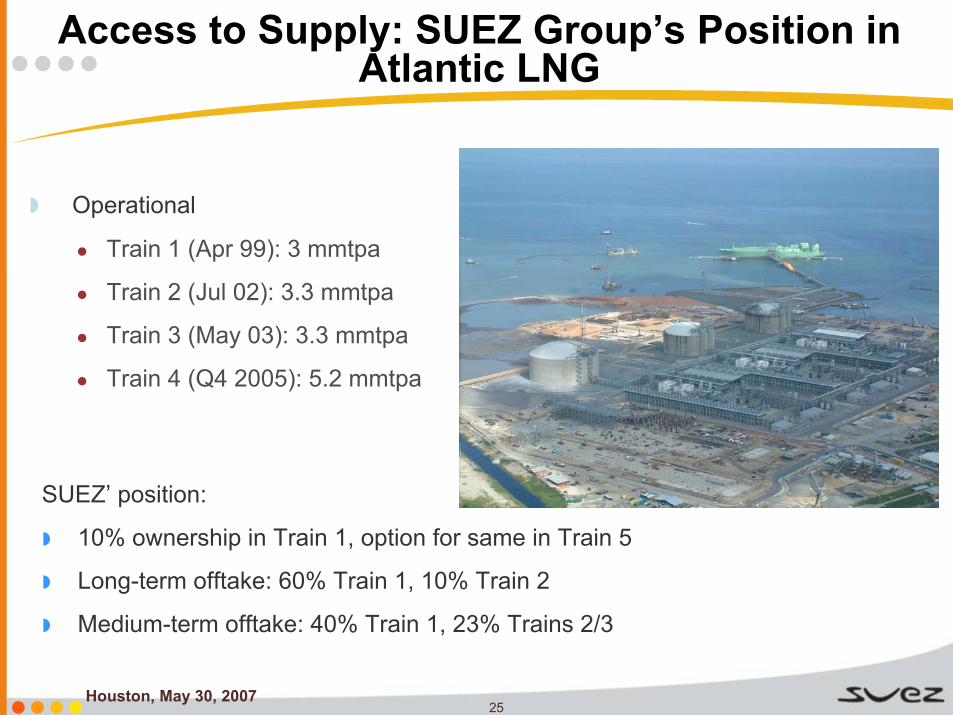
Access to Supply: SUEZ Group’s Position in Atlantic LNG
Operational
Train 1 (Apr 99): 3 mmtpa
Train 2 (Jul 02): 3.3 mmtpa
Train 3 (May 03): 3.3 mmtpa
Train 4 (Q4 2005): 5.2 mmtpa
SUEZ’ position:
10% ownership in Train 1, option for same in Train 5
Long-term offtake: 60% Train 1, 10% Train 2
Medium-term offtake: 40% Train 1, 23% Trains 2/3

26Houston, May 30, 2007
Access to Shipping: SUEZ Group’s Fleet
2023138,000m3“Berge Everett”
Q4 2009162,400 m3“SUEZ Paris“***
Q4 2009145,000m3Neptune SRVs”***
Q2 2009154,200m3“SUEZ Point Fortin”***
Q2 2009162,400m3“SUEZ Brussels”***
N/A130,000m3“Methania”
2023138,000m3“Berge Boston”**
2009138,000m3“Catalunya Spirit”
N/A125,000m3“SUEZ Matthew”*
Carrier Name CapacityTCP Term/In Service Date
*100% owned, **50% owned, ***under construction