Embed Size (px)
Citation preview
SUGAR AND ALLIED
INDUSTRY
DEC 2019

Process Flow
Sugarcane
Sugar Molasses
Ethanol
Bagasse
Power
Paper & Chipboard
Sugarcane Cubes
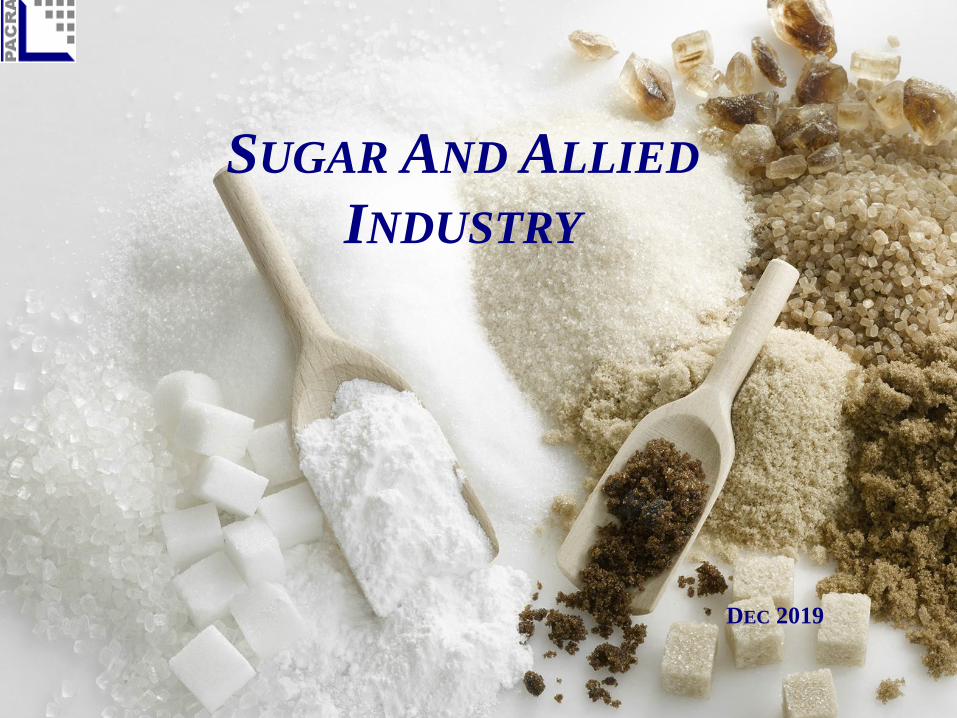
Farmer Sugar MillDistributor
&/or Industrial Consumers
Retail Stores End Customer
Supply Chain | Where do they fall?
Source: Economic Survey, Pakistan Bureau of Statistics and Pakistan Sugar Mills Association Annual Report, USDA Foreign Agricultural Services GAIN Report, World Food
Outlook – May’19
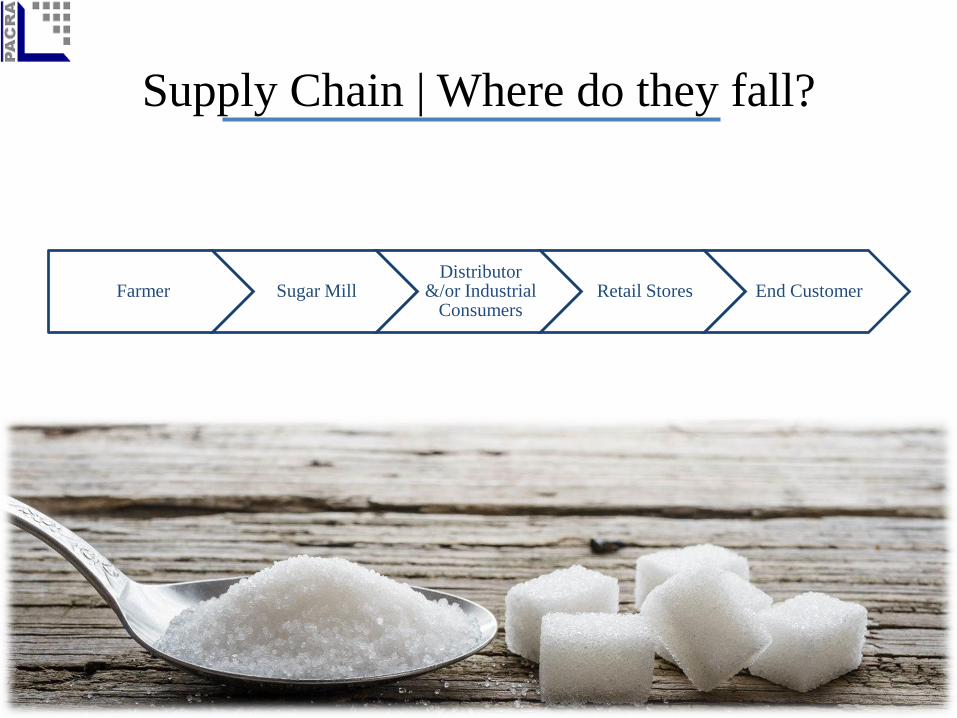
In MY19:
Value Addition in Agriculture ~ to 2.9%
Contribution in GDP ~ to 0.5%
Total No. of Industry Players ~ 75
Total No. of Listed Players - 30
Total No. Mills ~ 90
Total Sugar Production ~ 5.3mln tons
Total Sugar Consumption ~ 5.4mln tons
Average Per Capita Sugar Consumption:
Pakistan ~ 25.6 kg
Global ~ 23.1 kg
Sugar Industry | Key Stats
3.7
3.23.4
3.1 3.23.4
3.6
2.90.8
0.70.7
0.6 0.6
0.70.7
0.5
0
0.5
1
1.5
2
2.5
3
3.5
4
0
0.1
0.2
0.3
0.4
0.5
0.6
0.7
0.8
0.9
MY12 MY13 MY14 MY15 MY16 MY17 MY18 MY19
Agriculture's Value Addition (%) Contribution in GDP (%)

In MY19:
Cultivated land declined by ~12%
Sugar production declined by ~16%
Allowed Export Quota ~ upto 1 mln tons
Without freight subsidy, except Punjab @ Rs 5.3/Kg
Meagre exports ~ 0.2mln ton till Oct -Mar’19 (SMPLY: 0.8mln tons)
Reason: Low prices in international market compared to 0.8mln MT in SMPLY.
Key Assumptions for MY20 (Analyst Forecast):
Cultivated land projected ~ dip by 5%
Sugar production projected ~ dip by 5%
Exports may decline to 0.3mln tons as:
In domestic market: demand barely met plus maintains minimum stock levels
In international market: low sugar prices making exports non-competitive
Sugar Industry | Key Stats

Sugar Industry Dynamics1
.1
1.4
0.8
1.2
1.3
1.3
2.3
2.0
1.6
4.7
5.1
5.6
5.2
5.1
7.1
6.6
5.3
5.1
0.0
0.0
- - - - - - -
5.8
6.5
6.5
6.4
6.5
8.3
8.9
7.3
6.7
(0.0
)
(1.2
)
(0.8
)
(0.4
)
(0.3
)
(0.9
)
(1.5
)
(0.3
)
(0.3
)
(4.4
)
(4.4
)
(4.5
)
(4.6
)
(4.9
)
(5.1
)
(5.4
)
(5.4
)
(5.6
)
1.4
0.8
1.2
1.3
1.3
2.3
2.0
1.6
0.8
M Y1 2 M Y1 3 M Y1 4 M Y1 5 M Y1 6 M Y1 7 M Y1 8 M Y1 9 M Y2 0
(ANALYST
FO RECAST)
ML
N T
ON
S
Opening Stock Domestice Production Imports Total Available Sugar Suppply Exports Consumption Closing Stock

Government support
for farmers by
notifying minimum
sugarcane price led
the area under
cultivation to increase
In MY19, water
shortage posted a dip
in area under
cultivation
Sugarcane cultivation
area: Punjab ~ 65%,
Sindh ~ 25% and
KPK~ 10%
In MY20, water crisis
are expected to further
reduce the area under
cultivation
Source: MY20 – Production Target (69 mln tons) - Monetary Policy Compendium - PBS & Planning Commission of Pakistan, USDA Foreign Agricultural Services GAIN Report, Pakistan Sugar
Mills Association Annual Report
Sugarcane | Cultivation and Production
105 113 117 111 113 122 134 118112
58
64
67
6365
75
83
67
64
0
10
20
30
40
50
60
70
80
90
0
20
40
60
80
100
120
140
160
MY12 MY13 MY14 MY15 MY16 MY17 MY18 MY19 MY20 (Analyst
Forecast)
mln
to
ns
Are
a (
10
,00
0 h
ec),
Yie
ld/H
ec (
ton
s)
Sugarcane| Area Under Cultivation and Production
Plantation Area Production (RHS)

Source: USDA Foreign Agricultural Services GAIN Report, Pakistan Sugar Mills Association Annual Report, MY19 - Based on average utilization by mills and provisional Sugar production data
Lower than global average recovery rate in Pakistan (Brazil ~ 14%, India ~ 11.5%)
Higher recovery rates in Sindh
Significant R&D initiatives required to improve recovery rates
48.2 50.1 56.5 50.8 50.0 71.0 65.6 55.9 53.1
4.7 5 5.6 5.1 5.1 7 6.6 5.4 5.1
9.8%10% 9.9% 10% 10.2%
9.9% 10%
9.6% 9.6%
8%
9%
10%
11%
0.0
10.0
20.0
30.0
40.0
50.0
60.0
70.0
80.0
MY12 MY13 MY14 MY15 MY16 MY17 MY18 MY19 MY20(AnalystForecast)
Mln
To
ns
Sugarcane Crushed, Production & Recovery
Cane Crushed Sugar Made Recovery
Sugarcane | Processing

Source: USDA Foreign Agricultural Services GAIN Report, Pakistan Sugar Mills Association Annual Report
Local Market: Surplus production than required consumption level
Domestic consumption increase in line with population growth
Soft Drink and Confectionary Industry constitute a significant portion of in Sugar consumption
4.3 4.4 4.5 4.64.9
5.1 5.2 5.4
5.6
4.75.1
5.65.2 5.1
7.16.6
5.3
5.1
0.0
1.0
2.0
3.0
4.0
5.0
6.0
7.0
8.0
MY12 MY13 MY14 MY15 MY16 MY17 MY18 MY19 MY20
(Analyst
Forecast)
mln
to
ns
Sugar Consumption Sugar Production
Sugar | Production vs. Consumption

In MY16 Cane
Commissioner fixed the
price at PKR 172 for
Sindh, lower than
Punjab, and was
successfully challenged
by growers
Announced cane prices
were maintained in
MY19
In MY20, cane price
may surge upto PKR 200
per 40 kg
Source: Pakistan Sugar Mills Association Annual Report
Sugarcane Price | Notified by Government
150
170 170
180
180
180 180 180
190
154
172172
182
172
182 182 182
192
120
130
140
150
160
170
180
190
200
MY12 MY13 MY14 MY15 MY16 MY17 MY18 MY19 MY20
(Analyst
Forecast)
PK
R p
er 4
0k
g
Mill Gate Delivery Prices
Punjab & KPK Sindh
192-200
190-200
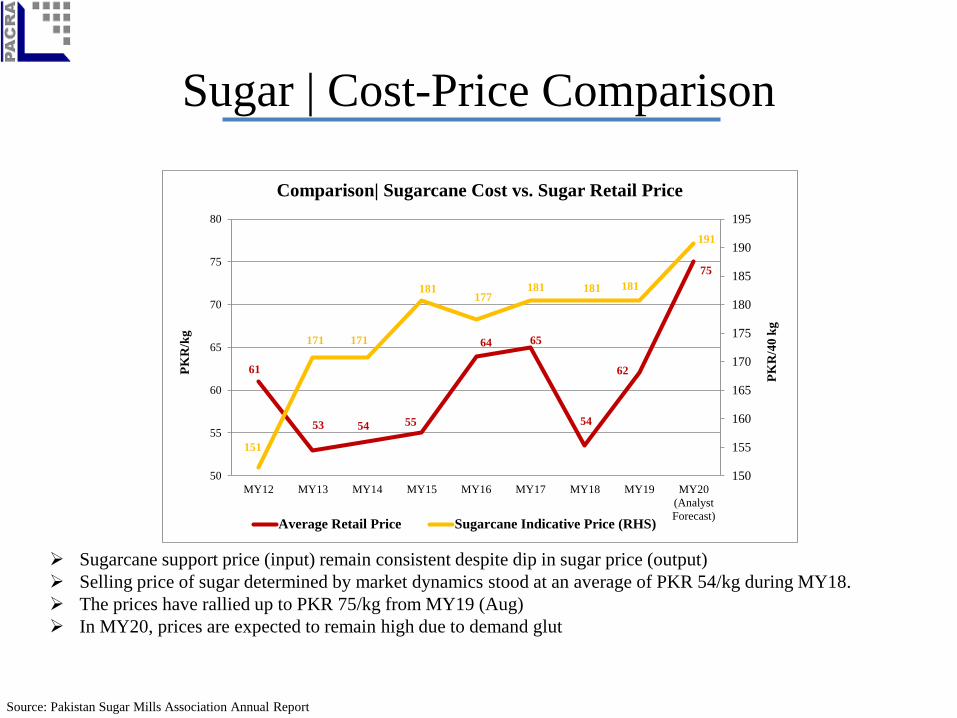
Sugarcane support price (input) remain consistent despite dip in sugar price (output)
Selling price of sugar determined by market dynamics stood at an average of PKR 54/kg during MY18.
The prices have rallied up to PKR 75/kg from MY19 (Aug)
In MY20, prices are expected to remain high due to demand glut
Source: Pakistan Sugar Mills Association Annual Report
Sugar | Cost-Price Comparison
61
53 54 55
64 65
54
62
75
151
171 171
181177
181 181 181
191
150
155
160
165
170
175
180
185
190
195
50
55
60
65
70
75
80
MY12 MY13 MY14 MY15 MY16 MY17 MY18 MY19 MY20
(Analyst
Forecast)
PK
R/4
0 k
g
PK
R/k
gComparison| Sugarcane Cost vs. Sugar Retail Price
Average Retail Price Sugarcane Indicative Price (RHS)

In MY18: sugar export
surged due to raised export
quota ~ 2mln MT coupled
with export subsidy of Rs
10.7/kg from the federal
government and an
additional subsidy of Rs
9.3/kg from the Sindh
government
In MY19, export quota was
revised to 1.1mln MT with
no subsidy was announced
at federal level
Punjab announced a
provincial subsidy of Rs
5.3/kg
Sugar exports are expected
to remain low due low
prices in international
market
Source: Pakistan Bureau of Statistics, USDA Foreign Agricultural Services GAIN Report
Sugar Industry | Exports
0.1
1.2
0.7
0.4
0.3
0.4
1.5
0.5
0.3
0.0
0.2
0.4
0.6
0.8
1.0
1.2
1.4
MY12 MY13 MY14 MY15 MY16 MY17 MY18 MY19 MY20
(Analyst
Forecast)
mln
to
ns

Source: Pakistan Sugar Mills Association Annual Report, Pakistan Bureau of Statistics, International Sugar Organization
Depressed international sugar prices due to excess sugar supply emanating from India and Thailand
Domestic Sugar prices are higher owing to lower yields, high recovery rates and high cost of production
Increase in Domestic prices emanates from lower sugar production during MY19
Sugar | Price Comparison
61
53
54
56
6365
54
62
7072
75
54
49
46
38
48
53
43
48 53
48
54
0.61
0.50
0.46
0.38
0.46 0.48
0.36
0.35 0.33
0.31
0.34
0.30
0.35
0.40
0.45
0.50
0.55
0.60
0.65
35
40
45
50
55
60
65
70
75
80
MY12 MY13 MY14 MY15 MY16 MY17 MY18 MY19
(Till Mar)
July Aug Sept
US
D/K
g
PK
R/k
g
International vs. Domestic Retail Prices
Average Retail Price (Domestic) Average Futures Prices (International) PKR Per kg Average Futures Prices (International)
USD/MT
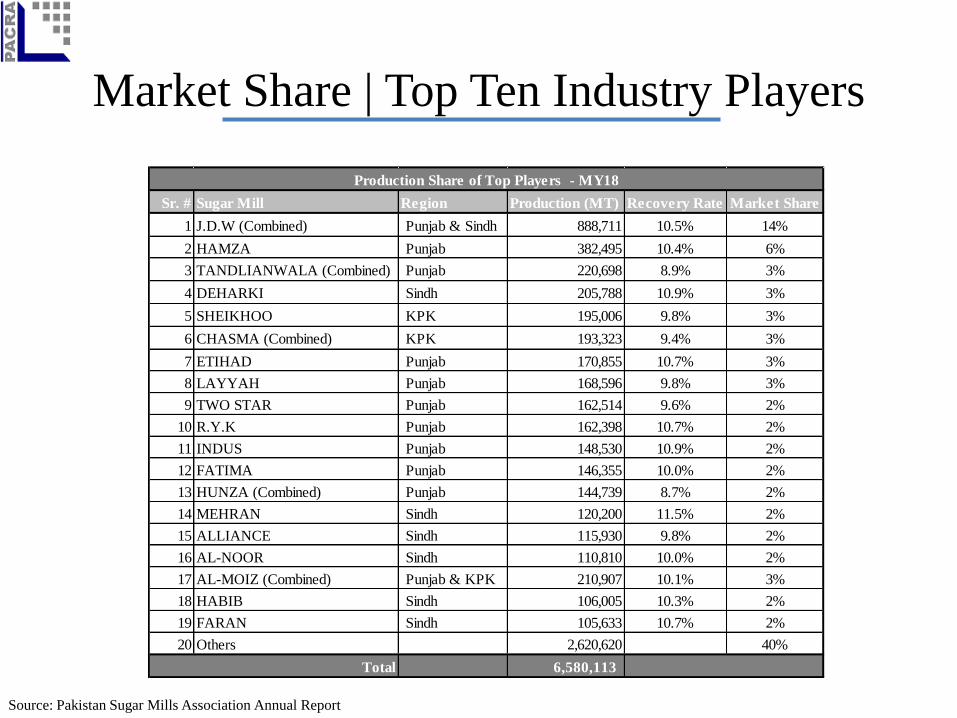
Market Share | Top Ten Industry Players
Sr. # Sugar Mill Region Production (MT) Recovery Rate Market Share
1 J.D.W (Combined) Punjab & Sindh 888,711 10.5% 14%
2 HAMZA Punjab 382,495 10.4% 6%
3 TANDLIANWALA (Combined) Punjab 220,698 8.9% 3%
4 DEHARKI Sindh 205,788 10.9% 3%
5 SHEIKHOO KPK 195,006 9.8% 3%
6 CHASMA (Combined) KPK 193,323 9.4% 3%
7 ETIHAD Punjab 170,855 10.7% 3%
8 LAYYAH Punjab 168,596 9.8% 3%
9 TWO STAR Punjab 162,514 9.6% 2%
10 R.Y.K Punjab 162,398 10.7% 2%
11 INDUS Punjab 148,530 10.9% 2%
12 FATIMA Punjab 146,355 10.0% 2%
13 HUNZA (Combined) Punjab 144,739 8.7% 2%
14 MEHRAN Sindh 120,200 11.5% 2%
15 ALLIANCE Sindh 115,930 9.8% 2%
16 AL-NOOR Sindh 110,810 10.0% 2%
17 AL-MOIZ (Combined) Punjab & KPK 210,907 10.1% 3%
18 HABIB Sindh 106,005 10.3% 2%
19 FARAN Sindh 105,633 10.7% 2%
20 Others 2,620,620 40%
6,580,113
Production Share of Top Players - MY18
Total
Source: Pakistan Sugar Mills Association Annual Report

─ Fluctuating gross margins due to cost-price disparity: Government notified Sugarcane
prices leads to high cost of production for the millers. While, the retail price for sugar rely
on supply - demand dynamics.
─ Unfeasible export avenues: Difficulty in selling sugar in the international market at better
prices despite devaluation of PKR in years of excess production.
┼ On import of sugar: Imposing 40% regulatory duty in Jun-15 (Previously: 20%).
┼ Diversification through revenues from co-generation projects: (i) molasses is also used
in the production of pharmaceutical and fuel grade ethanol while (ii) bagasse is used in
electricity generation and paper/chip board
Previous New
Sales Tax Sugar - Registered 8% (fixed @PKR 60/kg) 17% MRP
Additional Sales Tax - Unregistered 3% -
Regulatory duty on imports 40%
No sales tax on sugarcane as it’s an agriculture
Regulatory Structure & Risk Analysis
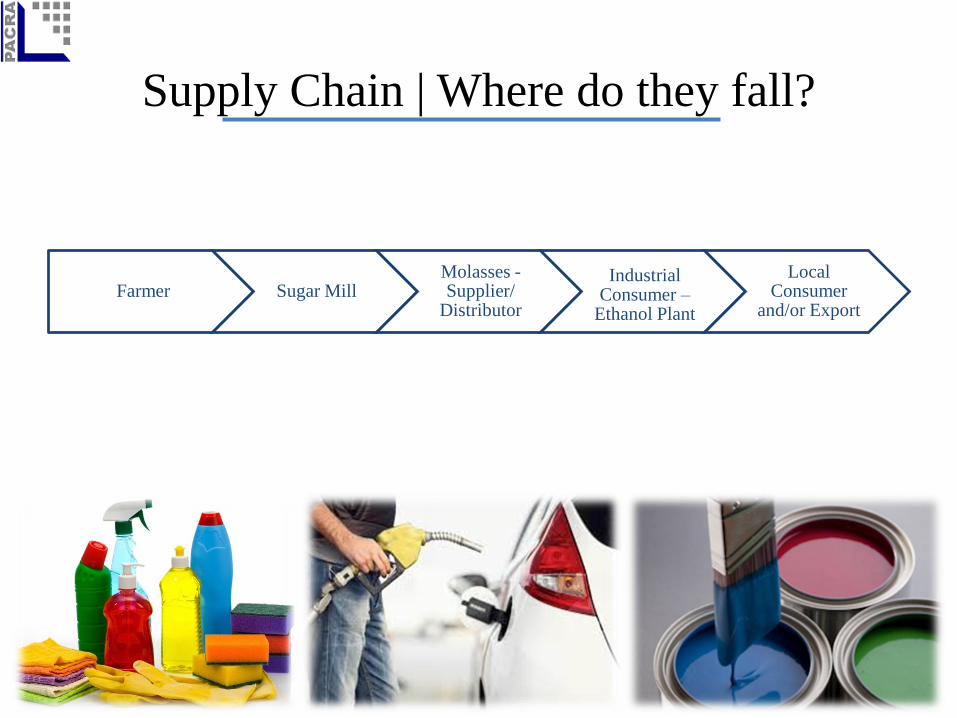
Farmer Sugar MillMolasses -Supplier/
Distributor
Industrial Consumer –
Ethanol Plant
Local Consumer
and/or Export
Supply Chain | Where do they fall?
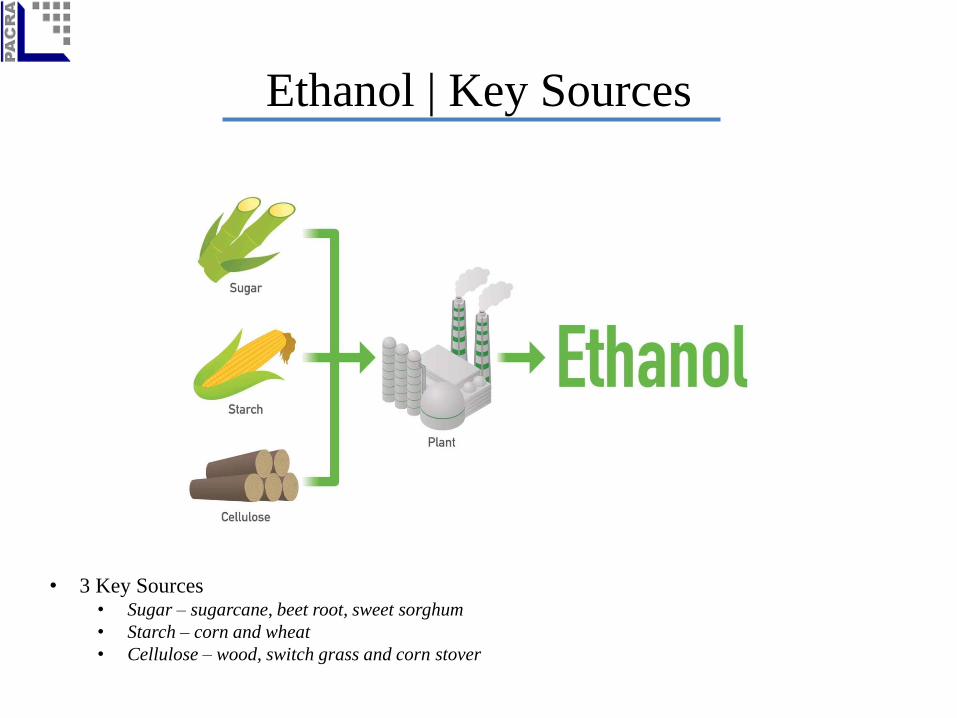
Ethanol | Key Sources
• 3 Key Sources • Sugar – sugarcane, beet root, sweet sorghum
• Starch – corn and wheat
• Cellulose – wood, switch grass and corn stover

Ethanol | Process Flow
• Dry milling : 90% of ethanol produced
• Process• From starch (grains): pre-processing to be transformed into glucose and its fermentation
• From sugarcane: simply dissolved in water
Source: Bioenergy Australia
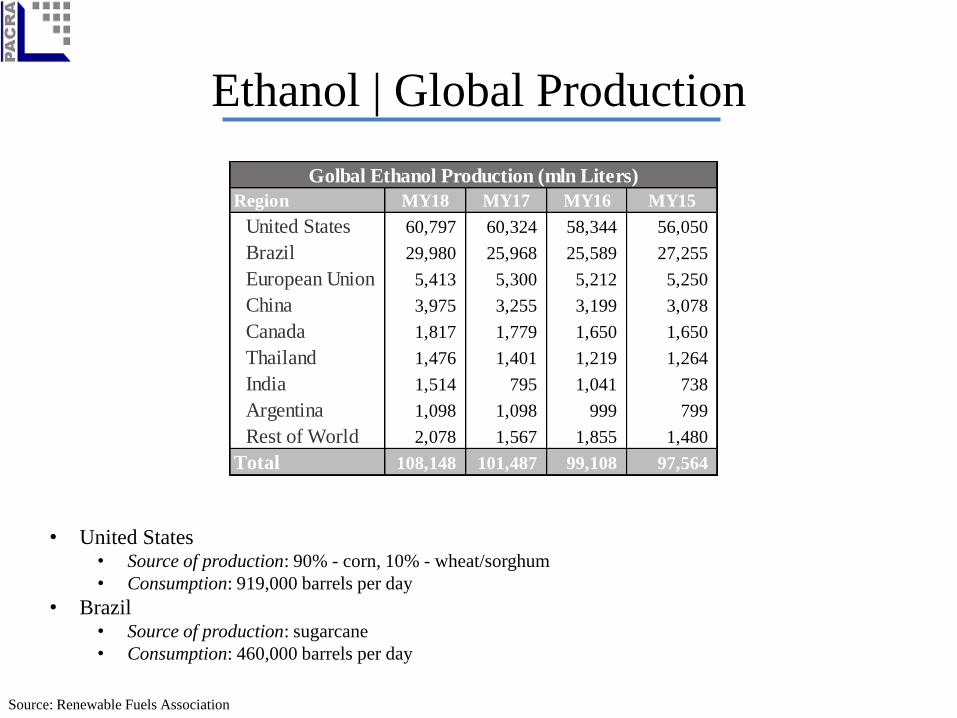
Ethanol | Global Production
• United States• Source of production: 90% - corn, 10% - wheat/sorghum
• Consumption: 919,000 barrels per day
• Brazil• Source of production: sugarcane
• Consumption: 460,000 barrels per day
Source: Renewable Fuels Association
Region MY18 MY17 MY16 MY15
United States 60,797 60,324 58,344 56,050
Brazil 29,980 25,968 25,589 27,255
European Union 5,413 5,300 5,212 5,250
China 3,975 3,255 3,199 3,078
Canada 1,817 1,779 1,650 1,650
Thailand 1,476 1,401 1,219 1,264
India 1,514 795 1,041 738
Argentina 1,098 1,098 999 799
Rest of World 2,078 1,567 1,855 1,480
Total 108,148 101,487 99,108 97,564
Golbal Ethanol Production (mln Liters)

Source: Company websites and annual accounts
Ethanol | Local Industry Players
Location Listing Activity Capacity
(Liters/day)
1 Madinah Group of Indutries Punjab Unlisted Sugar & Ethanol 375,000
2 Shakarganj Mills Limited (Non-operational since 2015) Punjab Listed Sugar & Ethanol 350,000
3 Tandlianwala Sugar Mills Limited (Defaulter) Punjab Listed Sugar & Ethanol 255,000
4 Shahmurad Sugar Mills Limited Sindh Listed Sugar & Ethanol 250,000
5 Unicol Limited Sindh Unlisted Ethanol 200,000
6 Premier Industrail Chemical Manufacturing (Pvt) Ltd Punjab Unlisted Ethanol 175,000
7 Al-Abbas Sugar Mills Limited Sindh Listed Sugar & Ethanol 172,500
8 Habib Sugar Mills Limited Sindh Listed Sugar & Ethanol 142,500
9 Colony Sugar Mills Limited Punjab Listed Sugar & Ethanol 135,000
10 Noon Sugar Mills Limited Punjab Listed Sugar & Ethanol 130,000
11 Dewan Sugar Mills Limited Sindh Listed Sugar & Ethanol 125,000
12 Abdullah Sugar Mills Limited Punjab Unlisted Sugar & Ethanol 125,000
13 Hunza Sugar Mills (Pvt) Ltd Punjab Unlisted Sugar & Ethanol 125,000
14 Chasma Sugar Mills Limited Punjab Listed Sugar & Ethanol 125,000
15 United Ethanol Industries Limited Punjab Unlisted Ethanol 120,000
16 Matol (Pvt.) Ltd Sindh Unlisted Sugar & Ethanol 100,000
17 Crystalline Chemical Industries Pvt Limited Punjab Unlisted Ethanol 100,000
18 Pak Ethanol (Pvt) Ltd Sindh Unlisted Ethanol 70,000
19 Khazana Sugar Mills (Pvt) Limited KPK Unlisted Sugar & Ethanol -
3,075,000
Players
Total

Ethanol | Local Production
• Source : Sugarcane
• Type : Food grade ethanol - Extra Neutral Alcohol (ENA) with a strength >96.4%
Source: SBP, PBS & PSMA
Description MY18 MY17 MY16 MY15
Sugarcane Crushed (mln MT) 65.6 71.0 50.0 50.8
Sugarcane Conversion to Molasses 4.5% 4.3% 4.5% 4.4%
Molasses Production (mln MT) 3.0 3.1 2.2 2.2
Molasses Exported (mln MT) 0.2 0.1 0.1 0.1
Molasses Available for Production (mln MT) 2.8 3.0 2.2 2.2
Ethanol Produced (mln MT) 0.8 0.8 0.6 0.6
Ethanol Exported (mln MT) 0.6 0.3 0.3 0.3
Industry Statistics

Ethanol | Price Trend
Source: Market Insider
1/7/2019
0
0.2
0.4
0.6
0.8
1
1.2
1.4
1.6
1.8
2
9/1/2015 9/1/2016 9/1/2017 9/1/2018 9/1/2019
US
$ /
lit
er
Etanol Price Trend

─ Reduced Production: Low sugarcane yield resulting in low output produced in form of
molasses resulting in price surge. Prices are expected to remain high in MY20.
─ Impact on Price - Molasses:
─ In local market - prices have almost doubled in MY19 in comparison to MY18. Price may remain
high in MY20.
─ In export market – rupee depreciation has made the export front favourable for the industry.
─ Pressure on Margins: High input cost – molasses - exerts pressure on industry’s margins,
however, remain high.
─ Impact on Price - Ethanol:
─ In local market - price will remain high in MY20 due low availability of input and high input cost.
─ In export market – rupee depreciation has made the export front favourable for the industry,
however, price remain a factor of international demand/supply dynamics.
Risk Analysis
DISCLAIMERPACRA has used due care in preparation of this document. Our information has been obtained from sources we
consider to be reliable but its accuracy or completeness is not guaranteed. The information in this document may be
copied or otherwise reproduced, in whole or in part, provided the source is duly acknowledged. The presentation
should not be relied upon as professional advice.
Analyst Ayesha Malik
Contact Number: + 92 42 3586 9504


![Allied Telesyn Government Allied Telesyn Centrecom Manual[1]](https://img.pdfslide.net/doc/110x75/547ef4015806b5d15e8b47a8/allied-telesyn-government-allied-telesyn-centrecom-manual1.jpg)