Embed Size (px)
Citation preview
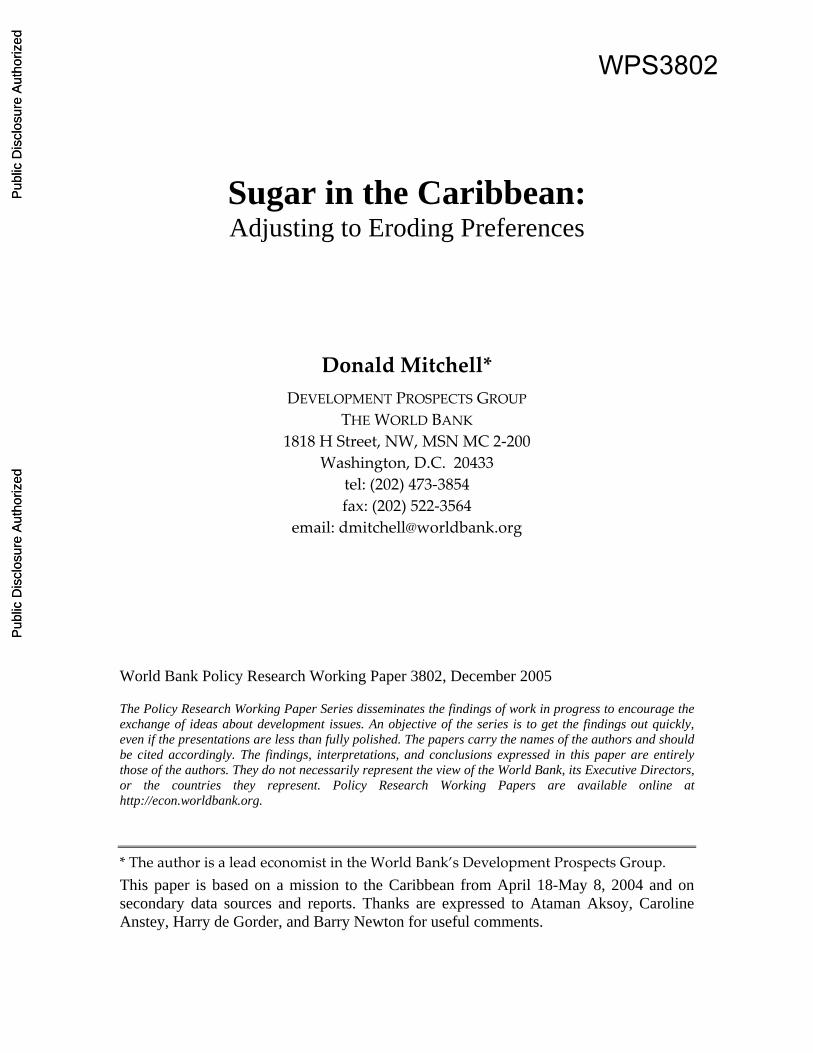
Sugar in the Caribbean: Adjusting to Eroding Preferences
Donald Mitchell* DEVELOPMENT PROSPECTS GROUP
THE WORLD BANK 1818 H Street, NW, MSN MC 2‐200
Washington, D.C. 20433 tel: (202) 473‐3854 fax: (202) 522‐3564
email: [email protected] World Bank Policy Research Working Paper 3802, December 2005 The Policy Research Working Paper Series disseminates the findings of work in progress to encourage the exchange of ideas about development issues. An objective of the series is to get the findings out quickly, even if the presentations are less than fully polished. The papers carry the names of the authors and should be cited accordingly. The findings, interpretations, and conclusions expressed in this paper are entirely those of the authors. They do not necessarily represent the view of the World Bank, its Executive Directors, or the countries they represent. Policy Research Working Papers are available online at http://econ.worldbank.org.
* The author is a lead economist in the World Bank’s Development Prospects Group. This paper is based on a mission to the Caribbean from April 18-May 8, 2004 and on secondary data sources and reports. Thanks are expressed to Ataman Aksoy, Caroline Anstey, Harry de Gorder, and Barry Newton for useful comments.
WPS3802
Pub
lic D
iscl
osur
e A
utho
rized
Pub
lic D
iscl
osur
e A
utho
rized
Pub
lic D
iscl
osur
e A
utho
rized
Pub
lic D
iscl
osur
e A
utho
rized
Pub
lic D
iscl
osur
e A
utho
rized
Pub
lic D
iscl
osur
e A
utho
rized
Pub
lic D
iscl
osur
e A
utho
rized
Pub
lic D
iscl
osur
e A
utho
rized
2
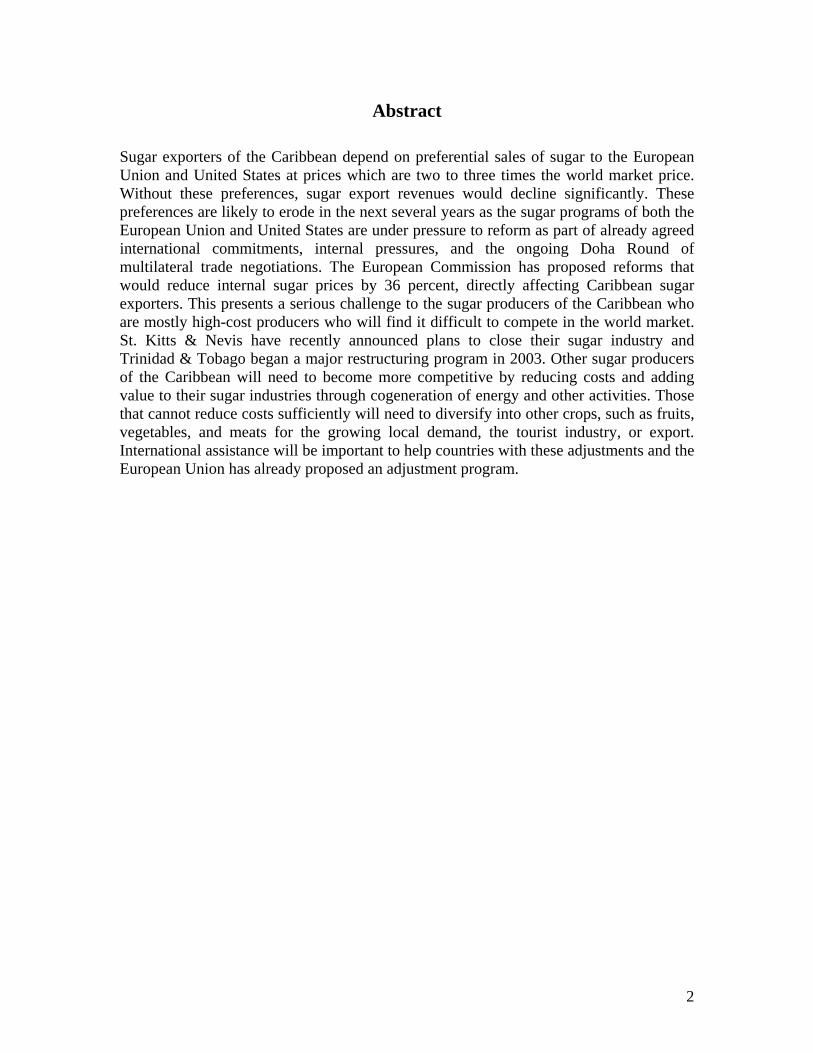
Abstract Sugar exporters of the Caribbean depend on preferential sales of sugar to the European Union and United States at prices which are two to three times the world market price. Without these preferences, sugar export revenues would decline significantly. These preferences are likely to erode in the next several years as the sugar programs of both the European Union and United States are under pressure to reform as part of already agreed international commitments, internal pressures, and the ongoing Doha Round of multilateral trade negotiations. The European Commission has proposed reforms that would reduce internal sugar prices by 36 percent, directly affecting Caribbean sugar exporters. This presents a serious challenge to the sugar producers of the Caribbean who are mostly high-cost producers who will find it difficult to compete in the world market. St. Kitts & Nevis have recently announced plans to close their sugar industry and Trinidad & Tobago began a major restructuring program in 2003. Other sugar producers of the Caribbean will need to become more competitive by reducing costs and adding value to their sugar industries through cogeneration of energy and other activities. Those that cannot reduce costs sufficiently will need to diversify into other crops, such as fruits, vegetables, and meats for the growing local demand, the tourist industry, or export. International assistance will be important to help countries with these adjustments and the European Union has already proposed an adjustment program.
3
Sugar in the Caribbean
CONTENTS Overview 1 Preferences 4 The EU Sugar Program 5 The U.S. Sugar Program 7 Caribbean Dependence on Preferences 9 Risk of Preference Erosion 10
Competitiveness 12 Improving Competitiveness 14 Rationalize 14 Privatize 15 Professional Management 15 Add Value 16 The Government’s Role 17
Diversify Out of Sugar 18 The World Market 19 Policy Choices 23 Conclusions 24 References 26 Appendix I: Trinidad & Tobago Sugar Industry 28
Restructuring Program
1
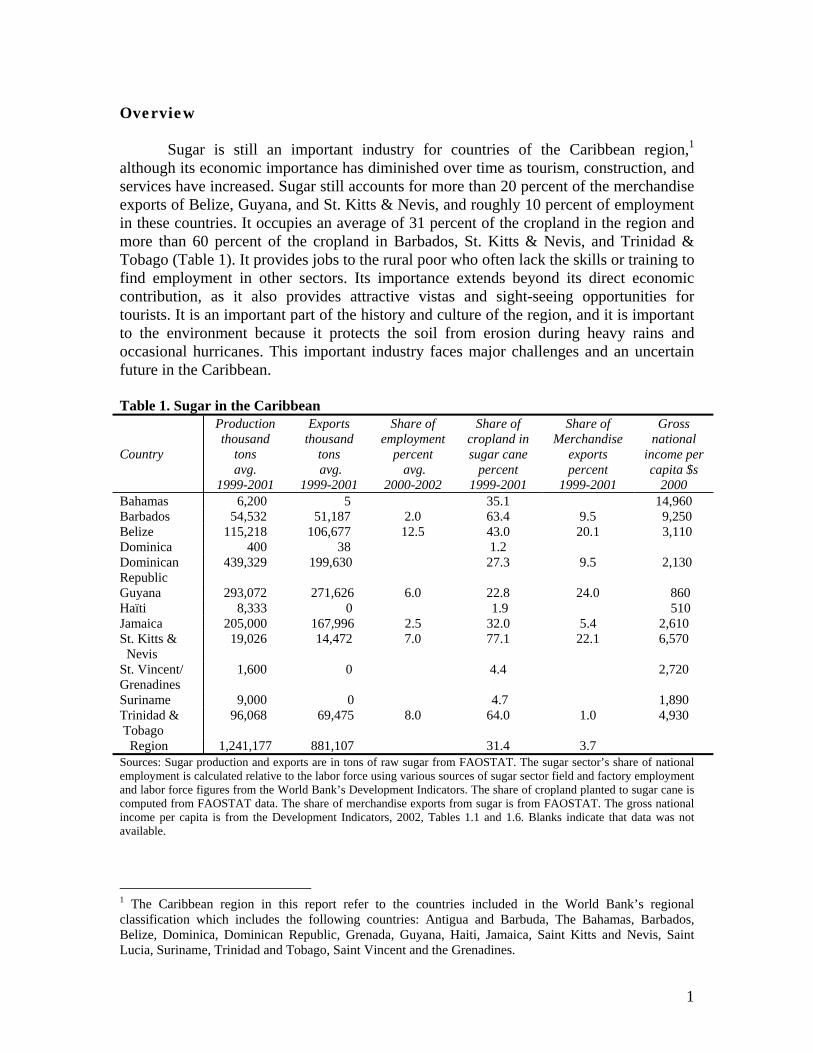
Overview Sugar is still an important industry for countries of the Caribbean region,1
although its economic importance has diminished over time as tourism, construction, and services have increased. Sugar still accounts for more than 20 percent of the merchandise exports of Belize, Guyana, and St. Kitts & Nevis, and roughly 10 percent of employment in these countries. It occupies an average of 31 percent of the cropland in the region and more than 60 percent of the cropland in Barbados, St. Kitts & Nevis, and Trinidad & Tobago (Table 1). It provides jobs to the rural poor who often lack the skills or training to find employment in other sectors. Its importance extends beyond its direct economic contribution, as it also provides attractive vistas and sight-seeing opportunities for tourists. It is an important part of the history and culture of the region, and it is important to the environment because it protects the soil from erosion during heavy rains and occasional hurricanes. This important industry faces major challenges and an uncertain future in the Caribbean.
Table 1. Sugar in the Caribbean Country
Production thousand
tons avg.
1999-2001
Exports thousand
tons avg.
1999-2001
Share of employment
percent avg.
2000-2002
Share of cropland in sugar cane
percent 1999-2001
Share of Merchandise
exports percent
1999-2001
Gross national
income per capita $s
2000 Bahamas 6,200 5 35.1 14,960 Barbados 54,532 51,187 2.0 63.4 9.5 9,250 Belize 115,218 106,677 12.5 43.0 20.1 3,110 Dominica 400 38 1.2 Dominican Republic
439,329 199,630 27.3 9.5 2,130
Guyana 293,072 271,626 6.0 22.8 24.0 860 Haïti 8,333 0 1.9 510 Jamaica 205,000 167,996 2.5 32.0 5.4 2,610 St. Kitts & Nevis
19,026 14,472 7.0 77.1 22.1 6,570
St. Vincent/ Grenadines
1,600 0 4.4 2,720
Suriname 9,000 0 4.7 1,890 Trinidad & Tobago
96,068 69,475 8.0 64.0 1.0 4,930
Region 1,241,177 881,107 31.4 3.7 Sources: Sugar production and exports are in tons of raw sugar from FAOSTAT. The sugar sector’s share of national employment is calculated relative to the labor force using various sources of sugar sector field and factory employment and labor force figures from the World Bank’s Development Indicators. The share of cropland planted to sugar cane is computed from FAOSTAT data. The share of merchandise exports from sugar is from FAOSTAT. The gross national income per capita is from the Development Indicators, 2002, Tables 1.1 and 1.6. Blanks indicate that data was not available.
1 The Caribbean region in this report refer to the countries included in the World Bank’s regional classification which includes the following countries: Antigua and Barbuda, The Bahamas, Barbados, Belize, Dominica, Dominican Republic, Grenada, Guyana, Haiti, Jamaica, Saint Kitts and Nevis, Saint Lucia, Suriname, Trinidad and Tobago, Saint Vincent and the Grenadines.
2
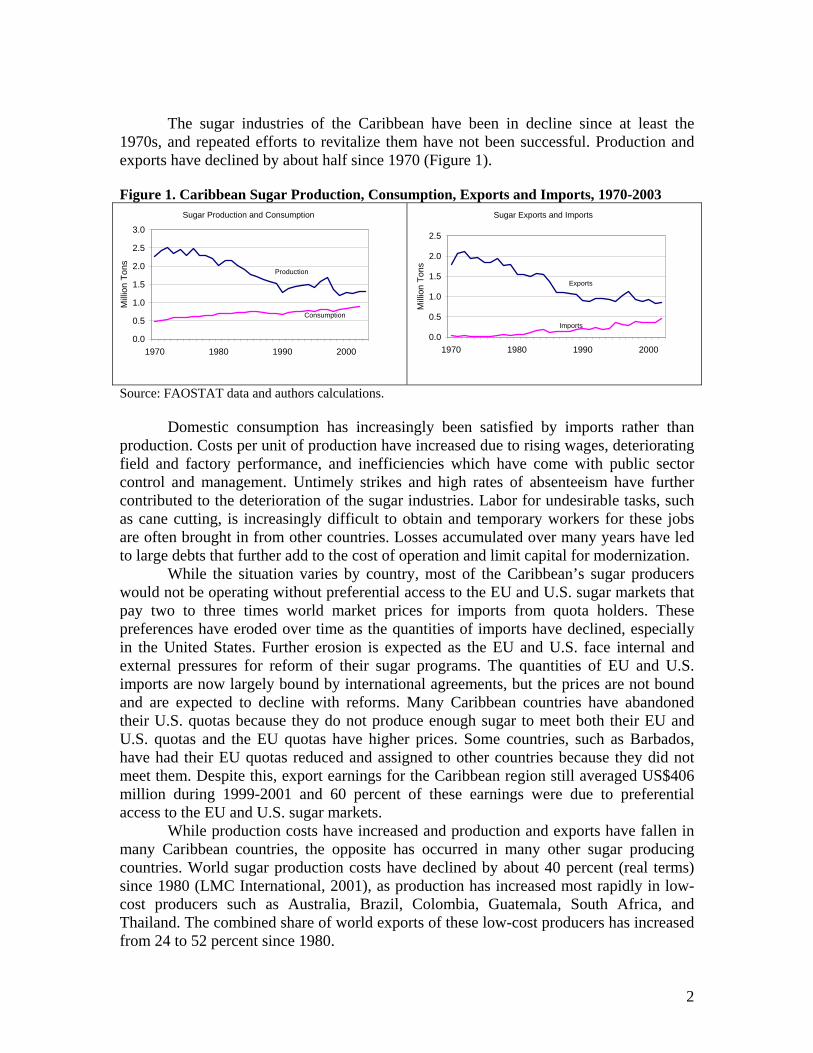
The sugar industries of the Caribbean have been in decline since at least the 1970s, and repeated efforts to revitalize them have not been successful. Production and exports have declined by about half since 1970 (Figure 1). Figure 1. Caribbean Sugar Production, Consumption, Exports and Imports, 1970-2003
Source: FAOSTAT data and authors calculations.
Domestic consumption has increasingly been satisfied by imports rather than production. Costs per unit of production have increased due to rising wages, deteriorating field and factory performance, and inefficiencies which have come with public sector control and management. Untimely strikes and high rates of absenteeism have further contributed to the deterioration of the sugar industries. Labor for undesirable tasks, such as cane cutting, is increasingly difficult to obtain and temporary workers for these jobs are often brought in from other countries. Losses accumulated over many years have led to large debts that further add to the cost of operation and limit capital for modernization.
While the situation varies by country, most of the Caribbean’s sugar producers would not be operating without preferential access to the EU and U.S. sugar markets that pay two to three times world market prices for imports from quota holders. These preferences have eroded over time as the quantities of imports have declined, especially in the United States. Further erosion is expected as the EU and U.S. face internal and external pressures for reform of their sugar programs. The quantities of EU and U.S. imports are now largely bound by international agreements, but the prices are not bound and are expected to decline with reforms. Many Caribbean countries have abandoned their U.S. quotas because they do not produce enough sugar to meet both their EU and U.S. quotas and the EU quotas have higher prices. Some countries, such as Barbados, have had their EU quotas reduced and assigned to other countries because they did not meet them. Despite this, export earnings for the Caribbean region still averaged US$406 million during 1999-2001 and 60 percent of these earnings were due to preferential access to the EU and U.S. sugar markets. While production costs have increased and production and exports have fallen in many Caribbean countries, the opposite has occurred in many other sugar producing countries. World sugar production costs have declined by about 40 percent (real terms) since 1980 (LMC International, 2001), as production has increased most rapidly in low-cost producers such as Australia, Brazil, Colombia, Guatemala, South Africa, and Thailand. The combined share of world exports of these low-cost producers has increased from 24 to 52 percent since 1980.
Sugar Production and Consumption
0.0
0.5
1.0
1.5
2.0
2.5
3.0
1970 1980 1990 2000
Mill
ion
Tons
Consumption
Production
Sugar Exports and Imports
0.0
0.5
1.0
1.5
2.0
2.5
1970 1980 1990 2000
Mill
ion
Tons
Exports
Imports
3
Most of the Caribbean sugar industries will need to be restructured, and some will need to be closed. If this is not done, they face ongoing losses that will increase as preferences erode. Since most of the sugar industries of the region are state-owned enterprises, the governments must ultimately pay for the losses. Sugar industries in a few countries in the region, such as Guyana and Belize, are expected to survive with lower preferences. And some portion of other sugar industries in the region could be viable if properly restructured to include only the best sugar producing lands and factories. In Jamaica, for example, two private sector estates are profitable and could survive with lower preferences while much of the state-owned industry could not survive, even now, without government subsidies and would probably not be able to adjust to lower preferences. The Jamaican government has announced that it will close two of its state-owned sugar factories (F.O. Lichts 2005).
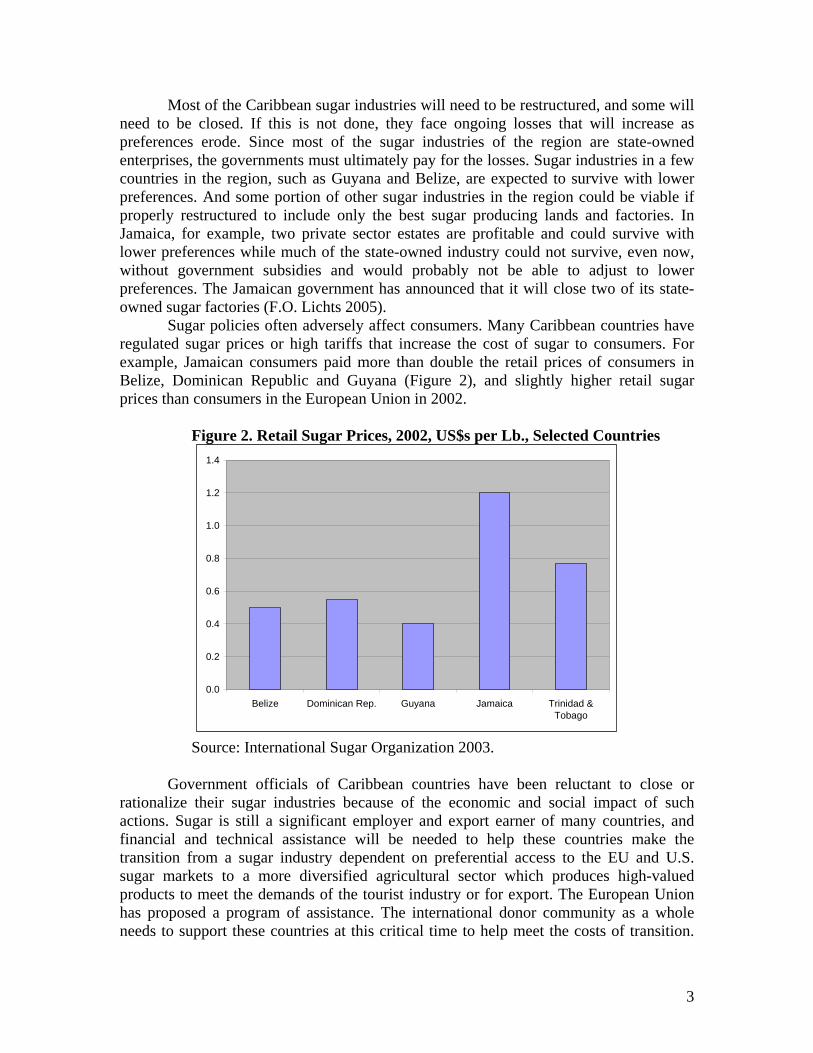
Sugar policies often adversely affect consumers. Many Caribbean countries have regulated sugar prices or high tariffs that increase the cost of sugar to consumers. For example, Jamaican consumers paid more than double the retail prices of consumers in Belize, Dominican Republic and Guyana (Figure 2), and slightly higher retail sugar prices than consumers in the European Union in 2002.
Figure 2. Retail Sugar Prices, 2002, US$s per Lb., Selected Countries
Source: International Sugar Organization 2003.
Government officials of Caribbean countries have been reluctant to close or rationalize their sugar industries because of the economic and social impact of such actions. Sugar is still a significant employer and export earner of many countries, and financial and technical assistance will be needed to help these countries make the transition from a sugar industry dependent on preferential access to the EU and U.S. sugar markets to a more diversified agricultural sector which produces high-valued products to meet the demands of the tourist industry or for export. The European Union has proposed a program of assistance. The international donor community as a whole needs to support these countries at this critical time to help meet the costs of transition.
0.0
0.2
0.4
0.6
0.8
1.0
1.2
1.4
Belize Dominican Rep. Guyana Jamaica Trinidad &Tobago
4
Caribbean countries should prepare a comprehensive transition program in a timely manner to help mobilize assistance.
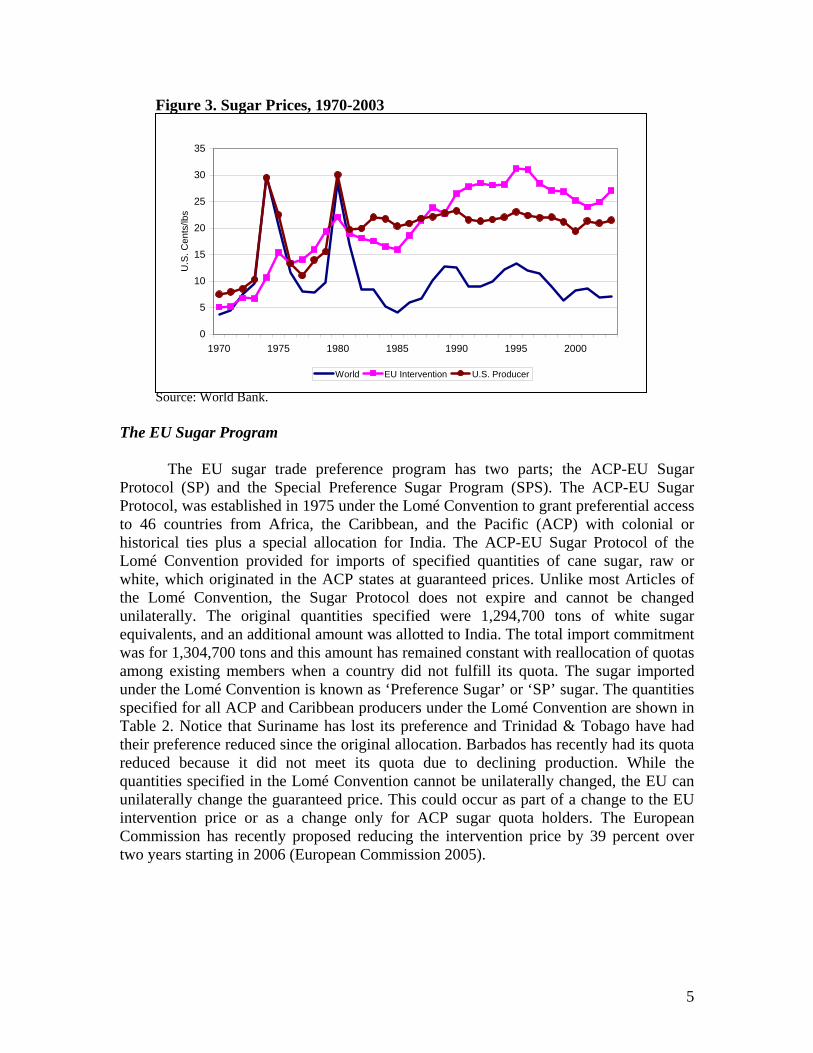
While most governments in the region continue to support their sugar industries, the Government of Trinidad & Tobago recently began a major restructuring and privatization program of the state-owned sugar company, Caroni (1975) Limited, which had never made a profit in 30 years of operation. The restructuring and privatization program may provide a useful model of reform for other countries in the region (see Appendix I for a description of the program). The restructuring program provided for severance payments and retraining for workers, privatization of cane growing, closing of one of the two factories, redevelopment of some sugar cane lands for residential and commercial uses, the sale of non-sugar activities, and the creation of a new sugar company with reduced assets and a more limited scope of activities. Past debts of the sugar company were assumed by the government and will be partially offset by the sale of assets and land of the former company. The cost of the restructuring was estimated at TT$1.5 billion (US$ 240 million), compared with annual losses of TT$0.5 billion (US$ 80 million). The former employees appear generally satisfied with their severance payments and retraining programs. Other countries may not be able to fund such an extensive restructuring program, but they will need to design their own programs to deal with the restructuring of their sugar industries into viable industries that can survive with lower preferences. St. Kitts & Nevis have recently announced plans to close their sugar industry. Preferences Trade preferences in sugar have been granted by the European Union under the Lomé Convention since 1975 and by the United States under its sugar program since 1982. These preferences allow quota-holding countries to export sugar up to the amount of their quota and receive prices that are based on the prices received by domestic producers in the EU and U.S. These internal prices have historically been substantially higher than prices in the world market (Figure 3). In 2003, the EU intervention price was more than three times the world price and the U.S. producer’s price was more than double the world price. In addition to these preferences, countries in the CARICOM Single Market and Economy (CSME)2 have duty-free access while imports of raw sugar from outside the region face a 40 percent Common External Tariff (CET). Refined sugar does not have a CET and tariffs vary among countries. However, there is a CARICOM provision which triggers a CET of 40 percent once the region produces at least 75 percent of its own requirements of refined sugar (Government of Jamaica 2003, page 16).
2 The Caribbean Community and Common Market were established by the Treaty of Chaguaramas on 4 July, 1973. By Treaty revisions, effective February 2002, the successor entity is now the Caribbean Community, including the CARICOM Single Market and Economy (CSME). Member countries include: Antigua and Barbuda, The Bahamas, Barbados, Belize, Dominica, Grenada, Guyana, Haiti, Jamaica, Montserrat, St. Kitts & Nevis, Saint Lucia, St. Vincent and the Grenadines, Suriname, Trinidad and Tobago. The Bahamas and Haiti are members of the Community but not the Single Market and Economy.
5
Figure 3. Sugar Prices, 1970-2003 Source: World Bank.
The EU Sugar Program
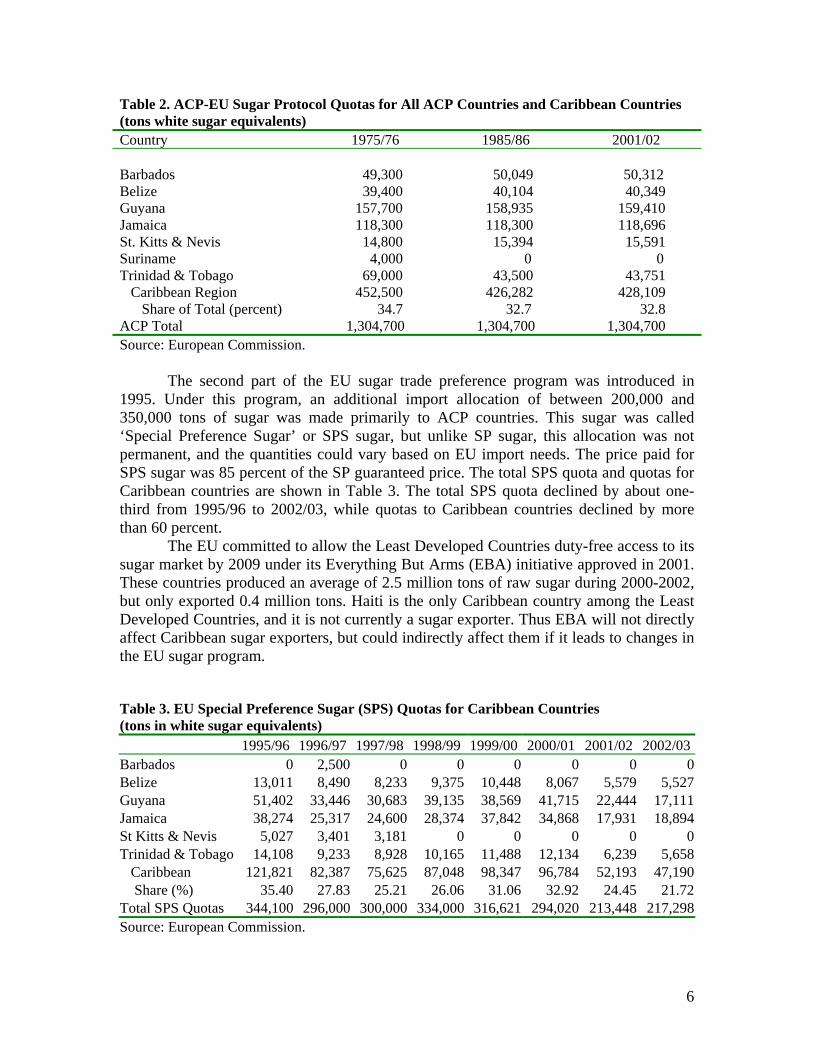
The EU sugar trade preference program has two parts; the ACP-EU Sugar Protocol (SP) and the Special Preference Sugar Program (SPS). The ACP-EU Sugar Protocol, was established in 1975 under the Lomé Convention to grant preferential access to 46 countries from Africa, the Caribbean, and the Pacific (ACP) with colonial or historical ties plus a special allocation for India. The ACP-EU Sugar Protocol of the Lomé Convention provided for imports of specified quantities of cane sugar, raw or white, which originated in the ACP states at guaranteed prices. Unlike most Articles of the Lomé Convention, the Sugar Protocol does not expire and cannot be changed unilaterally. The original quantities specified were 1,294,700 tons of white sugar equivalents, and an additional amount was allotted to India. The total import commitment was for 1,304,700 tons and this amount has remained constant with reallocation of quotas among existing members when a country did not fulfill its quota. The sugar imported under the Lomé Convention is known as ‘Preference Sugar’ or ‘SP’ sugar. The quantities specified for all ACP and Caribbean producers under the Lomé Convention are shown in Table 2. Notice that Suriname has lost its preference and Trinidad & Tobago have had their preference reduced since the original allocation. Barbados has recently had its quota reduced because it did not meet its quota due to declining production. While the quantities specified in the Lomé Convention cannot be unilaterally changed, the EU can unilaterally change the guaranteed price. This could occur as part of a change to the EU intervention price or as a change only for ACP sugar quota holders. The European Commission has recently proposed reducing the intervention price by 39 percent over two years starting in 2006 (European Commission 2005).
0
5
10
15
20
25
30
35
1970 1975 1980 1985 1990 1995 2000
U.S
. Cen
ts/lb
s
World EU Intervention U.S. Producer
6
Table 2. ACP-EU Sugar Protocol Quotas for All ACP Countries and Caribbean Countries (tons white sugar equivalents) Country 1975/76 1985/86 2001/02 Barbados 49,300 50,049 50,312 Belize 39,400 40,104 40,349 Guyana 157,700 158,935 159,410 Jamaica 118,300 118,300 118,696 St. Kitts & Nevis 14,800 15,394 15,591 Suriname 4,000 0 0 Trinidad & Tobago 69,000 43,500 43,751 Caribbean Region 452,500 426,282 428,109 Share of Total (percent) 34.7 32.7 32.8 ACP Total 1,304,700 1,304,700 1,304,700 Source: European Commission.
The second part of the EU sugar trade preference program was introduced in
1995. Under this program, an additional import allocation of between 200,000 and 350,000 tons of sugar was made primarily to ACP countries. This sugar was called ‘Special Preference Sugar’ or SPS sugar, but unlike SP sugar, this allocation was not permanent, and the quantities could vary based on EU import needs. The price paid for SPS sugar was 85 percent of the SP guaranteed price. The total SPS quota and quotas for Caribbean countries are shown in Table 3. The total SPS quota declined by about one-third from 1995/96 to 2002/03, while quotas to Caribbean countries declined by more than 60 percent. The EU committed to allow the Least Developed Countries duty-free access to its sugar market by 2009 under its Everything But Arms (EBA) initiative approved in 2001. These countries produced an average of 2.5 million tons of raw sugar during 2000-2002, but only exported 0.4 million tons. Haiti is the only Caribbean country among the Least Developed Countries, and it is not currently a sugar exporter. Thus EBA will not directly affect Caribbean sugar exporters, but could indirectly affect them if it leads to changes in the EU sugar program. Table 3. EU Special Preference Sugar (SPS) Quotas for Caribbean Countries (tons in white sugar equivalents) 1995/96 1996/97 1997/98 1998/99 1999/00 2000/01 2001/02 2002/03Barbados 0 2,500 0 0 0 0 0 0Belize 13,011 8,490 8,233 9,375 10,448 8,067 5,579 5,527Guyana 51,402 33,446 30,683 39,135 38,569 41,715 22,444 17,111Jamaica 38,274 25,317 24,600 28,374 37,842 34,868 17,931 18,894St Kitts & Nevis 5,027 3,401 3,181 0 0 0 0 0Trinidad & Tobago 14,108 9,233 8,928 10,165 11,488 12,134 6,239 5,658 Caribbean 121,821 82,387 75,625 87,048 98,347 96,784 52,193 47,190 Share (%) 35.40 27.83 25.21 26.06 31.06 32.92 24.45 21.72Total SPS Quotas 344,100 296,000 300,000 334,000 316,621 294,020 213,448 217,298Source: European Commission.
7
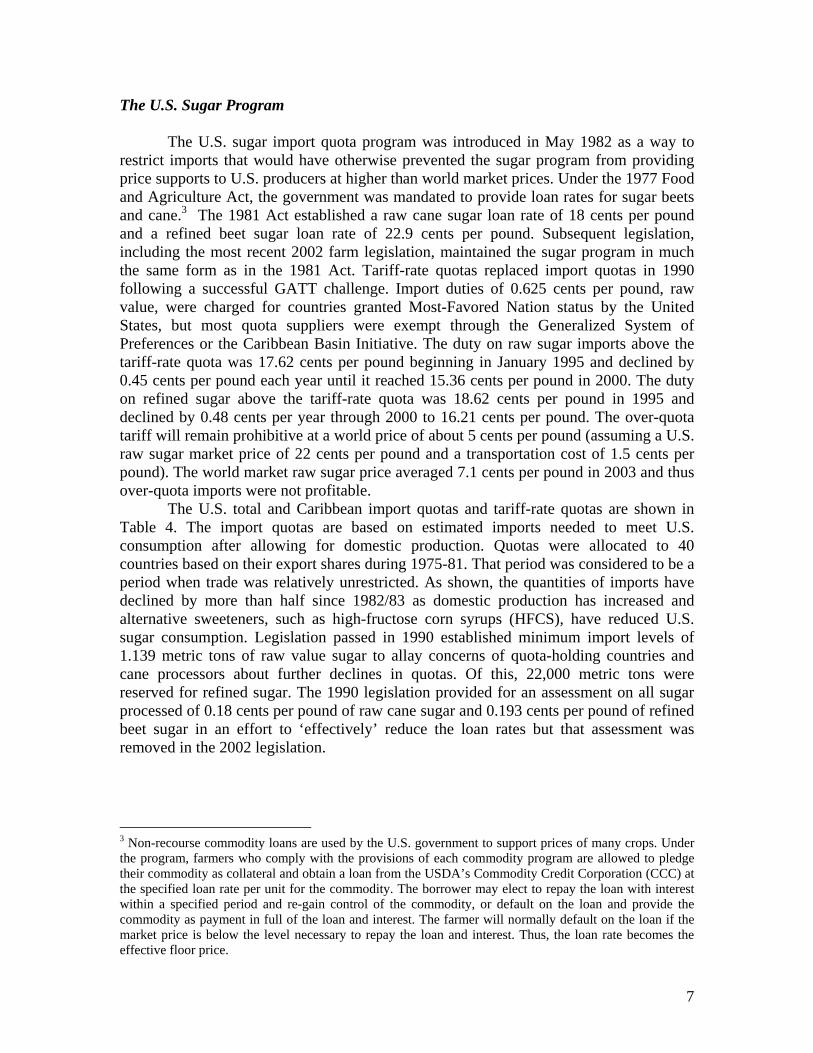
The U.S. Sugar Program The U.S. sugar import quota program was introduced in May 1982 as a way to restrict imports that would have otherwise prevented the sugar program from providing price supports to U.S. producers at higher than world market prices. Under the 1977 Food and Agriculture Act, the government was mandated to provide loan rates for sugar beets and cane.3 The 1981 Act established a raw cane sugar loan rate of 18 cents per pound and a refined beet sugar loan rate of 22.9 cents per pound. Subsequent legislation, including the most recent 2002 farm legislation, maintained the sugar program in much the same form as in the 1981 Act. Tariff-rate quotas replaced import quotas in 1990 following a successful GATT challenge. Import duties of 0.625 cents per pound, raw value, were charged for countries granted Most-Favored Nation status by the United States, but most quota suppliers were exempt through the Generalized System of Preferences or the Caribbean Basin Initiative. The duty on raw sugar imports above the tariff-rate quota was 17.62 cents per pound beginning in January 1995 and declined by 0.45 cents per pound each year until it reached 15.36 cents per pound in 2000. The duty on refined sugar above the tariff-rate quota was 18.62 cents per pound in 1995 and declined by 0.48 cents per year through 2000 to 16.21 cents per pound. The over-quota tariff will remain prohibitive at a world price of about 5 cents per pound (assuming a U.S. raw sugar market price of 22 cents per pound and a transportation cost of 1.5 cents per pound). The world market raw sugar price averaged 7.1 cents per pound in 2003 and thus over-quota imports were not profitable.
The U.S. total and Caribbean import quotas and tariff-rate quotas are shown in Table 4. The import quotas are based on estimated imports needed to meet U.S. consumption after allowing for domestic production. Quotas were allocated to 40 countries based on their export shares during 1975-81. That period was considered to be a period when trade was relatively unrestricted. As shown, the quantities of imports have declined by more than half since 1982/83 as domestic production has increased and alternative sweeteners, such as high-fructose corn syrups (HFCS), have reduced U.S. sugar consumption. Legislation passed in 1990 established minimum import levels of 1.139 metric tons of raw value sugar to allay concerns of quota-holding countries and cane processors about further declines in quotas. Of this, 22,000 metric tons were reserved for refined sugar. The 1990 legislation provided for an assessment on all sugar processed of 0.18 cents per pound of raw cane sugar and 0.193 cents per pound of refined beet sugar in an effort to ‘effectively’ reduce the loan rates but that assessment was removed in the 2002 legislation.
3 Non-recourse commodity loans are used by the U.S. government to support prices of many crops. Under the program, farmers who comply with the provisions of each commodity program are allowed to pledge their commodity as collateral and obtain a loan from the USDA’s Commodity Credit Corporation (CCC) at the specified loan rate per unit for the commodity. The borrower may elect to repay the loan with interest within a specified period and re-gain control of the commodity, or default on the loan and provide the commodity as payment in full of the loan and interest. The farmer will normally default on the loan if the market price is below the level necessary to repay the loan and interest. Thus, the loan rate becomes the effective floor price.
8
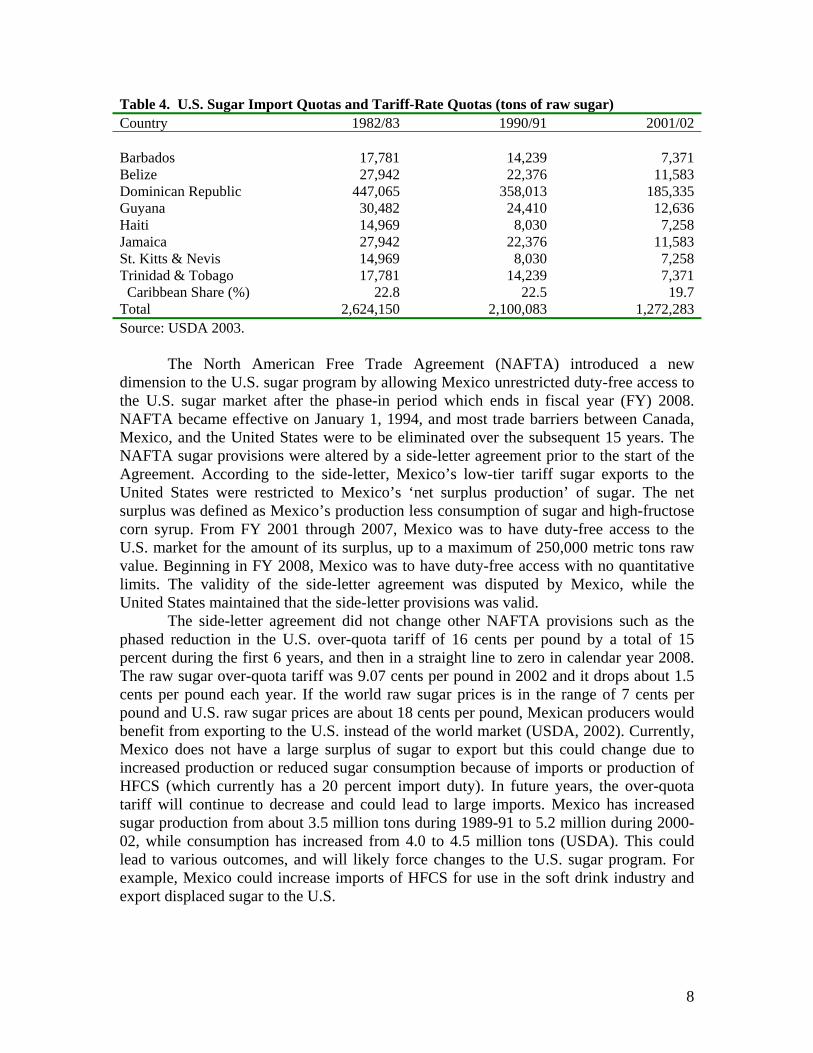
Table 4. U.S. Sugar Import Quotas and Tariff-Rate Quotas (tons of raw sugar) Country 1982/83 1990/91 2001/02 Barbados 17,781 14,239 7,371Belize 27,942 22,376 11,583Dominican Republic 447,065 358,013 185,335Guyana 30,482 24,410 12,636Haiti 14,969 8,030 7,258Jamaica 27,942 22,376 11,583St. Kitts & Nevis 14,969 8,030 7,258Trinidad & Tobago 17,781 14,239 7,371 Caribbean Share (%) 22.8 22.5 19.7Total 2,624,150 2,100,083 1,272,283Source: USDA 2003. The North American Free Trade Agreement (NAFTA) introduced a new dimension to the U.S. sugar program by allowing Mexico unrestricted duty-free access to the U.S. sugar market after the phase-in period which ends in fiscal year (FY) 2008. NAFTA became effective on January 1, 1994, and most trade barriers between Canada, Mexico, and the United States were to be eliminated over the subsequent 15 years. The NAFTA sugar provisions were altered by a side-letter agreement prior to the start of the Agreement. According to the side-letter, Mexico’s low-tier tariff sugar exports to the United States were restricted to Mexico’s ‘net surplus production’ of sugar. The net surplus was defined as Mexico’s production less consumption of sugar and high-fructose corn syrup. From FY 2001 through 2007, Mexico was to have duty-free access to the U.S. market for the amount of its surplus, up to a maximum of 250,000 metric tons raw value. Beginning in FY 2008, Mexico was to have duty-free access with no quantitative limits. The validity of the side-letter agreement was disputed by Mexico, while the United States maintained that the side-letter provisions was valid. The side-letter agreement did not change other NAFTA provisions such as the phased reduction in the U.S. over-quota tariff of 16 cents per pound by a total of 15 percent during the first 6 years, and then in a straight line to zero in calendar year 2008. The raw sugar over-quota tariff was 9.07 cents per pound in 2002 and it drops about 1.5 cents per pound each year. If the world raw sugar prices is in the range of 7 cents per pound and U.S. raw sugar prices are about 18 cents per pound, Mexican producers would benefit from exporting to the U.S. instead of the world market (USDA, 2002). Currently, Mexico does not have a large surplus of sugar to export but this could change due to increased production or reduced sugar consumption because of imports or production of HFCS (which currently has a 20 percent import duty). In future years, the over-quota tariff will continue to decrease and could lead to large imports. Mexico has increased sugar production from about 3.5 million tons during 1989-91 to 5.2 million during 2000-02, while consumption has increased from 4.0 to 4.5 million tons (USDA). This could lead to various outcomes, and will likely force changes to the U.S. sugar program. For example, Mexico could increase imports of HFCS for use in the soft drink industry and export displaced sugar to the U.S.
9
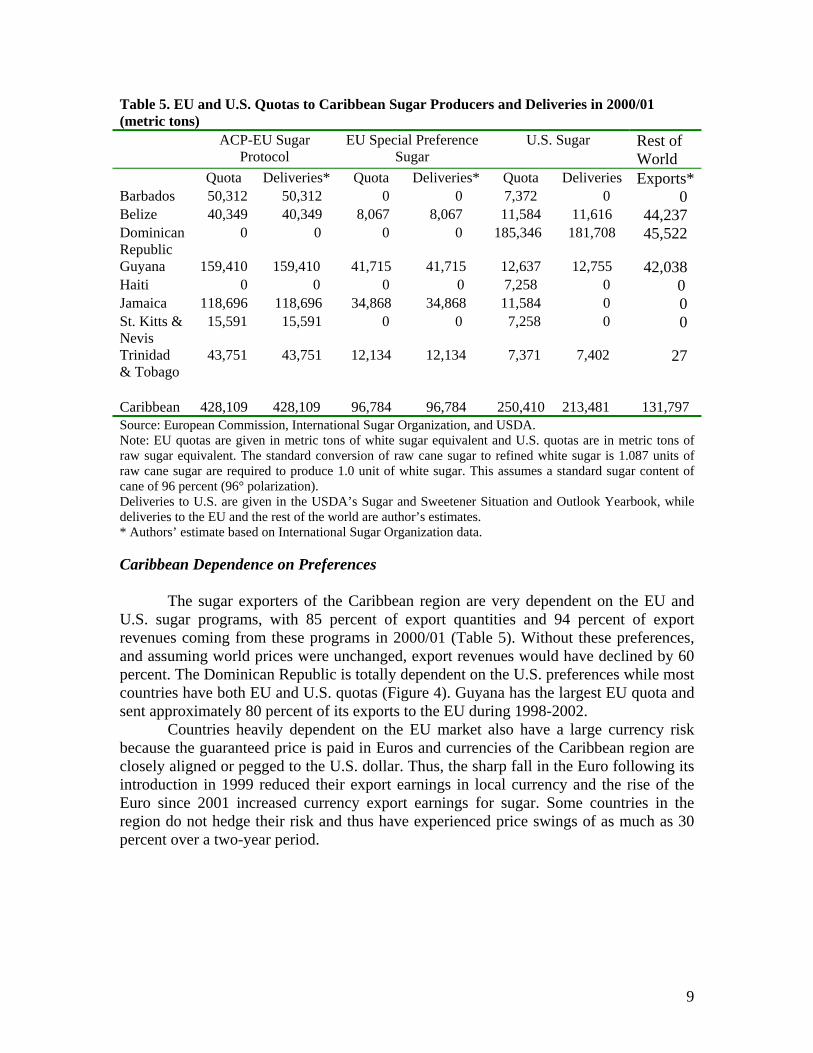
Table 5. EU and U.S. Quotas to Caribbean Sugar Producers and Deliveries in 2000/01 (metric tons) ACP-EU Sugar
Protocol EU Special Preference
Sugar U.S. Sugar Rest of
World Quota Deliveries* Quota Deliveries* Quota Deliveries Exports*Barbados 50,312 50,312 0 0 7,372 0 0 Belize 40,349 40,349 8,067 8,067 11,584 11,616 44,237 Dominican Republic
0 0 0 0 185,346 181,708 45,522
Guyana 159,410 159,410 41,715 41,715 12,637 12,755 42,038 Haiti 0 0 0 0 7,258 0 0 Jamaica 118,696 118,696 34,868 34,868 11,584 0 0 St. Kitts & Nevis
15,591 15,591 0 0 7,258 0 0
Trinidad & Tobago
43,751 43,751 12,134 12,134 7,371 7,402 27
Caribbean 428,109 428,109 96,784 96,784 250,410 213,481 131,797 Source: European Commission, International Sugar Organization, and USDA. Note: EU quotas are given in metric tons of white sugar equivalent and U.S. quotas are in metric tons of raw sugar equivalent. The standard conversion of raw cane sugar to refined white sugar is 1.087 units of raw cane sugar are required to produce 1.0 unit of white sugar. This assumes a standard sugar content of cane of 96 percent (96° polarization). Deliveries to U.S. are given in the USDA’s Sugar and Sweetener Situation and Outlook Yearbook, while deliveries to the EU and the rest of the world are author’s estimates. * Authors’ estimate based on International Sugar Organization data. Caribbean Dependence on Preferences
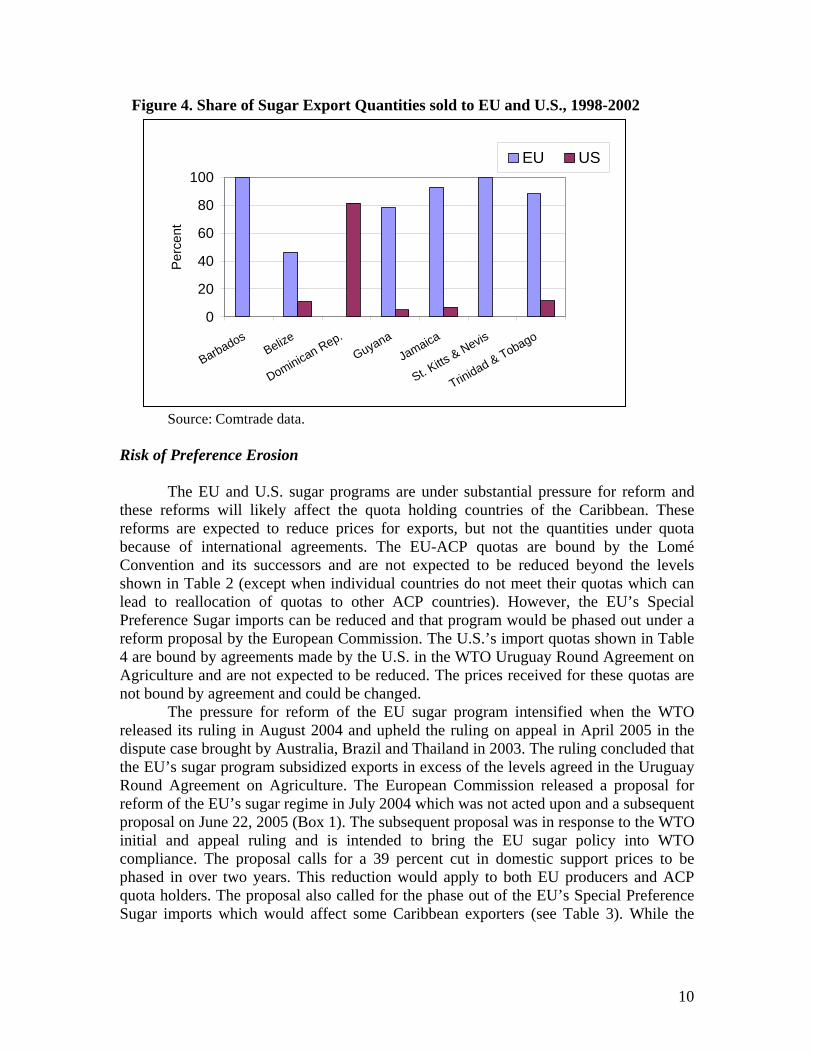
The sugar exporters of the Caribbean region are very dependent on the EU and U.S. sugar programs, with 85 percent of export quantities and 94 percent of export revenues coming from these programs in 2000/01 (Table 5). Without these preferences, and assuming world prices were unchanged, export revenues would have declined by 60 percent. The Dominican Republic is totally dependent on the U.S. preferences while most countries have both EU and U.S. quotas (Figure 4). Guyana has the largest EU quota and sent approximately 80 percent of its exports to the EU during 1998-2002.
Countries heavily dependent on the EU market also have a large currency risk because the guaranteed price is paid in Euros and currencies of the Caribbean region are closely aligned or pegged to the U.S. dollar. Thus, the sharp fall in the Euro following its introduction in 1999 reduced their export earnings in local currency and the rise of the Euro since 2001 increased currency export earnings for sugar. Some countries in the region do not hedge their risk and thus have experienced price swings of as much as 30 percent over a two-year period.
10
Figure 4. Share of Sugar Export Quantities sold to EU and U.S., 1998-2002 Source: Comtrade data.
Risk of Preference Erosion The EU and U.S. sugar programs are under substantial pressure for reform and these reforms will likely affect the quota holding countries of the Caribbean. These reforms are expected to reduce prices for exports, but not the quantities under quota because of international agreements. The EU-ACP quotas are bound by the Lomé Convention and its successors and are not expected to be reduced beyond the levels shown in Table 2 (except when individual countries do not meet their quotas which can lead to reallocation of quotas to other ACP countries). However, the EU’s Special Preference Sugar imports can be reduced and that program would be phased out under a reform proposal by the European Commission. The U.S.’s import quotas shown in Table 4 are bound by agreements made by the U.S. in the WTO Uruguay Round Agreement on Agriculture and are not expected to be reduced. The prices received for these quotas are not bound by agreement and could be changed.
The pressure for reform of the EU sugar program intensified when the WTO released its ruling in August 2004 and upheld the ruling on appeal in April 2005 in the dispute case brought by Australia, Brazil and Thailand in 2003. The ruling concluded that the EU’s sugar program subsidized exports in excess of the levels agreed in the Uruguay Round Agreement on Agriculture. The European Commission released a proposal for reform of the EU’s sugar regime in July 2004 which was not acted upon and a subsequent proposal on June 22, 2005 (Box 1). The subsequent proposal was in response to the WTO initial and appeal ruling and is intended to bring the EU sugar policy into WTO compliance. The proposal calls for a 39 percent cut in domestic support prices to be phased in over two years. This reduction would apply to both EU producers and ACP quota holders. The proposal also called for the phase out of the EU’s Special Preference Sugar imports which would affect some Caribbean exporters (see Table 3). While the
0
20
40
60
80
100
BarbadosBelize
Dominican Rep.Guyana
Jamaica
St. Kitts & Nevis
Trinidad & Tobago
Per
cent
EU US
11
proposed reforms will face stiff opposition in both the EU and from ACP exporters, it likely indicates the direction that EU sugar reforms will take.
The U.S. sugar program has not received as much pressure for reform as has the EU’s sugar regime, but it is expected to face challenges from other U.S. commodity producers who receive less support and from WTO negotiations in the Doha Round. It also faces internal pressures to reduce prices by food manufactures. If policy reforms occur in the U.S. sugar program, it could be as part of the next U.S. Farm Bill which is scheduled to take effect in 2007. Other countries, including Japan, also have policies which distort domestic markets and provide high levels of protection to producers (Mitchell 2004). Such programs are expected to come under scrutiny during the Doha Round of trade negotiations, and reform could lead to larger imports and some increase in world prices.
fvBox 1: European Commission’s proposal for Reform of the Sugar Regime
The European Commission put forward its proposal for the EU’s sugar regime on June 22,
2005. The proposal calls for a 39 percent reduction in support prices over two years. The white sugar support price would be reduced from EUR 631.9/ton to EUR 385.5/ton and the raw sugar support price would be reduced from EUR 523.7/ton to EUR 319.5/ton by the end of the transition period. To compensate for the loss of revenue, direct payments would be made to EU farmers to cover 60 percent of the income loss. A voluntary restructuring program was proposed for sugar companies to exit the industry. The intervention price would be renamed the reference price, and a private storage system would replace the intervention system to allow quota sugar to be taken off the market if prices fall below the reference price.
The proposal does not have mandatory production quotas and instead proposed a voluntary restructuring scheme for four years to provide incentives for least efficient sugar producers to cease production. A and B production quotas were to be combined into a single quota and C sugar was to be subject to an unspecified levy to discourage production. C sugar would not be exported in order to comply with the WTO ruling. Exports would be limited to the approximately 1.3 million tons allowed under the Uruguay Round Agreement on Agriculture compared to the 5-6 million tons of surplus production available for export.
ACP producers would receive an initial assistance plan with EUR 40 million for 2006 as part of an eight year scheme with additional assistance for 2006-2013. A broad range of support options were proposed to be tailored to the needs of each country identified by the stakeholders and integrated into a long term, comprehensive, sustainable strategy.
The proposal does not specifically mention what would happen to SPS sugar, but the previous proposal of the European Commission had said that the Maximum Supply Needs instrument, which is the basis of the Special Preference Sugar (SPS) import program, would in time no longer be needed and thus SPS imports would be phased out. This would directly affect ACP countries that provide about 16 percent of their exports to the EU under this program. References: European Commission Press Release IP/05/776, Brussels, 22 June 2005. European Commission, Commission Staff Working Document, “Reforming the European Union’s Sugar Policy, Update of Impact Assessment,” Brussels 22.6.2005 SEC(2005) 808. Noble, Joan, “Radical Reform of the EU Sugar Regime Will Bring Lasting Change,” F.O. Lichts International Sugar & Sweetener Report, July 5, 2005, Vol. 137, No.20.
12
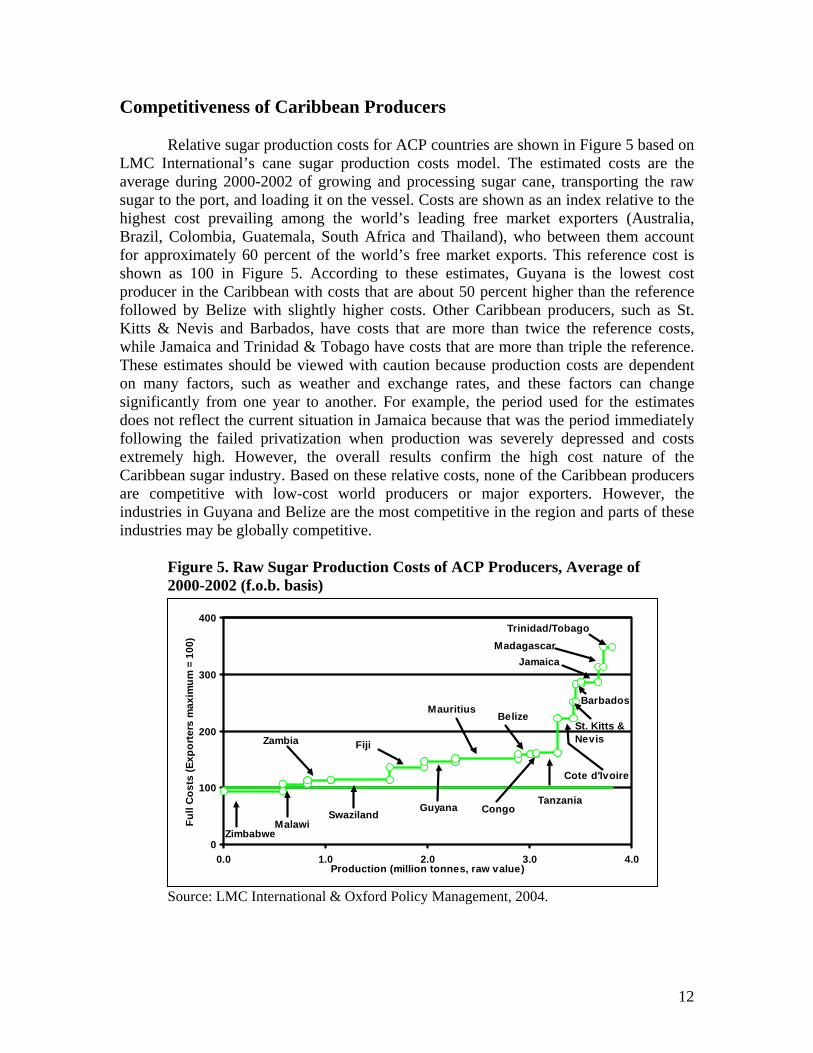
Competitiveness of Caribbean Producers Relative sugar production costs for ACP countries are shown in Figure 5 based on
LMC International’s cane sugar production costs model. The estimated costs are the average during 2000-2002 of growing and processing sugar cane, transporting the raw sugar to the port, and loading it on the vessel. Costs are shown as an index relative to the highest cost prevailing among the world’s leading free market exporters (Australia, Brazil, Colombia, Guatemala, South Africa and Thailand), who between them account for approximately 60 percent of the world’s free market exports. This reference cost is shown as 100 in Figure 5. According to these estimates, Guyana is the lowest cost producer in the Caribbean with costs that are about 50 percent higher than the reference followed by Belize with slightly higher costs. Other Caribbean producers, such as St. Kitts & Nevis and Barbados, have costs that are more than twice the reference costs, while Jamaica and Trinidad & Tobago have costs that are more than triple the reference. These estimates should be viewed with caution because production costs are dependent on many factors, such as weather and exchange rates, and these factors can change significantly from one year to another. For example, the period used for the estimates does not reflect the current situation in Jamaica because that was the period immediately following the failed privatization when production was severely depressed and costs extremely high. However, the overall results confirm the high cost nature of the Caribbean sugar industry. Based on these relative costs, none of the Caribbean producers are competitive with low-cost world producers or major exporters. However, the industries in Guyana and Belize are the most competitive in the region and parts of these industries may be globally competitive.
Figure 5. Raw Sugar Production Costs of ACP Producers, Average of 2000-2002 (f.o.b. basis)
Source: LMC International & Oxford Policy Management, 2004.
0
100
200
300
400
0.0 1.0 2.0 3.0 4.0Production (million tonnes, raw value)
Full
Cos
ts (E
xpor
ters
max
imum
= 1
00)
Zambia
MalawiSwaziland
Fiji
CongoGuyana
Belize
Tanzania
Mauritius
Cote d'Ivoire
Madagascar
St. Kitts & Nevis
Jamaica
Barbados
Trinidad/Tobago
Zimbabwe
13
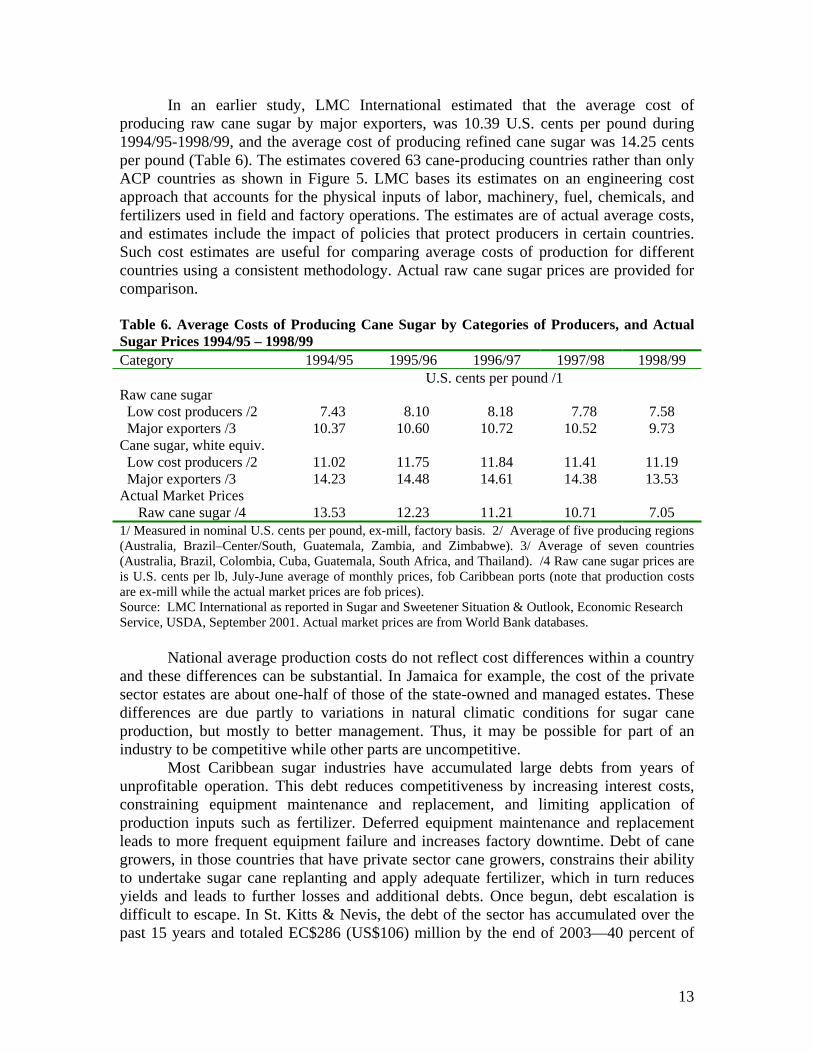
In an earlier study, LMC International estimated that the average cost of producing raw cane sugar by major exporters, was 10.39 U.S. cents per pound during 1994/95-1998/99, and the average cost of producing refined cane sugar was 14.25 cents per pound (Table 6). The estimates covered 63 cane-producing countries rather than only ACP countries as shown in Figure 5. LMC bases its estimates on an engineering cost approach that accounts for the physical inputs of labor, machinery, fuel, chemicals, and fertilizers used in field and factory operations. The estimates are of actual average costs, and estimates include the impact of policies that protect producers in certain countries. Such cost estimates are useful for comparing average costs of production for different countries using a consistent methodology. Actual raw cane sugar prices are provided for comparison.
Table 6. Average Costs of Producing Cane Sugar by Categories of Producers, and Actual Sugar Prices 1994/95 – 1998/99 Category 1994/95 1995/96 1996/97 1997/98 1998/99 U.S. cents per pound /1 Raw cane sugar Low cost producers /2 7.43 8.10 8.18 7.78 7.58 Major exporters /3 10.37 10.60 10.72 10.52 9.73 Cane sugar, white equiv. Low cost producers /2 11.02 11.75 11.84 11.41 11.19 Major exporters /3 14.23 14.48 14.61 14.38 13.53 Actual Market Prices Raw cane sugar /4 13.53 12.23 11.21 10.71 7.05 1/ Measured in nominal U.S. cents per pound, ex-mill, factory basis. 2/ Average of five producing regions (Australia, Brazil–Center/South, Guatemala, Zambia, and Zimbabwe). 3/ Average of seven countries (Australia, Brazil, Colombia, Cuba, Guatemala, South Africa, and Thailand). /4 Raw cane sugar prices are is U.S. cents per lb, July-June average of monthly prices, fob Caribbean ports (note that production costs are ex-mill while the actual market prices are fob prices). Source: LMC International as reported in Sugar and Sweetener Situation & Outlook, Economic Research Service, USDA, September 2001. Actual market prices are from World Bank databases.
National average production costs do not reflect cost differences within a country and these differences can be substantial. In Jamaica for example, the cost of the private sector estates are about one-half of those of the state-owned and managed estates. These differences are due partly to variations in natural climatic conditions for sugar cane production, but mostly to better management. Thus, it may be possible for part of an industry to be competitive while other parts are uncompetitive.
Most Caribbean sugar industries have accumulated large debts from years of unprofitable operation. This debt reduces competitiveness by increasing interest costs, constraining equipment maintenance and replacement, and limiting application of production inputs such as fertilizer. Deferred equipment maintenance and replacement leads to more frequent equipment failure and increases factory downtime. Debt of cane growers, in those countries that have private sector cane growers, constrains their ability to undertake sugar cane replanting and apply adequate fertilizer, which in turn reduces yields and leads to further losses and additional debts. Once begun, debt escalation is difficult to escape. In St. Kitts & Nevis, the debt of the sector has accumulated over the past 15 years and totaled EC$286 (US$106) million by the end of 2003—40 percent of
14
annual GDP. In Trinidad, the state-owned sugar company, Caroni (1975) Limited, had accumulated current and long-term debt of TT$1.5 billion (US$240 million) and total debt and liabilities of TT$3.4 billion (US$540 million). In Jamaica, the failed privatization effort of 1994 led to the return of six estates/factories to the government from 1998-2000 and the assumption of their debts of about J$3.3 billion (US$77 million). That did not include the substantial debt of private Jamaican sugar cane farmers.
The trade regimes in many Caribbean countries are highly protectionist for sugar as well as other agricultural products and are another indication of a lack of competitiveness. For example, Barbados bound all agricultural tariffs at 100 percent and specific products at substantially higher rates during the 1994 Uruguay Round Agreement on Agriculture. In addition, a 15 percent VAT and a one percent environmental tax are applied to the c.i.f. import price plus tariffs of most agricultural products. The resulting total duties and charges approach 300 percent for many agricultural products produced in Barbados. The import tariffs have been reduced by the agreed 24 percent over the 10 years since the Uruguay Round Agreement, but remain high. White sugar imported within CARICOM is charged only the 15 percent VAT and the one percent environmental tax. Raw cane sugar imports are subject to a sugar levy of B$900 (US$150/ton), which is equivalent to an 80 percent duty at 2004 prices. The lower duties and charges on white sugar reflect the fact that it is not produced in Barbados and all domestic sugar consumption is met by imports. Jamaica also has high duties and fees on imports.
The Jamaican Government increased import duties on certain agricultural products in 2002. The duties were increased from 86 to 260 percent for poultry products, and selected vegetables (fresh or chilled tomatoes, cabbage, lettuce and carrots). Despite the high tariffs, food imports continue to rise which indicates the lack of competitiveness in many products. Jamaican raw sugar import face a 40 percent CET and a 63 percent stamp tax duty for a total import tariff of 128 percent since the stamp duty is also charged on the CET. Improving Competitiveness With the prospects of preference erosion increasing, Caribbean sugar producers who intend to continue producing sugar need to consider ways to improve competitiveness by reducing costs and adding value to their output. There are a number of ways that this can be done. Rationalize Sugar industries in most countries are comprised of several estates each with its own cane growing area and factory. Production costs vary among estates due to differences in sugar cane growing conditions, and field and factory performance. An industry may become more competitive by closing the unprofitable estates and shifting resources and equipment to the more profitable estates. This reduces the size of the industry, and allows the portion of the industry that remains to be more competitive. The sugar sector restructuring underway in Trinidad & Tobago closed one of the two sugar factories. The remaining factory has increased production and reduced per unit
15
costs by operating at the higher output level. Jamaica has developed several plans to rationalize the industry and close some factories. Under the proposals, cane production would be shifted to remaining factories. The plans are still under consideration but not yet agreed. Some Caribbean countries have sugar sectors with only one factory, such as St. Kitts & Nevis. Under such conditions it may not be possible to rationalize the industry in order to reduce costs, and in fact, the industry in St. Kitts & Nevis is slated to close. Privatize
Most of the sugar industries of the Caribbean are state-owned enterprises, which
world-wide experience has shown, do not perform as well as private sector companies. Past efforts to privatize the industries have been unsuccessful. The state-owned Jamaican estates were privatized in 1994 but were returned to the government starting in 1998. The failed privatization of the Jamaican sugar industry left the industry in a weaker state than before and the government still in control. Prospects for privatization are not good because the industries are unprofitable and potential buyers are aware of the risk of preference erosion. However, a partial privatization may be a more viable option for many sugar industries. This was done in Trinidad & Tobago in their recent restructuring program. The restructuring privatized cane growing, but not the factory. The factories will purchase cane from 6,000 private cane growers producing under contract on owned lands or leased company lands.
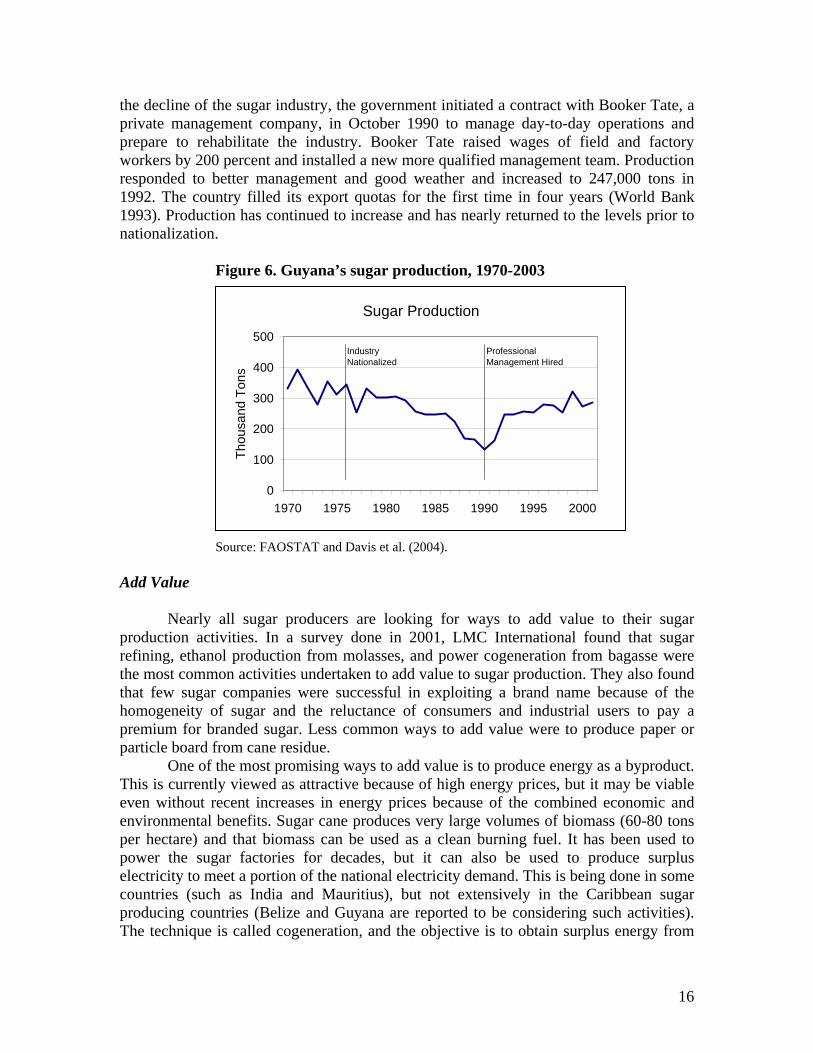
The value of private ownership is demonstrated in Jamaica where there are two private sector sugar estates and five public sector estates in operation. The private sector estates, have higher yields, more sugar produced per ton of cane and per hectare, lower labor costs, and less factory down time. One of the private sector estates, Worthy Park, is a fourth-generation family-owned company that began operating in 1918. It produces 10 tons of sugar per hectare of sugar cane land compared to the Jamaican industry average of 5 tons per hectare. It has doubled sugar cane production since 1990 while Jamaican national production has declined by 30 percent. The large difference between private sector and public sector sugar companies’ performance in Jamaica does not bode well for the survival of the Caribbean sugar sector in its current public sector dominated form. Efforts to improve efficiency of public sector companies have been tried repeatedly and often with World Bank involvement. These efforts have generally been unsuccessful in their objective of establishing a competitive sector that could operate without government support. Instead, they accomplished their immediate goal of preventing a collapse of the industry but at the expense of further debt. Professional Management While private ownership and management is the preferred model of operation, several Caribbean sugar industries have improved performance by hiring professional management. The sugar industry in Guyana was nationalized in 1975 and 1976 and went into a long period of decline, with production falling from about 350,000 tons in 1974 to only 132,000 tons in 1990 (Figure 6). Exports declined from 307,000 tons in 1974 to 129,000 tons in 1990 and were less than the 164,000 tons that could be sold under quota to the European Economic Community and U.S. at preferential prices. In order to arrest
16
the decline of the sugar industry, the government initiated a contract with Booker Tate, a private management company, in October 1990 to manage day-to-day operations and prepare to rehabilitate the industry. Booker Tate raised wages of field and factory workers by 200 percent and installed a new more qualified management team. Production responded to better management and good weather and increased to 247,000 tons in 1992. The country filled its export quotas for the first time in four years (World Bank 1993). Production has continued to increase and has nearly returned to the levels prior to nationalization.
Figure 6. Guyana’s sugar production, 1970-2003
Source: FAOSTAT and Davis et al. (2004). Add Value
Nearly all sugar producers are looking for ways to add value to their sugar
production activities. In a survey done in 2001, LMC International found that sugar refining, ethanol production from molasses, and power cogeneration from bagasse were the most common activities undertaken to add value to sugar production. They also found that few sugar companies were successful in exploiting a brand name because of the homogeneity of sugar and the reluctance of consumers and industrial users to pay a premium for branded sugar. Less common ways to add value were to produce paper or particle board from cane residue.
One of the most promising ways to add value is to produce energy as a byproduct. This is currently viewed as attractive because of high energy prices, but it may be viable even without recent increases in energy prices because of the combined economic and environmental benefits. Sugar cane produces very large volumes of biomass (60-80 tons per hectare) and that biomass can be used as a clean burning fuel. It has been used to power the sugar factories for decades, but it can also be used to produce surplus electricity to meet a portion of the national electricity demand. This is being done in some countries (such as India and Mauritius), but not extensively in the Caribbean sugar producing countries (Belize and Guyana are reported to be considering such activities). The technique is called cogeneration, and the objective is to obtain surplus energy from
Sugar Production
0
100
200
300
400
500
1970 1975 1980 1985 1990 1995 2000
Thou
sand
Ton
s
Industry Nationalized
Professional Management Hired
17
the burning of the cane residue (bagasse) or cane tops and field residue in high-efficiency boilers. This can be done by upgrading the equipment at sugar factories or using the bagasse in combination with coal in existing power generating plants. This latter approach requires little modification to existing power plants and benefits from the economies of scale of large power plants. The constraints to this approach are the cost of transporting the biomass fuel and the willingness of the power company to switch to an alternative fuel. If surplus power is generated by upgrading equipment at sugar factories, the efficiency is lower, because of the smaller scale of power plant, and large capital investments are required. There are substantial environmental advantages to using sugar cane bagasse and residue to produce electricity because of the clean burning properties of biomass compared to fossil fuels. Fossil fuel burning produces greenhouse gases, such as CO2, while burning biomass is considered to have zero CO2 emissions because sugar cane absorbs CO2 during growth and releases it during incineration.
A less viable approach to energy production in the Caribbean is to produce ethanol instead of sugar from the sugar cane. The ethanol could then be blended with gasoline to obtain a cleaner burning automobile fuel. Brazil has done this since the mid-1970s, but scaled back the program in the 1990s because it was unprofitable. It has recently expanded ethanol production from sugar cane in response to high petroleum and low sugar prices. Most Caribbean sugar producers could not profitably switch to ethanol without large government subsidies because they are high-cost sugar cane producers. There is an opportunity, however, to profitably produce ethanol from imported feedstock and export it duty-free to the U.S. under the Caribbean Basin Initiative. But, this would not add value to Caribbean sugar industries because it would be wholly outside the sugar sector and dependent on low-cost imported feedstock.
Sugar refining is another way to add value to sugar industries and that is the strategy being followed by the reformed sugar company in Trinidad & Tobago. The strategy plans to take advantage of the 40 percent CET exemption in the CARICOM Single Market and Economy for countries within the region. That makes it profitable to refine raw cane sugar and export it to countries in the region that lack refining capacity. However, the CET is only triggered once the region produces at least 75 percent of its own requirement of refined sugar which is currently 175,000 tons (Government of Jamaica 2003 page 16). The Government’s Role
The government can increase the competitiveness of its sugar industry by providing an enabling economic environment. This can be done by enacting policies and providing public services that allow the sugar industry to operate efficiently. This includes; building and maintaining rural roads that are critical for transporting sugar cane, providing access to power, fuels, and communications at competitive rates, and providing a stable macro economic environment with equitable taxation policies and fairly-valued exchange rates. Traditional activities of the public sector also include providing research on crop varieties and production practices to increase the competitiveness of the industry. Some activities previously provided by the public sector, such as extension to cane growers, are now sometimes provided by the private sector based on user fees. Sugar companies often provide healthcare and education services for employees, but these
18
services could be provided by the government to reduce the costs of sugar production. Experience has shown that the government should not be involved directly in marketing and production, since these activities are better done by the private sector. Diversify Out of Sugar
Those sugar industries that cannot become competitive in sugar need to diversify
out of sugar and this is being tried in a number of countries with varying levels of success. Past efforts to diversify have been constrained by poorly planned, financed and executed efforts as well as the ongoing competition from sugar which received high preference prices. If sugar preference prices erode, diversification will become a higher priority for both the public and private sector and will have better chances to succeed.
Efforts to diversify into fresh fruits and vegetables production for the tourist hotels or export market have generally been disappointing. Hotels catering to tourists need a regular supply of high quality produce which does not have high pesticide residue, insect damage, or other problems. Small producers find it difficult to meet such standards without large government support. Jamaica has a government program to provide such support, but it affects less than 100 farmers. The program was developed by the Ministry of Agriculture and is under the direction of the Jamaican Agricultural Society. It has been able to overcome some of the problems by closely involving the hotels. Seasonality of local production is somewhat reduced by the use of irrigation, and hotels know when local produce will be available and they import during other times. High tariffs add to the incentives for using local produce since many of the locally produced fruits and vegetables have tariffs of as much as 260 percent.
Despite the limited success of the program in Jamaica, efforts of Caribbean sugar producers to diversify into other agricultural crops have generally been unsuccessful. Often this was due to inappropriate project design, poor technology, improper institutional arrangements, and inadequate funding. The difficulties of diversify within the sugar sector are illustrated by the efforts of the Caroni sugar company of Trinidad & Tobago.4 The company was a state-owned enterprise that began efforts to diversify out of sugar in the 1970s with the formation of the Sugar Sector Rationalization Committee in 1978 to be followed by a five-year development plan in 1983-84. The plan called for the production of rice, citrus, coffee, corn, livestock, milk, miscellaneous food crops, and aquaculture. The labor union opposed the separation of the diversified activities from the Caroni sugar company because they feared it would weaken the importance of sugar and thus the wages and jobs of union members. Consequently the diversification effort was headed by the staff of the sugar company and the projects were activities of the sugar company. This caused two problems. First, the sugar company staff did not have expertise in non-sugar activities, and second, the staff were reluctant to have resources devoted to non-sugar activities and were not fully supportive of the diversification activities. When resources were to be shared between sugar and non-sugar activities, the priority went to sugar even if the need was greater in the non-sugar activity. The funding of the diversification effort was inadequate and that compromised many of the activities.
4 Based on a presentation by Dr. George Mason, agronomist at Caroni (1975) Limited at the Sugar Symposium in St. Kitts & Nevis, April 20, 2004.
19
The citrus plant, for example, was never constructed due to lack of funds and the planned-for processing of 85 percent of the crop that could not be consumed fresh, never occurred. The selection of planting materials and livestock was rushed once the diversification plan was approved with the result that the materials was not well suited to the soils and climate, or were of poor quality and were not readily marketable. The coffee varieties selected were of poor quality and that activity failed. The sheep project was designed for superior breeds available from Barbados, but due to time and budget pressures, less desirable local animals were used. Whether the diversification could have been done successfully cannot be know, but other countries had similar disappointing experiences.
The World Bank was involved in a diversification effort in Barbados which was initially successful but eventually failed. The World Bank had a Technical Assistance project with the Ministry of Agriculture in Barbados to support vegetable production and marketing in 1982 and an Industrial Credit Project in 1983 to support agro processing. This led to a substantial increase in vegetable exports. The implementation completion reports were satisfactory (World Bank 1996), but the capacity was lost once the World Bank support ended according to Ministry of Agriculture Officials. The World Sugar Market
Without the high prices of the preference markets, Caribbean producers would be more directly affected by the developments and trends in the world sugar market which has a long history of policy distortions that affect price levels and price volatility. These distortions have included government guaranteed prices to producers, import tariffs, quantitative import controls, and export subsidies. Most often these policies have been intended to protect producers from lower cost imports. The highest protection has generally occurred in OECD countries such as Japan, the European Union, and the United States. This protection has contributed to slower consumption growth, higher production, the emergence of alternative sweeteners, reduced net imports or increased net exports, and lower world prices. For example, such policies have caused the combined net imports of the European Union, Japan, and the United States to decline from one-half of world sugar imports in the 1970s to about zero in recent years (Mitchell, 2004). This has slowed the growth of world trade and depressed world prices compared to the levels that would have occurred without policy distortions in these countries. Consumers have often paid for such policies through higher prices. For example, U.S. consumers pay about US$0.22 per pound for raw cane sugar compared with a 2004 average world market prices of about US$0.07 cents per pound. Consumers in the EU pay about triple the world market price and consumers in Japan pay nearly twice those levels. Consumers in the Caribbean pay higher than world market prices because of high duties on imports or government policies which limit imports. In Trinidad & Tobago, for example, sugar prices are government controlled with higher prices for retail sugar sales than for wholesale prices for companies which use sugar in food processing or baking. In Jamaica, consumers pay about triple the current world market price for raw cane sugar because of government import controls and high import duties. The trend in world sugar prices has been down, after adjusting for inflation, with real sugar prices declining by about half since 1950 (Figure 7). This price decline has
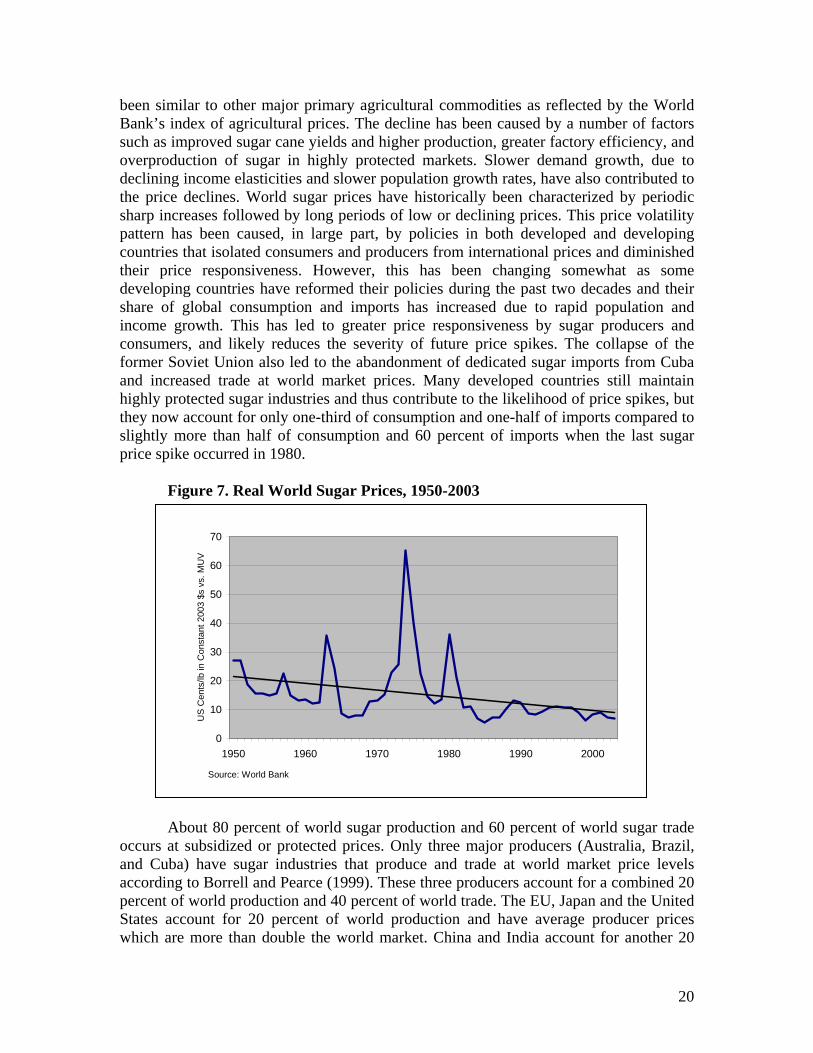
20
been similar to other major primary agricultural commodities as reflected by the World Bank’s index of agricultural prices. The decline has been caused by a number of factors such as improved sugar cane yields and higher production, greater factory efficiency, and overproduction of sugar in highly protected markets. Slower demand growth, due to declining income elasticities and slower population growth rates, have also contributed to the price declines. World sugar prices have historically been characterized by periodic sharp increases followed by long periods of low or declining prices. This price volatility pattern has been caused, in large part, by policies in both developed and developing countries that isolated consumers and producers from international prices and diminished their price responsiveness. However, this has been changing somewhat as some developing countries have reformed their policies during the past two decades and their share of global consumption and imports has increased due to rapid population and income growth. This has led to greater price responsiveness by sugar producers and consumers, and likely reduces the severity of future price spikes. The collapse of the former Soviet Union also led to the abandonment of dedicated sugar imports from Cuba and increased trade at world market prices. Many developed countries still maintain highly protected sugar industries and thus contribute to the likelihood of price spikes, but they now account for only one-third of consumption and one-half of imports compared to slightly more than half of consumption and 60 percent of imports when the last sugar price spike occurred in 1980.
Figure 7. Real World Sugar Prices, 1950-2003
About 80 percent of world sugar production and 60 percent of world sugar trade occurs at subsidized or protected prices. Only three major producers (Australia, Brazil, and Cuba) have sugar industries that produce and trade at world market price levels according to Borrell and Pearce (1999). These three producers account for a combined 20 percent of world production and 40 percent of world trade. The EU, Japan and the United States account for 20 percent of world production and have average producer prices which are more than double the world market. China and India account for another 20
0
10
20
30
40
50
60
70
1950 1960 1970 1980 1990 2000
Source: World Bank
US
Cen
ts/lb
in C
onst
ant 2
003
$s v
s. M
UV
21
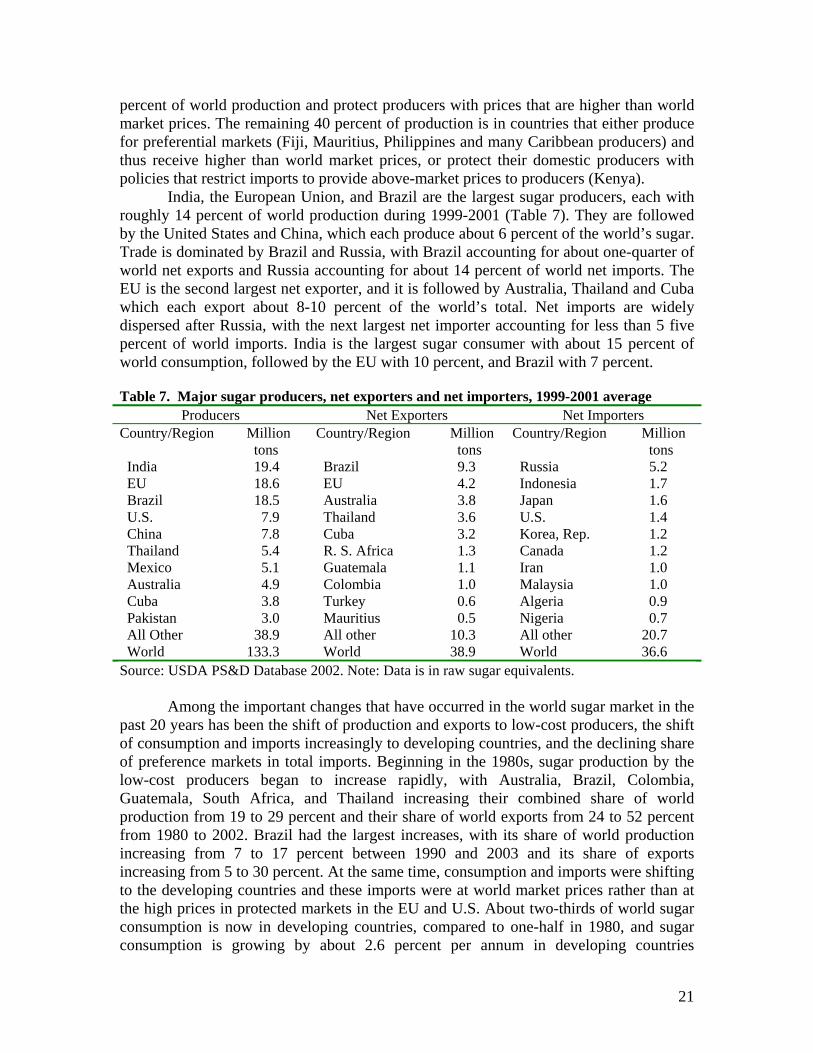
percent of world production and protect producers with prices that are higher than world market prices. The remaining 40 percent of production is in countries that either produce for preferential markets (Fiji, Mauritius, Philippines and many Caribbean producers) and thus receive higher than world market prices, or protect their domestic producers with policies that restrict imports to provide above-market prices to producers (Kenya). India, the European Union, and Brazil are the largest sugar producers, each with roughly 14 percent of world production during 1999-2001 (Table 7). They are followed by the United States and China, which each produce about 6 percent of the world’s sugar. Trade is dominated by Brazil and Russia, with Brazil accounting for about one-quarter of world net exports and Russia accounting for about 14 percent of world net imports. The EU is the second largest net exporter, and it is followed by Australia, Thailand and Cuba which each export about 8-10 percent of the world’s total. Net imports are widely dispersed after Russia, with the next largest net importer accounting for less than 5 five percent of world imports. India is the largest sugar consumer with about 15 percent of world consumption, followed by the EU with 10 percent, and Brazil with 7 percent. Table 7. Major sugar producers, net exporters and net importers, 1999-2001 average
Producers Net Exporters Net Importers Country/Region Million
tons Country/Region Million
tons Country/Region Million
tons India 19.4 Brazil 9.3 Russia 5.2 EU 18.6 EU 4.2 Indonesia 1.7 Brazil 18.5 Australia 3.8 Japan 1.6 U.S. 7.9 Thailand 3.6 U.S. 1.4 China 7.8 Cuba 3.2 Korea, Rep. 1.2 Thailand 5.4 R. S. Africa 1.3 Canada 1.2 Mexico 5.1 Guatemala 1.1 Iran 1.0 Australia 4.9 Colombia 1.0 Malaysia 1.0 Cuba 3.8 Turkey 0.6 Algeria 0.9 Pakistan 3.0 Mauritius 0.5 Nigeria 0.7 All Other 38.9 All other 10.3 All other 20.7 World 133.3 World 38.9 World 36.6 Source: USDA PS&D Database 2002. Note: Data is in raw sugar equivalents.
Among the important changes that have occurred in the world sugar market in the
past 20 years has been the shift of production and exports to low-cost producers, the shift of consumption and imports increasingly to developing countries, and the declining share of preference markets in total imports. Beginning in the 1980s, sugar production by the low-cost producers began to increase rapidly, with Australia, Brazil, Colombia, Guatemala, South Africa, and Thailand increasing their combined share of world production from 19 to 29 percent and their share of world exports from 24 to 52 percent from 1980 to 2002. Brazil had the largest increases, with its share of world production increasing from 7 to 17 percent between 1990 and 2003 and its share of exports increasing from 5 to 30 percent. At the same time, consumption and imports were shifting to the developing countries and these imports were at world market prices rather than at the high prices in protected markets in the EU and U.S. About two-thirds of world sugar consumption is now in developing countries, compared to one-half in 1980, and sugar consumption is growing by about 2.6 percent per annum in developing countries
22
compared to no growth in developed countries. Approximately one-half of world sugar imports are now by developing countries compared to less than one-third in 1980. These shifts have diminished the importance of developed country imports and the importance of EU and U.S. quota imports, which now account for only 7 percent of total world import quantities compared to 13 percent in 1982.
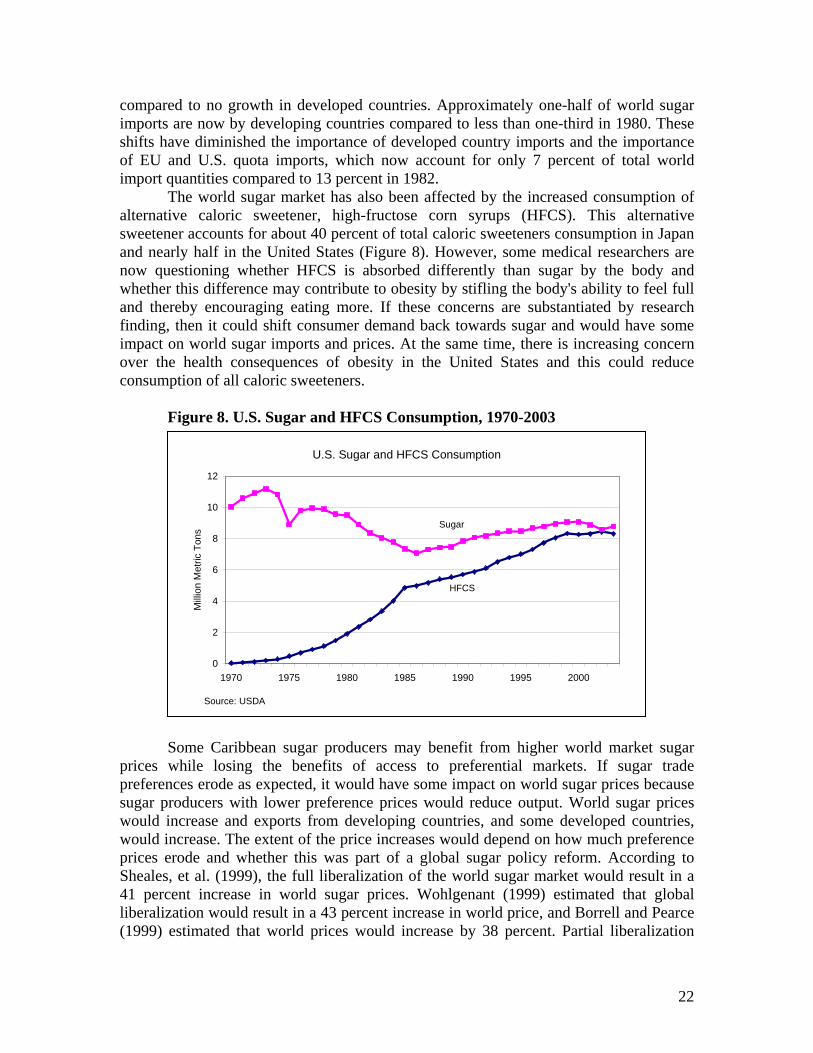
The world sugar market has also been affected by the increased consumption of alternative caloric sweetener, high-fructose corn syrups (HFCS). This alternative sweetener accounts for about 40 percent of total caloric sweeteners consumption in Japan and nearly half in the United States (Figure 8). However, some medical researchers are now questioning whether HFCS is absorbed differently than sugar by the body and whether this difference may contribute to obesity by stifling the body's ability to feel full and thereby encouraging eating more. If these concerns are substantiated by research finding, then it could shift consumer demand back towards sugar and would have some impact on world sugar imports and prices. At the same time, there is increasing concern over the health consequences of obesity in the United States and this could reduce consumption of all caloric sweeteners.
Figure 8. U.S. Sugar and HFCS Consumption, 1970-2003 Some Caribbean sugar producers may benefit from higher world market sugar
prices while losing the benefits of access to preferential markets. If sugar trade preferences erode as expected, it would have some impact on world sugar prices because sugar producers with lower preference prices would reduce output. World sugar prices would increase and exports from developing countries, and some developed countries, would increase. The extent of the price increases would depend on how much preference prices erode and whether this was part of a global sugar policy reform. According to Sheales, et al. (1999), the full liberalization of the world sugar market would result in a 41 percent increase in world sugar prices. Wohlgenant (1999) estimated that global liberalization would result in a 43 percent increase in world price, and Borrell and Pearce (1999) estimated that world prices would increase by 38 percent. Partial liberalization
U.S. Sugar and HFCS Consumption
0
2
4
6
8
10
12
1970 1975 1980 1985 1990 1995 2000
Milli
on M
etric
Ton
s
HFCS
Sugar
Source: USDA
23
would result in smaller changes in world prices. A recent expert consultation on sugar at (FAO 2004) debated the extent of the price increase which would result from trade liberalization in light of Brazil’s potential to expand exports. Wohlgenant presented new simulations assuming a larger supply response from Brazil and the results support the conclusion that prices would rise by 30-40 percent under full trade liberalization, but these increases would erode over time as Brazil responded to higher prices. Policy Choices Many Caribbean sugar producers are not profitable even at current preferential prices and would become even more unprofitable if preference prices eroded. However, some producers may benefit from higher international sugar prices which result from production, consumption, and trade adjustments in response to lower preference prices. Sugar producers that can become competitive in a more liberalized world market can benefit by increasing exports and taking actions to reduce costs and add value to their sugar production activities. Sugar producers that are not currently profitable will find it difficult to reduce costs or add enough value to become competitive and should use the transition period and adjustment programs available to diversify into other activities and retrain workers. Some Caribbean sugar producers will not fall clearly into either of these groups because they have sugar industries that have a portion that is competitive or can become competitive with changes. In such cases, the industries need to be rationalized or privatized to allow the competitive portion to continue while the uncompetitive portions are closed. Professional management may be a viable alternative for government-owned and -managed sugar industries.
For some countries, it may be necessary to shift from a production strategy to a preservation strategy by converting the sugar lands into pasture lands for sheep and cattle. This would require much less intensive farming practices and labor than sugar and it would still provide both environmental protection for the land and attractive vistas for tourists. Sugar could still be grown on some lands, but some of the land could be shifted to permanent pasture. The pasture could be devoted to grazing cattle or the Barbados black belly sheep which is well adapted to the island environment and has superior meat qualities that make it very marketable to the large tourist industry or for export. The cost of maintaining permanent pasture would be small compared to the cost of growing sugar cane and losses currently incurred in supporting the sugar industry would be curtailed. Government land which is now in sugar could be converted to permanent pasture and leased to local livestock producers in much the same way that government-owned lands in the western United States are now leased to livestock producers. Government lease regulations could limit the number of animals per acre to prevent over grazing. Lands could be leased on a competitive bid basis or directed to small farmers as part of an income support program.
24
Conclusions Sugar exporters of the Caribbean depend on sales of sugar to the European Union under the ACP-EU Sugar Protocol at triple the world market price and somewhat less dependent on the U.S. sugar import program which pays double current world market sugar prices. There are indications that the prices received on these preferential exports will decline in the future while the quantities are largely bound by international agreement and are not expected to decline. According to a reform proposal by the European Commission, the prices received for exports to the EU would decline by 39 percent over a two year period once a reform policy is agreed.
The consequence of likely erosion of preferences, large debts, and ongoing losses even on current sales to the high priced EU quota market leave many countries of the Caribbean with few alternatives. Since most of the sugar industries are state-owned, countries may continue to support their loss-making sugar industries with high levels of government budget support while attempting to restructure their industries to reduce costs and contain losses. If they cannot become competitive with lower preference prices, they may decide to close their industries to avoid further losses and use adjustment programs to retrain sugar workers for other jobs. Another alternative would be to privatize the industries, but this does not appear viable in many cases because of the unprofitable nature of the industries and widespread concerns over preference erosion. Privatizing some aspects of the industry may be a more viable alternative as was done in Trinidad & Tobago when sugar cane production was shifted entirely to private growers.
Any of the alternatives will likely entail large government costs. If the sugar sector is closed, employees will need to be compensated at least as much as labor agreements specify and countries will need to introduce programs to deal with the social consequences. Trinidad is in the process of a major restructuring of its sugar sector, and provided an enhanced severance package to all of its 9,200 employees at a cost of TT$1.5 billion (US$240 million). The restructuring program does not close the sector, but it transfers all sugar cane production to private farmers, closes one of the two mills, and divests of most of the non-sugar activities. The sugar factory and refinery remain in a state-owned corporation, but with a smaller workforce and limited scope of activities. Their restructuring could serve as a model for other countries, and is discussed in detail in the Appendix to this report. Jamaica is following the second alternative, which is to try and reduce operating losses while continuing to operate the sugar industry in its current form. This is being done by bringing in new management and better business practices, and appears to be partially successful. However, the government is still left with the large debt of the sugar companies and will need to support modernization if the sector is to return to profitability. It also leaves the government vulnerable to future large losses if the industry cannot become profitable. The Government of St. Kitts & Nevis has taken the decision to close the sugar industry. Government officials in Barbados appear most likely to follow the second alternative of supporting the sector in its current form and officials are exploring ways to add value such as producing energy from sugar cane or diversifying sugar cane lands into vegetables or livestock to meet the needs of the tourist hotels. It is important for countries to take decisions regarding their sugar industries because past government inaction in dealing with sugar industry problems has allowed
25
further debts to accumulate and equipment to deteriorate. In Jamaica, for example, there were three reports prepared on the future of the sugar sector in 2001 with detailed documentation of problems and recommendations for action. However, most of these recommendations were not taken up. Instead, the sector continues to operate, uncertain of its future, with production having declined each year since 2000. In Trinidad & Tobago, a Tripartite Report to restructure the industry was prepared in the mid-1990s with broad stakeholder involvement and support, but it was not implemented with the resulting continued deterioration of the industry and the eventual restructuring which occurred in 2003.
The sugar industries of the Caribbean face severe challenges in the coming years. Those that survive will need to become more competitive by better managing and operating their industries and by adding value to sugar production in any way possible. One promising alternative appears to be to produce surplus energy from sugar cane residue (bagasse) through cogeneration. This requires the installation of high-efficiency boilers which can then produce surplus electricity which can be sold to the public utility. Other alternatives such as sugar refining and ethanol production depend on the policies and market opportunities available in each country. Those producers that cannot compete will need to devote resources to retraining workers and developing sugar lands into commercial, residential and agricultural uses.
26
References Berg, Christoph, World Ethanol Production 2001, F.O. Licht, Ratzeburg, Germany. Borrell, Brent and David Pearce, “Sugar: the taste test of trade liberalization,” Center for International Economics, Canberra & Sydney Australia, September 1999. Davis, H.B., D. Eastwood, W.L. McG. Stuart, and N. Surujbally, “The Sugar Industry in Guyana,” unpublished manuscript, 2004. European Commission, “EU Trade Concession to Least Developed Countries, Everything But Arms Proposal, Possible Impacts on the Agricultural Sector,” DG Trade, Brussels, 2000. European Commission, “Economic Partnership Agreements, Start of negotiations,” Brussels, September 2002. European Commission Press Release IP/05/776, Brussels, 22 June 2005. European Commission, Commission Staff Working Document, “Reforming the European Union’s Sugar Policy, Update of Impact Assessment,” Brussels 22.6.2005 SEC(2005) 808. FAO, FAOSTATA database, 2004. FAO, “Informal Expert Consultation on Sugar,” August 5-6, 2004, Rome. International Sugar Organization, “Domestic Prices for Sugar: International Comparison,” 28 October 2003. International Sugar Organization, “Quarterly Market Outlook,” September 2002, London. Government of Jamaica, “Green Paper #_/03 on the Sugar Industry,” April 2003. LMC International, Pricing Policy Reform—A Summary, Sweetener Analysis, January 1999. LMC International as reported in Sugar and Sweetener Situation & Outlook, Economic Research Service, USDA, September 2001. LMC International, “Sweetener Analysis: Opportunities for Value Adding at Sugar Factories,” November 2001. LMC International, “Sweetener Analysis: Understanding Trends in Global Production Costs,” November 2002. LMC International and Oxford Policy Management, “Addressing the Impact of Preference Erosion in Sugar on Developing Countries,” September 2003.
27
Lord, Ron, Sugar Background for 1995 Farm Legislation, ERS/USDA Agricultural Economic Report Number 171, April 1995. Mitchell, Donald, “Sugar Policies: Opportunity for Change,” Policy Research Working Paper No. 3222, February 2004, World Bank, Washington D.C. Noble, Joan, “Radical Reform of the EU Sugar Regime Will Bring Lasting Change,” F.O. Lichts International Sugar & Sweetener Report, July 5, 2005, Vol. 137, No.20. Sheales, Terry, Simon Gordon, Ahmed Hafi, and Chris Toyne, “Sugar International Policies Affecting Market Expansion,” ABARE Research Report 99.14, November 1999. Wohlgenant, Michael K., “Effects of Trade Liberalization on the World Sugar Market,” FAO. 1999. USDA/ERS Briefing Room Data for Sugar, 2004. USDA, ERS, “Sugar and Sweetener Situation and Outlook Report,” various issues. World Bank, “Commodity Price Data”, Development Prospects Group, various issues. World Bank, World Development Indicators, 2002. World Bank, “Implementation Competition Report Barbados Agricultural Development Project,” 1996.
28
Appendix I
Trinidad and Tobago Sugar Industry Restructuring Program
The sugar industry in Trinidad and Tobago began a major restructuring program
in 2003. This was preceded by no less than eight previous attempts to restructure and create a viable sugar industry. Despite these past efforts, by the end of 2003 the state-owned sugar company, Caroni (1975) Limited, had accumulated current and long-term debt of TT$1.5 billion, debt and liabilities of TT$3.4 billion, and was making annual losses of about TT$500 million.5 The company had never made a profit in 30 years of operation as a state-owned enterprise. With total revenues of only TT$411 million in 2002, the Government concluded that Caroni was highly unlikely to achieve viability in the foreseeable future and that the industry urgently needed to be restructured. Prior to the restructuring, Caroni (1975) Limited employed approximately 9,200 persons, owned 77,000 acres of land (of which 29,000 were used for sugar cane production), refined sugar, and produced sugar, rum, dairy, beef, citrus and rice. The major elements of the restructuring were the creation of three new state-owned companies; retaining Caroni (1975) Limited to manage the restructuring as a non-trading company; providing a separation package to all employees; removing all debt and liabilities from Caroni; and transferring Caroni lands to the Government. These lands were to be leased to farmers for sugar cane production or developed for other uses. The restructuring plan involved closing one of the two sugar factories, shifting all cane production to farmers, divesting of the non-sugar activities, and requiring all new business activities to be private sector driven. All debts and liabilities and all lands owned by Caroni were transferred to the government. All employees were given a separation package and retraining budgets. The restructured sugar company was to mill sugar cane produced in Trinidad and export it to the EU to meet its quota. Any additional sugar produced beyond the EU quota would be used to meet domestic demand. The new company would import raw sugar duty-free from other countries in the CARICOM trading area (primarily Guyana) and refine it to satisfy domestic demand or export it within the CARICOM region. This activity would benefit from the protection of the 40 percent Common External Tariff (CET) on imports of refined sugar from outside CARICOM. The restructuring was expected to result in a loss of jobs in the initial years, but an increase in jobs over the longer-term as employees were retrained and new jobs created as lands not used for sugar production were developed for commercial and residential use.
All employees of Caroni were separated from the company and given a Voluntary Separation of Employment Package (VSEP), retraining opportunities, and unspecified future preferential treatment to acquire some of the Caroni assets, bungalows, and agricultural land for use in their own businesses or for personal use. Prior to the restructuring, there were about 8,100 daily-paid field and factory workers and 1,100 monthly-paid workers. The cost of the VSEP was estimated at TT$730.9 million, of which TT$299.5 million was allocated to monthly-paid workers and TT$431.4 million
5 In 2003, 6.25TT$ equal US$1.0.
29
was allocated to daily-paid workers. The average VSEP benefit was about TT$54,600 for daily-paid workers, and TT$272,000 for monthly-paid workers. The benefit obligations were specified by the Retrenchment and Severance Benefits Act (RSBA) No. 32 of 1985 based on time-in-service and pay rate. Under this Act a person with 18 years service, for example, would be entitled to 30.5 months pay (Appendix IV, page 3). An enhanced benefit package was eventually agreed which provided a 30 percent enhancement to the Benefits Act and made some other allowances for age. The average VSEP benefit to daily-paid workers was equal to 2 years of annual pay and the average for monthly-paid workers was about 4.7 years of annual pay. Each worker was also given a retraining budget of up to TT$4,000 for daily-paid and up to TT$9,000 for monthly-paid workers for approved training. In addition, all employees and their spouses were given computer literacy training at a cost of TT$200 per person. If the employee and spouse did not want to take the computer literacy training, they could designate one child to receive the training. Counseling and financial advisory services were provided to all employees. The training programs have been taken-up by many of the former employees and there were (as of April 2004) 1,200 daily-paid and 500 monthly-paid former staff in approved training programs. Others were waiting for training, but could not be accommodated because of the large number of staff eligible for training and the limited number of qualified trainers. Many of the workers had skills which were not certified (such as welding) and only needed limited additional training to be certified. The reaction of the former employees of Caroni was mixed, but generally favorable. The senior monthly-paid workers were the least satisfied with the VSEP while many of the daily-paid workers were very satisfied with the VSEP. Of the 7,900 daily-paid workers, about 3,500 were expected to be retrained with marketable skills. The entire cost of the restructuring program was estimated at TT$1.5 billion.
The three new companies created were: the Sugar Manufacturing Company Limited (SMCL), the Estates Management Business Development Company (EMBD), and the Rum distillers of Trinidad and Tobago Limited (RDTT). EMBD was to provide the security for the vacated lands and oversee their return to the Government. It was also to develop some lands for commercial and residential use and ensure that the governments land use policy was followed. EMBD was mandated to conduct a land capability survey. RDTT was to take over rum production and seek an investor for ongoing operations. The Company was considered a viable candidate for privatization because of a large stock of aged rum which had a ready market. Other assets of Caroni were to be sold by the Ministry of Finance, Divestment Secretariate, or the Ministry of Agriculture, Lands, and Marine Resources (MALMR). These assets included the Sugarcane Feed Center, livestock, citrus groves, the rice project, dairy operation, and the aquaculture project. Certain services previously provided by Caroni, such as the cane quality control program, environmental regulations, roadway and culvert repair, scale calibration and monitoring, and coordination of sugar cane hauling were transferred to the MALMR. Management of certain facilities such as social clubs, schools, and medical centers were awarded to local authorities or organizations. As of January 2004, EMBD had received 12,900 requests for agricultural and residential lands. The Sugar Manufacturing Company Limited was established in August 2003 using transitional staff from Caroni and the sugar mill and refinery at St. Madeleine. The second mill was closed and used to provide parts and training facilities for the remaining
30
staff and mill. The Company was to be the State appointed miller of sugar cane and to be the primary source of refined sugar for local consumption. Since all Caroni employees were separated and given the VSEP, the new Company was free to hire only those employees with the skills required. Wages were determined by existing labor agreements that applied to sugar workers as well as workers in other sectors. About 500 of the former employees were hired back by the new Company. The new Company no longer produced sugar cane, but instead purchased cane from 6,000 private cane growers producing under contract using owned lands or leased government lands. A fixed price of TT$180/ton was to be paid per ton of cane, with the mandate to implement a cane quality payment system. The Company could import raw cane sugar for refining or refined sugar for sale to the domestic market. Production in excess of the EU quota of about 55,000 tons was not profitable given the cost structure and the company planed to produce only the amount of sugar that could be sold to the EU. The U.S. quota of 7,372 tons would go unfilled because it could not be satisfied profitably. Company officials believed the U.S. quota would not be forfeited if it went unfilled. The viability of the restructured sugar company depended on four factors: i) access to the EU quota and the high prices available, ii) the protection afforded by the CARICOM Common External Tariff (CET) of 40 percent which must be paid on raw or refined sugar from outside the region, and iii) the protection afforded in the domestic market by high government-set wholesale and retail sugar prices, and iv) the ability of the Company to control costs. Without the high prices for EU quota sugar, domestic sugar cane production would not be viable. Even after restructuring, high cane prices have been maintained as government policy, with farmers receiving TT$180/ton (US$30/ton), which was double that of low-cost producer Australia. At such high prices, exports to the U.S. quota market were not profitable even though U.S. quota prices were nearly three times the 2004 world market price. Sugar cane accounted for 75 percent of total raw sugar production costs. Other costs had been reduced because the Company had reduced its work force to 500 workers. Given high costs, the Company planned to produce only the amount of raw cane sugar that could be exported to the EU under quota, which was about 55,000 tons under the EU’s Sugar Protocol and Special Preference Sugar programs. The CET of 40 percent provided an opportunity for SMCL to profitably import raw sugar from within CARICOM and export refined sugar to CARICOM countries. The total demand for refined sugar imports within the CARICOM countries was approximately 200,000 tons and most of this was not being met by CARICOM exports because of the lack of sugar refining capacity. Under such condition, countries were granted a CET wavier to import from outside CARICOM. The Company planned to expand refining capacity to meet this demand. The Companies’ refinery had a name-plate capacity to produce 80,000 tons of refined sugar and the refinery would be upgraded and expanded. If raw cane sugar was not available for import from CARICOM countries, then the Company would apply for a CET wavier and import from other raw sugar exporters such as Brazil. Sugar prices in Trinidad and Tobago were regulated with very high prices to retail consumers and lower (but still well above world market) wholesale prices to manufactures of products using sugar. This provided a lucrative market opportunity for both manufactures and SMCL. The ex-warehouse price of refined sugar to manufactures was equal to the most recent 30 day average International Sugar Organization price plus a
31
16 percent allowance for storage and handling--currently TT$4,600 per ton after allowing for the CET of 40 percent. The government-regulated retail refined sugar price was more than double that at TT$11,000 per ton. Sugar consumption by manufactures was 46,000 tons and retail consumption was 9,000 tons. Brown sugar consumption was an additional 14,000 tons bringing total domestic consumption to 69,000 tons. The monopoly on imports by Caroni was removed in 2002 and that led to a 25 percent loss of market share to the private sector that had better marketing and distribution. The government is reportedly considering re-establishing the monopoly to the Company. Without the monopoly, the company would continue to lose market share as private sector companies import refined sugar and package and distribute to manufactures and retailers. The restructuring of the sugar sector came after 30 years of unprofitable operation by the state-owned sugar company. It may provide a useful model for other countries facing similarly unprofitable sugar sectors. The government officials in charge of the restructuring stress the importance of developing an initial plan that can be effectively defended against the inevitable criticism. Once the plan is announced, the timetable should be followed. It is important to meet with all affected parties and provide detailed information on the plan. Implementation should be done quickly so that employees can retrain and return to productive employment. Counseling and financial advice should be given to ease the transition. The cost of the entire restructuring program was high at TT$1.5 billion, however it was justified by the annual loss of TT$500 million per year from ongoing operations. The redistribution of sugar lands to other commercial and residential uses could partially offset the debts and liabilities of the sugar company, and provide a stronger tax base for the future. On balance, the restructuring was a success and most of the former sugar workers appear satisfied with the separation package. References Caroni (1975) Limited, Restructuring of Caroni (1975) Limited, February 2004. Divestment Secretariat, The Restructuring of the Sugar Industry: 2003, March 2003. Sugar Manufacturing Company Limited (SMCL), Strategic Imperatives for Milling Period 2004 and Beyond: Conceptual Framework, September 2003.