Embed Size (px)
Citation preview
December 2016
Sugar trends in Latin America
2
Trends in Key Sugar Countries Of Latin America
3
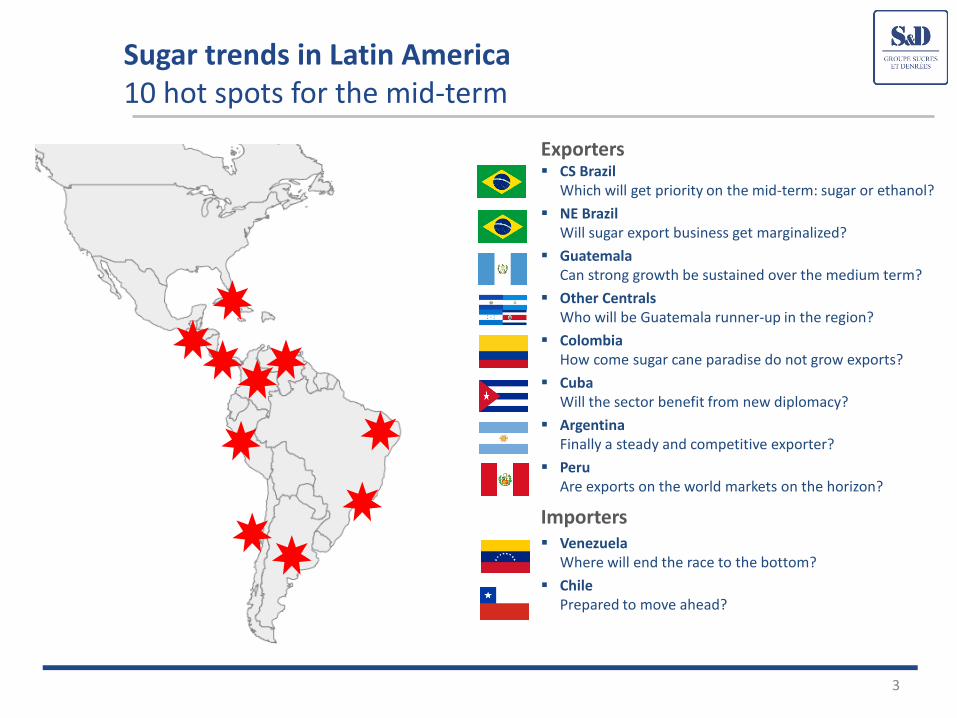
Sugar trends in Latin America 10 hot spots for the mid-term
Exporters CS Brazil Which will get priority on the mid-term: sugar or ethanol?
NE Brazil Will sugar export business get marginalized?
Guatemala Can strong growth be sustained over the medium term?
Other Centrals Who will be Guatemala runner-up in the region?
Colombia How come sugar cane paradise do not grow exports?
Cuba Will the sector benefit from new diplomacy?
Argentina Finally a steady and competitive exporter?
Peru Are exports on the world markets on the horizon?
Importers Venezuela Where will end the race to the bottom?
Chile Prepared to move ahead?
4
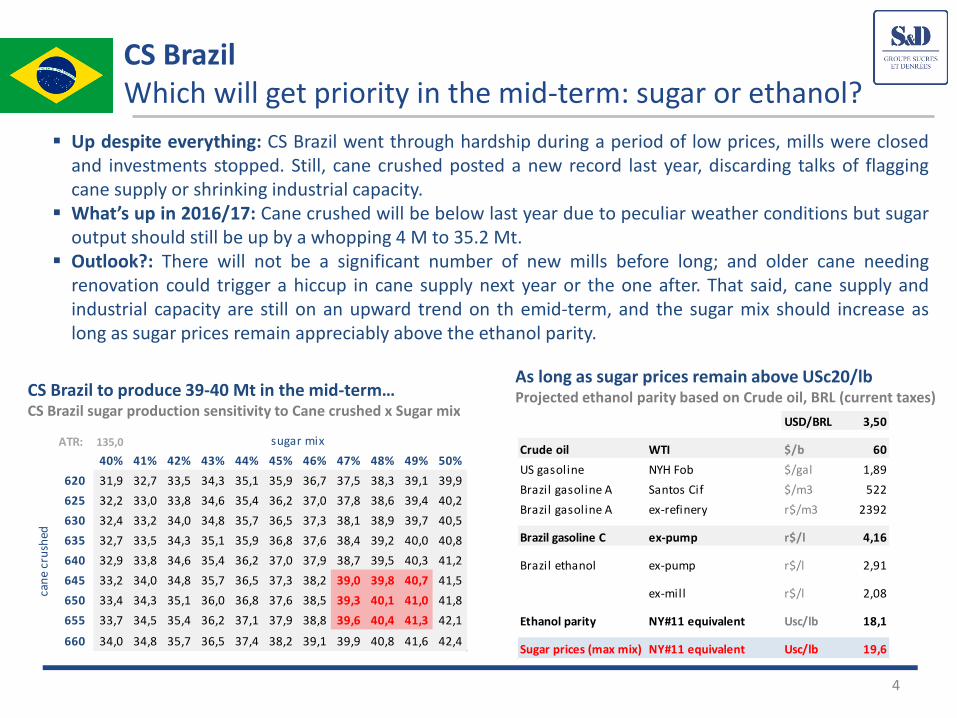
CS Brazil to produce 39-40 Mt in the mid-term… CS Brazil sugar production sensitivity to Cane crushed x Sugar mix
CS Brazil Which will get priority in the mid-term: sugar or ethanol?
Up despite everything: CS Brazil went through hardship during a period of low prices, mills were closed and investments stopped. Still, cane crushed posted a new record last year, discarding talks of flagging cane supply or shrinking industrial capacity.
What’s up in 2016/17: Cane crushed will be below last year due to peculiar weather conditions but sugar output should still be up by a whopping 4 M to 35.2 Mt.
Outlook?: There will not be a significant number of new mills before long; and older cane needing renovation could trigger a hiccup in cane supply next year or the one after. That said, cane supply and industrial capacity are still on an upward trend on th emid-term, and the sugar mix should increase as long as sugar prices remain appreciably above the ethanol parity.
As long as sugar prices remain above USc20/lb Projected ethanol parity based on Crude oil, BRL (current taxes)
ATR: 135,0
40% 41% 42% 43% 44% 45% 46% 47% 48% 49% 50%
620 31,9 32,7 33,5 34,3 35,1 35,9 36,7 37,5 38,3 39,1 39,9
625 32,2 33,0 33,8 34,6 35,4 36,2 37,0 37,8 38,6 39,4 40,2
630 32,4 33,2 34,0 34,8 35,7 36,5 37,3 38,1 38,9 39,7 40,5
635 32,7 33,5 34,3 35,1 35,9 36,8 37,6 38,4 39,2 40,0 40,8
640 32,9 33,8 34,6 35,4 36,2 37,0 37,9 38,7 39,5 40,3 41,2
645 33,2 34,0 34,8 35,7 36,5 37,3 38,2 39,0 39,8 40,7 41,5
650 33,4 34,3 35,1 36,0 36,8 37,6 38,5 39,3 40,1 41,0 41,8
655 33,7 34,5 35,4 36,2 37,1 37,9 38,8 39,6 40,4 41,3 42,1
660 34,0 34,8 35,7 36,5 37,4 38,2 39,1 39,9 40,8 41,6 42,4
sugar mix
can
e cr
ush
ed
USD/BRL 3,50
Crude oil WTI $/b 60
US gasoline NYH Fob $/gal 1,89
Brazil gasoline A Santos Cif $/m3 522
Brazil gasoline A ex-refinery r$/m3 2392
Brazil gasoline C ex-pump r$/l 4,16
Brazil ethanol ex-pump r$/l 2,91
ex-mill r$/l 2,08
Ethanol parity NY#11 equivalent Usc/lb 18,1
Sugar prices (max mix) NY#11 equivalent Usc/lb 19,6
5
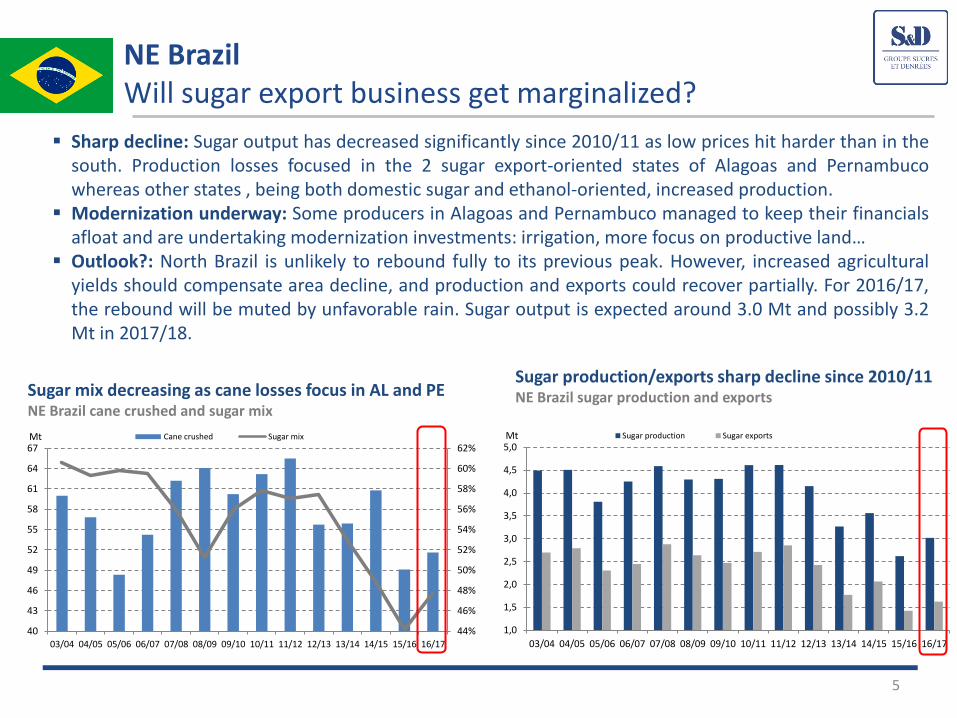
Sugar mix decreasing as cane losses focus in AL and PE NE Brazil cane crushed and sugar mix
NE Brazil Will sugar export business get marginalized?
Sharp decline: Sugar output has decreased significantly since 2010/11 as low prices hit harder than in the south. Production losses focused in the 2 sugar export-oriented states of Alagoas and Pernambuco whereas other states , being both domestic sugar and ethanol-oriented, increased production.
Modernization underway: Some producers in Alagoas and Pernambuco managed to keep their financials afloat and are undertaking modernization investments: irrigation, more focus on productive land…
Outlook?: North Brazil is unlikely to rebound fully to its previous peak. However, increased agricultural yields should compensate area decline, and production and exports could recover partially. For 2016/17, the rebound will be muted by unfavorable rain. Sugar output is expected around 3.0 Mt and possibly 3.2 Mt in 2017/18.
Sugar production/exports sharp decline since 2010/11 NE Brazil sugar production and exports
44%
46%
48%
50%
52%
54%
56%
58%
60%
62%
40
43
46
49
52
55
58
61
64
67
03/04 04/05 05/06 06/07 07/08 08/09 09/10 10/11 11/12 12/13 13/14 14/15 15/16 16/17
Mt Cane crushed Sugar mix
1,0
1,5
2,0
2,5
3,0
3,5
4,0
4,5
5,0
03/04 04/05 05/06 06/07 07/08 08/09 09/10 10/11 11/12 12/13 13/14 14/15 15/16 16/17
Mt Sugar production Sugar exports
6
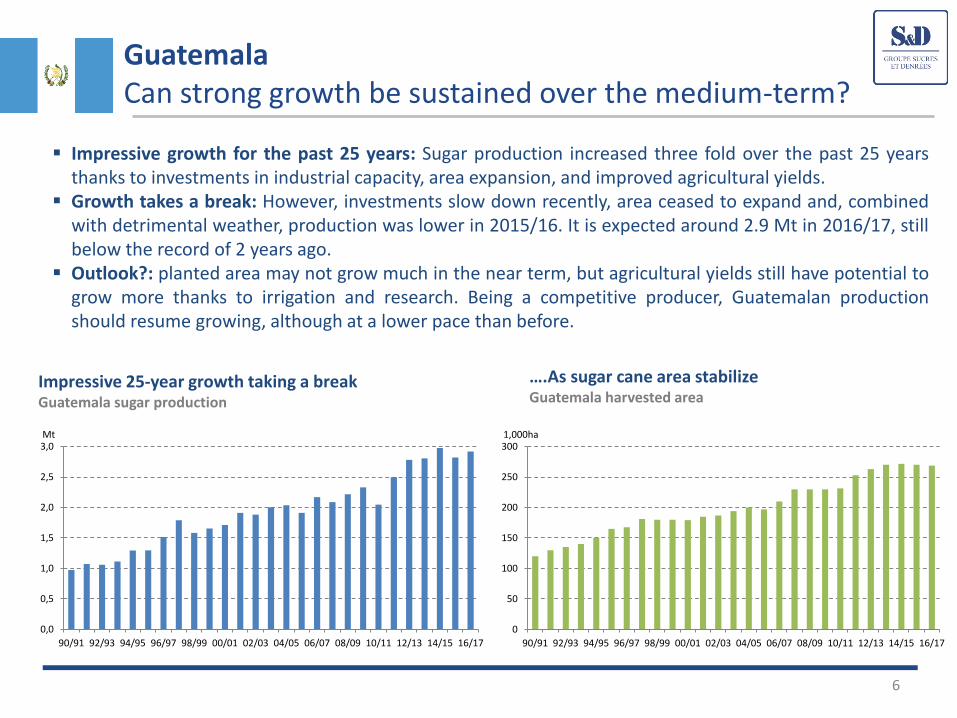
Impressive 25-year growth taking a break Guatemala sugar production
Guatemala Can strong growth be sustained over the medium-term?
Impressive growth for the past 25 years: Sugar production increased three fold over the past 25 years thanks to investments in industrial capacity, area expansion, and improved agricultural yields.
Growth takes a break: However, investments slow down recently, area ceased to expand and, combined with detrimental weather, production was lower in 2015/16. It is expected around 2.9 Mt in 2016/17, still below the record of 2 years ago.
Outlook?: planted area may not grow much in the near term, but agricultural yields still have potential to grow more thanks to irrigation and research. Being a competitive producer, Guatemalan production should resume growing, although at a lower pace than before.
….As sugar cane area stabilize Guatemala harvested area
0,0
0,5
1,0
1,5
2,0
2,5
3,0
90/91 92/93 94/95 96/97 98/99 00/01 02/03 04/05 06/07 08/09 10/11 12/13 14/15 16/17
Mt
0
50
100
150
200
250
300
90/91 92/93 94/95 96/97 98/99 00/01 02/03 04/05 06/07 08/09 10/11 12/13 14/15 16/17
1,000ha
7
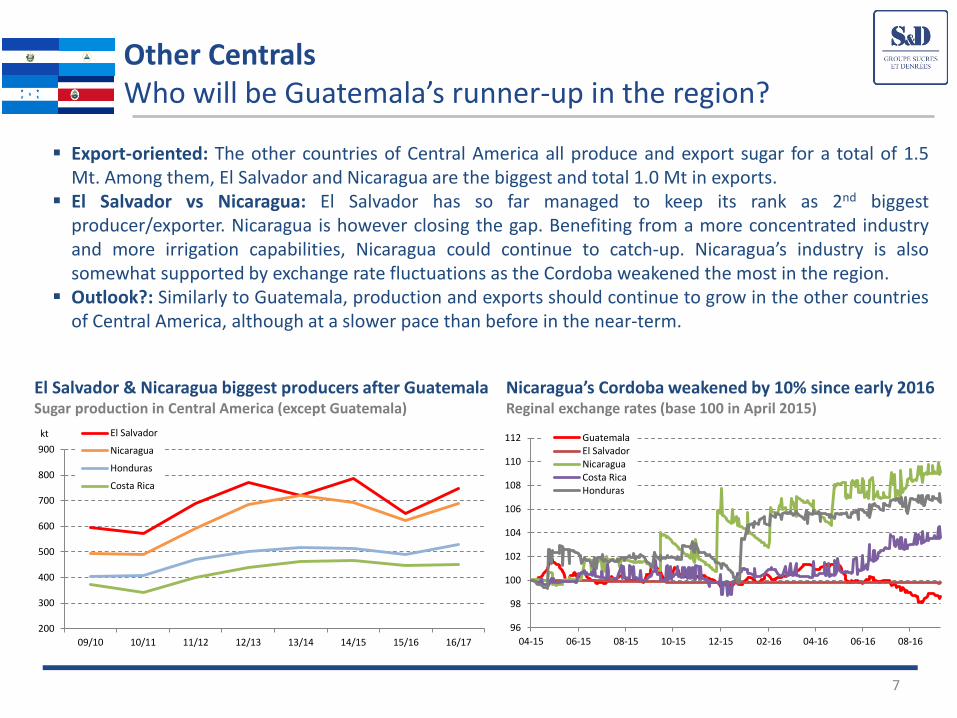
El Salvador & Nicaragua biggest producers after Guatemala Sugar production in Central America (except Guatemala)
Other Centrals Who will be Guatemala’s runner-up in the region?
Export-oriented: The other countries of Central America all produce and export sugar for a total of 1.5 Mt. Among them, El Salvador and Nicaragua are the biggest and total 1.0 Mt in exports.
El Salvador vs Nicaragua: El Salvador has so far managed to keep its rank as 2nd biggest producer/exporter. Nicaragua is however closing the gap. Benefiting from a more concentrated industry and more irrigation capabilities, Nicaragua could continue to catch-up. Nicaragua’s industry is also somewhat supported by exchange rate fluctuations as the Cordoba weakened the most in the region.
Outlook?: Similarly to Guatemala, production and exports should continue to grow in the other countries of Central America, although at a slower pace than before in the near-term.
Nicaragua’s Cordoba weakened by 10% since early 2016 Reginal exchange rates (base 100 in April 2015)
200
300
400
500
600
700
800
900
09/10 10/11 11/12 12/13 13/14 14/15 15/16 16/17
kt El Salvador
Nicaragua
Honduras
Costa Rica
96
98
100
102
104
106
108
110
112
04-15 06-15 08-15 10-15 12-15 02-16 04-16 06-16 08-16
GuatemalaEl SalvadorNicaraguaCosta RicaHonduras
8
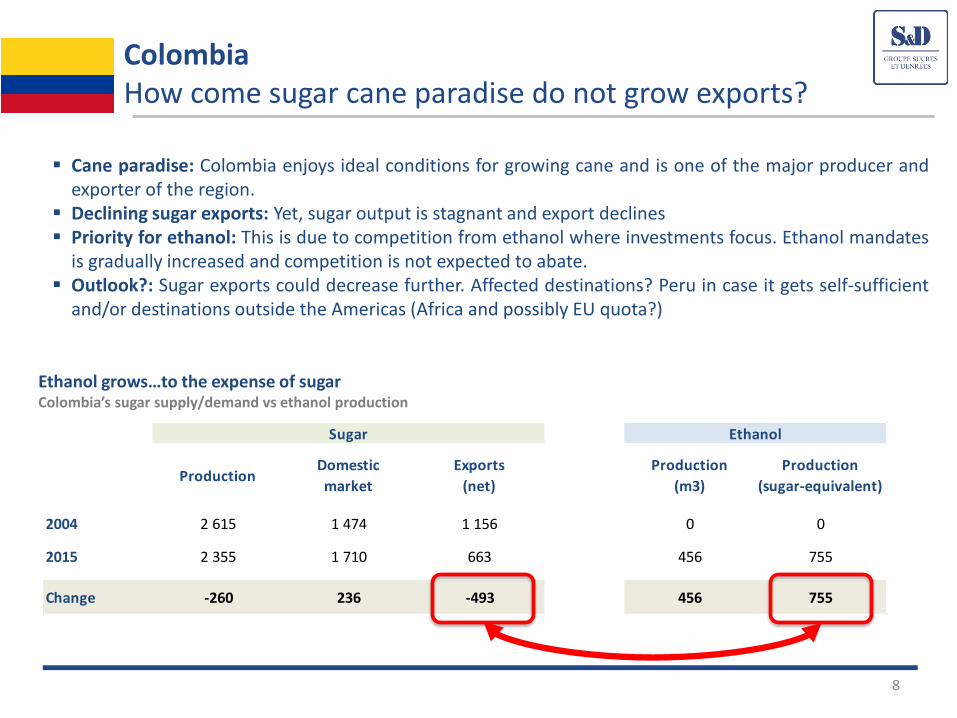
Ethanol grows…to the expense of sugar Colombia’s sugar supply/demand vs ethanol production
Colombia How come sugar cane paradise do not grow exports?
Cane paradise: Colombia enjoys ideal conditions for growing cane and is one of the major producer and exporter of the region.
Declining sugar exports: Yet, sugar output is stagnant and export declines Priority for ethanol: This is due to competition from ethanol where investments focus. Ethanol mandates
is gradually increased and competition is not expected to abate. Outlook?: Sugar exports could decrease further. Affected destinations? Peru in case it gets self-sufficient
and/or destinations outside the Americas (Africa and possibly EU quota?)
ProductionDomestic
market
Exports
(net)
Production
(m3)
Production
(sugar-equivalent)
2004 2 615 1 474 1 156 0 0
2015 2 355 1 710 663 456 755
Change -260 236 -493 456 755
Sugar Ethanol
9
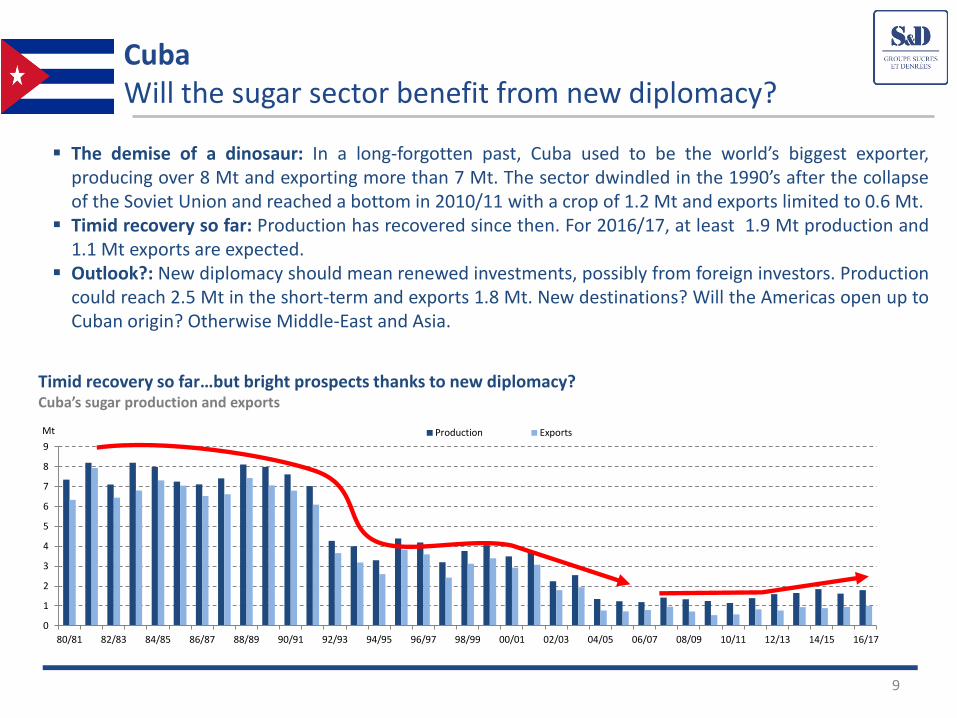
Timid recovery so far…but bright prospects thanks to new diplomacy? Cuba’s sugar production and exports
Cuba Will the sugar sector benefit from new diplomacy?
The demise of a dinosaur: In a long-forgotten past, Cuba used to be the world’s biggest exporter, producing over 8 Mt and exporting more than 7 Mt. The sector dwindled in the 1990’s after the collapse of the Soviet Union and reached a bottom in 2010/11 with a crop of 1.2 Mt and exports limited to 0.6 Mt.
Timid recovery so far: Production has recovered since then. For 2016/17, at least 1.9 Mt production and 1.1 Mt exports are expected.
Outlook?: New diplomacy should mean renewed investments, possibly from foreign investors. Production could reach 2.5 Mt in the short-term and exports 1.8 Mt. New destinations? Will the Americas open up to Cuban origin? Otherwise Middle-East and Asia.
0
1
2
3
4
5
6
7
8
9
80/81 82/83 84/85 86/87 88/89 90/91 92/93 94/95 96/97 98/99 00/01 02/03 04/05 06/07 08/09 10/11 12/13 14/15 16/17
Mt Production Exports
10
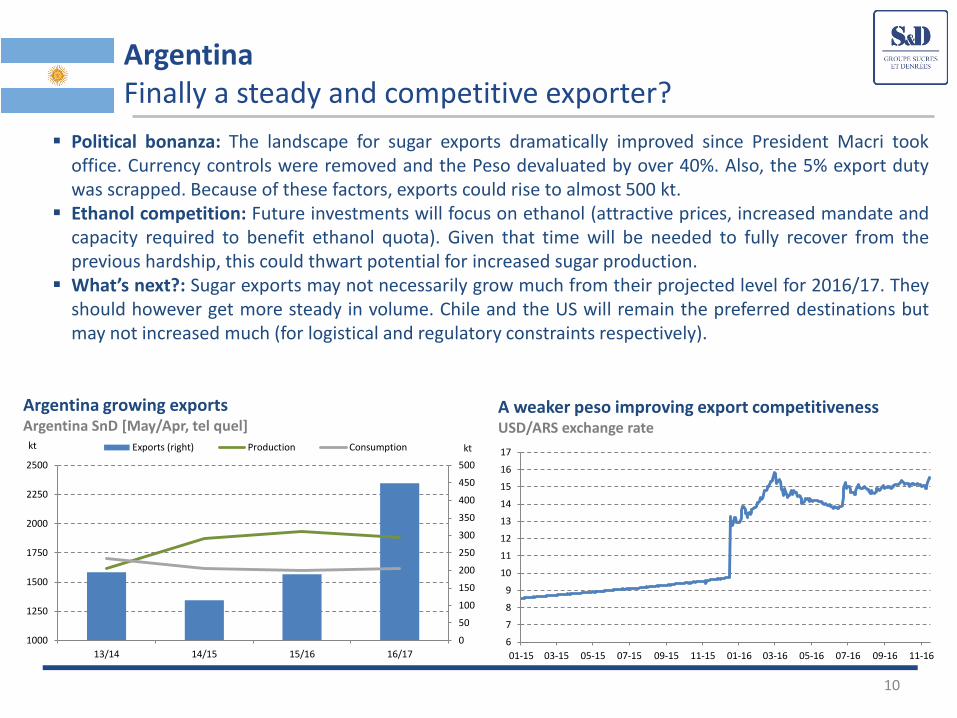
Argentina growing exports Argentina SnD [May/Apr, tel quel]
Argentina Finally a steady and competitive exporter?
Political bonanza: The landscape for sugar exports dramatically improved since President Macri took office. Currency controls were removed and the Peso devaluated by over 40%. Also, the 5% export duty was scrapped. Because of these factors, exports could rise to almost 500 kt.
Ethanol competition: Future investments will focus on ethanol (attractive prices, increased mandate and capacity required to benefit ethanol quota). Given that time will be needed to fully recover from the previous hardship, this could thwart potential for increased sugar production.
What’s next?: Sugar exports may not necessarily grow much from their projected level for 2016/17. They should however get more steady in volume. Chile and the US will remain the preferred destinations but may not increased much (for logistical and regulatory constraints respectively).
A weaker peso improving export competitiveness USD/ARS exchange rate
0
50
100
150
200
250
300
350
400
450
500
1000
1250
1500
1750
2000
2250
2500
13/14 14/15 15/16 16/17
ktkt Exports (right) Production Consumption
6
7
8
9
10
11
12
13
14
15
16
17
01-15 03-15 05-15 07-15 09-15 11-15 01-16 03-16 05-16 07-16 09-16 11-16
11
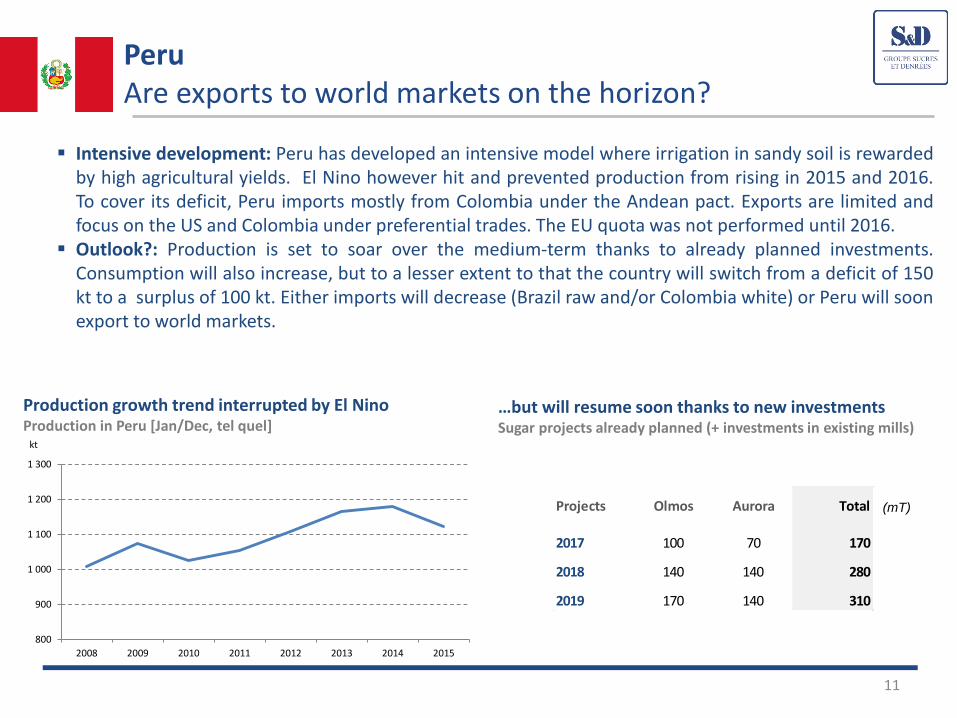
Production growth trend interrupted by El Nino Production in Peru [Jan/Dec, tel quel]
Peru Are exports to world markets on the horizon?
Intensive development: Peru has developed an intensive model where irrigation in sandy soil is rewarded by high agricultural yields. El Nino however hit and prevented production from rising in 2015 and 2016. To cover its deficit, Peru imports mostly from Colombia under the Andean pact. Exports are limited and focus on the US and Colombia under preferential trades. The EU quota was not performed until 2016.
Outlook?: Production is set to soar over the medium-term thanks to already planned investments. Consumption will also increase, but to a lesser extent to that the country will switch from a deficit of 150 kt to a surplus of 100 kt. Either imports will decrease (Brazil raw and/or Colombia white) or Peru will soon export to world markets.
…but will resume soon thanks to new investments Sugar projects already planned (+ investments in existing mills)
800
900
1 000
1 100
1 200
1 300
2008 2009 2010 2011 2012 2013 2014 2015
kt
Mill
iers
Projects Olmos Aurora Total
2017 100 70 170
2018 140 140 280
2019 170 140 310
(mT)
12
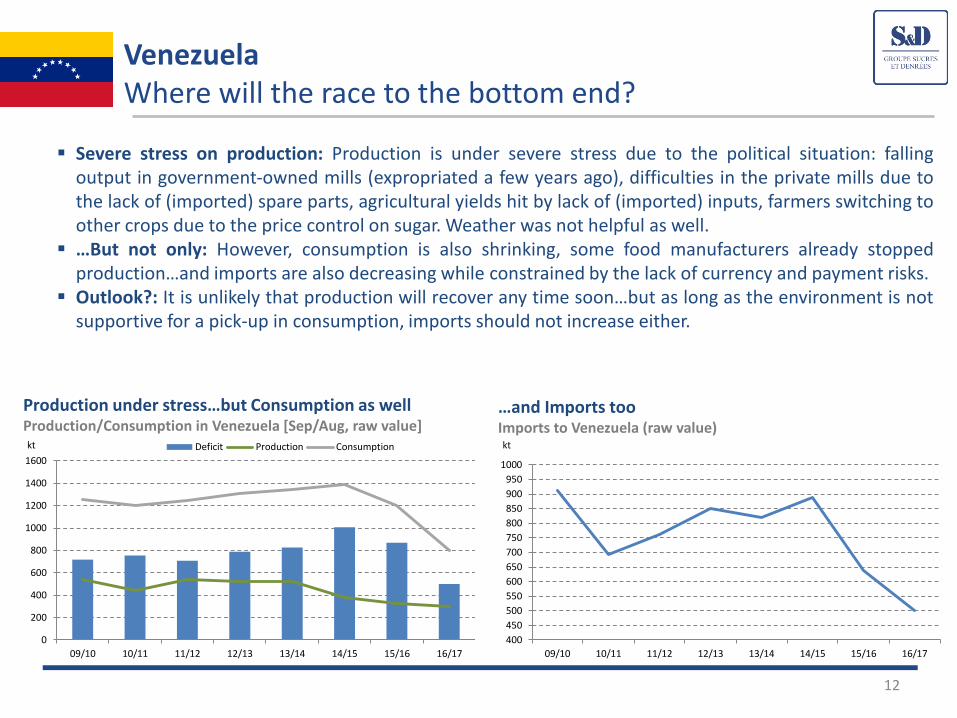
Production under stress…but Consumption as well Production/Consumption in Venezuela [Sep/Aug, raw value]
Venezuela Where will the race to the bottom end?
Severe stress on production: Production is under severe stress due to the political situation: falling output in government-owned mills (expropriated a few years ago), difficulties in the private mills due to the lack of (imported) spare parts, agricultural yields hit by lack of (imported) inputs, farmers switching to other crops due to the price control on sugar. Weather was not helpful as well.
…But not only: However, consumption is also shrinking, some food manufacturers already stopped production…and imports are also decreasing while constrained by the lack of currency and payment risks.
Outlook?: It is unlikely that production will recover any time soon…but as long as the environment is not supportive for a pick-up in consumption, imports should not increase either.
…and Imports too Imports to Venezuela (raw value)
0
200
400
600
800
1000
1200
1400
1600
09/10 10/11 11/12 12/13 13/14 14/15 15/16 16/17
kt Deficit Production Consumption
400
450
500
550
600
650
700
750
800
850
900
950
1000
09/10 10/11 11/12 12/13 13/14 14/15 15/16 16/17
kt
13
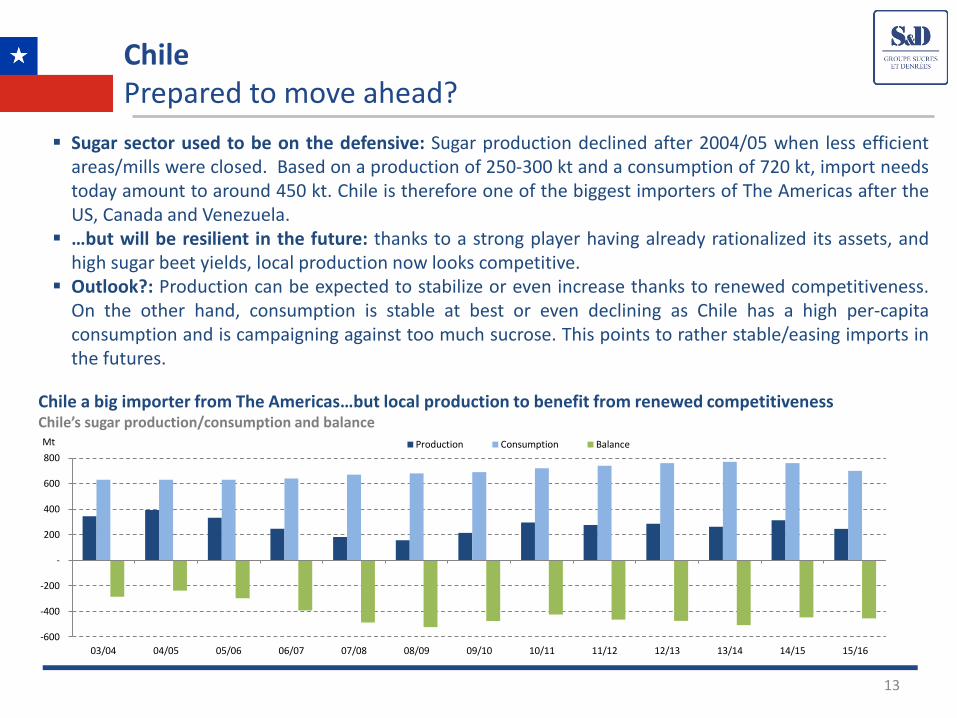
Chile a big importer from The Americas…but local production to benefit from renewed competitiveness Chile’s sugar production/consumption and balance
Chile Prepared to move ahead?
Sugar sector used to be on the defensive: Sugar production declined after 2004/05 when less efficient areas/mills were closed. Based on a production of 250-300 kt and a consumption of 720 kt, import needs today amount to around 450 kt. Chile is therefore one of the biggest importers of The Americas after the US, Canada and Venezuela.
…but will be resilient in the future: thanks to a strong player having already rationalized its assets, and high sugar beet yields, local production now looks competitive.
Outlook?: Production can be expected to stabilize or even increase thanks to renewed competitiveness. On the other hand, consumption is stable at best or even declining as Chile has a high per-capita consumption and is campaigning against too much sucrose. This points to rather stable/easing imports in the futures.
-600
-400
-200
-
200
400
600
800
03/04 04/05 05/06 06/07 07/08 08/09 09/10 10/11 11/12 12/13 13/14 14/15 15/16
Mt Production Consumption Balance
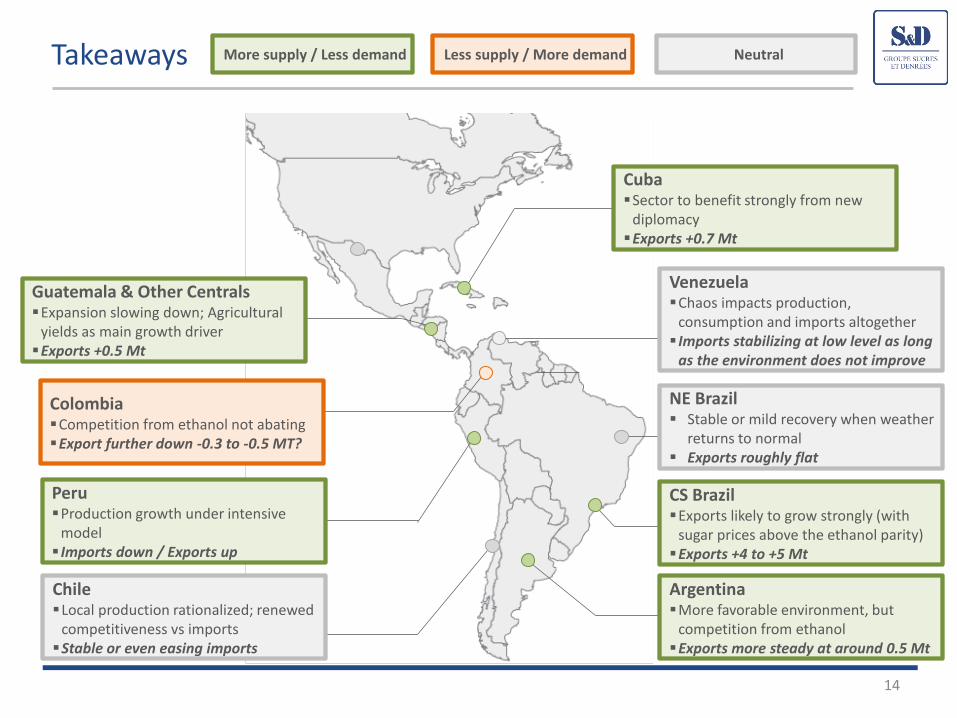
Takeaways
14
CS Brazil Exports likely to grow strongly (with
sugar prices above the ethanol parity) Exports +4 to +5 Mt
Chile Local production rationalized; renewed
competitiveness vs imports Stable or even easing imports
Venezuela Chaos impacts production,
consumption and imports altogether Imports stabilizing at low level as long
as the environment does not improve
Peru Production growth under intensive
model Imports down / Exports up
Argentina More favorable environment, but
competition from ethanol Exports more steady at around 0.5 Mt
Cuba Sector to benefit strongly from new
diplomacy Exports +0.7 Mt
Colombia Competition from ethanol not abating Export further down -0.3 to -0.5 MT?
Guatemala & Other Centrals Expansion slowing down; Agricultural
yields as main growth driver Exports +0.5 Mt
NE Brazil Stable or mild recovery when weather
returns to normal Exports roughly flat
More supply / Less demand Less supply / More demand Neutral
15
Role of Latin America in the world sugar balance
16
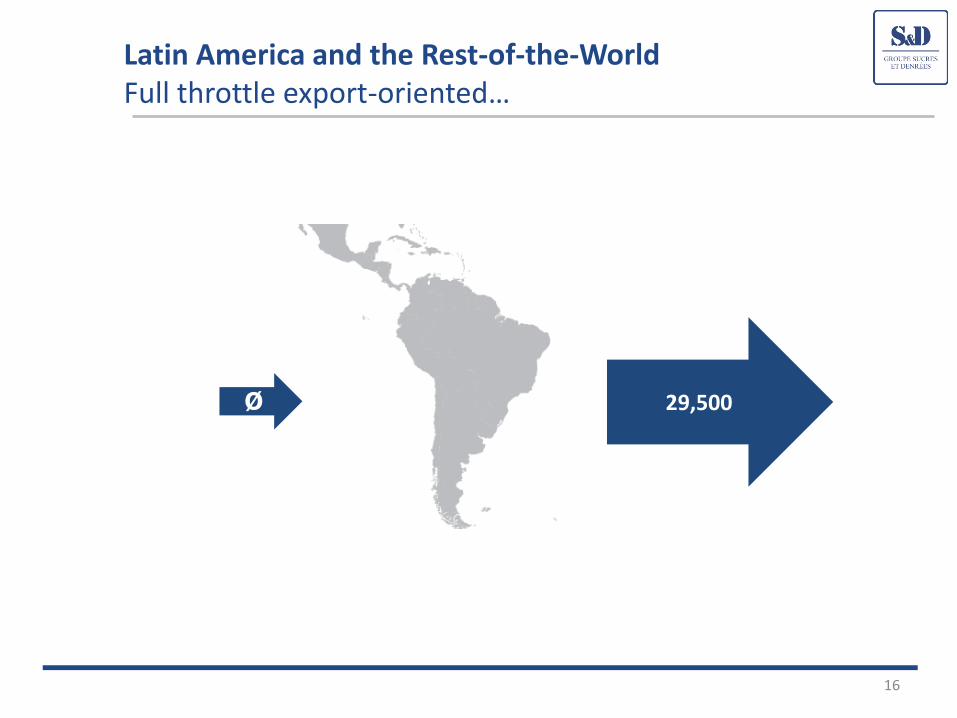
Latin America and the Rest-of-the-World Full throttle export-oriented…
29,500 Ø
17
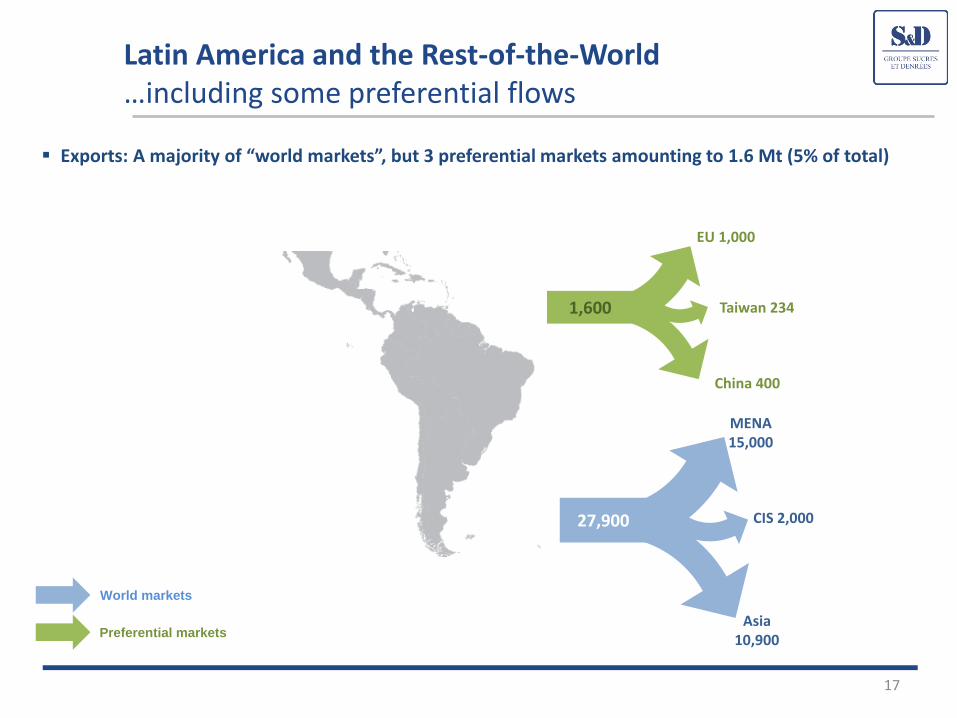
Latin America and the Rest-of-the-World …including some preferential flows
Exports: A majority of “world markets”, but 3 preferential markets amounting to 1.6 Mt (5% of total)
MENA 15,000
Asia 10,900
CIS 2,000 27,900
Taiwan 234
EU 1,000
China 400
1,600
Preferential markets
World markets
18
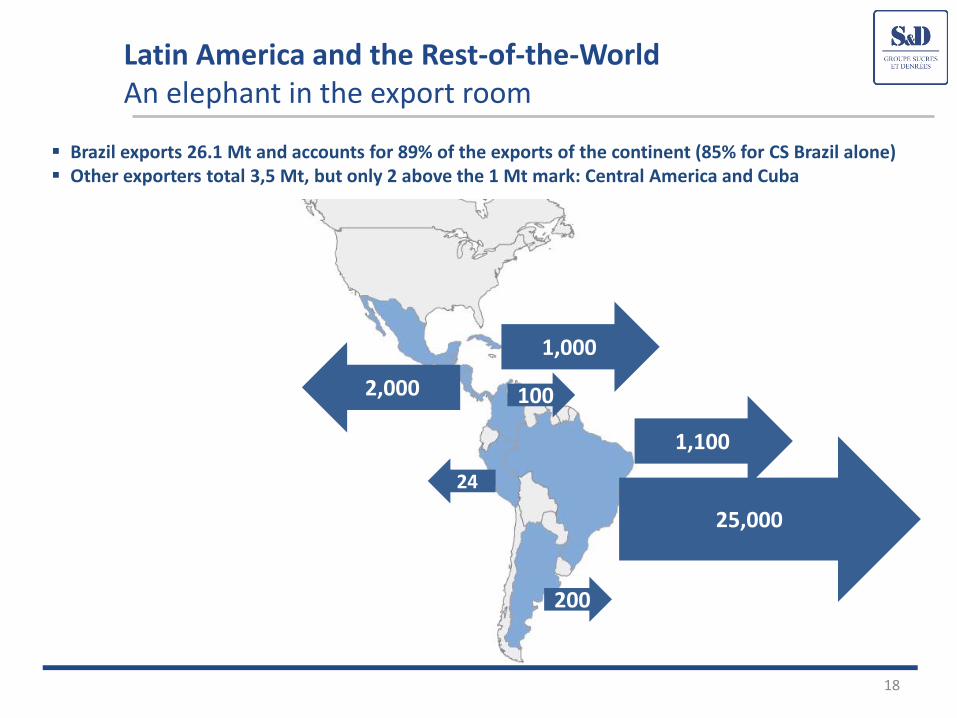
Latin America and the Rest-of-the-World An elephant in the export room
Brazil exports 26.1 Mt and accounts for 89% of the exports of the continent (85% for CS Brazil alone) Other exporters total 3,5 Mt, but only 2 above the 1 Mt mark: Central America and Cuba
25,000
1,100
200
24
100
1,000
2,000
19
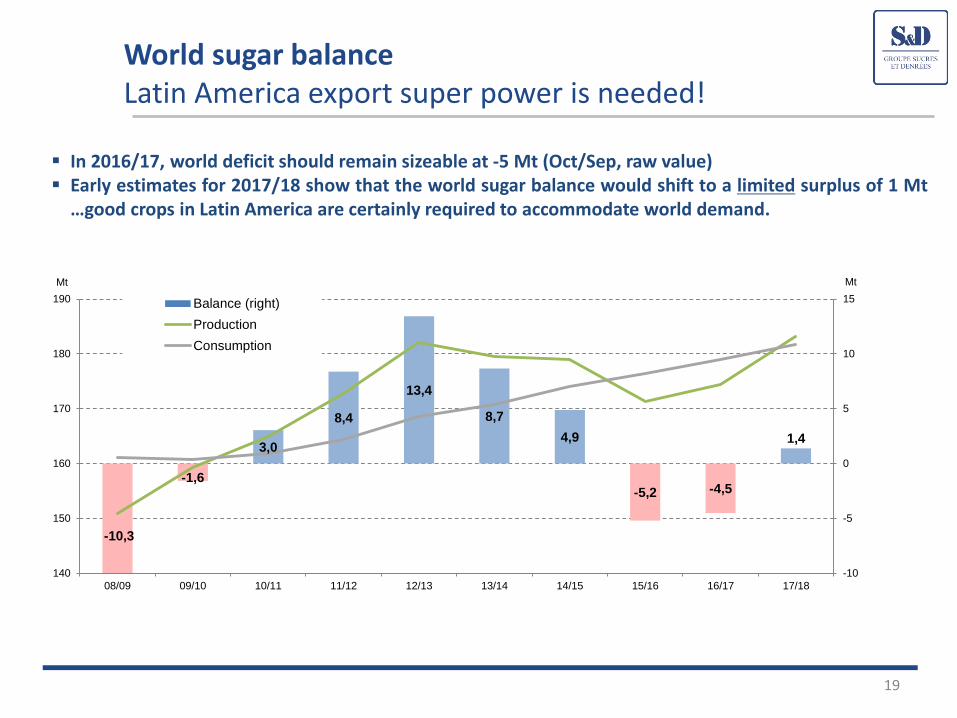
World sugar balance Latin America export super power is needed!
In 2016/17, world deficit should remain sizeable at -5 Mt (Oct/Sep, raw value) Early estimates for 2017/18 show that the world sugar balance would shift to a limited surplus of 1 Mt
…good crops in Latin America are certainly required to accommodate world demand.
-10,3
-1,6
3,0
8,4
13,4
8,7
4,9
-5,2 -4,5
1,4
-10
-5
0
5
10
15
140
150
160
170
180
190
08/09 09/10 10/11 11/12 12/13 13/14 14/15 15/16 16/17 17/18
MtMt
Balance (right)
Production
Consumption
THANK YOU!
20


![SUCDEN SUGAR MARKET REPORT€¦ · CS Brazilian production [Apr/March, Left: Mt sugar & Mm3 ethanol - Right: Mt cane] CS: CANE AND SUGAR MIX QUITE STABLE CS Brazilian cumulative rains](https://img.pdfslide.net/doc/110x75/5f31ee5d18ddf7479c1ba381/sucden-sugar-market-report-cs-brazilian-production-aprmarch-left-mt-sugar-.jpg)