Embed Size (px)
Citation preview

Suitability Assessment of Mesozoic LimestoneAggregates as Pavement Material in Harar-DireDawa Area, Eastern EthiopiaLeta Gudissa ( [email protected] )
Addis Ababa Science and Technology University https://orcid.org/0000-0003-2549-7503Tarun Kumar Raghuvanshi
Addis Ababa UniversityMatebie Meten
Addis Ababa Science and Technology UniversityYadeta Chemdesa Chemeda
Adama Science and Technology UniversityRonald Schmerold
Addis Ababa Science and Technology University
Research Article
Keywords: Suitability, Limestone, Pavement, Aggregate Crushing Value, Aggregate Impact Value
Posted Date: March 11th, 2021
DOI: https://doi.org/10.21203/rs.3.rs-262072/v1
License: This work is licensed under a Creative Commons Attribution 4.0 International License. Read Full License
1
Suitability Assessment of Mesozoic Limestone Aggregates as Pavement Material in Harar-
Dire Dawa Area, Eastern Ethiopia
Leta Gudissa*a, b, Tarun K. Raghuvanshic, Matebie Metena, Yadeta C. Chemedad, and Ronald Schmerolda
aAddis Ababa Science and Technology University, Department of Geology, College of Applied Sciences, P.O.Box
16417, Addis Ababa, Ethiopia
b Adama Science and Technology University, Department of Civil Engineering, School of Civil Engineering and
Architecture, P.O.Box 1888, Adama, Ethiopia
cAddis Ababa University, School of Earth-Sciences, P.O.Box 1176, Addis Ababa, Ethiopia,
dAdama Science and Technology University, Department of Applied Geology, School of Natural Sciences, P.O.Box
1888, Adama, Ethiopia
Leta Gudissa*: E-mail: [email protected], Lecturer
Phone: +251-911-179322, https://orcid.org/0000-0003-2549-7503
Tarun K. Raghuvanshi E-mail: [email protected], Associate Professor
Phone: +251-911-875983
Matebie Meten E-mail: [email protected], Assistant Professor
Phone: +251-911-899279
Yadeta C. Chemeda E-mail: [email protected], Assistant Professor
Phone: +251-947-372481
Ronald Schmerold E-mail: [email protected], Assistant Professor
Phone: +251-922-997986
Acknowledgments
The authors are thankful for everyone's supports provided by AASTU and ASTU. We would like to acknowledge
Mr. Belachew Moges from AASTU, Ing. Moika Dinsa, Mr. Abity Takle, Mr. Bahiru Asfaw, Mr. Abiot Tesfaye, Mr.
Mesele Yosef, and Mr. Debele Bari from ASTU for the technical support and assistance during the laboratory work.
*Corresponding author: Leta Gudissa, Addis Ababa Science and Technology University, Department of
Geology, College of Applied Sciences, P.O.Box. 16417, Addis Ababa, Ethiopia, E-mail: [email protected],
Phone: +251-911-179322.
Running Title: Characterization of Limestone for possible use as Pavement material
2
Abstract
The quality of aggregates affects the durability and performance of pavement as it is the dominant component both
in rigid and flexible pavement. Hence, aggregate quality assessment is important to ensure the good performance of
aggregate in different sections of pavements. The present work aims to assess the suitability of limestone for road
aggregate. Thirty-seven Mesozoic limestone samples obtained from previously identified suitable quarry sites were
subjected to petrographic and geotechnical analyses. Physical properties (ultrasonic pulse velocity (PVU), water
absorption (Wa), Na2SO4 soundness, and specific gravity tests) and mechanical properties (unconfined compressive
strength (UCS), Aggregate crushing value (ACV), Aggregate Impact Value (AIV), and Los Angles Abrasion value
(LAAV)) were determined in the lab and then compared with the globally accepted standards. The petrographic
observations revealed that the Mesozoic limestones of the area are dominantly composed of micrite, sparite, and
bioclasts with subordinate intraclasts, ooids, Fe-oxides, and dolomites. Results of the physical properties show the
rock has a mean PVU of 4859 m/s, a bulk dry specific gravity (Gsb) of 2.64, and very low water absorption capacity
ranging from 0.2-5.7%, and Na2SO4 soundness ranging from 1-14%. UCS, AIV, ACV, and LAAV range from 20.5-
180.5Mpa, 8-20%, 24-34%, and 18.9-31.1%, respectively. The physical, chemical and mechanical properties of the
entire limestones sample comply with the required standards, suggesting their suitability as aggregate materials in
road construction.
To study the interrelationships between the physical, properties of the limestone aggregate, regression analysis was
applied showing a significant interrelationship between these properties.
Keywords
Suitability, Limestone, Pavement, Aggregate Crushing Value, Aggregate Impact Value
1. Introduction
In road construction, more than 90% of asphalt pavements and 80% of rigid pavements consist of aggregates
(Ndukauba and Akaha, 2012). Thus, understandably the properties and quality of aggregates to great extent affect
the load transferability, durability, and performance of the pavement. In other words, it is essential to obtain the right
type and best quality aggregates. Aggregate quality assessment is important to ensure the good performance of
aggregate in different sections of pavement. Aggregates used as road stones must possess high resistance to crushing
and heavy traffic wheel load has to be tough enough to resist high impacts caused by the jumping of the steel wheels
and severe abrasion resistance. It also has to be sound enough to resist weathering and it should be, impermeable,
chemically inert, and possess a low coefficient of expansion (Ndukauba and Akaha, 2012).
In Ethiopia, limestone rock accounts for 10% of the total volume of all sedimentary rocks (Wondafrash et al. 2009).
Particularly, in the study area, there is a huge reserve of limestone rock as thick as about 750 meters and consists of
predominantly fossiliferous yellow limestone (Bosellini et al. 2001; Wondafrash et al. 2009). These limestone
reserves can be potential sources of natural construction material including for aggregate of road. In Ethiopia, the
Antalo limestones are mainly utilized for cement and dimension stone.
The suitability of limestones for aggregate depends on several geological factors such as the type of minerals
present, strength, porosity, and durability (Adeyi et al. 2019). Other factors such as proportions of mineral grains;
the type of contacts between the mineral grains; the layering of minerals; and the presence and interconnection of
voids have also a role. The properties of crushed rock depend on the origin and mineralogy of the source rock and its
3
subsequent alteration and weathering. In general, older and more hardened limestone exhibits higher strengths and is
suitable for road surfacing applications, as well as for use in the lower parts of the road pavement (Adeyi et al.
2019). Moreover, aggregates in pavement works should be strong, hard and tough, durable, not be flaky, and
elongate (Ashebir et al. 2019).
The aggregates must be thoroughly tested before they are used for construction in order to produce well-performing
pavement and ensure pavement longevity. The principal laboratory aggregate tests include aggregate crushing tests,
aggregate impact tests, aggregate abrasion resistance test, aggregate water absorption, specific gravity, and density
test, compressive strength, and mineralogical characteristics of rock (Jethro et al. 2014). Recently, Gudissa et al.
(2021) have adopted a stage-wise quarry site selection approach based on readily available office data (remote
sensing and previous work data (stage 1)) and field data (stage 2) to select suitable quarry site in the study area.
However, quality assessment for specific use (such as for pavement, etc.) of the rock needs to be considered for the
final suitable quarry site selection. To the authors’ knowledge, no research was done on the physical and
petrographic properties of the Mesozoic limestone for its use in road construction. Therefore, this work emphasizes
the detailed investigation and geomechanical characterization of limestones and assesses their suitability for
pavement works. Particularly, since the physical properties of aggregates have a greater influence on the supporting
structure of pavement layers, due to poor behavior of aggregate materials; its suitability for road base construction
will be affected. Hence, the proper physical properties of aggregates shall be carefully and properly determined to
check their suitability for road construction.
2. Materials and Methods
2.1 Location and Geology of the study area
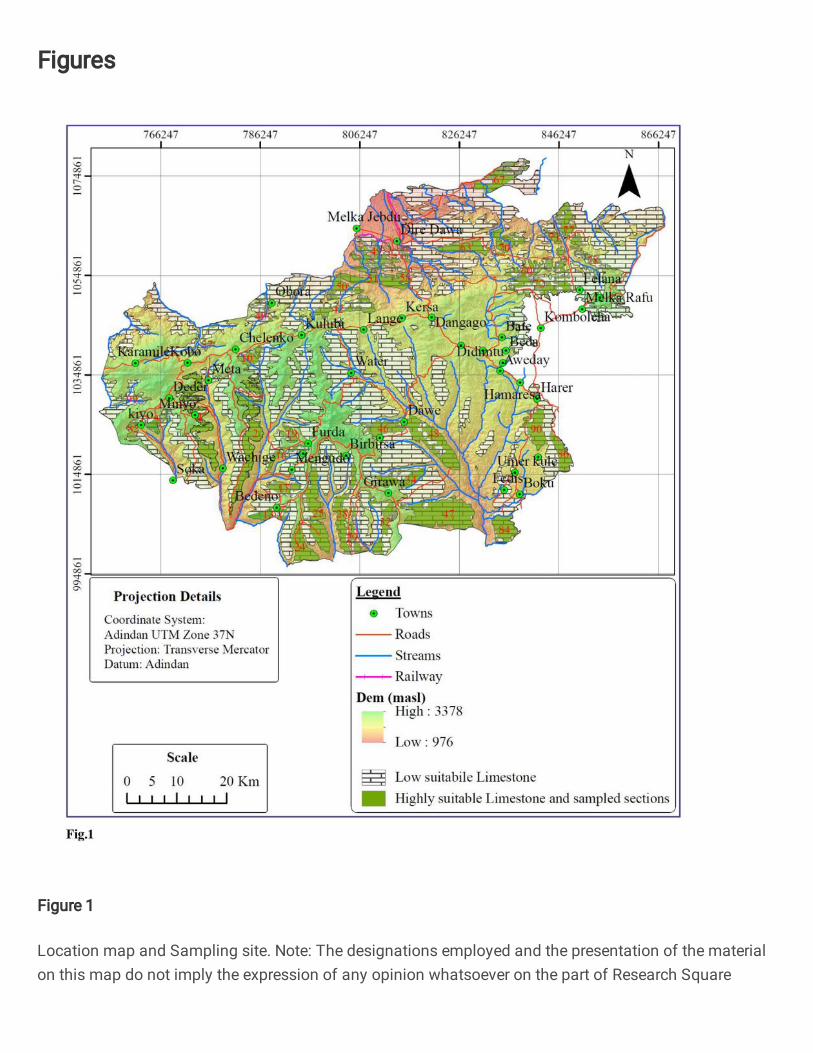
The study area is located in Eastern Ethiopia about 520Km far away from the capital city, Addis Ababa (Fig.1). It is
accessed either by road, by air, or by train through Addis Ababa - Djibouti railway. The topography of the area is
hilly and rugged with 3378 and 976 masl max and min elevations, respectively (Gudissa et al. 2021).
The regional geology of the study area consists of rock units starting from Precambrian basements up to recent
sediments (Fig.2). The basements include high-grade gneisses, migmatites, fine to medium-grained amphibolite, and
low-grade quartz-mica schist. Massive granite is exposed to the underlying lower sandstone. Phyllite, greenstone,
chert, serpentinites, and talc schist are exposed within the study area.
The Mesozoic succession consists of the lower sandstone, carbonate, and upper sandstone. The local geology of the
area is dominantly covered by the Antalo limestone (Bosellini et al. 2001; Gudissa et al. 2021). The geologic
structures within the limestone unit include joints, bedding, and solution cavities. The limestone beds have a
horizontal orientation (dips <100). The major joints run in the N-S direction along with the Ethiopian rift system
while minor joint sets are perpendicular to the main joints (Gudissa et al. 2021).

4
Fig.1

5
Fig.2

6
2.2 Rock sample collection and preparation
Thirty-seven limestone samples were collected from previously identified highly and moderately suitable limestone
quarry sites by Gudissa et al. (2021). For the rock mechanical properties characterization, cubic samples were cut
from each sample with dimensions of 70±5mm using a Red Band masonry saw. Red Band has an enclosed diamond
blade, tilting table, and in-built pump for wet cutting. For the crushed rock aggregate test, the rock samples were
crushed manually to the required sizes. Rock thin sections were prepared at a petrographic laboratory in the
Geological Survey of Ethiopia.
2.3 Laboratory test
All engineering properties tests were carried out at Adama Science and Technology University in the construction
material laboratory with different aggregate testing apparatuses (AIV, sieves, flakiness, and elongation, LAA, water
immersion bath, and compressive strength measuring apparatus). A hydrometer was also used for specific gravity
measurements of the Na2SO4 solution during the preparation of the solution for the weathering test. Additionally,
petrographic descriptions of the thin section were done at Addis Ababa Science and Technology University with a
petrographic plane polarizing microscope. Photographs of thin sections were also captured by a camera mounted on
a petrographic microscope. The chemical composition test was conducted using X-Ray Fluorescence (XRF) device
at Dire Dawa National Cement Factory.
2.3.1 Physical properties
Ultrasonic Pulse Velocity (PVU)
The PVU measurements of compressional waves were carried out in line with ASTM D2845, (2000) employing a
high-energy pulser on the driving side and a 2-channel digital storage oscilloscope on the receiving side for
recording time traveled. The PVU was determined by using the time-of-flight measurement technique at 82 kHz
frequency as the sample size allows good contact with this transducer. Energy transmission between the specimen
and every transducer is also improved by employing a thin layer of a coupling medium like high vacuum grease, and
by pressing the transducer against the specimen with a small seating force. The PVU was measured on three pairs of
faces and three measurements were recorded for one pair of the face.
Water Absorption (Wa)
The Wa of the limestone cube was determined according to ISRM suggested methods. Oven-dried samples were
immersed in water for twenty-four hours for saturation of the samples. The Wa of the sample is then calculated as
the ratio of water absorbed (i.e. weight of saturated sample minus the weight of the oven-dry sample) to the weight
of the oven-dry sample. For each sample, three measurements were done and the average was considered.
Dry Density (dd)
The dd (Kg/m3) of a cubic sample was determined following the ISRM method. It is obtained from the ratio of oven-
dried mass to the bulk volume. The samples were dried in an oven at 105°C for twenty-four hours for determining
the dry mass. The bulk volumes were calculated from dimension measurements using the caliper technique. By
using a vernier caliper, the dimensions of cubic samples were measured thrice at different locations for accurate
computation of bulk volume. For each sample, three measurements were done and the average was taken.
Bulk Specific Gravity (Gsb)
The Gsb was resolute using the buoyancy method following ISRM suggested standards. The bulk volume of the
samples was determined using the Archimedes principle, from the saturated-submerged sample. The volume of the
7
displaced fluid was determined volumetrically. The Gsb is then obtained from the ratio of the mass of the oven-dried
sample to the mass of an equal volume of displaced water (Ashebir et al. 2019).
Effective Porosity (PE)
The PE is the percentage of interconnected void space. It is obtained from the ratio of the volume of voids (Vv) to
bulk volume (Vbulk) of the rock sample. The volume of the void was obtained from the volume of water filling the
void (i.e. the mass of water in a saturated sample divided by the density of water).
Soundness
The soundness test was performed using anhydrous Na2SO4 chemical following ASTM C88-99a (1999) procedure.
The test was performed by repeatedly immersing the sample in saturated solutions of Na2SO4 solution followed by
oven drying to partially or completely dehydrate the salt precipitated in permeable pore spaces. The tests were done
on fine fractions. Two determinations were performed for every sample and the averages were considered.
Aggregate Particle Shape
Aggregate particle shape including flakiness and elongations were performed for all the thirty-seven aggregate
samples. Two determinations were conducted for both flakiness and elongation tests. The Flakiness (IF) and
Elongation (IE) were determined using the procedures given by BS812-105.1 (1989) and BS 812-105.2 (1990),
respectively.
2.3.2 Mechanical properties
Unconfined Compressive Strength (UCS)
The UCS test was performed on cubic samples as per ASTM C170 (1999) and British Standard BS-EN-1926
(2006). The UCS test is a mechanical test measuring the amount of compressive load a material can bear before
fracturing. For each sample, four tests were conducted and the average was recorded.
Aggregate Impact Value (AIV)
For the AIV test, BS812-112 (1990) method was used the determination of the AIV values. An aggregate sample of
about 700 g was taken and compacted in a standardized open steel cup. The specimen was then subjected to several
standard impacts from dropping weight. An aggregate sample of 14 mm to 10 mm in size is subjected to a
discontinuous loading of 15 blows with a hammer. This action breaks the aggregate to a degree that relies on the
impact resistance of the material. This degree was assessed by sieving the impacted specimen on a 2.36 mm sieve
and was taken as the AIV. The % of material passing relative to the initial weight gives the aggregate impact value.
Three repeated tests were conducted for statistical precision and therefore the average of two closely related values
was considered as the final AIV. If the difference between the two AIV is more than 0.15 times the mean of AIV; it
is needed to conduct further additional tests to compute the median of four tests.
Aggregate Crushing Value (ACV)
Determination of ACV gives a relative measure of the resistance of an aggregate to crushing under a gradually
applied compressive load. The ACV was performed following BS 812-110 (1990) methods. This method applies to
aggregates passing a 14.0 mm sieve and retained on a 10.0 mm test sieve. An aggregate sample of not more than 1.7
Kg was taken and compacted in a standardized steel cylinder fitted with a freely moving plunger. The specimen was
then subjected to a nonstop load at a homogenous rate up to 400KN which is transmitted through the plunger. This
action breaks the aggregate to a degree that depends on the crushing resistance of the material. The entire crushed
sample on the tray was sieved on a 2.36 mm sieve until no further significant amount passes. The fraction passing

8
was weighed and recorded. Two additional repetitions of the tests would be conducted for statistical precision and if
the mean is less than 1.8 times the difference of the two values, the average of two closely related values was
considered as the final ACV. However if 1.8 times the difference between the two values is larger than the average
value, yet one more additional test is conducted and the median was considered as ACV.
Los Angles Abrasion Value (LAAV)
The LAAV is one of the most common test methods used to calculate aggregate toughness and abrasion
characteristics and determination of aggregates resistance to a combination of actions including abrasion or attrition,
impact, and grinding in dry conditions (Kolawole et al. 2019; Depountis et al. 2020). The LAAV was conducted
according to the test procedures listed in ASTM C131-96, (1996). In the LAAV test, coarse aggregates of grade C
(2.5Kg sample passing 9.5mm and retained on 6.3mm and 2.5Kg sample passing 6.3mm and retained on 4.75mm)
were placed in a cylindrical drum, mounted horizontally. A charge of eight steel balls is added and therefore the
drum is rotated 500 numbers of revolutions. After 500 revolutions, the contents were removed from the drum and
the aggregate portion is sieved on 1.7mm sieve to measure the degradation as percent loss.
2.3.3 Chemical Composition
The process of XRF analysis involves preliminary size reduction by grinding a sample into a fine powder, ideally to
a grain size of <75μm, mixing it with a binding aid, and then pressing the mixture in a die to produce a
homogeneous sample pellet. Thus, the sample material was analyzed as a pressed powder fused into a glass disk
using a suitable flux, such as lithium tetraborate (Jamaluddin et al. 2018). Generally, the XRF test was conducted as
per a test method of ES 1172:2 equivalent to EN 196:2. The analysis is rapid and non-destructive (Jamaluddin et al.,
2018) which is widely used for chemical analysis, particularly in the investigation of geologic construction
materials. The major oxides test was carried out on as little as 0.5 g of material. The elements within the sample can
therefore be identified by their spectral wavelengths for chemical analysis and therefore the intensity of the emitted
spectral lines enables for the quantitative chemical analysis.
2.3.4 Petrographic Examination
For mineralogical characteristics, the modal analysis of thin sections was used. It’s the method of determining the
petrography of rocks by counting the various minerals thereby determining the mineralogical composition and
therefore the percentage of crystal formation of varied minerals present in the samples of each rock type (Jethro et
al. 2014). According to Jethro et al. (2014), the “Percentage Mineral Composition” can be calculated using (eq.1).
100x
tmT
mT
mC T.................... (eq.1)
Where, Cm = Percentage mineral composition (%); Tm = Total number of count for a mineral, and Ttm =
Total number of count for the entire mineral.
The relative abundance of the sparite and micrite cement, fossils, and diagenetic features were determined which
was used for the naming of the rock. The classification scheme of Dunham (1962) and Folk (1962) were applied for
the carbonate rock naming. Textures, fabrics, crystal boundary shapes and grain size features were observed,
providing descriptive parameters for the characterization of the kinds of carbonate (Dunham, 1962; Wright, 1992;
Brilli et al., 2018).
2.4 Materials

9
The previous preliminary suitability map (Gudissa et al. 2021) prepared for quarry sites in the area was used as a
base map in the present investigation for rock sample collection. The highly and moderately suitable limestone
sections were selected, from the previous suitability map by disregarding the unsuitable and low suitable limestone
locations (Gudissa et al. 2021).
All engineering property tests were carried out at Adama Science and Technology University using aggregate testing
apparatuses like AIV apparatus, sieves, Flakiness Index (IF), and elongation Index (IE) apparatus, LAAV apparatus,
water immersion bath, and compressive machines which were used for the characterization purposes. A hydrometer
was also used for specific gravity measurements of the Na2So4 solution during the preparation of the solution for the
weathering test. Additionally, thin section studies were done at Addis Ababa Science and Technology University
with a petrographic plane polarizing microscope. Photographs of thin sections were also captured by a camera
mounted on a petrographic microscope.
3. Results and Discussions
Properties such as ultrasonic pulse velocity, dry density, Bulk specific gravity, effective porosity, water absorption,
and volume of voids as well as mechanical properties like compressive strength and other aggregate tests of
limestone were used for the geotechnical characterization of these rocks (Alqahtani et al. 2013).
3.1 Ultrasonic pulse velocity (PVU)
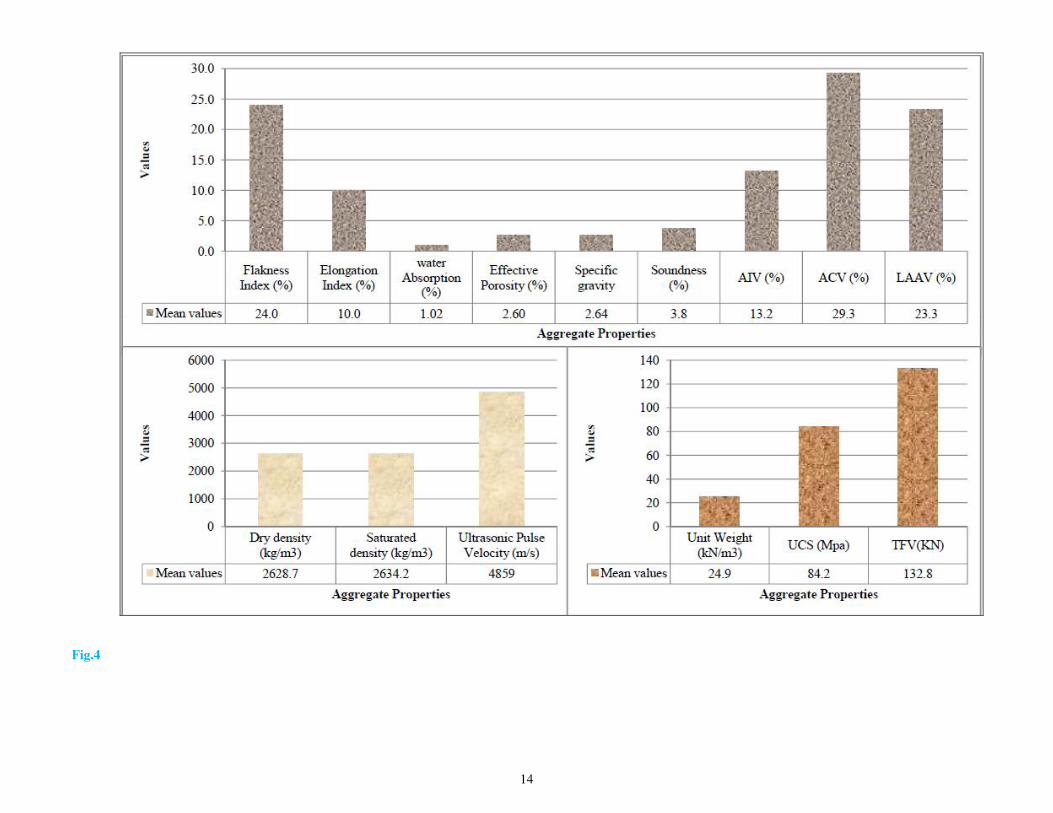
The results of PVU for the limestone samples from the study area range from 2940 m/s to 5370 m/s while the highest
values were recorded for sample #37 and the lowest values were obtained from sample # 86 but the average value
was found to be 4859 m/s (Table 1 and Fig.4). These values were in good agreement with the compressive strength,
degree of weathering, and rifting of samples.
Table 1
3.2 Water Absorption (Wa)
The samples have Wa values ranging from 0.2- 5.7 % with an average value of 1.02% (Table 1and Fig.4). However,
the minimum value of the Wa was determined for the dolomitized biointramicritic limestone (Sample #4 and 49)
which is dense and fine-grained while the maximum Wa was recorded from biointramicritic limestone (#86).
Wa is a measure of the amount of water that an aggregate can absorb into its pore structure (Ashebir et al. 2019) and
it is an important wonderful indicator of the strength of the aggregate and the volume of asphalt binder it is likely to
absorb. Strong aggregates will have an awfully low absorption below 1%. An aggregate with high Wa is non-durable
and isn’t likely to be a suitable road-building material. Generally, less absorptive aggregates often tend to be more
resistant to mechanical forces and wetting. Moreover, the higher the Wa, the higher the quantity or volume of
asphalt binder the aggregate will likely absorb (Ashebir et al. 2019). The appropriate limit of Wa generally ranges
from 1-5% (Aweda et al. 2019). However, lightweight aggregates have higher Wa values usually from 5-20%. Wa
values range from 0.1 to about 2.0 percent for aggregates particularly utilized in road surfacing. Thus, all the
samples within the current study satisfy this requirement except sample #86.
3.3 Dry Density (dd)
The dd of the samples vary from 2366.5-2762.1(Kg/m3) and the average value of dd is 2634.2 (kg/m3) for the
limestone in the study area. The lowest value is from sample #86 (biointramicritic limestone) and the highest one is
from sample #58 (siliceous biopelmicritic limestone). There is no significant variability among the values

10
concerning the dd. Although the strength of high-density limestone (sample #58) is relatively high, the natural
discontinuities made the rock mass weak.
3.4 Bulk Specific Gravity (Gsb)
The Gsb of aggregates normally used in road construction ranges from about 2.5 to 3.0 with an average of about 2.68
(Ashebir et al. 2019). However, the Gsb of the limestone samples ranges from 2.34-2.81, and the average Gsb for the
limestone in the study area is 2.64. Normally, a high Gsb value is considered as an indicator of high strength. The
minimum value of 2.34 was obtained for sample #86 (biointramicritic limestone) and the maximum value (2.81) was
obtained for sample #40 which is also biointramicritic limestone.
3.5 Effective Porosity (PE)
PE is defined as the ratio of the volume of voids (Vv) to bulk volume (Vbulk) of the cubes multiplied by 100,
expressed in percentage (eq.2).
*100
bulkV
vV
(%)PorosityEffective . (eq.2)
The high porosity of aggregates indicates the aggregates have a potential durability problem. However, minimum
porosity indicates high strength and potentially durable aggregates (Ashebir et al. 2019).
The limestone of the study area was evaluated and the minimum and maximum effective porosity is 0.44% for
sample no #4 from dolomitized biointramicritic Limestone and 13.75% for sample, no #86 from biointramicritic
Limestone, respectively.
About 89% of the total studied samples have PE not exceeding 5%. It is widely understood that diagenetic processes
play a key role in controlling porosity and permeability within limestone (Alqahtani et al. 2013). Petrographical
analyses of the remaining samples indicate that the diagenetic processes increase the total porosity of the studied
limestone.
Table 2
3.6 Flakiness Index (IF) and Elongation Index (IE)
Generally, better aggregate surface texture and higher angularity lead to a good aggregate-cement bond and good
particle interlock, both of which help in achieving good compressive strength properties. However, flakey aggregate
has less strength than cubical aggregate and doesn’t create the dense matrix that well-graded cubic aggregate can do,
and it’ll provide less texture when used in the surface dressing. E.g. Granular sub-base with a high proportion of
flakey aggregate tends to segregate and be difficult to compact. Moreover, Flakey chippings do not create the
surface texture that a cubic or angular chipping can produce. Flaky particles are more easily stripped from bitumen
seals. In flakiness study, it involves investigating the lithological causes, as distinct from the crushing induced,
causes of flakiness. The IF of the limestone aggregate in the study area ranges from 11- 38%, and the IE ranges from
4-19%. The maximum and minimum IF values were from sample #82 and #29, respectively. However, the maximum
for the IE was from samples #4 and #29 whereas the minimum values were from sample #58. In this study,
fortunately, most samples satisfy the requirements for road base course (Table 2).
3.7 Soundness
The soundness test is meant to review the resistance of aggregates to weathering action, by conducting accelerated
weathering test cycles. Porous aggregates subjected to Na2So4 solution are likely to disintegrate prematurely. To
11
ascertain the soundness of such aggregates, aggregates of specified sizes are subjected to an accelerated cycle of
alternate wetting utilizing a saturated solution of Na2So4. The minimum and maximum percentage losses of Na2So4
soundness are 1% and 14% respectively. The minimum values were exhibited by samples (such as #63, #49, #42,
#7, #19, and #46) (Table 1). The maximum values were from sample # 86 and the average values for the Harer-Dire
Dawa limestone are 4% (Fig.4). According to ERA STS 2013, the loss in weight should not exceed 10 percent for
fine aggregate when tested with sodium sulfate. Thus, fortunately, only sample number 86 exceeds the maximum
limit, and therefore, most samples are suitable concerning soundness. A relatively lower limit value of Na2So4
soundness is set for fine aggregates than coarse aggregates; because there is an interconnection between soundness
or weatherability and particle sizes or surface area. The weathering or soundness increases as particle size decreases
or as surface area increases.
3.8 Unconfined Compressive Strength (UCS)
Results of the UCS value of the limestone samples range from a minimum value of 20.5 MPa to a maximum value
of 180.5 Mpa, the limestone in the study area has a mean value of 84 Mpa, thus mainly classified into strong rock
according to (Singh and Goel, 2011) and as medium-strong to very strong rocks. It is found that about 89% of the
tested samples have a compressive strength of more than 50MPa. Hence, it is safe to say that the compressive
strength values of the samples are more than 50Mpa with 95% confidence. The highest compressive strength was
recorded for samples ML28 which is from biointramicritic Limestone and the lowest value is for sample ML86 from
the same group. The average compressive strength results of the limestones in the study area are satisfactory and the
results were accepted for the utilization of such rocks as crushed stones for road construction purposes.
3.9 Aggregate Impact Value (AIV)
The maximum and minimum values for AIV were 20% and 8%, respectively. The maximum value was obtained
from sample #86 and the minimum AIV value was obtained from sample #46. The average AIV value for Harer-
Dire Dawa limestone is 13.2% which is too less than 30% indicating the suitability of this aggregate as a good
wearing course. AIV is used as a measure of resistance to sudden impact. Low numerical value means a resistant
rock (eq.3).
100*
Sampleof Weight Original
sieve2.36 passing fines of Weight(%)AIV . (eq.3)
AIVs below 10 are considered as strong, and AIVs above 35 would normally be considered as too weak to be used
on road surfaces (Aweda et al. 2019). The AIV of aggregates to be used for wearing course shouldn't exceed 30%.
For water-bound macadam base courses, the maximum permissible value defined by BS 882:1992 is 45%. Thus, the
AIV of all samples in the current study area satisfy the requirements for road construction (Fig.3 (a)).

12
Fig.3 (a-c)

13
3.10 Aggregate Crushing Value (ACV)
The ACV is a value that indicates the ability of an aggregate to resist against the gradually applied load or crushing. The lower the value the stronger the aggregate is i.e.
the greater its ability to resist crushing. A value below 10 signifies an exceptionally strong aggregate while above 35 would normally be considered as weak aggregates.
Therefore, all the samples in the current study exhibit ACV values between 10 and 35 (Table 1and Fig.4) indicating that they are strong aggregates. According to ERA-
STS-2002, it is recommended to reject if the ACV (%) exceeds a value of 29% for road construction. Therefore, based on the result shown in Table 1; the ACV of the
limestone aggregate from samples #47 and #86 indicated a bit higher than the limit of ERA-STS.
The degree of resistance is assessed from fine particles passing the BS sieve 2.36 mm which are calculated as the percentage of initial weight and this taken as a measure
of the aggregate crushing value (eq.4).
100*
Sampleof Weight Original
sieve2.36 passing fines of Weight(%)ACV . (eq.4)
The maximum and minimum values for the aggregate crushing value (ACV) ranges from 34% to 24% while the maximum ACV value was shown by sample #47 from
dolomitized biooospary Limestone and minimum value by sample #28 from biointramicritic Limestone. The mean value of ACV for Harer-Dire Dawa limestone is 29%.
According to (Ethiopian Roads Authority Standard Technical Specification (ERA-STS, 2002), the ACV should preferably be less than 25% and in any case less than 29%
for road base course (Table 2, Fig.3 (b)).
3.11 Los Angles Abrasion Value (LAAV)
The principle of the LAAV test is to find the percentage of wear due to relative rubbing action between the aggregate and steel balls which is used as an abrasive charge.
A maximum value of 35% and 30% is allowed for road base course and wearing course in Ethiopian conditions (ERA-STS-2002 and ERA-STS-2013). The maximum and
minimum LAAV were 31.1% and 18.9% respectively. The maximum value was from sample #86 and the minimum value was from sample #28. Both minimum and
maximum values were obtained from the same group of limestone which is biointramicritic Limestone indicating the variation in the result is due to micro-structures and
alteration or weathering.
Generally, LAAV below 15% is regarded as good while values above 25% will pose poor resistance to wearing and fragmentation (Aweda et al., 2019). For road sub-base
applications, the LAAV shall not exceed 45% when determined following the requirements of (AASHTO T 96-94, 1994). Consequently, in the current study, all samples
except sample #86 satisfy the requirement for road sub-base, base course, and bituminous bound surfacing or wearing course (30%), (Table 2 and Fig.3 (c)). Therefore,
the aggregate of these limestones will not wear away; abrade too quickly particularly when present in wearing courses and surface treatments.
14
Fig.4

15
3.12 XRF analysis
The results of the XRF analysis show (Fe2O3, MgO, CaO, and SiO2) major oxides that dominate the rock sample in the study area. The XRF analysis of samples from
Harer-Dire Dawa revealed an average value of CaO of 49.23% with average levels of MgO 1.71% (Table 3). Calcium oxide (CaO) is the most dominant oxides in all
samples of the study area but Silica (SiO2) is the next dominant one.
3.13 Petrographic Analysis
The microscopic investigations of thirty-seven samples of the Harer-Dire Dawa limestone indicated the presence of three main components; allochems (grains), matrix
(mostly micritic), and cement (spray calcite). The allochems are mainly composed of fossils. These skeletal components are embedded in micritic fine groundmass or
cemented by sparitic cement.
Diagenesis processes (compaction, dissolution, cementation, recrystallization, and dolomitization) are of special importance when studying carbonate sediments because
these processes modify the texture, structure, and composition of the original sediments (Alqahtani et al. 2013). Consequently, the modifications may greatly affect their
mechanical properties.
The relatively higher porosity of the samples may be related to its higher bio-clastic contents. This is indicated in Fig.5 with an increase in porosity as percentages of bio-
clastic contents increases.
Fig.5

16
The geological classification of the different limestone in this study is mainly based on carbonate grains. The grains
include skeletal and non-skeletal grains. The skeletal grains are bioclast or fossils which were transported, broken,
abraded, and still completely preserved shells such as bi-values. However, non-skeletal grains are peloids, ooids, and
various coated grains. Plates 1-8 and Fig.6 (a-g) showed the results of the photomicrographs and the modal
composition of the various samples examined in this work. In the present study, micrite, sparite, intraclasts, ooids,
fossils, peloids, clastic quartz, dolomite, and Fe-oxides are the main minerals present (Fig.6 (a-g)). From the results,
it can be concluded that ML-29 has the highest percentage composition of micrite content of 60% as compared to
sample #17 which has 9%. In the thin section of ML-29, micrite appears dark, featureless, and microcrystalline
(plate 1). The matrix is a fine-grained, homogeneous texture, bio-clastic micrite. The slide of sample #17 contains a
prominent pressure solution seam with spacing in mm laying in the horizontal direction with large stylolite.
Moreover, brownish Fe-oxide staining remains in the pressure solution seam. Pressure solution can increase the
dissolution of calcite and is believed to be a significant source for the formation of porosity (Erik, 2010). On the
other hand, pressure solution may create conduits for fluids and open migration paths leading to low strength value
of the sample. Thus ML-29 has the highest strength value as compared to sample #17. Sample #ML-24 and CL-90
contain the highest percentage of clastic quartz (plate 3) which adds to the high strength value. In these samples,
(sample ML-24 and CL-90), the whole matrix is dolomite sparite, and fossils are converted to sparite. The
development of a good rhombohedral structure is a typical form of dolomites and uncommon in calcites. Therefore,
all these add to the high strength value. On the contrary, samples # 84 and 72 contain the least clastic quartz and this
adds to the lowest strength values as shown in the modal composition (Fig.6 (e-g)). The slide of sample #72, contain
coated grains formed by a series of concentric layers of calcite surrounding a quartz nucleus. Oolites form by
making quartz in the core and then building concentric calcites (plate 4). The calcite cement in the interparticle pores
appears white and the spaces between ooids are filled by sparite. In this oolitic limestone, the Oolitic grains form
rounded or spherical morphometry with a smooth surface or small scale roughness and the individual grains are
supported by the sparitic matrix. The Mud-supported (matrix supported) fabric is indicated by grains ‘floating’ in
lime mud (plate 4). Thus, these also contribute to the lowest strength of the rock. The sparite of this sample is both
calcite and dolomite.
The fine to medium texture of sample # ML-29 also confirmed the hardness of the rock as indicated in the results of
aggregate mechanical properties (Aggregate crushing and aggregate impact values), particularly when compared
with the results of sample #17. Besides, limestone sample #17 contains abundant stylolites and matrix supported
fabric which may make a poor aggregate (Plate 2). Stylolites are irregular, suture-like contacts produced by
differential vertical movement under pressure in the presence of solution. They are marked by irregular and
interlocking penetration on two sides (plate 2): Columns, pits and tooth-like projections on one side fit into their
counterparts on the other side (Erik, 2010). The samples which have stylolites tend to have relatively lower
compressive strength with an average value of 81MPa compared to the stylolite free samples which have average
value of 86MPa.
In addition, in sample #86 though there’s some clastic quartz, however the Fe-minerals in this sample show
oxidation (plate 6). Thus, due to intense oxidation, it shows poor (lowest) strength and aggregate quality as
compared to sample #28 (Table 1). But sample #28 (plate 5) has the highest unconfined compressive strength and
comparatively lowest AIV and ACV; indicating a better rock strength and aggregate quality (AIV and ACV) (Table

17
1). The good quality may be due to well-cemented grains, the sharpness of grain corners or irregular shape, grain
supported fabrics (plate 5), as well as fossils, are filled with larger crystals (coarse) sparitic calcite. The grain-
support fabric, are indicated by a little or no mud, close packing of grains, and abundance of carbonate cement in
interparticle pores. In plate (8) for instance, the bio-clasts are suspended within the lime mud. Thus, matrix-
supported fabric alongside the pressure solution and oxidation contributes to the poor quality of the sample. This
means that the knowledge of the petrographic features of rocks is of great importance to estimate the engineering
these rocks.
18
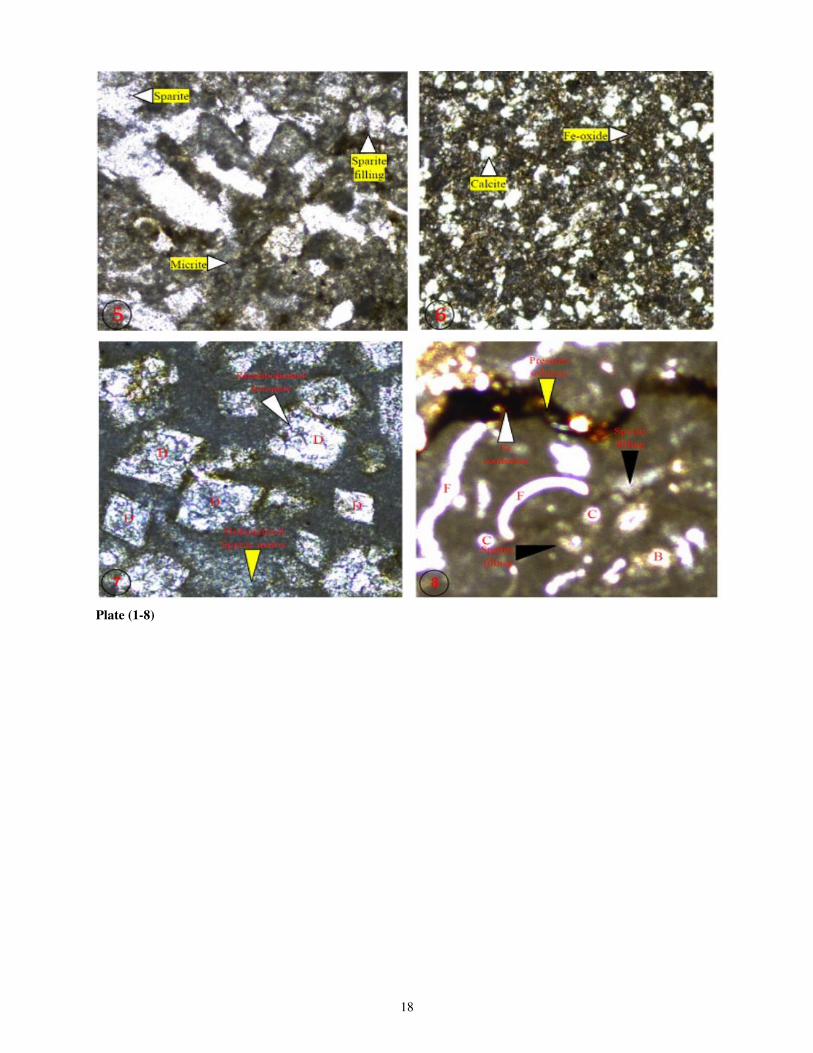
Plate (1-8)

19

20
Fig.6 (a-g)
21
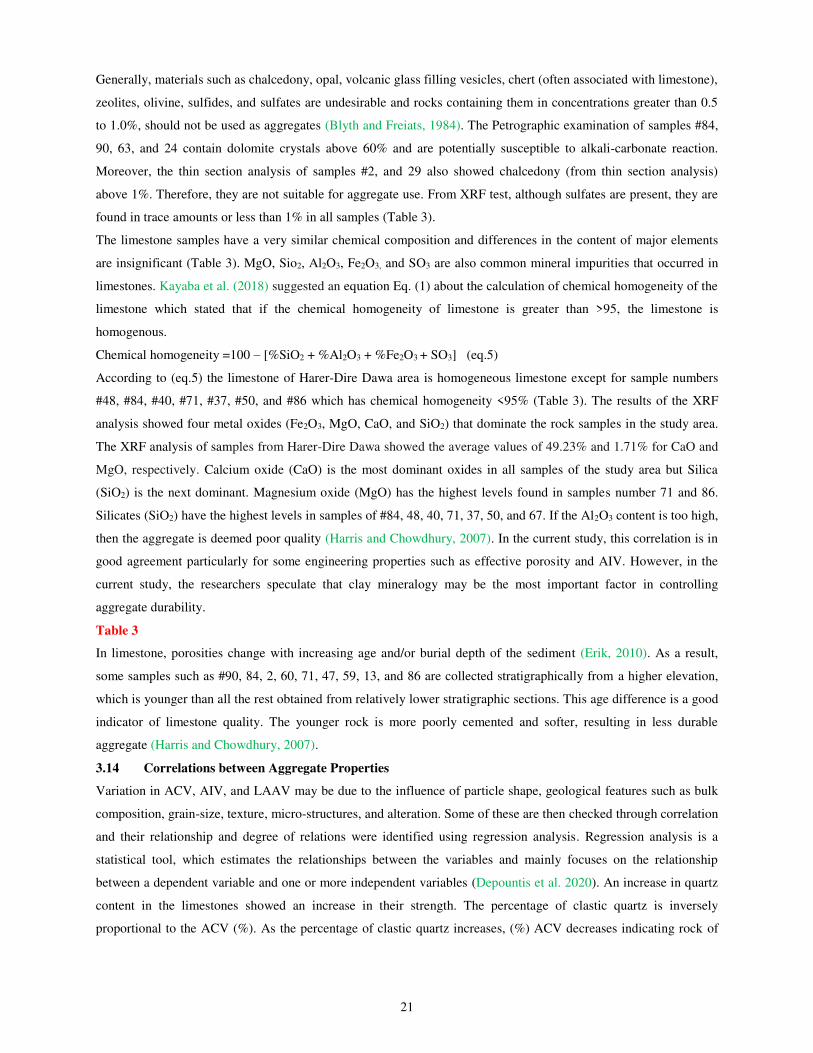
Generally, materials such as chalcedony, opal, volcanic glass filling vesicles, chert (often associated with limestone),
zeolites, olivine, sulfides, and sulfates are undesirable and rocks containing them in concentrations greater than 0.5
to 1.0%, should not be used as aggregates (Blyth and Freiats, 1984). The Petrographic examination of samples #84,
90, 63, and 24 contain dolomite crystals above 60% and are potentially susceptible to alkali-carbonate reaction.
Moreover, the thin section analysis of samples #2, and 29 also showed chalcedony (from thin section analysis)
above 1%. Therefore, they are not suitable for aggregate use. From XRF test, although sulfates are present, they are
found in trace amounts or less than 1% in all samples (Table 3).
The limestone samples have a very similar chemical composition and differences in the content of major elements
are insignificant (Table 3). MgO, Sio2, Al2O3, Fe2O3, and SO3 are also common mineral impurities that occurred in
limestones. Kayaba et al. (2018) suggested an equation Eq. (1) about the calculation of chemical homogeneity of the
limestone which stated that if the chemical homogeneity of limestone is greater than >95, the limestone is
homogenous.
Chemical homogeneity =100 – [%SiO2 + %Al2O3 + %Fe2O3 + SO3] (eq.5)
According to (eq.5) the limestone of Harer-Dire Dawa area is homogeneous limestone except for sample numbers
#48, #84, #40, #71, #37, #50, and #86 which has chemical homogeneity <95% (Table 3). The results of the XRF
analysis showed four metal oxides (Fe2O3, MgO, CaO, and SiO2) that dominate the rock samples in the study area.
The XRF analysis of samples from Harer-Dire Dawa showed the average values of 49.23% and 1.71% for CaO and
MgO, respectively. Calcium oxide (CaO) is the most dominant oxides in all samples of the study area but Silica
(SiO2) is the next dominant. Magnesium oxide (MgO) has the highest levels found in samples number 71 and 86.
Silicates (SiO2) have the highest levels in samples of #84, 48, 40, 71, 37, 50, and 67. If the Al2O3 content is too high,
then the aggregate is deemed poor quality (Harris and Chowdhury, 2007). In the current study, this correlation is in
good agreement particularly for some engineering properties such as effective porosity and AIV. However, in the
current study, the researchers speculate that clay mineralogy may be the most important factor in controlling
aggregate durability.
Table 3
In limestone, porosities change with increasing age and/or burial depth of the sediment (Erik, 2010). As a result,
some samples such as #90, 84, 2, 60, 71, 47, 59, 13, and 86 are collected stratigraphically from a higher elevation,
which is younger than all the rest obtained from relatively lower stratigraphic sections. This age difference is a good
indicator of limestone quality. The younger rock is more poorly cemented and softer, resulting in less durable
aggregate (Harris and Chowdhury, 2007).
3.14 Correlations between Aggregate Properties
Variation in ACV, AIV, and LAAV may be due to the influence of particle shape, geological features such as bulk
composition, grain-size, texture, micro-structures, and alteration. Some of these are then checked through correlation
and their relationship and degree of relations were identified using regression analysis. Regression analysis is a
statistical tool, which estimates the relationships between the variables and mainly focuses on the relationship
between a dependent variable and one or more independent variables (Depountis et al. 2020). An increase in quartz
content in the limestones showed an increase in their strength. The percentage of clastic quartz is inversely
proportional to the ACV (%). As the percentage of clastic quartz increases, (%) ACV decreases indicating rock of
22
good quality. For all limestone variety, as the contents of clastic quartz increases, the percentage values of ACV
decrease (Fig.7 (a-d)).
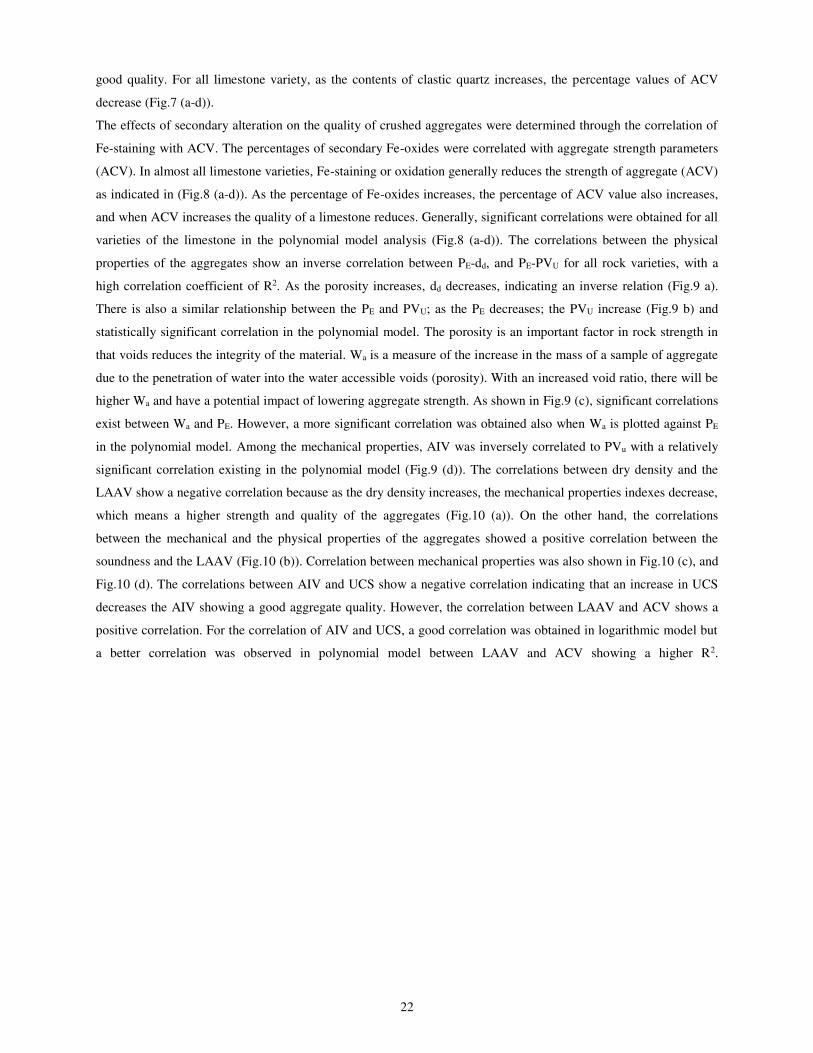
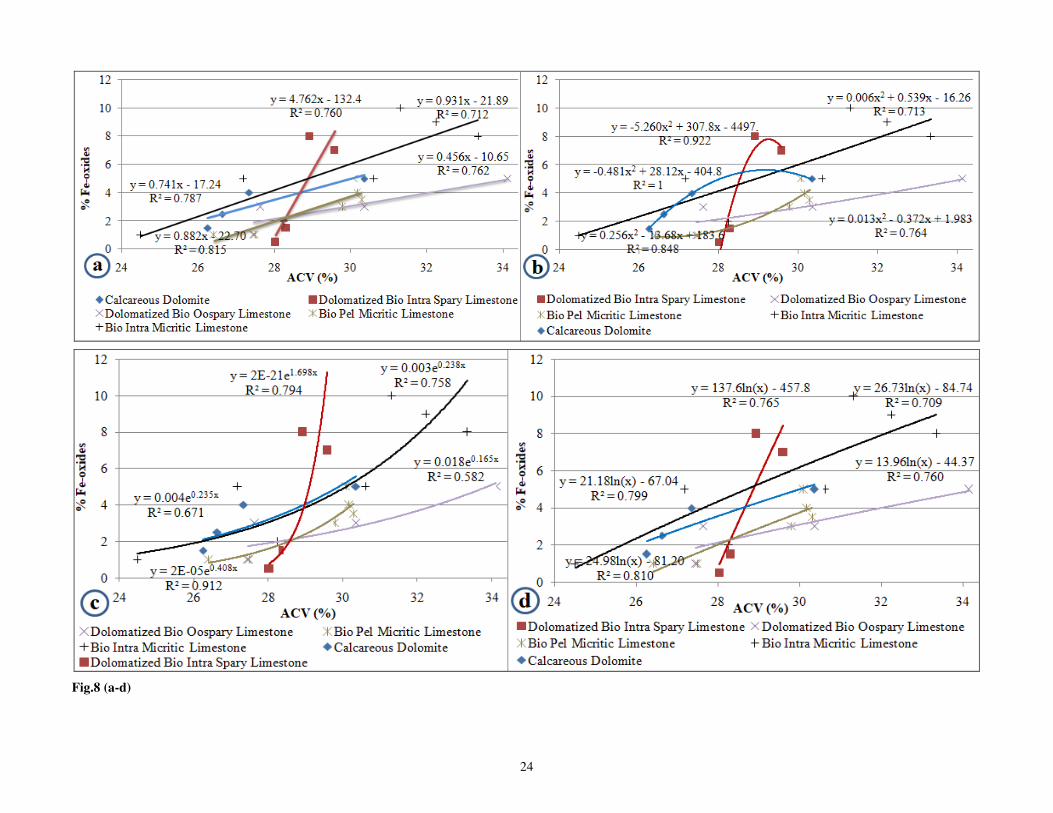
The effects of secondary alteration on the quality of crushed aggregates were determined through the correlation of
Fe-staining with ACV. The percentages of secondary Fe-oxides were correlated with aggregate strength parameters
(ACV). In almost all limestone varieties, Fe-staining or oxidation generally reduces the strength of aggregate (ACV)
as indicated in (Fig.8 (a-d)). As the percentage of Fe-oxides increases, the percentage of ACV value also increases,
and when ACV increases the quality of a limestone reduces. Generally, significant correlations were obtained for all
varieties of the limestone in the polynomial model analysis (Fig.8 (a-d)). The correlations between the physical
properties of the aggregates show an inverse correlation between PE-dd, and PE-PVU for all rock varieties, with a
high correlation coefficient of R2. As the porosity increases, dd decreases, indicating an inverse relation (Fig.9 a).
There is also a similar relationship between the PE and PVU; as the PE decreases; the PVU increase (Fig.9 b) and
statistically significant correlation in the polynomial model. The porosity is an important factor in rock strength in
that voids reduces the integrity of the material. Wa is a measure of the increase in the mass of a sample of aggregate
due to the penetration of water into the water accessible voids (porosity). With an increased void ratio, there will be
higher Wa and have a potential impact of lowering aggregate strength. As shown in Fig.9 (c), significant correlations
exist between Wa and PE. However, a more significant correlation was obtained also when Wa is plotted against PE
in the polynomial model. Among the mechanical properties, AIV was inversely correlated to PVu with a relatively
significant correlation existing in the polynomial model (Fig.9 (d)). The correlations between dry density and the
LAAV show a negative correlation because as the dry density increases, the mechanical properties indexes decrease,
which means a higher strength and quality of the aggregates (Fig.10 (a)). On the other hand, the correlations
between the mechanical and the physical properties of the aggregates showed a positive correlation between the
soundness and the LAAV (Fig.10 (b)). Correlation between mechanical properties was also shown in Fig.10 (c), and
Fig.10 (d). The correlations between AIV and UCS show a negative correlation indicating that an increase in UCS
decreases the AIV showing a good aggregate quality. However, the correlation between LAAV and ACV shows a
positive correlation. For the correlation of AIV and UCS, a good correlation was obtained in logarithmic model but
a better correlation was observed in polynomial model between LAAV and ACV showing a higher R2.

23
Fig.7 (a-d)
24
Fig.8 (a-d)

25
Fig.9 (a-d)

26
Fig.10 (a-d)

27
4. Conclusion
From the results obtained in this study, it could be concluded that there are certain limestones with chemical,
physical, and strength properties that are adequate for serving as construction materials for highway pavements. This
was substantiated based on laboratory test results such as strength and mineralogical properties of these limestones.
The different laboratory testing results led to the general conclusion that most samples obtained from the limestone
rocks can be used as aggregates in road pavement layers, due to their low AIV, ACV, and LAAV relative to existing
standards. These values (near or within the specified limits) make the aggregate from the current study area more
suitable for road construction.
The strength is mainly dependent on the presence of rifting since both the minimum and maximum values are from
the same group. Moreover, significantly different values were obtained for the same samples indicating the effect of
rifting. When compared with the maximum permissible limits of standards the measured values of AIV for all
varieties of limestone complies with standards values for pavement applications. All samples of dolomitized bio
oosparry limestone are excellent for pavement base course. However, the same limestone type was evaluated as
good pavement surfacing course. Siliceous bio pel micritic limestone is also excellent for pavement works. Almost
all samples except samples #86, 13, and 71 were evaluated as excellent for pavement base course. Under hot
weather conditions, frequent contact of the limestone base-course materials with water may cause weathering of
these materials (sample #86) and thus it may have a deleterious effect on the durability and serviceability of
highway pavements. In general, the absorption results of the Harer-Dire Dawa limestone showed a very low
absorption values which were considered advantageous.
Aggregates of Harer-Dire Dawa limestone are more resistant to sudden impact (tough) and fragmentation by
abrasion than a continuous gradual load. The average value of the fragmentation resistance (LAAV) and ACV were
23.3 and 29.3, respectively, whereas the average value of the impact resistance (AIV) was found to be 13.2 (Fig.4).
Therefore, it can be concluded that the Harer-Dire Dawa limestone aggregates will be better suited for the
construction of elements subjected to dynamic loads.
In this study, all samples except a sample with the maximum value (#86) satisfy the maximum percentage losses of
Na2So4 soundness requirement (10%-fine aggregates and 12%-coarse aggregates) for crushed stone as unbound road
base course, and bituminous bound surfacing or wearing course.
Dolomitic limestones are generally preferred in asphalt concrete wearing courses since they are generally harder and
tend to polish less. Dolomitic limestones also have lower absorption rates and thus lead to the use of lower Bitumen
Content in asphalt concrete mixes.
The locally available limestone, although variable in quality and physical properties, can be used in road
construction applications using appropriate mining and processing techniques where igneous source aggregate has
been used previously. However, the aggregates to be used in road construction, particularly in the wearing course of
the pavement should be sufficiently resistant to crushing to withstand the high stresses induced due to heavy traffic
wheel loads.
The mechanical properties of rocks are highly influenced by the composition, fabric (arrangement of intraclasts of
skeletons and voids), and the diagenetic processes. Especially Stylolites are the product of intergranular pressures-
solution and are pervasive in the studied limestone. The prevalent views are that the presence of stylolites

28
significantly weakens rocks and that they induce a significant mechanical anisotropy. Therefore, the impact of
stylolite on the strength of limestone can’t be neglected in geotechnical applications, even if the stylolites are closed.
Generally, the results indicate that rocks of the same type in different areas have different physical and mechanical
values. This is because of the difference in the geological setting and other physical properties. Thus it can be
concluded that changes in texture and mineralogical characteristics due to crystallization, diagenesis, and tectonism
that affect the engineering properties of the same rocks in different areas.
To study the interrelationships between the physical, properties of the limestone aggregate, regression
analysis was applied to their properties and the results show significant interrelationships between them. The
correlation coefficient was high in most of the samples, which means a high correlation between the properties of
the aggregates. Especially, the correlations between dd and PE, PE and PVu, AIV and PVu, dd and LAAV, AIV and
UCS show a negative correlation, which means a higher strength and quality of the examined aggregates.
Conflicts of Interest
No conflict of interest.
References
AASHTO T 96-94. (1994). Standard Method of Test for Resistance to Degradation of Small-Size Coarse Aggregate
by Abrasion and Impact in the Los Angeles Machine. Annual Book of AASHTO Standards.
Abate, E. Y. (2010). Anthropogenic Impacts on Groundwater Resources in the urban Environment of Dire Dawa,
Ethiopia. MSC Thesis in Geosciences, University of Oslo, pp160.
Adeyi, O. G., Mbagwu, C. C., Ndupu, C. N., & Okeke, C. O. (2019). Production and Uses of Crushed Rock
Aggregates. International Journal of Advanced Academic Research, 5(8), 92–110.
Alqahtani, M. B., Seif, A., & Sedek, E. S. (2013). Correlations between petrography and some engineering
properties of coralline limestone: A case study along the Red Sea Coast of Jeddah, Saudi Arabia. Journal of
King Abdulaziz University, Earth Sciences, 24(1), 99–114.
Aragaw, H. (2008). Evaluation of the Suitability of Basaltic Rock as Source of Concrete Aggregate in and around
Addis Ababa City. MSC Thesis, Addis Ababa University, PP78.
Ashebir, A. M., Matusala, B. D., & Ashenafi, R. T. (2019). Determining the Physical Properties of Aggregate
Products and its Suitability for Road Base. 8(12), 210–216.
ASTM C131-96. (1996). Standard Test Method for Resistance to Degradation of Large-Size Coarse Aggregate by
Abrasion and Impact in the Los Angeles Machine. Annual Book of ASTM Standards.
ASTM C170-90. (1999). Standard Test Method for Compressive Strength of Dimension Stone. Annual Book of
ASTM Standards, (Reapproved).
ASTM C88-99a. (1999). The soundness of Aggregates by Use of Sodium Sulfate or Magnesium Sulfate. Annual
Book of ASTM Standards.
ASTM D2845. (2000). Standard Test Method for Laboratory Determination of Pulse Velocities and Ultrasonic
Elastic Constants of Rock. Annual Book of ASTM Standards, pp7.
Aweda, A. K., Mohammed, A., IGE, O. O., & Bitrus, S. A. (2019). Engineering Characterization of Rocks from the
Minna Granitic Formation as Pavement Construction Aggregates. Journal of Geography and Earth Sciences,
7(1), 27–32.
Blyth, F. G. ., & Freiats, M. H. d. (1984). A Geology for Engineers. CRC Press, London, p349.

29
Bosellini, A., Russo, A. and, & Assefa, G. (2001). The Mesozoic succession of Dire Dawa, Harar Province,
Ethiopia. Journal of African Earth Sciences, 32(3), 403–417.
Brilli, M., Giustini, F., & Kadıoğlu, M. (2018). Black Limestone Used in Antiquity: Recognizing the Limestone of
Teos. University of Oxford, Archaeometry, 1–14.
BS-EN-1926. (2006). Natural-Stone-Test-Methods-Uniaxial-Compressive-Strength. Annual Book of BS Standards.,
p18.
BS 812-105.2. (1990). Testing aggregates-Methods for determination of particle shape-Section 105.2 Elongation
index of coarse aggregate. Annual Book of BS Standards.
BS 812-110. (1990). Testing aggregates-Part 110: Methods for determination of aggregate crushing value (ACV).
Annual Book of BS Standards.
BS812-105.1. (1989). Testing aggregates-Methods for determination of particle shape-Section 105.1 Flakiness
index. Annual Book of BS Standards.
BS812-112. (1990). Testing aggregates-Part 112: Methods for determination of aggregate impact value (AIV).
Annual Book of BS Standards.
Depountis, N., Boumpoulis, V., Mouzoulas, G., & Sabatakakis, N. (2020). Suitability of Igneous Rocks as
Aggregates in Road Pavement Layers in Greece. Cur Trends Civil & Struct Eng., 4(5), 4–9.
Dunham, R. J. (1962). Classification of carbonate rocks according to depositional texture. American Association
Petroleum Geologists Memoirs (1), 108–121.
Dweirj, M., Fraige, F., Alnawafleh, H., & Titi, A. (2017). Geotechnical Characterization of Jordanian Limestone.
Geomaterials, 07(01), 1–12.
Engidasew, T. A., & Barbieri, G. (2014). Geo-engineering evaluation of Termaber basalt rock mass for crushed
stone aggregate and building stone from Central Ethiopia. Journal of African Earth Sciences, 99, 581–594.
Erik, F. (2010). Microfacies of Carbonate Rocks: Analysis, Interpretation, and Application. pp1006.
Ethiopian Roads Authority Standard Technical Specification (ERA-STS). (2002). Flexible Pavements and Gravel
Roads. Pavement Design Manual, I.
Folk, R. L. (1962). Spectral subdivision of limestone types, classification of carbonate rocks. Symp Am Assoc Petrol
Geol, 62–8.
Gudissa, L., Raghuvanshi, T. K., Meten, M., & Chemeda, Y. C. (2021). TES Analysis for Crushed Stone Aggregate
Quarry Site Selection: The case of Limestone Terrain around Harer-Dire Dawa towns, Eastern Ethiopia. Arab
Journal of Geoscience, 16, 56–68.
Harris, J. P., & Chowdhury, A. (2007). Tests to Identify Poor Quality Coarse Limestone Aggregates and Acceptable
Limits for Such Aggregates in Bituminous Mixes. Technical Report 0-4523-2, pp118.
Jamaluddin, Darwis, A., & Massinai, M. A. (2018). X-Ray Fluorescence ( XRF ) to identify the chemical analysis of
minerals in Buton island, SE Sulawesi, Indonesia. IOP Conference Series: Earth and Environmental Science,
118 012070, 1–5.
Jethro, M. A., Shehu, S. A., & Olaleye, B. M. (2014). The Suitability of Some Selected Granite Deposits for
Aggregate Stone Production in Road Construction. The International Journal Of Engineering And Science
(IJES), 3(2), 75–81.
Kayabaşı, A., Soypak, R., & Göz, E. (2018). Evaluation of limestone quarries for concrete and asphalt production: a

30
case study from Ankara, Turkey. Arabian Journal of Geosciences, 11(20), 1–22.
Kibrie, T., & Yirga, T. (2008). The Geology of Bedesa Area (NC37-16). Geological Survey of Ethiopia, Basic
Geoscience Mapping Core Process, Memoir No. 19, pp138.
Nata, T., Bheemalingeswara, K., & Abdulaziz, M. (2010). Hydrogeological Investigation and Groundwater Potential
Assessment in Haromaya Watershed, Eastern Ethiopia. MEJS, CNCS-Mekelle University, 2(1), 26–48.
Ndukauba, E., & Akaha, C. T. (2012). Engineering-Geological Evaluation of Rock Materials from Bansara,
Bamenda Massif Southeastern Nigeria, as Aggregates for Pavement Construction. Geosciences, 2(5), 107–
111.
Okogbue, C. O., & Aghamelu, O. P. (2013). Performance of pyroclastic rocks from Abakaliki Metropolis
(southeastern Nigeria) in road construction projects. Bull Eng Geol Environ, 72, 433–446.
Singh, B., & Goel, R. K. (2011). Engineering Rock Mass Classification: Tunneling, Foundations, and Landslides.
Elsevier Inc. United States of America, pp382.
Tesfaye, A. E., & Asmelash, A. (2016). Assessment and Evaluation of Volcanic Rocks Used as Construction
Materials in the City of Addis Ababa. Momona Ethiopian Journal of Science (MEJS), 8(2), 193–212.
Tilahun, K., & Merkel, B. J. (2009). Estimation of groundwater recharge using a GIS-based distributed water
balance model in Dire Dawa, Ethiopia. Water, 1443–1457.
Wondafrash, M., Sentayehu, Z., & Geremew, N. (2009). Investment Opportunities in Limestone Resources
Development of Ethiopia. Promotion Document, Geological Survey of Ethiopia (GSE), pp13.
Workineh, H. (2010). Geology of the Harer Areas (NC 38/9). Geological Survey of Ethiopia, Basic Geoscience
Mapping Core Process, Memoir No. 21, pp124.
Wright, V. P. (1992). A revised classification of limestones. Sedimentary Geology, 76, 177–185.
Yirga, M., Weldearegay, K., & Abebe, T. (2017). Evaluation of Suitability of Coarse Aggregate for Concrete in
Mekele Area, Ethiopia. International Journal of Scientific & Engineering Research, 8(10), 1235–1240.
List of Tables
Table 1. Results for different engineering properties of limestone
Table 2. Permissible Limits of AIV, ACV, LAAV, TPFV, FI, and Soundness (Na2So4) for pavement applications
Table 3. Chemical composition of Harer-Dire Dawa limestones
List of Figures
Fig.1 Location map and Sampling site.
Fig.2 Geological map of the study area.
Fig.3 Bar chart showing the comparisons of a) AIV b) ACV c) LAAV for various limestones and comparison
against standards.
Fig.4 Mean values of the Engineering properties for the Aggregate.
Fig.5 Comparison of the percentages of bioclasts with effective porosity.
Fig.6 Modal Composition of Rocks Studied by Thin Sections Analysis for (a) biointramicritic limestone (b)
biointraspary limestone (c) biopelmicritic limestone (d) dolomitized biointramicritic limestone (e)
dolomitized biooospary limestone (f) dolomitized biointraspary limestone (g) calcareous dolomite.

31
Fig.7 Plots of the clastic quartz against ACV in (a) linear model (b) polynomial model (c) exponential model (d)
logarithmic model.
Fig.8 Plots of the Fe-oxide against ACV in (a) linear model (b) polynomial model (c) exponential model (d)
logarithmic model.
Fig.9 The correlation of (a) dd and PE (b) PE and PVu (c) PE and Wa (d) AIV and PVu.
Fig.10 The correlation of (a) dd and LAAV (b) LAAV and Soundness (c) AIV and UCS (d) LAAV and ACV.
Plate. (1-8) The photomicrographs of (1) ML-29 (M=Medium grained micritic groundmass, long stick-like bi-
valves (white arrows)), (2) sample #17 (Fe-oxides along the pressure solution seam (white arrow), M=Fine
grained micritic groundmass), (3) sample CL-90, (4) sample #72, (5) sample ML-28, and (6) sample 86 (7)
ML-24 with rhombohedral dolomite crystals (white arrows) and D (dolomite) (8) fossiliferous micritic
limestone of sample #70 with dominant pressure solution and oxidation along the pressure solution seam
(yellow arrow) F-Foraminifera, B-Bryozoans, C-Calcispheres.
Figures
Figure 1
Location map and Sampling site. Note: The designations employed and the presentation of the materialon this map do not imply the expression of any opinion whatsoever on the part of Research Square

concerning the legal status of any country, territory, city or area or of its authorities, or concerning thedelimitation of its frontiers or boundaries. This map has been provided by the authors.
Figure 2
Geological map of the study area. Note: The designations employed and the presentation of the materialon this map do not imply the expression of any opinion whatsoever on the part of Research Squareconcerning the legal status of any country, territory, city or area or of its authorities, or concerning thedelimitation of its frontiers or boundaries. This map has been provided by the authors.
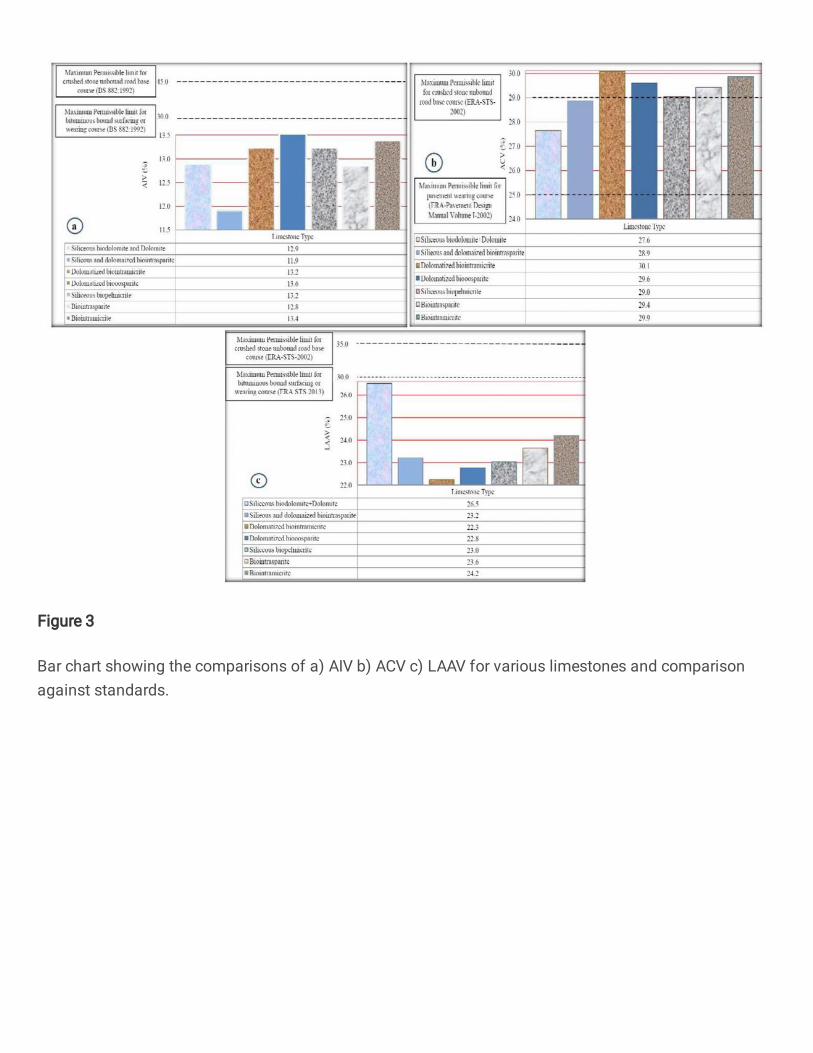
Figure 3
Bar chart showing the comparisons of a) AIV b) ACV c) LAAV for various limestones and comparisonagainst standards.
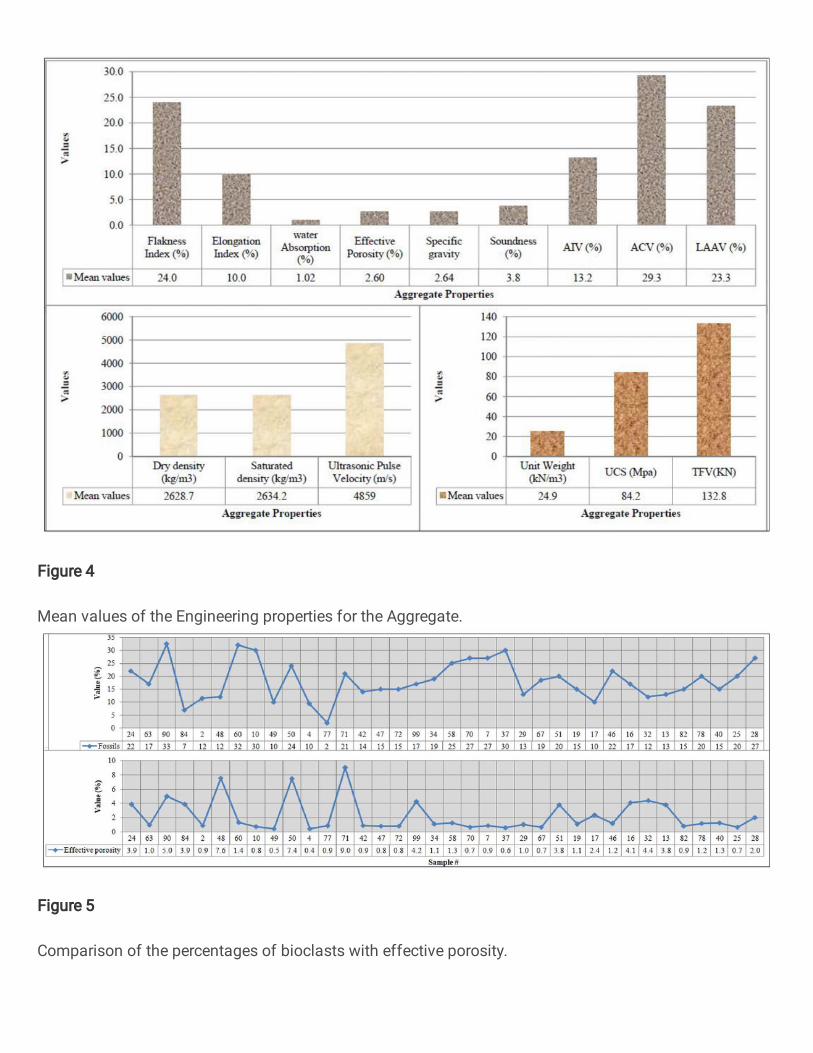
Figure 4
Mean values of the Engineering properties for the Aggregate.
Figure 5
Comparison of the percentages of bioclasts with effective porosity.

Figure 6
Modal Composition of Rocks Studied by Thin Sections Analysis for (a) biointramicritic limestone (b)biointraspary limestone (c) biopelmicritic limestone (d) dolomitized biointramicritic limestone (e)dolomitized biooospary limestone (f) dolomitized biointraspary limestone (g) calcareous dolomite.
Figure 7

Plots of the clastic quartz against ACV in (a) linear model (b) polynomial model (c) exponential model (d)logarithmic model.
Figure 8
Plots of the Fe-oxide against ACV in (a) linear model (b) polynomial model (c) exponential model (d)logarithmic model.

Figure 9
The correlation of (a) dd and PE (b) PE and PVu (c) PE and Wa (d) AIV and PVu.

Figure 10
The correlation of (a) dd and LAAV (b) LAAV and Soundness (c) AIV and UCS (d) LAAV and ACV.
Figure 11

Plate. (1-8) The photomicrographs of (1) ML-29 (M=Medium grained micritic groundmass, long stick-likebi-valves (white arrows)), (2) sample #17 (Fe-oxides along the pressure solution seam (white arrow),M=Fine grained micritic groundmass), (3) sample CL-90, (4) sample #72, (5) sample ML-28, and (6)sample 86 (7) ML-24 with rhombohedral dolomite crystals (white arrows) and D (dolomite) (8)fossiliferous micritic limestone of sample #70 with dominant pressure solution and oxidation along thepressure solution seam (yellow arrow) F-Foraminifera, B-Bryozoans, C-Calcispheres.


![Limestone, Chert, or Limestone? [2013225_fieldtrip]](https://img.pdfslide.net/doc/110x75/558421bfd8b42a86478b4731/limestone-chert-or-limestone-2013225fieldtrip.jpg)