Embed Size (px)
Citation preview
SUITABILITY OF CRUSHED CERAMIC AND PORCELAIN
CLAY TILES AS PARTIAL REPLACEMENT OF CEMENT IN
CONCRETE
OLENG MORRIS
MASTER OF SCIENCE IN CIVIL ENGINEERING
(STRUCTURAL OPTION)
PAN AFRICAN UNIVERSITY INSTITUTE FOR BASIC
SCIENCES, TECHNOLOGY AND INNOVATION
2018
i
Suitability of Crushed Ceramic and Porcelain Clay Tiles as Partial
Replacement of Cement in Concrete
Oleng Morris
CE 300 – 0005/17
A Thesis Submitted to the Department of Civil Engineering in the
Institute of Basic Science Technology and Innovation in Partial
Fulfilment for the Award of the Degree of Master of Science in Civil
Engineering (Structural Option) of the Pan African University
2018
i
DECLARATION AND RECOMMENDATION
DECLARATION
This thesis is my original work and has not been presented for a degree in any other
University.
Signature: ………………………………. Date: ……………………….…
Oleng Morris
CE300 – 0005/17
RECOMMENDATION
This thesis has been submitted with our approval as the University Supervisors.
Signature: ………………………………. Date: ……………………….…
Prof. Dr. - Ing. Zachary C. Abiero - Gariy (PhD)
Department of Civil Engineering, (JKUAT) Nairobi, Kenya.
Signature: ………………………………. Date: ……………………….…
Prof. Christopher Kanali
Agricultural and Biosystems Engineering Department, (JKUAT) Nairobi, Kenya.
Signature: ………………………………. Date: ……………………….…
Dr. Erick Ronoh
Agricultural and Biosystems Engineering Department, (JKUAT) Nairobi, Kenya.
ii
DEDICATION
I dedicate this study to my parents Silvesto Amuko Oleng and Florence Amuko Oleng
for their relentless support towards my academic pursuits. I also dedicate it to my late
auntie Olga Icaka Oleng for her encouragement and advice.
iii
ACKNOWLEDGEMENT
First and foremost, every success gained is attributed to the grace of the Almighty God
for good health and energy to work consistently on this research thesis. Secondly,
special thanks goes to the management of the Pan African University as well as that of
Jomo Kenyatta University of Agriculture and Technology for the awesome support
offered during this study. I sincerely appreciate the university administration for their
dedicated service throughout the entire period. I would also like to acknowledge my
supervisors, Prof. Zachary Gariy, Prof. Christopher Kanali and Dr. Erick Ronoh for
their relentless and highly dedicated technical support, daily supervision, guidance and
consultation during the entire exercise. Finally, I acknowledge any other person who
has had a positive addition to this thesis. These include my classmates among others.
iv
TABLE OF CONTENTS
DECLARATION AND RECOMMENDATION ......................................................... i
DEDICATION ............................................................................................................. ii
ACKNOWLEDGEMENT .......................................................................................... iii
TABLE OF CONTENTS ............................................................................................ iv
LIST OF TABLES .................................................................................................... viii
LIST OF FIGURES .................................................................................................... ix
LIST OF APPENDICES ............................................................................................. xi
LIST OF ABBREVIATIONS AND ACRONYMS ................................................... xii
LIST OF SYMBOLS ................................................................................................ xiii
DEFINITIONS .......................................................................................................... xvi
ABSTRACT .............................................................................................................. xxi
CHAPTER ONE .......................................................................................................... 1
1 INTRODUCTION ......................................................................................... 1
1.1 Background to the Study ................................................................................ 1
1.2 Statement of the Problem ............................................................................... 3
1.3 Objectives ...................................................................................................... 7
1.3.1 General Objective ....................................................................... 7
1.3.2 Specific Objectives ..................................................................... 7
1.4 Research Questions ........................................................................................ 7
1.5 Justification .................................................................................................... 7
1.6 Scope and Limitations.................................................................................... 9
1.6.1 Scope of the Study ...................................................................... 9
1.6.2 Limitations ................................................................................ 10
v
CHAPTER TWO ....................................................................................................... 11
2 LITERATURE REVIEW ............................................................................ 11
2.1 Introduction .................................................................................................. 11
2.2 Theoretical Review ...................................................................................... 11
2.2.1 Concrete .................................................................................... 11
2.2.2 Classification of Concrete ......................................................... 13
2.2.3 Constituent Materials for Making Concrete .............................. 16
2.2.4 Desirable Properties of Concrete .............................................. 22
2.2.5 Waste Ceramic and Porcelain Clay Tile Powder ...................... 32
2.2.6 Environmental Impact Assessment ........................................... 34
2.3 Empirical Review......................................................................................... 36
2.3.1 Engineering Properties of Waste Material Used as Partial
Replacement of Cement in Concrete ........................................ 36
2.3.2 Performance of Structural Concrete Mix with Waste Material
used as Partial Replacement ...................................................... 38
2.3.3 Cost-Benefit of using Waste Material as Partial Replacement of
Cement ...................................................................................... 45
2.4 Literature Review Summary and Research Gaps ........................................ 48
2.5 Conceptual Framework ................................................................................ 50
CHAPTER THREE .................................................................................................... 51
3 MATERIALS AND METHODS ................................................................. 51
3.1 Introduction .................................................................................................. 51
3.2 Determining Engineering Properties of Ceramic and Porcelain Clay Tile
Powders ........................................................................................................ 51
vi
3.2.1 Material Acquisition and Preparation ....................................... 51
3.2.2 Data Collection Procedure ........................................................ 54
3.2.3 Data Analysis ............................................................................ 58
3.3 Evaluating the Performance of Concrete with Ceramic and Porcelain Clay
Tile Powders as Partial Cement Substitutes................................................. 59
3.3.1 Material Acquisition and Preparation ....................................... 59
3.3.2 Experimental Setup ................................................................... 61
3.3.3 Data Collection Procedure ........................................................ 62
3.3.4 Data Processing and Analysis ................................................... 66
3.4 Analysing the Cost-Benefit of Using Ceramic and Porcelain Powders in
Concrete ....................................................................................................... 68
3.4.1 Data Collection Procedure ........................................................ 68
3.4.2 Data Analysis ............................................................................ 69
CHAPTER FOUR ...................................................................................................... 71
4 RESULTS AND DISCUSSION .................................................................. 71
4.1 Engineering Properties of Crushed Ceramic and Porcelain Clay Tile Powders
……………………………………………………………………………..71
4.2 Performance of Concrete Mix obtained from Crushed Ceramic and Porcelain
Clay Tile Powders as Partial Cement Substitutes ........................................ 74
4.2.1 Material Characterization and Concrete Mix Design ............... 74
4.2.2 Workability of Fresh Concrete .................................................. 77
4.2.3 Compressive Strength of Hardened Concrete ........................... 78
4.2.4 Splitting Tensile Strength of Hardened Concrete ..................... 82
vii
4.3 Cost benefit of using Crushed Ceramic and Porcelain Clay Tiles as Partial
Replacement of Cement in concrete ............................................................ 86
4.3.1 Cost Assessment ....................................................................... 86
4.3.2 Environmental Impact Assessment ........................................... 89
CHAPTER FIVE ........................................................................................................ 92
5 CONCLUSIONS AND RECOMMENDATIONS ...................................... 92
5.1 Conclusions .................................................................................................. 92
5.2 Recommendations ........................................................................................ 93
5.2.1 For Possible Application ........................................................... 93
5.2.2 For Further Study ...................................................................... 93
5.3 Achievements ............................................................................................... 94
REFERENCES ........................................................................................................... 96
viii
LIST OF TABLES
Table 2.1: Classification of concrete in accordance with unit weight ....................... 14
Table 2.2: Classification of concrete in accordance with compressive strength. ....... 14
Table 2.3: Concrete classifications in accordance with additives .............................. 15
Table 2.4: Compounds in Portland cement ................................................................ 17
Table 2.5: Functions of compounds in cement .......................................................... 18
Table 2.6: Actual strength classes commonly used in reinforced concrete design .... 28
Table 2.7: Values of the secant modulus of elasticity Ecm (in kN/mm2) ................... 31
Table 3.1: Geographical coordinates of study sites ................................................... 52
Table 3.2: Test methods for properties of ceramic and porcelain clay tile powders . 54
Table 3.3: Physical properties of ordinary Portland cement ...................................... 59
Table 3.4: Chemical composition of ordinary Portland cement (OPC) ..................... 60
Table 3.5: Physical properties of aggregates.............................................................. 63
Table 4.1: Physical properties of ceramic and porcelain clay tile powders. .............. 71
Table 4.2: Concrete trial mix proportions for test specimen ...................................... 76
Table 4.3: Material cost for conventional concrete .................................................... 87
Table 4.4: Material cost for concrete with 20% cement replacement ........................ 87
ix
LIST OF FIGURES
Figure 2.1: Normal frequency distribution of strengths. ............................................ 23
Figure 2.2: Failure patterns of cubes. ......................................................................... 24
Figure 2.3: Splitting tensile strength specimen. ......................................................... 26
Figure 2.4: Failure patterns of cylinders. ................................................................... 27
Figure 2.5: Flexural strength beam setup. .................................................................. 29
Figure 2.6: Typical stress-strain relationship for concrete ......................................... 30
Figure 2.7: Ceramic tile waste at demolition site. ...................................................... 33
Figure 2.8: Conceptual framework. ........................................................................... 50
Figure 3.1: Location of study area. ............................................................................ 53
Figure 3.2: Schematic diagram for determining engineering properties of ceramic and
porcelain clay tile powders......................................................................................... 55
Figure 3.3: Le-Chatelier flask for determining specific gravity ................................ 56
Figure 3.4: Vicat apparatus for determining consistency and setting time ................ 57
Figure 3.5: X-Ray fluorescence spectrometer ............................................................ 58
Figure 3.6: Flow chart for evaluating the performance of concrete mix obtained from
ceramic and porcelain clay tile powders as partial cement substitutes. ..................... 62
Figure 3.7: Slump measurement and its forms. ......................................................... 64
Figure 3.8: Slump cone apparatus. ............................................................................. 65
Figure 3.9: Universal testing machine for determining strength of concrete. ............ 66
Figure 4.1: Chemical composition of cement, and ceramic and porcelain powders. 72
Figure 4.2: Particle size distribution of fine aggregates. ............................................ 74
Figure 4.3: Particle size distribution of coarse aggregates. ........................................ 75
Figure 4.4: Variation of slump with percentage cement replacement ....................... 77
x
Figure 4.5: Compressive strengths for various cement replacement levels at different
ages. ............................................................................................................................ 79
Figure 4.6: Prediction of compressive strengths for various cement replacement levels
at different ages of curing. ......................................................................................... 81
Figure 4.7: Tensile strengths for various cement replacement levels at different
ages. ............................................................................................................................ 83
Figure 4.8: Prediction of splitting tensile strengths for various cement replacement
levels at different ages of curing. ............................................................................... 84
Figure 4.9: Relationship between compressive and splitting tensile strengths. ......... 86
Figure 4.10: Unit cost of materials per cubic metre for various cement replacement
levels. ......................................................................................................................... 88
Figure 4.11: Abiotic depletion ................................................................................... 89
Figure 4.12: Global warming ..................................................................................... 90
xi
LIST OF APPENDICES
Appendix A: Concrete Mix Design Tables .............................................................. 107
Appendix B: Laboratory Test Certificates ............................................................... 111
Appendix B1: Chemical composition of ceramic powder ........................... 111
Appendix B2: Chemical composition of porcelain powder ......................... 112
Appendix B3: Characterisation of coarse aggregates................................... 113
Appendix B4: Characterisation of fine aggregates (sand)............................ 114
Appendix B5: Compressive strength of concrete for various cement
replacement levels at different ages ........................................ 115
Appendix C: Material Cost of Production of 1 m3 of Concrete ............................... 137
Appendix C1: Material Breakdown for C25 cement concrete (1:2:3) ......... 137
Appendix C2: Calculation of Unit Price of Concrete Production ................ 138
Appendix D: Environmental Impact Considerations ............................................... 141
Appendix D1: Abiotic depletion .................................................................. 141
Appendix D2: Global warming .................................................................... 142
Appendix E: Publications ......................................................................................... 143
xii
LIST OF ABBREVIATIONS AND ACRONYMS
ASTM : American Standard of Testing Materials
BS : British Standards
CKD : Cement Kiln Dust
DSP : Densified with Small Particles
EC : Euro Code
EMP : Environment Management Plan
FRC : Fibre Reinforced Concrete
GDP : Gross Domestic Product
IS : Indian Standards
KES : Kenyan Shillings
MDF : Macro Defect Free
MPa : Mega Pascal
NEMA : National Environment Management Authority
NW&SC : National Water and Sewerage Corporation
OPC : Ordinary Portland cement
R.C : Reinforced Concrete
U.K : United Kingdom
UShs : Ugandan Shillings
UTM : Universal Testing Machine
xiii
LIST OF SYMBOLS
ckf Characteristic compressive cylinder strength of concrete
Standard deviation
(CO2)r Percentage carbon dioxide reduction
(K, Na)2O. Al2O3. 6H2O Feldspar
Ac Cross-sectional area of the specimen
ADr Percentage abiotic depletion reduction
Al2O3 Aluminium Oxide
Al2Si2O5 (OH)4 Kaolin
C Cement content in kg
C0 Material cost of conventional concrete mix
C20 Material cost of optimal concrete mix
C2S Belite
C3A Celite
C3S Alite
C4AF Felite
CaO Calcium Oxide
CEc CO2 emission in production of one ton of cement
CEw CO2 emission in production of one ton of waste powders
Cr Percentage cost reduction
D Density of the material
D Density of the material.
d Designated cross-sectional dimension
Ec Energy required for production of 1 kg of cement
xiv
Ecm Secant modulus
Ew Energy required for production of 1 kg of waste powders
f Cube strength
F Maximum load at failure
fck, cube Equivalent characteristic cube strength at 28 days.
fcs Compressive strength
fctk Characteristic tensile strength
fctk0.05, Lower characteristic compressive strength at 5% fractile
fctk0.95 Upper characteristic compressive strength at 95%
fractile
fctm Mean tensile strength
Fe2O3 Iron Oxide
fk Characteristic cylinder strength at 28 days
fm Mean strength
fts Tensile splitting strength
K2O Potassium Oxide
L Length of the line of contact of the specimen
M Mass of the material
M Mass of material
MgO Magnesium Oxide
n Number of cubes tested
Na2O Sodium Oxide
SiO2 Silica Oxide
TiO2 Titanium Oxide
xv
V Absolute volume
W Water content in kg
Wc Water cement ratio
xvi
DEFINITIONS
Absorption: The process by which a liquid is drawn into and tends to
fill permeable pores in a porous solid body; also, the
increase in mass of a porous solid body resulting from
the penetration of a liquid into its permeable pores.
Admixture: Material other than water, aggregates, hydraulic
cementitious material, and fibre reinforcement that is
used as an ingredient of a cementitious mixture to
modify its freshly mixed, setting, or hardened properties
and that is added to the batch before or during its mixing.
Aggregate: Granular material, such as sand, gravel, crushed stone,
or iron blast-furnace slag, used with a cementing
medium to form hydraulic-cement concrete or mortar.
Ceramics: Brittle solids that are suitable for withstanding very high
temperatures.
Coarse aggregate: Aggregate predominantly retained on the 4.75-mm (no.
4) sieve; or that portion of an aggregate retained on the
4.75-mm (no. 4) sieve.
Fine aggregate: Aggregate passing the 9.5-mm sieve and almost entirely
passing the 4.75-mm (no. 4) sieve and predominantly
retained on the 75-µm (no. 200) sieve; or that portion of
xvii
an aggregate passing the 4.75-mm (no. 4) sieve and
retained on the 75-µm (no. 200) sieve.
Bulk density: The mass of a unit volume of bulk aggregate material
(the unit volume includes the volume of the individual
particles and the volume of the voids between the
particles).
Concrete: Composite material that consists essentially of a binding
medium within which are embedded particles or
fragments of aggregate; in hydraulic-cement concrete,
the binder is formed from a mixture of hydraulic cement
and water.
Consistency: The relative mobility or ability to flow of fresh concrete,
mortar, or grout.
Curing: Action taken to maintain moisture and temperature
conditions in a freshly-placed cementitious mixture to
allow hydraulic cement hydration and (if applicable)
pozzolanic reactions to occur so that the potential
properties of the mixture may develop
Density: Mass per unit volume (preferred over deprecated term
unit weight)
xviii
Fineness modulus: Factor obtained by adding the percentages of material in
the sample that is coarser than each of the following
sieves (cumulative percentages retained), and dividing
the sum by 100: 150-µm (no. 100), 300-µm (no. 50),
600-µm (no. 30), 1.18-mm (no. 16), 2.36-mm (no. 8),
4.75-mm (no. 4), 9.5-mm, 19.0-mm, 37.5-mm, 75-mm,
150-mm.
Fresh concrete: Concrete which possesses enough of its original
workability so that it can be placed and consolidated by
the intended methods.
Maximum size: In specifications for, or description of aggregate, the
smallest sieve opening through which the entire amount
of aggregate is required to pass.
Nominal maximum size: In specifications for, or description of aggregate, the
smallest sieve opening through which the entire amount
of the aggregate is permitted to pass.
Pozzolan: A siliceous or siliceous and aluminous material, which
in itself possesses little or no cementitious value but
will, in finely divided form and in the presence of
moisture, chemically react with calcium hydroxide at
ordinary temperatures to form compounds possessing
cementitious properties.
xix
Rate analysis: The process of fixing cost per unit of measurement for
the different item of works.
Sand: Fine aggregate resulting from natural disintegration and
abrasion of rock or processing of completely friable
sandstone.
Segregation: The unintentional separation of the constituents of
concrete or particles of an aggregate, causing a lack of
uniformity in their distribution.
Setting: The process, due to chemical reactions, occurring after
the addition of mixing water, that results in a gradual
development of rigidity of a cementitious mixture.
Specific gravity: The ratio of mass of a volume of a material at a stated
temperature to the mass of the same volume of distilled
water at a stated temperature.
Time of setting: The elapsed time from the addition of mixing water to a
cementitious mixture until the mixture reaches a
specified degree of rigidity as measured by a specific
procedure.
Unit weight: Mass per unit volume. (deprecated term—use preferred
term bulk density) of aggregates.
xx
Water-cement ratio: The ratio of the mass of water, exclusive only of that
absorbed by the aggregates, to the mass of Portland
cement in concrete, mortar, or grout, stated as a decimal.
Workability of concrete: That property determining the effort required to
manipulate a freshly mixed quantity of concrete with
minimum loss of homogeneity.
xxi
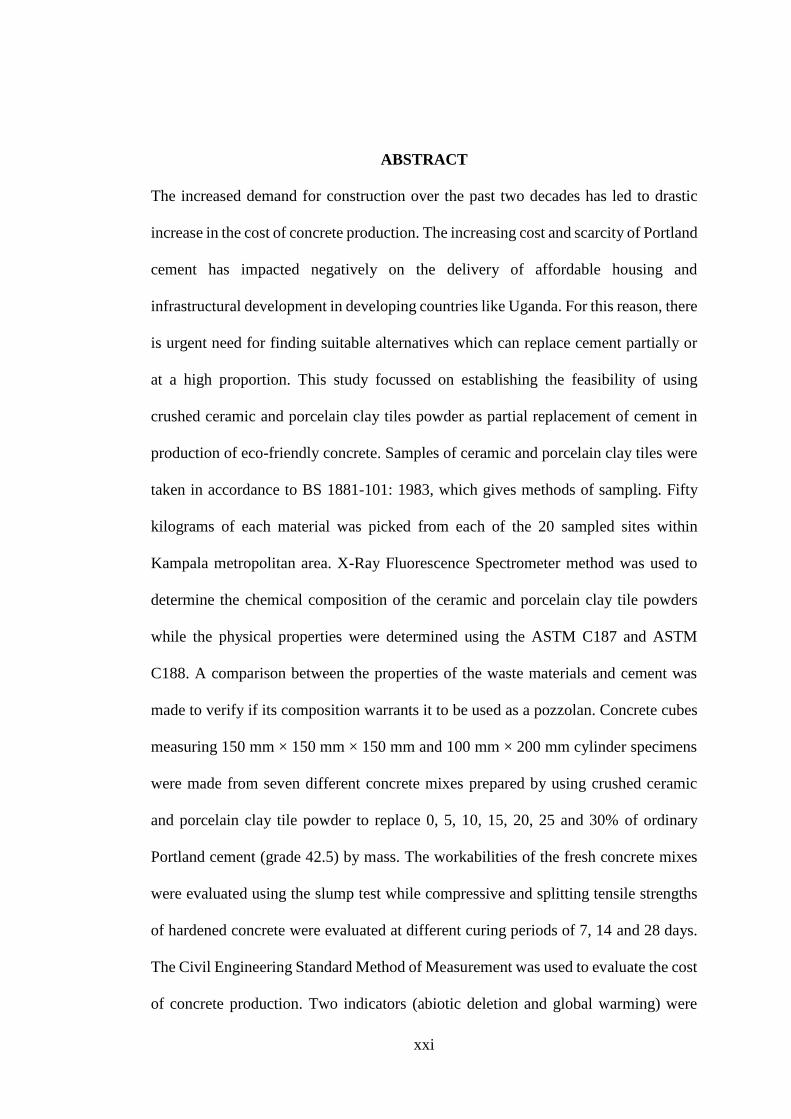
ABSTRACT
The increased demand for construction over the past two decades has led to drastic
increase in the cost of concrete production. The increasing cost and scarcity of Portland
cement has impacted negatively on the delivery of affordable housing and
infrastructural development in developing countries like Uganda. For this reason, there
is urgent need for finding suitable alternatives which can replace cement partially or
at a high proportion. This study focussed on establishing the feasibility of using
crushed ceramic and porcelain clay tiles powder as partial replacement of cement in
production of eco-friendly concrete. Samples of ceramic and porcelain clay tiles were
taken in accordance to BS 1881-101: 1983, which gives methods of sampling. Fifty
kilograms of each material was picked from each of the 20 sampled sites within
Kampala metropolitan area. X-Ray Fluorescence Spectrometer method was used to
determine the chemical composition of the ceramic and porcelain clay tile powders
while the physical properties were determined using the ASTM C187 and ASTM
C188. A comparison between the properties of the waste materials and cement was
made to verify if its composition warrants it to be used as a pozzolan. Concrete cubes
measuring 150 mm × 150 mm × 150 mm and 100 mm × 200 mm cylinder specimens
were made from seven different concrete mixes prepared by using crushed ceramic
and porcelain clay tile powder to replace 0, 5, 10, 15, 20, 25 and 30% of ordinary
Portland cement (grade 42.5) by mass. The workabilities of the fresh concrete mixes
were evaluated using the slump test while compressive and splitting tensile strengths
of hardened concrete were evaluated at different curing periods of 7, 14 and 28 days.
The Civil Engineering Standard Method of Measurement was used to evaluate the cost
of concrete production. Two indicators (abiotic deletion and global warming) were
xxii
used to evaluate the environmental impacts. The properties of ceramic and porcelain
powders showed that the combined percentage of silica, iron oxide, and alumina for
both materials met the 70% minimum requirement of ASTM C 618 for a good
pozzolan. The results of slump test showed that increase in ceramic and porcelain
powder replacement decreased the workability of concrete. Replacement of cement
with ceramic and porcelain powder significantly increased the compressive strength
of concrete. The target compressive and tensile splitting strengths were achieved up to
20% replacement of cement with ceramic and porcelain powder beyond which the
strength reduced. The cost evaluation indicated there was a reduction of 15.2%
between the conventional and optimal mixes. Energy consumption reduced by 12.8%,
signifying a reduction in the production cost of binders. Finally, carbon dioxide
emission reduced by 19.2% implying a significant reduction in global warming.
1
CHAPTER ONE
1 INTRODUCTION
1.1 Background to the Study
The construction industry constitutes one of the main contributors to the economy of
any country. In fact, it contributes about 10% of the gross domestic product (GDP) in
the world. The industry plays a huge role in not only economic development but also
improving the welfare of the citizens. Over the past two decades, the rate of growth in
construction has increased drastically from 1.8% globally with the largest contributors
to the construction market being Europe, America, Asia and Japan as they control more
than 70% of the industry (Wadel, 2009). The industry is forecasted to grow at a rate of
4.2% from 2018 to 2023. The major drivers for the growth of this market are increasing
housing starts and rising infrastructure due to increasing urbanization and growing
population. Emerging trends which have a direct impact on the dynamics of the
construction industry include increasing demand for green construction to reduce
carbon footprint. (Ikponmwosa et al., 2017).
Concrete is the world’s most utilized construction material and due to this, statistics
have shown that worldwide cement production, by major producing countries from
2011 to 2016 has drastically increased and so has its cost (Xi et al., 2016). Global
cement production is expected to increase from 3.27 million metric tons in 2010 to 4.8
million metric tons in 2030. Yet, due to the increase in demand of construction, the
cost of concrete production has become more expensive over the years and is expected
to increase even further. This has resulted in increased initiatives to modify ordinary
concrete to make it more sustainable and affordable so as to cater for the increasing
2
construction boom. Consequently, properties of concrete such as strength, workability
and durability of concrete have opened avenues for new innovations in the production
of concrete.
In this regard, different studies have been done on the reduction of the cost of concrete
production like replacing cement with: animal blood, waste glass powder, rice husk
ash, saw dust, steel shot dust, and using kiln saw dust among others (Prabagar et al.,
2015). Interest has been driven much towards these wastes and recycled materials as
they are economical and more environmental friendly. Particularly, ceramic materials
which include brick walls, ceramic tiles and all the ceramic products contribute the
highest proportion of wastes in the construction and demolition waste (Meena, 2017).
Ceramic waste can be used in concrete to increase its strength and other durability
factors. Ceramic waste can be used to partially replace cement or sand in order to
achieve different properties of concrete as noted by Raval (2013).
The production of ceramic tiles is unique in that they stand out for its low water
absorption and high mechanical strength. The properties of ceramic clay tiles result
from its low porosity due to the processing conditions such as high degree milling of
raw materials, high force compaction and sintering temperature among others, and the
potential of the raw materials to form liquid phases during sintering (high desiccation).
On the other hand, porcelain tile is a type of ceramic material which possesses high
vitreous characteristics. This vitrification indicates that it has a high degree of melting
on firing and this improves on its mechanical strength (Perez et al., 2013).
3
In reference to these increasing prices of cement over the years, there is a concern to
reduce total cost of concrete production. Since the cost of cement as a binder is
constantly increasing, the cost of concrete production will be high. This study aimed
at finding alternatives of reducing the cost of concrete production for low cost housing
construction by use of waste ceramic and porcelain clay tiles as partial replacement of
cement during production of concrete.
1.2 Statement of the Problem
The increased demand of construction over the past two decades has led to drastic
increase in the cost of concrete production. Worldwide, the annual production of
concrete is estimated to be approximately 4 million tons of concrete. Such volumes
require vast amounts of natural resources for concrete ingredients such as aggregate
and especially cement production. Specifically, the cost of building materials such as
cement, granite and aggregates continue to increase and this poses a great challenge to
most constructors. The world’s cement market currently stands at approximately 2
million tonnes of cement, 80% of which is consumed in emerging countries like
Uganda. Demographic growth, urbanization and economic growth are generating
annual growth of 5% (100 million tonnes) in this market (Lafarge, 2007).
Additionally, the growing concern of depletion of resources necessitates the search for
alternatives sources (Agbede et al., 2009). Due to this increase and varying costs of
materials for production of concrete, there is need for alternative material to be blended
with cement in order to reduce the cost of concrete (Naik et al., 2003). Recently, a
surge in the price of cement has led to a crisis in the construction industry in Uganda
4
and this resulted into panic buying, hoarding and rationing as was reported by retailers
and consumers. The falling production in Tororo Cement and Hima Cement
manufacturing plants was attributed to reduced electricity supplies. Morgan
Gagranihe, the executive director of Tororo Cement, said that production from the
company’s plant at Tororo had fallen by half to 0.6Mt/year from 1.2Mt/year, according
to the Daily Monitor newspaper of 6th April 2018.
In addition, as much as 50% of all materials extracted from the earth’s crust are
transformed into construction materials and products and this contributes greatly to
abiotic depletion (Arpad, 2004). Not only that but also Portland cement production is
very energy-intensive and so, from the standpoint of conservation of natural resources
as well as energy saving, the use of alternative waste constituents in construction
materials is now a global concern. For this reason, extensive research and development
works towards exploring new ingredients are required for producing adequate,
sustainable and environment friendly construction materials. There have been
numerous attempts to utilize ceramic wastes in the manufacture of wall and floor
ceramic tiles in the last two decades, reusing ceramic wastes in the manufacture of
vitrified sewer pipes, and manufacture of mortar (Meena, 2017).
Furthermore, it has also been estimated that the production of one ton of Portland
cement causes the release of approximately one ton of carbon dioxide (CO2) into the
atmosphere. CO2 is a greenhouse gas and it is consequently responsible for global
warming. The cement industry alone generates about 7% of the world total carbon
dioxide emission.
5
According to Ganesan (2000), construction materials account for the largest input into
construction activities, in the range of 50-60%of the total project cost. Unfortunately,
large portions of construction materials are transformed into waste and hence not
wholly utilized by the industry. Evidence shows that approximately 40% of the waste
generated globally originates from the construction and demolition of buildings
(Holm, 1998) and this forms a major portion of the solid waste generally discarded in
landfills worldwide. It is a common practice in Uganda that during cost estimations
for construction materials, estimators add 5% extra materials to cater for wastes in the
course of construction activities. This shows that during planning and design stages,
there is lack of consideration given to waste reduction to minimize the generation of
waste (Muhwezi et al., 2012).
Consequently, efforts have been made in the concrete industry to use waste such as
ceramics among others as partial replacement materials. The demolition and disposal
of wastes generated from concrete structures, pavements, etc., constitutes additional
environmental burden. Construction debris contributes a large fraction of solid waste
disposal problem, with concrete structures constituting the largest single component.
Ceramic products like tiles and sanitary ware are part of the essential construction
materials used in most building works especially as finishes. Some common
manufactured ceramics include wall tiles, floor tiles, sanitary ware, household
ceramics and technical ceramics (Prabagar et al., 2015). They are mostly produced
using natural materials that contain high content of clay minerals. Despite the
ornamental benefits of ceramics, its waste causes a lot of nuisance to the environment.
6
Efforts have been made in Uganda to re-use the tile for reconstruction in the case of
unbroken ones, others use them as hard core for base construction, and companies that
recycle these tiles barely exist. Despite the above measures in tile waste management,
little effort has been done in studying the use of ceramic tiles in concrete production
in terms of its powder. Understanding this is imperative in going a long way in
ensuring that the tile wastes from the construction sites are utilized and are of
economical use. This study aimed at addressing this through establishing the feasibility
of partial replacement of cement with waste ceramic and porcelain tile powder in
concrete production.
Conclusively, these points and these numbers seem to indicate that the concrete
industry has become a victim of its own success and therefore is now faced with
tremendous challenges. But the situation is not as bad as it might seem, because eco-
friendly concrete is inherently an environmentally friendly material, as can be
demonstrated readily with a life-cycle analysis (Geem, 2002). The challenges derive
primarily from the fact that Portland cement is not environmentally friendly to the
problems associated with use of Portland cement could be solved by observing the
simple requirement of using as much concrete with as little Portland cement as
possible. It is for this reason that my study attempts to use ceramic and porcelain waste
in production of environmentally friendly concrete.
7
1.3 Objectives
1.3.1 General Objective
The general objective of this study was to assess the suitability of using crushed
ceramic and porcelain clay tiles as partial replacement of cement in concrete.
1.3.2 Specific Objectives
(1) To determine the engineering properties of crushed ceramic and porcelain clay
tile powders.
(2) To evaluate the performance of concrete mix obtained from using crushed
ceramic and porcelain clay tiles as partial cement substitutes.
(3) To assess the cost-benefit of using crushed ceramic and porcelain clay tiles as
partial replacement materials for cement in concrete.
1.4 Research Questions
(1) Do the engineering properties of crushed ceramic and porcelain clay tile
powder warrant it to be used as a pozzolan?
(2) How does the concrete mix obtained from using crushed ceramic and porcelain
clay tiles as partial replacement materials for cement in concrete perform?
(3) What is the cost-benefit of using crushed ceramic and porcelain clay tiles as
partial replacement materials for cement in concrete?
1.5 Justification
The evident relatively high cost of cement (currently (USD 14) per 50 kg bag), and yet
it is the major concrete constituent. This calls for research in order to find an alternative
8
to partially or fully replace cement. Utilization of wastes from other industries as
building materials is one of the sustainable measures that the construction industry can
adopt. This will lead to reduced cost of concrete production and consequently reduced
cost of construction which in turn leads to affordable housing construction.
There is continuous demolition of old structures around Kampala and reconstruction.
Other demolished components like bricks, air vents and aggregates have been re-put
into use after proper removal but tiles from the old structures have been abandoned in
stores or broken tiles are often heaped on sites, reused and disposed to dumping
grounds or buried and forgotten until when they manifest in increased waste levels.
Tile waste is a major problem for construction industries, manufacturing industry, sites
where they are sold and homesteads worldwide. This study, therefore, focussed on
utilizing old waste tiles from demolished structures in order to reduce waste around
Kampala.
The production of cement requires high energy input (850 kcal per kg of clinker)
implying that the extraction of large quantities of raw materials from the earth requires
several tons of rock to produce 1 ton of clinker. Not only does the production of one
ton of cement generate 0.55 ton of chemical CO2 but also requires an additional 0.39
ton of CO2 in fuel emissions, accounting for a total of 0.94 ton of CO2, which is a
greenhouse gas responsible for global warming.
Conclusively, in today’s world, concrete constitutes the most popular material in
construction in both the developed and the developing countries (Chee et al., 2011).
9
Therefore, not only are the economic and technical aspect of concrete important, but
also is its conservation and energy consumption. Due to the increase in price of cement
used in concrete production, finding alternatives to reduce the amount of cement
required is thus very desirable (Pacheco, 2010).
1.6 Scope and Limitations
1.6.1 Scope of the Study
Ceramic and Porcelain clay tile waste was sampled from Kampala and its environs,
targeting construction sites, areas of Kireka sites that sell tiles, Namave where many
tile producers are available, Bukoto as an area of major demolition and Namugongo
area undergoing a lot of construction. The study involved homesteads undergoing
massive demolition due to the recent road development programs in Kampala city like
along northern by pass. Next, the engineering properties of ceramic and porcelain clay
tiles was limited to physical properties and chemical composition respectively
determined using the relevant standards and X-Ray Fluorescence Spectrometer.
Further, the performance of concrete with ceramic and porcelain clay tile powder as
partial cement substitute was evaluated from the properties of fresh concrete
(workability) as well as the properties of hardened concrete (compressive strength and
splitting tensile strength) monitored at 7, 14 and 28 days of curing. Based on the
reviewed literature, several authors have utilized ceramic waste whilst others have
investigated the use of porcelain waste as partial replacement of cement in concrete
and obtained similar results. The two powders were therefore mixed in ratio of 1:1. It
was on this basis that this study did not seek to find the individual effect of each waste
10
material in the concrete mixes. However, the engineering properties of both ceramic
and porcelain powders were determined to verify similarities as well as warrant their
use as pozzolan.
Finally, the cost benefit of using crushed ceramic and porcelain clay tiles as partial
replacement materials for cement in concrete was limited to comparing the
performance and cost of optimal mix with the conventional mix. The benefits in terms
of the environment were also evaluated. This was assessed to determine the suitability
of using crushed ceramic and porcelain clay tiles as partial replacement materials for
cement in concrete production for low cost housing construction.
1.6.2 Limitations
First and foremost, there was lack of instrumentation for determination of all the
chemical components of the ceramic and porcelain powders. This was a limitation
because sodium oxide content could not be determined due to lack of Atomic
Absorption Spectrophotometry (AAS) and Flame Emission Spectrophotometry (FES),
or flame photometry which are approved standard methods for determination of
sodium composition and potassium content in materials for making concrete. Flow
Injection Analysis (FIA) which initially was intended to be incorporated to these
detectors in order to gain various advantages like fast and convenient operation and
high degrees of automation was also unavailable. In spite of this limitation, alternative
methods used included slump test to monitor workability and X-Ray fluorescence
spectrometer to determine the chemical composition.
11
CHAPTER TWO
2 LITERATURE REVIEW
2.1 Introduction
This chapter involves the theories upon which this research is based as well as the
empirical review of existing related research that has already been carried out in this
field of concrete production. It is organized starting with theoretical literature followed
by empirical literature review. A critique of existing literature is also presented and the
research gap identified to warrant the contribution of this research study to knowledge.
In a nutshell, this chapter gives an orientation to the research problem by referencing
to previous concepts/theories and researches related to this particular area of study.
2.2 Theoretical Review
2.2.1 Concrete
Concrete is a manmade construction material that looks like stone. The word
“concrete” is derived from the Latin concretus, meaning “to grow together.” Concrete
is a composite material composed of several ingredients such as coarse granular
material (aggregate) embedded in a hard matrix of material (the cement or binder) that
fills the space among the aggregate particles thereby gluing them together.
Alternatively, one can say that concrete is a composite material that constitutes
essentially of a binding medium in which are embedded particles or fragments of
aggregates either fine or coarse. Concrete is a composite material composed of gravels
or crushed stones (coarse aggregate), sand (fine aggregate) and hydrated cement or
binder (Neville et al, 1995).
12
A variety of new materials in the field of concrete technology have been developed
during the recent past with the ongoing demand of construction industries to meet the
functional, strength, economical and durability requirements. Concrete is the most
widely used material in the world. It contributes an important fraction in the
infrastructure and private buildings construction industry. Concrete can be named in
different ways depending on the various kinds of binding material used. For example,
if a concrete made of hydraulic cement, it is called hydraulic cement concrete; if a
concrete in made with non-hydraulic cement, it is called non-hydraulic cement
concrete; if a concrete is made of asphalt, it is called asphalt concrete; if a concrete is
made of polymer, it is called polymer concrete. The similarity is that both non-
hydraulic and hydraulic cement require water to mix in and react during their hydration
process. However, their individual ability to gain strength in water forms the main
difference between the two types of cement. Non-hydraulic cement cannot gain
strength in water, while hydraulic cement does (Li, 2011).
Fresh concrete mix should be consistent in such manner that it can be compacted easily
by the desired manner without excessive effort, this’ a property broadly referred to as
workability. Workability as defined by Japanese Association of Concrete Engineers is
that property of concrete or mortar that determines the ease and homogeneity with
which it can be mixed, placed and compacted due to its consistency, the homogeneity
with which it can be made into concrete, and the degree with which it can resist
separation of materials. Workability of fresh concrete is dependent on concrete
properties especially the water to cement ratio. Excessively dry mixes have low
workability hence difficult to compact and this may lead to poorly compacted concrete
13
results in presence of voids which greatly reduces its strength. The workability of fresh
concrete can be determined by a simple, inexpensive and relatively accurate test
referred to as the slump test which is fully described in BS 1881:102:2011.
The primary requirement of concrete in its hardened state is satisfactory compressive
strength and durability. The strength of concrete is often considered its most important
property and is used as a basis to determine the quality of concrete. This is vital since
it is the element ultimately considered in structural design. Test for compressive
strength is done by crushing cast concrete cubes made according to specifications
contained in BS 1881:115:2011. The strength of concrete is greatly influenced by two
factors namely the water/cement ratio and the degree of compaction (Odero, 2015).
2.2.2 Classification of Concrete
(a) Classification in accordance with unit weight
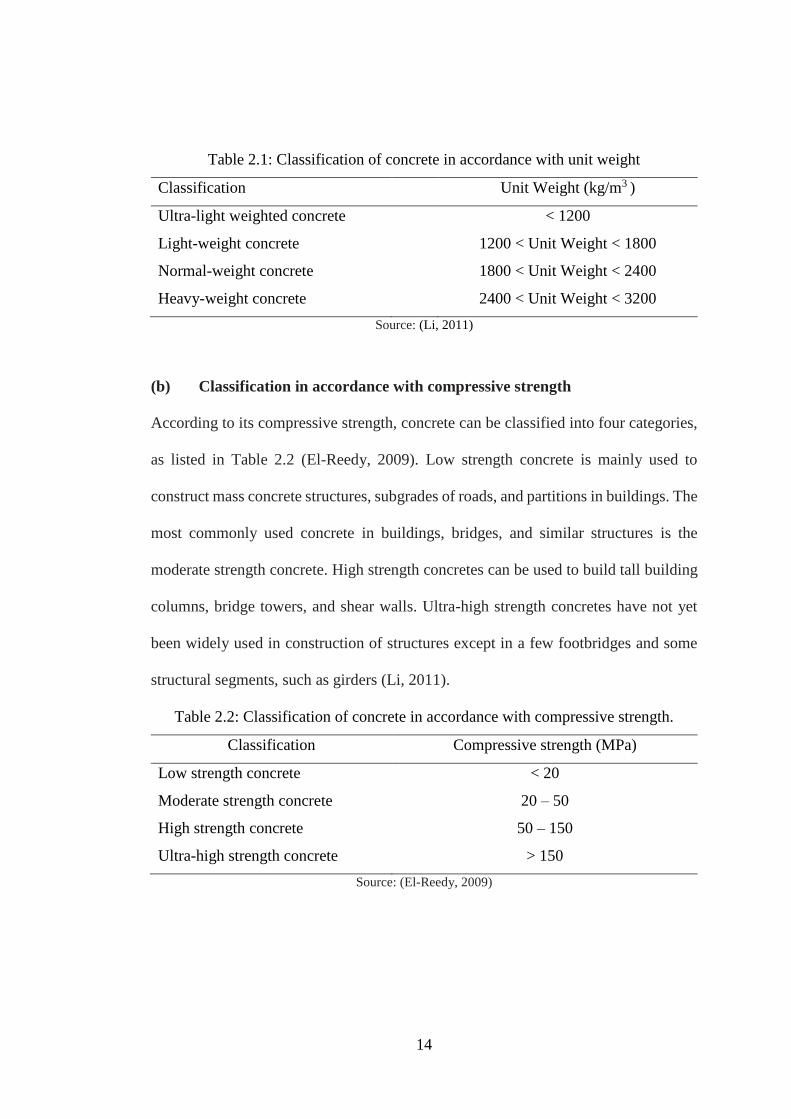
According to the unit weight of concretes, they can be classified into four categories,
as shown in Table 2.1. Ultra-lightweight concrete is only appropriate for use in
building non-structural members. Lightweight concrete can be used to build both non-
structural and structural members, depending on its specified composition. The
commonly used concretes in the construction of infrastructures and buildings is
Normal-weight concretes. In building some special structures, such as hospital
examination rooms, laboratories, and nuclear plant, where radioactive protection is
needed to minimize its influence on people’s health, heavyweight concrete is
considered most appropriate for use (Li, 2011).
14
Table 2.1: Classification of concrete in accordance with unit weight
Classification Unit Weight (kg/m3 )
Ultra-light weighted concrete < 1200
Light-weight concrete 1200 < Unit Weight < 1800
Normal-weight concrete 1800 < Unit Weight < 2400
Heavy-weight concrete 2400 < Unit Weight < 3200
Source: (Li, 2011)
(b) Classification in accordance with compressive strength
According to its compressive strength, concrete can be classified into four categories,
as listed in Table 2.2 (El-Reedy, 2009). Low strength concrete is mainly used to
construct mass concrete structures, subgrades of roads, and partitions in buildings. The
most commonly used concrete in buildings, bridges, and similar structures is the
moderate strength concrete. High strength concretes can be used to build tall building
columns, bridge towers, and shear walls. Ultra-high strength concretes have not yet
been widely used in construction of structures except in a few footbridges and some
structural segments, such as girders (Li, 2011).
Table 2.2: Classification of concrete in accordance with compressive strength.
Classification Compressive strength (MPa)
Low strength concrete < 20
Moderate strength concrete 20 – 50
High strength concrete 50 – 150
Ultra-high strength concrete > 150
Source: (El-Reedy, 2009)

15
(c) Classification in accordance with additives
According to the materials other than cement, aggregate and water that are added into
concrete mixtures as additives, concretes can be classified into different categories.
Four examples are shown in Table 2.3. Concrete which incorporates fibres is referred
to as Fibre-Reinforced Concrete (FRC).
Table 2.3: Concrete classifications in accordance with additives
Classification Additives
Micro defect free Polymers
Fibre-reinforced concrete Different fibres
Densified with small particles concrete Large amount silica fume
Polymer concrete Polymers
Source: (Li, 2011)
Many different fibres have been used to produce fibre-reinforced concrete, including
steel, glass, polymeric, and carbon. The purpose of incorporating fibres into concrete
includes toughness enhancement, tension property improvement, shrinkage control,
and decoration (Neville et al., 1995). Macro defect free (MDF) is a cement based
composite that incorporates a large amount of water-soluble polymer which is
produced in a twin-roll mixing process. This was developed to enhance the flexural
and tensile properties of concrete. Concrete that has been densified with small particles
(DSP) has incorporated a large amount of silica fume, a mineral admixture with very
small particles. DSP has excellent abrasion resistance and is mainly used to produce
machine tools and industrial moulds. There are three methods which have been
developed to incorporate polymers into concrete. These include using the polymer as
a binder, using the polymer as an admixture in ordinary Portland concrete and
impregnating the polymer into normal Portland cement concrete members (Li, 2011).
16
2.2.3 Constituent Materials for Making Concrete
Concrete is one of the most versatile and widely produced construction materials
worldwide. Its worldwide annual production exceeds 4 million metric tons, with more
than two metric tons of concrete was produced each year for every person on earth in
2007. The increasing demand for infrastructure development and hence concrete
materials is being driven by the ever increasing population, living standards, and
economic development. As a composite material, concrete is composed of different
graded aggregates or fillers embedded in a hardened matrix of cementitious material.
The properties of major constituents of concrete mixtures, such as aggregates,
cementitious materials, admixtures, and water, should be understood first to better
learn the properties and performance of concrete (Neville et al., 1995).
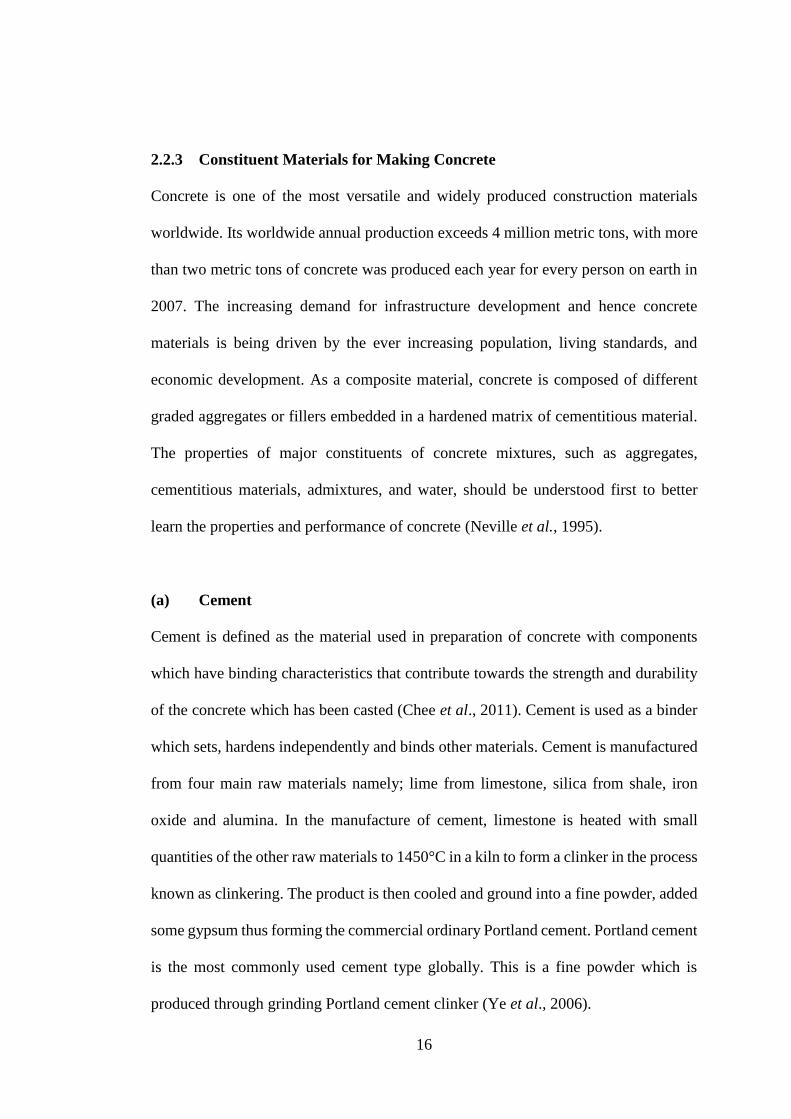
(a) Cement
Cement is defined as the material used in preparation of concrete with components
which have binding characteristics that contribute towards the strength and durability
of the concrete which has been casted (Chee et al., 2011). Cement is used as a binder
which sets, hardens independently and binds other materials. Cement is manufactured
from four main raw materials namely; lime from limestone, silica from shale, iron
oxide and alumina. In the manufacture of cement, limestone is heated with small
quantities of the other raw materials to 1450°C in a kiln to form a clinker in the process
known as clinkering. The product is then cooled and ground into a fine powder, added
some gypsum thus forming the commercial ordinary Portland cement. Portland cement
is the most commonly used cement type globally. This is a fine powder which is
produced through grinding Portland cement clinker (Ye et al., 2006).
17
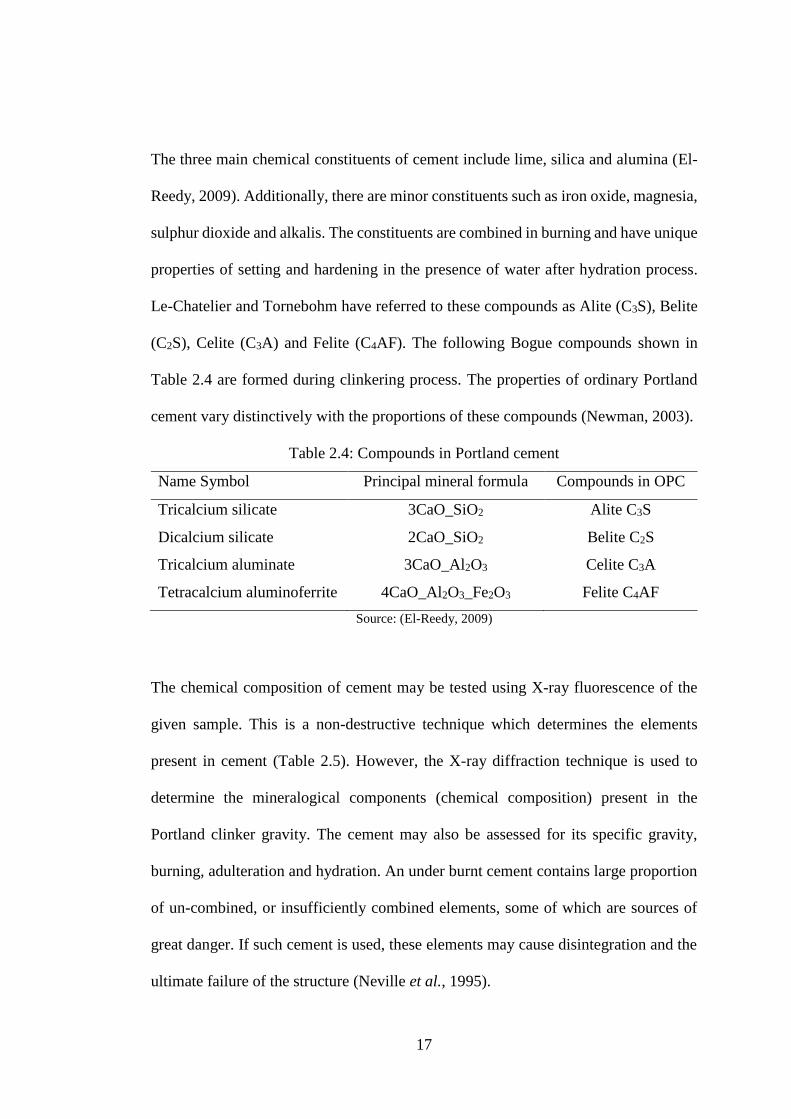
The three main chemical constituents of cement include lime, silica and alumina (El-
Reedy, 2009). Additionally, there are minor constituents such as iron oxide, magnesia,
sulphur dioxide and alkalis. The constituents are combined in burning and have unique
properties of setting and hardening in the presence of water after hydration process.
Le-Chatelier and Tornebohm have referred to these compounds as Alite (C3S), Belite
(C2S), Celite (C3A) and Felite (C4AF). The following Bogue compounds shown in
Table 2.4 are formed during clinkering process. The properties of ordinary Portland
cement vary distinctively with the proportions of these compounds (Newman, 2003).
Table 2.4: Compounds in Portland cement
Name Symbol Principal mineral formula Compounds in OPC
Tricalcium silicate 3CaO_SiO2 Alite C3S
Dicalcium silicate 2CaO_SiO2 Belite C2S
Tricalcium aluminate 3CaO_Al2O3 Celite C3A
Tetracalcium aluminoferrite 4CaO_Al2O3_Fe2O3 Felite C4AF
Source: (El-Reedy, 2009)
The chemical composition of cement may be tested using X-ray fluorescence of the
given sample. This is a non-destructive technique which determines the elements
present in cement (Table 2.5). However, the X-ray diffraction technique is used to
determine the mineralogical components (chemical composition) present in the
Portland clinker gravity. The cement may also be assessed for its specific gravity,
burning, adulteration and hydration. An under burnt cement contains large proportion
of un-combined, or insufficiently combined elements, some of which are sources of
great danger. If such cement is used, these elements may cause disintegration and the
ultimate failure of the structure (Neville et al., 1995).
18
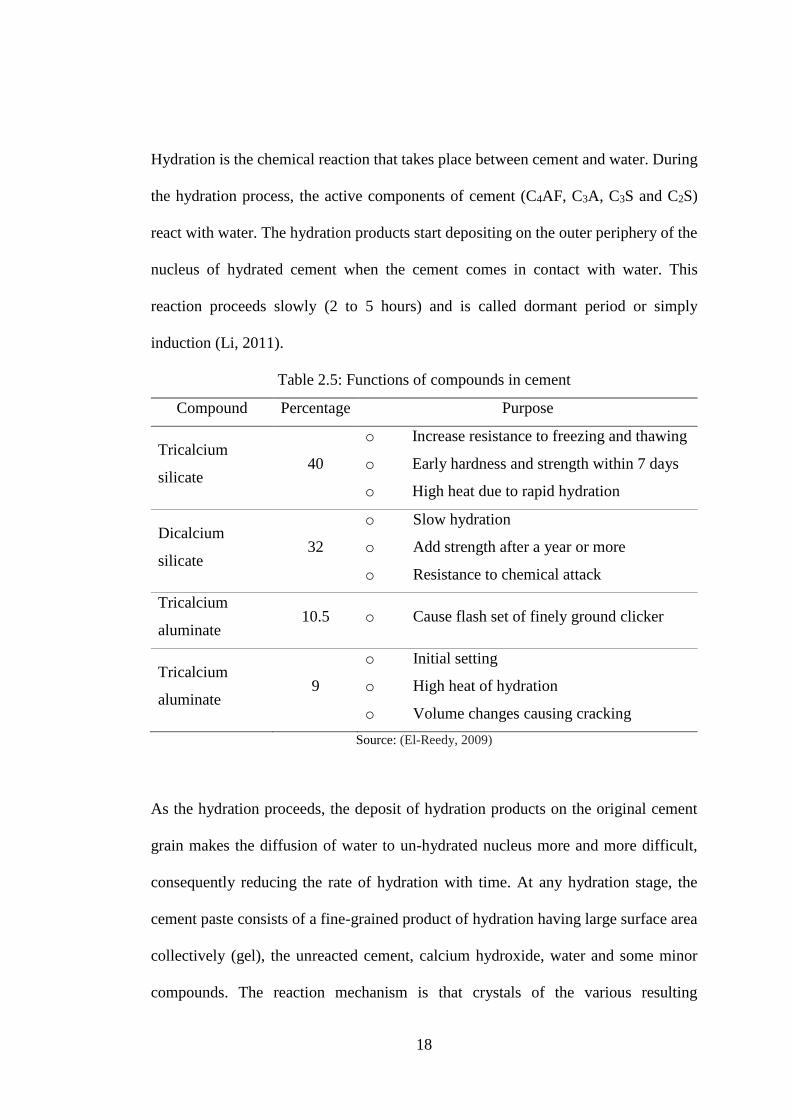
Hydration is the chemical reaction that takes place between cement and water. During
the hydration process, the active components of cement (C4AF, C3A, C3S and C2S)
react with water. The hydration products start depositing on the outer periphery of the
nucleus of hydrated cement when the cement comes in contact with water. This
reaction proceeds slowly (2 to 5 hours) and is called dormant period or simply
induction (Li, 2011).
Table 2.5: Functions of compounds in cement
Compound Percentage Purpose
Tricalcium
silicate 40
o Increase resistance to freezing and thawing
o Early hardness and strength within 7 days
o High heat due to rapid hydration
Dicalcium
silicate 32
o Slow hydration
o Add strength after a year or more
o Resistance to chemical attack
Tricalcium
aluminate 10.5 o Cause flash set of finely ground clicker
Tricalcium
aluminate 9
o Initial setting
o High heat of hydration
o Volume changes causing cracking
Source: (El-Reedy, 2009)
As the hydration proceeds, the deposit of hydration products on the original cement
grain makes the diffusion of water to un-hydrated nucleus more and more difficult,
consequently reducing the rate of hydration with time. At any hydration stage, the
cement paste consists of a fine-grained product of hydration having large surface area
collectively (gel), the unreacted cement, calcium hydroxide, water and some minor
compounds. The reaction mechanism is that crystals of the various resulting
19
compounds gradually fill the space originally occupied by water, resulting in the
stiffening of the mass and subsequent development of the strength (El-Reedy, 2009).
(b) Aggregates
The skeleton of concrete is constituted by aggregates since approximately three
quarters of the overall volume of conventional concrete is occupied by aggregate. It is
therefore inevitable that a constituent occupying such a large percentage of the mass
should contribute important properties to both the fresh and hardened product.
Aggregate is considered as an inert dispersion in the cement paste. However, strictly
speaking, aggregate is not truly inert because physical, thermal, and chemical
properties can influence the performance of concrete (Neville et al., 1995).
Aggregates can be divided into several categories according to different criteria, such
as size, source, and unit weight. In accordance with size, aggregates predominately
retained on a No. 4 (4.75mm) sieve are classified as coarse aggregate. In general,
coarse aggregate ranges from 5 to 150mm in size. For normal concrete used for
structural members such as columns and beams, the maximum size of coarse aggregate
is usually about 25mm whilst mass concrete used for dams or deep foundations
constitute of maximum size of 150 mm as largest size. Fine aggregates are classified
as those aggregates passing through BS test sieve 4.75mm and predominately retained
on BS test sieve 75 μm for instance river sand which is the most commonly used fine
aggregate. In addition, crushed rock fines is also used as fine aggregate in spite of the
differences in the finishing surfaces for instance the finish of concrete with crushed
rock fines is not as good as that with river sand (Ye et al., 2006).
20
Natural aggregates such as sand and gravel is usually taken from natural deposits
without changing the nature during production. Manufactured (synthetic) aggregates
are man-made materials, resulting from industrial products or by-products. Blast
furnace slag and lightweight aggregate are some of such examples. The unit weight of
ultra-lightweight aggregate is less than 500 kg/m3, including foam plastic and
expanded perlite. Depending on the volume fraction of aggregate, the bulk density of
concrete made from ultra-lightweight aggregates ranges from 800 to 1100 kg/m3. Such
a concrete can be used only as non-structural members, like partition walls. The unit
weight of light-weight aggregates is between 500 and 1120 kg/m3. Examples include
cinder, blast furnace slag, volcanic pumice, and expanded clay. The concrete
constituting lightweight aggregate has a bulk density between 1200 and 1800 kg/m3.
Such concrete can be either a structural member or non-structural member, depending
what type of aggregate is used. Sand, gravel, and crushed rock belong to the category
of aggregate with a unit weight of 1520–1680 kg/m3 classified as normal-weight
aggregate and are most widely used. Concrete made with normal-weight aggregate of
aggregate has a bulk density of 2300–2400 kg/m3. It is the main type of concrete used
to produce critical structural members. If the unit weight of aggregate is greater than
2100 kg/m3, it is classified as heavy-weight aggregate. Materials used include iron ore,
magnesite limonite and crashed steel pieces among others. The bulk density of the
corresponding concrete is consequently greater than 3200 kg/m3 and can reach 4000
kg/m3 (Li, 2011).
21
(c) Water
Water is such an important constituent of concrete, and a properly designed concrete
mixture, typically with approximately 15 to 25% water by volume, possess the desired
workability for fresh concrete and the required durability and strength for hardened
concrete. The primary role of water is for hydration and workability. The total amount
of water in concrete and the water-to-cement ratio is one of the most critical factors in
the production of quality concrete. Too much water reduces concrete strength, while
too little makes the concrete unworkable thereby calling for a balance in the amount
of water required for mixing concrete. Because concrete must be both strong and
workable, a careful selection of the cement-to-water ratio and total amount of water
are required when producing concrete. Water can exist in a solid form as ice, a liquid
form as water, or a gaseous form as vapour. Mixing water is the free water encountered
in freshly mixed concrete. It has three main functions: it acts as a lubricant,
contributing to the workability of the fresh mixture; it reacts with the cement powder,
thus producing hydration products; and finally, it secures the necessary space in the
paste for the development of hydration products. Because of this obvious reason, the
amount of water added for adequate workability is always greater than that needed for
complete hydration of the cement in practice (Neville et al., 1995).
Unlike other raw materials, the supply of raw water varies significantly in quality, both
geographically and from season to season for instance water derived from an upland
surface source usually has a low content of dissolved solids and is relatively soft with
a high concentration of organic contamination, much of it being colloidal. By contrast,
underground water sources generally have a high content of dissolved solids and a high
22
hardness level but a low organic content. There is a simple rule concerning the
acceptability of mixing water: if water is potable, that is, fit for human consumption,
with the exception of certain mineral waters and water containing sugar, it is also
suitable for concrete making. In other words, if water does not have any particular
taste, odour, or colour, and does not fizz or foam when shaken, then there is no reason
to assume that such water will hurt the concrete when used properly as mixing water
(Bungey et al., 1995).
2.2.4 Desirable Properties of Concrete
(a) Characteristic material strength
The strengths of materials upon which a design is based, normally, those strengths
below which results are unlikely to fall are called ‘characteristic’ strength. The
assumption is that for a given material, the distribution of strength is approximately
‘normally distributed’, so that a frequency distribution curve of a large number of
sample results would be of the form shown in Figure 2.1. The characteristic strength,
fk is taken as that value below which it is unlikely that more than 5% of the results will
fall as expressed by Equation (2.1). In the equation, fm is mean strength given by
Equation (2.2); is standard deviation and is a measure of quality control given by
Equation (2.3) where f is the cube strength, and n is number of cubes tested.
64.1 mk ff (2.1)
n
ffm
(2.2)
2/12)(
n
ff m (2.3)
23
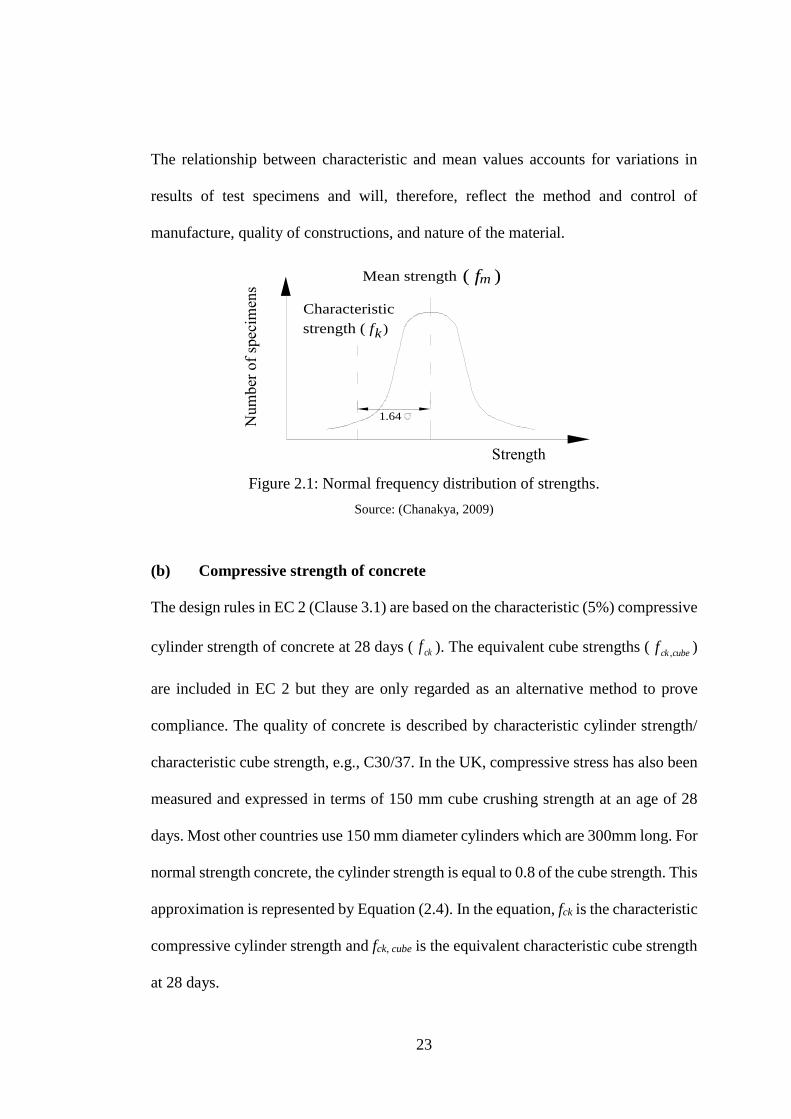
The relationship between characteristic and mean values accounts for variations in
results of test specimens and will, therefore, reflect the method and control of
manufacture, quality of constructions, and nature of the material.
Figure 2.1: Normal frequency distribution of strengths.
Source: (Chanakya, 2009)
(b) Compressive strength of concrete
The design rules in EC 2 (Clause 3.1) are based on the characteristic (5%) compressive
cylinder strength of concrete at 28 days ( ckf ). The equivalent cube strengths ( cubeckf , )
are included in EC 2 but they are only regarded as an alternative method to prove
compliance. The quality of concrete is described by characteristic cylinder strength/
characteristic cube strength, e.g., C30/37. In the UK, compressive stress has also been
measured and expressed in terms of 150 mm cube crushing strength at an age of 28
days. Most other countries use 150 mm diameter cylinders which are 300mm long. For
normal strength concrete, the cylinder strength is equal to 0.8 of the cube strength. This
approximation is represented by Equation (2.4). In the equation, fck is the characteristic
compressive cylinder strength and fck, cube is the equivalent characteristic cube strength
at 28 days.
strength
number oftest specimens
Mean strength ( f )
Characteristic
strength ( f )k
m
1.64
Strength
Num
ber
of
spec
imen
s
24
cubeckck ff ,8.0 (2.4)
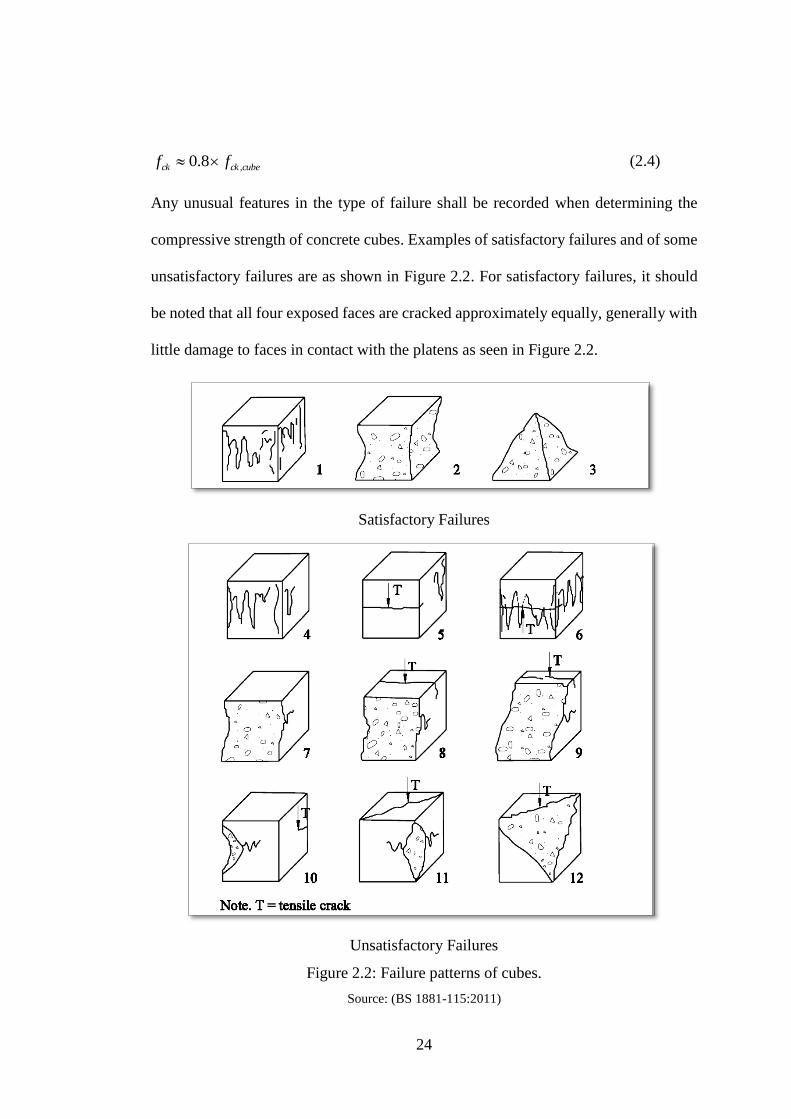
Any unusual features in the type of failure shall be recorded when determining the
compressive strength of concrete cubes. Examples of satisfactory failures and of some
unsatisfactory failures are as shown in Figure 2.2. For satisfactory failures, it should
be noted that all four exposed faces are cracked approximately equally, generally with
little damage to faces in contact with the platens as seen in Figure 2.2.
Satisfactory Failures
Unsatisfactory Failures
Figure 2.2: Failure patterns of cubes.
Source: (BS 1881-115:2011)
25
The cross-sectional area of the cube is calculated from the measured dimensions. The
compressive cube strength of concrete is calculated by dividing the maximum load by
the cross-sectional area, expressed to the nearest 0.1 MPa. The density of the specimen
can be calculated using the measured dimensions or the volume obtained from the
water displacement method.
(c) Splitting tensile strength of concrete
The maximum stress the concrete can withstand when subjected to uniaxial tension
(tensile force applies in one axis) is known as tensile strength of concrete. The mean
tensile strength kctf . of concrete may be derived from Equations (2.5) to (2.7). In the
equations, fctm, fck, fctk 0.05, fctk 0.95 are the mean tensile strength, characteristic
compressive strength, lower characteristic compressive strength at 5% fractile and
upper characteristic compressive strength at 95% fractile, respectively
2)3/2( /3.0 mmNff ckctm (2.5)
2
05.0 /7.0 mmNff ctmctk (2.6)
2
95.0 /3.1 mmNff ctmctk (2.7)
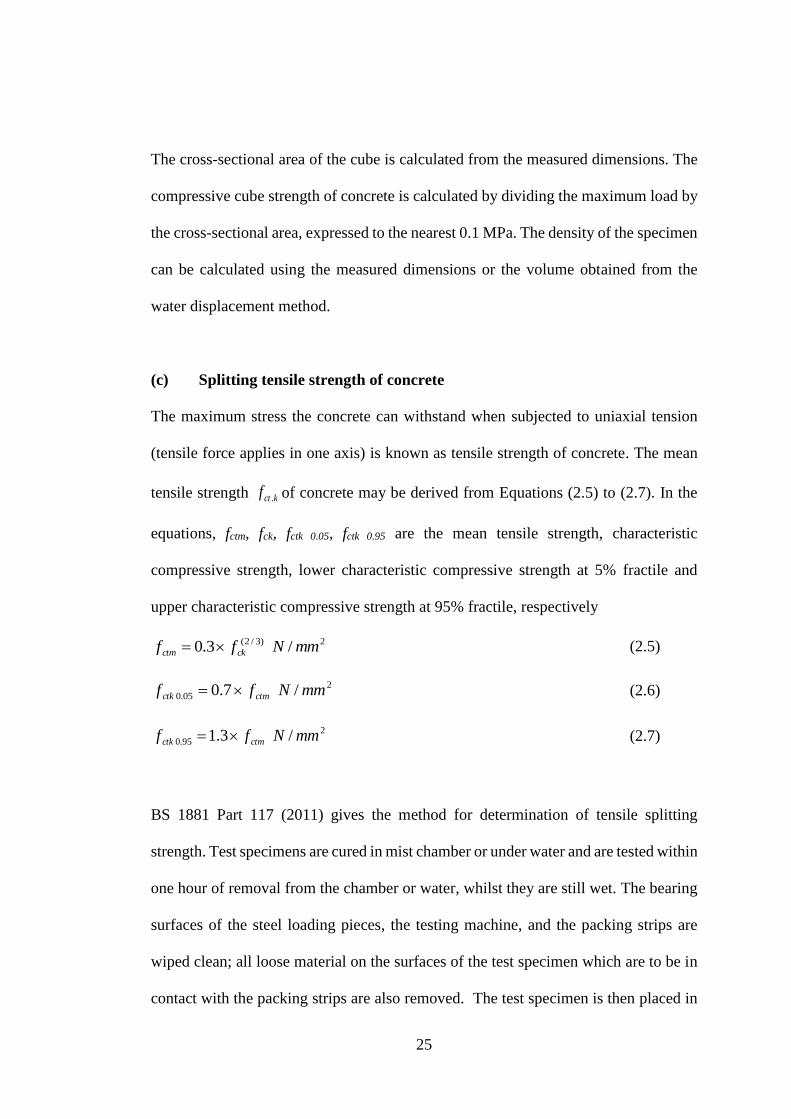
BS 1881 Part 117 (2011) gives the method for determination of tensile splitting
strength. Test specimens are cured in mist chamber or under water and are tested within
one hour of removal from the chamber or water, whilst they are still wet. The bearing
surfaces of the steel loading pieces, the testing machine, and the packing strips are
wiped clean; all loose material on the surfaces of the test specimen which are to be in
contact with the packing strips are also removed. The test specimen is then placed in
26
the centring jig. Packing strips and loading pieces carefully positioned along the top
and bottom of the plane of loading of the specimen. The jig is then placed in the
machine so as to centrally locate the test specimen. The upper platen is parallel to the
lower platen (Figure 2.3).
Figure 2.3: Splitting tensile strength specimen.
Source: (BS 1881-117:2011)
The load is applied steadily and without shock such that the stress is increased at a rate
within the range of 0.04 MPa/s to 0.06 MPa/s. Once adjusted, the rate is maintained at
± 10 % until failure. The maximum load applied to the specimen is recorded. The
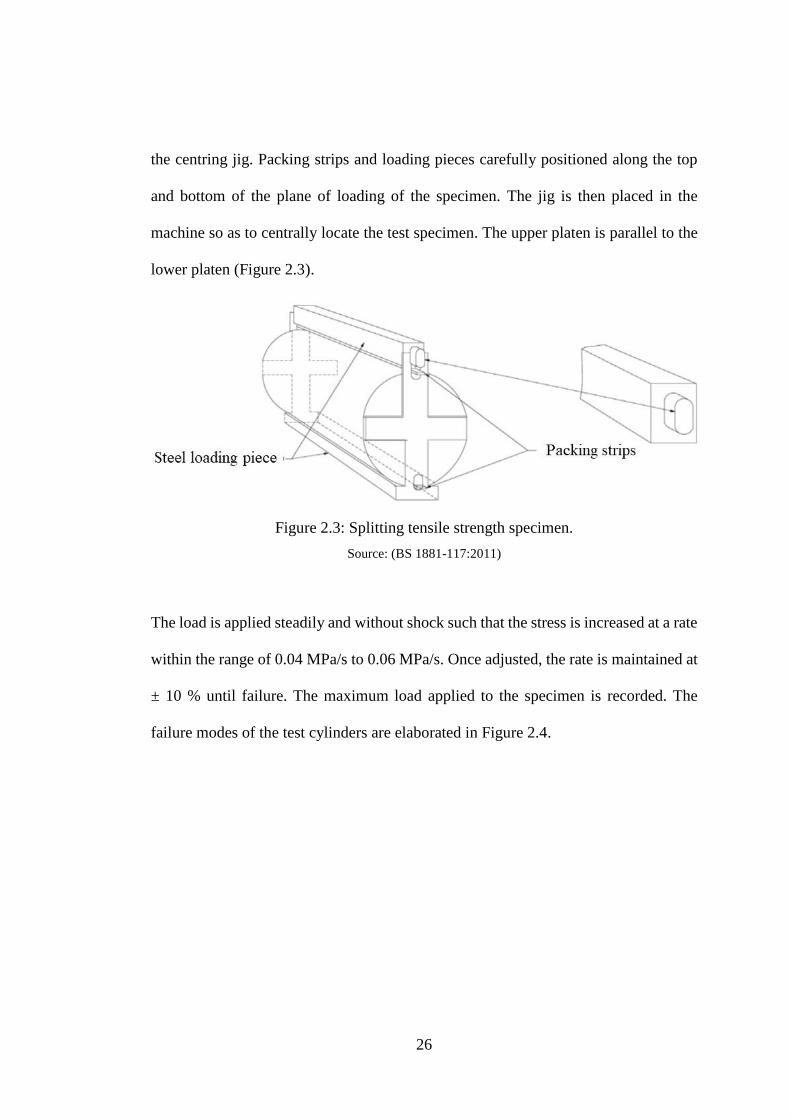
failure modes of the test cylinders are elaborated in Figure 2.4.
27
Satisfactory failure of cylinder specimen
Some unsatisfactory failures of cylinder specimen
Figure 2.4: Failure patterns of cylinders.
Source: (BS 1881-117:2011)
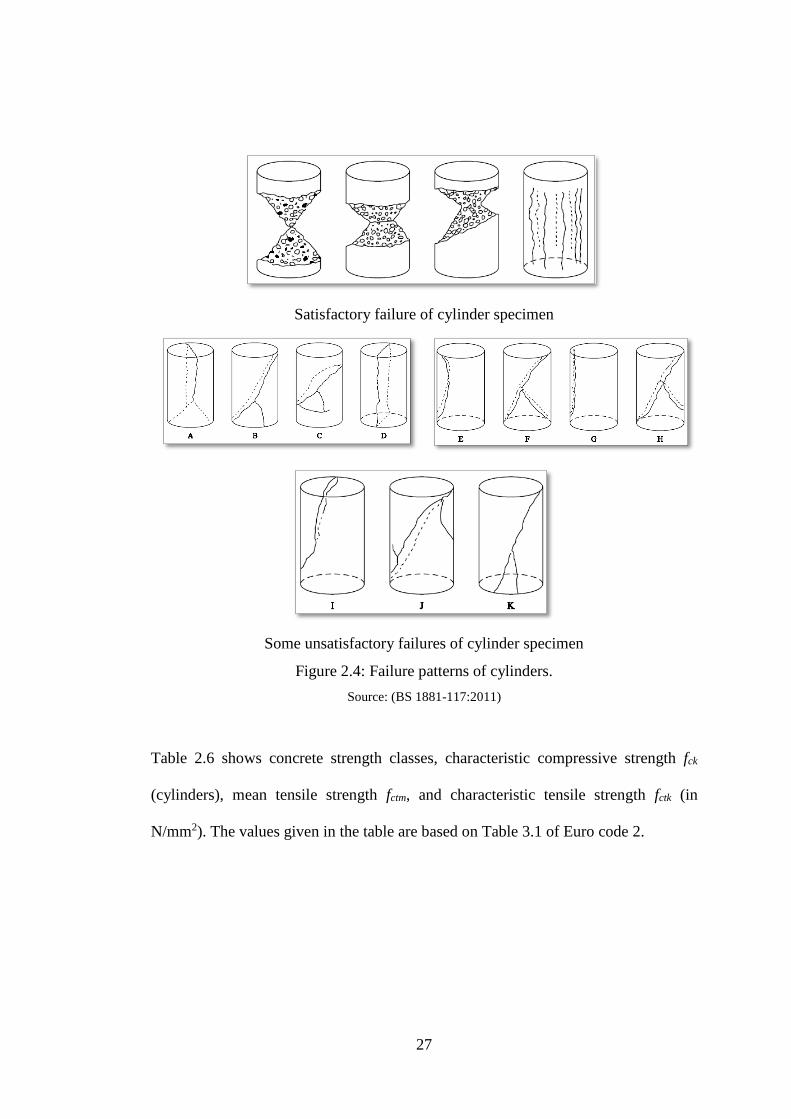
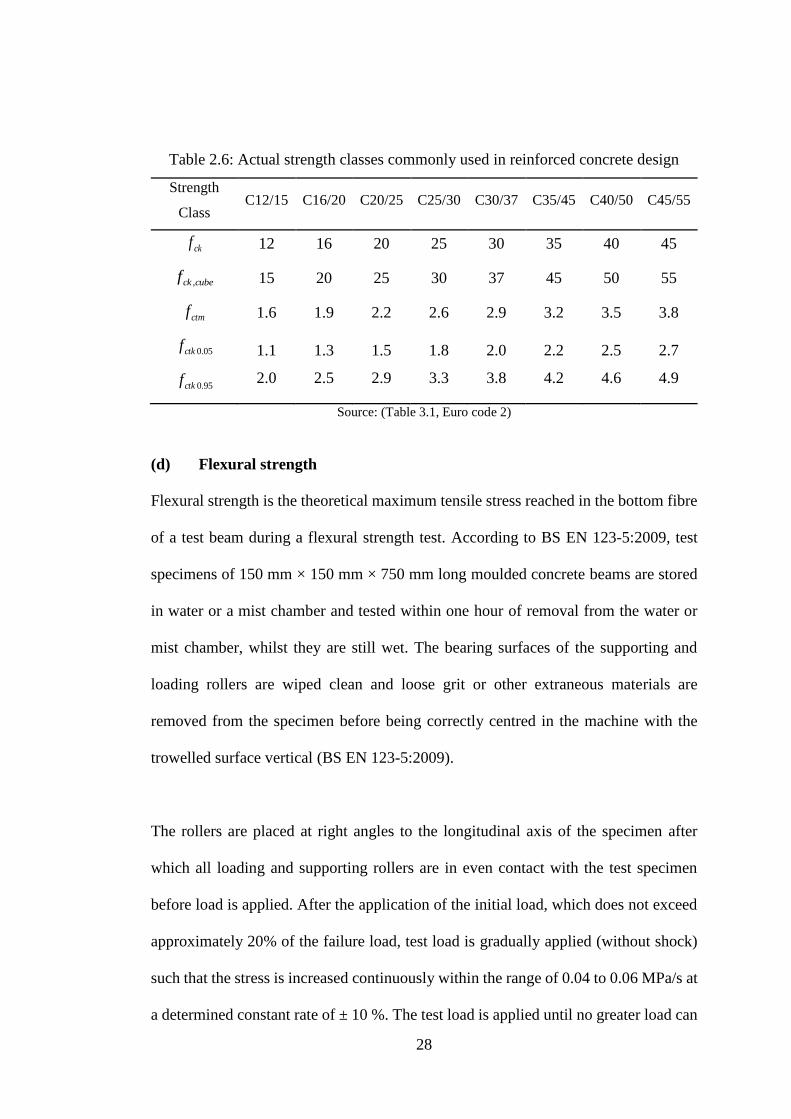
Table 2.6 shows concrete strength classes, characteristic compressive strength fck
(cylinders), mean tensile strength fctm, and characteristic tensile strength fctk (in
N/mm2). The values given in the table are based on Table 3.1 of Euro code 2.
28
Table 2.6: Actual strength classes commonly used in reinforced concrete design
Strength
Class C12/15 C16/20 C20/25 C25/30 C30/37 C35/45 C40/50 C45/55
ckf 12 16 20 25 30 35 40 45
cubeckf , 15 20 25 30 37 45 50 55
ctmf 1.6 1.9 2.2 2.6 2.9 3.2 3.5 3.8
05.0ctkf
95.0ctkf
1.1
2.0
1.3
2.5
1.5
2.9
1.8
3.3
2.0
3.8
2.2
4.2
2.5
4.6
2.7
4.9
Source: (Table 3.1, Euro code 2)
(d) Flexural strength
Flexural strength is the theoretical maximum tensile stress reached in the bottom fibre
of a test beam during a flexural strength test. According to BS EN 123-5:2009, test
specimens of 150 mm × 150 mm × 750 mm long moulded concrete beams are stored
in water or a mist chamber and tested within one hour of removal from the water or
mist chamber, whilst they are still wet. The bearing surfaces of the supporting and
loading rollers are wiped clean and loose grit or other extraneous materials are
removed from the specimen before being correctly centred in the machine with the
trowelled surface vertical (BS EN 123-5:2009).
The rollers are placed at right angles to the longitudinal axis of the specimen after
which all loading and supporting rollers are in even contact with the test specimen
before load is applied. After the application of the initial load, which does not exceed
approximately 20% of the failure load, test load is gradually applied (without shock)
such that the stress is increased continuously within the range of 0.04 to 0.06 MPa/s at
a determined constant rate of ± 10 %. The test load is applied until no greater load can
29
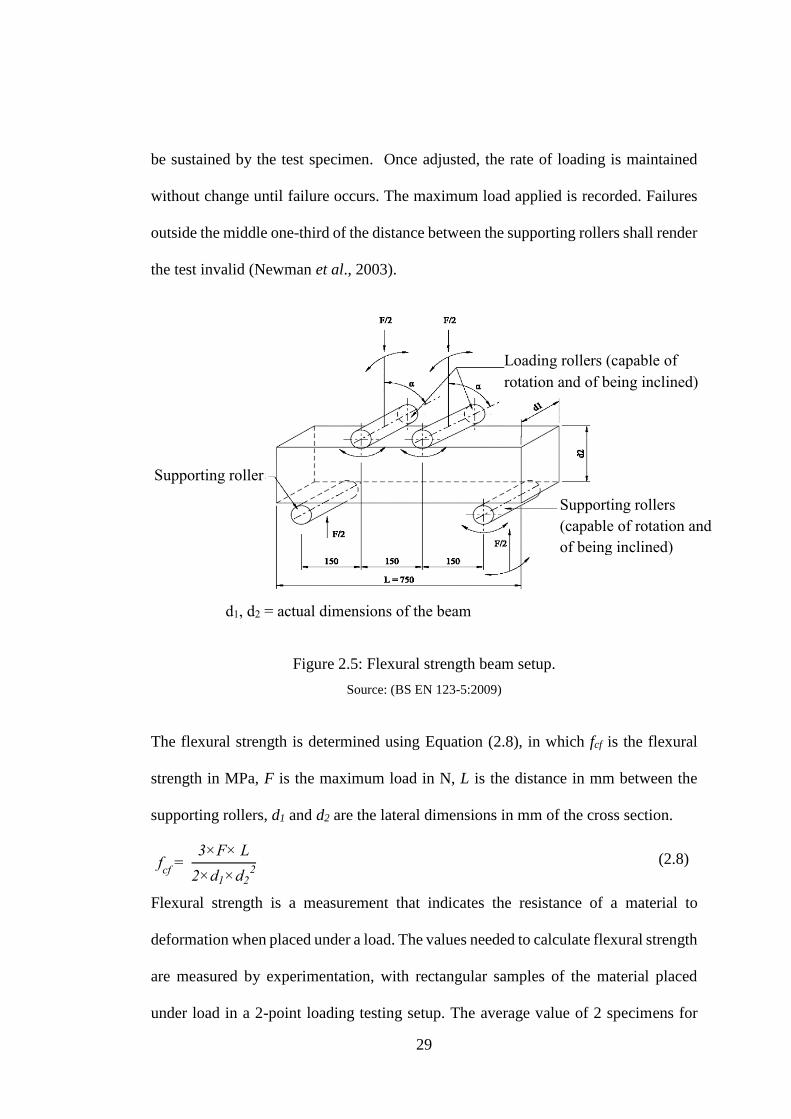
be sustained by the test specimen. Once adjusted, the rate of loading is maintained
without change until failure occurs. The maximum load applied is recorded. Failures
outside the middle one-third of the distance between the supporting rollers shall render
the test invalid (Newman et al., 2003).
Figure 2.5: Flexural strength beam setup.
Source: (BS EN 123-5:2009)
The flexural strength is determined using Equation (2.8), in which fcf is the flexural
strength in MPa, F is the maximum load in N, L is the distance in mm between the
supporting rollers, d1 and d2 are the lateral dimensions in mm of the cross section.
fcf
= 3×F× L
2×d1×d22 (2.8)
Flexural strength is a measurement that indicates the resistance of a material to
deformation when placed under a load. The values needed to calculate flexural strength
are measured by experimentation, with rectangular samples of the material placed
under load in a 2-point loading testing setup. The average value of 2 specimens for
Loading rollers (capable of
rotation and of being inclined)
Supporting rollers
(capable of rotation and
of being inclined)
Supporting roller
d1, d2 = actual dimensions of the beam
30
each category at the age of 7 days, 14 days and 28 days are determined accordingly
(Sivaprakash et al., 2016).
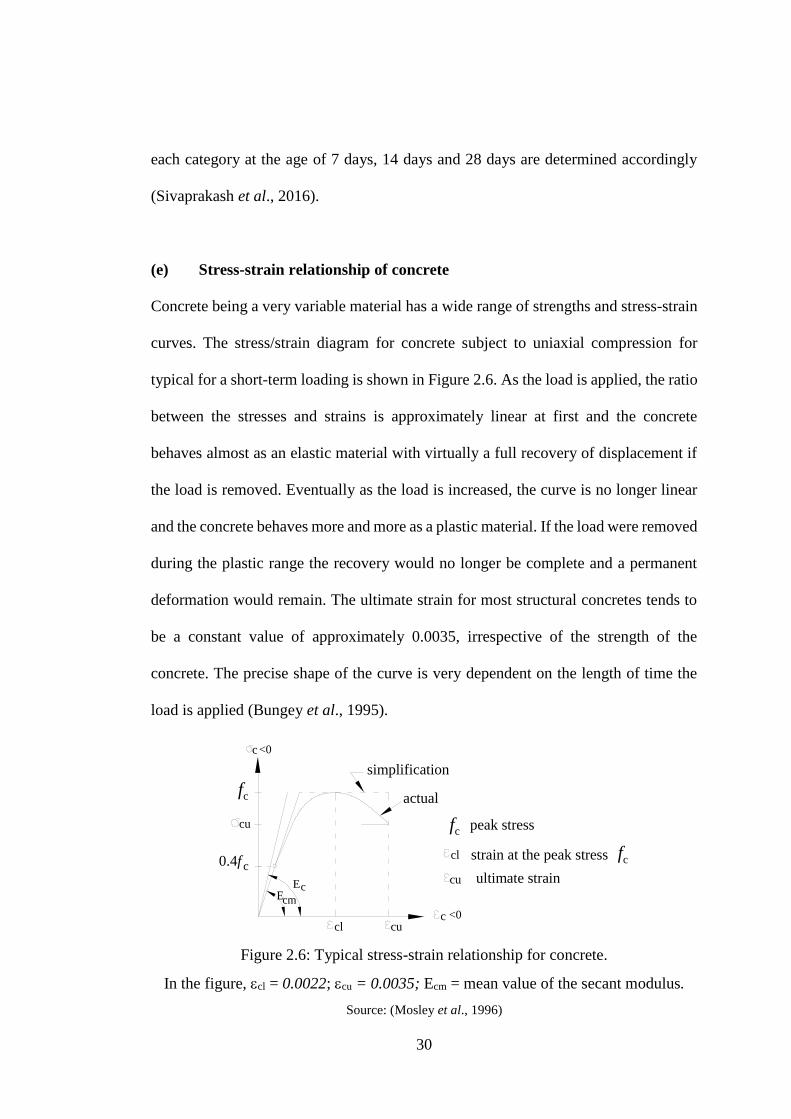
(e) Stress-strain relationship of concrete
Concrete being a very variable material has a wide range of strengths and stress-strain
curves. The stress/strain diagram for concrete subject to uniaxial compression for
typical for a short-term loading is shown in Figure 2.6. As the load is applied, the ratio
between the stresses and strains is approximately linear at first and the concrete
behaves almost as an elastic material with virtually a full recovery of displacement if
the load is removed. Eventually as the load is increased, the curve is no longer linear
and the concrete behaves more and more as a plastic material. If the load were removed
during the plastic range the recovery would no longer be complete and a permanent
deformation would remain. The ultimate strain for most structural concretes tends to
be a constant value of approximately 0.0035, irrespective of the strength of the
concrete. The precise shape of the curve is very dependent on the length of time the
load is applied (Bungey et al., 1995).
Figure 2.6: Typical stress-strain relationship for concrete.
In the figure, cl = 0.0022; cu = 0.0035; Ecm = mean value of the secant modulus.
Source: (Mosley et al., 1996)
cuc <0
c<0
fc
cu
0.4f c
cl
fcpeak stress
strain at the peak stress
ultimate stress
fccl
cuEcEcm
simplification
actual
ultimate strain
31
(f) Modulus of Elasticity
The modulus of elasticity depends on the strength class of concrete, properties of
aggregates used and the mean value of the secant modulus Ecm for a particular class is
shown in Table 2.7, as obtained from Table 3.2 of Euro code 2.
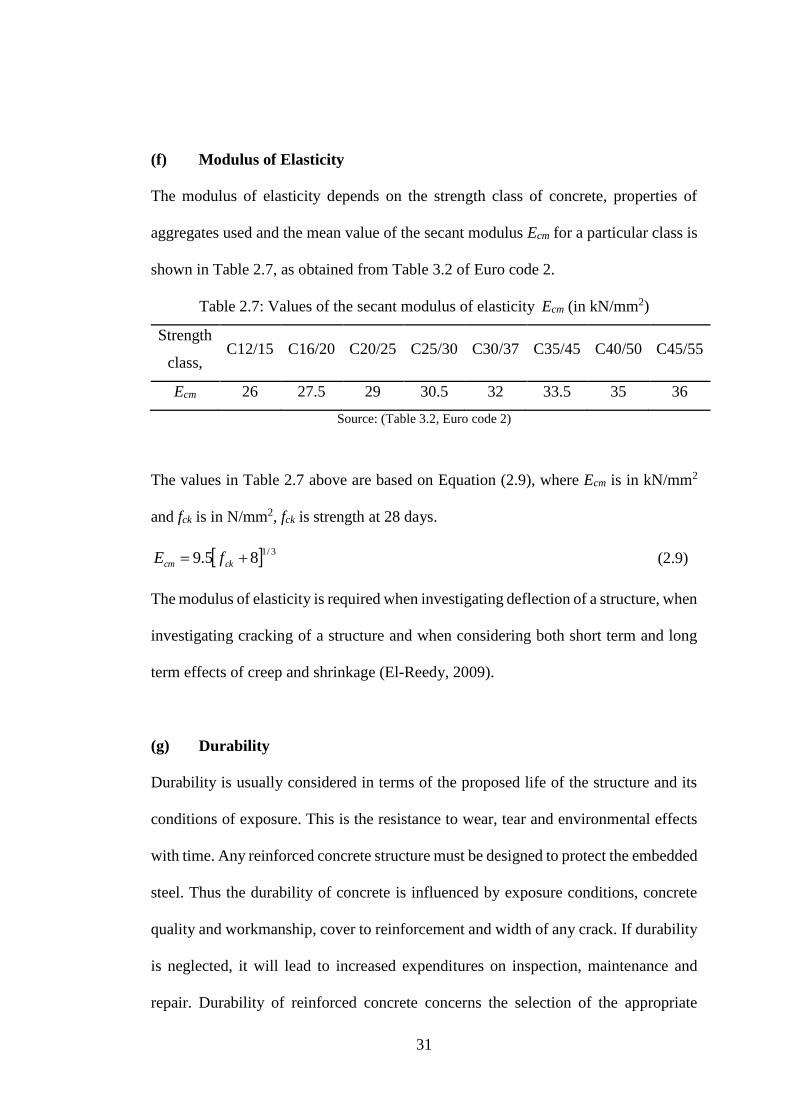
Table 2.7: Values of the secant modulus of elasticity Ecm (in kN/mm2)
Strength
class, C12/15 C16/20 C20/25 C25/30 C30/37 C35/45 C40/50 C45/55
Ecm 26 27.5 29 30.5 32 33.5 35 36
Source: (Table 3.2, Euro code 2)
The values in Table 2.7 above are based on Equation (2.9), where Ecm is in kN/mm2
and fck is in N/mm2, fck is strength at 28 days.
3/185.9 ckcm fE (2.9)
The modulus of elasticity is required when investigating deflection of a structure, when
investigating cracking of a structure and when considering both short term and long
term effects of creep and shrinkage (El-Reedy, 2009).
(g) Durability
Durability is usually considered in terms of the proposed life of the structure and its
conditions of exposure. This is the resistance to wear, tear and environmental effects
with time. Any reinforced concrete structure must be designed to protect the embedded
steel. Thus the durability of concrete is influenced by exposure conditions, concrete
quality and workmanship, cover to reinforcement and width of any crack. If durability
is neglected, it will lead to increased expenditures on inspection, maintenance and
repair. Durability of reinforced concrete concerns the selection of the appropriate
32
concrete grade and cover, for the conditions of environmental exposure and protection
of reinforcement against a rapid rise in temperature and resultant loss of strength
(Chanakya, 2009).
2.2.5 Waste Ceramic and Porcelain Clay Tile Powder
Ceramics are inorganic and non-metallic solids which can be highly crystalline, semi
crystalline, vitrified or completely amorphous. The most commonly used ceramics are
brick, glass and porcelain. Ceramics are grouped into two main groups which include
the crystalline ceramics and the non-crystalline ceramics. The crystalline ceramics are
found to be non-submissive to the wide range of processing and hence the crystalline
ceramic is prepared in a desired shape either by forming powders in the desired shape
and then heating it until it becomes a solid mass or by reaction on site.
On the other hand, non-crystalline ceramics are made from melts and in this process,
the shape of the glass is formed either when it is in a toffee like viscosity or on a molten
state. Ceramic waste is available in large quantities especially from large ceramic
factories, ceramic product manufacturing units and also from everyday construction
activities. Traditional ceramics which include bricks, roof and floor tiles, other
construction materials, and technical ceramics like porcelain possess wide
compositional range of the natural clays used as raw materials and this makes them
highly heterogeneous (Sivaprakash et al., 2016).
There are two most common tiles available in Uganda; ceramic and porcelain tiles.
The differences between ceramic and porcelain tile lies in the fact that both are made
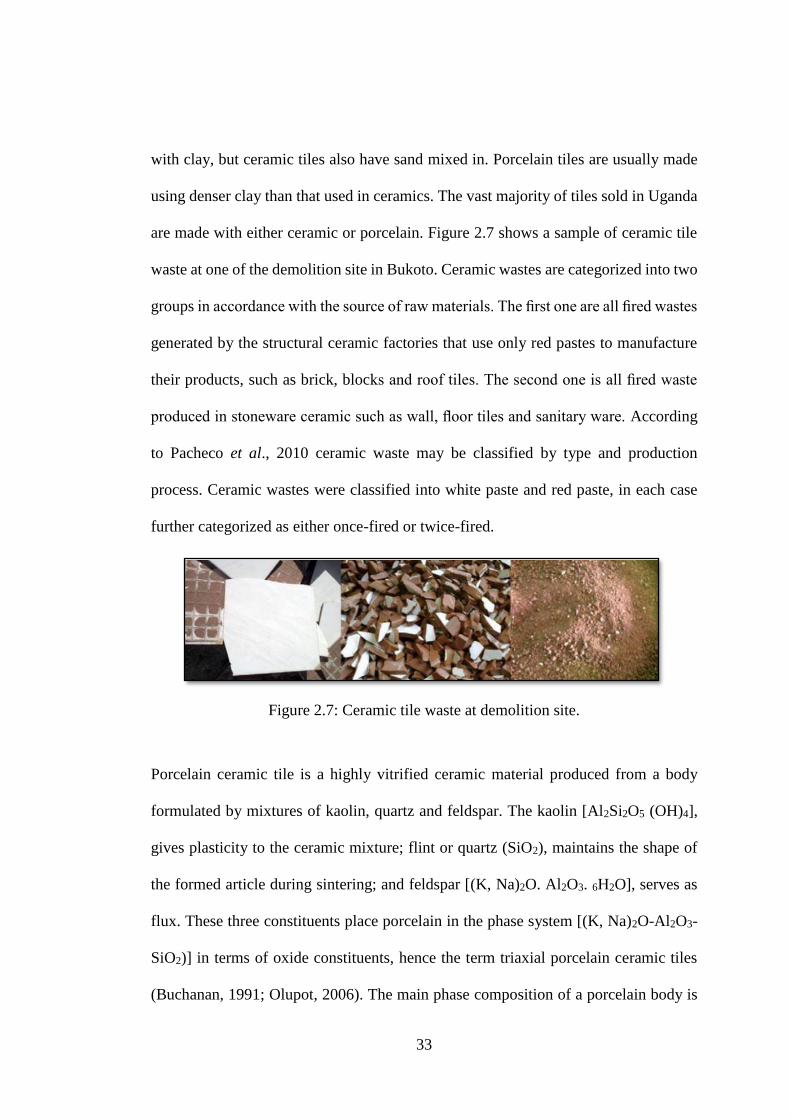
33
with clay, but ceramic tiles also have sand mixed in. Porcelain tiles are usually made
using denser clay than that used in ceramics. The vast majority of tiles sold in Uganda
are made with either ceramic or porcelain. Figure 2.7 shows a sample of ceramic tile
waste at one of the demolition site in Bukoto. Ceramic wastes are categorized into two
groups in accordance with the source of raw materials. The first one are all fired wastes
generated by the structural ceramic factories that use only red pastes to manufacture
their products, such as brick, blocks and roof tiles. The second one is all fired waste
produced in stoneware ceramic such as wall, floor tiles and sanitary ware. According
to Pacheco et al., 2010 ceramic waste may be classified by type and production
process. Ceramic wastes were classified into white paste and red paste, in each case
further categorized as either once-fired or twice-fired.
Figure 2.7: Ceramic tile waste at demolition site.
Porcelain ceramic tile is a highly vitrified ceramic material produced from a body
formulated by mixtures of kaolin, quartz and feldspar. The kaolin [Al2Si2O5 (OH)4],
gives plasticity to the ceramic mixture; flint or quartz (SiO2), maintains the shape of
the formed article during sintering; and feldspar [(K, Na)2O. Al2O3. 6H2O], serves as
flux. These three constituents place porcelain in the phase system [(K, Na)2O-Al2O3-
SiO2)] in terms of oxide constituents, hence the term triaxial porcelain ceramic tiles
(Buchanan, 1991; Olupot, 2006). The main phase composition of a porcelain body is
34
characterized by a heterogeneous glassy matrix composition and needle shaped mullite
crystals interlocking together with some quartz grains and closed irregular shaped
pores. The crystals of mullite are endowed together with excellent mechanical, thermal
and chemical properties. Processing routes and the kinetics of the firing process,
porcelains represent some of the most complicated ceramic systems reason being the
complex interplay between raw materials (Lopez, 2011).
2.2.6 Environmental Impact Assessment
Environmental Impact Assessment (EIA) is defined as a tool for ensuring new projects
and programmes incorporate appropriate measures to mitigate adverse impacts to the
environment and health and safety of people as well as enhancement of sustainable
operations with respect to environmental resources including co-existence with other
socio-economic activities in their neighbourhood (Kenface, 2016). It is a procedure
used to examine the environmental consequences (both beneficial and adverse) of a
proposed development project and to ensure that these effects are taken into account
during the project design phase. For this reason, the EIA is therefore usually based on
predictions. These impacts assessed can range from all relevant aspects of the natural,
social, economic and human environment (Ogola, 2009).
EIA certainly has a crucial role to play in addressing environmental issues surrounding
project development and therefore the integration of environment into development
planning forms one of the most important tools in achieving sustainable development.
In addition, environmental protection and economic development must thus be dealt
with in an integrated manner. EIA process is necessary in providing an anticipatory
35
and preventive mechanism for environmental management and protection in any
development (GIBB, 2014). EIA is therefore viewed as an integral part of the project
planning phase. Unlike the environmental audit (EA), which is usually conducted on
existing projects, the EIA is applied to new projects and the expansion aspects of
existing projects. The study therefore requires a multidisciplinary approach and should
be done very early at the feasibility stage of a project. In other words, a project should
be assessed for its environmental feasibility (Kenface, 2016).
Social Impact Assessment (SIA) includes the processes of analysing, monitoring and
managing the intended and unintended social consequences, both positive and
negative, of planned interventions and any social change processes invoked by those
interventions. The analysis includes the use of land, culture, the main economic
activities e.g. tourism, employment levels, agriculture and impact on service provision
e.g. water use, education, traffic, energy use among others. Its primary purpose is to
bring about a more sustainable and equitable biophysical and human environment. SIA
assumes that social, economic and biophysical impacts are interconnected. It is
therefore done to ensure that there is no mismatch between the development and socio-
cultural aspects of the project area (Ogola, 2009). The purposes of the environmental
impact assessment are to: propose workable mitigation measures; ensure adequate
identification of potential environmental impacts; develop an environmental
management and monitoring plan articulating envisaged impacts; and formulate
implementation framework for the proposed mitigation measures, required resources,
responsible persons and implementation schedule.
36
On the other hand, the objectives of this assessment are to: determine and assess the
impacts of the proposed project and to develop appropriate mitigation measures;
ensure there is compliance with the provisions of the National Environmental
Management Authority (NEMA) as well as other statutory requirements; prepare an
Environmental Management Plan (EMP) which can be used as the basis for future
audits; and ensure that the proposed project does not compromise the well-being of the
people including all other stakeholders.
2.3 Empirical Review
2.3.1 Engineering Properties of Waste Material Used as Partial Replacement of
Cement in Concrete
Ceramics are brittle solids and are suitable for withstanding very high temperatures.
They are inert which is responsible for their ability to confront the damages caused by
oxygen, acids, or any other chemicals. The ceramics are also considered to be anti-
static in that they prevent the build-up of static energy that is responsible for the
imbalances caused by friction. In addition, the ceramic materials are also high resistant
to both electricity and heat which makes them very durable. They also have high
fracture toughness and have similar modulus to that of steel. Based on experimental
research, water absorption of ceramic waste is established to be 0.18% and that for
natural aggregate is 0.10% (Guerra et al., 2008).
An investigative study on the mechanical properties of porcelain conducted by
Braganca et al. (2004) reported the optimum sintering temperature for the porcelain
studied was 1340oC using a heating rate of 15oC/h and a 30 min soaking time. The
37
modulus of rupture and bulk density were at a maximum at this temperature. The study
findings give the following properties of porcelain: water absorption is 0.34%,
apparent porosity is 0.84%, bulk density is 2.48 g/cm3, linear shrinkage is12.2% and
modulus of rupture is 46 MPa. Technical data analysis revealed a relationship between
the modulus of rupture and the bulk density adding that maximum strength is achieved
as a result of decrease in internal flaws and porosity. The study found that samples
fired at temperatures below the ideal (1340οC) showed open porosity.
Stathis (2004) asserts that filler grain size has severe impact on the mechanical and
physical properties of porcelain compared to the impact of the other factors such as
firing temperature, quartz content in the filler and soaking time. This therefore
suggested that, optimization efforts should be focused on this factor. The study showed
that bending strength is affected by quartz grain size in two ways, indirectly through
the development of a favourable microstructure, and directly through the induction of
compressive stresses to the vitreous phase. It is explained that the particle distribution
of quartz grains is major factor upon which both parameters depend. The study found
that the maximum bending strength was achieved with the optimum quartz grain size
of 5–20 μm. It was noticed that the use of coarser grain sizes results in reduced bending
strength due to the development of a detrimental microstructure.
According to Pacheco et al. (2010), the chemical compositions of ceramic waste and
porcelain tile powder has been established to vary greatly based on the type of ceramic
tile. The main chemical component is SiO2 which is found in the largest proportion
followed by Al2O3. Other minor chemical constituents include Fe2O3, CaO, MgO,
38
Na2O, and K2O while TiO2 is the least found chemical constituent. The chemical
composition of the ceramic waste also tends to influence the specific gravity of the
ceramic waste as established by Siddesha (2011) who conducted a study using
homogeneous ceramic tiles.
On the microstructural analysis Braganca et al. (2004) revealed that the ideal firing
temperature occurs when the glassy phase covers the entire sample surface with
sufficient time to react with crystalline phases. Higher temperatures were limited by
the porosity increase. This porosity is a result of oxygen released from Fe2O3
decomposition and gas expansion in the pores. Finally, the mechanical and physical
properties of concretes in which conventional coarse aggregate was partially
substituted by coarse ceramic aggregate obtained from crushed sanitary porcelain ware
was studied by López et al. (2007) and Juan et al. (2010) studied. The study reported
good results.
2.3.2 Performance of Structural Concrete Mix with Waste Material used as
Partial Replacement
The basic concept of a mix design is to select and proportion suitable materials so as
to provide a required strength and workability. Strength is normally assumed to be
inversely proportional to water cement ratio and workability to slump and cohesion or
sandiness. The more sand and the higher the water requirement (and therefore the
cement requirement and cost) but the ‘softer’, more cohesive and easier to handle the
concrete at a given slump. To a large extent, using a finer sand has the same effect as
using a larger percentage of sand (Ken, 2006). The concrete which is mixed with
39
ceramic waste powder has a minor strength loss but possesses increased durability
performance because of its pozzolanic properties. Replacement of conventional coarse
aggregates by ceramic coarse aggregates produces concrete with promising results but
they slightly underperform in water absorption (Pacheco, 2010).
Pacheco et al. (2010) conducted a study on the behaviour of concrete with partial
replacement of tile powder in cement accordingly in the range of 0 to 50% in steps of
10% by weight for class C30 concrete. The tile concrete samples were tested and
comparison made with the conventional concrete. The compressive strength, tensile
strength and flexural strength for 7, 28 and 56 days for the various replacement levels
were compared. The materials used were; ordinary Portland cement of 53 grade
cement conforming to IS 8112:1989 of initial and final setting time of 55 minutes and
210 minutes respectively and also of specific gravity 3.15. Tile dust of fineness 7.5%
and specific gravity of 2.62 was obtained from RAK ceramics. Local river sand
conforming to zone-II of IS 383-1970 with fineness modulus is 3.69, specific gravity
of 2.64, bulk density1718 kg/m3 and water absorption 0.4% was used as fine aggregate
while locally crushed granite stone of maximum size 20mm, fineness modulus of
7.357, specific gravity 2.67, bulk density 1605 kg/m3 and water absorption 3.72% was
used as coarse aggregate. The quantity and quality of water was very carefully
determined. Super plasticizer used was conplast SP430 with brown liquid appearance,
specific gravity 1.18 and alkali content less than 55g. Concrete mix of strength class
C30 was designed as per IS 10262: 2009 and the variation of strength of hardened
concrete using tile dust as partial cement substitute was studied by casting 3 cubes, 3
cylinders and 3 beams for each replacement level. The specimens were cured for 7, 28
40
and 56 days prior to being tested for compression, split tensile and flexural strengths.
The results of the study showed that compressive strength, split-tensile strength and
flexural strengths were achieved up to 30% partial replacement level without affecting
the characteristic strength of C30 grade concrete. Beyond 30% replacement level, the
strengths gradually decreased when compared to the conventional (control) concrete.
Sivaprakasha et al. (2016) experimentally studied the mechanical strength properties
of C25 grade concrete by partially replacing sand with ceramic waste. In order to
analyse the mechanical properties such as compressive, split tensile, flexural strength,
the samples were cast with 10–50% in steps of 10% replacement of sand using ceramic
waste. The tests were carried out after 7, 14 and 28 days of curing. The test results
showed clearly that the ceramic waste can be used as replacement materials for river
sand in concrete. The concrete with 10 and 20% replacement satisfied the compressive
strength of M25 grade however higher the percentage addition of ceramic waste
reduces the strength of normal concrete. The tensile strength of 10, 20, 30%
replacements at 14 days showed the consistency in attaining the required range. Hence
it was concluded in this study that the replacement of river sand using 30% ceramic
waste in concrete gives the required strength and can be considered as optimum
replacement level. It was observed that the mechanical properties of concrete reduced
with further increase in the percentage addition of ceramic waste.
The reuse of ceramic tiles waste (CWT) as aggregate in concrete was studied by Shruti
et al., 2016. In their study, natural coarse aggregates were partially replaced with
ceramic tile waste. The replacement levels were 0, 10, 20, and 30% substitution of C20
41
grade concrete. The concrete cubes and cylinders were cast and tested for compressive
strength and split tensile strength respectively after curing periods of 3, 7 and 28 days
for each replacement level. The result indicate that the maximum compressive strength
is obtained for 30% replacement of ceramic tile aggregate with natural coarse
aggregate.
The effect of replacing crushed clay tiles as a coarse aggregate in concrete with partial
replacement of 0, 50, and 100% of natural aggregate was experimentally investigated
by Topcu et al. (2007). In this study, both physical and mechanical tests were carried
out. The results revealed that the unit weights and strengths of crushed tile aggregate
concrete decreased with increase in waste material, compared to control concrete. On
the contrary, water absorption and capillary coefficients were increased compared to
the control concrete. In the light of the same, Ikponmwosa et al. (2017) also studied
the effect of ceramic waste as coarse aggregate substitute on particularly the strength
properties of concrete. The study concluded that ceramic waste could be used for both
non-structural and structural works while recommending that beyond 75% substitution
level, ceramic waste material should not be used in concrete structures where high
strength is the major consideration. In addition, Reddy et al. (2007) concluded that
ceramic scrap can be partially used to replace conventional coarse aggregates up to 10
and 20% replacement levels without structurally affecting its performance and hence
significance.
Hemanth et al. (2015) studied the effect of waste ceramic tiles as partial replacement
of both fine and coarse aggregates in concrete production. In this study crushed
42
ceramic waste tiles were used to partially replace the fine and coarse aggregate (10 and
20%). The results showed that the optimum percentage of coarse aggregate that can be
replaced by crushed tiles is 10%. In addition, Senthamarai et al. (2005) studied the
possibility of using wastes from the ceramic industry as coarse aggregate in structural
concretes, and obtained satisfactory results. Not only these studied but also Gomes et
al. (2009) investigated the feasibility of incorporating ceramic block waste as coarse
aggregates in the production of new concretes and concluded that in terms of durability
these new concretes incorporating recycled aggregate could be used for structural
purposes, but that the 4-32 mm fraction of natural aggregates could not be substituted
in its entirety. Furthermore, Cachim (2008) used different kinds of crushed waste
ceramic blocks as partial substitute (15, 20 and 30%) of coarse natural aggregates,
observing that with 15% substitution there was no change in concrete strength.
On the other hand, the feasibility of using red ceramic waste as a partial and total
substitute for natural fine aggregates was analysed by Silva et al. (2010). In this study
substitution percentages of 20 and 50% results were at all times superior to those for
the reference mortar. However, the behaviour was poorer than that of the reference
concrete when natural fine aggregate was totally substituted. Additionally, Binici
(2007) also used crushed ceramic waste and pumice stone as a partial substitute for
fine aggregate in the production of mortars and concretes, concluding that these
presented good compressive strength and abrasion resistance. Other studies also
include Saswat et al. (2016) who investigated the possibility of partial replacement of
fine aggregate with a combination of ceramic and demolition waste from rigid
pavements. The study concluded that 40% of natural fine aggregate can be saved while
43
making rigid pavement by using ceramic and demolition waste. In addition, it was
established that the compressive strength is more than that of referral concrete up to
20% demolition waste and 20% ceramic waste.
Experimental studies have found that with the use of ceramic waste powder in cement
concrete, 30% ceramic waste powder can substitute fine aggregate in cement concrete
without loss of compressive strength Hardil et al. (2015). The study also concluded
that compared to conventional concrete, only about 1% loss of split tensile strength is
obtained. Not only the above but Vidivelli et al. (2010) also studied on fly ash concrete
using SEM analysis as partial replacement to cement and had reported a significant
increase of 20% compressive strength.
Furthermore, Koyuncu et al. (2004), Topcu (2007), Brito (2010), Correia et al. (2006),
and Bakri (2006) agree on the viability of using recycled ceramic aggregate in non-
structural concretes, which show good abrasion resistance and tensile strength
properties, and because of the increased durability of recycled concrete, they are
suitable for use as paving slabs. Puertas et al., (2008) studied 6 types of ceramic wastes,
using them as alternative materials in the production of raw cement; the study
established the feasibility of this use while demonstrating a level of pozzolanic activity
together with suitable chemical and mineralogical composition.
The performance of fly ash as partial replacement of cement was studied by Kumar et
al. (2012). Both compressive strength and split tensile strength were determined at
various partial replacement levels of cement (0, 10, 20, 30 and 40%) by weight of C5
44
and C40 mixes. The compressive strength of the samples was determined at the curing
age of 7, 14, 28 days whereas the splitting tensile strength of the test specimens were
conducted at the age of 56 days. In this study, it was observed that the best value of
compressive strength was achieved at 14 days.
Amudhavalli et al. (2012) examined the performance of concrete incorporating silica
fume as the partial cement substitute. Cement was replaced with silica fume in steps
of 0, 5, 10, 15 and 20% by weight by M35 mix. The study reported compressive
strength, split tensile strength and flexural strength at age of 7 days and 28 days for
several replacement levels. The results indicated that the performance of concrete in
strength and durability aspects improves by incorporating silica fume in concrete.
Raval et al. (2013) explained the feasibility of replacing cement with ceramic waste
and utilizing the same in construction industry. The study revealed that compressive
strength was achieved up to 15% replacement level. In addition, the use of glass
powder as partial replacement to cement was effective (Vijayakumar et al., 2013).
The compressive strength of concrete in which cement was partially substituted with
silica fume (0, 5, 10, 15, and 20%) was determined by Pradhan et al. (2013). The
compressive strength tests were conducted on specimen (100 mm and 150 mm cubes)
at 1, 7 and 28 days of curing. The results presented that with addition of silica fume up
to 20% replaced by weight of cement, the compressive strength of concrete increased.
Upon further addition of silica fume, the compressive strength may increase or
decrease.
45
Ajileye et al. (2012) examined the partial replacement of cement with usage of
microsillica in concrete. Cement was replaced with coconut shell in the range of 0-
25% in steps of 5. The compressive strength and of the samples was recorded at the
curing age of 3, 7, 14, 28 days. The results showed that with addition of silica fume up
to10% replaced by weight of cement, the compressive strength of concrete increased.
However, with further addition of microsillica the compressive strength decreased.
Utilization of natural pozzolanic cement substitute in concrete materials has been
determined by Al-Chaar et al. (2013). In this study, four mixes using three types of
natural pozzolanic, as well as a Class F fly ash were investigated by means of a test
series. The effectiveness and efficiency of each pozzolanic material in controlling
alkali-silica reactions was established. The study also revealed correlations between
Portland cement control mix and the mechanical properties of the proposed mixes. The
findings were also compared with the industry standards for mortars made with silica
fume and fly ash. These findings to indicate that one type of pozzolanic may be used
as a substitute for fly ash, but not for silica fume.
2.3.3 Cost-Benefit of using Waste Material as Partial Replacement of Cement
For the economic analysis, a cost-benefit analysis technique may be used to perform
validity analysis on an investment and was applied for a cost comparison of facility
construction. The two are identical in that both consider the temporal value of cost.
The main difference is that cost-benefit analysis explicitly handles both cost and
benefit, while economic analysis has to do with only cost. Barrie et al., (2002)
suggested three types of estimates (preliminary estimates, fair-cost estimates, and
46
definite estimates) for the efficient management of construction costs. Depending on
accuracy. pre-cost and post-cost according to quotation time, Kim et al., (2004)
classified estimates into definite and preliminary estimates. In this classification, the
cost estimated before construction is completed is defined as pre-cost and it is further
sub-classified into preliminary, design, construction and budget cost of work schedule
(BCWS) estimates. On the other hand, the actual consumption (so-called “actual cost”)
is referred to as post-cost estimate and it represents basic data used for the preparation
of construction financial statements.
Studies which minimize cement usage, develop alternatives for instance by partial
replacement of cement with fly ash, blast-furnace slag, or such industrial by-products
and assess the environmental impacts and economic value of concrete mixed with such
have become of prime interest to the construction industry. In a study conducted by
Tae (2016), a physical property evaluation of concrete was investigated by using A-
BFS (Activator Blast Furnace Slag) mixed with an activator in order to induce early-
age strength manifestation of BFS mixed concrete. This study primarily conducted
physical property tests for compressive strength of concrete that partially replaced
ordinary Portland cement with A-BFS and executed a comparative analysis with 100%
ordinary Portland cement. According to which the economic value of the construction
period, reduction was evaluated based on the fact that if concrete early strength is
manifested through this process when applied to RC (reinforced concrete) building, at
most a three to four-day construction cycle would be possible.
47
The combination of waste sheet glass powder (SGP) as substitutes for both fine
aggregate and Portland cement with 20% optimum substitution of fly ash as
cementations binder was found to offer an economically viable technology for high
value utilization of industrial waste. Use of SGP in concrete is also an interesting
possibility for conservation of natural resources as well as economy on waste disposal
sites. In this study, natural sand was partially replaced with SGP in steps of 10% in the
range of 0-50%. A 20% optimum replacement of Portland cement with fly ash was
also made. Compressive, tensile and flexural strengths up to 180 days of age were
compared with those of the conventional concrete made with natural fine aggregates.
The study results indicate that the manufacture of low cost concrete containing SGP
produces similar characteristics to those of natural sand aggregate concrete up to 30%
SGP as fine aggregate along with 20% optimum cement replacement with fly ash
(Mageswari et al., 2009).
In order to minimize the environmental damages due to quarrying, Biruk et al. (2012)
developed the strength of concrete by using masonry waste in concrete mix for
construction purposes. The study noted that it is highly desirable that the waste
materials of bricks and concrete are further reutilized after the demolition of old
structures in an effective manner especially realizing that it will minimize damages to
the environment caused by excessively reckless quarrying for earth materials such as
stones. In addition, the pressure of finding new dumping ground for these wastes will
reduce when they are reutilized, thus further saving the eco-systems and natural
environment at large. The reliability, durability and adequacy in service performance
of these reused waste materials over the stipulated design period of structures are of
48
paramount concern. In this study, such properties of reused concrete and brick masonry
waste materials were critically examined and suitable recommendations suggested for
further enhancing life of such structures, thereby resulting in sufficient and sustainable
economic growth and development.
2.4 Literature Review Summary and Research Gaps
Though studies have been conducted trying to investigate how ceramics may be used
as partial replacement in concrete, the studies have focused entirely on using either
ceramic or porcelain waste directly (Bragança et al., 2004; Meena, 2017; Olupot,
2006) leaving out the use of both wastes simultaneously. Most studies indicate the
feasibility of using either or both ceramic and porcelain waste as partial replacement
for coarse aggregates (Pacheco et al., 2010; Sivaprakash et al., 2016; Sentharamai et
al., 2005; Siddesha, 2011; Sudarsana et al., 2013; Pacheco et al., 2010; Topcu et al.,
2007; Ikponmwosa et al., 2017; Hemanth et al., 2015; Senthamarai et al., 2005; Gomes
et al., 2009; Cachim 2008). Furthermore, Koyuncu et al. (2004), Topcu (2007), Brito
et al. (2010), Correia et al. (2006), and Bakri (2006) agree on the viability of using
recycled ceramic in non-structural concrete to replace aggregates and not cement. In
addition, studies have been conducted to analyse the feasibility of using red ceramic
waste as a partial and total substitute for natural fine aggregates (Sivaprakasha et al.,
2016; Silva et al., 2010; Binici, 2007; Saswat et al., 2016).
On the other hand, several waste materials such as stone dust, oven burnt bricks, glass
powder, coconut shells, waste tires, slag, fly ash, broken glass pieces, rice husk ash,
coconut shell ash have been used in concrete to partially replace cement. These studies
49
(Puertas et al., 2008; Portella et al., 2006; Hardil et al., 2015; Vidivelli et al., 2010;
Vijayakumar et al., 2013; Kumar et al., 2012; Pradhan et al., 2013; Amudhavalli et
al., 2012; Al-Chaar et al., 2013; Ajileye et al., 2012; Ghutke1 et al., 2014) established
the feasibility of using particular waste material as partial replacement of cement in
concrete production. In addition, today the Portland cement manufacturing industry is
under close scrutiny reason being the large volumes of CO2 emitted. Actually about5–
7% of the total CO2 anthropogenic emissions is thought to be produced by this
industrial sector (Hendricks et al., 1998; Humphreys et al., 2002). Therefore,
numerous studies have been done to evaluate and possibly reduce CO2 emissions and
energy consumption (Capros et al., 2001; CIF, 2003; Gartner, 2004). Other cement
emissions such as SO2 emissions have also been analysed (Josa et al., 2004, 2007)
using Life Cycle Assessment (LCA) method. Other studies (Tae, 2016; Gamashta et
al., 2006; Mageswari et al., 2009; Hailu et al., 2012) have also been conducted to
evaluate the cost of structures using alternative ingredients of concrete.
In a nutshell, studies have focused entirely on using either ceramic or porcelain waste
directly leaving out the use of both wastes simultaneously. Most studies indicate the
feasibility of using either or both ceramic and porcelain waste as partial replacement
for aggregates. No conclusion has been made on the cost benefit assessment of using
both ceramic and porcelain waste as partial cement substitute in concrete production.
The impacts of using ceramic and porcelain waste on the environment in terms of cost
and benefits have also not been established. This study therefore aimed at addressing
these research gaps.
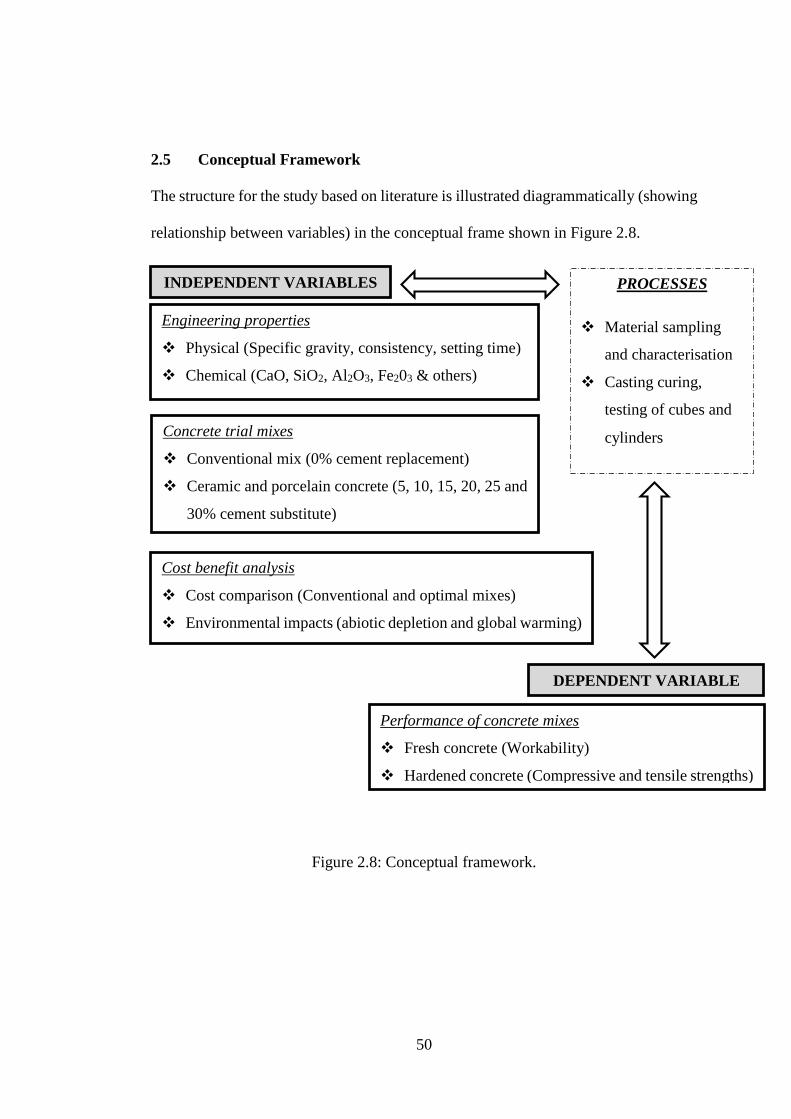
50
2.5 Conceptual Framework
The structure for the study based on literature is illustrated diagrammatically (showing
relationship between variables) in the conceptual frame shown in Figure 2.8.
Figure 2.8: Conceptual framework.
INDEPENDENT VARIABLES
Engineering properties
Physical (Specific gravity, consistency, setting time)
Chemical (CaO, SiO2, Al2O3, Fe203 & others)
PROCESSES
Material sampling
and characterisation
Casting curing,
testing of cubes and
cylinders
DEPENDENT VARIABLE
Concrete trial mixes
Conventional mix (0% cement replacement)
Ceramic and porcelain concrete (5, 10, 15, 20, 25 and
30% cement substitute)
Cost benefit analysis
Cost comparison (Conventional and optimal mixes)
Environmental impacts (abiotic depletion and global warming)
Performance of concrete mixes
Fresh concrete (Workability)
Hardened concrete (Compressive and tensile strengths)
51
CHAPTER THREE
3 MATERIALS AND METHODS
3.1 Introduction
This chapter represents the methodology that was used in achieving the study
objectives. According to Kothari (2004), the methodology emphasizes the procedure
and details on how this research was carried out, and this is elaborated herein. It
constitutes the methods used, the material sampling and preparation, the data
collection, processing and analysis procedures. It contains the experimental setup
regarding what, where, when, how much, by what means the inquiry was carried out.
3.2 Determining Engineering Properties of Ceramic and Porcelain Clay Tile
Powders
3.2.1 Material Acquisition and Preparation
Ceramic and Porcelain clay tile waste was sampled from Kampala and its environs,
targeting construction sites, areas of Kireka sites that sell tiles, Namave where many
tile producers are available, Bukoto as an area of major demolition and Namugongo
area undergoing a lot of construction. Samples of ceramic and porcelain clay tiles was
taken in accordance to BS 1881-101: 1983, which gives methods of sampling. In
February 2018, 50 kg of each waste material (ceramic and porcelain clay tiles) was
taken from each of the 20 demolition sites within Kampala metropolitan area. The
samples were packed in polypropylene semi-transparent woven plastic sack bags and
transported to the crushing plant using Sinotruk HOWO 8X4 Dumper 420HP Dump
Truck. The sample was washed and left to air dry for one week before it was crushed
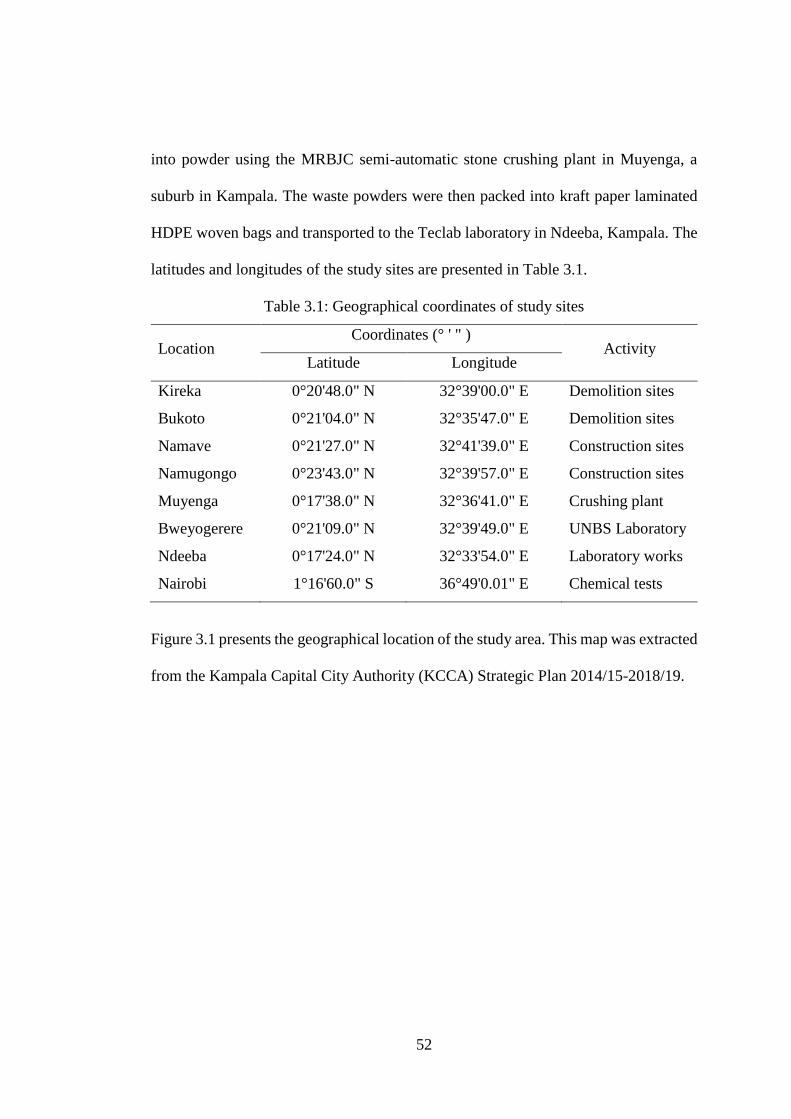
52
into powder using the MRBJC semi-automatic stone crushing plant in Muyenga, a
suburb in Kampala. The waste powders were then packed into kraft paper laminated
HDPE woven bags and transported to the Teclab laboratory in Ndeeba, Kampala. The
latitudes and longitudes of the study sites are presented in Table 3.1.
Table 3.1: Geographical coordinates of study sites
Location Coordinates (° ' " )
Activity Latitude Longitude
Kireka 0°20'48.0" N 32°39'00.0" E Demolition sites
Bukoto 0°21'04.0" N 32°35'47.0" E Demolition sites
Namave 0°21'27.0" N 32°41'39.0" E Construction sites
Namugongo 0°23'43.0" N 32°39'57.0" E Construction sites
Muyenga 0°17'38.0" N 32°36'41.0" E Crushing plant
Bweyogerere 0°21'09.0" N 32°39'49.0" E UNBS Laboratory
Ndeeba 0°17'24.0" N 32°33'54.0" E Laboratory works
Nairobi 1°16'60.0" S 36°49'0.01" E Chemical tests
Figure 3.1 presents the geographical location of the study area. This map was extracted
from the Kampala Capital City Authority (KCCA) Strategic Plan 2014/15-2018/19.
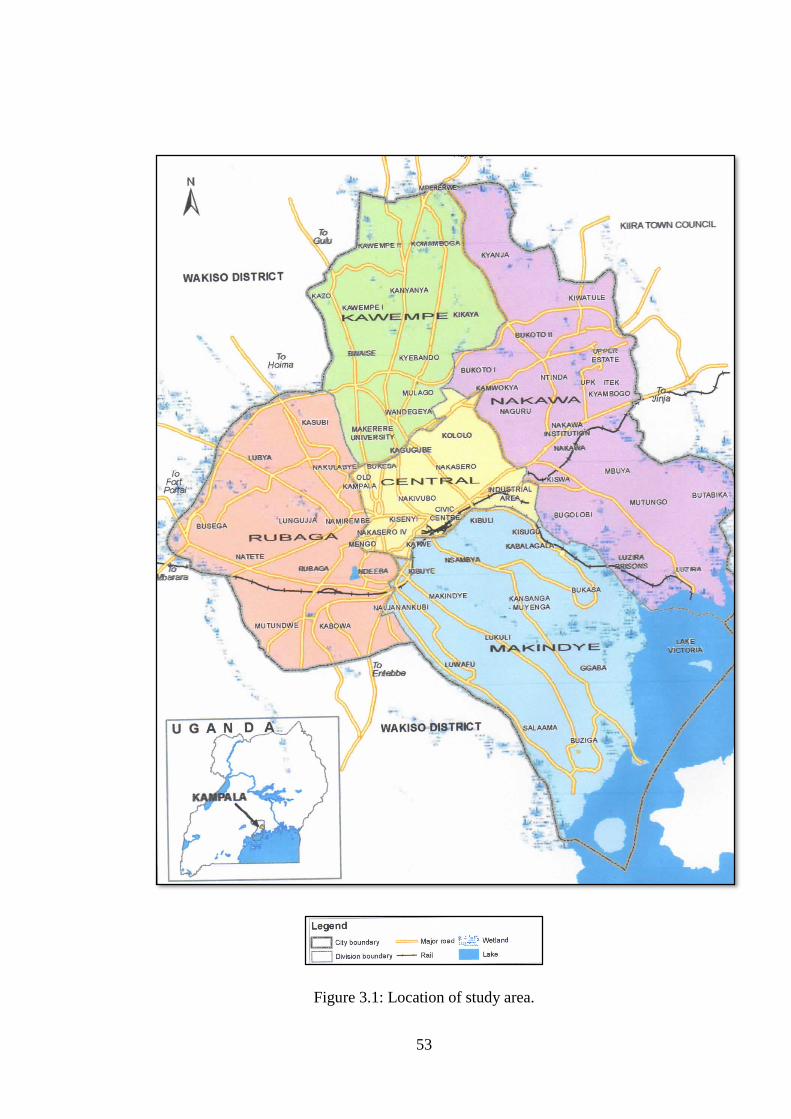
53
Figure 3.1: Location of study area.
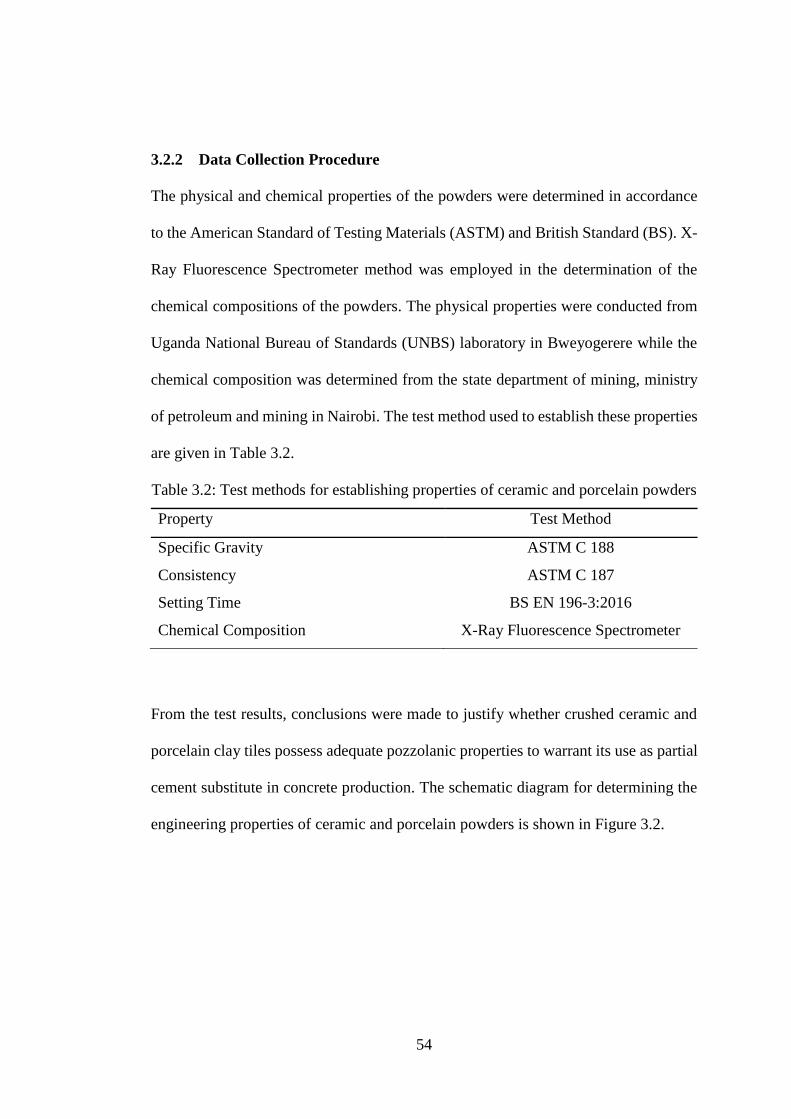
54
3.2.2 Data Collection Procedure
The physical and chemical properties of the powders were determined in accordance
to the American Standard of Testing Materials (ASTM) and British Standard (BS). X-
Ray Fluorescence Spectrometer method was employed in the determination of the
chemical compositions of the powders. The physical properties were conducted from
Uganda National Bureau of Standards (UNBS) laboratory in Bweyogerere while the
chemical composition was determined from the state department of mining, ministry
of petroleum and mining in Nairobi. The test method used to establish these properties
are given in Table 3.2.
Table 3.2: Test methods for establishing properties of ceramic and porcelain powders
Property Test Method
Specific Gravity ASTM C 188
Consistency ASTM C 187
Setting Time
Chemical Composition
BS EN 196-3:2016
X-Ray Fluorescence Spectrometer
From the test results, conclusions were made to justify whether crushed ceramic and
porcelain clay tiles possess adequate pozzolanic properties to warrant its use as partial
cement substitute in concrete production. The schematic diagram for determining the
engineering properties of ceramic and porcelain powders is shown in Figure 3.2.
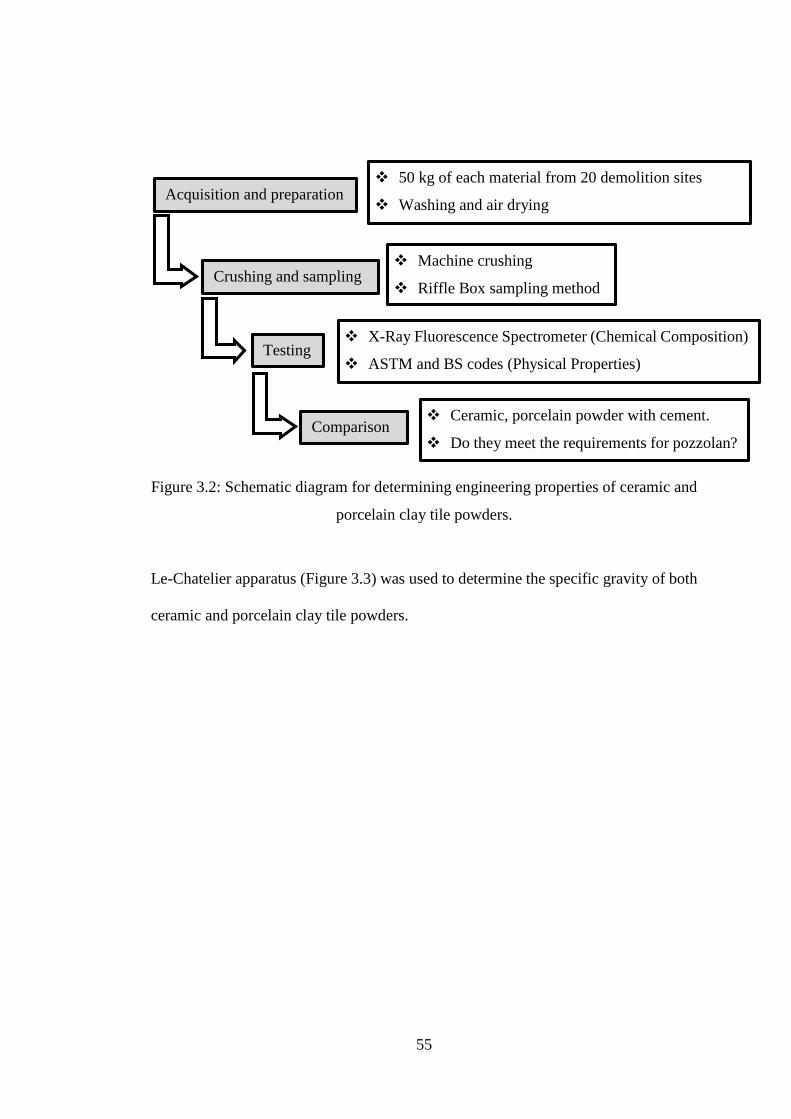
55
Figure 3.2: Schematic diagram for determining engineering properties of ceramic and
porcelain clay tile powders.
Le-Chatelier apparatus (Figure 3.3) was used to determine the specific gravity of both
ceramic and porcelain clay tile powders.
Acquisition and preparation 50 kg of each material from 20 demolition sites
Washing and air drying
Crushing and sampling Machine crushing
Riffle Box sampling method
Testing X-Ray Fluorescence Spectrometer (Chemical Composition)
ASTM and BS codes (Physical Properties)
Comparison Ceramic, porcelain powder with cement.
Do they meet the requirements for pozzolan?
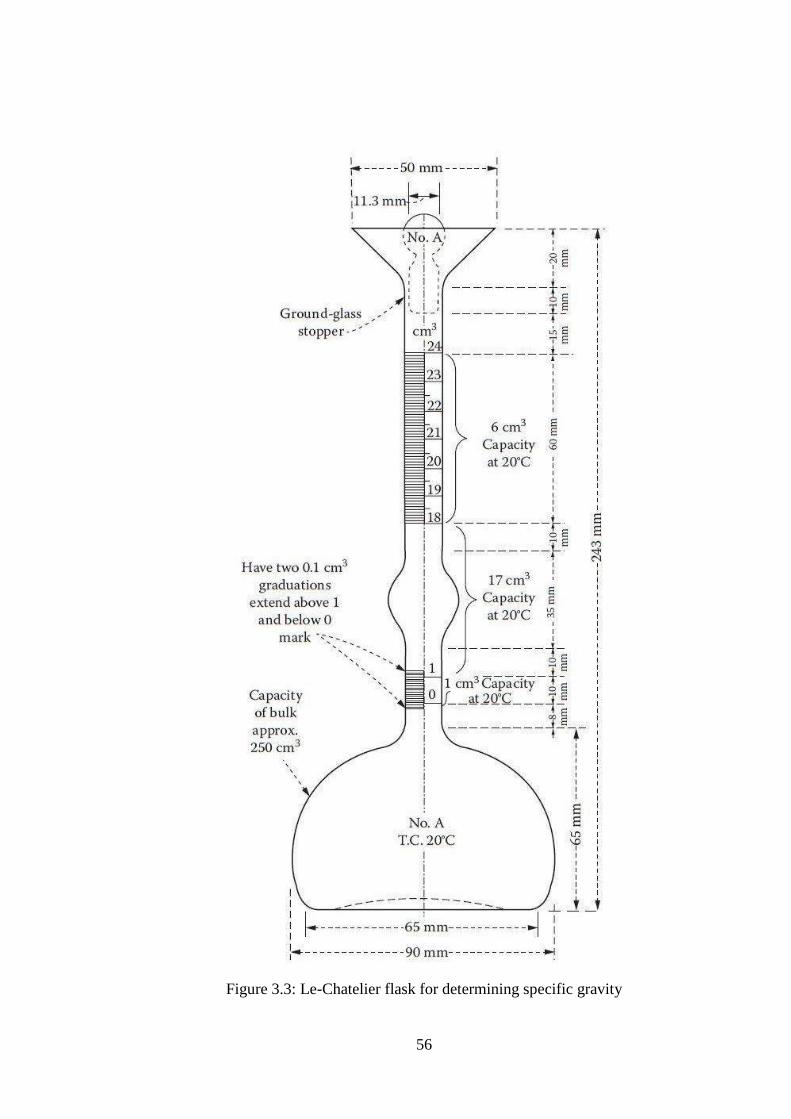
56
Figure 3.3: Le-Chatelier flask for determining specific gravity
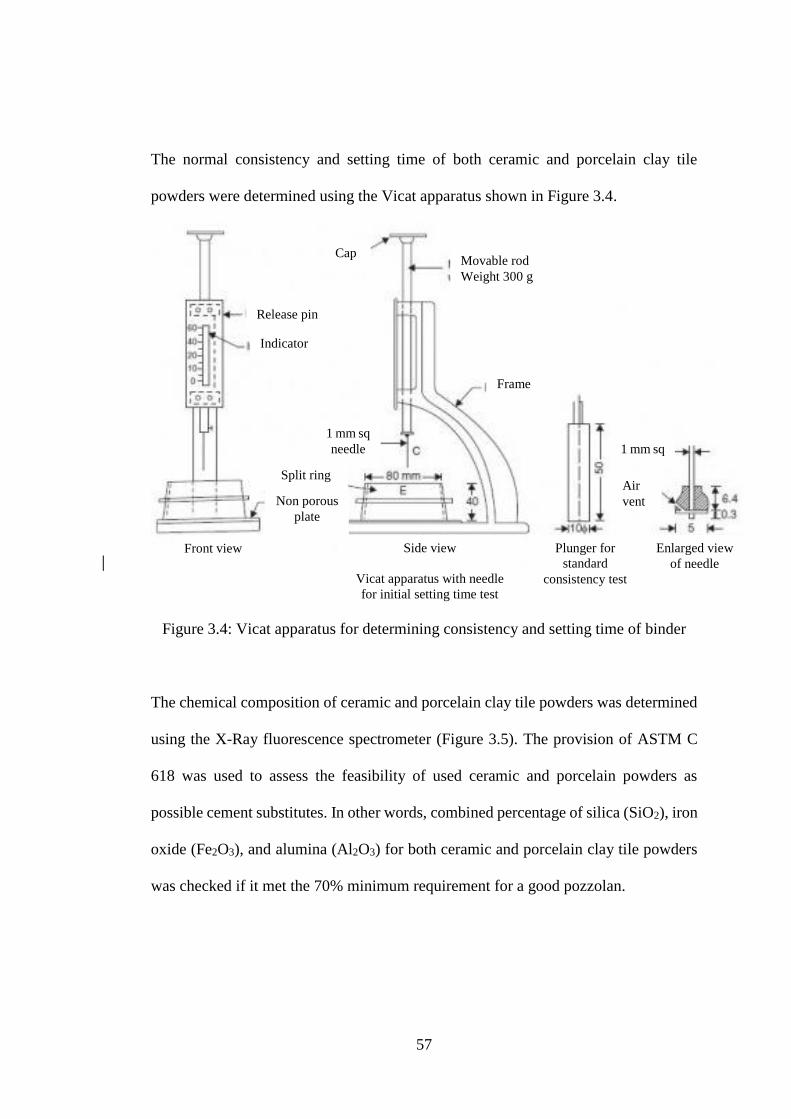
57
The normal consistency and setting time of both ceramic and porcelain clay tile
powders were determined using the Vicat apparatus shown in Figure 3.4.
Figure 3.4: Vicat apparatus for determining consistency and setting time of binder
The chemical composition of ceramic and porcelain clay tile powders was determined
using the X-Ray fluorescence spectrometer (Figure 3.5). The provision of ASTM C
618 was used to assess the feasibility of used ceramic and porcelain powders as
possible cement substitutes. In other words, combined percentage of silica (SiO2), iron
oxide (Fe2O3), and alumina (Al2O3) for both ceramic and porcelain clay tile powders
was checked if it met the 70% minimum requirement for a good pozzolan.
Split ring
Release pin
Indicator
Movable rod
Weight 300 g
Cap
Frame
1 mm sq
1 mm sq
needle
Non porous
plate
Air
vent
Front view Side view
Vicat apparatus with needle
for initial setting time test
Plunger for
standard
consistency test
Enlarged view
of needle
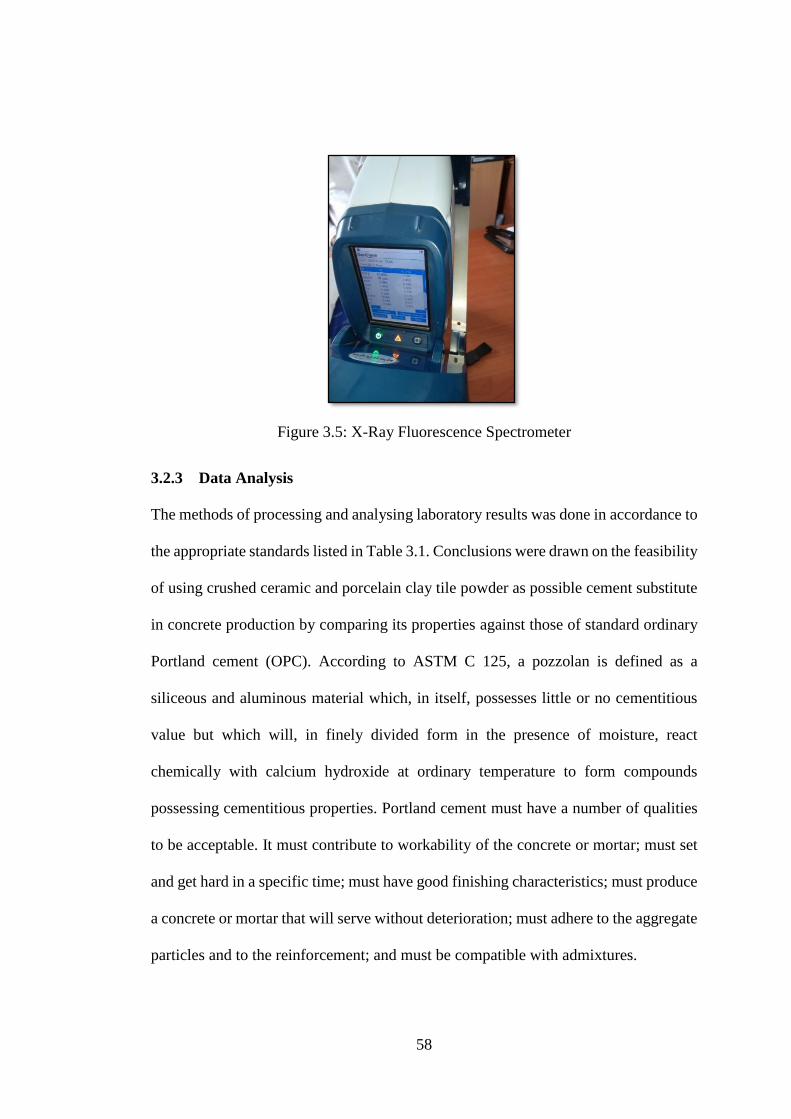
58
Figure 3.5: X-Ray Fluorescence Spectrometer
3.2.3 Data Analysis
The methods of processing and analysing laboratory results was done in accordance to
the appropriate standards listed in Table 3.1. Conclusions were drawn on the feasibility
of using crushed ceramic and porcelain clay tile powder as possible cement substitute
in concrete production by comparing its properties against those of standard ordinary
Portland cement (OPC). According to ASTM C 125, a pozzolan is defined as a
siliceous and aluminous material which, in itself, possesses little or no cementitious
value but which will, in finely divided form in the presence of moisture, react
chemically with calcium hydroxide at ordinary temperature to form compounds
possessing cementitious properties. Portland cement must have a number of qualities
to be acceptable. It must contribute to workability of the concrete or mortar; must set
and get hard in a specific time; must have good finishing characteristics; must produce
a concrete or mortar that will serve without deterioration; must adhere to the aggregate
particles and to the reinforcement; and must be compatible with admixtures.
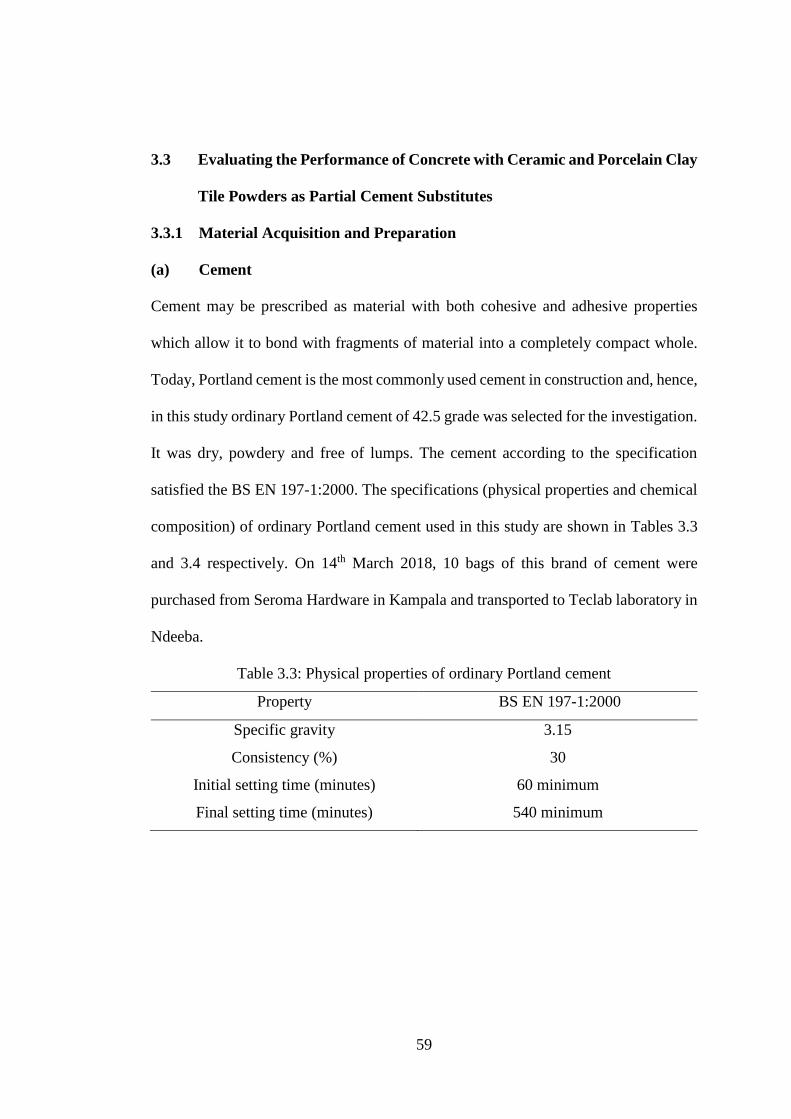
59
3.3 Evaluating the Performance of Concrete with Ceramic and Porcelain Clay
Tile Powders as Partial Cement Substitutes
3.3.1 Material Acquisition and Preparation
(a) Cement
Cement may be prescribed as material with both cohesive and adhesive properties
which allow it to bond with fragments of material into a completely compact whole.
Today, Portland cement is the most commonly used cement in construction and, hence,
in this study ordinary Portland cement of 42.5 grade was selected for the investigation.
It was dry, powdery and free of lumps. The cement according to the specification
satisfied the BS EN 197-1:2000. The specifications (physical properties and chemical
composition) of ordinary Portland cement used in this study are shown in Tables 3.3
and 3.4 respectively. On 14th March 2018, 10 bags of this brand of cement were
purchased from Seroma Hardware in Kampala and transported to Teclab laboratory in
Ndeeba.
Table 3.3: Physical properties of ordinary Portland cement
Property BS EN 197-1:2000
Specific gravity 3.15
Consistency (%) 30
Initial setting time (minutes) 60 minimum
Final setting time (minutes) 540 minimum
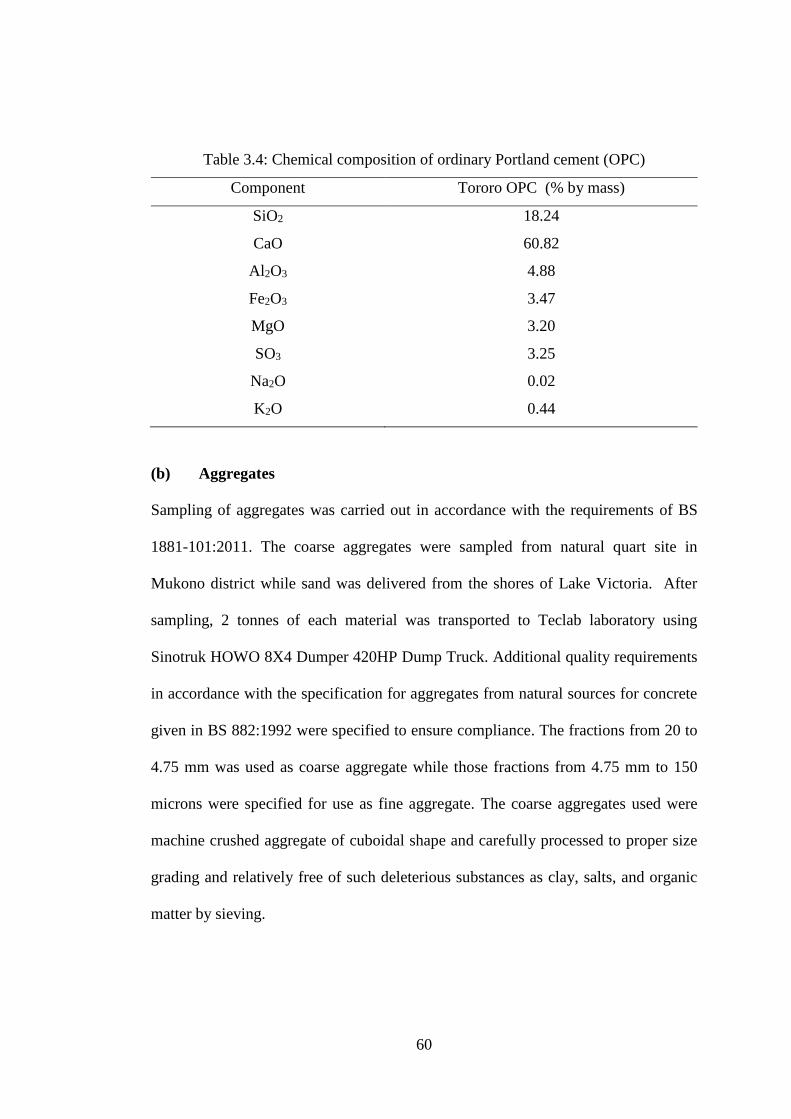
60
Table 3.4: Chemical composition of ordinary Portland cement (OPC)
Component Tororo OPC (% by mass)
SiO2 18.24
CaO 60.82
Al2O3 4.88
Fe2O3 3.47
MgO 3.20
SO3 3.25
Na2O 0.02
K2O 0.44
(b) Aggregates
Sampling of aggregates was carried out in accordance with the requirements of BS
1881-101:2011. The coarse aggregates were sampled from natural quart site in
Mukono district while sand was delivered from the shores of Lake Victoria. After
sampling, 2 tonnes of each material was transported to Teclab laboratory using
Sinotruk HOWO 8X4 Dumper 420HP Dump Truck. Additional quality requirements
in accordance with the specification for aggregates from natural sources for concrete
given in BS 882:1992 were specified to ensure compliance. The fractions from 20 to
4.75 mm was used as coarse aggregate while those fractions from 4.75 mm to 150
microns were specified for use as fine aggregate. The coarse aggregates used were
machine crushed aggregate of cuboidal shape and carefully processed to proper size
grading and relatively free of such deleterious substances as clay, salts, and organic
matter by sieving.
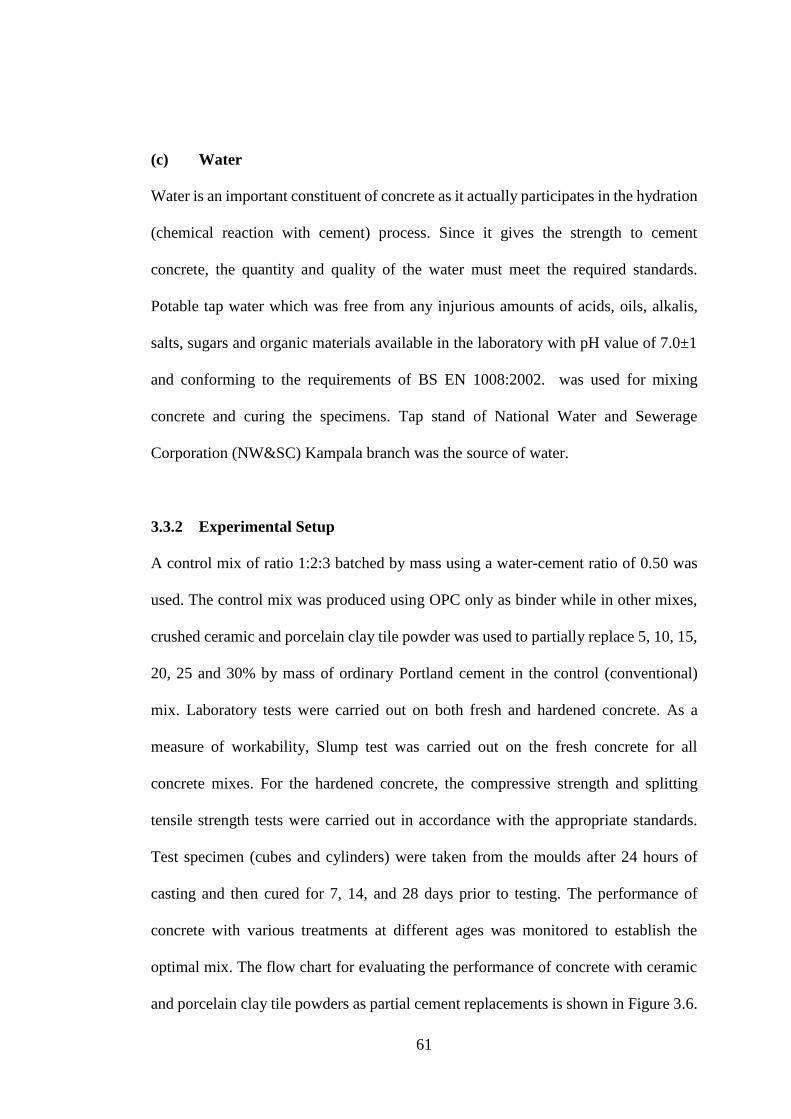
61
(c) Water
Water is an important constituent of concrete as it actually participates in the hydration
(chemical reaction with cement) process. Since it gives the strength to cement
concrete, the quantity and quality of the water must meet the required standards.
Potable tap water which was free from any injurious amounts of acids, oils, alkalis,
salts, sugars and organic materials available in the laboratory with pH value of 7.0±1
and conforming to the requirements of BS EN 1008:2002. was used for mixing
concrete and curing the specimens. Tap stand of National Water and Sewerage
Corporation (NW&SC) Kampala branch was the source of water.
3.3.2 Experimental Setup
A control mix of ratio 1:2:3 batched by mass using a water-cement ratio of 0.50 was
used. The control mix was produced using OPC only as binder while in other mixes,
crushed ceramic and porcelain clay tile powder was used to partially replace 5, 10, 15,
20, 25 and 30% by mass of ordinary Portland cement in the control (conventional)
mix. Laboratory tests were carried out on both fresh and hardened concrete. As a
measure of workability, Slump test was carried out on the fresh concrete for all
concrete mixes. For the hardened concrete, the compressive strength and splitting
tensile strength tests were carried out in accordance with the appropriate standards.
Test specimen (cubes and cylinders) were taken from the moulds after 24 hours of
casting and then cured for 7, 14, and 28 days prior to testing. The performance of
concrete with various treatments at different ages was monitored to establish the
optimal mix. The flow chart for evaluating the performance of concrete with ceramic
and porcelain clay tile powders as partial cement replacements is shown in Figure 3.6.
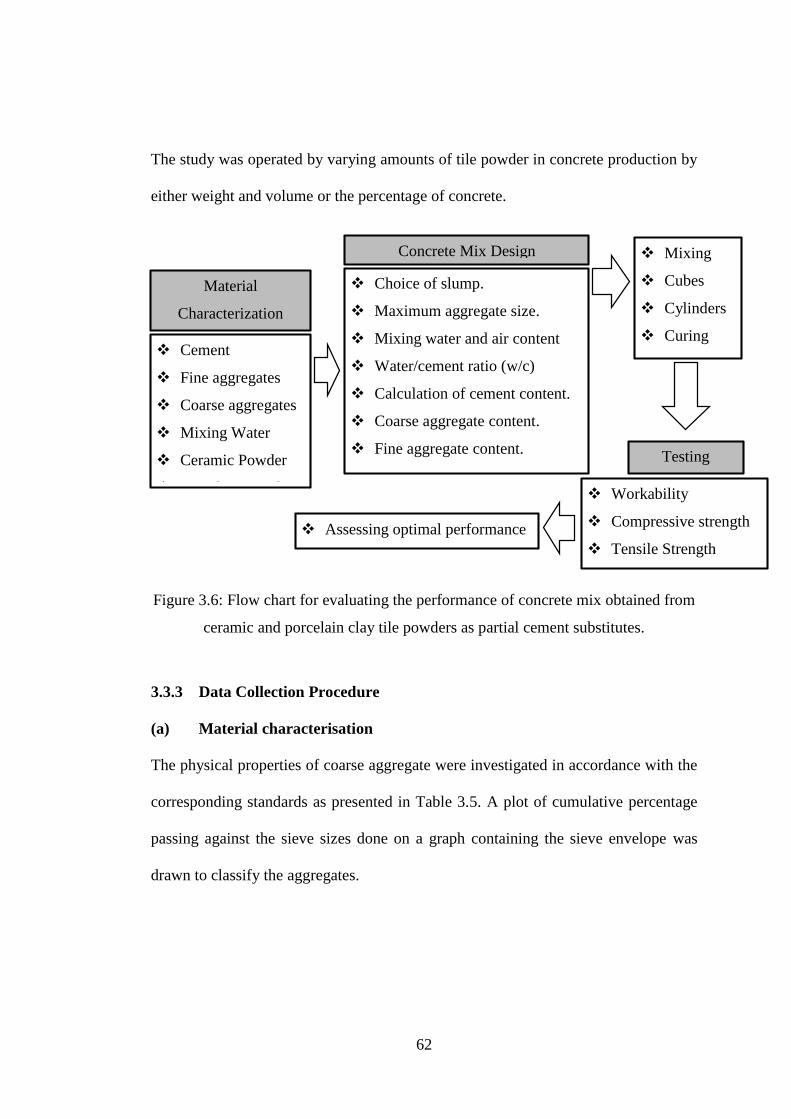
62
The study was operated by varying amounts of tile powder in concrete production by
either weight and volume or the percentage of concrete.
Figure 3.6: Flow chart for evaluating the performance of concrete mix obtained from
ceramic and porcelain clay tile powders as partial cement substitutes.
3.3.3 Data Collection Procedure
(a) Material characterisation
The physical properties of coarse aggregate were investigated in accordance with the
corresponding standards as presented in Table 3.5. A plot of cumulative percentage
passing against the sieve sizes done on a graph containing the sieve envelope was
drawn to classify the aggregates.
Material
Characterization
Cement
Fine aggregates
Coarse aggregates
Mixing Water
Ceramic Powder
Porcelain Powder
Concrete Mix Design
Choice of slump.
Maximum aggregate size.
Mixing water and air content
Water/cement ratio (w/c)
Calculation of cement content.
Coarse aggregate content.
Fine aggregate content.
Trial mixes.
Mixing
Cubes
Cylinders
Curing
Testing
Workability
Compressive strength
Tensile Strength
Assessing optimal performance
63
Table 3.5: Physical properties of aggregates
Property Standard
Particle size distribution — Sieve Analysis BS EN 933-2-2012
Specific Gravity BS EN 1097-6-2013
Moisture Content BS EN 882:1992
Water absorption BS EN 1097-6-2013
Bulk Density BS EN 1093-3-2013
Silt Content BS EN 933-1-2012
(b) Mix design
American Concrete Institute (ACI) methods of concrete mix design method ACI
211.1-81 (1997) was used. The method is based on the strength, at a given age, of fully
compacted concrete, cured under standard condition, is governed by water: cement
ratio (WC) and type of cementitious material used. Also, the amount of water required
per unit volume of concrete for a given consistency and with a given material is
substantially constant regardless of cement content, WC or proportions of aggregate
and cement. The main factors determining the amount of water are aggregate
properties, cement properties and maximum stone size. In addition, for any particular
concrete mix and combination of materials, there is an optimum stone content which
depends on size, shape and compacted bulk density of the stone, fineness modulus of
sand and desired consistence of concrete. Finally, the volume of compacted concrete
produced by any combination of materials must be equivalent to the sum of the
absolute volumes of cement and aggregates plus the volume of water and that of
entrapped or entrained air.
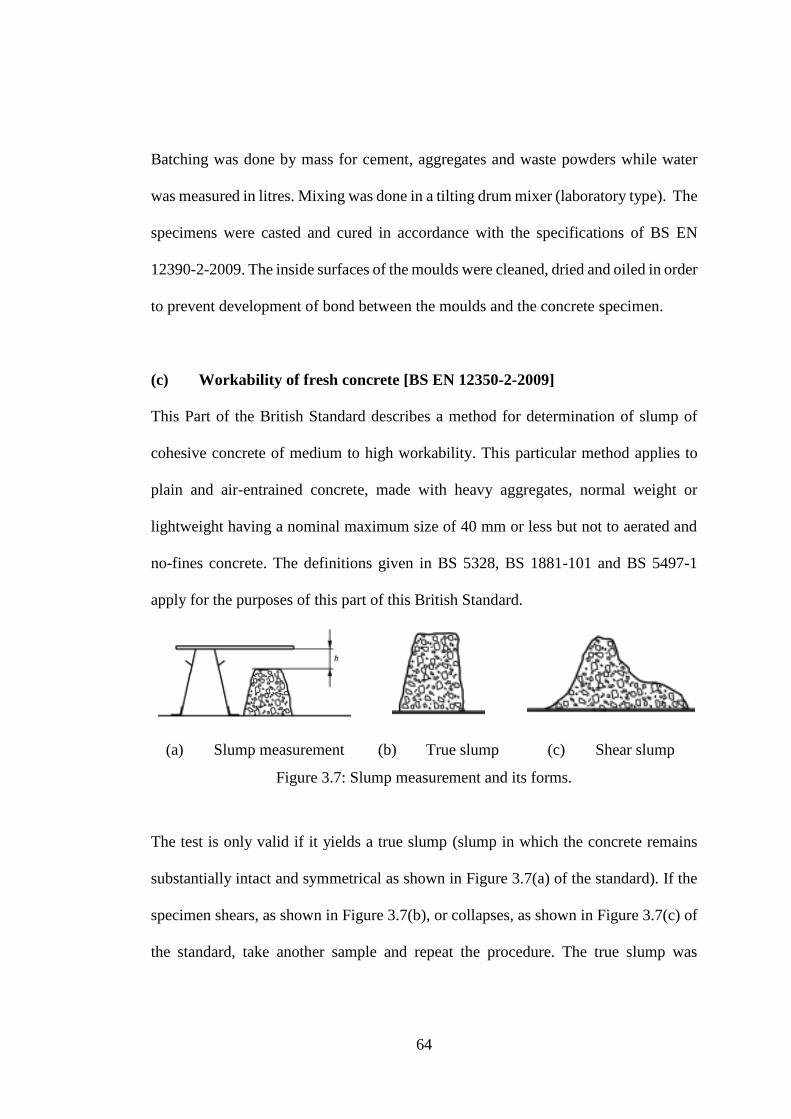
64
Batching was done by mass for cement, aggregates and waste powders while water
was measured in litres. Mixing was done in a tilting drum mixer (laboratory type). The
specimens were casted and cured in accordance with the specifications of BS EN
12390-2-2009. The inside surfaces of the moulds were cleaned, dried and oiled in order
to prevent development of bond between the moulds and the concrete specimen.
(c) Workability of fresh concrete [BS EN 12350-2-2009]
This Part of the British Standard describes a method for determination of slump of
cohesive concrete of medium to high workability. This particular method applies to
plain and air-entrained concrete, made with heavy aggregates, normal weight or
lightweight having a nominal maximum size of 40 mm or less but not to aerated and
no-fines concrete. The definitions given in BS 5328, BS 1881-101 and BS 5497-1
apply for the purposes of this part of this British Standard.
(a) Slump measurement (b) True slump (c) Shear slump
Figure 3.7: Slump measurement and its forms.
The test is only valid if it yields a true slump (slump in which the concrete remains
substantially intact and symmetrical as shown in Figure 3.7(a) of the standard). If the
specimen shears, as shown in Figure 3.7(b), or collapses, as shown in Figure 3.7(c) of
the standard, take another sample and repeat the procedure. The true slump was
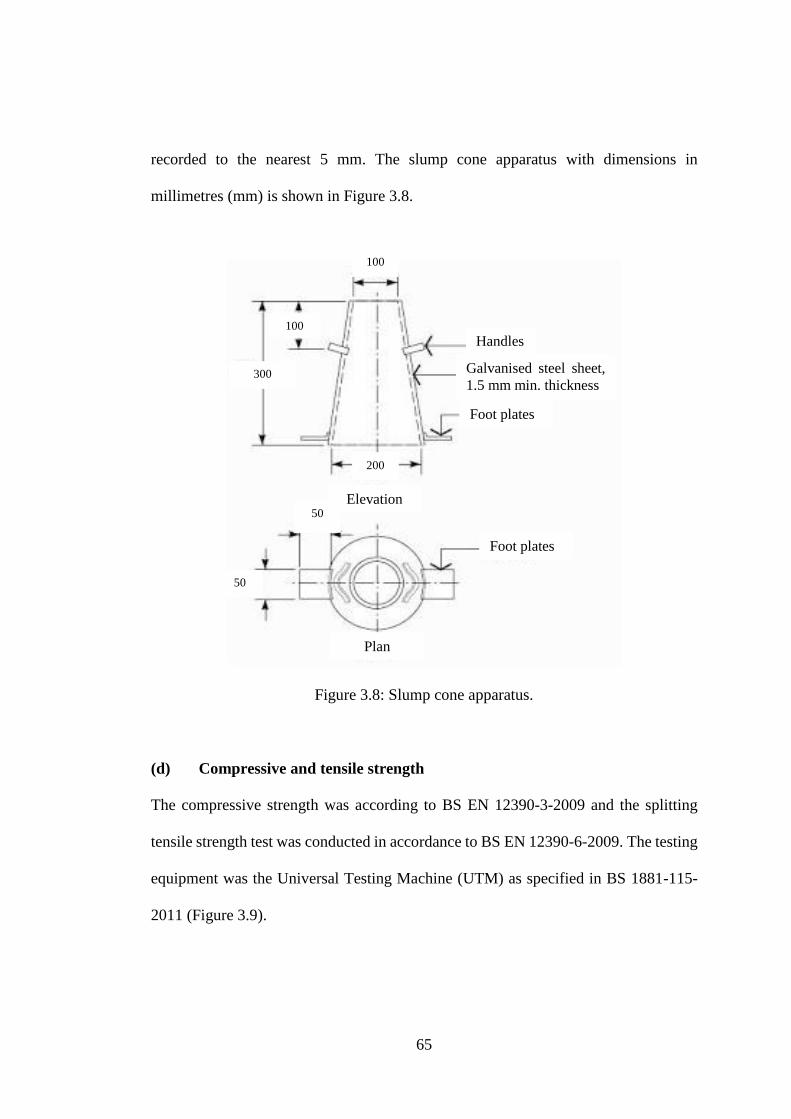
65
recorded to the nearest 5 mm. The slump cone apparatus with dimensions in
millimetres (mm) is shown in Figure 3.8.
Figure 3.8: Slump cone apparatus.
(d) Compressive and tensile strength
The compressive strength was according to BS EN 12390-3-2009 and the splitting
tensile strength test was conducted in accordance to BS EN 12390-6-2009. The testing
equipment was the Universal Testing Machine (UTM) as specified in BS 1881-115-
2011 (Figure 3.9).
Handles
Galvanised steel sheet,
1.5 mm min. thickness
Foot plates
Foot plates
Elevation
Plan
200
300
100
100
50
50
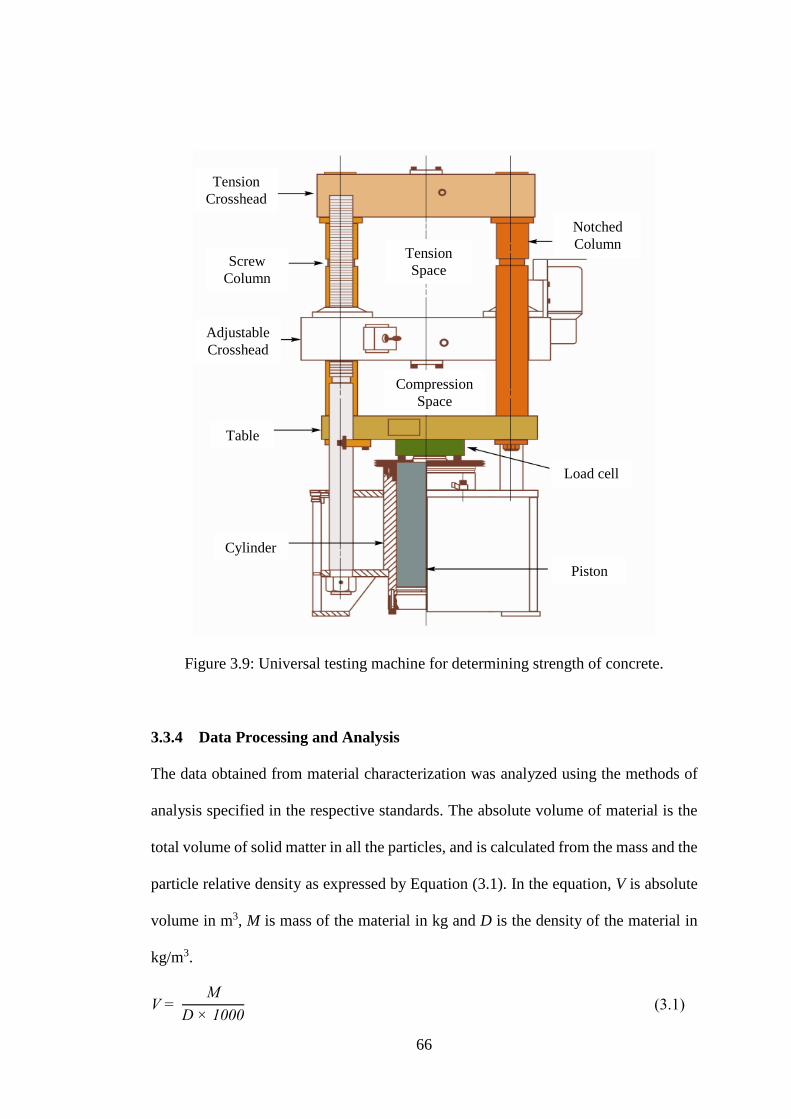
66
Figure 3.9: Universal testing machine for determining strength of concrete.
3.3.4 Data Processing and Analysis
The data obtained from material characterization was analyzed using the methods of
analysis specified in the respective standards. The absolute volume of material is the
total volume of solid matter in all the particles, and is calculated from the mass and the
particle relative density as expressed by Equation (3.1). In the equation, V is absolute
volume in m3, M is mass of the material in kg and D is the density of the material in
kg/m3.
V = M
D × 1000 (3.1)
Tension
Crosshead
Screw
Column
Adjustable
Crosshead
Tension
Space
Compression
Space
Notched
Column
Load cell
Table
Cylinder
Piston
67
Slump was specified as dependent on method of concrete transportation, placing and
compacting. The type of cement, maximum water cement ratio, (Wc) and minimum
cement content were also specified. The density of concrete and other characteristics
were obtained from the manufacture’s manual and cement content was calculated
using Equation (3.2). In this equation, C is the cement content in kg, W is the water
content also in kg and Wc is the water cement ratio.
C = WWc⁄ (3.2)
Using excel sheets and by iteration, masses of all the materials for the different
concrete mixes were obtained. The results of workability, compressive and splitting
tensile strengths were analysed in accordance with the methods specified in the
respective standards. From the standards, the compressive and splitting tensile
strengths of concrete were calculated using Equations 3.3 and 3.4 respectively. In
these equations, fcs is the compressive strength, fts is the tensile splitting strength, F is
the maximum load at failure, L is the length of the line of contact of the specimen, d is
the designated cross-sectional dimension and Ac is the cross-sectional area of the
specimen on which the compressive force acts.
Ff cs
Ac
(3.3)
2ts
Ff
Ld (3.4)
Using excel spreadsheet, graphs were plotted and regression analysis was carried out
to study the relationship between variables.
68
3.4 Analysing the Cost-Benefit of Using Ceramic and Porcelain Powders in
Concrete
3.4.1 Data Collection Procedure
The aim of this objective was to compare the cost of one cubic metre of optimal
concrete mix with the cost of the same quantity conventional concrete mix. The
relevant data was collected as elucidated in Sections 3.2.2 and 3.3.3. The Civil
Engineering Standard Method of Measurement (CEMM) was used to evaluate the cost
of concrete production. A conclusion was drawn based on the difference in cost saving
between the two options.
As concerns the benefits, Environmental Impact Assessment (EIA) was carried out.
The aspects of the EIA included: the objectives of the study; the technology,
procedures and processes used in the implementation of the study; the materials to be
used in the implementation of the study objectives; the products, by-products, and
waste to be generated by the production of concrete alternative ingredients; reviewing
existing legal and institutional framework related to waste management; identifying
and analyse alternative options for the proposed waste management systems and
developing mitigation measures for the negative impacts of the study. Two indicators
(abiotic deletion and global warming) were used to evaluate the environmental
impacts.
The following information was required to define cost per unit of work: correct
information of the market price of the materials at the time of need to be used as a
prime cost, correct information of the rates of various categories of skilled and
69
unskilled labourers as wage rates to be used for daily work rate, output of labourers
per day for various types of items (productivity), correct information of the rates of
various categories of equipment and tools as rental rates to be used for major items of
rates.
Total cost per unit of work (TC) was grouped into two components; direct cost and
indirect cost. The direct cost (DC) included cost due to material, cost due to labour,
cost due to equipment, whereas the indirect cost (IC) covers overhead costs, and
contractor’s profit. Overhead costs for general office facility, rents, taxes, electrical
light, water, and other miscellaneous items were not considered in the analysis.
3.4.2 Data Analysis
The cost benefit analysis was done to compare the cost of housing construction with
concrete having 0% cement substitute and that with the optimal concrete mix. These
assessments were calculated using Equations 3.5, 3.6 and 3.7. In these equations, Cr is
percentage cost reduction, ADr is the percentage abiotic depletion reduction, (CO2)r is
the percentage carbon dioxide reduction, C0 is the material cost of conventional
concrete mix, C20 is the material cost of optimal concrete mix, Ec is the energy
consumption required for production of 1 kg of cement, Ew is the energy consumption
required for production of 1 kg of waste powders, CEc is the CO2 emission in
production of one ton of cement and CEw is the CO2 emission in production of one ton
of waste powders.
Cr = ( C 0 - C20
C 0) ×100 % (3.5)
70
ADr = (1 − Ec - Ew
Ec
) ×100 % (3.6)
(CO2)r = ( 1 −CE c - CE w
CE c) ×100 % (3.7)
In addition, cost and environmental impacts were also compared using graphs plotted
in Microsoft excel spreadsheet.
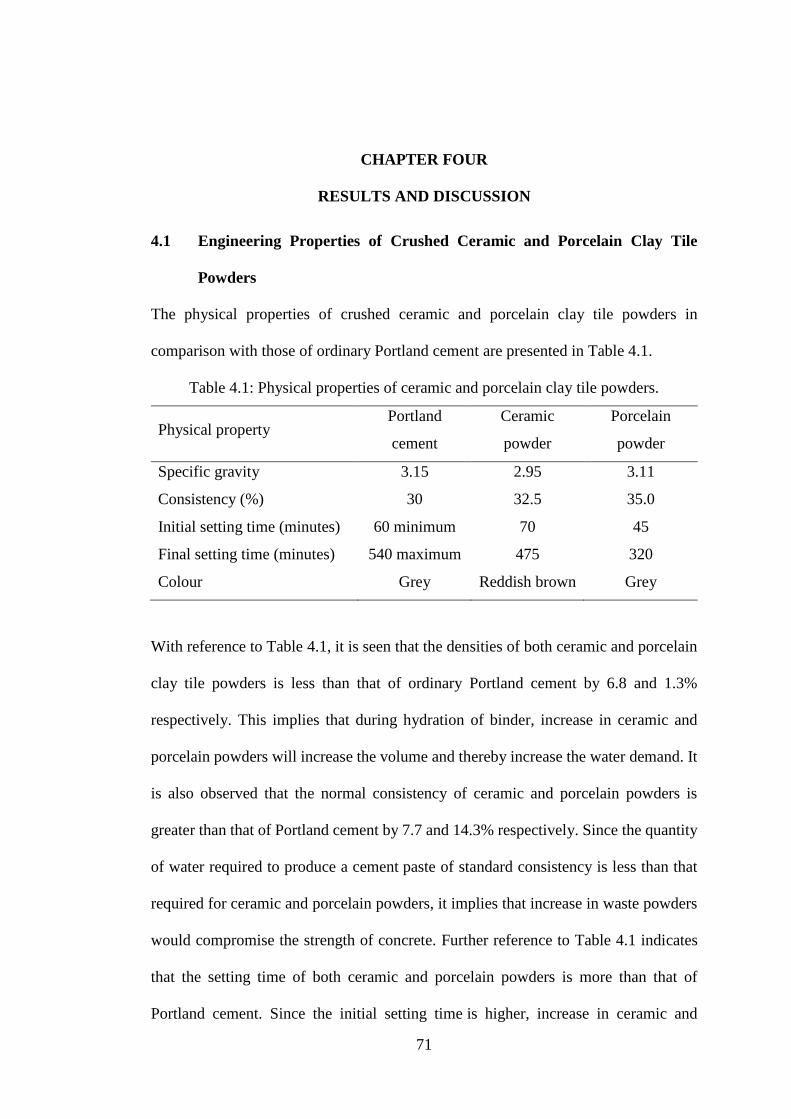
71
CHAPTER FOUR
4 RESULTS AND DISCUSSION
4.1 Engineering Properties of Crushed Ceramic and Porcelain Clay Tile
Powders
The physical properties of crushed ceramic and porcelain clay tile powders in
comparison with those of ordinary Portland cement are presented in Table 4.1.
Table 4.1: Physical properties of ceramic and porcelain clay tile powders.
Physical property Portland
cement
Ceramic
powder
Porcelain
powder
Specific gravity 3.15 2.95 3.11
Consistency (%) 30 32.5 35.0
Initial setting time (minutes) 60 minimum 70 45
Final setting time (minutes) 540 maximum 475 320
Colour Grey Reddish brown Grey
With reference to Table 4.1, it is seen that the densities of both ceramic and porcelain
clay tile powders is less than that of ordinary Portland cement by 6.8 and 1.3%
respectively. This implies that during hydration of binder, increase in ceramic and
porcelain powders will increase the volume and thereby increase the water demand. It
is also observed that the normal consistency of ceramic and porcelain powders is
greater than that of Portland cement by 7.7 and 14.3% respectively. Since the quantity
of water required to produce a cement paste of standard consistency is less than that
required for ceramic and porcelain powders, it implies that increase in waste powders
would compromise the strength of concrete. Further reference to Table 4.1 indicates
that the setting time of both ceramic and porcelain powders is more than that of
Portland cement. Since the initial setting time is higher, increase in ceramic and
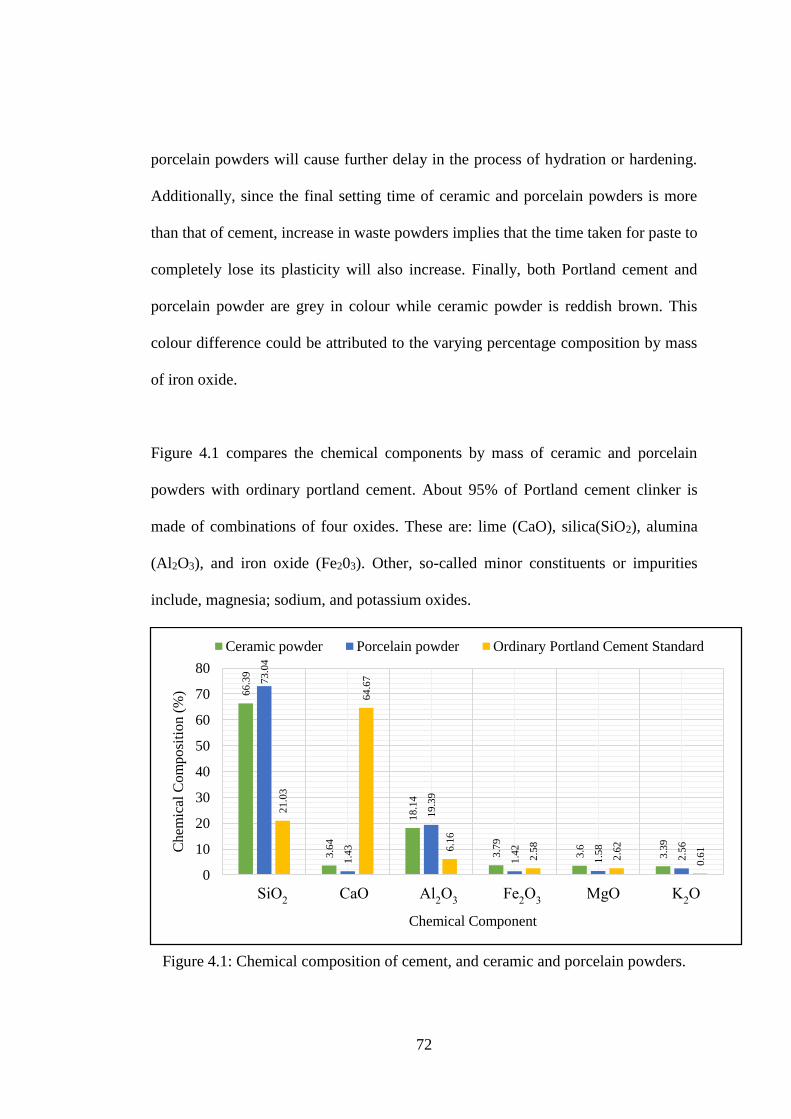
72
porcelain powders will cause further delay in the process of hydration or hardening.
Additionally, since the final setting time of ceramic and porcelain powders is more
than that of cement, increase in waste powders implies that the time taken for paste to
completely lose its plasticity will also increase. Finally, both Portland cement and
porcelain powder are grey in colour while ceramic powder is reddish brown. This
colour difference could be attributed to the varying percentage composition by mass
of iron oxide.
Figure 4.1 compares the chemical components by mass of ceramic and porcelain
powders with ordinary portland cement. About 95% of Portland cement clinker is
made of combinations of four oxides. These are: lime (CaO), silica(SiO2), alumina
(Al2O3), and iron oxide (Fe203). Other, so-called minor constituents or impurities
include, magnesia; sodium, and potassium oxides.
Figure 4.1: Chemical composition of cement, and ceramic and porcelain powders.
66
.39
3.6
4
18
.14
3.7
9
3.6
3.3
9
73
.04
1.4
3
19
.39
1.4
2
1.5
8
2.5
6
21
.03
64
.67
6.1
6
2.5
8
2.6
2
0.6
1
0
10
20
30
40
50
60
70
80
SiO2 CaO Al2O3 Fe2O3 MgO K2O
Ch
emic
al C
om
po
siti
on
(%
)
Chemical Component
Ceramic powder Porcelain powder Ordinary Portland Cement Standard
SiO2 CaO Al
2O
3 Fe
2O
3 MgO K
2O
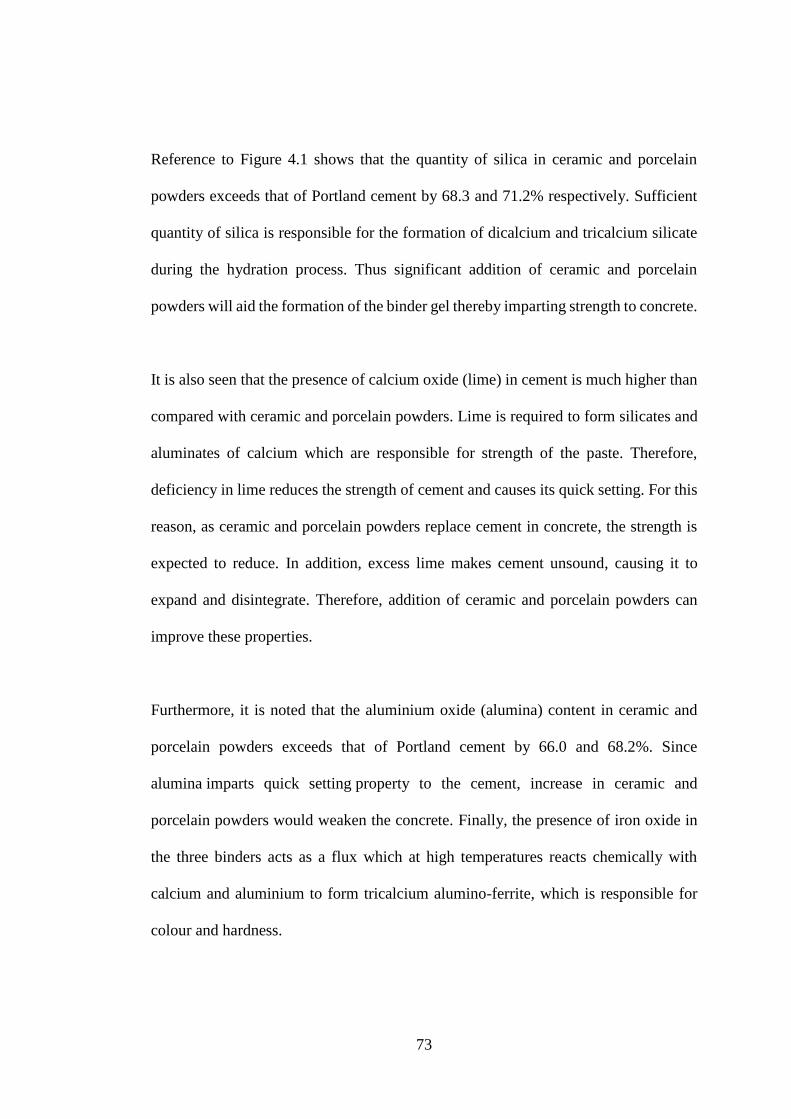
73
Reference to Figure 4.1 shows that the quantity of silica in ceramic and porcelain
powders exceeds that of Portland cement by 68.3 and 71.2% respectively. Sufficient
quantity of silica is responsible for the formation of dicalcium and tricalcium silicate
during the hydration process. Thus significant addition of ceramic and porcelain
powders will aid the formation of the binder gel thereby imparting strength to concrete.
It is also seen that the presence of calcium oxide (lime) in cement is much higher than
compared with ceramic and porcelain powders. Lime is required to form silicates and
aluminates of calcium which are responsible for strength of the paste. Therefore,
deficiency in lime reduces the strength of cement and causes its quick setting. For this
reason, as ceramic and porcelain powders replace cement in concrete, the strength is
expected to reduce. In addition, excess lime makes cement unsound, causing it to
expand and disintegrate. Therefore, addition of ceramic and porcelain powders can
improve these properties.
Furthermore, it is noted that the aluminium oxide (alumina) content in ceramic and
porcelain powders exceeds that of Portland cement by 66.0 and 68.2%. Since
alumina imparts quick setting property to the cement, increase in ceramic and
porcelain powders would weaken the concrete. Finally, the presence of iron oxide in
the three binders acts as a flux which at high temperatures reacts chemically with
calcium and aluminium to form tricalcium alumino-ferrite, which is responsible for
colour and hardness.
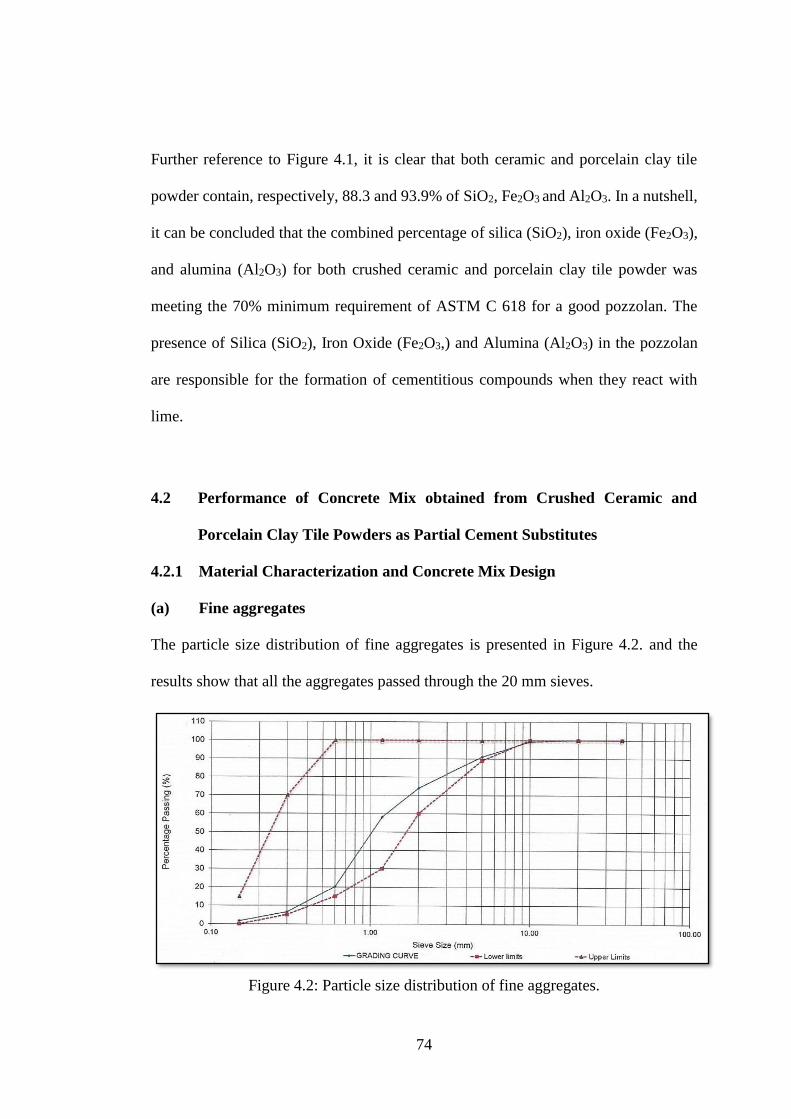
74
Further reference to Figure 4.1, it is clear that both ceramic and porcelain clay tile
powder contain, respectively, 88.3 and 93.9% of SiO2, Fe2O3 and Al2O3. In a nutshell,
it can be concluded that the combined percentage of silica (SiO2), iron oxide (Fe2O3),
and alumina (Al2O3) for both crushed ceramic and porcelain clay tile powder was
meeting the 70% minimum requirement of ASTM C 618 for a good pozzolan. The
presence of Silica (SiO2), Iron Oxide (Fe2O3,) and Alumina (Al2O3) in the pozzolan
are responsible for the formation of cementitious compounds when they react with
lime.
4.2 Performance of Concrete Mix obtained from Crushed Ceramic and
Porcelain Clay Tile Powders as Partial Cement Substitutes
4.2.1 Material Characterization and Concrete Mix Design
(a) Fine aggregates
The particle size distribution of fine aggregates is presented in Figure 4.2. and the
results show that all the aggregates passed through the 20 mm sieves.
Figure 4.2: Particle size distribution of fine aggregates.
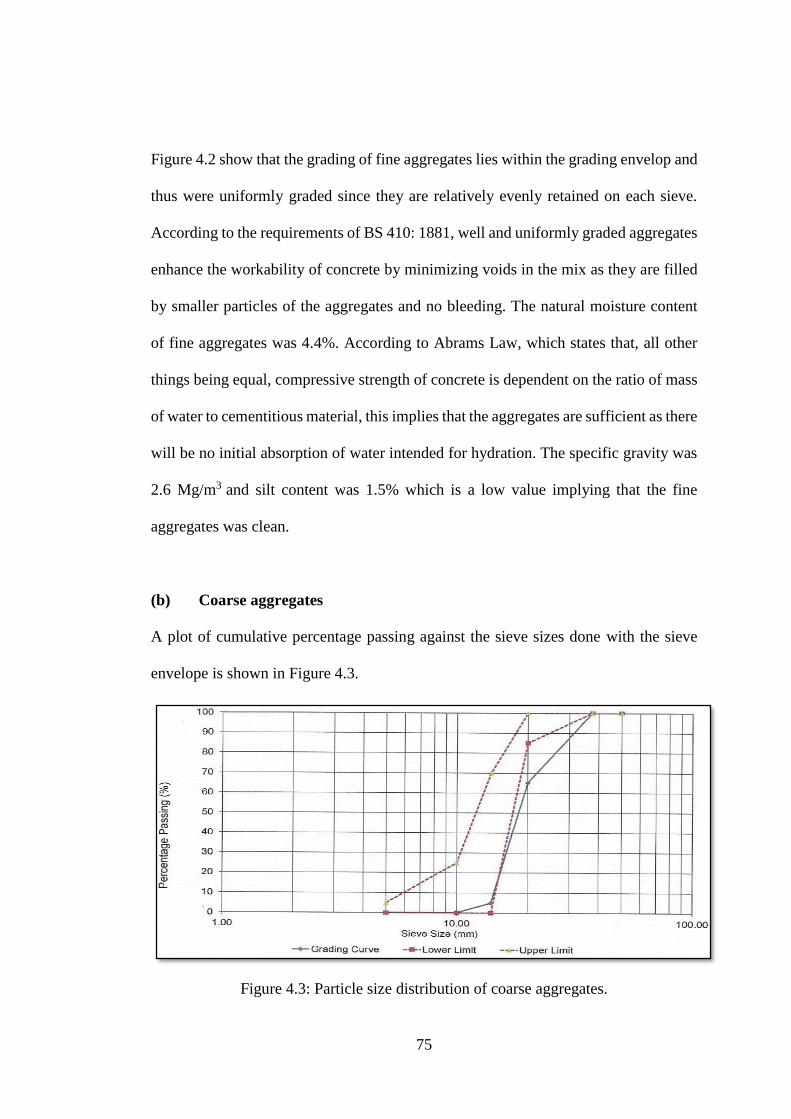
75
Figure 4.2 show that the grading of fine aggregates lies within the grading envelop and
thus were uniformly graded since they are relatively evenly retained on each sieve.
According to the requirements of BS 410: 1881, well and uniformly graded aggregates
enhance the workability of concrete by minimizing voids in the mix as they are filled
by smaller particles of the aggregates and no bleeding. The natural moisture content
of fine aggregates was 4.4%. According to Abrams Law, which states that, all other
things being equal, compressive strength of concrete is dependent on the ratio of mass
of water to cementitious material, this implies that the aggregates are sufficient as there
will be no initial absorption of water intended for hydration. The specific gravity was
2.6 Mg/m3 and silt content was 1.5% which is a low value implying that the fine
aggregates was clean.
(b) Coarse aggregates
A plot of cumulative percentage passing against the sieve sizes done with the sieve
envelope is shown in Figure 4.3.
Figure 4.3: Particle size distribution of coarse aggregates.
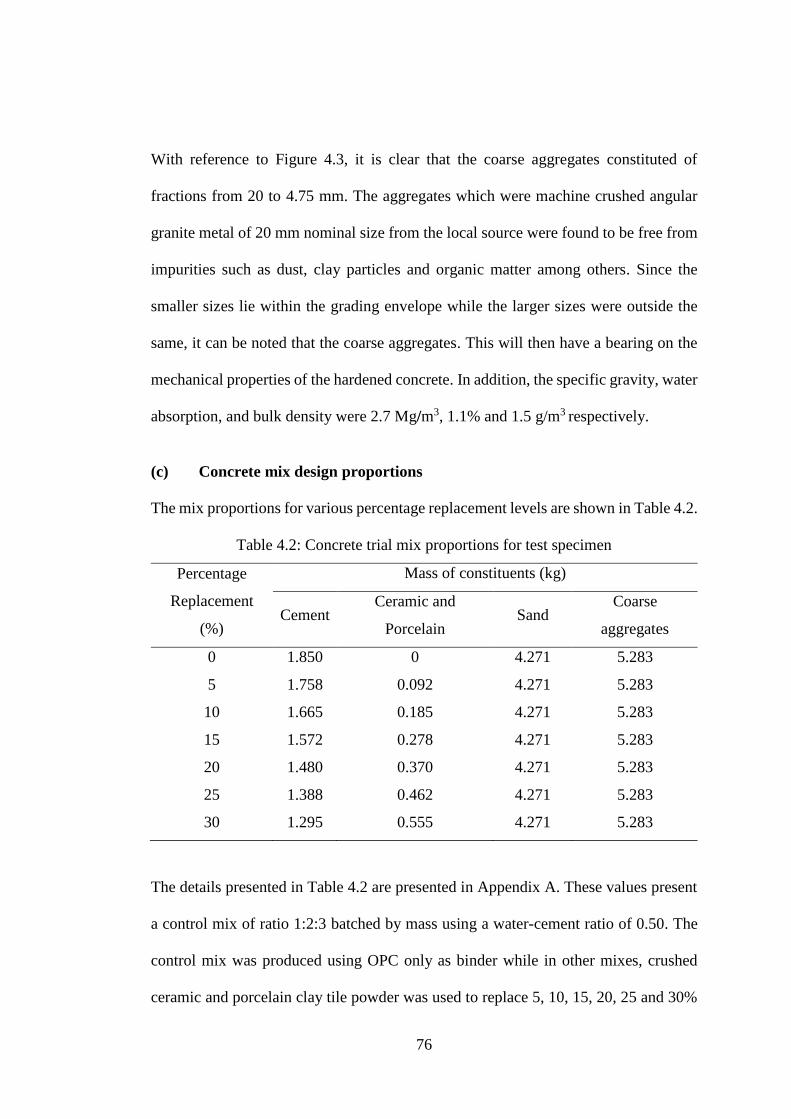
76
With reference to Figure 4.3, it is clear that the coarse aggregates constituted of
fractions from 20 to 4.75 mm. The aggregates which were machine crushed angular
granite metal of 20 mm nominal size from the local source were found to be free from
impurities such as dust, clay particles and organic matter among others. Since the
smaller sizes lie within the grading envelope while the larger sizes were outside the
same, it can be noted that the coarse aggregates. This will then have a bearing on the
mechanical properties of the hardened concrete. In addition, the specific gravity, water
absorption, and bulk density were 2.7 Mg/m3, 1.1% and 1.5 g/m3 respectively.
(c) Concrete mix design proportions
The mix proportions for various percentage replacement levels are shown in Table 4.2.
Table 4.2: Concrete trial mix proportions for test specimen
Percentage
Replacement
(%)
Mass of constituents (kg)
Cement Ceramic and
Porcelain Sand
Coarse
aggregates
0 1.850 0 4.271 5.283
5 1.758 0.092 4.271 5.283
10 1.665 0.185 4.271 5.283
15 1.572 0.278 4.271 5.283
20 1.480 0.370 4.271 5.283
25 1.388 0.462 4.271 5.283
30 1.295 0.555 4.271 5.283
The details presented in Table 4.2 are presented in Appendix A. These values present
a control mix of ratio 1:2:3 batched by mass using a water-cement ratio of 0.50. The
control mix was produced using OPC only as binder while in other mixes, crushed
ceramic and porcelain clay tile powder was used to replace 5, 10, 15, 20, 25 and 30%
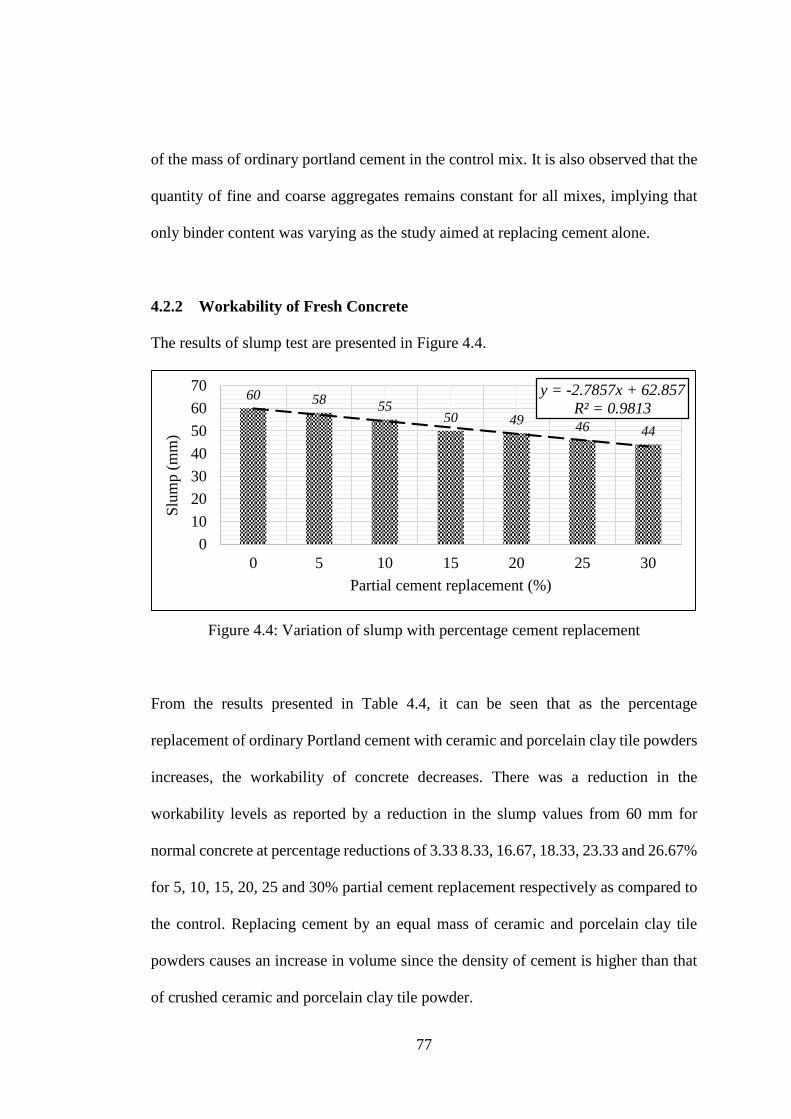
77
of the mass of ordinary portland cement in the control mix. It is also observed that the
quantity of fine and coarse aggregates remains constant for all mixes, implying that
only binder content was varying as the study aimed at replacing cement alone.
4.2.2 Workability of Fresh Concrete
The results of slump test are presented in Figure 4.4.
Figure 4.4: Variation of slump with percentage cement replacement
From the results presented in Table 4.4, it can be seen that as the percentage
replacement of ordinary Portland cement with ceramic and porcelain clay tile powders
increases, the workability of concrete decreases. There was a reduction in the
workability levels as reported by a reduction in the slump values from 60 mm for
normal concrete at percentage reductions of 3.33 8.33, 16.67, 18.33, 23.33 and 26.67%
for 5, 10, 15, 20, 25 and 30% partial cement replacement respectively as compared to
the control. Replacing cement by an equal mass of ceramic and porcelain clay tile
powders causes an increase in volume since the density of cement is higher than that
of crushed ceramic and porcelain clay tile powder.
60 5855
50 4946 44
y = -2.7857x + 62.857
R² = 0.9813
0
10
20
30
40
50
60
70
0 5 10 15 20 25 30
Slu
mp (
mm
)
Partial cement replacement (%)
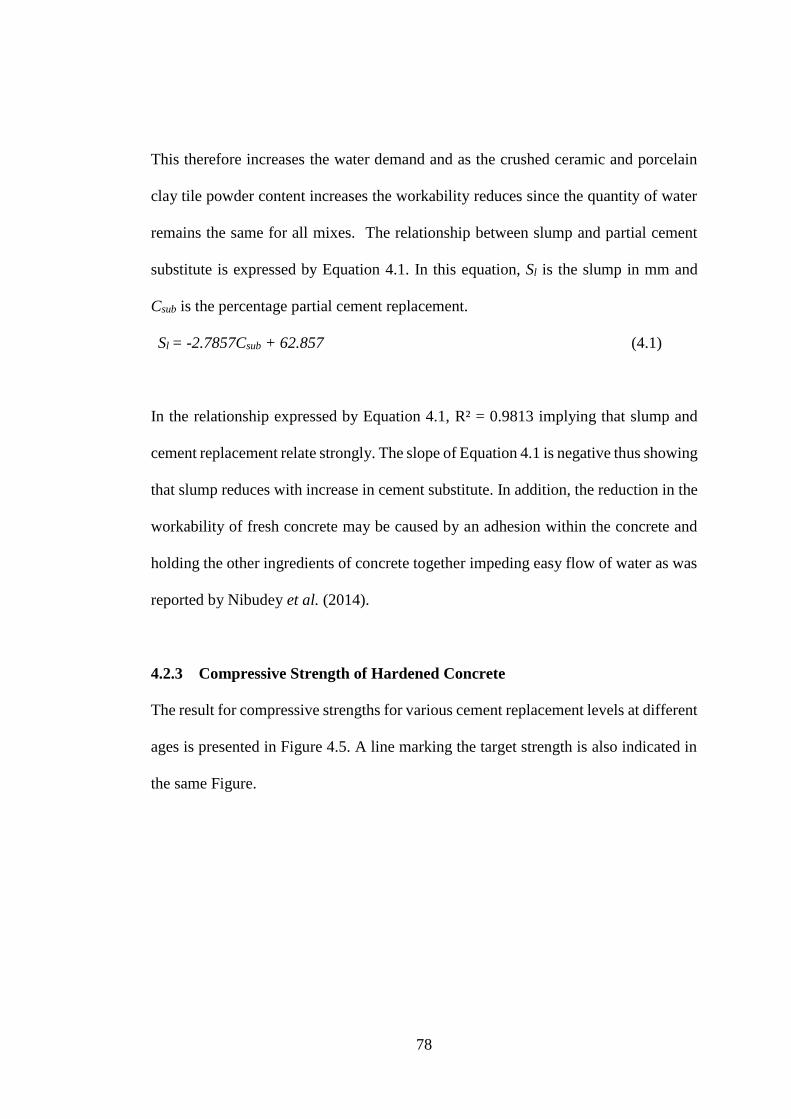
78
This therefore increases the water demand and as the crushed ceramic and porcelain
clay tile powder content increases the workability reduces since the quantity of water
remains the same for all mixes. The relationship between slump and partial cement
substitute is expressed by Equation 4.1. In this equation, Sl is the slump in mm and
Csub is the percentage partial cement replacement.
Sl = -2.7857Csub + 62.857 (4.1)
In the relationship expressed by Equation 4.1, R² = 0.9813 implying that slump and
cement replacement relate strongly. The slope of Equation 4.1 is negative thus showing
that slump reduces with increase in cement substitute. In addition, the reduction in the
workability of fresh concrete may be caused by an adhesion within the concrete and
holding the other ingredients of concrete together impeding easy flow of water as was
reported by Nibudey et al. (2014).
4.2.3 Compressive Strength of Hardened Concrete
The result for compressive strengths for various cement replacement levels at different
ages is presented in Figure 4.5. A line marking the target strength is also indicated in
the same Figure.
79
Figure 4.5: Compressive strengths for various replacement levels at different ages.
Concrete derives its strength from the pozzolanic reaction between silica in pozzolan
and the calcium hydroxide liberated during the hydration of OPC. In the very first
period after the adsorption of water on the surface of the dry powder, the dissolution
of part of the inorganic phases starts to occur. Very soon, however, new silicate and
aluminate hydrated phases begin to precipitate from the solution on the existing grains,
thus favouring the further dissolution of the anhydrous phases through an incongruent
process. An amorphous calcium silicate hydrate, referred to as C-S-H, having the
properties of a rigid gel responsible for the binding characteristics of the cement is, is
formed during the hydrated phase. The C-S-H gel is the most abundant reaction
product and it occupies about 50% of the paste volume. A secondary product of the
hydration process of cement is crystalline portlandite (Ca(OH)2). The reaction of the
silicate and aluminate phases with water is an exothermic process. Because the C-S-H
gel forms a continuous layer that binds together the original cement particles into a
cohesive whole, it is responsible for most of the engineering properties of cement
0
5
10
15
20
25
30
35
40
0 5 10 15 20 25 30
Co
mp
ress
ive
stre
ngth
(M
Pa)
Partial cement replacement (%)
Compressive Strength (MPa) at 7 days Compressive Strength (MPa) at 14 days
Compressive Strength (MPa) at 28 days
Target strength
80
paste. The ability of the C-S-H gel to act as a binding phase arises from its nanometer-
level structure.
From Figure 4.5, it is seen that at low percentages of replacement, the quantity of silica
is low, therefore, despite the large quantity of calcium hydroxide liberated due to the
relatively large quantity of portland cement, only a limited quantity of C-S-H can be
formed. However, at high percentage replacement, the quantity of pozzolan in the mix
increases. C-S-H formed reduces due to liberation of a small quantity of Ca(OH)2 from
the hydration of the relatively low quantity of portland cement available. The strength
of concrete at both low and high percentage replacement is therefore low. It can also
be concluded that the strength of concrete depends on the relative proportions of silica
in crushed ceramic and porcelain powder and ordinary portland cement available.
In addition, the optimum reaction takes place at 5% replacement of OPC hence the rate
of strength gain with respect to time is highest for concrete with 5% replacement of
OPC by crushed ceramic and porcelain powder. The variation of compressive strength
of concrete is presented in Figure 4.6. The target compressive strength at 28 days was
achieved up to 20% replacement of cement with crushed ceramic and porcelain clay
tile powder beyond which the addition reduces the strength. This trend is similar at all
ages when specimen were testes testing. It is also seen that the strength of concrete
increases with age.
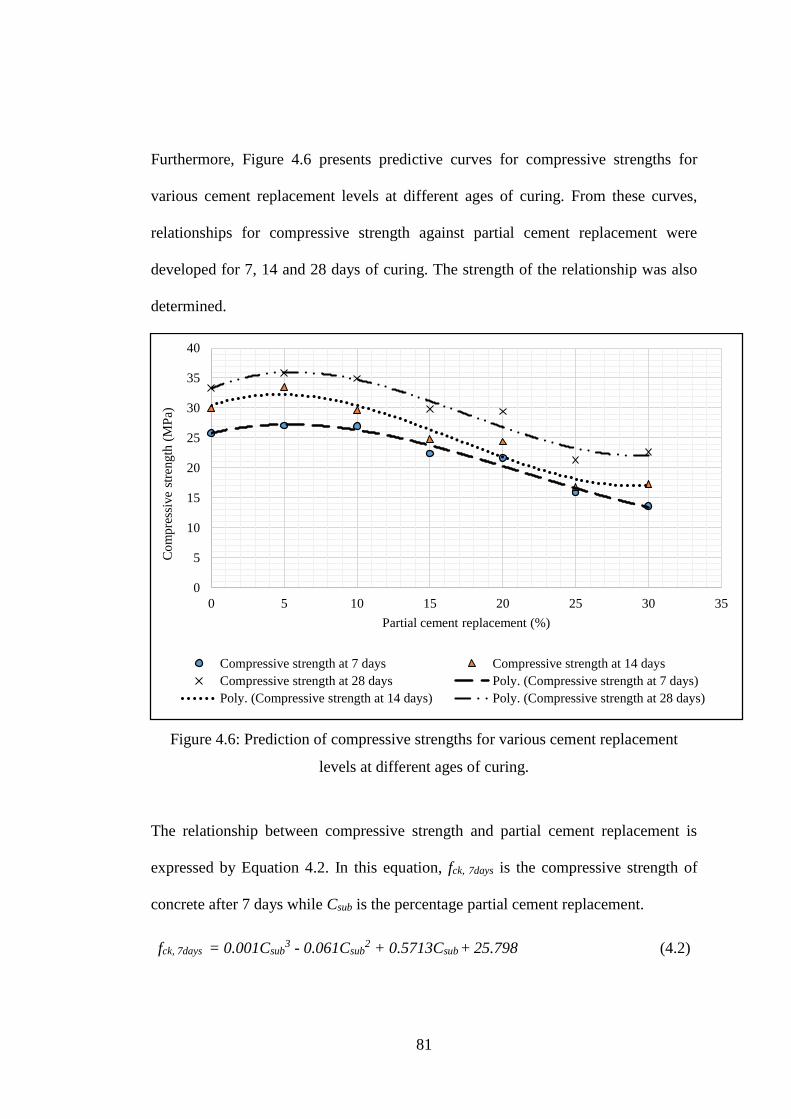
81
Furthermore, Figure 4.6 presents predictive curves for compressive strengths for
various cement replacement levels at different ages of curing. From these curves,
relationships for compressive strength against partial cement replacement were
developed for 7, 14 and 28 days of curing. The strength of the relationship was also
determined.
Figure 4.6: Prediction of compressive strengths for various cement replacement
levels at different ages of curing.
The relationship between compressive strength and partial cement replacement is
expressed by Equation 4.2. In this equation, fck, 7days is the compressive strength of
concrete after 7 days while Csub is the percentage partial cement replacement.
fck, 7days = 0.001Csub3 - 0.061Csub
2 + 0.5713Csub + 25.798 (4.2)
0
5
10
15
20
25
30
35
40
0 5 10 15 20 25 30 35
Co
mp
ress
ive
stre
ngth
(M
Pa)
Partial cement replacement (%)
Compressive strength at 7 days Compressive strength at 14 days
Compressive strength at 28 days Poly. (Compressive strength at 7 days)
Poly. (Compressive strength at 14 days) Poly. (Compressive strength at 28 days)
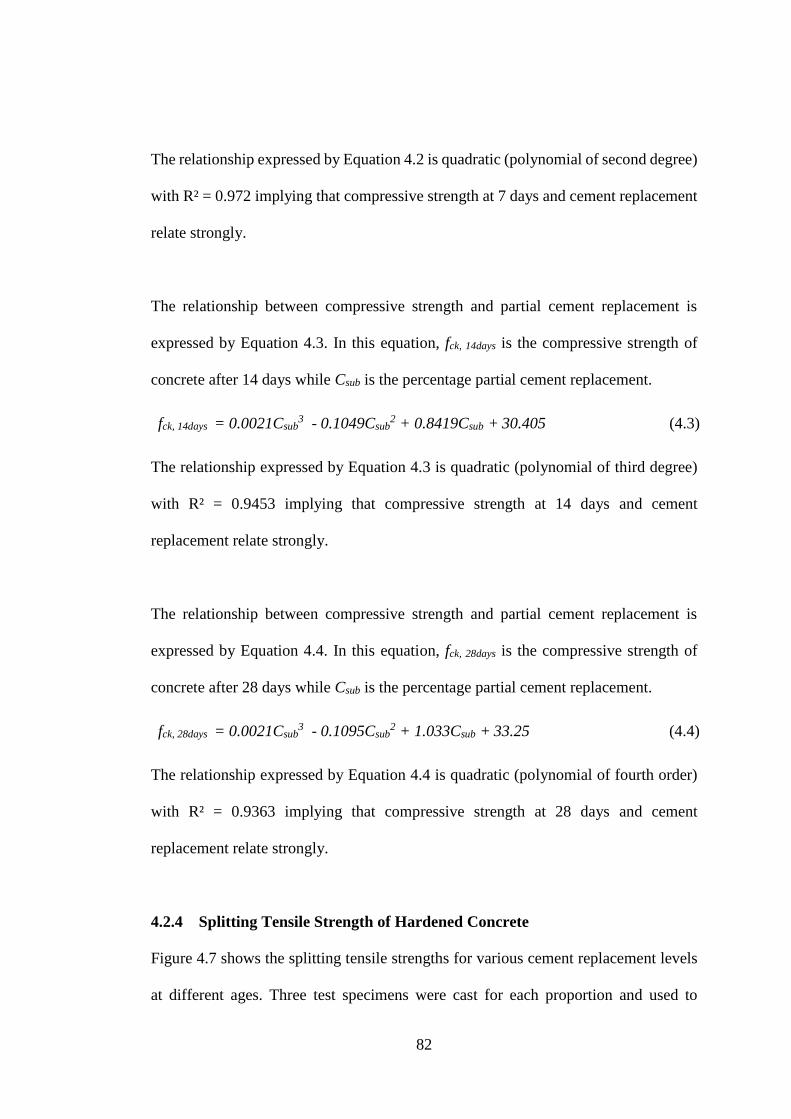
82
The relationship expressed by Equation 4.2 is quadratic (polynomial of second degree)
with R² = 0.972 implying that compressive strength at 7 days and cement replacement
relate strongly.
The relationship between compressive strength and partial cement replacement is
expressed by Equation 4.3. In this equation, fck, 14days is the compressive strength of
concrete after 14 days while Csub is the percentage partial cement replacement.
fck, 14days = 0.0021Csub3 - 0.1049Csub
2 + 0.8419Csub + 30.405 (4.3)
The relationship expressed by Equation 4.3 is quadratic (polynomial of third degree)
with R² = 0.9453 implying that compressive strength at 14 days and cement
replacement relate strongly.
The relationship between compressive strength and partial cement replacement is
expressed by Equation 4.4. In this equation, fck, 28days is the compressive strength of
concrete after 28 days while Csub is the percentage partial cement replacement.
fck, 28days = 0.0021Csub3 - 0.1095Csub
2 + 1.033Csub + 33.25 (4.4)
The relationship expressed by Equation 4.4 is quadratic (polynomial of fourth order)
with R² = 0.9363 implying that compressive strength at 28 days and cement
replacement relate strongly.
4.2.4 Splitting Tensile Strength of Hardened Concrete
Figure 4.7 shows the splitting tensile strengths for various cement replacement levels
at different ages. Three test specimens were cast for each proportion and used to
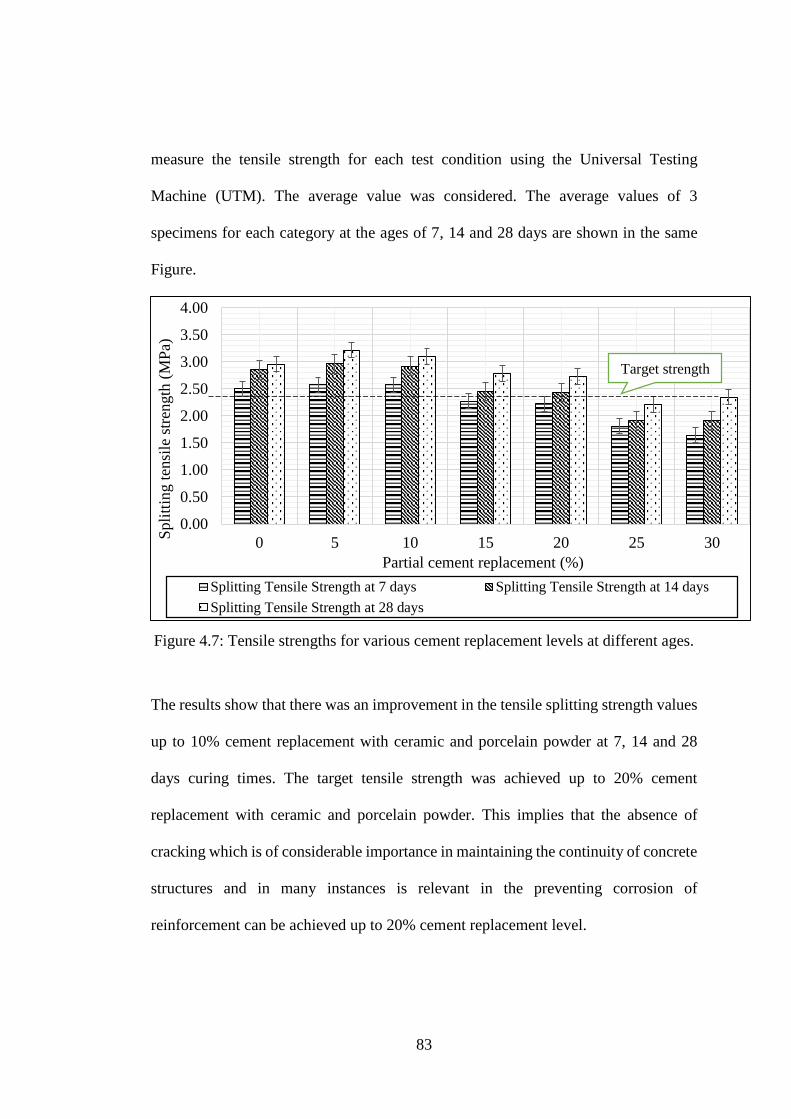
83
measure the tensile strength for each test condition using the Universal Testing
Machine (UTM). The average value was considered. The average values of 3
specimens for each category at the ages of 7, 14 and 28 days are shown in the same
Figure.
Figure 4.7: Tensile strengths for various cement replacement levels at different ages.
The results show that there was an improvement in the tensile splitting strength values
up to 10% cement replacement with ceramic and porcelain powder at 7, 14 and 28
days curing times. The target tensile strength was achieved up to 20% cement
replacement with ceramic and porcelain powder. This implies that the absence of
cracking which is of considerable importance in maintaining the continuity of concrete
structures and in many instances is relevant in the preventing corrosion of
reinforcement can be achieved up to 20% cement replacement level.
0.00
0.50
1.00
1.50
2.00
2.50
3.00
3.50
4.00
0 5 10 15 20 25 30
Spli
ttin
g t
ensi
le s
tren
gth
(M
Pa)
Partial cement replacement (%)
Splitting Tensile Strength at 7 days Splitting Tensile Strength at 14 days
Splitting Tensile Strength at 28 days
Target strength
84
Furthermore, Figure 4.8 presents curves upon which relationship between splitting
tensile strengths for various cement replacement levels at different ages of curing is
predicted in Equations 4.5, 4.6 and 4.7.
Figure 4.8: Prediction of splitting tensile strengths for various cement replacement
levels at different ages of curing.
The relationship between splitting tensile strength and partial cement replacement is
expressed by Equation 4.5. In this equation, fctk, 7days is the splitting tensile strength of
concrete after 7 days while Csub is the percentage partial cement replacement.
fctk, 7days = -0.0013Csub2 + 0.0076Csub + 2.5446 (4.5)
The relationship expressed by Equation 4.2 is quadratic (polynomial of second degree)
with R² = 0.9588 implying that compressive strength at 7 days and cement replacement
relate strongly.
0.00
0.50
1.00
1.50
2.00
2.50
3.00
3.50
0 5 10 15 20 25 30 35
Spli
ttin
g t
ensi
le s
tren
gth
(M
Pa)
Partial cement replacement (%)
Splitting Tensile Strength at 7 days Splitting Tensile Strength at 14 days
Splitting Tensile Strength at 28 days Poly. (Splitting Tensile Strength at 7 days)
Poly. (Splitting Tensile Strength at 14 days) Poly. (Splitting Tensile Strength at 28 days)
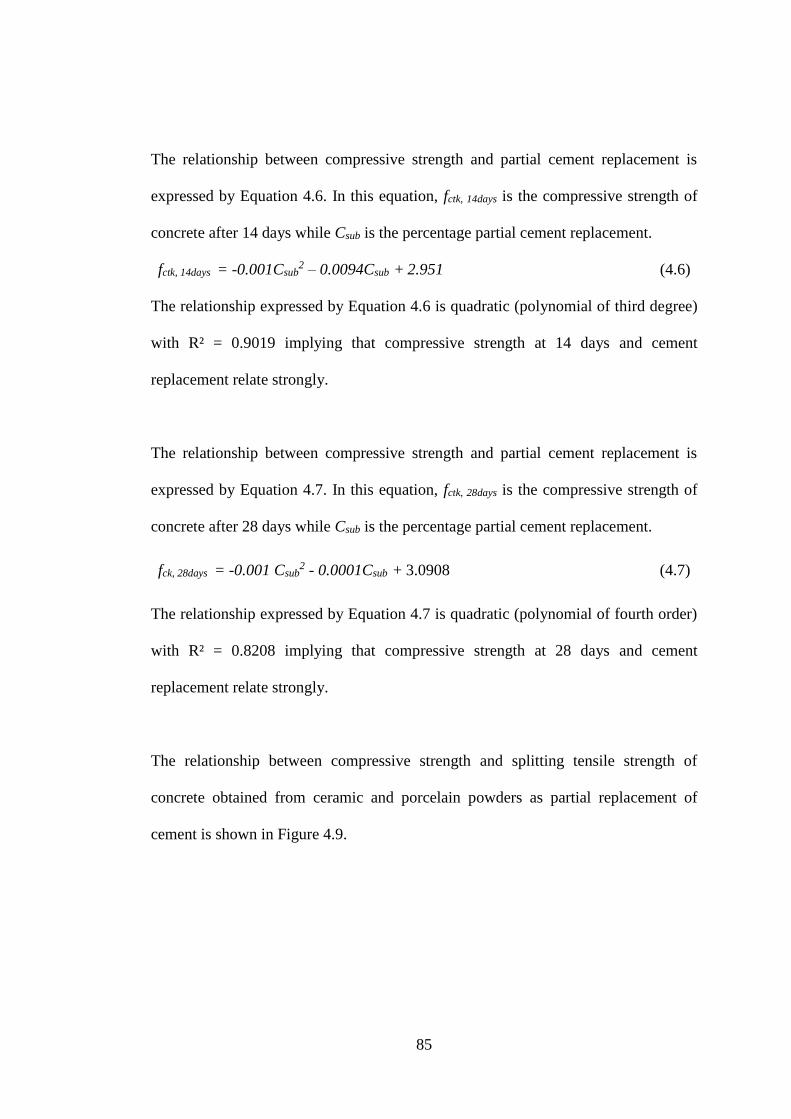
85
The relationship between compressive strength and partial cement replacement is
expressed by Equation 4.6. In this equation, fctk, 14days is the compressive strength of
concrete after 14 days while Csub is the percentage partial cement replacement.
fctk, 14days = -0.001Csub2 – 0.0094Csub + 2.951 (4.6)
The relationship expressed by Equation 4.6 is quadratic (polynomial of third degree)
with R² = 0.9019 implying that compressive strength at 14 days and cement
replacement relate strongly.
The relationship between compressive strength and partial cement replacement is
expressed by Equation 4.7. In this equation, fctk, 28days is the compressive strength of
concrete after 28 days while Csub is the percentage partial cement replacement.
fck, 28days = -0.001 Csub2 - 0.0001Csub + 3.0908 (4.7)
The relationship expressed by Equation 4.7 is quadratic (polynomial of fourth order)
with R² = 0.8208 implying that compressive strength at 28 days and cement
replacement relate strongly.
The relationship between compressive strength and splitting tensile strength of
concrete obtained from ceramic and porcelain powders as partial replacement of
cement is shown in Figure 4.9.
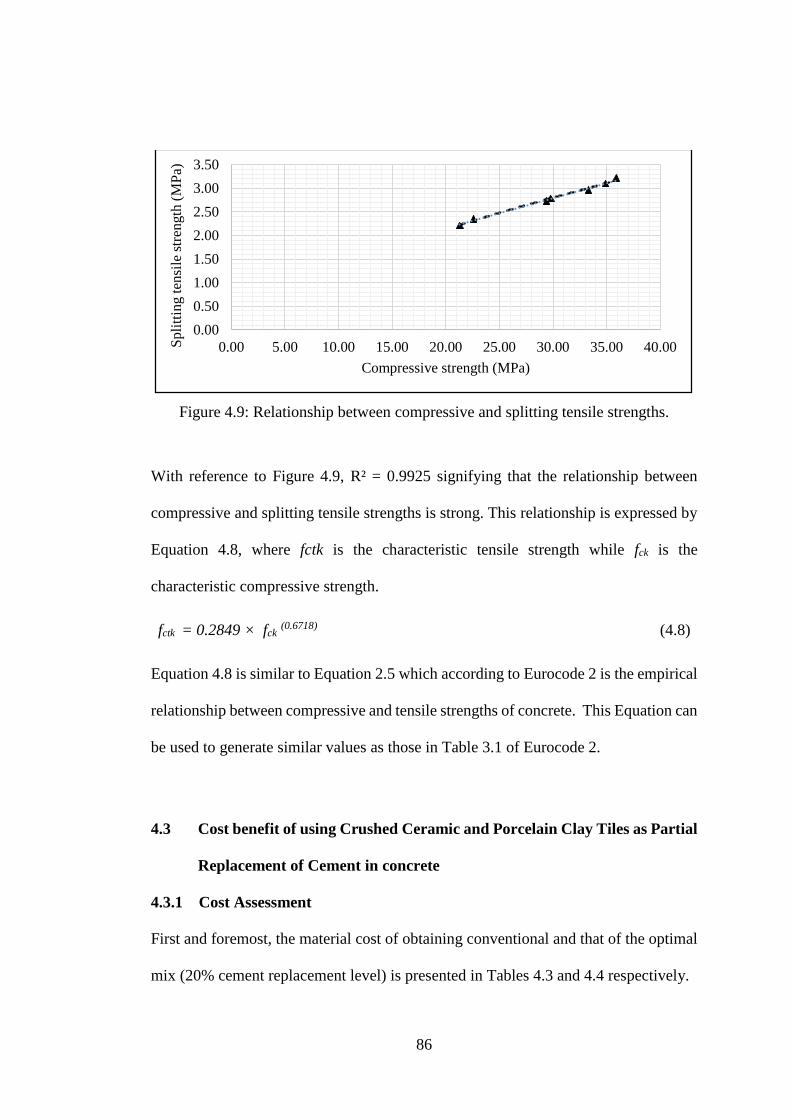
86
Figure 4.9: Relationship between compressive and splitting tensile strengths.
With reference to Figure 4.9, R² = 0.9925 signifying that the relationship between
compressive and splitting tensile strengths is strong. This relationship is expressed by
Equation 4.8, where fctk is the characteristic tensile strength while fck is the
characteristic compressive strength.
fctk = 0.2849 × fck (0.6718) (4.8)
Equation 4.8 is similar to Equation 2.5 which according to Eurocode 2 is the empirical
relationship between compressive and tensile strengths of concrete. This Equation can
be used to generate similar values as those in Table 3.1 of Eurocode 2.
4.3 Cost benefit of using Crushed Ceramic and Porcelain Clay Tiles as Partial
Replacement of Cement in concrete
4.3.1 Cost Assessment
First and foremost, the material cost of obtaining conventional and that of the optimal
mix (20% cement replacement level) is presented in Tables 4.3 and 4.4 respectively.
0.00
0.50
1.00
1.50
2.00
2.50
3.00
3.50
0.00 5.00 10.00 15.00 20.00 25.00 30.00 35.00 40.00Sp
litt
ing t
ensi
le s
tren
gth
(M
Pa)
Compressive strength (MPa)
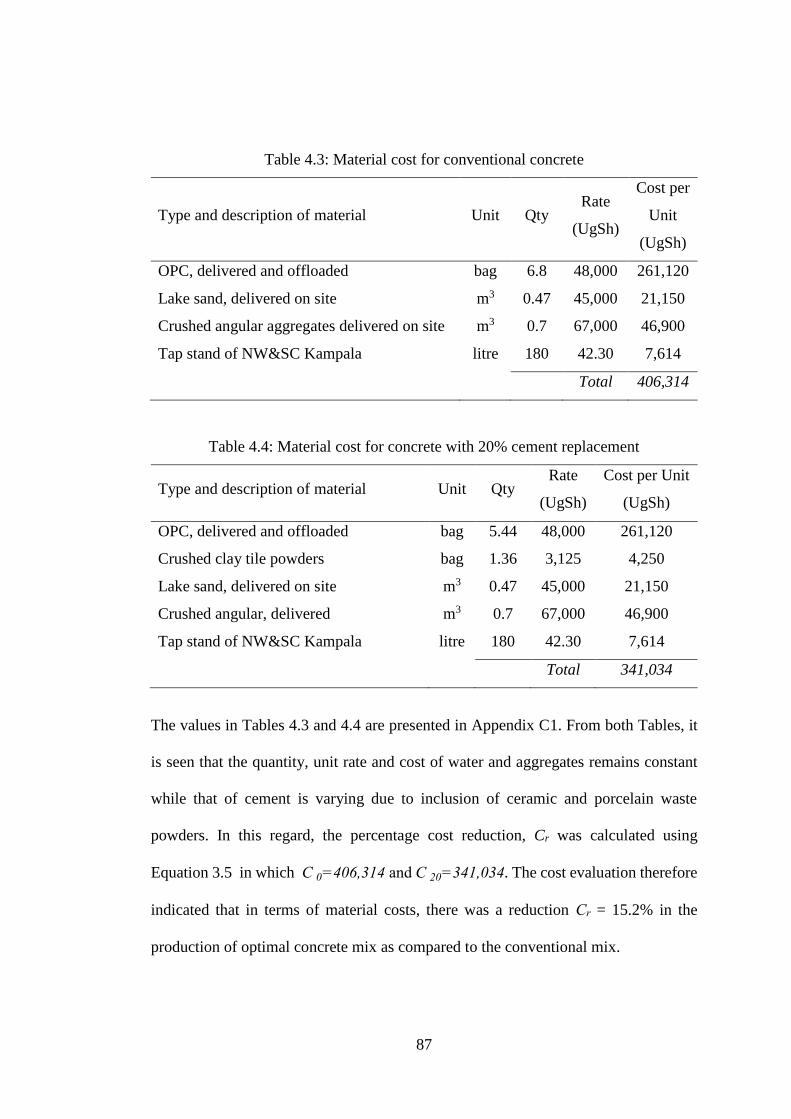
87
Table 4.3: Material cost for conventional concrete
Type and description of material Unit Qty Rate
(UgSh)
Cost per
Unit
(UgSh)
OPC, delivered and offloaded bag 6.8 48,000 261,120
Lake sand, delivered on site m3 0.47 45,000 21,150
Crushed angular aggregates delivered on site m3 0.7 67,000 46,900
Tap stand of NW&SC Kampala litre 180 42.30 7,614
Total 406,314
Table 4.4: Material cost for concrete with 20% cement replacement
Type and description of material Unit Qty Rate
(UgSh)
Cost per Unit
(UgSh)
OPC, delivered and offloaded bag 5.44 48,000 261,120
Crushed clay tile powders bag 1.36 3,125 4,250
Lake sand, delivered on site m3 0.47 45,000 21,150
Crushed angular, delivered m3 0.7 67,000 46,900
Tap stand of NW&SC Kampala litre 180 42.30 7,614
Total 341,034
The values in Tables 4.3 and 4.4 are presented in Appendix C1. From both Tables, it
is seen that the quantity, unit rate and cost of water and aggregates remains constant
while that of cement is varying due to inclusion of ceramic and porcelain waste
powders. In this regard, the percentage cost reduction, Cr was calculated using
Equation 3.5 in which C 0=406,314 and C 20=341,034. The cost evaluation therefore
indicated that in terms of material costs, there was a reduction Cr = 15.2% in the
production of optimal concrete mix as compared to the conventional mix.
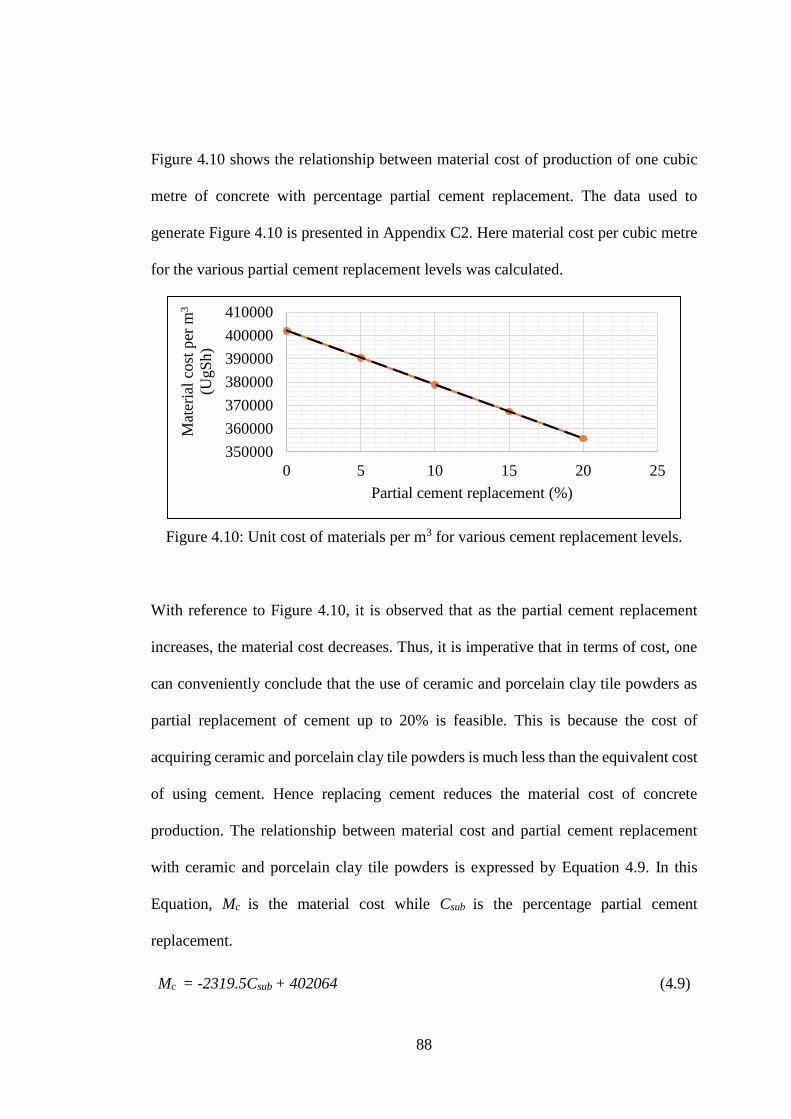
88
Figure 4.10 shows the relationship between material cost of production of one cubic
metre of concrete with percentage partial cement replacement. The data used to
generate Figure 4.10 is presented in Appendix C2. Here material cost per cubic metre
for the various partial cement replacement levels was calculated.
Figure 4.10: Unit cost of materials per m3 for various cement replacement levels.
With reference to Figure 4.10, it is observed that as the partial cement replacement
increases, the material cost decreases. Thus, it is imperative that in terms of cost, one
can conveniently conclude that the use of ceramic and porcelain clay tile powders as
partial replacement of cement up to 20% is feasible. This is because the cost of
acquiring ceramic and porcelain clay tile powders is much less than the equivalent cost
of using cement. Hence replacing cement reduces the material cost of concrete
production. The relationship between material cost and partial cement replacement
with ceramic and porcelain clay tile powders is expressed by Equation 4.9. In this
Equation, Mc is the material cost while Csub is the percentage partial cement
replacement.
Mc = -2319.5Csub + 402064 (4.9)
350000
360000
370000
380000
390000
400000
410000
0 5 10 15 20 25
Mat
eria
l co
st p
er m
3
(UgS
h)
Partial cement replacement (%)
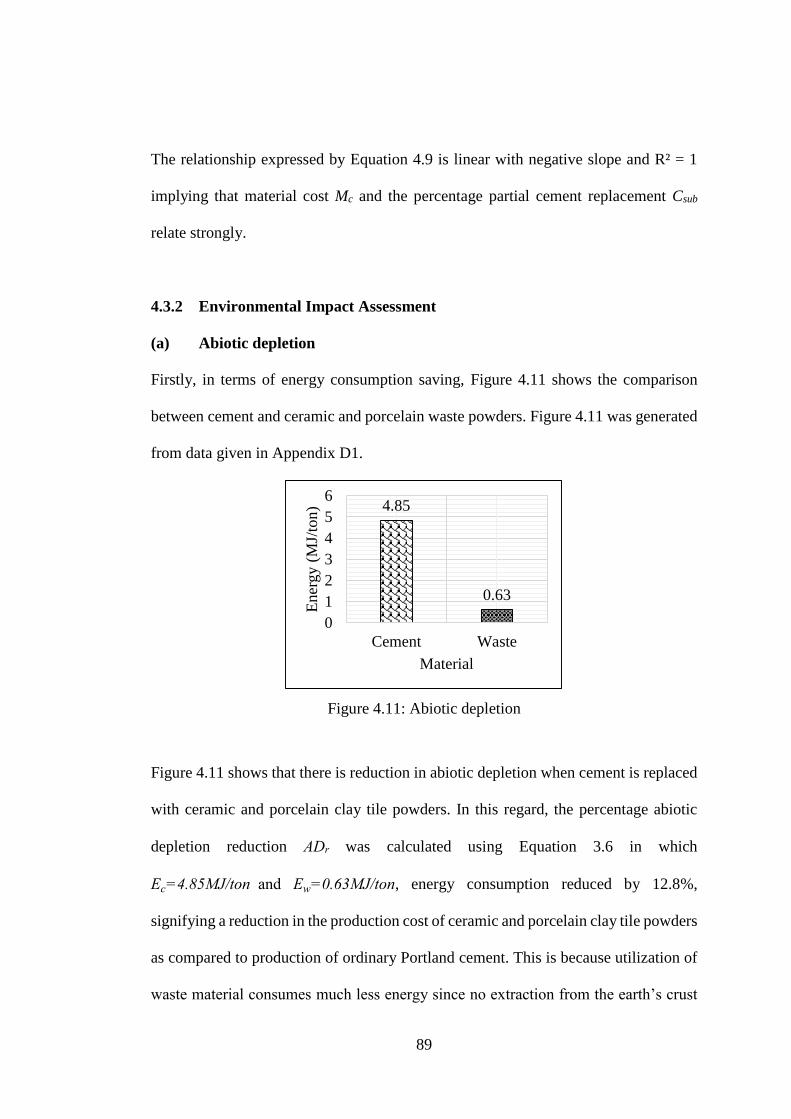
89
The relationship expressed by Equation 4.9 is linear with negative slope and R² = 1
implying that material cost Mc and the percentage partial cement replacement Csub
relate strongly.
4.3.2 Environmental Impact Assessment
(a) Abiotic depletion
Firstly, in terms of energy consumption saving, Figure 4.11 shows the comparison
between cement and ceramic and porcelain waste powders. Figure 4.11 was generated
from data given in Appendix D1.
Figure 4.11: Abiotic depletion
Figure 4.11 shows that there is reduction in abiotic depletion when cement is replaced
with ceramic and porcelain clay tile powders. In this regard, the percentage abiotic
depletion reduction ADr was calculated using Equation 3.6 in which
Ec=4.85MJ/ton and Ew=0.63MJ/ton, energy consumption reduced by 12.8%,
signifying a reduction in the production cost of ceramic and porcelain clay tile powders
as compared to production of ordinary Portland cement. This is because utilization of
waste material consumes much less energy since no extraction from the earth’s crust
4.85
0.63
0
1
2
3
4
5
6
Cement Waste
En
ergy (
MJ/
ton
)
Material
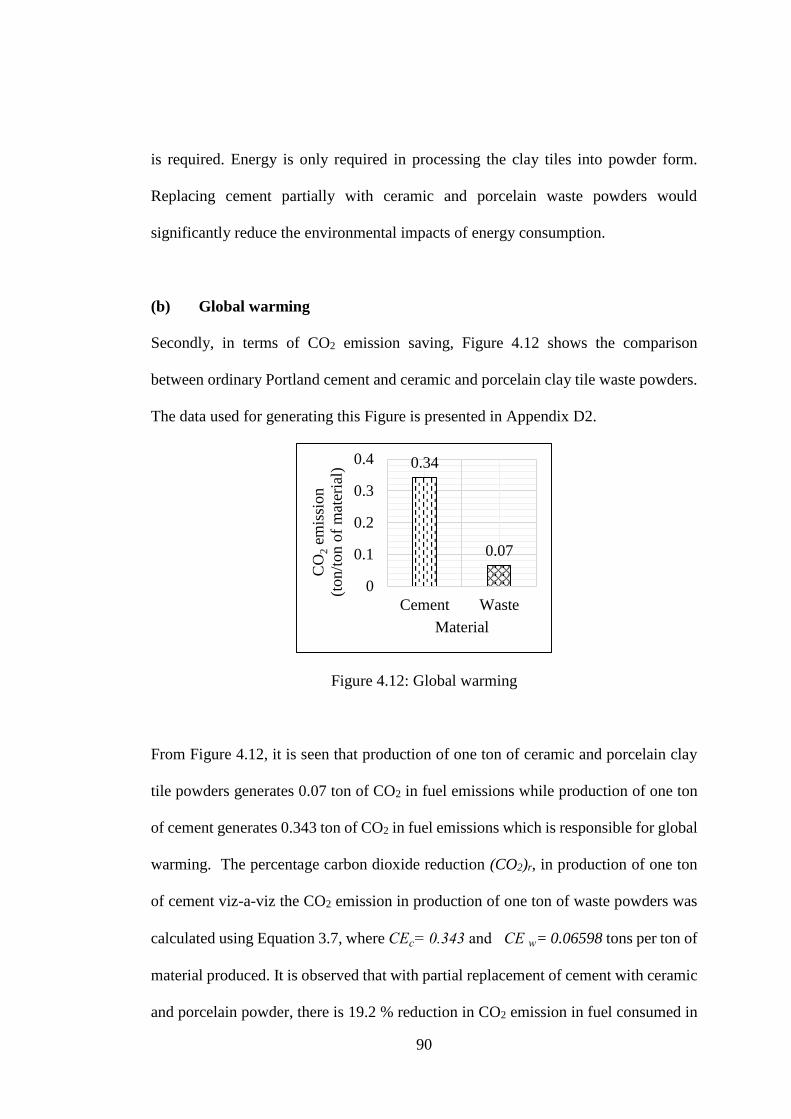
90
is required. Energy is only required in processing the clay tiles into powder form.
Replacing cement partially with ceramic and porcelain waste powders would
significantly reduce the environmental impacts of energy consumption.
(b) Global warming
Secondly, in terms of CO2 emission saving, Figure 4.12 shows the comparison
between ordinary Portland cement and ceramic and porcelain clay tile waste powders.
The data used for generating this Figure is presented in Appendix D2.
Figure 4.12: Global warming
From Figure 4.12, it is seen that production of one ton of ceramic and porcelain clay
tile powders generates 0.07 ton of CO2 in fuel emissions while production of one ton
of cement generates 0.343 ton of CO2 in fuel emissions which is responsible for global
warming. The percentage carbon dioxide reduction (CO2)r, in production of one ton
of cement viz-a-viz the CO2 emission in production of one ton of waste powders was
calculated using Equation 3.7, where CEc= 0.343 and CE w= 0.06598 tons per ton of
material produced. It is observed that with partial replacement of cement with ceramic
and porcelain powder, there is 19.2 % reduction in CO2 emission in fuel consumed in
0.34
0.07
0
0.1
0.2
0.3
0.4
Cement Waste
CO
2em
issi
on
(ton/t
on o
f m
ater
ial)
Material

91
their respective production. This carbon dioxide emission reduced by 19.2% implying
a significant reduction in global warming.
92
CHAPTER FIVE
5 CONCLUSIONS AND RECOMMENDATIONS
5.1 Conclusions
1) The physical properties of crushed ceramic and porcelain clay tile powders are
closely related. The combined percentage of silica (SiO2), iron oxide (Fe2O3),
and alumina (Al2O3) for both crushed ceramic and porcelain powders was
meeting the 70% minimum requirement of ASTM C 618 for a good pozzolan.
Increase in crushed ceramic and porcelain clay tile powder replacement
decreased the workability of concrete. Replacement of cement with crushed
ceramic and porcelain clay tile powder significantly increased the compressive
strength of concrete. Replacement of 5% of the mass of cement with crushed
ceramic and porcelain powders achieved the maximum compressive strength.
2) The 7-day, 14-day, and 28-day compressive strengths at 5% replacement
respectively showed increases of 5%, 12% and 8% over the compressive strength
of the control concrete at those ages.
The 28-day compressive strengths at 20% replacement showed increases of 18%
compared to the target compressive strength of C25. Hence the replacement of
cement using 20% crushed ceramic and porcelain powders in production of
concrete gives the required strength and can be considered as optimum
percentage. Further increase in the percentage addition of ceramic waste, reduces
the compressive strength of concrete by 56% at 28 days.
93
The 28-day splitting tensile strengths was achieved up to 20% replacement and
it showed increases of 8.2% compared to the target tensile strength of C25.
3) From the cost point of view, there was a reduction of 15.2 % between the
conventional and optimal concrete mixes. Replacing cement partially with
ceramic and porcelain waste powders would significantly reduce the
environmental impacts of energy consumption by 12.8 %, signifying saving in
abiotic resources like fuel and coal. There was also a reduction in terms of CO2
emission by 19.2 %, implying reduction in global warming.
5.2 Recommendations
5.2.1 For Possible Application
1) Crushed ceramic and porcelain clay tile powders may be used to replace cement
partially or even at high proportions in in the production of eco-friendly concrete.
2) This concrete can be applied as multi-purpose concrete that is used on a wide
range of commercial and domestic construction sites as structural concrete
elements such as foundations (footings).
3) It may also be the ideal concrete for domestic slab foundations for house and
bungalow floors among other structural elements like beams and columns.
5.2.2 For Further Study
1) Other physical properties of crushed ceramic and porcelain powder such as
fineness, specific surface, soundness, and density among others may be further
94
studied because they are of great significance in characterizing the behaviour of
such materials.
2) In addition, mechanical and thermal properties of ceramic and porcelain clay tile
powders should also be investigated in order to get in depth understanding on
their strength properties as well as their mechanism of heat transfer.
3) Flexural behaviour of ceramic and porcelain concrete should be determined so
as to develop empirical relationships between compressive, tensile and flexural
strengths of concrete made using ceramic and porcelain powders.
4) The durability aspect of ceramic and porcelain concrete may also be studied This
will guide in design especially when determining exposure conditions to choose
appropriate cover to reinforcement of structural concrete obtained using ceramic
and porcelain powders as partial cement substitutes.
5.3 Achievements
The results of this study were published in peer review journals. These articles are
attached in Appendix E. The two articles which were prepared and published include
the following;
(1) Oleng M., Kanali C., Gariy Z.C.A., & Ronoh E. (2018). Physical and Chemical
Properties of Crushed Ceramic and Porcelain Clay Tile Powder. International
Journal of IT, Engineering and Applied Sciences Research (IJIEASR). Volume
7, No. 7, July 2018. http:\\www.ijrcjournals.org.
(2) Oleng M., Kanali C., Gariy Z.C.A., & Ronoh E. (2018). Physical and
Mechanical Experimental Investigation of Concrete incorporated with Ceramic
and Porcelain Clay Tile Powders as Partial Cement Substitutes. International
95
Journal of Engineering Research & Technology (IJERT). Vol. 7 Issue 09,
September-2018. http:\\www.ijert.org.
(3) Consideration for future publication: The cost benefit of using ceramic and
porcelain clay tile powders as partial replacement of cement in concrete.
96
REFERENCES
ACI COMMITTEE 211.1-81, (2007). Standard practice for selecting proportions of
normal, heavyweight and mass concrete. ACI manual of concrete practice.
Agbede, O. I., & Monash, J. (2009). Suitability of Periwinkle Shell as Partial
Replacement for Gravel in Concrete. Leonardo Electronic J. of Practice and
Technologies, (15), 56-66.
Ajileye, F. V. (2012). Investigations on Silica Fume as Partial Cement Replacement in
Concrete, Global J. research in engineering. Civil and Structural, 12(1), 17-23.
Al-Chaar, M. A., Ghassan, K., & Panagiotis G. A. (2013). Natural Pozzolan as a Partial
Substitute for Cement in Concrete, The Open Construction and Building
Technology Journal, 7, 33-42.
Amudhavalli, N. K., & Jeena, M. (2012). Effect of silica fume on strength and
durability parameters of concrete, Inter. J. Engineering Sciences & Emerging
Tech., 3(1), 28-35.
Arpad, H. (2004). Construction Materials and the Environment, Annu.Rev. Environ.
Res., 29: 181-204.
ASTM C 187 – 16, Standard Test Method for Amount of Water Required for Normal
Consistency of Hydraulic Cement Paste. ASTM International, Pennsylvania.
ASTM C 618. Standard Specification for Coal Fly Ash and Raw or Calcined Natural
Pozzolan for Use in Concrete.
ASTM C125. Standard Terminology Relating to Concrete and Concrete Aggregates.
ASTM C188 – 17, Standard Test Method for Density of Hydraulic Cement. ASTM
International, Pennsylvania
97
Bakri, M. M., Hussin, K., Mohd, C., Baharin, S., Ramly, R., & Khairiatun, N. (2006).
Concrete Ceramic Waste Slab (CCWS). Journal of Engineering Research &
Education, vol. 3, pp. 139-145.
Barrie, D. S., & Plaulson, B. C. (2002). Professional Construction Management, 3rd
ed.; McGraw-Hill Inc. New York, NY, USA.
Binici, H. (2007). Effect of crushed ceramic and basaltic pumice as fine aggregates on
concrete mortar properties. Construction and Building Materials, vol. 21, no 6,
pp. 1191- 1197. DOI: 10.1016/j.conbuildmat.2006.06.002.
Bragança, S. R., & Bergmann, C. P. (2004). Traditional and glass powder porcelain:
Technical and Microstructure analysis. Journal of the European Ceramic
Society 24, pp 2383-2388.
Brito, J. (2010). Abrasion resistance of concrete made with recycled aggregates.
International Journal of Sustainable Engineering, vol. 3, no 1, pp. 58-64.
BS 1881 Part 117 (2011). Testing concrete. Method for determination of tensile
splitting strength. British Standards Institution, London, UK.
BS 1881-101:2011. Testing concrete. Method of sampling fresh concrete on site,
British Standard Institution, London, UK.
BS 1881-102:2011. Testing concrete. Method for determination of slump, British
Standard Institution, London, UK.
BS 1881-115:2011. Testing concrete. Specification for compression testing machines
for concrete, British Standard Institution, London, UK.
BS 882 (1992), Specification for aggregates from natural sources for concrete. British
Standards Institution, London, UK.
98
BS 882 (1992), Specification for aggregates from natural sources for concrete. British
Standards Institution, London, UK.
BS EN 1008:2002. Mixing water for concrete — Specification for sampling, testing
and assessing the suitability of water, including water recovered from processes
in the concrete industry, as mixing water for concrete, British Standards
Institution, London, UK.
BS EN 1097-6:2013. Tests for mechanical and physical properties of aggregates. Part
6: Determination of particle density and water absorption. British Standard
Institution, London, UK.
BS EN 12350-2:2009. Testing fresh concrete. Part 2: Slump-test. British Standard
Institution, London, UK.
BS EN 12390-2:2009. Testing hardened Concrete. Part 2: Making and curing
specimens for strength tests. British Standard Institution, London, UK.
BS EN 197-1:2000, Cement - Part 1: Composition, specifications and conformity
criteria for common cements, British Standard Institution, London, UK.
BS EN 197-1:2000, Cement - Part 1: Composition, specifications and conformity
criteria for common cements, British Standard Institution, London, UK.
BS EN 197-3, (2016), Method of testing cement: Determination of setting time and
soundness. British Standard Institution, London, UK.
BS EN 933-1:2012. Tests for geometrical properties of aggregates. Part 1:
Determination of particle size distribution — Sieving method. British Standard
Institution, London, UK.
99
BS EN 933-2:1996. Tests for geometrical properties of aggregates — Determination
of particle size distribution — Test sieves, nominal size of apertures, British
Standard Institution, London, UK.
BS EN 933-2:1996. Tests for geometrical properties of aggregates — Determination
of particle size distribution — Test sieves, nominal size of apertures, British
Standard Institution, London, UK.
Buchanan, J. A., & Olupot, P. W. (2006). Characterization of Ceramic Raw Minerals
in Uganda for Production of Electrical Porcelain Insulators. Proceedings from
the International Conference on Advances in Engineering and Technology.
Bungey, J. H., & Millard, S. G. (1995). The Testing of Concrete in Structures, 3rd
edition. Chapman & Hall, London.
Cachim, P. B. (2009). Mechanical properties of brick aggregate concrete. Construction
and Building Materials, vol. 23, no 3 pp. 1292-1297.
Capros, P., Kouvaritakis, N., & Mantzos, L. (2001). Economic Evaluation of Sectoral
Emission Reduction Objectives for Climate Change: Top–down Analysis of
Greenhouse Gas Emission Possibilities in the EU.
CESMM 3: 1991. Civil engineering standard Method of Measurement. Third edition.
Thomas Telford, London.
Chanakya, A. (2009). Design of Structural Elements, Third Edition. Taylor & Francis
2 Park Square, Milton Park, Abingdon, Oxon OX14 4RN.
Chee, C. B., & Mahyuddin, R. (2011). The implementation of wood waste ash as a
partial cement replacement material in the production of structural grade
concrete and mortar. School of Housing, Building and Planning, Universiti
Sains Malaysia, 11800 Penang, Malaysia.
100
CIF. (2003). Cement Industry Environment Report. Cement Industry Federation.
Correia, J. R., de Brito, J., Pereira, A. S. (2006). Effects on concrete durability of using
recycled ceramic aggregates. Materials and Structures, vol. 39, no 2, pp. 169-
177.
El-Reedy., M. A. (2009). Advanced materials and Techniques for reinforced Concrete
Structures. CRC Press, Taylor& Francis Group.
Eurocode 2: Design of concrete structures - Part 1-1: General rules and rules for
buildings. British Standard Institution, London, UK.
Gartner, E. (2004). Industrially interesting approaches to ‘‘low-CO2’’ cements.
Cement and Concrete Research 34, 1489–1498.
Geem, M. G., & Marceau, M. L. (2002). Using Concrete to Maximize LEED Points,
Concrete International.
Genesan, S. (2000). Employment, Technology and Construction Development,
Ashgate Publishing Company, Aldershot.
GIBB. (2014). Environment and Social Impact Assessment for Northern Collector
Phase I.
Gomes, M., & de Brito, J. (2009). Structural concrete with incorporation of coarse
recycled concrete and ceramic aggregates: durability performance. Materials
and Structures, vol. 42 (2009), no 5, pp. 663-675.
Guerra, I., Vivar, I., Llamas, B., Juan, A., & Moran, J. M. (2009). Eco-efficient
concretes: The effects of using recycled ceramic material from sanitary
installations on the mechanical properties of concrete. Waste Management, vol.
29, no 2, pp. 643-646.
101
Hardil, P., & Arora, N. K. (2015). Use of ceramic waste powder in cement concrete.
International Journal for Innovative Research in Science and Technology, 2(1).
Hemanth, K. C., Ananda, R. K., Sateesh, B. K., Guraviaiah, T., Naveen, R. K., & Jami,
S. (2015). Effect of waste ceramic tiles as partial replacement of coarse and
fine aggregate of concrete. International Advanced Research Journal in
Science, Engineering and Technology, 2(5), pp. 13-16.
Holm, F. H. (1998). Ad Hoc Committee on Sustainable Building. Norwegian Building
Research Institute, Blinderm.
Ikponmwosa, E. E., & Ehikhuenmen. (2017). The effect of ceramic waste as coarse
aggregate on strength properties of concrete. Nigerian Journal of Technology,
36(3), pp. 691-696.
Josa, A., Aguado, A., Cardim, A., & Byars, E. (2007). Comparative analysis of the life
cycle impact assessment of available cement inventories in the EU. Cement
and Concrete Research 37, 781–788.
Josa, A., Aguado, A., Heino, A., Byars, E., & Cardim, A. (2004). Comparative analysis
of available life cycle inventories of cement in the EU. Cement and Concrete
Research 34, 1313–1320.
Juan, A., Medina, C., Guerra, M. I., Llamas, B., Moran, J. Ma., & Tascon, A. (2010).
Re-use of construction and demolition residues and industrial wastes for the
elaboration or recycled eco-efficient concretes. Spanish Journal of Agricultural
Research, vol. 8 (2010), no 1, pp. 25-34.
Ken W. D. (2006). Concrete Mix Design, Quality Control and Specification, Third
Edition published by Taylor & Francis, 2 Park Square, Milton Park, Abingdon,
Oxon OX14 4RN.
102
Kenface, E. (2016). Environmental and Social Impact Assessment Study Report for
the Proposed High Grand Falls Multi-Purpose Dam Project.
Kim, K. H., & Kang, K. I. (2004). Comparing Accuracy of Prediction Cost Estimation
Using Case-Based Reasoning and Neural Networks. Archit. Inst. Korea, 20,
93–105.
Kothari, C. R. (2004). Research methodology: Methods and techniques. New Age
International (P) Ltd., Publishers Published by New Age International (P) Ltd.,
Publishers
Koyuncu, H., Guney, Y., Yilmaz, G., Koyuncu, S., & Bakis, R. (2004). Utilization of
ceramic wastes in the construction sector. Key Engineering Materials, vol. 264-
268, pp. 2509-2512. DOI: 10.4028/www.scientific.net/KEM.264-268.2509.
Kumar, J. P., Zala, L. B., & Umrigar, F. S. (2012). Experimental investigations on
partial replacement of cement with fly ash in design mix concrete, Inter. J. of
Advanced Engineering Tech., 3(4), 126-129.
Lafarge, (2007). Lafarge in Kenya and Uganda: a sustainable commitment. Press kit.
Li, Z., (2011). Advanced Concrete Technology - Li - Wiley Online Library. Published
by John Wiley & Sons., Inc, Hoboken, New Jersey, USA.
Lopez G. F., Lopez C. C., Serrano L. M. A., Garcia, T. E., & Lopez M. A. (2011).
Assessment of properties of recycled concrete by means of a highly fractioned
factorial design of experiment. Construction and Building Materials 25 (10):
3802–3809.
Lopez, V., Llamas, B., Juan, A., Moran. J. M., & Guerra, M. I., (2007). Eco-efficient
concretes: Impact of the use of white ceramic powder on the mechanical
properties of concrete. Biosystems Engineering, vol. 96, no 4, pp. 559-564.
103
Mageswari, M., & Vidivelli, B. (2009). Innovative concrete using fly ash and waste
sheet glass, J. of Environ. Res. Develop. 4(2), 476-483.
Meena, A. V. J., (2017). Experimental Study of Ceramic Waste Electric Insulator
Powder Used as a Partial Replacement of Cement in Concrete. Journal of
Materials Science & Surface Engineering, 5(4): 606-611.
Mosley, W. H., Hulse, R., & Bungey, J. H. (1996). Reinforced Concrete Design to
Eurocode 2. Macmillan, Basingstoke.
Muhwezi, L., Chamuriho, L. M. & Lema, N. M. (2012). An investigation into
Materials Wastes on Building Construction Projects in Kampala-Uganda.
Journal of Engineering Research Vol. 1(1), pp. 11-18.
Naik, T. R., & Klaus, R. N. (2003). Wood Ash; A New Source of Pozzolanic Material.
Concrete International. 20.
Neville, A. M., (1995). Properties of concrete. Harlow, Essex: Longman.
Newman, J., & Choo. B. S. (2003). Advanced Concrete Technology. Linacre House,
Jordan Hill, Oxford.
Nibudey, R. N., Nagarnaik, P. B., Parbat, D. K., Pande, A. M., & Polytechnic, G.
(2014). Compressive Strength and Sorptivity Properties of PET Fiber
Reinforced Concrete, 7(4), 1206–1216.
Odero, T. J. (2015). Study on the feasibility of using Sawdust as partial replacement
for Sand in concrete. University of Nairobi. (Master’s thesis report)
Ogola, P. F. A. (2009). Environmental Impact Assessment General Procedures. In
UNU-GTP (pp. 1–16).
Olupot, P. W. (2006). Assessment of ceramic raw materials in Uganda for electrical
porcelain. (Doctoral dissertation, KTH).
104
Pacheco, F., & Jalali, S. (2010). Reusing ceramic wastes in concrete. Construction and
Building Materials, Volume 48, 2013, pp. 295-305.
Pérez, J. M., Rincón, J. M., & Romero, M. (2012). Effect of moulding pressure on
microstructure and technological properties of porcelain stoneware. Ceramics
International, 38(1), 317-325.
Prabagar, S., Kalya, S., & Kerthi, W. R. F. (2015). Wood ash as an effective raw
material for concrete blocks. International journal of research in engineering
and technology, Environmental Technology Section, Industrial Technology
Institute,363, Bauddhaloka Mawathe, colombo.
Pradhan, D., & Dutta, D. (2013). Influence of Silica Fume on Normal Concrete, Int. J.
of Engineering Res. and Application, 3(5), 79- 82.
Puertas, F., Garcia-Diaz, I., Barba, A., Gazulla, M. F., Palacios, M., Gomez, M. P., &
Martinez, R. S. (2008). Ceramic wastes as alternative raw materials for
Portland cement clinker production. Cement and Concrete Composites, vol. 30
(2008), no 9, pp. 798-805.
Raval, A. D. (2013). Ceramic Waste: Effective Replacement of Cement for
Establishing Sustainable Concrete. International Journal of Engineering Trends
and Technology (IJETT) – Volume 4 Issue 6- June 2013.
Raval, A. D., Indrajit, N., Patel, Pitroda, J. (2013). Ceramic Waste: Effective
Replacement of Cement for Establishing Sustainable Concrete, Inter. J.
Engineering Trends and Tech. (IJETT), 4(6), 2324-2329.
Reddy, M. V. and Reddy, C. N. V. S. (2007). An experimental study on use of Rock
Flour and insulator ceramic scrap in concrete. Journal of Institution of
Engineers, India, 88, pp. 47-50.
105
Saswat, H., & Vikas, S. (2016). Comprehensive Literature review on partial
replacement of fine aggregate with ceramic and demolition waste in rigid
pavement. International Journal of Innovative Research in Science Engineering
and Technology, 5(8).
Senthamarai, R. M., & Manhoharan, D. P. (2005). Concrete with ceramic waste
aggregate. Cement & Concrete Composites, vol. 27, no 9-10, pp. 910-913.
Shruti, H. G., Gowtham, P. M. E., Samreen, T., & Syed, R. P. (2016). Reuse of ceramic
waste as aggregate in concrete, International Research Journal of Engineering
and Technology, 3(7), pp. 115-119.
Siddesha, H. (2011). Experimental Studies on the Effect of Ceramic fine aggregate on
the Strength properties of Concrete. International Journal of Advances in
Engineering, Science and Technology.
Silva, J., de Brito, J., & Veiga, R. (2010). Recycled red – clay ceramic construction
and demolition waste for mortars production. Journal of Materials in Civil
Engineering, vol. 22, no. 3, pp. 236-244.
Sivaprakash, G., Saravana, K., & Lakhi, J. S. (2016). Experimental study on partial
replacement of sand by ceramic waste in concrete. Int. J. Chem.
Stathis, G., Ekonomakou, A., & Stournaras, C. J. (2004). Effect of firing conditions,
filler grain size and quartz content on bending strength and physical properties
of sanitary ware porcelain. Journal of the European Ceramic.
Sudarsana, G. V. (2013). Influence of Water Absorption of the Ceramic Aggregate on
Strength Properties of Ceramic Aggregate Concrete. International Journal of
Innovative Research in Science, Engineering and Technology, Vol. 2.
106
Tae, H. K. (2016). Assessment of Construction Cost Saving by Concrete Mixing the
Activator Material. Building and Urban Research Institute, Korea Institute of
Civil Engineering and Building Technology, Daehwa-dong 283, Goyandae-
Ro, ILsanseo-Gu, Goyang-Si, Gyeonggi-Do 10223, Korea
Topcu, I. B., & Canbaz, M. (2007). Utilization of crushed tile as aggregate in concrete.
Iranian Journal of Science and Technology Transaction B-Engineering, vol. 31,
no B5, pp. 561-565.
Vidivelli, B., and Mageswari, M. (2010). Study on fly ash concrete using SEM
analysis, J. of Environ. Res. Develop., 5(1), 46-52.
Vijayakumar, G., Vishaliny, H., & Govindarajulu, D. (2013). Studies on Glass Powder
as Partial Replacement of Cement in Concrete Production, Inter. J. of Emerging
Tech. and Advan. Engineering, 3(2), 153-157.
Wadel, G. (2009). Sustainability in industrialized architecture: Modular lightweight
construction applied to housing. Doctoral Thesis, Polytechnic University of
Catalonia-Department of Architectural Constructions.
Xi, F., Davis, S. J., Ciais, P., Crawford-Brown, D., Guan, D., Pade, C., & Bing, L.
(2016). Substantial global carbon uptake by cement carbonation. Nature
Geoscience, 9(12), 880-883.
Ye, Z. S. M., (2006). An investigation ascertaining the suitability of wood ash as a
partial replacement of cement in concrete at various intervals of (0-25%).
International Journal of Innovative Research in Science, Engineering and
Technology.
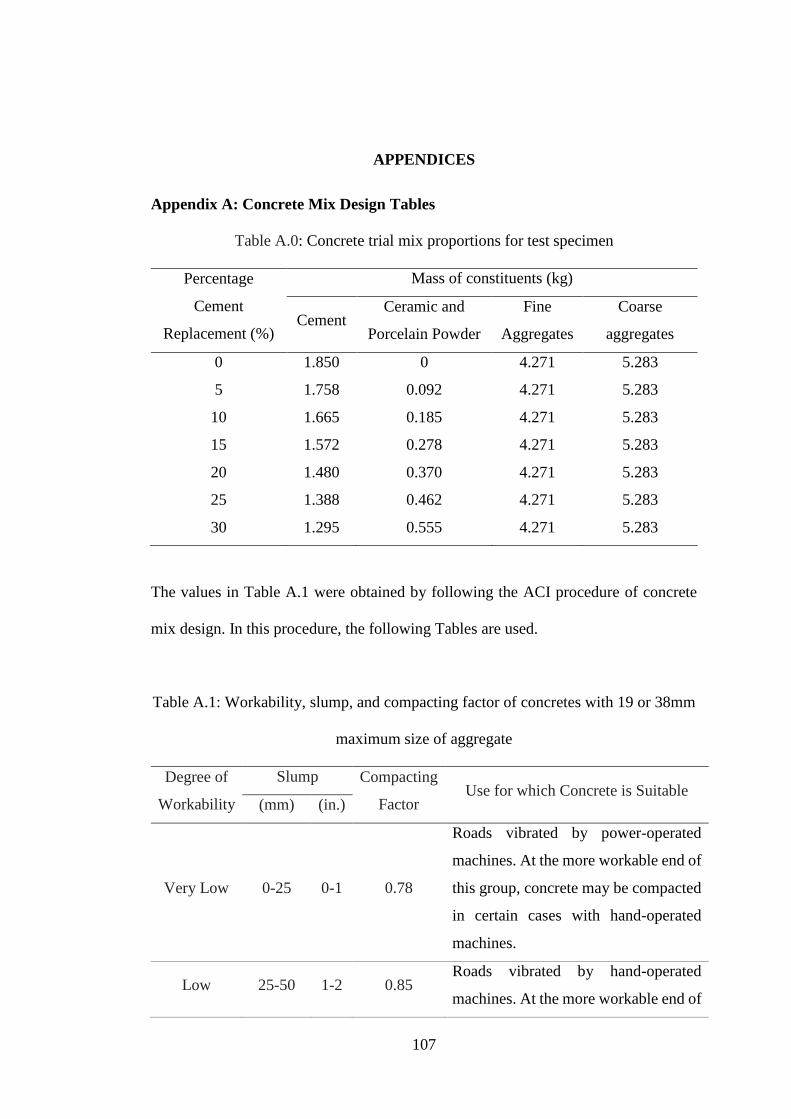
107
APPENDICES
Appendix A: Concrete Mix Design Tables
Table A.0: Concrete trial mix proportions for test specimen
Percentage
Cement
Replacement (%)
Mass of constituents (kg)
Cement Ceramic and
Porcelain Powder
Fine
Aggregates
Coarse
aggregates
0 1.850 0 4.271 5.283
5 1.758 0.092 4.271 5.283
10 1.665 0.185 4.271 5.283
15 1.572 0.278 4.271 5.283
20 1.480 0.370 4.271 5.283
25 1.388 0.462 4.271 5.283
30 1.295 0.555 4.271 5.283
The values in Table A.1 were obtained by following the ACI procedure of concrete
mix design. In this procedure, the following Tables are used.
Table A.1: Workability, slump, and compacting factor of concretes with 19 or 38mm
maximum size of aggregate
Degree of
Workability
Slump Compacting
Factor Use for which Concrete is Suitable
(mm) (in.)
Very Low 0-25 0-1 0.78
Roads vibrated by power-operated
machines. At the more workable end of
this group, concrete may be compacted
in certain cases with hand-operated
machines.
Low 25-50 1-2 0.85 Roads vibrated by hand-operated
machines. At the more workable end of
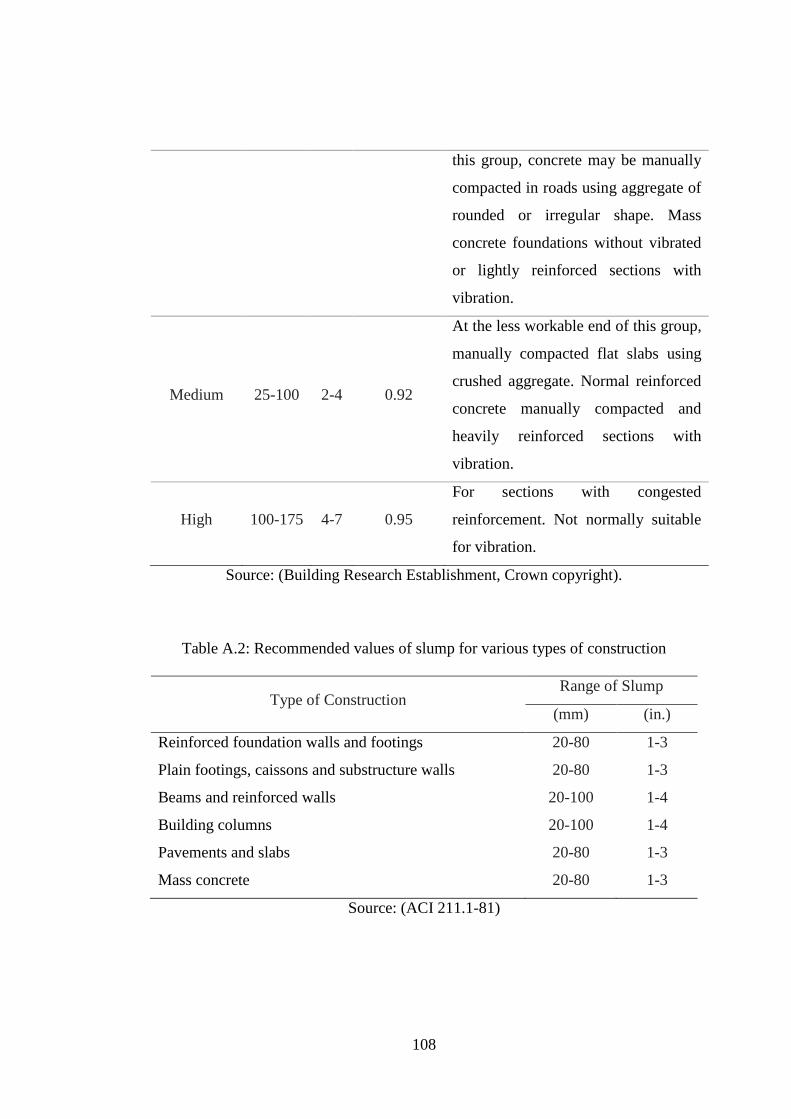
108
this group, concrete may be manually
compacted in roads using aggregate of
rounded or irregular shape. Mass
concrete foundations without vibrated
or lightly reinforced sections with
vibration.
Medium 25-100 2-4 0.92
At the less workable end of this group,
manually compacted flat slabs using
crushed aggregate. Normal reinforced
concrete manually compacted and
heavily reinforced sections with
vibration.
High 100-175 4-7 0.95
For sections with congested
reinforcement. Not normally suitable
for vibration.
Source: (Building Research Establishment, Crown copyright).
Table A.2: Recommended values of slump for various types of construction
Type of Construction Range of Slump
(mm) (in.)
Reinforced foundation walls and footings 20-80 1-3
Plain footings, caissons and substructure walls 20-80 1-3
Beams and reinforced walls 20-100 1-4
Building columns 20-100 1-4
Pavements and slabs 20-80 1-3
Mass concrete 20-80 1-3
Source: (ACI 211.1-81)
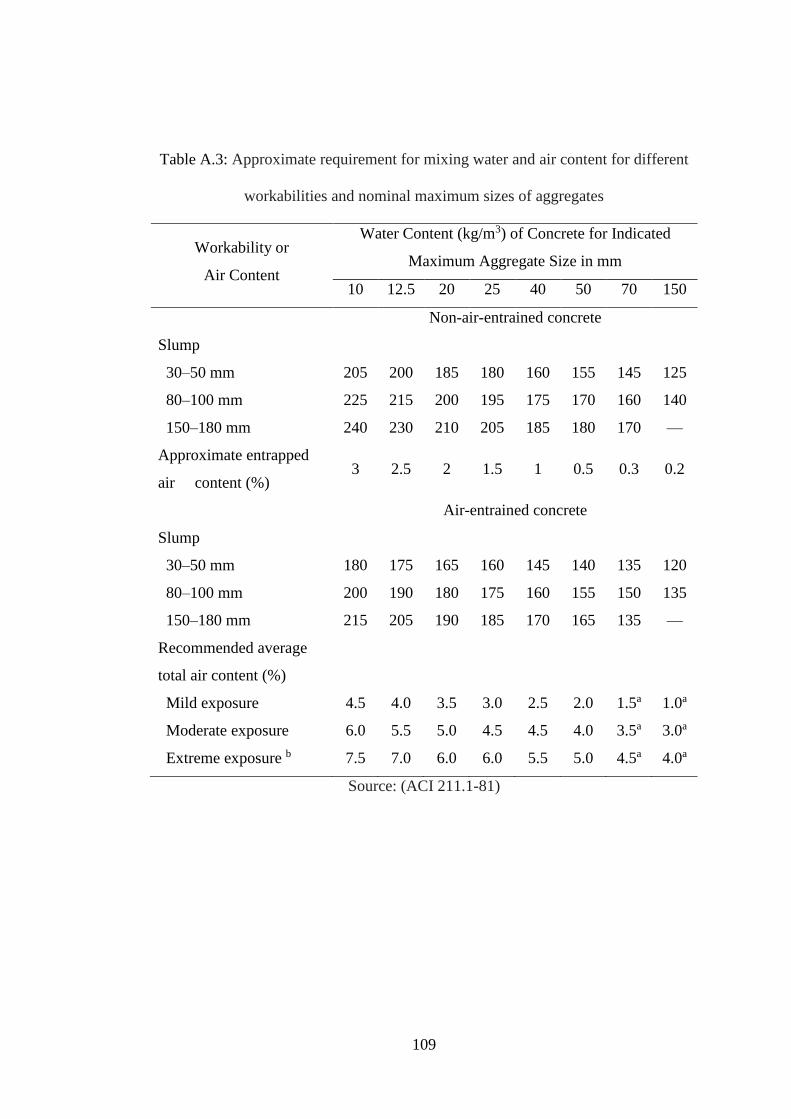
109
Table A.3: Approximate requirement for mixing water and air content for different
workabilities and nominal maximum sizes of aggregates
Workability or
Air Content
Water Content (kg/m3) of Concrete for Indicated
Maximum Aggregate Size in mm
10 12.5 20 25 40 50 70 150
Non-air-entrained concrete
Slump
30–50 mm 205 200 185 180 160 155 145 125
80–100 mm 225 215 200 195 175 170 160 140
150–180 mm 240 230 210 205 185 180 170 —
Approximate entrapped
air content (%) 3 2.5 2 1.5 1 0.5 0.3 0.2
Air-entrained concrete
Slump
30–50 mm 180 175 165 160 145 140 135 120
80–100 mm 200 190 180 175 160 155 150 135
150–180 mm 215 205 190 185 170 165 135 —
Recommended average
total air content (%)
Mild exposure 4.5 4.0 3.5 3.0 2.5 2.0 1.5a 1.0a
Moderate exposure 6.0 5.5 5.0 4.5 4.5 4.0 3.5a 3.0a
Extreme exposure b 7.5 7.0 6.0 6.0 5.5 5.0 4.5a 4.0a
Source: (ACI 211.1-81)
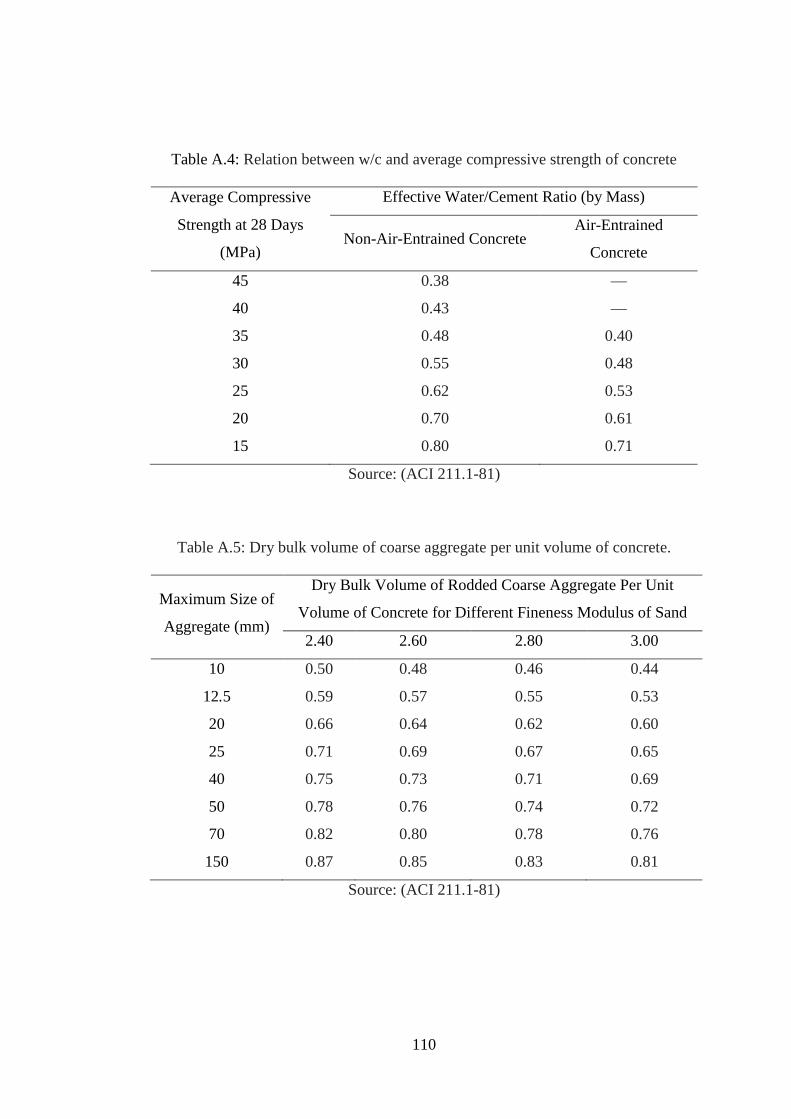
110
Table A.4: Relation between w/c and average compressive strength of concrete
Average Compressive
Strength at 28 Days
(MPa)
Effective Water/Cement Ratio (by Mass)
Non-Air-Entrained Concrete Air-Entrained
Concrete
45 0.38 —
40 0.43 —
35 0.48 0.40
30 0.55 0.48
25 0.62 0.53
20 0.70 0.61
15 0.80 0.71
Source: (ACI 211.1-81)
Table A.5: Dry bulk volume of coarse aggregate per unit volume of concrete.
Maximum Size of
Aggregate (mm)
Dry Bulk Volume of Rodded Coarse Aggregate Per Unit
Volume of Concrete for Different Fineness Modulus of Sand
2.40 2.60 2.80 3.00
10 0.50 0.48 0.46 0.44
12.5 0.59 0.57 0.55 0.53
20 0.66 0.64 0.62 0.60
25 0.71 0.69 0.67 0.65
40 0.75 0.73 0.71 0.69
50 0.78 0.76 0.74 0.72
70 0.82 0.80 0.78 0.76
150 0.87 0.85 0.83 0.81
Source: (ACI 211.1-81)
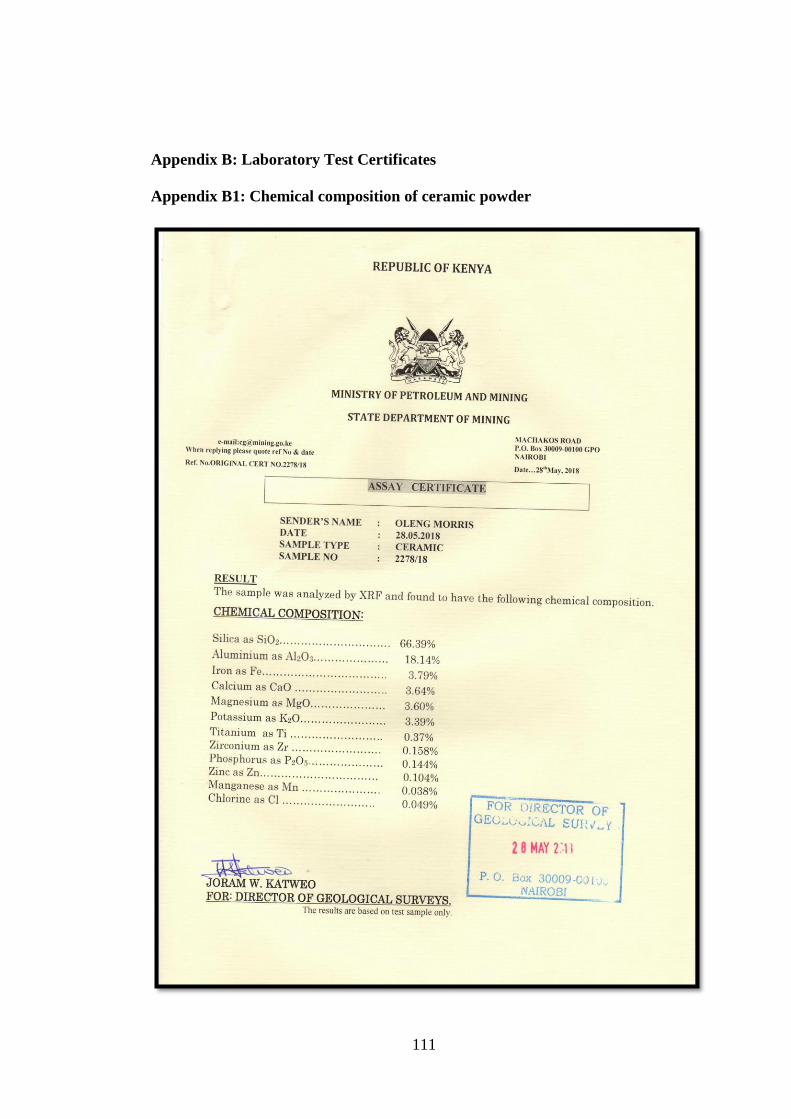
111
Appendix B: Laboratory Test Certificates
Appendix B1: Chemical composition of ceramic powder
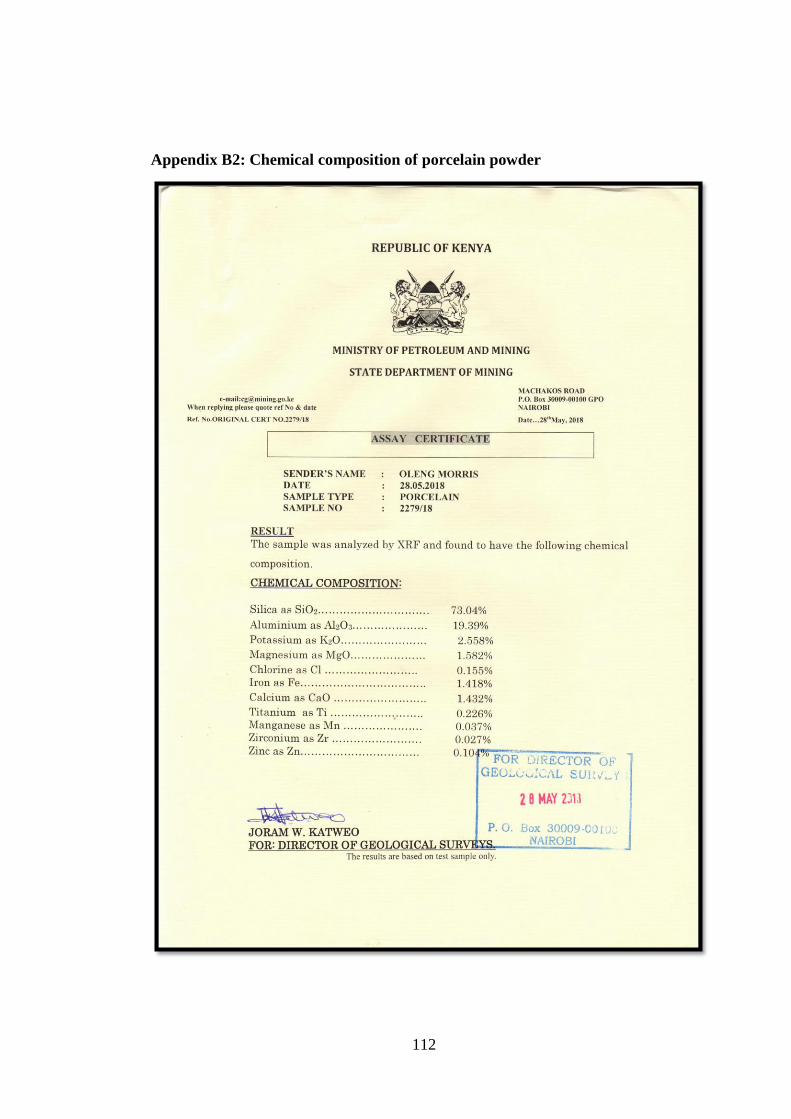
112
Appendix B2: Chemical composition of porcelain powder
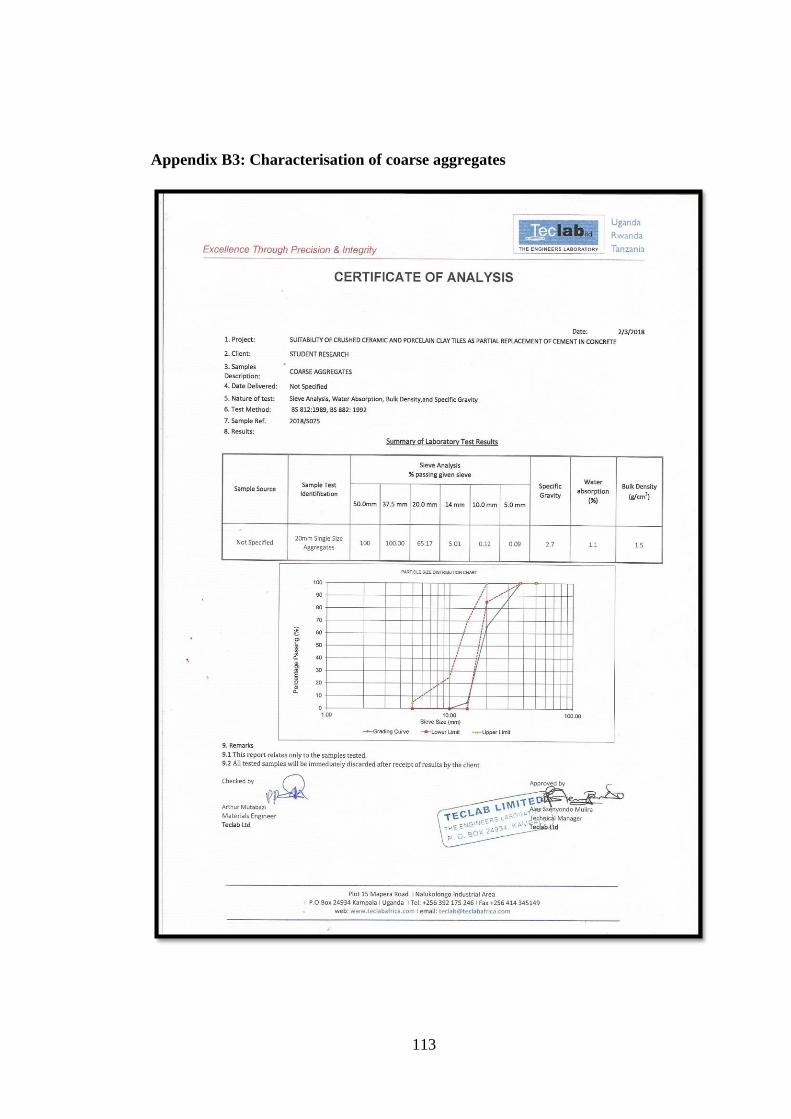
113
Appendix B3: Characterisation of coarse aggregates
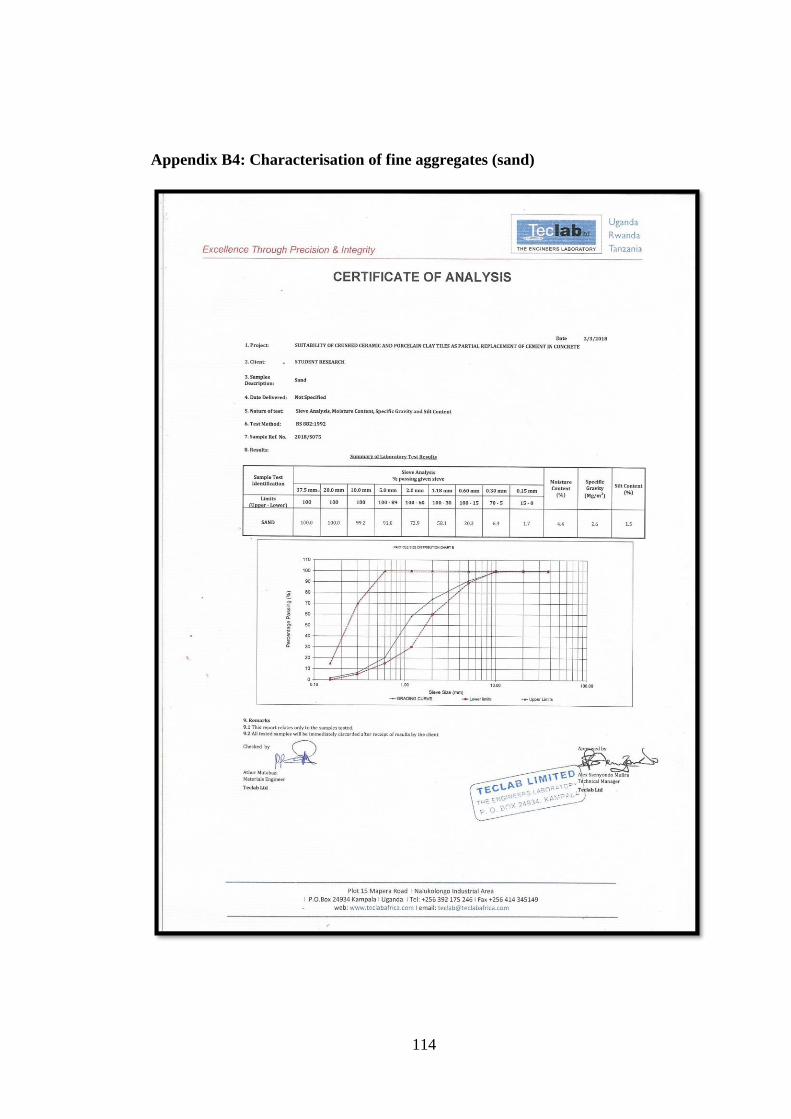
114
Appendix B4: Characterisation of fine aggregates (sand)
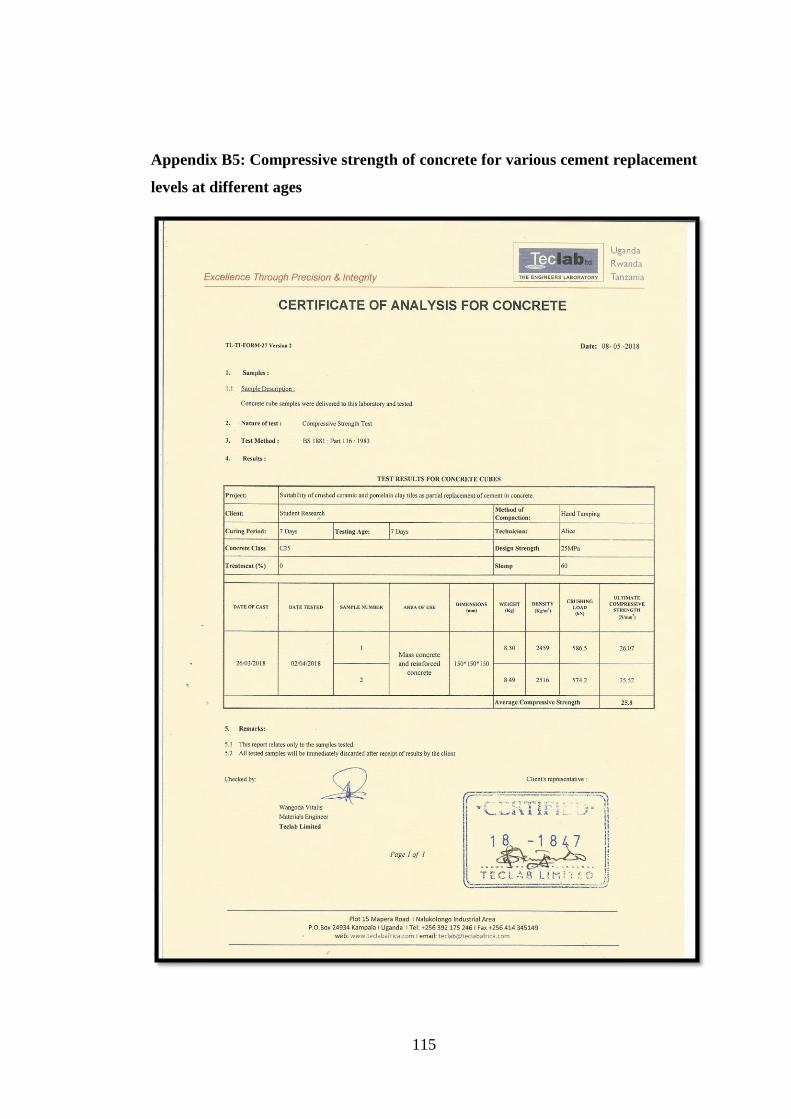
115
Appendix B5: Compressive strength of concrete for various cement replacement
levels at different ages

116
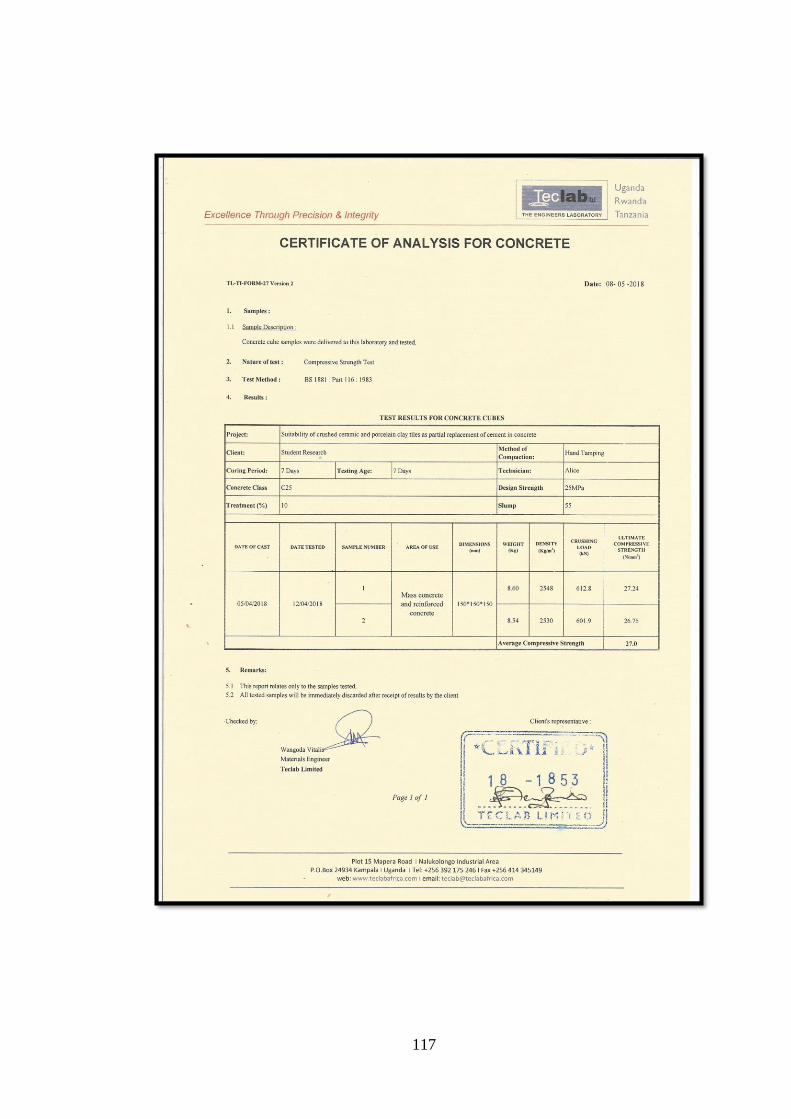
117
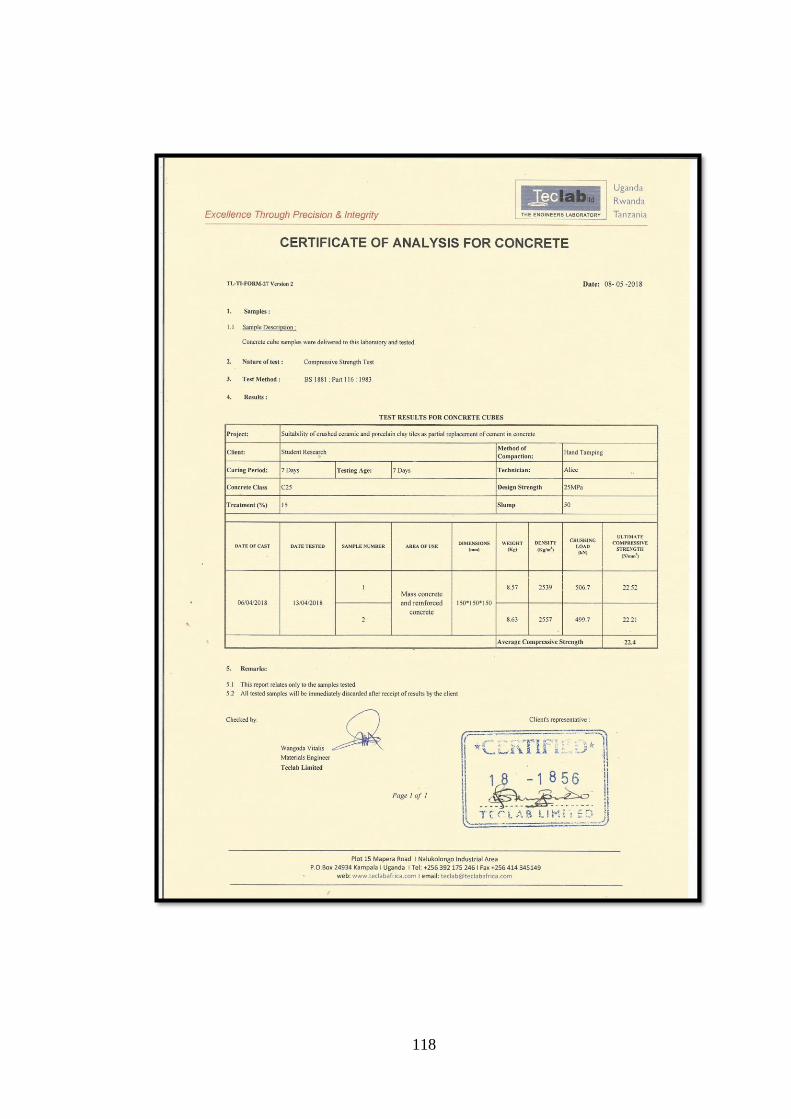
118
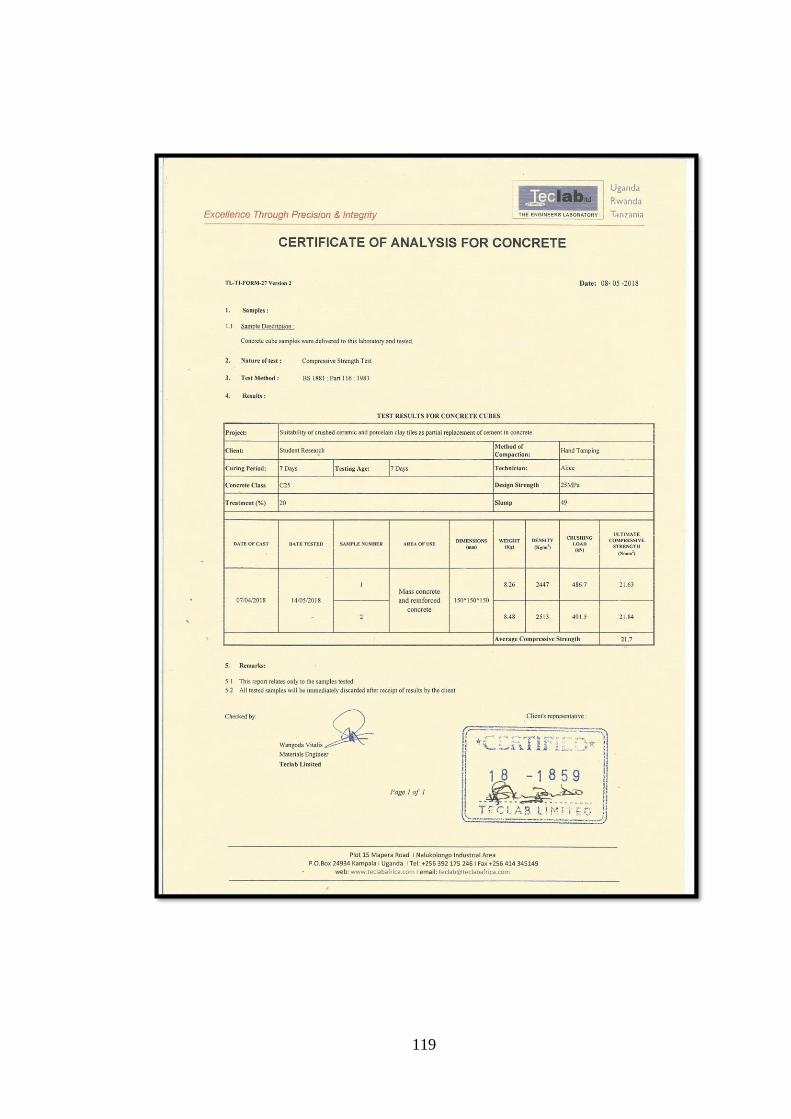
119
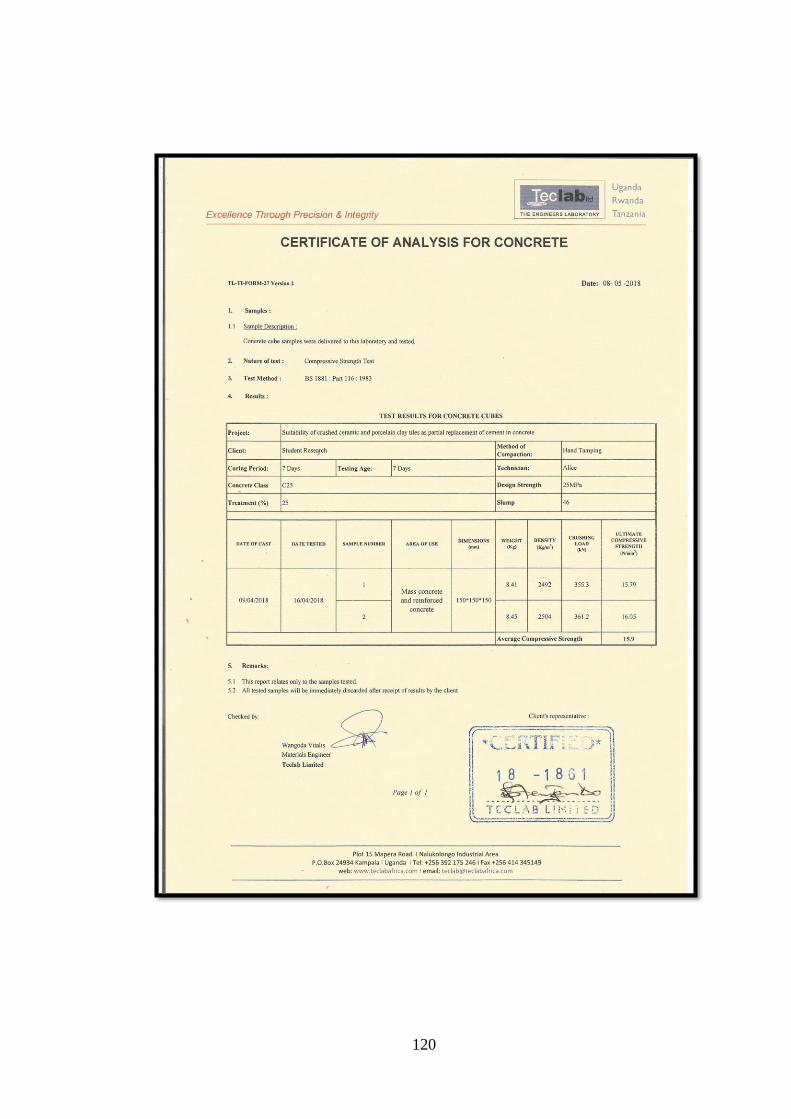
120
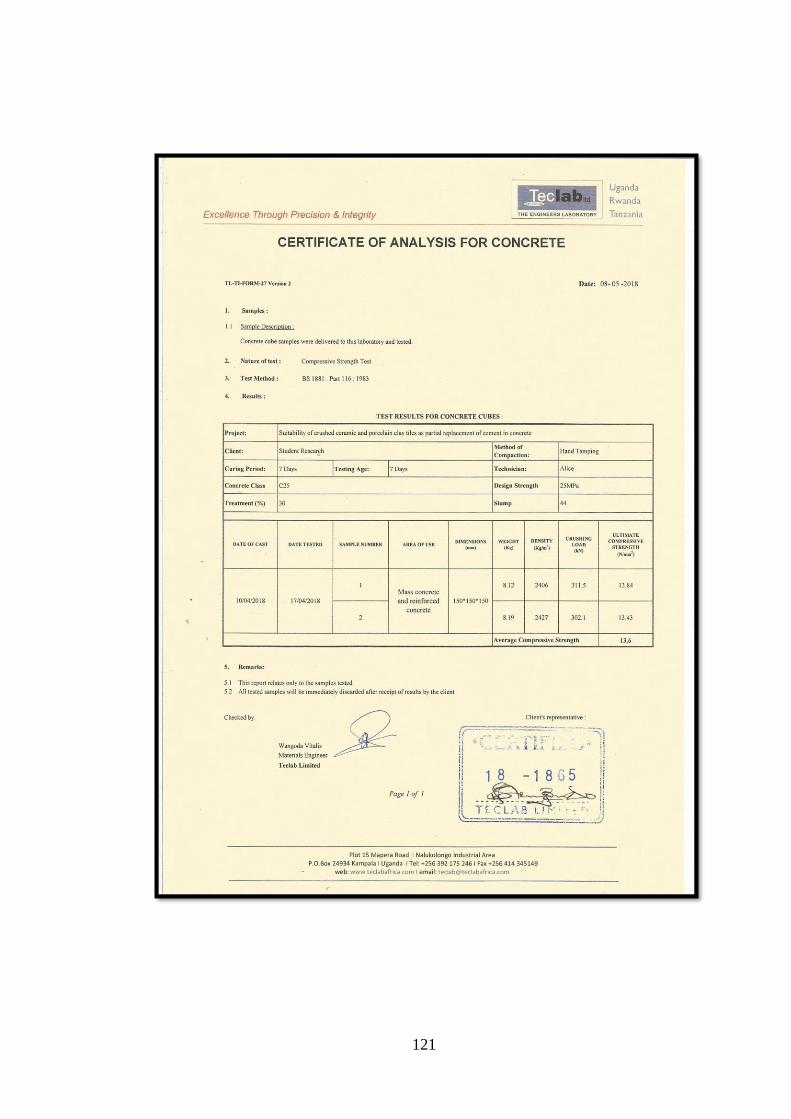
121
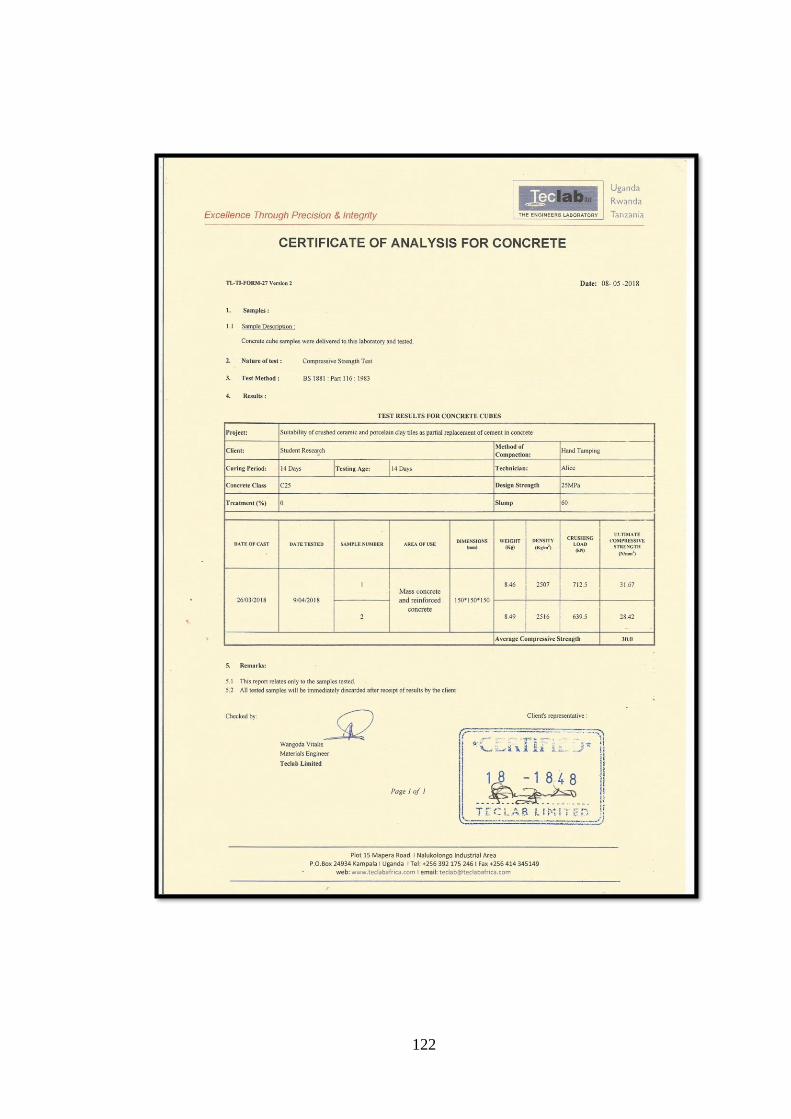
122
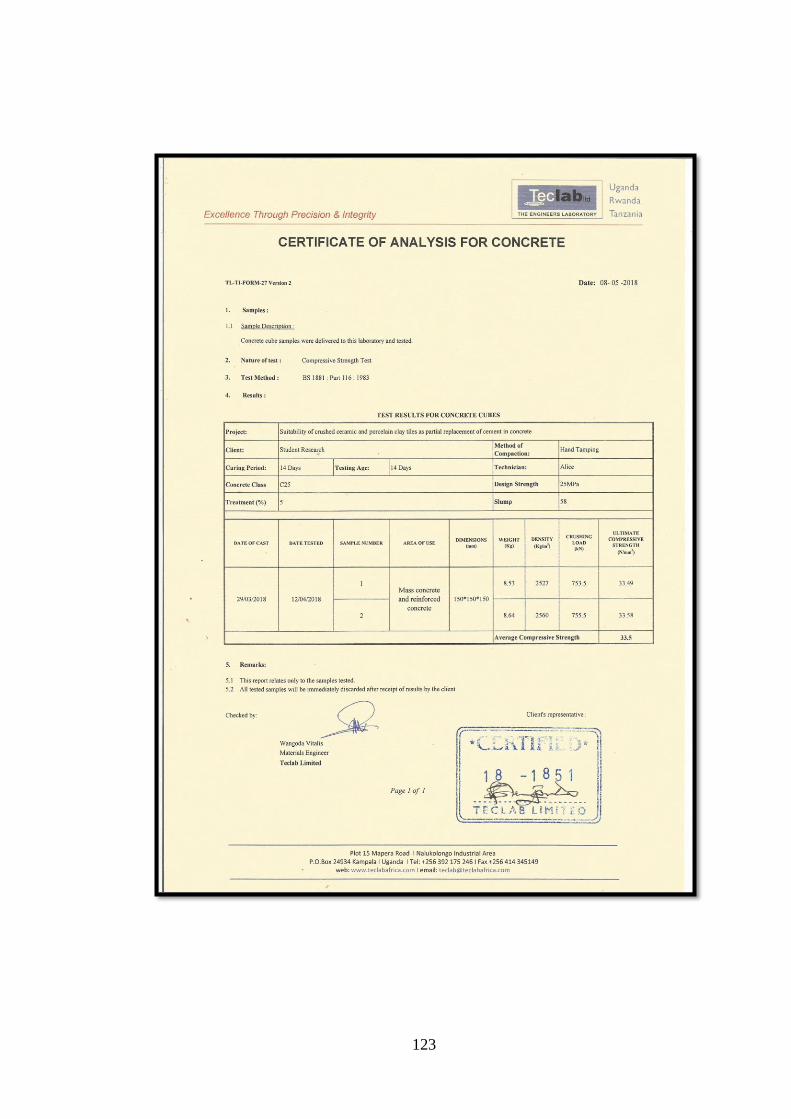
123
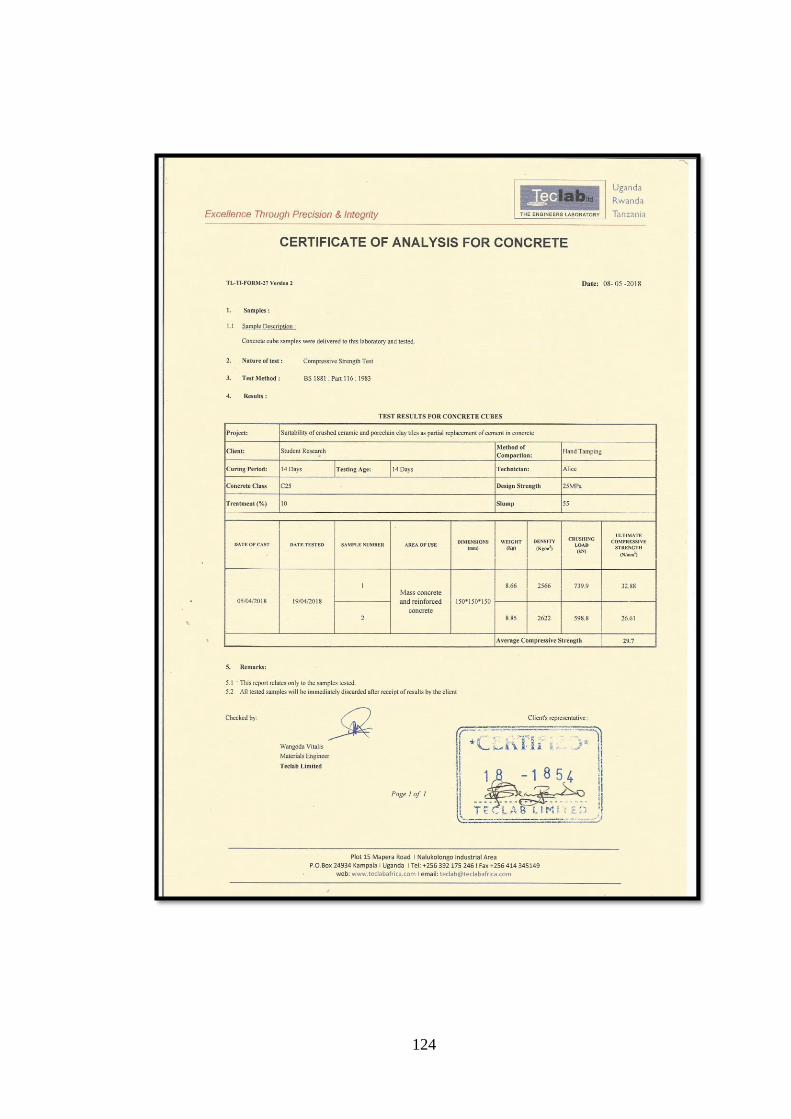
124
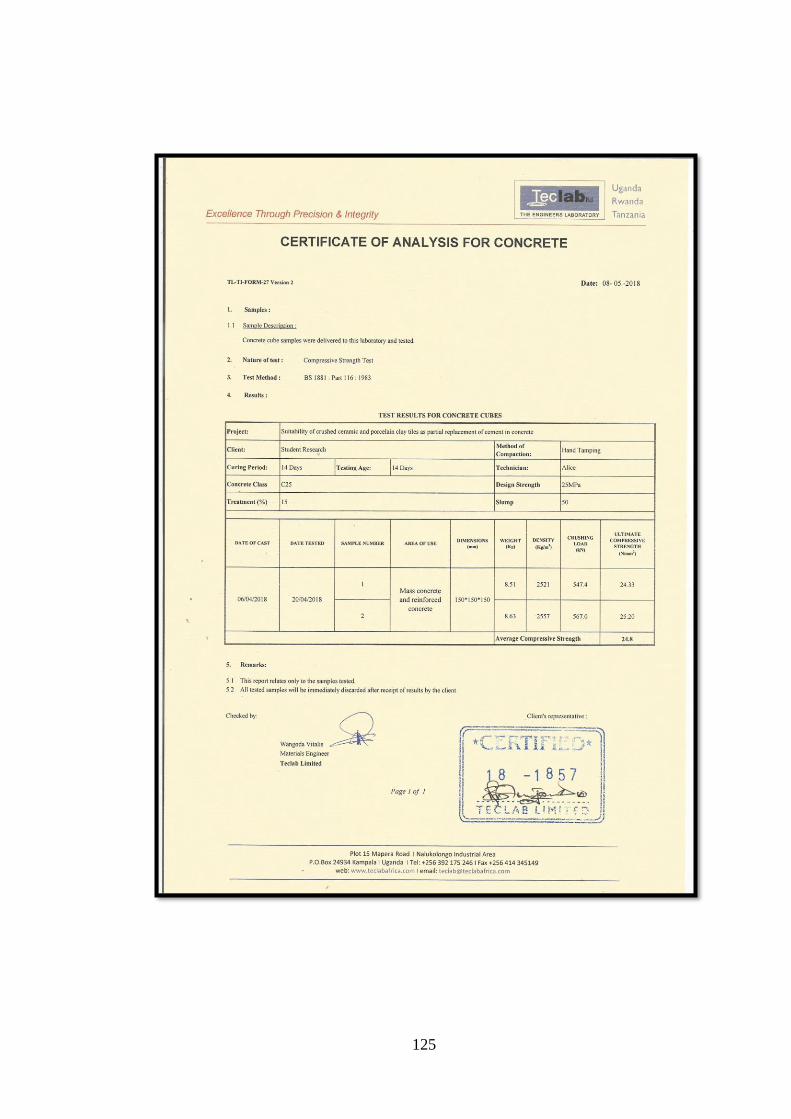
125
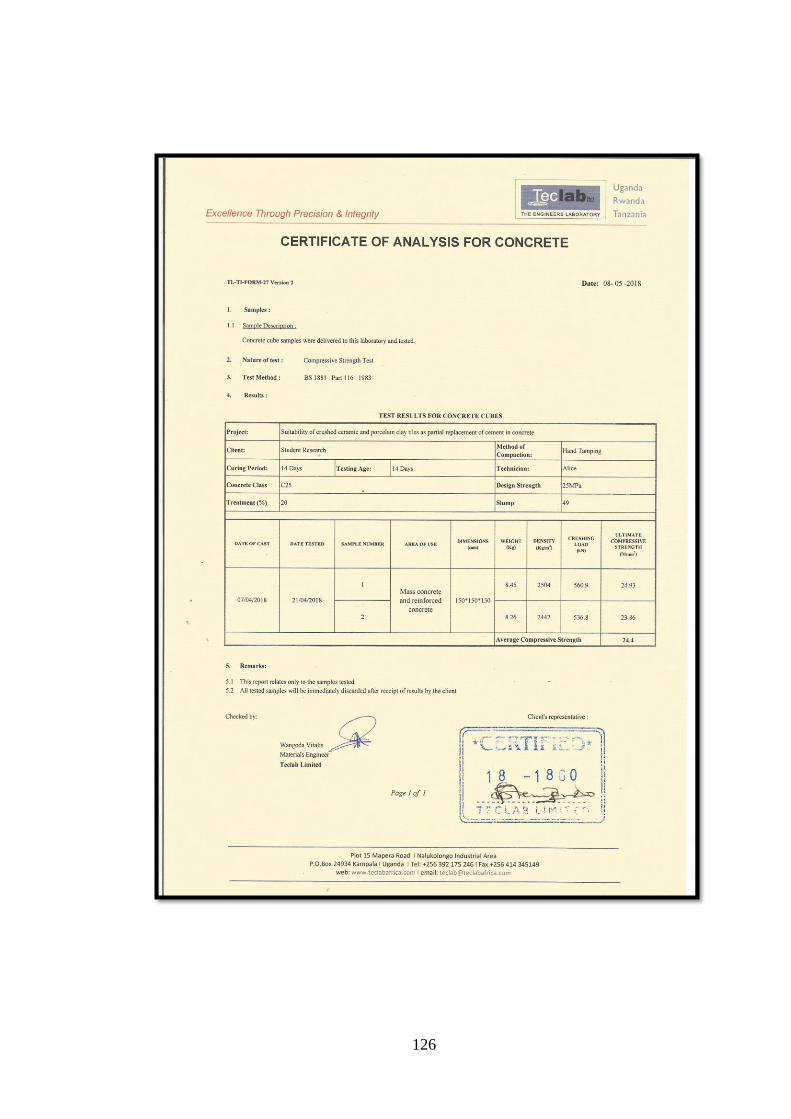
126
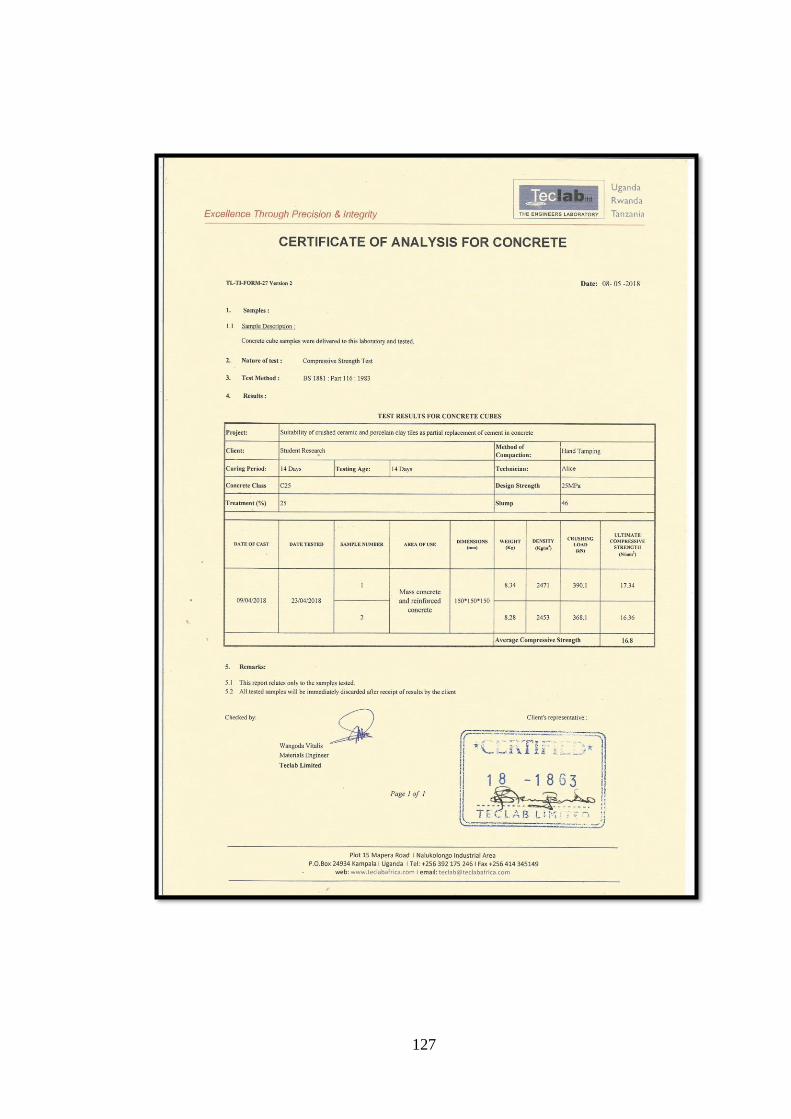
127
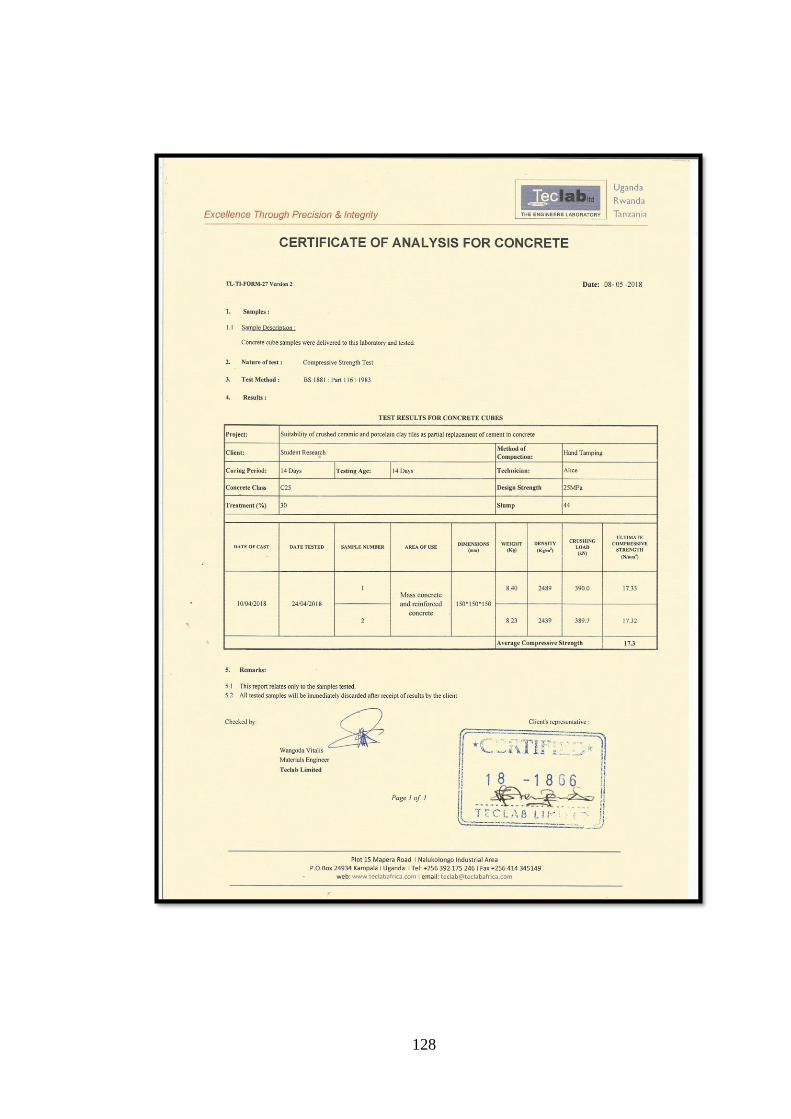
128

129
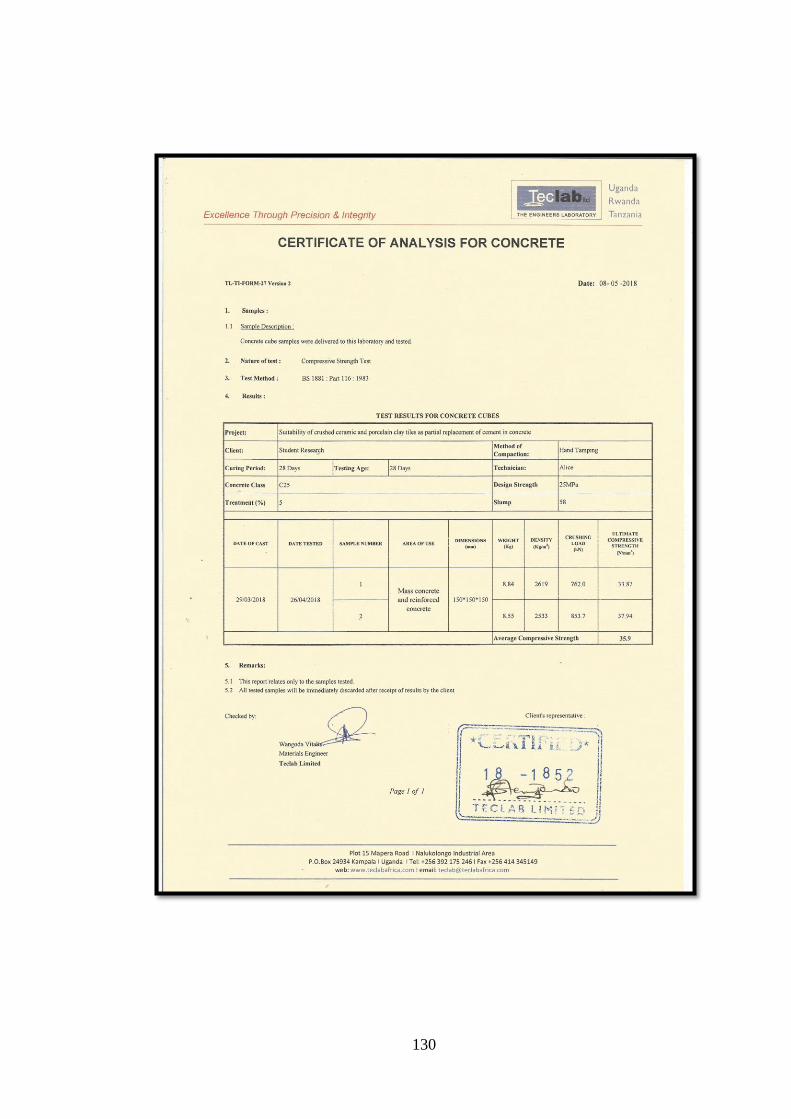
130

131
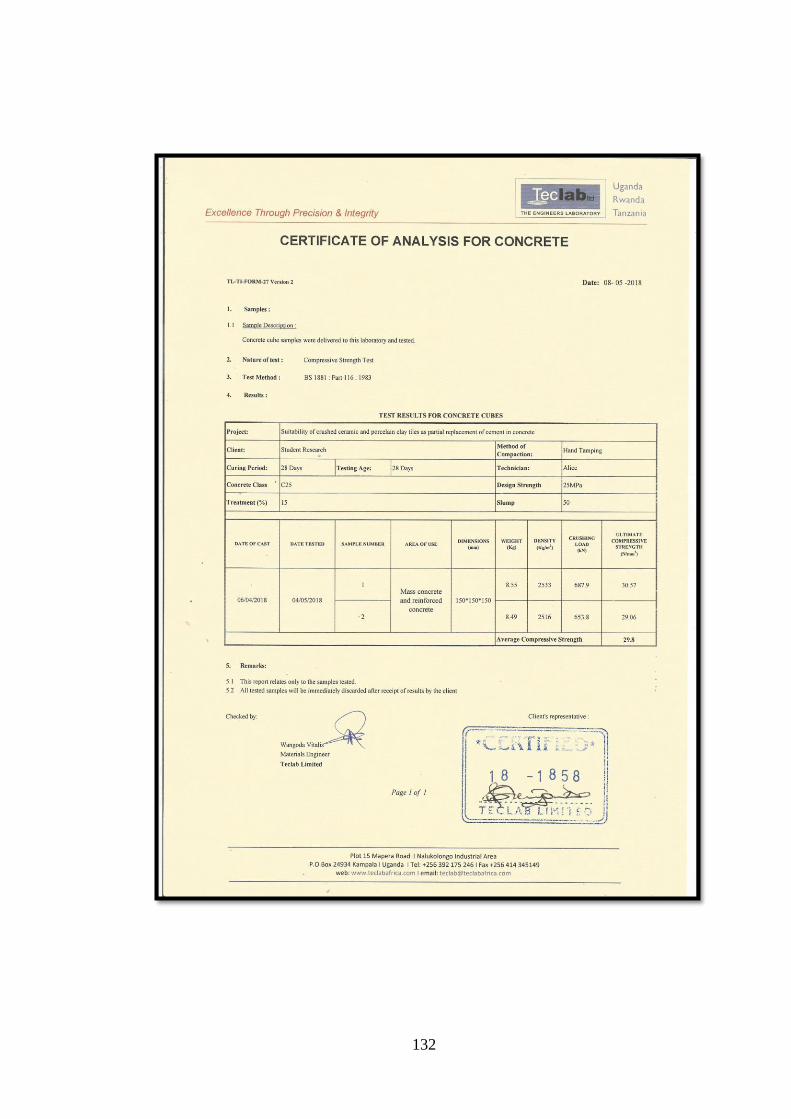
132
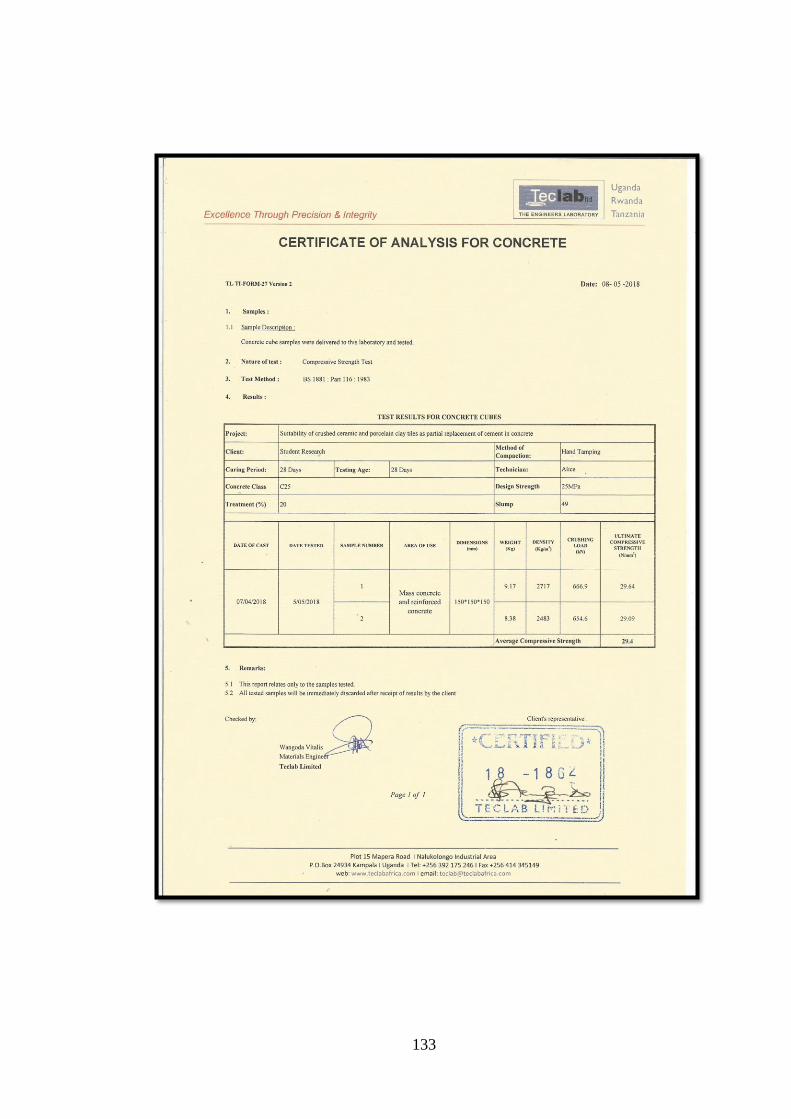
133
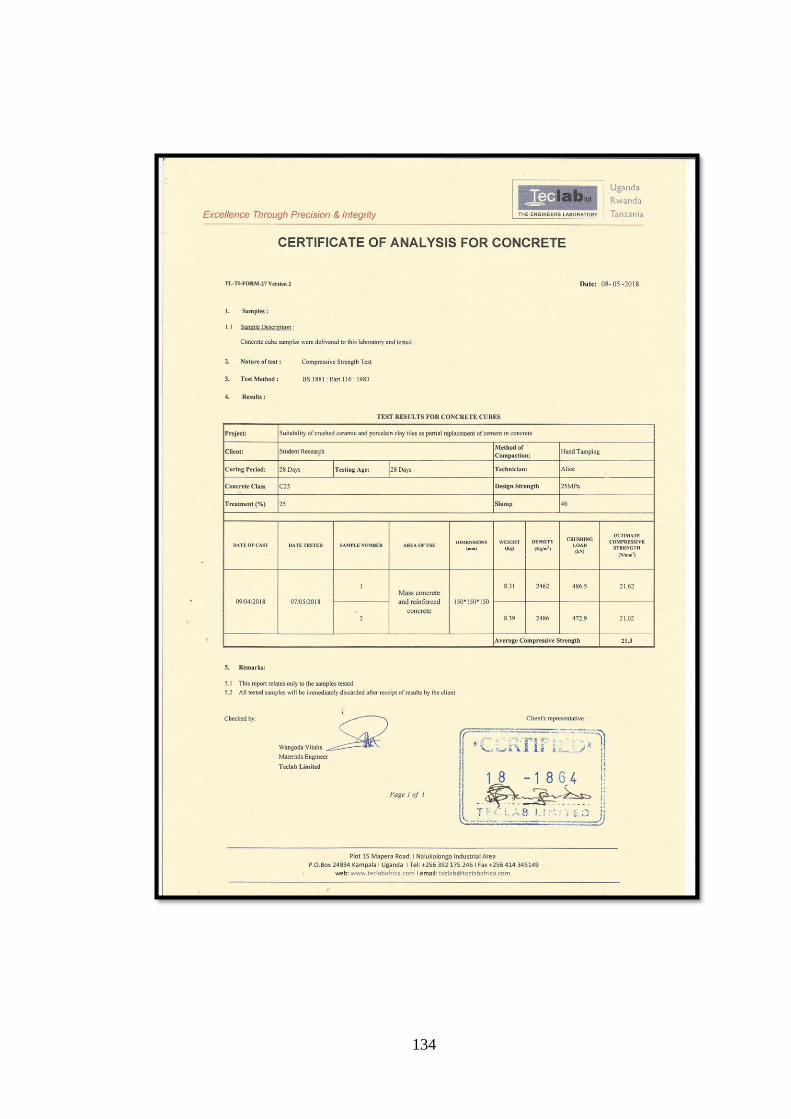
134
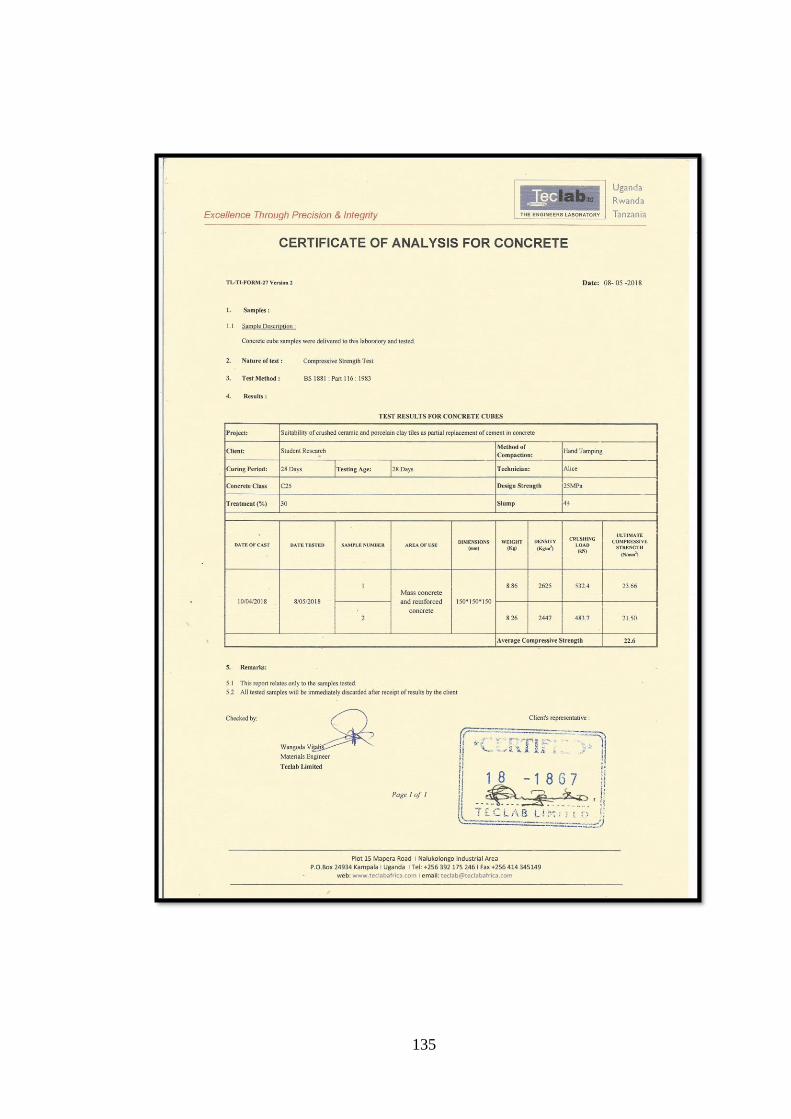
135
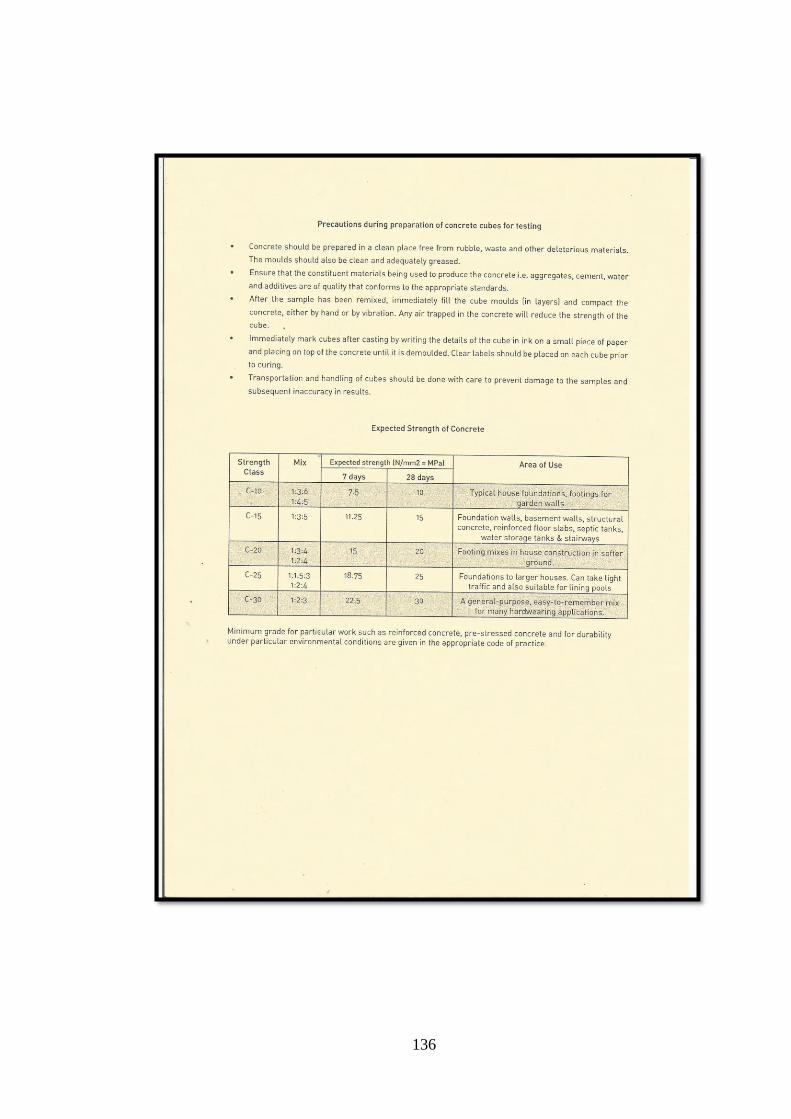
136
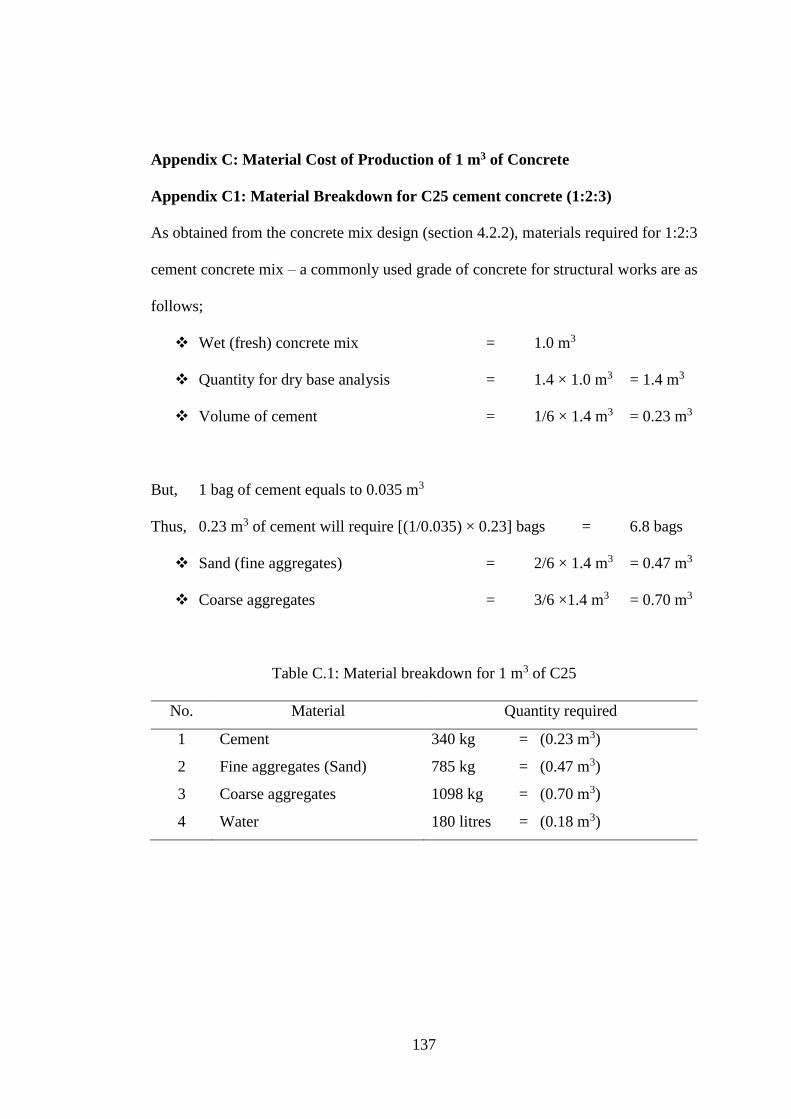
137
Appendix C: Material Cost of Production of 1 m3 of Concrete
Appendix C1: Material Breakdown for C25 cement concrete (1:2:3)
As obtained from the concrete mix design (section 4.2.2), materials required for 1:2:3
cement concrete mix – a commonly used grade of concrete for structural works are as
follows;
Wet (fresh) concrete mix = 1.0 m3
Quantity for dry base analysis = 1.4 × 1.0 m3 = 1.4 m3
Volume of cement = 1/6 × 1.4 m3 = 0.23 m3
But, 1 bag of cement equals to 0.035 m3
Thus, 0.23 m3 of cement will require [(1/0.035) × 0.23] bags = 6.8 bags
Sand (fine aggregates) = 2/6 × 1.4 m3 = 0.47 m3
Coarse aggregates = 3/6 ×1.4 m3 = 0.70 m3
Table C.1: Material breakdown for 1 m3 of C25
No. Material Quantity required
1 Cement 340 kg = (0.23 m3)
2 Fine aggregates (Sand) 785 kg = (0.47 m3)
3 Coarse aggregates 1098 kg = (0.70 m3)
4 Water 180 litres = (0.18 m3)
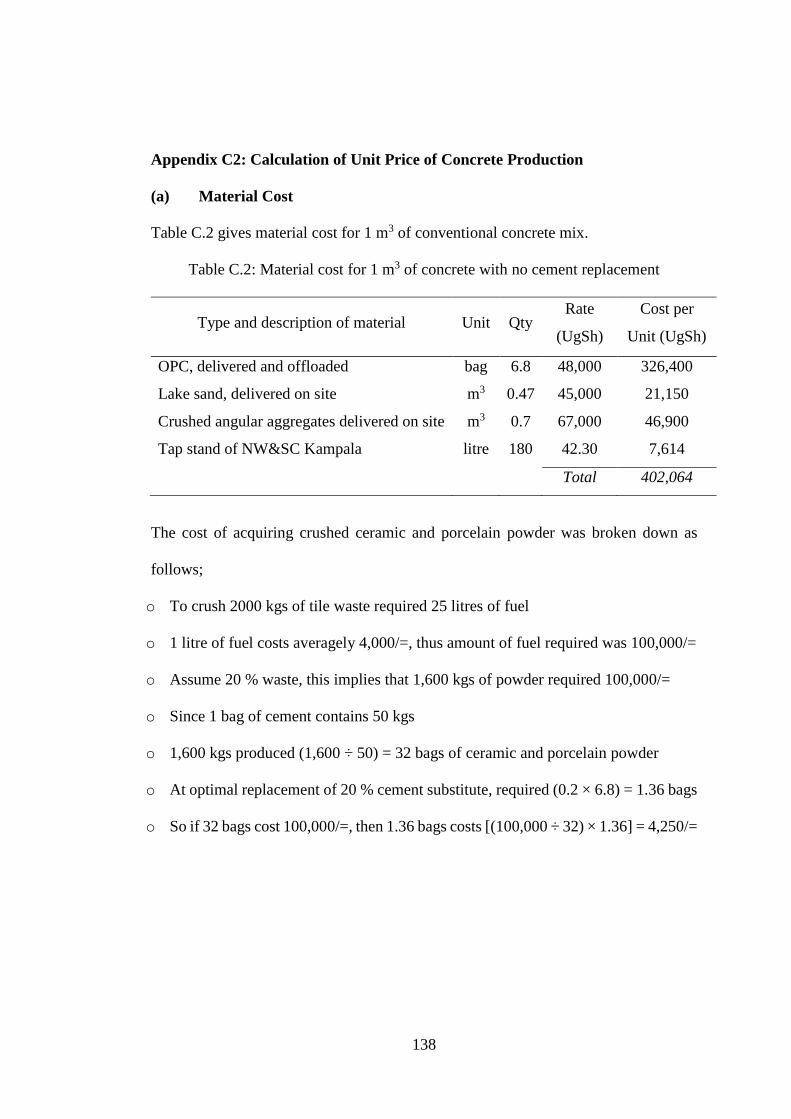
138
Appendix C2: Calculation of Unit Price of Concrete Production
(a) Material Cost
Table C.2 gives material cost for 1 m3 of conventional concrete mix.
Table C.2: Material cost for 1 m3 of concrete with no cement replacement
Type and description of material Unit Qty Rate
(UgSh)
Cost per
Unit (UgSh)
OPC, delivered and offloaded bag 6.8 48,000 326,400
Lake sand, delivered on site m3 0.47 45,000 21,150
Crushed angular aggregates delivered on site m3 0.7 67,000 46,900
Tap stand of NW&SC Kampala litre 180 42.30 7,614
Total 402,064
The cost of acquiring crushed ceramic and porcelain powder was broken down as
follows;
o To crush 2000 kgs of tile waste required 25 litres of fuel
o 1 litre of fuel costs averagely 4,000/=, thus amount of fuel required was 100,000/=
o Assume 20 % waste, this implies that 1,600 kgs of powder required 100,000/=
o Since 1 bag of cement contains 50 kgs
o 1,600 kgs produced (1,600 ÷ 50) = 32 bags of ceramic and porcelain powder
o At optimal replacement of 20 % cement substitute, required (0.2 × 6.8) = 1.36 bags
o So if 32 bags cost 100,000/=, then 1.36 bags costs [(100,000 ÷ 32) × 1.36] = 4,250/=
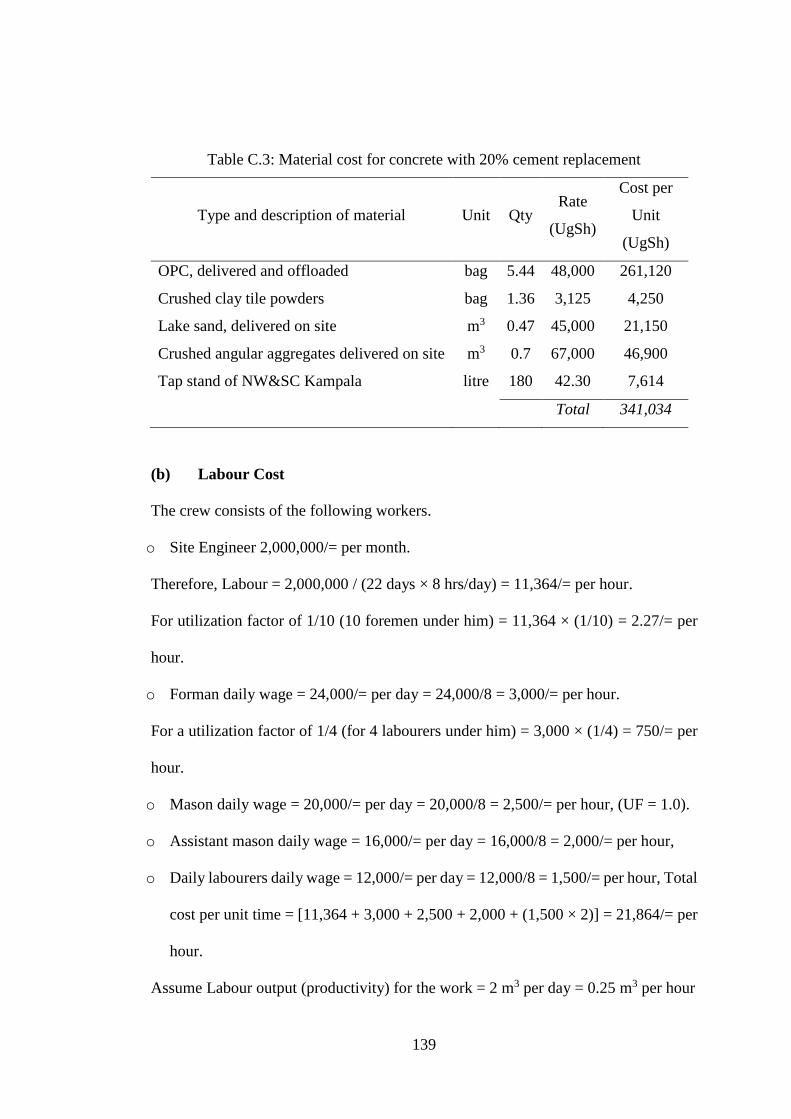
139
Table C.3: Material cost for concrete with 20% cement replacement
Type and description of material Unit Qty Rate
(UgSh)
Cost per
Unit
(UgSh)
OPC, delivered and offloaded bag 5.44 48,000 261,120
Crushed clay tile powders bag 1.36 3,125 4,250
Lake sand, delivered on site m3 0.47 45,000 21,150
Crushed angular aggregates delivered on site m3 0.7 67,000 46,900
Tap stand of NW&SC Kampala litre 180 42.30 7,614
Total 341,034
(b) Labour Cost
The crew consists of the following workers.
o Site Engineer 2,000,000/= per month.
Therefore, Labour = 2,000,000 / (22 days × 8 hrs/day) = 11,364/= per hour.
For utilization factor of 1/10 (10 foremen under him) = 11,364 × (1/10) = 2.27/= per
hour.
o Forman daily wage = 24,000/= per day = 24,000/8 = 3,000/= per hour.
For a utilization factor of 1/4 (for 4 labourers under him) = 3,000 × (1/4) = 750/= per
hour.
o Mason daily wage = 20,000/= per day = 20,000/8 = 2,500/= per hour, (UF = 1.0).
o Assistant mason daily wage = 16,000/= per day = 16,000/8 = 2,000/= per hour,
o Daily labourers daily wage = 12,000/= per day = 12,000/8 = 1,500/= per hour, Total
cost per unit time = [11,364 + 3,000 + 2,500 + 2,000 + (1,500 × 2)] = 21,864/= per
hour.
Assume Labour output (productivity) for the work = 2 m3 per day = 0.25 m3 per hour
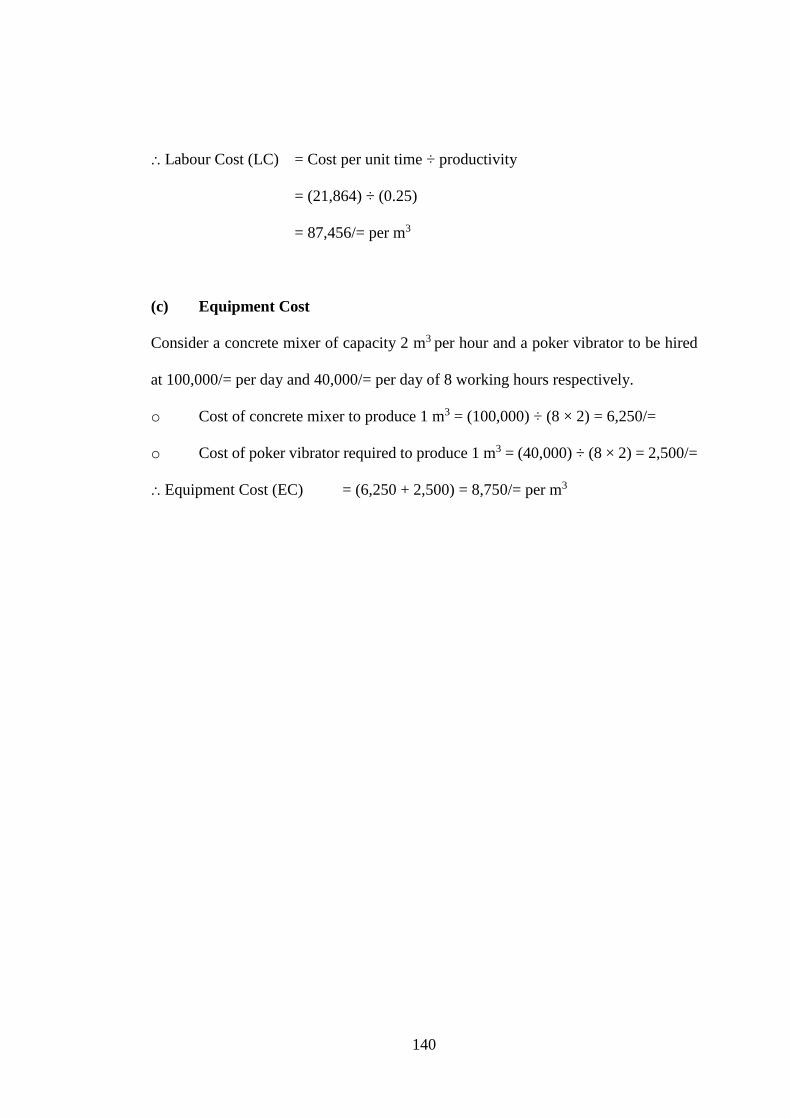
140
⸫ Labour Cost (LC) = Cost per unit time ÷ productivity
= (21,864) ÷ (0.25)
= 87,456/= per m3
(c) Equipment Cost
Consider a concrete mixer of capacity 2 m3 per hour and a poker vibrator to be hired
at 100,000/= per day and 40,000/= per day of 8 working hours respectively.
o Cost of concrete mixer to produce 1 m3 = (100,000) ÷ (8 × 2) = 6,250/=
o Cost of poker vibrator required to produce 1 m3 = (40,000) ÷ (8 × 2) = 2,500/=
⸫ Equipment Cost (EC) = (6,250 + 2,500) = 8,750/= per m3
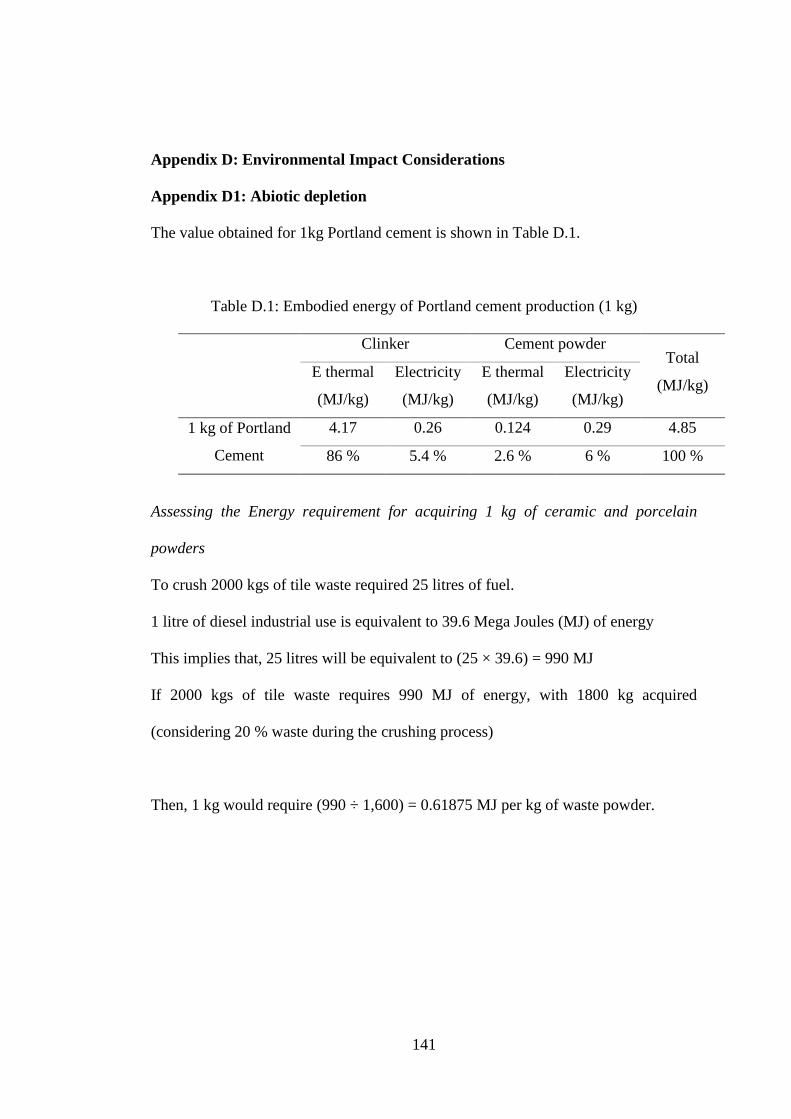
141
Appendix D: Environmental Impact Considerations
Appendix D1: Abiotic depletion
The value obtained for 1kg Portland cement is shown in Table D.1.
Table D.1: Embodied energy of Portland cement production (1 kg)
Clinker Cement powder Total
(MJ/kg) E thermal
(MJ/kg)
Electricity
(MJ/kg)
E thermal
(MJ/kg)
Electricity
(MJ/kg)
1 kg of Portland
Cement
4.17 0.26 0.124 0.29 4.85
86 % 5.4 % 2.6 % 6 % 100 %
Assessing the Energy requirement for acquiring 1 kg of ceramic and porcelain
powders
To crush 2000 kgs of tile waste required 25 litres of fuel.
1 litre of diesel industrial use is equivalent to 39.6 Mega Joules (MJ) of energy
This implies that, 25 litres will be equivalent to (25 × 39.6) = 990 MJ
If 2000 kgs of tile waste requires 990 MJ of energy, with 1800 kg acquired
(considering 20 % waste during the crushing process)
Then, 1 kg would require (990 ÷ 1,600) = 0.61875 MJ per kg of waste powder.
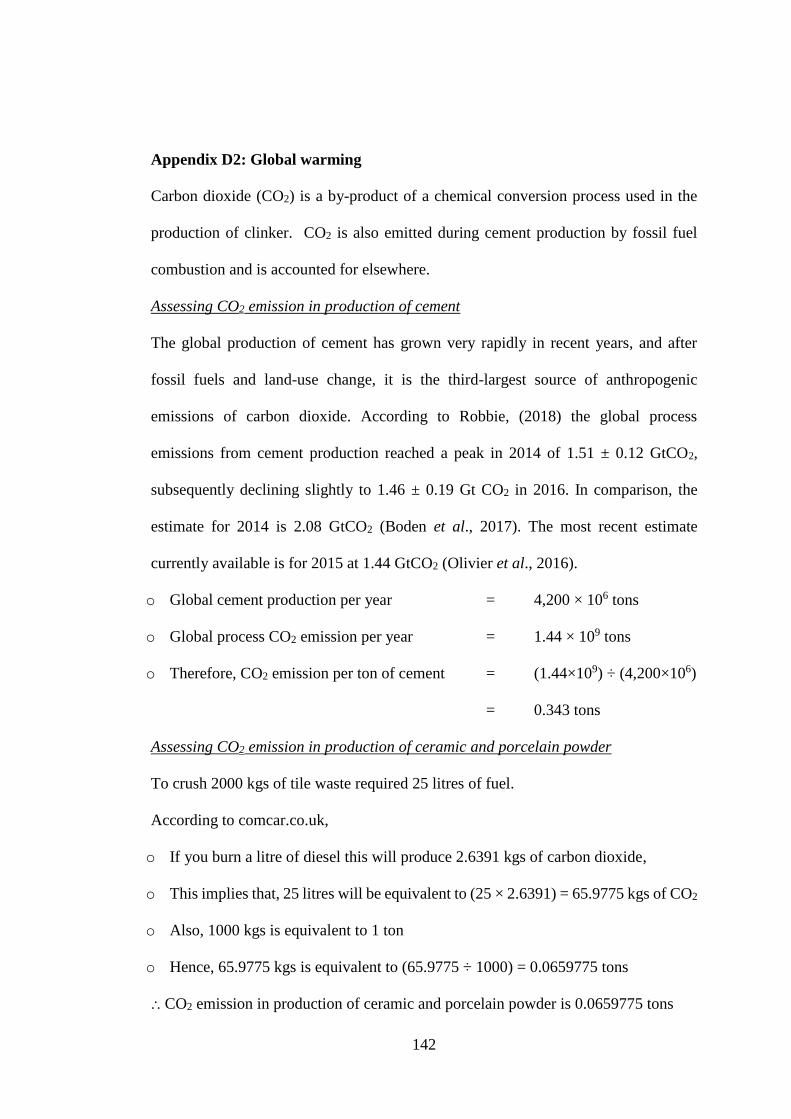
142
Appendix D2: Global warming
Carbon dioxide (CO2) is a by-product of a chemical conversion process used in the
production of clinker. CO2 is also emitted during cement production by fossil fuel
combustion and is accounted for elsewhere.
Assessing CO2 emission in production of cement
The global production of cement has grown very rapidly in recent years, and after
fossil fuels and land-use change, it is the third-largest source of anthropogenic
emissions of carbon dioxide. According to Robbie, (2018) the global process
emissions from cement production reached a peak in 2014 of 1.51 ± 0.12 GtCO2,
subsequently declining slightly to 1.46 ± 0.19 Gt CO2 in 2016. In comparison, the
estimate for 2014 is 2.08 GtCO2 (Boden et al., 2017). The most recent estimate
currently available is for 2015 at 1.44 GtCO2 (Olivier et al., 2016).
o Global cement production per year = 4,200 × 106 tons
o Global process CO2 emission per year = 1.44 × 10⁹ tons
o Therefore, CO2 emission per ton of cement = (1.44×10⁹) ÷ (4,200×106)
= 0.343 tons
Assessing CO2 emission in production of ceramic and porcelain powder
To crush 2000 kgs of tile waste required 25 litres of fuel.
According to comcar.co.uk,
o If you burn a litre of diesel this will produce 2.6391 kgs of carbon dioxide,
o This implies that, 25 litres will be equivalent to (25 × 2.6391) = 65.9775 kgs of CO2
o Also, 1000 kgs is equivalent to 1 ton
o Hence, 65.9775 kgs is equivalent to (65.9775 ÷ 1000) = 0.0659775 tons
⸫ CO2 emission in production of ceramic and porcelain powder is 0.0659775 tons

143
Appendix E: Publications
Physical and Mechanical Experimental Investigation of Concrete incorporated with Ceramic and Porcelain Clay Tile Powders as
Partial Cement Substitutes
Morris Oleng Post Graduate Student
Department of Civil Engineering PAN AFRICAN UNIVERSITY Institute for Basic Sciences,
Technology and Innovation (PAUSTI) Nairobi, Kenya
Christopher Kanali Professor
Dept. of Agricultural and Biosystems Engineering Jomo Kenyatta University of Agriculture and Technology
Nairobi, Kenya
Zachary C. Abiero Gariy Professor
Department of Civil Engineering Jomo Kenyatta University of Agriculture and Technology
Nairobi, Kenya
Erick Ronoh Doctor
Dept. of Agricultural and Biosystems Engineering Jomo Kenyatta University of Agriculture and Technology
Nairobi, Kenya
Abstract— The increased demand of construction over the past two decades has led to drastic increase in the cost of concrete production. The increasing cost and scarcity of portland cement has impacted negatively on the delivery of affordable housing and infrastructural development in developing countries like Uganda. For this reason, there is urgent need for finding suitable alternatives which can replace cement partially or at a high proportion. This study focussed on establishing the feasibility of using crushed ceramic and porcelain clay tiles powder as partial replacement of cement in production of eco-friendly concrete. Concrete cubes measuring 150 mm × 150 mm × 150 mm and 100 mm × 200 mm cylinder specimens were made from seven different concrete mixes prepared by using crushed ceramic and porcelain clay tile powder to replace 0%, 5%, 10%, 15%, 20%, 25% and 30% of ordinary portland cement by mass. The workabilities of the fresh concrete mixes were evaluated using the slump while compressive and splitting tensile strengths of hardened concrete were evaluated at different curing periods of 7, 14, and 28 days. The results of slump test showed that increase in ceramic and porcelain powder replacement decreased the workability of concrete. Replacement of cement with ceramic and porcelain powder significantly increased the compressive strength of concrete. Conclusively, the target compressive and tensile splitting strengths were achieved up to 20% replacement of cement with ceramic and porcelain powder beyond which the strength reduced.
Keywords— Cement; Ceramic And Porcelain Clay Tile Powder; Concrete; Workability; Compressive Strength; Splitting Tensile Strength
I. INTRODUCTION The construction industry constitutes one of the main
contributors to the economy of any country (about 10% of the gross domestic product). It plays a huge role in not only economic development but also improving the welfare of the citizens. Recently, the growth rate in construction has increased drastically by over 1.8% globally with the largest contributors
to the construction market being Europe, America, Asia and Japan as they control more than 70% of the industry [22]. Concrete is the world most utilized construction material and due to this, statistics have shown that worldwide cement production, by major producing countries from 2011 to 2016 has drastically increased and so has its cost [23]. Additionally, the growing concern of depletion of resources necessitates the search for alternatives sources [1]. For these reasons, there is need for increased initiatives to modify ordinary concrete to make it more sustainable and affordable so as to cater for the increasing construction boom [18].
Different studies have been done with interest driven much towards wastes and recycled materials as they are economical and more environmental friendly. Such studies reported include replacing cement with animal blood, partial replacement with waste glass powder, replacing cement with rice husks, replacement with saw dust, replacement by steel shot dust, using kiln saw dust and many others [21]. Particularly, ceramic materials which include brick walls, ceramic tiles and all the ceramic products contribute the highest proportion of wastes in the construction and demolition waste [17]. Ceramic tile is a product that stands out for its low water absorption and high mechanical strength. The properties of the product result from its low porosity due to the processing conditions (high degree milling of raw materials, high force compaction and sintering temperature), and the potential of the raw materials to form liquid phases during sintering (high desiccation). Porcelain tile on the other hand has high vitreous characteristics [20].
This study, therefore, seeks to assess the suitability of utilizing old waste tiles from demolished structures in order to reduce waste around cities such as Kampala. The properties of crushed ceramic and porcelain clay tile powder were determined. Cement was partially replaced 0%, 5%, 10%, 15%, 20%, 25%, and 30% of crushed ceramic and porcelain clay tile powder in M25 concrete.
International Journal of Engineering Research & Technology (IJERT)
ISSN: 2278-0181http://www.ijert.org
IJERTV7IS090044(This work is licensed under a Creative Commons Attribution 4.0 International License.)
Published by :
www.ijert.org
Vol. 7 Issue 09, September-2018
126
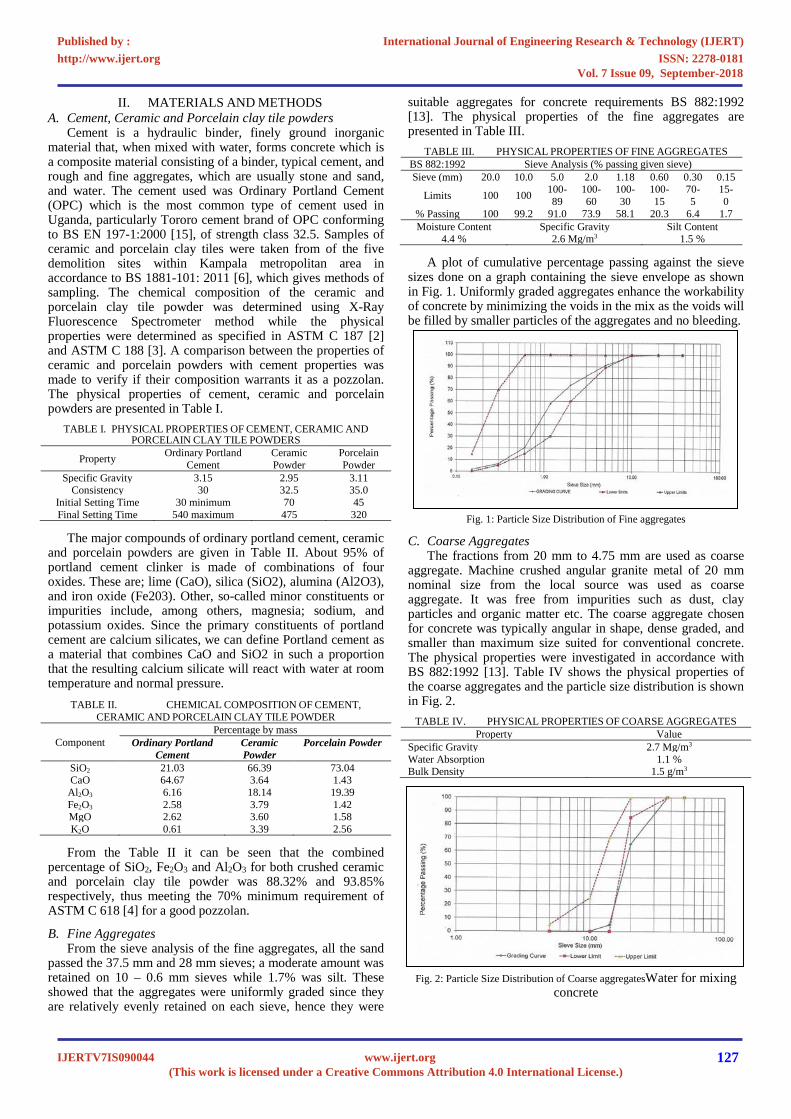
II. MATERIALS AND METHODS A. Cement, Ceramic and Porcelain clay tile powders
Cement is a hydraulic binder, finely ground inorganic material that, when mixed with water, forms concrete which is a composite material consisting of a binder, typical cement, and rough and fine aggregates, which are usually stone and sand, and water. The cement used was Ordinary Portland Cement (OPC) which is the most common type of cement used in Uganda, particularly Tororo cement brand of OPC conforming to BS EN 197-1:2000 [15], of strength class 32.5. Samples of ceramic and porcelain clay tiles were taken from of the five demolition sites within Kampala metropolitan area in accordance to BS 1881-101: 2011 [6], which gives methods of sampling. The chemical composition of the ceramic and porcelain clay tile powder was determined using X-Ray Fluorescence Spectrometer method while the physical properties were determined as specified in ASTM C 187 [2] and ASTM C 188 [3]. A comparison between the properties of ceramic and porcelain powders with cement properties was made to verify if their composition warrants it as a pozzolan. The physical properties of cement, ceramic and porcelain powders are presented in Table I.
TABLE I. PHYSICAL PROPERTIES OF CEMENT, CERAMIC AND PORCELAIN CLAY TILE POWDERS
Property Ordinary Portland Cement
Ceramic Powder
Porcelain Powder
Specific Gravity 3.15 2.95 3.11 Consistency 30 32.5 35.0
Initial Setting Time 30 minimum 70 45 Final Setting Time 540 maximum 475 320
The major compounds of ordinary portland cement, ceramic and porcelain powders are given in Table II. About 95% of portland cement clinker is made of combinations of four oxides. These are; lime (CaO), silica (SiO2), alumina (Al2O3), and iron oxide (Fe203). Other, so-called minor constituents or impurities include, among others, magnesia; sodium, and potassium oxides. Since the primary constituents of portland cement are calcium silicates, we can define Portland cement as a material that combines CaO and SiO2 in such a proportion that the resulting calcium silicate will react with water at room temperature and normal pressure.
TABLE II. CHEMICAL COMPOSITION OF CEMENT, CERAMIC AND PORCELAIN CLAY TILE POWDER
Component Percentage by mass
Ordinary Portland Cement
Ceramic Powder
Porcelain Powder
SiO2 21.03 66.39 73.04 CaO 64.67 3.64 1.43
Al2O3 6.16 18.14 19.39 Fe2O3 2.58 3.79 1.42 MgO 2.62 3.60 1.58 K2O 0.61 3.39 2.56
From the Table II it can be seen that the combined percentage of SiO2, Fe2O3 and Al2O3 for both crushed ceramic and porcelain clay tile powder was 88.32% and 93.85% respectively, thus meeting the 70% minimum requirement of ASTM C 618 [4] for a good pozzolan.
B. Fine Aggregates From the sieve analysis of the fine aggregates, all the sand
passed the 37.5 mm and 28 mm sieves; a moderate amount was retained on 10 – 0.6 mm sieves while 1.7% was silt. These showed that the aggregates were uniformly graded since they are relatively evenly retained on each sieve, hence they were
suitable aggregates for concrete requirements BS 882:1992 [13]. The physical properties of the fine aggregates are presented in Table III.
TABLE III. PHYSICAL PROPERTIES OF FINE AGGREGATES BS 882:1992 Sieve Analysis (% passing given sieve) Sieve (mm) 20.0 10.0 5.0 2.0 1.18 0.60 0.30 0.15
Limits 100 100 100-89
100-60
100-30
100-15
70-5
15-0
% Passing 100 99.2 91.0 73.9 58.1 20.3 6.4 1.7 Moisture Content
4.4 % Specific Gravity
2.6 Mg/m3 Silt Content
1.5 %
A plot of cumulative percentage passing against the sieve sizes done on a graph containing the sieve envelope as shown in Fig. 1. Uniformly graded aggregates enhance the workability of concrete by minimizing the voids in the mix as the voids will be filled by smaller particles of the aggregates and no bleeding.
Fig. 1: Particle Size Distribution of Fine aggregates
C. Coarse Aggregates The fractions from 20 mm to 4.75 mm are used as coarse
aggregate. Machine crushed angular granite metal of 20 mm nominal size from the local source was used as coarse aggregate. It was free from impurities such as dust, clay particles and organic matter etc. The coarse aggregate chosen for concrete was typically angular in shape, dense graded, and smaller than maximum size suited for conventional concrete. The physical properties were investigated in accordance with BS 882:1992 [13]. Table IV shows the physical properties of the coarse aggregates and the particle size distribution is shown in Fig. 2.
TABLE IV. PHYSICAL PROPERTIES OF COARSE AGGREGATES Property Value
Specific Gravity 2.7 Mg/m3 Water Absorption 1.1 % Bulk Density 1.5 g/m3
Fig. 2: Particle Size Distribution of Coarse aggregatesWater for mixing concrete
International Journal of Engineering Research & Technology (IJERT)
ISSN: 2278-0181http://www.ijert.org
IJERTV7IS090044(This work is licensed under a Creative Commons Attribution 4.0 International License.)
Published by :
www.ijert.org
Vol. 7 Issue 09, September-2018
127
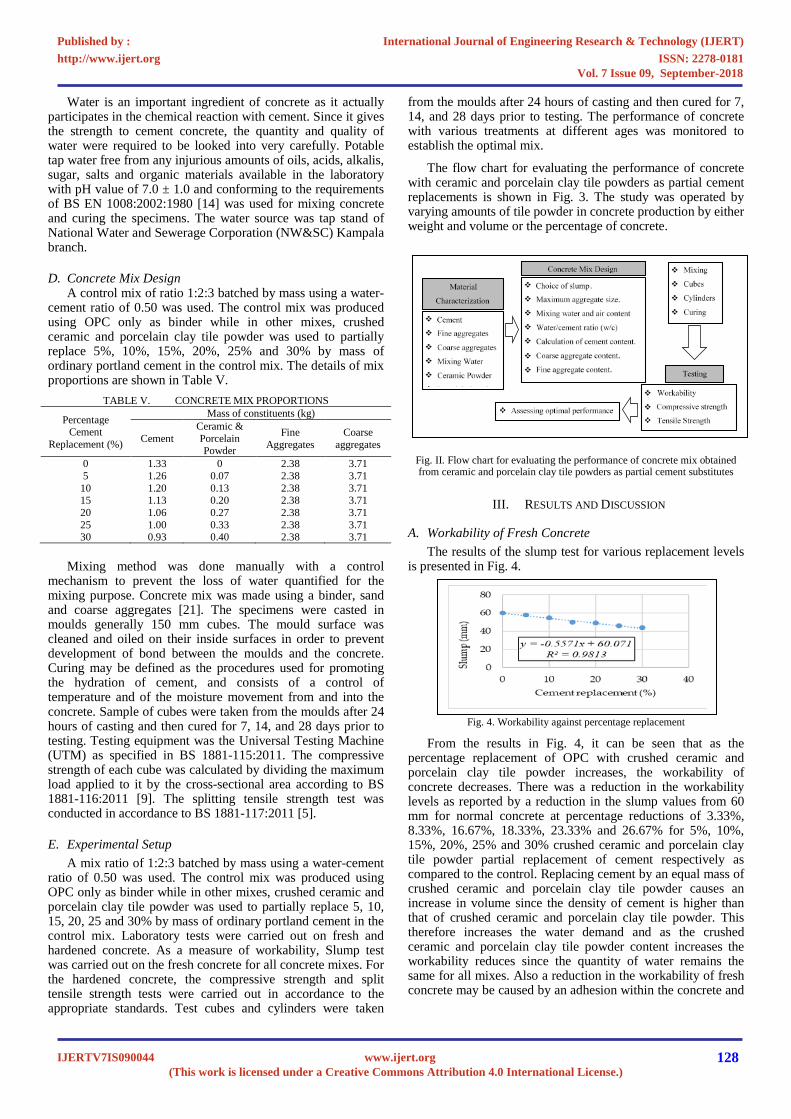
Water is an important ingredient of concrete as it actually participates in the chemical reaction with cement. Since it gives the strength to cement concrete, the quantity and quality of water were required to be looked into very carefully. Potable tap water free from any injurious amounts of oils, acids, alkalis, sugar, salts and organic materials available in the laboratory with pH value of 7.0 ± 1.0 and conforming to the requirements of BS EN 1008:2002:1980 [14] was used for mixing concrete and curing the specimens. The water source was tap stand of National Water and Sewerage Corporation (NW&SC) Kampala branch.
D. Concrete Mix Design A control mix of ratio 1:2:3 batched by mass using a water-
cement ratio of 0.50 was used. The control mix was produced using OPC only as binder while in other mixes, crushed ceramic and porcelain clay tile powder was used to partially replace 5%, 10%, 15%, 20%, 25% and 30% by mass of ordinary portland cement in the control mix. The details of mix proportions are shown in Table V.
TABLE V. CONCRETE MIX PROPORTIONS
Percentage Cement
Replacement (%)
Mass of constituents (kg)
Cement Ceramic & Porcelain Powder
Fine Aggregates
Coarse aggregates
0 1.33 0 2.38 3.71 5 1.26 0.07 2.38 3.71
10 1.20 0.13 2.38 3.71 15 1.13 0.20 2.38 3.71 20 1.06 0.27 2.38 3.71 25 1.00 0.33 2.38 3.71 30 0.93 0.40 2.38 3.71
Mixing method was done manually with a control
mechanism to prevent the loss of water quantified for the mixing purpose. Concrete mix was made using a binder, sand and coarse aggregates [21]. The specimens were casted in moulds generally 150 mm cubes. The mould surface was cleaned and oiled on their inside surfaces in order to prevent development of bond between the moulds and the concrete. Curing may be defined as the procedures used for promoting the hydration of cement, and consists of a control of temperature and of the moisture movement from and into the concrete. Sample of cubes were taken from the moulds after 24 hours of casting and then cured for 7, 14, and 28 days prior to testing. Testing equipment was the Universal Testing Machine (UTM) as specified in BS 1881-115:2011. The compressive strength of each cube was calculated by dividing the maximum load applied to it by the cross-sectional area according to BS 1881-116:2011 [9]. The splitting tensile strength test was conducted in accordance to BS 1881-117:2011 [5].
E. Experimental Setup A mix ratio of 1:2:3 batched by mass using a water-cement
ratio of 0.50 was used. The control mix was produced using OPC only as binder while in other mixes, crushed ceramic and porcelain clay tile powder was used to partially replace 5, 10, 15, 20, 25 and 30% by mass of ordinary portland cement in the control mix. Laboratory tests were carried out on fresh and hardened concrete. As a measure of workability, Slump test was carried out on the fresh concrete for all concrete mixes. For the hardened concrete, the compressive strength and split tensile strength tests were carried out in accordance to the appropriate standards. Test cubes and cylinders were taken
from the moulds after 24 hours of casting and then cured for 7, 14, and 28 days prior to testing. The performance of concrete with various treatments at different ages was monitored to establish the optimal mix.
The flow chart for evaluating the performance of concrete with ceramic and porcelain clay tile powders as partial cement replacements is shown in Fig. 3. The study was operated by varying amounts of tile powder in concrete production by either weight and volume or the percentage of concrete.
Fig. II. Flow chart for evaluating the performance of concrete mix obtained from ceramic and porcelain clay tile powders as partial cement substitutes
III. RESULTS AND DISCUSSION
A. Workability of Fresh Concrete The results of the slump test for various replacement levels
is presented in Fig. 4.
Fig. 4. Workability against percentage replacement
From the results in Fig. 4, it can be seen that as the percentage replacement of OPC with crushed ceramic and porcelain clay tile powder increases, the workability of concrete decreases. There was a reduction in the workability levels as reported by a reduction in the slump values from 60 mm for normal concrete at percentage reductions of 3.33%, 8.33%, 16.67%, 18.33%, 23.33% and 26.67% for 5%, 10%, 15%, 20%, 25% and 30% crushed ceramic and porcelain clay tile powder partial replacement of cement respectively as compared to the control. Replacing cement by an equal mass of crushed ceramic and porcelain clay tile powder causes an increase in volume since the density of cement is higher than that of crushed ceramic and porcelain clay tile powder. This therefore increases the water demand and as the crushed ceramic and porcelain clay tile powder content increases the workability reduces since the quantity of water remains the same for all mixes. Also a reduction in the workability of fresh concrete may be caused by an adhesion within the concrete and
International Journal of Engineering Research & Technology (IJERT)
ISSN: 2278-0181http://www.ijert.org
IJERTV7IS090044(This work is licensed under a Creative Commons Attribution 4.0 International License.)
Published by :
www.ijert.org
Vol. 7 Issue 09, September-2018
128
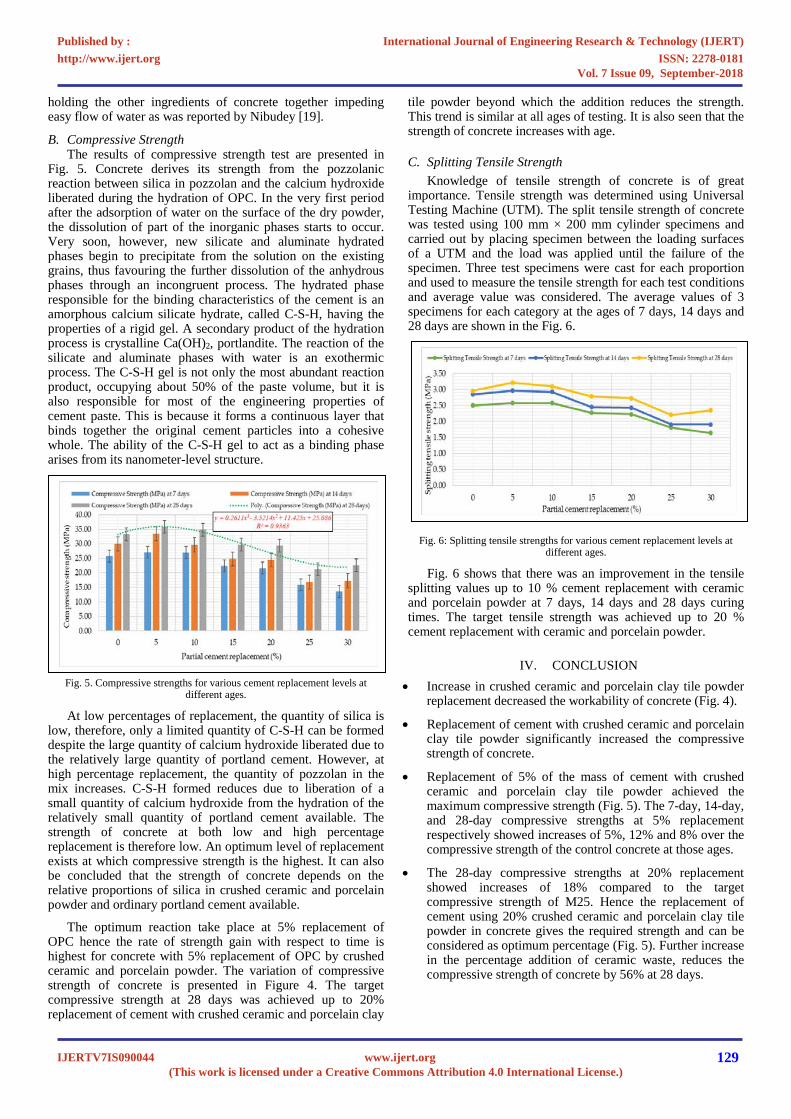
holding the other ingredients of concrete together impeding easy flow of water as was reported by Nibudey [19].
B. Compressive Strength The results of compressive strength test are presented in
Fig. 5. Concrete derives its strength from the pozzolanic reaction between silica in pozzolan and the calcium hydroxide liberated during the hydration of OPC. In the very first period after the adsorption of water on the surface of the dry powder, the dissolution of part of the inorganic phases starts to occur. Very soon, however, new silicate and aluminate hydrated phases begin to precipitate from the solution on the existing grains, thus favouring the further dissolution of the anhydrous phases through an incongruent process. The hydrated phase responsible for the binding characteristics of the cement is an amorphous calcium silicate hydrate, called C-S-H, having the properties of a rigid gel. A secondary product of the hydration process is crystalline Ca(OH)2, portlandite. The reaction of the silicate and aluminate phases with water is an exothermic process. The C-S-H gel is not only the most abundant reaction product, occupying about 50% of the paste volume, but it is also responsible for most of the engineering properties of cement paste. This is because it forms a continuous layer that binds together the original cement particles into a cohesive whole. The ability of the C-S-H gel to act as a binding phase arises from its nanometer-level structure.
Fig. 5. Compressive strengths for various cement replacement levels at
different ages.
At low percentages of replacement, the quantity of silica is low, therefore, only a limited quantity of C-S-H can be formed despite the large quantity of calcium hydroxide liberated due to the relatively large quantity of portland cement. However, at high percentage replacement, the quantity of pozzolan in the mix increases. C-S-H formed reduces due to liberation of a small quantity of calcium hydroxide from the hydration of the relatively small quantity of portland cement available. The strength of concrete at both low and high percentage replacement is therefore low. An optimum level of replacement exists at which compressive strength is the highest. It can also be concluded that the strength of concrete depends on the relative proportions of silica in crushed ceramic and porcelain powder and ordinary portland cement available.
The optimum reaction take place at 5% replacement of OPC hence the rate of strength gain with respect to time is highest for concrete with 5% replacement of OPC by crushed ceramic and porcelain powder. The variation of compressive strength of concrete is presented in Figure 4. The target compressive strength at 28 days was achieved up to 20% replacement of cement with crushed ceramic and porcelain clay
tile powder beyond which the addition reduces the strength. This trend is similar at all ages of testing. It is also seen that the strength of concrete increases with age.
C. Splitting Tensile Strength Knowledge of tensile strength of concrete is of great
importance. Tensile strength was determined using Universal Testing Machine (UTM). The split tensile strength of concrete was tested using 100 mm × 200 mm cylinder specimens and carried out by placing specimen between the loading surfaces of a UTM and the load was applied until the failure of the specimen. Three test specimens were cast for each proportion and used to measure the tensile strength for each test conditions and average value was considered. The average values of 3 specimens for each category at the ages of 7 days, 14 days and 28 days are shown in the Fig. 6.
Fig. 5: Splitting tensile strengths for various cement replacement levels at different ages.
Fig. 6: Splitting tensile strengths for various cement replacement levels at different ages.
Fig. 6 shows that there was an improvement in the tensile splitting values up to 10 % cement replacement with ceramic and porcelain powder at 7 days, 14 days and 28 days curing times. The target tensile strength was achieved up to 20 % cement replacement with ceramic and porcelain powder.
IV. CONCLUSION • Increase in crushed ceramic and porcelain clay tile powder
replacement decreased the workability of concrete (Fig. 4).
• Replacement of cement with crushed ceramic and porcelain clay tile powder significantly increased the compressive strength of concrete.
• Replacement of 5% of the mass of cement with crushed ceramic and porcelain clay tile powder achieved the maximum compressive strength (Fig. 5). The 7-day, 14-day, and 28-day compressive strengths at 5% replacement respectively showed increases of 5%, 12% and 8% over the compressive strength of the control concrete at those ages.
• The 28-day compressive strengths at 20% replacement showed increases of 18% compared to the target compressive strength of M25. Hence the replacement of cement using 20% crushed ceramic and porcelain clay tile powder in concrete gives the required strength and can be considered as optimum percentage (Fig. 5). Further increase in the percentage addition of ceramic waste, reduces the compressive strength of concrete by 56% at 28 days.
International Journal of Engineering Research & Technology (IJERT)
ISSN: 2278-0181http://www.ijert.org
IJERTV7IS090044(This work is licensed under a Creative Commons Attribution 4.0 International License.)
Published by :
www.ijert.org
Vol. 7 Issue 09, September-2018
129
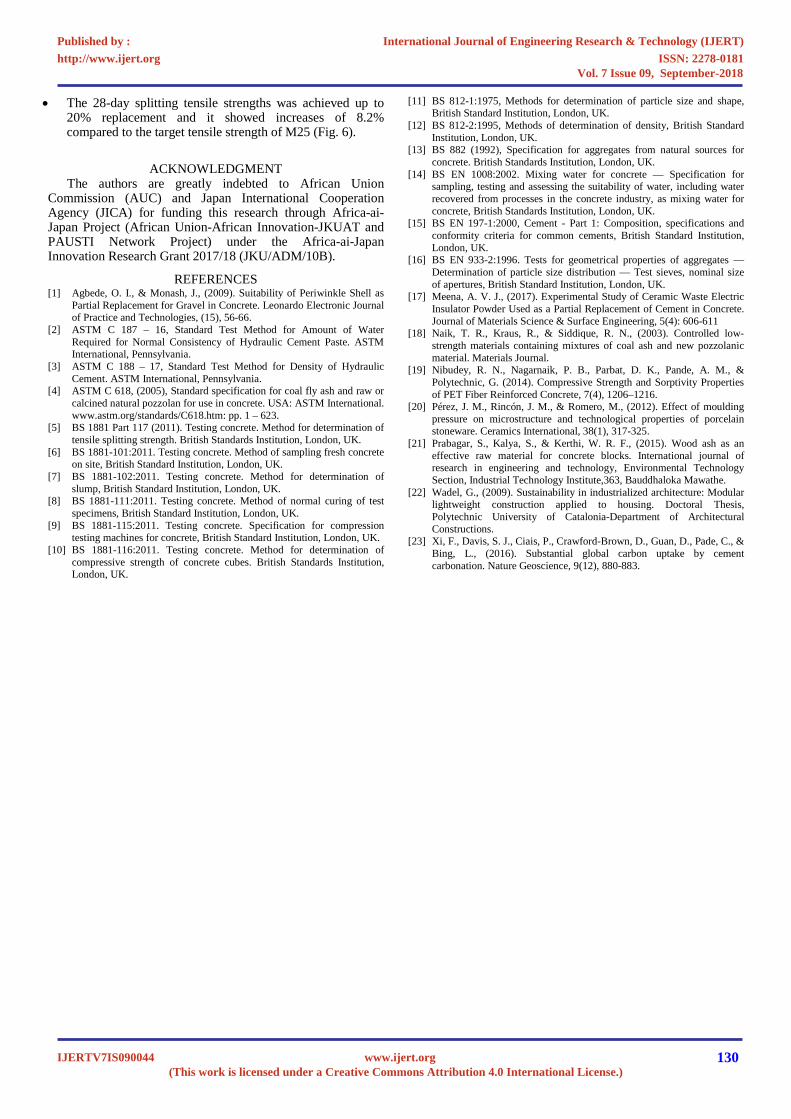
• The 28-day splitting tensile strengths was achieved up to 20% replacement and it showed increases of 8.2% compared to the target tensile strength of M25 (Fig. 6).
ACKNOWLEDGMENT The authors are greatly indebted to African Union
Commission (AUC) and Japan International Cooperation Agency (JICA) for funding this research through Africa-ai-Japan Project (African Union-African Innovation-JKUAT and PAUSTI Network Project) under the Africa-ai-Japan Innovation Research Grant 2017/18 (JKU/ADM/10B).
REFERENCES [1] Agbede, O. I., & Monash, J., (2009). Suitability of Periwinkle Shell as
Partial Replacement for Gravel in Concrete. Leonardo Electronic Journal of Practice and Technologies, (15), 56-66.
[2] ASTM C 187 – 16, Standard Test Method for Amount of Water Required for Normal Consistency of Hydraulic Cement Paste. ASTM International, Pennsylvania.
[3] ASTM C 188 – 17, Standard Test Method for Density of Hydraulic Cement. ASTM International, Pennsylvania.
[4] ASTM C 618, (2005), Standard specification for coal fly ash and raw or calcined natural pozzolan for use in concrete. USA: ASTM International. www.astm.org/standards/C618.htm: pp. 1 – 623.
[5] BS 1881 Part 117 (2011). Testing concrete. Method for determination of tensile splitting strength. British Standards Institution, London, UK.
[6] BS 1881-101:2011. Testing concrete. Method of sampling fresh concrete on site, British Standard Institution, London, UK.
[7] BS 1881-102:2011. Testing concrete. Method for determination of slump, British Standard Institution, London, UK.
[8] BS 1881-111:2011. Testing concrete. Method of normal curing of test specimens, British Standard Institution, London, UK.
[9] BS 1881-115:2011. Testing concrete. Specification for compression testing machines for concrete, British Standard Institution, London, UK.
[10] BS 1881-116:2011. Testing concrete. Method for determination of compressive strength of concrete cubes. British Standards Institution, London, UK.
[11] BS 812-1:1975, Methods for determination of particle size and shape, British Standard Institution, London, UK.
[12] BS 812-2:1995, Methods of determination of density, British Standard Institution, London, UK.
[13] BS 882 (1992), Specification for aggregates from natural sources for concrete. British Standards Institution, London, UK.
[14] BS EN 1008:2002. Mixing water for concrete — Specification for sampling, testing and assessing the suitability of water, including water recovered from processes in the concrete industry, as mixing water for concrete, British Standards Institution, London, UK.
[15] BS EN 197-1:2000, Cement - Part 1: Composition, specifications and conformity criteria for common cements, British Standard Institution, London, UK.
[16] BS EN 933-2:1996. Tests for geometrical properties of aggregates — Determination of particle size distribution — Test sieves, nominal size of apertures, British Standard Institution, London, UK.
[17] Meena, A. V. J., (2017). Experimental Study of Ceramic Waste Electric Insulator Powder Used as a Partial Replacement of Cement in Concrete. Journal of Materials Science & Surface Engineering, 5(4): 606-611
[18] Naik, T. R., Kraus, R., & Siddique, R. N., (2003). Controlled low-strength materials containing mixtures of coal ash and new pozzolanic material. Materials Journal.
[19] Nibudey, R. N., Nagarnaik, P. B., Parbat, D. K., Pande, A. M., & Polytechnic, G. (2014). Compressive Strength and Sorptivity Properties of PET Fiber Reinforced Concrete, 7(4), 1206–1216.
[20] Pérez, J. M., Rincón, J. M., & Romero, M., (2012). Effect of moulding pressure on microstructure and technological properties of porcelain stoneware. Ceramics International, 38(1), 317-325.
[21] Prabagar, S., Kalya, S., & Kerthi, W. R. F., (2015). Wood ash as an effective raw material for concrete blocks. International journal of research in engineering and technology, Environmental Technology Section, Industrial Technology Institute,363, Bauddhaloka Mawathe.
[22] Wadel, G., (2009). Sustainability in industrialized architecture: Modular lightweight construction applied to housing. Doctoral Thesis, Polytechnic University of Catalonia-Department of Architectural Constructions.
[23] Xi, F., Davis, S. J., Ciais, P., Crawford-Brown, D., Guan, D., Pade, C., & Bing, L., (2016). Substantial global carbon uptake by cement carbonation. Nature Geoscience, 9(12), 880-883.
International Journal of Engineering Research & Technology (IJERT)
ISSN: 2278-0181http://www.ijert.org
IJERTV7IS090044(This work is licensed under a Creative Commons Attribution 4.0 International License.)
Published by :
www.ijert.org
Vol. 7 Issue 09, September-2018
130
International Journal of IT, Engineering and Applied Sciences Research (IJIEASR) ISSN: 2319-4413 Volume 7, No. 7, July 2018
Impact Factor: 5.913 www.irjcjournals.org
1
Physical and Chemical Properties of Crushed Ceramic and
Porcelain Clay Tile Powder
Oleng Morris, PG Student, Department of Civil Engineering, Pan African University Institute for
Basic Sciences, Technology and Innovation (PAUSTI), Nairobi, Kenya
C. Kanali, Professor, Department of Agricultural and Biosystems Engineering, Jomo Kenyatta
University of Agriculture and Technology (JKUAT), Nairobi, Kenya
Zachary C. A. Gariy, Professor, Department of Civil Engineering, Jomo Kenyatta University of
Agriculture and Technology (JKUAT), Nairobi, Kenya
E. Ronoh, Doctor, Department of Agricultural and Biosystems Engineering, Jomo Kenyatta
University of Agriculture and Technology (JKUAT), Nairobi, Kenya
ABSTRACT
This study focussed on establishing the physical and
chemical properties of crushed ceramic and porcelain clay
tiles for use as partial replacement of cement in
production of eco-friendly concrete.Samples of ceramic
and porcelain clay tiles were taken in accordance to BS
1881-101: 1983, which gives methods of sampling. Five
kilograms of each material (ceramic and porcelain clay
tiles) was picked from each of the five sampled sites within
Kampala metropolitan area. The chemical composition of
the ceramic and porcelain clay tile powder was
determined using X-Ray Fluorescence Spectrometer
method while the physical properties were determined
using the ASTM C187 and ASTM C188. A comparison
between the properties of the waste materials and cement
was made to verify if its composition warrants it to be used
as a pozzolan. The results show that the combined
percentage of silica (SiO2), Iron Oxide (Fe2O3), and
Alumina (Al2O3) for both crushed ceramic and porcelain
clay tile powder was meeting the 70% minimum
requirement of ASTM C 618 for a good pozzolan.
Keywords
Ceramic powder; porcelain powder; physical and
chemical properties
1. INTRODUCTION
Ceramic is defined as inorganic and non – metallic solids
which can be highly crystalline, semi crystalline, vitrified
or completely amorphous. Ceramics are grouped into two
main groups which include the crystalline ceramics and
the non-crystalline ceramics. The crystalline ceramics are
found to be non-submissive to the wide range of
processing and hence the crystalline ceramic is prepared in
a desired shape either by reaction on site or by forming
powders in the desired shape and then heating it until it
becomes a solid mass. On the other hand, the non-
crystalline ceramics are made from melts. The shape of the
glass is formed either on a molten state or when it is in a
toffee like viscosity(Sivaprakash et al., 2016).
Ceramic wastes can be separated in two categories in
accordance with the source of raw materials. The first one
are all fired wastes generated by the structural ceramic
factories that use only red pastes to manufacture their
products, such as brick, blocks and roof tiles. The second
one is all fired waste produced in stoneware ceramic such
as wall, floor tiles and sanitary ware. These producers use
red and white pastes; nevertheless, the usage of white
paste is more frequent and much higher in volume.
(Pacheco et al., 2010).
Porcelain tile is a highly vitrified material produced from a
body formulated by mixtures of kaolin, quartz and
feldspar. The kaolin [Al2Si2O5 (OH)4], gives plasticity to
the mixture; flint or quartz (SiO2), maintains the shape of
the formed article during sintering; and feldspar [(K,
Na)2O. Al2O3. 6H2O], serves as flux. These three
constituents place porcelain in the phase system [(K,
Na)2O-Al2O3- SiO2)] in terms of oxide constituents, hence
the term triaxial porcelain tiles (Buchanan, 1991 and
Olupot, 2006). The main phase composition of a porcelain
body is constituted by a heterogeneous glassy matrix and
needle shaped mullite crystals together with some quartz
grains and closed irregular shaped pores. Because of the
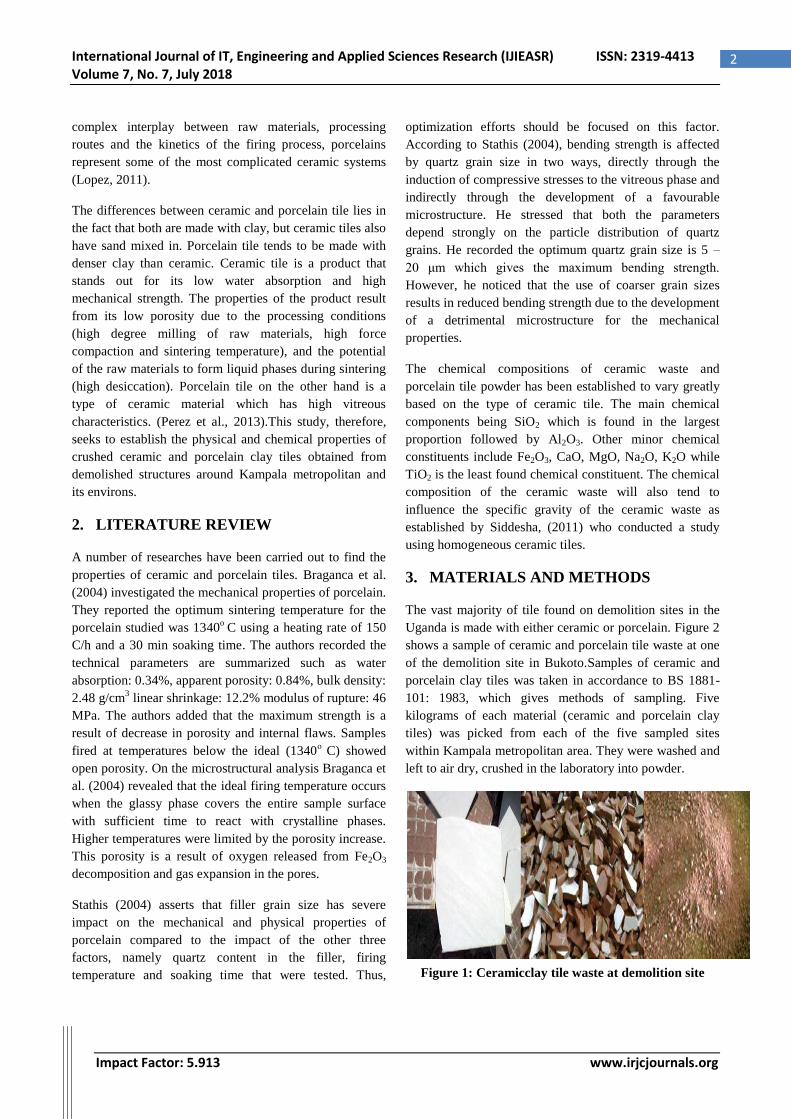
International Journal of IT, Engineering and Applied Sciences Research (IJIEASR) ISSN: 2319-4413 Volume 7, No. 7, July 2018
Impact Factor: 5.913 www.irjcjournals.org
2
complex interplay between raw materials, processing
routes and the kinetics of the firing process, porcelains
represent some of the most complicated ceramic systems
(Lopez, 2011).
The differences between ceramic and porcelain tile lies in
the fact that both are made with clay, but ceramic tiles also
have sand mixed in. Porcelain tile tends to be made with
denser clay than ceramic. Ceramic tile is a product that
stands out for its low water absorption and high
mechanical strength. The properties of the product result
from its low porosity due to the processing conditions
(high degree milling of raw materials, high force
compaction and sintering temperature), and the potential
of the raw materials to form liquid phases during sintering
(high desiccation). Porcelain tile on the other hand is a
type of ceramic material which has high vitreous
characteristics. (Perez et al., 2013).This study, therefore,
seeks to establish the physical and chemical properties of
crushed ceramic and porcelain clay tiles obtained from
demolished structures around Kampala metropolitan and
its environs.
2. LITERATURE REVIEW
A number of researches have been carried out to find the
properties of ceramic and porcelain tiles. Braganca et al.
(2004) investigated the mechanical properties of porcelain.
They reported the optimum sintering temperature for the
porcelain studied was 1340o
C using a heating rate of 150
C/h and a 30 min soaking time. The authors recorded the
technical parameters are summarized such as water
absorption: 0.34%, apparent porosity: 0.84%, bulk density:
2.48 g/cm3 linear shrinkage: 12.2% modulus of rupture: 46
MPa. The authors added that the maximum strength is a
result of decrease in porosity and internal flaws. Samples
fired at temperatures below the ideal (1340ο
C) showed
open porosity. On the microstructural analysis Braganca et
al. (2004) revealed that the ideal firing temperature occurs
when the glassy phase covers the entire sample surface
with sufficient time to react with crystalline phases.
Higher temperatures were limited by the porosity increase.
This porosity is a result of oxygen released from Fe2O3
decomposition and gas expansion in the pores.
Stathis (2004) asserts that filler grain size has severe
impact on the mechanical and physical properties of
porcelain compared to the impact of the other three
factors, namely quartz content in the filler, firing
temperature and soaking time that were tested. Thus,
optimization efforts should be focused on this factor.
According to Stathis (2004), bending strength is affected
by quartz grain size in two ways, directly through the
induction of compressive stresses to the vitreous phase and
indirectly through the development of a favourable
microstructure. He stressed that both the parameters
depend strongly on the particle distribution of quartz
grains. He recorded the optimum quartz grain size is 5 –
20 μm which gives the maximum bending strength.
However, he noticed that the use of coarser grain sizes
results in reduced bending strength due to the development
of a detrimental microstructure for the mechanical
properties.
The chemical compositions of ceramic waste and
porcelain tile powder has been established to vary greatly
based on the type of ceramic tile. The main chemical
components being SiO2 which is found in the largest
proportion followed by Al2O3. Other minor chemical
constituents include Fe2O3, CaO, MgO, Na2O, K2O while
TiO2 is the least found chemical constituent. The chemical
composition of the ceramic waste will also tend to
influence the specific gravity of the ceramic waste as
established by Siddesha, (2011) who conducted a study
using homogeneous ceramic tiles.
3. MATERIALS AND METHODS
The vast majority of tile found on demolition sites in the
Uganda is made with either ceramic or porcelain. Figure 2
shows a sample of ceramic and porcelain tile waste at one
of the demolition site in Bukoto.Samples of ceramic and
porcelain clay tiles was taken in accordance to BS 1881-
101: 1983, which gives methods of sampling. Five
kilograms of each material (ceramic and porcelain clay
tiles) was picked from each of the five sampled sites
within Kampala metropolitan area. They were washed and
left to air dry, crushed in the laboratory into powder.
Figure 1: Ceramicclay tile waste at demolition site
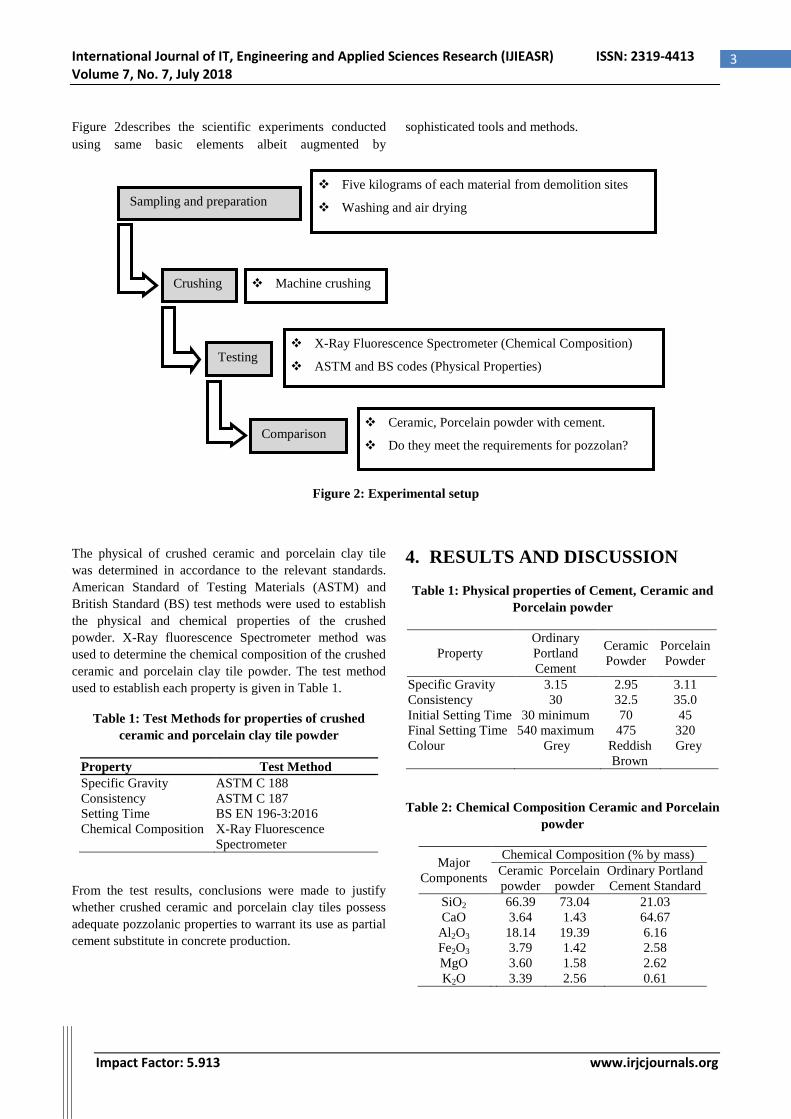
International Journal of IT, Engineering and Applied Sciences Research (IJIEASR) ISSN: 2319-4413 Volume 7, No. 7, July 2018
Impact Factor: 5.913 www.irjcjournals.org
3
Figure 2describes the scientific experiments conducted
using same basic elements albeit augmented by
sophisticated tools and methods.
Figure 2: Experimental setup
The physical of crushed ceramic and porcelain clay tile
was determined in accordance to the relevant standards.
American Standard of Testing Materials (ASTM) and
British Standard (BS) test methods were used to establish
the physical and chemical properties of the crushed
powder. X-Ray fluorescence Spectrometer method was
used to determine the chemical composition of the crushed
ceramic and porcelain clay tile powder. The test method
used to establish each property is given in Table 1.
Table 1: Test Methods for properties of crushed
ceramic and porcelain clay tile powder
Property Test Method
Specific Gravity ASTM C 188
Consistency ASTM C 187
Setting Time
Chemical Composition
BS EN 196-3:2016
X-Ray Fluorescence
Spectrometer
From the test results, conclusions were made to justify
whether crushed ceramic and porcelain clay tiles possess
adequate pozzolanic properties to warrant its use as partial
cement substitute in concrete production.
4. RESULTS AND DISCUSSION
Table 1: Physical properties of Cement, Ceramic and
Porcelain powder
Property
Ordinary
Portland
Cement
Ceramic
Powder
Porcelain
Powder
Specific Gravity 3.15 2.95 3.11
Consistency 30 32.5 35.0
Initial Setting Time 30 minimum 70 45
Final Setting Time 540 maximum 475 320
Colour Grey Reddish
Brown
Grey
Table 2: Chemical Composition Ceramic and Porcelain
powder
Major
Components
Chemical Composition (% by mass)
Ceramic
powder
Porcelain
powder
Ordinary Portland
Cement Standard
SiO2 66.39 73.04 21.03
CaO 3.64 1.43 64.67
Al2O3 18.14 19.39 6.16
Fe2O3 3.79 1.42 2.58
MgO 3.60 1.58 2.62
K2O 3.39 2.56 0.61
Sampling and preparation
Five kilograms of each material from demolition sites
Washing and air drying
Crushing
Machine crushing
Testing
X-Ray Fluorescence Spectrometer (Chemical Composition)
ASTM and BS codes (Physical Properties)
Comparison
Ceramic, Porcelain powder with cement.
Do they meet the requirements for pozzolan?
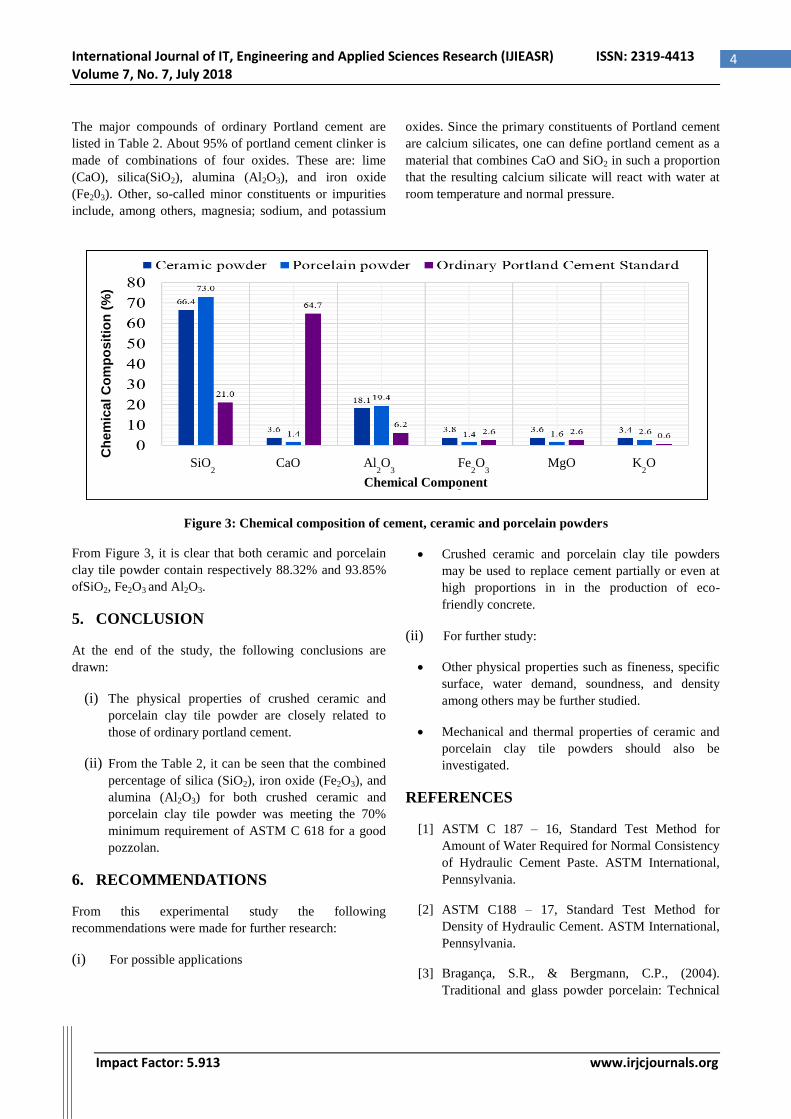
International Journal of IT, Engineering and Applied Sciences Research (IJIEASR) ISSN: 2319-4413 Volume 7, No. 7, July 2018
Impact Factor: 5.913 www.irjcjournals.org
4
The major compounds of ordinary Portland cement are
listed in Table 2. About 95% of portland cement clinker is
made of combinations of four oxides. These are: lime
(CaO), silica(SiO2), alumina (Al2O3), and iron oxide
(Fe203). Other, so-called minor constituents or impurities
include, among others, magnesia; sodium, and potassium
oxides. Since the primary constituents of Portland cement
are calcium silicates, one can define portland cement as a
material that combines CaO and SiO2 in such a proportion
that the resulting calcium silicate will react with water at
room temperature and normal pressure.
Figure 3: Chemical composition of cement, ceramic and porcelain powders
From Figure 3, it is clear that both ceramic and porcelain
clay tile powder contain respectively 88.32% and 93.85%
ofSiO2, Fe2O3 and Al2O3.
5. CONCLUSION
At the end of the study, the following conclusions are
drawn:
(i) The physical properties of crushed ceramic and
porcelain clay tile powder are closely related to
those of ordinary portland cement.
(ii) From the Table 2, it can be seen that the combined
percentage of silica (SiO2), iron oxide (Fe2O3), and
alumina (Al2O3) for both crushed ceramic and
porcelain clay tile powder was meeting the 70%
minimum requirement of ASTM C 618 for a good
pozzolan.
6. RECOMMENDATIONS
From this experimental study the following
recommendations were made for further research:
(i) For possible applications
Crushed ceramic and porcelain clay tile powders
may be used to replace cement partially or even at
high proportions in in the production of eco-
friendly concrete.
(ii) For further study:
Other physical properties such as fineness, specific
surface, water demand, soundness, and density
among others may be further studied.
Mechanical and thermal properties of ceramic and
porcelain clay tile powders should also be
investigated.
REFERENCES
[1] ASTM C 187 – 16, Standard Test Method for
Amount of Water Required for Normal Consistency
of Hydraulic Cement Paste. ASTM International,
Pennsylvania.
[2] ASTM C188 – 17, Standard Test Method for
Density of Hydraulic Cement. ASTM International,
Pennsylvania.
[3] Bragança, S.R., & Bergmann, C.P., (2004).
Traditional and glass powder porcelain: Technical
Ch
em
ica
l C
om
po
sit
ion
(%
)
SiO2
CaO Al2O
3 Fe
2O
3 MgO K
2O
Chemical Component
International Journal of IT, Engineering and Applied Sciences Research (IJIEASR) ISSN: 2319-4413 Volume 7, No. 7, July 2018
Impact Factor: 5.913 www.irjcjournals.org
5
and Microstructure analysis. Journal of the
European Ceramic Society.
[4] BS 1881-101:1983, Method of sampling fresh
concrete on site, British Standard Institution,
London, UK.
[5] BS EN 197-3, (2016), Method of testing cement:
Determination of setting time and soundness.
British Standard Institution, London, UK.
[6] Buchanan, J. A., & Olupot, P. W., (2006).
Characterization of Ceramic Raw Minerals in
Uganda for Production of Electrical Porcelain
Insulators. Proceedings from the International
Conference on Advances in Engineering and
Technology
[7] Lopez-Gayarre, F., Lopez-Colina, C., Serrano-
Lopez, M.A., Garcia Taengua, E., Lopez-Martinez,
A., (2011). Assessment of properties of recycled
concrete by means of a highly fractioned factorial
design of experiment. Construction and Building
Materials 25 (10): 3802–3809.
[8] Pacheco, F.,&Jalali, S., (2010). Reusing ceramic
wastes in concrete. Construction and Building
Materials, Volume 48, 2013, pp. 295-305.
[9] Pérez, J. M., Rincón, J. M., & Romero, M., (2012).
Effect of moulding pressure on microstructure and
technological properties of porcelain stoneware.
Ceramics International, 38(1), 317-325.
[10] Siddesha, H., (2011). Experimental Studies on the
Effect of Ceramic fine aggregate on the Strength
properties of Concrete. International Journal of
Advances in Engineering, Science and Technology
(IJAEST).
[11] Sivaprakash, G., Saravana, K., & Lakhi, J. S.,
(2016). Experimental study on partial replacement
of sand by ceramic waste in concrete. Int. J. Chem.
Sci.: 14(S1).
[12] Stathis, G., Ekonomakou, A., Stournaras, C. J.,
(2004), Effect of firing conditions, filler grain size
and quartz content on bending strength and physical
properties of sanitaryware porcelain. Journal of the
European Ceramic.


![13. Crushed [Esmagadas]](https://img.pdfslide.net/doc/110x75/55cf9aa5550346d033a2bb57/13-crushed-esmagadas.jpg)