Embed Size (px)
Citation preview

The Astrophysical Journal, 799:156 (23pp), 2015 February 1 doi:10.1088/0004-637X/799/2/156C! 2015. The American Astronomical Society. All rights reserved.
SULFUR ISOTOPIC COMPOSITIONS OF SUBMICROMETER SiCGRAINS FROM THE MURCHISON METEORITE
Yuchen Xu1,2,7, Ernst Zinner2, Roberto Gallino3, Alexander Heger4,8, Marco Pignatari5,8, and Yangting Lin61 Institute of Geochemistry, Chinese Academy of Sciences, Guiyang 550002, China; [email protected]
2 Laboratory for Space Sciences and Physics Department, Washington University, St. Louis, MO 63130, USA3 Dipartimento di Fisica, Universita di Torino, I-10125 Torino, Italy
4 Monash Centre for Astrophysics, School of Mathematical Sciences, Monash University, Vic 3800, Australia5 Department of Physics, University of Basel, CH-4056 Basel, Switzerland
6 Key Laboratory of Earth’s Deep Interior, Institute of Geology and Geophysics, Chinese Academy of Sciences, Beijing 100029, ChinaReceived 2014 February 13; accepted 2014 November 19; published 2015 January 27
ABSTRACT
We report C, Si, N, S, Mg–Al, and Ca–Ti isotopic compositions of presolar silicon carbide (SiC) grains fromthe SiC-rich KJE size fraction (0.5–0.8 µm) of the Murchison meteorite. One thousand one hundred thirteen SiCgrains were identified based on their C and Si isotopic ratios. Mainstream, AB, C, X, Y, and Z subtypes of SiC,and X-type silicon nitride (Si3N4) account for 81.4%, 5.7%, 0.1%, 1.5%, 5.8%, 4.9%, and 0.4%, respectively.Twenty-five grains with unusual Si isotopic ratios, including one C grain, 16 X grains, 1 Y grain, 5 Z grains, and2 X-type Si3N4 grains were selected for N, S, Mg–Al, and Ca–Ti isotopic analysis. The C grain is highly enrichedin 29Si and 30Si (!29Si = 1345‰ ± 19‰, !30Si = 1272‰ ± 19‰). It has a huge 32S excess, larger than any seenbefore, and larger than that predicted for the Si/S supernova (SN) zone, providing evidence against the elementalfractionation model by Hoppe et al. Two SN models investigated here present a more satisfying explanation interms of a radiogenic origin of 32S from the decay of short-lived 32Si (" 1/2 = 153 yr). Silicon-32 as well as 29Siand 30Si can be produced in SNe by short neutron bursts; evidence for initial 44Ti (" 1/2 = 60 yr) in the C grain isadditional evidence for an SN origin. The X grains have marginal 32S excesses, much smaller than expected fromtheir large 28Si excesses. Similarly, the Y and Z grains do not show the S-isotopic anomalies expected from theirlarge Si isotopic anomalies. Low intrinsic S contents and contamination with isotopically normal S are the mostlikely explanations.
Key words: astrochemistry – circumstellar matter – nuclear reactions, nucleosynthesis, abundances –supernovae: general – stars: AGB and post-AGB
1. INTRODUCTION
Stardust grains, also called presolar grains, formed in stellaroutflows from late-type stars or in ejecta from stellar explo-sions before the formation of the solar system some 4.6 Gyrago, and survived their interstellar journey into the solar system(Lodders & Amari 2005; Zinner 2014). They have been identi-fied in meteorites (e.g., Amari et al. 1994; Huss & Lewis 1995),interplanetary dust particles (Messenger et al. 2003), Antarc-tic micrometeorites (Yada et al. 2008), and cometary matter(Stadermann et al. 2008) based on their anomalous isotopiccompositions (Clayton & Nittler 2004; Zinner 2014). The lab-oratory study of presolar grains can provide new informationon stellar nucleosynthesis (setting constraints on theoreticalmodels), galactic chemical evolution, mixing of ejecta duringand after supernova (SN) explosions, and grain formation incircumstellar environments.
Presolar grains of SiC, the best-studied presolar mineralphase, are divided into distinct groups, based on their C-, N-,and Si-isotopic compositions: mainstream, AB, X, Y, Z, possibleNova grains, and C and U grains (Nittler 2003; Clayton &Nittler 2004; Davis 2011; Zinner 2014). Asymptotic giantbranch (AGB) stars and core–collapse SNe are the main twosources of stardust. Most presolar SiC grains formed in thewinds of 1–3 M" AGB stars (Lugaro et al. 2003), mainstream
7 Institute of Geology and Geophysics, Chinese Academy of Sciences, No.19, Bei Tucheng Xilu, Chaoyang District, Beijing 100029, China.8 NuGrid Collaboration, http://www.nugridstars.org
grains from stars of close-to-solar metallicity, while Y and Zgrains from stars of lower-than-solar metallicity (Amari et al.2001; Zinner et al. 2006, 2007). X grains, C grains, and X-typeSi3N4 are believed to come from core–collapse SNe (SNe II)based on their Si isotopic anomalies and high inferred initial26Al/27Al and 44Ti/48Ti ratios (Hoppe et al. 2012; Lin et al.2010; Pignatari et al. 2013b, 2013c). Type X SiC grains andX-type Si3N4 grains have large 28Si excesses, whereas C grainshave large 29Si and 30Si excesses. All SN SiC grains areextremely rare: X grains account for 1% of all presolar SiCgrains, C grains and Si3N4 grains for only #0.1%. Most of themwere found during automatic searches for rare grains with theion microprobe.
Besides the major elements C and Si, many other elementshave been analyzed for their isotopic ratios in SiC grains (Hynes& Gyngard 2009). Sulfur isotopic measurements have beenmade only recently. These measurements revealed large 32Sexcesses in C grains (Gyngard et al. 2010a; Hoppe et al. 2012)and smaller 32S excesses in X grains (Hoppe et al. 2012) and Ugrains (Hoppe et al. 2012; Orthous-Daunay et al. 2012). Type Ugrains, like C grains, have large 29Si and 30Si excesses, but, incontrast, have low 12C/13C ratios of less than 10.
Here we report the results of C, Si N, S, Mg–Al, and Ca–Tiisotopic measurements of selected presolar SiC grains fromthe SiC-rich KJE size fraction (0.5–0.8 µm) of the Murchisonmeteorite (Amari et al. 1994), with emphasis on the S isotopicratios of the grains. Grains of type C, X, Y, and Z were identifiedfrom an automatic grain search. In Section 2 we describe theexperimental measurements, in Section 3 we report the results
1

The Astrophysical Journal, 799:156 (23pp), 2015 February 1 Xu et al.
and discuss their implications in terms of stellar models. This isfollowed by conclusions in Section 4. Preliminary results havebeen reported by Xu et al. (2012).
2. EXPERIMENTAL PROCEDURES
The details of the chemical and physical separation of presolarSiC grains from the Murchison carbonaceous meteorite havebeen described by Amari et al. (1994). KJE is the SiC-richsize fraction with nominal diameters between 0.5 and 0.8 µm.In this work, a search for rare SiC grains was undertakenby automatic isotopic imaging in the auto-grain mode withthe Cameca NanoSIMS 50 ion microprobe at WashingtonUniversity (Gyngard et al. 2010b). Thousands of KJE SiC grainswere deposited from liquid suspension onto a clean gold foil.Prior to ion imaging, the analyzed areas were bombarded with ahigh-current Cs + ion beam for cleaning and implantation of Cs.Approximately 25 nm were removed in this step. Simultaneousion images of 12C$, 13C$, 28Si$, 29Si$, and 30Si$ were acquiredby rastering a focused Cs + ion beam (#1 pA, 100 nm) over areas40 % 40 µm2 in size. SiC grains were identified by an automaticgrain-recognition algorithm. These grains were analyzed indetail by deflecting the primary Cs + beam onto individual grainsand rastering the beam over square areas 1.5–2 times the graindiameter on a side. Subsequently, the sample stage was movedto an adjacent analysis area and the process was repeated.
Out of a total number of 1113 SiC grains we identified 906mainstream grains, 63 AB grains, 1 C grain, 17 X grains, 64Y grains, 55 Z grains, 2 nova grain candidates, and 5 X-typeSi3N4 grains. Out of these we measured N and S isotopic ratiosin 1 C grain, 16 X grains, and 2 Si3N4 grains. We also selectedone Y grain and five Z grains with the largest 30Si excessesfor such isotopic analyses. These measurements were made byobtaining negative ion images of 12C14N$, 12C15N$, 32S$, 33S$,and 34S$ in multi-collection mode by rastering the Cs + beamover 2 % 2 to 3 % 3 µm2 areas covering the grains. From theimages we obtained 14N/15N ratios and !33S/32S and !34S/32Svalues (!-values are deviations from normal isotopic ratios inparts per thousand). The advantage of the imaging mode is thatit allows us to exclude contributions from other attached ornearby SiC grains to the N and S signals from the measuredgrains. A synthetic SiC–Si3N4 mix was used for N as standard.For S we used FeS and the S signal from the SiC–Si3N4 mixthat contained enough S. Since S in FeS is a main element, but atrace element in the SiC–Si3N4 mix, this allowed us to study theQSA (Quasi-Simultaneous Arrival) effect for S (Slodzian et al.2004; see also Gyngard et al. 2009). The analyses of Al–Mg andTi–Ca were made with positive secondary ions produced withan O$ primary beam. 24Mg, 25Mg, 26Mg, 27Al, and 28Si weremeasured in multi-collection mode by rastering the primaryO$ beam of #10 pA over small areas around one C grain, 1Si3N4 grain, and 13 X grains. Subsequently, these grains weremeasured for 28Si, 40Ca, 42Ca, 44Ca, and 48Ti, also in multi-collection mode. Terrestrial spinel was used as a standard forMg and Al, and perovskite (CaTiO3) for the isotopes of Ca andTi. The sensitivity factors obtained were Al + /Mg + = 1.78 %Al/Mg and Ca + /Ti + = 2.83 % Ca/Ti.
3. RESULTS AND DISCUSSION: GRAIN DATAAND SN MIXING MODELS
The isotopic compositions of the 25 grains selected fordetailed isotopic analysis are given in Table 1. The C, N, inferred26Al/27Al and 44Ti/48Ti ratios for C grains, X grains, U grains,
and X-type Si3N4 grains, including data from previous studies,are given in Figures 1 and 2. Figures 3(a)–(c) present plots of theSi and S isotopic ratios of the grains of this study as well as ofC, U, X, Y, and Z grains of previous studies in which S isotopicratios had been measured (Gyngard et al. 2010a, 2012; Hoppeet al. 2012; Orthous-Daunay et al. 2012). The !30Si/28Si valuesand inferred 32Si/28Si ratios for C and U grains are given inFigure 4. All grains believed to have an SN origin (C, X, Si3N4)as well as U grains show low 14N/15N ratios (15N excesses) buta large range of 12C/13C ratios (Figure 1). All grains measuredfor Al–Mg show large 26Mg excesses due to the decay of short-lived (" 1/2 = 7.2%105 yr) 26Al (Table 1). The table gives the26Al/27Al ratios inferred from 26Mg excesses. The C grain andfour X grains have large 44Ca excesses resulting from the decayof short-lived (" 1/2 = 60 yr) 44Ti. Because 44Ti is produced onlyin SNe (Timmes et al. 1996; Magkotsios et al. 2010), its initialpresence is evidence for an SN origin of these grains. The tablegives inferred 44Ti/48Ti ratios. Figures 2(a) and (b) show theinferred 26Al/27Al and inferred 44Ti/48Ti ratios of the C grainsand X grains of this and previous studies plotted against their12C/13C ratios.
Before we discuss the S isotopic ratios of the grains of thisstudy in more detail, we want to emphasize two fundamentalproblems with S isotopic measurements in presolar SiC grains:first, S does not readily condense into SiC and intrinsic Sconcentrations are very low and, second, contamination withisotopically normal S is ubiquitous. One reason for the latteris that the SiC-rich residue has been treated with sulfuric acidto dissolve spinel grains (Amari et al. 1994), another reason isthe mobile nature of S and its compounds. The contaminationproblem is demonstrated in Figures 5 and 14–17, which shownegative ion isotopic images of S and CN and secondary electronimages of the C Grain a1–5–7 and four X grains. As can be seenin Figure 5, most of the S, especially 33S and 34S, is located atthe periphery of the grain. If we use the whole image, we obtain!33S/32S = $714‰ ± 24‰, and !34S/32S = $703‰ ± 14‰,whereas from the selected area outlined in the images we obtain!33S/32S = $944‰ ± 33‰, and !34S/32S = $941‰ ± 14‰.It is clear that the selected area is almost completely devoid of33S and 34S, while the intrinsic S is dominated by 32S. Belowwe will discuss the S contamination problem in more detail.
3.1. Type C Grains and Their Stellar Sources
The C grain of this study, a1–5–7, has extreme excesses in 29Siand 30Si (!29Si/28Si = 1345‰ ± 19‰, !30Si/28Si = 1272‰ ±19‰; Table 1; Figure 3(a)). Whereas models predict large 30Siexcesses for AGB stars of low metallicity, these excesses areexpected to be accompanied by 29Si deficits (Zinner et al. 2006);such isotopic patterns are found in SiC grains of type Z (Table 1).In contrast, large excesses in both 29Si and 30Si are predictedfor certain zones in core–collapse SNe, e.g., in part of theHe/C zone (e.g., Woosley & Weaver 1995; Rauscher et al. 2002;Woosley & Heger 2007). Grain a1–5–7 carries this isotopicsignature together with C and N isotopic ratios of 12C/13C =192 and 14N/15N = 58 (Figure 1), similar to those observedin SiC X grains, believed to have an SN origin (e.g., Lin et al.2010). The inferred 26Al/27Al ratio of this grain is 1.7 % 10$3,not high enough to provide definitive proof of an SN origin.Such proof, however, is provided by evidence for the initialpresence of 44Ti with 44Ti/48Ti = 4.2 % 10$2.
Grain a1–5–7 has the largest 33,34S depletions (or 32S excess)observed in any C grain (Figure 3(b)). The Si and S iso-topic ratios in C grains have posed a puzzle, because in SNe
2
The Astrophysical Journal, 799:156 (23pp), 2015 February 1 Xu et al.
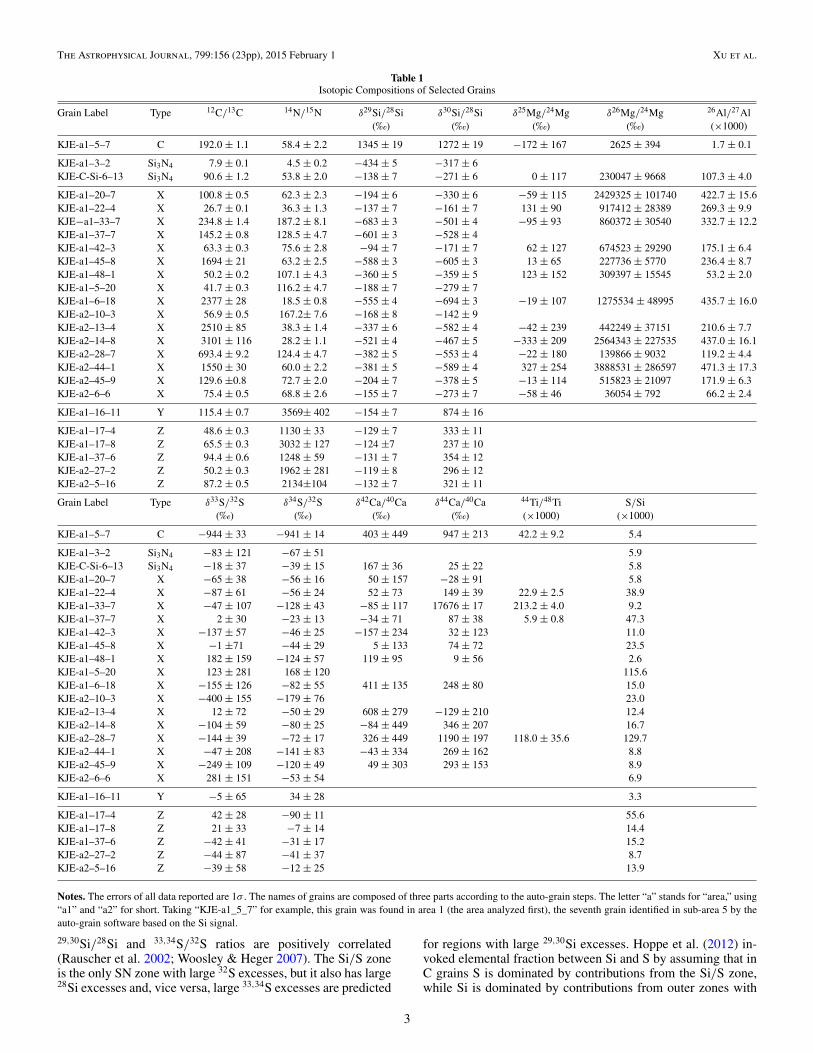
Table 1Isotopic Compositions of Selected Grains
Grain Label Type 12C/13C 14N/15N !29Si/28Si !30Si/28Si !25Mg/24Mg !26Mg/24Mg 26Al/27Al(‰) (‰) (‰) (‰) (%1000)
KJE-a1–5–7 C 192.0 ± 1.1 58.4 ± 2.2 1345 ± 19 1272 ± 19 $172 ± 167 2625 ± 394 1.7 ± 0.1
KJE-a1–3–2 Si3N4 7.9 ± 0.1 4.5 ± 0.2 $434 ± 5 $317 ± 6KJE-C-Si-6–13 Si3N4 90.6 ± 1.2 53.8 ± 2.0 $138 ± 7 $271 ± 6 0 ± 117 230047 ± 9668 107.3 ± 4.0
KJE-a1–20–7 X 100.8 ± 0.5 62.3 ± 2.3 $194 ± 6 $330 ± 6 $59 ± 115 2429325 ± 101740 422.7 ± 15.6KJE-a1–22–4 X 26.7 ± 0.1 36.3 ± 1.3 $137 ± 7 $161 ± 7 131 ± 90 917412 ± 28389 269.3 ± 9.9KJE$a1–33–7 X 234.8 ± 1.4 187.2 ± 8.1 $683 ± 3 $501 ± 4 $95 ± 93 860372 ± 30540 332.7 ± 12.2KJE-a1–37–7 X 145.2 ± 0.8 128.5 ± 4.7 $601 ± 3 $528 ± 4KJE-a1–42–3 X 63.3 ± 0.3 75.6 ± 2.8 $94 ± 7 $171 ± 7 62 ± 127 674523 ± 29290 175.1 ± 6.4KJE-a1–45–8 X 1694 ± 21 63.2 ± 2.5 $588 ± 3 $605 ± 3 13 ± 65 227736 ± 5770 236.4 ± 8.7KJE-a1–48–1 X 50.2 ± 0.2 107.1 ± 4.3 $360 ± 5 $359 ± 5 123 ± 152 309397 ± 15545 53.2 ± 2.0KJE-a1–5–20 X 41.7 ± 0.3 116.2 ± 4.7 $188 ± 7 $279 ± 7KJE-a1–6–18 X 2377 ± 28 18.5 ± 0.8 $555 ± 4 $694 ± 3 $19 ± 107 1275534 ± 48995 435.7 ± 16.0KJE-a2–10–3 X 56.9 ± 0.5 167.2± 7.6 $168 ± 8 $142 ± 9KJE-a2–13–4 X 2510 ± 85 38.3 ± 1.4 $337 ± 6 $582 ± 4 $42 ± 239 442249 ± 37151 210.6 ± 7.7KJE-a2–14–8 X 3101 ± 116 28.2 ± 1.1 $521 ± 4 $467 ± 5 $333 ± 209 2564343 ± 227535 437.0 ± 16.1KJE-a2–28–7 X 693.4 ± 9.2 124.4 ± 4.7 $382 ± 5 $553 ± 4 $22 ± 180 139866 ± 9032 119.2 ± 4.4KJE-a2–44–1 X 1550 ± 30 60.0 ± 2.2 $381 ± 5 $589 ± 4 327 ± 254 3888531 ± 286597 471.3 ± 17.3KJE-a2–45–9 X 129.6 ±0.8 72.7 ± 2.0 $204 ± 7 $378 ± 5 $13 ± 114 515823 ± 21097 171.9 ± 6.3KJE-a2–6–6 X 75.4 ± 0.5 68.8 ± 2.6 $155 ± 7 $273 ± 7 $58 ± 46 36054 ± 792 66.2 ± 2.4
KJE-a1–16–11 Y 115.4 ± 0.7 3569± 402 $154 ± 7 874 ± 16
KJE-a1–17–4 Z 48.6 ± 0.3 1130 ± 33 $129 ± 7 333 ± 11KJE-a1–17–8 Z 65.5 ± 0.3 3032 ± 127 $124 ±7 237 ± 10KJE-a1–37–6 Z 94.4 ± 0.6 1248 ± 59 $131 ± 7 354 ± 12KJE-a2–27–2 Z 50.2 ± 0.3 1962 ± 281 $119 ± 8 296 ± 12KJE-a2–5–16 Z 87.2 ± 0.5 2134±104 $132 ± 7 321 ± 11
Grain Label Type !33S/32S !34S/32S !42Ca/40Ca !44Ca/40Ca 44Ti/48Ti S/Si(‰) (‰) (‰) (‰) (%1000) (%1000)
KJE-a1–5–7 C $944 ± 33 $941 ± 14 403 ± 449 947 ± 213 42.2 ± 9.2 5.4
KJE-a1–3–2 Si3N4 $83 ± 121 $67 ± 51 5.9KJE-C-Si-6–13 Si3N4 $18 ± 37 $39 ± 15 167 ± 36 25 ± 22 5.8KJE-a1–20–7 X $65 ± 38 $56 ± 16 50 ± 157 $28 ± 91 5.8KJE-a1–22–4 X $87 ± 61 $56 ± 24 52 ± 73 149 ± 39 22.9 ± 2.5 38.9KJE-a1–33–7 X $47 ± 107 $128 ± 43 $85 ± 117 17676 ± 17 213.2 ± 4.0 9.2KJE-a1–37–7 X 2 ± 30 $23 ± 13 $34 ± 71 87 ± 38 5.9 ± 0.8 47.3KJE-a1–42–3 X $137 ± 57 $46 ± 25 $157 ± 234 32 ± 123 11.0KJE-a1–45–8 X $1 ±71 $44 ± 29 5 ± 133 74 ± 72 23.5KJE-a1–48–1 X 182 ± 159 $124 ± 57 119 ± 95 9 ± 56 2.6KJE-a1–5–20 X 123 ± 281 168 ± 120 115.6KJE-a1–6–18 X $155 ± 126 $82 ± 55 411 ± 135 248 ± 80 15.0KJE-a2–10–3 X $400 ± 155 $179 ± 76 23.0KJE-a2–13–4 X 12 ± 72 $50 ± 29 608 ± 279 $129 ± 210 12.4KJE-a2–14–8 X $104 ± 59 $80 ± 25 $84 ± 449 346 ± 207 16.7KJE-a2–28–7 X $144 ± 39 $72 ± 17 326 ± 449 1190 ± 197 118.0 ± 35.6 129.7KJE-a2–44–1 X $47 ± 208 $141 ± 83 $43 ± 334 269 ± 162 8.8KJE-a2–45–9 X $249 ± 109 $120 ± 49 49 ± 303 293 ± 153 8.9KJE-a2–6–6 X 281 ± 151 $53 ± 54 6.9
KJE-a1–16–11 Y $5 ± 65 34 ± 28 3.3
KJE-a1–17–4 Z 42 ± 28 $90 ± 11 55.6KJE-a1–17–8 Z 21 ± 33 $7 ± 14 14.4KJE-a1–37–6 Z $42 ± 41 $31 ± 17 15.2KJE-a2–27–2 Z $44 ± 87 $41 ± 37 8.7KJE-a2–5–16 Z $39 ± 58 $12 ± 25 13.9
Notes. The errors of all data reported are 1# . The names of grains are composed of three parts according to the auto-grain steps. The letter “a” stands for “area,” using“a1” and “a2” for short. Taking “KJE-a1_5_7” for example, this grain was found in area 1 (the area analyzed first), the seventh grain identified in sub-area 5 by theauto-grain software based on the Si signal.
29,30Si/28Si and 33,34S/32S ratios are positively correlated(Rauscher et al. 2002; Woosley & Heger 2007). The Si/S zoneis the only SN zone with large 32S excesses, but it also has large28Si excesses and, vice versa, large 33,34S excesses are predicted
for regions with large 29,30Si excesses. Hoppe et al. (2012) in-voked elemental fraction between Si and S by assuming that inC grains S is dominated by contributions from the Si/S zone,while Si is dominated by contributions from outer zones with
3

The Astrophysical Journal, 799:156 (23pp), 2015 February 1 Xu et al.
Figure 1. Nitrogen isotopic ratios of different types of rare presolar SiC grains and Si3N4 grains are plotted against their C isotopic ratios. In this and subsequentfigures grains of this study are plotted as solid symbols, grains previously analyzed by other investigators (http://presolar.wustl.edu/#pgd) are plotted as open symbols.Type C grains with crosses are grains whose S isotopic ratios have been measured. Also plotted are different mixing lines resulting from mixing either whole zones orindividual layers from the 12 M" SN model by Woosley & Heger (2007) and the 15r and 15r4 models by Pignatari et al. (2013c). Solid lines are for mixtures betweenthe He/C (C/O + He/C for the 12 M" SN model) zone and the He/N zone or between layers therein, broken lines for mixtures between the He/C (C/O + He/C) zoneand the H envelope. The letters c and d refer to the layers shown in Figure 7. Two selected X grains of this study are labeled.
isotopically heavy Si. This explanation is completely ad hocand the fractionation process is not understood at all. Moreimportantly, grain a1–5–7 provides proof against this interpre-tation. The reason is that the S isotopic composition of thisgrain is more 32S-rich than the average of the Si/S zone, e.g.,in the 15 M" SN model by Rauscher et al. (2002) and otherSN models (see Figure 3(b)). Figure 6 shows this in more de-tail for several SN models. Plotted are the predicted S isotopicratios for the Si/S zones of the 12 M" core–collapse SN modelby Woosley & Heger (2007) and the 15, 20, and 25 M" SNmodels by Rauscher et al. (2002), as well as the average ratiosof the whole Si/S zones. As can be seen, the predicted ratiosdo not reach those of grain a1–5–7. A much more satisfyingexplanation, proposed by Pignatari et al. (2013c), is that the32S excess in C grains is of radiogenic origin from the decayof short-lived 32Si (" 1/2 = 153 yr). In this model, both, thelarge 29,30Si excesses and large 32S excess are produced by thesame process.
Silicon-32 is produced by neutron capture. Because 31Sihas a short half life (" 1/2 = 2.6 hr), the production of 32Sirequires high neutron densities. Such high neutron densitiescan be found inside of SNe in the outer layers of the O/Czone or at the bottom of the He/C zone, produced by the22Ne($, n)25Mg reaction that is activated by the passage of theSN shock. This is the so-called n-process (Blake & Schramm1976), causing a short neutron burst, which has been proposedby Meyer et al. (2000) to be responsible for the Mo isotopicpattern found in X grains (Pellin et al. 1999). An alternativemodel to explain the Mo isotopic pattern in X grains has beenproposed by Farouqi et al. (2009). In this model the Mo isotopesare produced by charged particles (mostly $ particles) in thehigh-entropy wind of Type II SNe. However, it still needs to be
seen whether a mixing model including the component of theneutrino-wind ejecta can produce large 29Si, 30Si excesses, andlarge amounts of 32Si. Since the two core–collapse SN modelsadopted for comparison with the presolar grain data do notinclude the neutrino-wind ejecta, we concentrate on the neutronburst models in the C-rich He shell. In the 15 M" SN model byRauscher et al. (2002) and in models with higher mass, such aneutron burst and the resulting Mo isotopic pattern is found inthe outer layers of the O/C zone. These layers have also a highabundance of 32Si (as well as large 29Si and 30Si excesses). Thisregion, however, is O-rich, and therefore not conducive for thecondensation of SiC. More promising is the 12 M" SN modelby Woosley & Heger (2007),9 where a 32Si-rich layer with large29Si and 30Si excesses is located in a C-rich region, right atthe boundary between the C/O and He/C zones (Figure 8(a)).A 32Si-rich zone is also found in the 15 M" core–collapse SNmodel by Pignatari et al. (2013c). In this model, at high shockvelocities the ensuing high temperatures result in efficient $-capture at the bottom of the He/C zone, forming the C/Sizone. High neutron densities, ranging up to 1022 cm$3, in layersoutside of the C/Si zone, produce high 32Si abundances andlarge 29,30Si excesses (Figure 8(b)). The authors demonstratedthat their model can produce sufficiently high 32Si/28Si ratiosto explain the S isotopic compositions measured in C grains.They did not consider the C, N, Al, and Ti isotopic ratios of thegrains, however. In the 32Si-rich regions of both the 12 M" SNand 15 M" SN model C consist of almost pure 12C, the result ofHe burning. In order to produce the C isotopic ratios observed inthe C grains, we assume that before grain condensation extensivemixing took place between the 12C- and 32Si-rich He/C zone and
9 Available at: http://2sn.org/sollo03
4

The Astrophysical Journal, 799:156 (23pp), 2015 February 1 Xu et al.
the He/N zone and/or the H-rich envelope, both characterizedby low 12C/13C ratios, the result of H burning in the CNO cycleduring previous stellar evolutionary stages.
In order to test these assumptions, different layers of the SNejecta are mixed. This procedure is justified since astronomicalobservations of SN remnants have shown a large degree of mix-ing and asymmetries of the ejected material (e.g., Grefenstetteet al. 2014). While these stars were obviously not the source ofthe presolar grains found in meteorites, we assume that the sametype of mixing occurred in the old parent SNe, with the mostrelevant constraint for the formation of carbide grains being thatthe resulting mixture has C/O > 1 (e.g., Travaglio et al. 1999;Yoshida 2007).
Therefore, in order to compare presolar grain measurementswith stellar models, we performed mixing calculations betweendifferent regions for the 12 M" SN model and the Pignatari et al.(2013c) models 15r and 15r4, the 15r model having the highestexplosion energy and temperature. The 15r model is based onthe analytical prescription by Fryer et al. (2012). The 15r4 modelhas a shock velocity lower by a factor of four than the shockvelocity of the 15r model (Pignatari et al. 2013a). First, wemixed the whole C/O + He/C zone with the entire He/N zoneof the Woosley & Heger (2007) model and the whole He/C zonewith the entire He/N zone of the Pignatari et al. models. We alsomixed individual layers in the C/O and He/C zone with layers inthe He/N zone for the three models. In addition, we also mixedzones and layers from the He/C (O/C + HeC) zone with the Henvelope. The relevant zones and the individual layers for themodels are indicated in Figure 8. In these mixing calculationsthe relative proportions of the two constituents of the mix havebeen varied, resulting in the curves shown in Figure 4, whichare compared with the 30Si/28Si ratios and inferred 32Si/28Siratios of grain a1–5–7 and other C grains. Also plotted are Ugrains, which have the same Si and S isotopic signatures as Cgrains but have much smaller 12C/13C ratios. In Figure 4(a) itcan be seen that the full-zone mixture of the 12 M" SN modelmisses most of the C grains. Even SN-12 mix a, which mixesthe layer with the maximum 30Si/28Si ratios and 32Si/28Si ratios(Figure 8(a)) with a layer in the He/N zone or the H envelopeand which therefore produces the largest 30Si/28Si ratios for agiven 12C/13C ratio in the mix, cannot account for the isotopicratios of a1–5–7 and most other C grains.
As can be seen from the plots in Figure 4(a), mixing with theH envelope produces mixing lines that are shifted to the left,i.e., have smaller 12C/13C ratios, from the mixing lines with theHe/N zone. This seems to be counter-intuitive because theHe/N zone has lower 12C/13C ratios than the H envelope.The reason is that in such mixing calculations it is not onlythe isotopic ratio but also the absolute abundances of theisotopes in question that matter. The H envelope has much higherabundances of the C isotopes than the He/N zone. An extremeexample of this principle is shown in some mixing curves inFigure 1. This figure shows a mixing curve between layer d atinternal mass 2.31 M" in the He/C zone with a layer at mass3.185 M" in the H envelope in the 12 M" SN model. Layerd is the layer where 15N reaches a maximum (Figure 7(a)).This mixing curve reaches low 14N/15N ratios for a range of12C/13C ratios and falls below all the C grains and most Xgrains (Figure 1). Compare this with the SN-12 mix c curvebetween layer c and the same layer in the H envelope. In layerc the 14N/15N ratio is much higher than in layer d, but the 15Nabundance is much lower. The resulting curve has very high14N/15N ratios up to very high 12C/13C ratios and misses all
Figure 2. (a) Inferred initial 26Al/27Al ratios of different rare types of presolarSiC grains are plotted against their 12C/13C ratios. As in Figure 1, solid mixinglines are between the He/C (C/O + He/C for the 12 M" SN model) zone andthe He/N zone or between layers therein, broken lines for mixtures between theHe/C (C/O + He/C) zone and the H envelope. Dash-dotted lines are between theHe/C (C/O + He/C) zone and a 1:1 mixture of the He/N zone and H envelopefor the 12 M" SN model and a 2:1 mixture of the He/N zone and H envelope forthe 15r model. Line 15r and 15r4 mix c2 are between layer c at 3.488 (model 15r)or 3.307 (model 15r4) internal mass and a 0.0063:0.9937 mix between layersat mass 4.758 (He/N zone) and mass 4.87 (H envelope). (b) Inferred initial44Ti/48Ti ratios of C and X grains are plotted against their 12C/13C ratios.
the grains. Another examples are the a and b mixing curves ofthe 15r SN model (Figure 4(a)). Mix b has higher !30Si/28Sivalues than mix a although the 30Si/28Si ratio is higher in layera (Figure 8(b)).
In contrast to the failure of mixing lines from the 12 M" SNmodel to match C grain a1–5–7 in Figure 4(a), the full-zonemixing line of model 15r for the 32Si/28Si versus 12C/13C plotis close to the isotopic ratios of a1–5–7 and mixing of differentlayers of the He/C zone for both the 15r and 15r4 models(Figure 4(a)) with a He/N layer and/or a H envelope layer cancover all grains. The grains to the right of the 15r and 15r4 lineswith the highest 12C/13C can be reached by selecting a layer
5

The Astrophysical Journal, 799:156 (23pp), 2015 February 1 Xu et al.
-1000
-500
0
500
1000
1500
!29 S
i/28 S
i (‰
)
-1000 -500 0 500 1000 1500
!30Si/28Si (‰)
C grains
Z grainsY grainsX grainsU grains
Z grainsY grainsX grains
Si3N4
C grains
Solar
Sola
r
(a)
-1000
-500
0
500
!33 S
/32 S
(‰)
-1000 -500 0 500
!34S/32S (‰)
Solar
Sola
rSi/S zone
-200
-100
0
100
200
!33 S
/32 S
(‰)
-200 -100 0 100 200
!34S/32S (‰)
Solar
Sola
r(b)
-1000
-500
0
500
!34 S
/32 S
(‰)
-1000 -500 0 500 1000 1500
!30Si/28Si (‰)
12M Si/S zone
Solar
Sola
r
15r C/Si zone
(c)
Figure 3. Silicon and sulfur isotopic compositions of different types of rare presolar SiC grains. Si and S isotopic of the SiC grains in all plots are given as !-values,deviations from the solar ratios in permil (‰). (a) Si isotopic ratios of selected SiC grains. (b) S isotopic ratios of selected rare SiC grains. The average S isotopicratios of the S/Si zone of the 15 M" SN model by Rauscher et al. (2002) are indicated. (c) !34S/32S values of grains are plotted against their !30Si/28Si values. Theratios of the S/Si zone of the 15 M" SN model by Rauscher et al. (2002) and those of the C/Si zone of the 15r model by Pignatari et al. (2013b) are depicted bysolid diamonds. The two solid lines in the right upper quadrant are mixing lines between the C/O-He/C and He/N zones of the 12 M" SN model by Woosley &Heger (2007; lower line) and between the He/C and He/N zones of the 15r model by Pignatari et al. (2013c). The solid line in the left lower quadrant is a mixing linebetween the Si/S zone and a mix between the He/C and He/N zones of the 15 M" SN model by Rauscher et al. (2002). In all figures errors are 1# .
6

The Astrophysical Journal, 799:156 (23pp), 2015 February 1 Xu et al.
with higher internal mass that has lower 29,30Si/28Si ratios butstill a high 12C/13C ratio (to the right of layer c in (Figure 8(b)).
Figure 4(b) shows that mix a of the 12 M" SN model canreproduce the inferred 32Si/28Si ratio of grain a1–5–7, andall grains can be covered by the right choice of mixtures forthis model. Because Si and S isotopes were not measuredsimultaneously in grain a1–5–7, we estimated the relative ionintensities of both elements from the independent measurementsof C and Si isotopes and of N and S isotopes by correctingfor differences in primary beam current and raster size. The32Si/28Si ratio was inferred from the 32S/28Si ratio and theaverage of the !33S/32S and !34S/32S values as explained byPignatari et al. (2013c) according to the formula
32Si/28Si = (32S/28Si) % ($0.001 % ! S),
where !S is the average of !33S and !34S. Because the Si and Ssignals are obtained from the images covering the whole grain,the !-values !33S/32S = $714‰, and !34S/32S = $703‰, andnot the ones obtained from the selected area shown in Figure 5and given in Table 1 have to be taken.
The full-zone mixing line between the He/C and He/N zonesof model 15r goes right through the a1–5–7 data point and allgrains can be covered by mixing of different individual layers(Figure 4(b)). Pignatari et al. (2013c) explored also models withlower shock velocities and showed that very similar maximum32Si/28Si ratios are obtained down to 1/10 of the shock velocityof model 15r (their Figure 5), which is also shown by the mixingcurves for the 15r4 model. In conclusion, the 15r and 15r4models seem to better explain the Si isotopic ratios of C grainsthan the 12 M" SN model (Figure 4(a)), but all models canexplain the inferred 32Si/28Si ratios. The isotopic ratios of theU grains are completely outside of predictions by any baselineSN models and apparently require a different stellar source.
In the models considered here, the regions with 32Si (andlarge 29Si and 30Si excesses) have heavy S, i.e., large 33S and34S excesses (see Table 2). In Figure 3(c) the two lines at positive!30Si/28Si values are whole-zone mixing lines for the 12 M" and15r SN models. The fact that the C grains show large 34S deficitsinstead of excesses means that any indigenous S in the grainsmust have been completely overwhelmed by radiogenic 32S. Wealready mentioned that only very little S condensed into SiC. Thelower a1–5–7 data point in Figure 13 was obtained by assumingthat all the non-radiogenic S in the grain (in the whole image inFigure 5) had normal isotopic composition. However, both SNmodels predict an excess of 34S of about 600‰. If we assumesuch a composition then the S/Si ratio for the non-radiogenic Sis only 0.001. However, this is only an upper limit because forthis estimate we used the full S isotopic image (because the Sisignal was obtained from the whole grain) and it is clear that alarge portion of 34S is due to contamination and not intrinsic 34S(Figure 5(e)). Pignatari et al. (2013c) assumed a fractionationfactor of 104 between Si and S during condensation. This isconsistent with our estimate. Radiogenic 32S was retained inthe SiC grain because it condensed as 32Si. Previous studies ofgraphite grains have demonstrated that another volatile element,K, is quantitatively retained in graphite if it is radiogenic41K, produced by the decay of short-lived 41Ca (Zinner &Jadhav 2013).
We can also investigate, how well the SN models match theremaining isotopic ratios in the C grain a1–5–7. Figure 1 showsthat zone mixing cannot match the N and C isotopic ratios ofthe grain but produce 14N/15N ratios that are much too high. We
Figure 4. (a) 30Si/28Si ratios (expressed as !-values) of C and U grains areplotted against their 12C/13C ratios. The C grain of this study is plotted as asolid sphere. C grains studied previously are plotted as open spheres, those thathad their S isotopic ratios analyzed with crossed lines. Also plotted are mixinglines between the C/O–He/C and He/N zones of the 12 M" SN model byWoosley & Heger (2007) and between the He/C and He/N zones of the 15rand 15r4 models by Pignatari et al. (2013c), for the whole zones as well asfor individual layers from the He/C and He/N (solid lines) zones and the Henvelope (broken lines) as indicated in Figure 7. (b) Inferred (from 32S excesses)32Si/28Si ratios of C and U grains are plotted against their 12C/13C ratios. Thegrain with 12C/13C = 3290 and !30Si = 1283‰ in plot (a) is from Gyngardet al. (2010a). Although both the Si and S isotopic ratios were measured in thisgrain, not enough information had been recorded to determine the S/Si and thusthe 32Si/28Si ratio. Mixing lines are as described for the plot in the upper panel.
have to use layers with high 15N. These are the layer d in the12 M" SN model and the layer c in the 15r SN model (Figure 7).Mixing with this layer easily covers the N and C isotopic ratiosof grain a1–5–7 for the 12 M" SN model. However, a mixtureof layer c in the 15r models with a layer in the H envelope stillmisses grain a1–5–7, although this is the mixture in this modelthat gets closest to the C and N isotopic ratios of this grain. Themixing curve for layer c with a layer in the H envelope for the15r4 model is even farther removed from the N and C isotopicratios of grain a1–5–7.
7

The Astrophysical Journal, 799:156 (23pp), 2015 February 1 Xu et al.
(a) (b)
(c) (d)
(e) (f)
Figure 5. NanoSIMS images of CN and S negative ions and secondary electrons for the C grain a1–5–7. The images are over a 2.5 % 2.5 µm2 area and consist of64 % 64 pixels each. The color bars besides the images indicate counts pixel$1. The area outlined by the red line was selected to exclude most contamination by 33Sand 34S and was used to determine N and S isotopic ratios of the grain.
The inferred 26Al/27Al ratio (!25Mg/24Mg = $172‰ ±167‰, !26Mg/24Mg = 2625‰ ± 394‰) of grain a1–5–7 islower than those of other C grains, which in turn are lower thanthose of most X grains (Figure 2(a)). It is also lower than themixing line of whole He/C (O/C + He/C) and He/N zones forthe 12 M" and 15r SN models. However, mixing with the Henvelope results in much lower 26Al/27Al ratios. Intermediateratios can be produced by the proper mixing of all three zones.
The C and Al isotopic ratios of grain a1–5–7 can be reproducedby a mixture of layer c in the 15r SN model with a 0.0063:0.9937mix of a layer at internal mass 4.758 in the He/N zone and alayer at mass 4.87 in the H envelope (Figure 2(a)). They alsocan be reproduced by the same mixture of layers for the 15r4SN model.
The mixing curves shown in Figures 1, 2(a), and 4 giveonly a very rudimentary impression of the mixing problem:
8

The Astrophysical Journal, 799:156 (23pp), 2015 February 1 Xu et al.
Figure 6. S isotopic ratios of C grains are compared to theoretical predictions of these ratios in the Si/S zones of four different SN models: the 12 M" SN model byWoosley & Heger (2007) and the 15 M", 20 M", and the 25 M" SN models by Rauscher et al. (2002). In addition to the ratio lines we also plotted the S isotopicratios averaged over the Si/S zone for each model.
(1) they show only mixing curves for two isotopic ratios and (2)they usually involve only two or at most three different zonesor layers. We thus attempted to match all isotopic ratios of agiven grain by mixing several layers of the SN models we haveconsidered. Table 2 shows the layers we have selected for thisfitting exercise. The reasons for selecting these layers are thefollowing. A layer in the core can provide a high abundanceof 44Ti without much affecting the other isotopic ratios. Wechose a layer in the Si/S zone (12 M" model) and the C/Sizone (15r model) in order to obtain 28Si for the X grains. In theHe/C zone we selected two layers, one with high 29,30,32Si/28Siratios and one with high 15N. Both have high 12C/13C ratios.We need a layer in the He/N zone for high 26Al/27Al ratios, andfinally one in the H envelope for low 26Al/27Al ratios and low12C/13C ratios.
Table 3 and Figure 9 show the result of this fitting exercisefor the C grain a1–5–7. The 12 M" SN model yields good fitsfor all measured isotopic ratios except the Si isotopic ratios. Weremarked already in discussing Figure 4(a) that mixing lines ofthe 12 M" model do not reach grain a1–5–7. The 15r modelcan match the Si isotopic ratios and the ratios of the short-livedisotopes 26Al, 32Si, and 44Ti of this grains quite well but has aproblem with the C and N isotopic ratios. We have already seenin Figure 1 that the 15r model does not have a mixture that canreproduce the C and N isotopic ratios of grain a1–5–7. We thusproduced two mixtures, one which matches the 12C/13C ratio ofthe grain but not the 14N/15N ratio and one which matches theN but not the C isotopic ratio. The first mixture matches all theremaining ratios, the second all but the 30Si/28Si ratio (Table 3and Figure 9). The situation is similar for the 15r4 model except
9

The Astrophysical Journal, 799:156 (23pp), 2015 February 1 Xu et al.
1E-7
1E-6
1E-5
1E-4
1E-3
1E-2
1E-1
1E+0
Abu
ndan
ce o
r Rat
io
1.9 2.0 2.1 2.2 2.3 2.4 2.5 2.6 2.7 2.8 2.9 3.0 3.1 3.2
Interior Mass
SN-12-Woosley-Heger
26Al/27Al
15N
14N
12C
He/NHe/CO/C
C/O
a bc d
(a)
1E-7
1E-6
1E-5
1E-4
1E-3
1E-2
1E-1
1E+0
Abu
ndan
ce o
r Rat
io
2.8 3 3.2 3.4 3.6 3.8 4 4.2 4.4 4.6 4.8 5
Interior Mass
Pignatari Model 15r
He/NHe/Cab c
(b)
C/Si
1E-7
1E-6
1E-5
1E-4
1E-3
1E-2
1E-1
1E+0
Abu
ndan
ce o
r Rat
io
2.8 3 3.2 3.4 3.6 3.8 4 4.2 4.4 4.6 4.8 5
Interior Mass
Pignatari Model 15r4
He/NHe/Cab c
(c)
C/Si
Figure 7. Carbon-12, 14N, and 15N abundances (weight fractions) and26Al/27Al ratios in the interior of three SN models: (a) the 12 M" SN model byWoosley & Heger (2007) and ((b) and (c)) the 15r and 15r4 models by Pignatariet al. (2013c). Vertical lines across the height of individual plots indicate bordersbetween SN zones named after the two most abundant elements (Meyer et al.1995). Short vertical lines with labels indicate layers in the He/C zone that weremixed with the layer in the He/N zone indicated by another short vertical line.The interior mass (x-axis) is in units of solar mass.
1E-5
1E-4
1E-3
1E-2
1E-1
1E+0
Abu
ndan
ce o
r Rat
io
1.9 2.0 2.1 2.2 2.3 2.4 2.5 2.6 2.7 2.8 2.9 3.0 3.1 3.2
Interior Mass
SN-12-Woosley-Heger
12C
32Si/28Si
30Si/28Si
29Si/28Si
He/NHe/CO/C
C/O
a b
1E-5
1E-4
1E-3
1E-2
1E-1
1E+0
Abu
ndan
ce o
r Rat
io
2.8 3 3.2 3.4 3.6 3.8 4 4.2 4.4 4.6 4.8 5
Interior Mass
Pignatari Model 15r
He/NHe/Cab c
(a)
(b)
dc
C/Si
1E-5
1E-4
1E-3
1E-2
1E-1
1E+0
Abu
ndan
ce o
r Rat
io
2.8 3 3.2 3.4 3.6 3.8 4 4.2 4.4 4.6 4.8 5
Interior Mass
Pignatari Model 15r4
He/NHe/Cab c
(c)
C/Si
Figure 8. Carbon-12 abundances (weight fractions) and Si isotopic ratios in theinterior of the two SN models described in the Figure 7 caption.
that the discrepancy for the 14N/15N ratio in case we matchthe 12C/13C ratio and vice versa is somewhat worse. We nowobtain a closer match for the 30Si/28Si ratio in the second case(Figure 9 and Table 3).
10
The Astrophysical Journal, 799:156 (23pp), 2015 February 1 Xu et al.
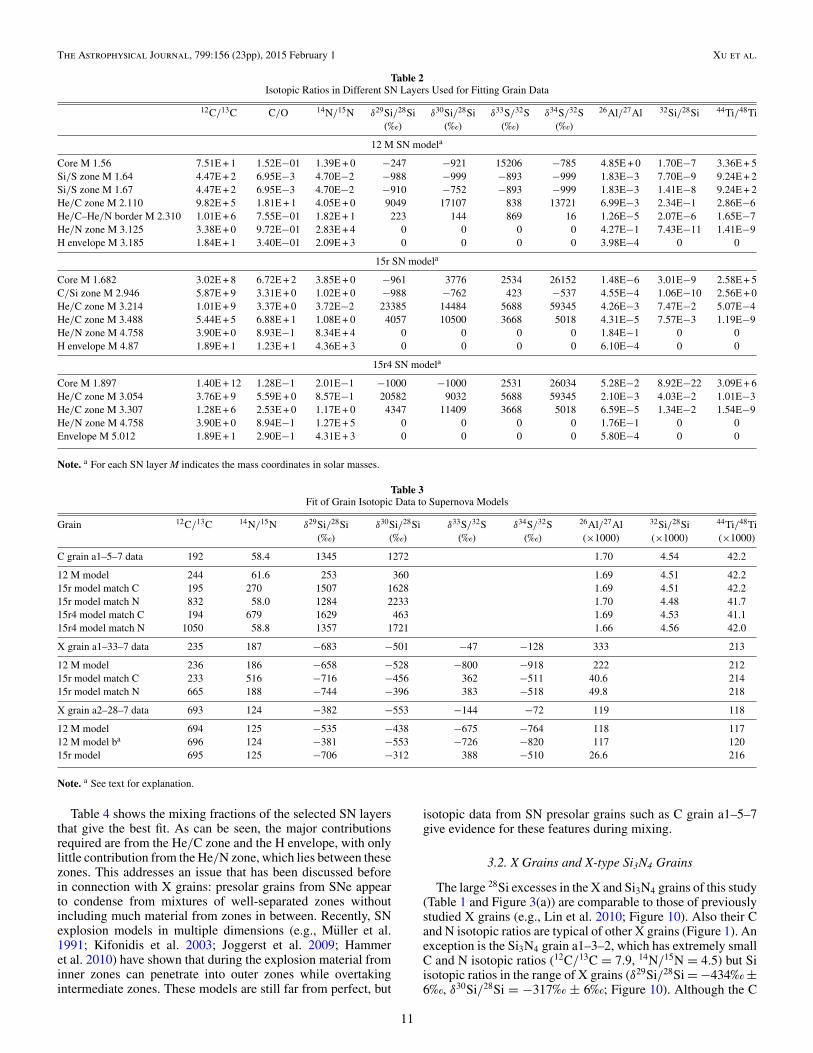
Table 2Isotopic Ratios in Different SN Layers Used for Fitting Grain Data
12C/13C C/O 14N/15N !29Si/28Si !30Si/28Si !33S/32S !34S/32S 26Al/27Al 32Si/28Si 44Ti/48Ti(‰) (‰) (‰) (‰)
12 M SN modela
Core M 1.56 7.51E + 1 1.52E$01 1.39E + 0 $247 $921 15206 $785 4.85E + 0 1.70E$7 3.36E + 5Si/S zone M 1.64 4.47E + 2 6.95E$3 4.70E$2 $988 $999 $893 $999 1.83E$3 7.70E$9 9.24E + 2Si/S zone M 1.67 4.47E + 2 6.95E$3 4.70E$2 $910 $752 $893 $999 1.83E$3 1.41E$8 9.24E + 2He/C zone M 2.110 9.82E + 5 1.81E + 1 4.05E + 0 9049 17107 838 13721 6.99E$3 2.34E$1 2.86E$6He/C–He/N border M 2.310 1.01E + 6 7.55E$01 1.82E + 1 223 144 869 16 1.26E$5 2.07E$6 1.65E$7He/N zone M 3.125 3.38E + 0 9.72E$01 2.83E + 4 0 0 0 0 4.27E$1 7.43E$11 1.41E$9H envelope M 3.185 1.84E + 1 3.40E$01 2.09E + 3 0 0 0 0 3.98E$4 0 0
15r SN modela
Core M 1.682 3.02E + 8 6.72E + 2 3.85E + 0 $961 3776 2534 26152 1.48E$6 3.01E$9 2.58E + 5C/Si zone M 2.946 5.87E + 9 3.31E + 0 1.02E + 0 $988 $762 423 $537 4.55E$4 1.06E$10 2.56E + 0He/C zone M 3.214 1.01E + 9 3.37E + 0 3.72E$2 23385 14484 5688 59345 4.26E$3 7.47E$2 5.07E$4He/C zone M 3.488 5.44E + 5 6.88E + 1 1.08E + 0 4057 10500 3668 5018 4.31E$5 7.57E$3 1.19E$9He/N zone M 4.758 3.90E + 0 8.93E$1 8.34E + 4 0 0 0 0 1.84E$1 0 0H envelope M 4.87 1.89E + 1 1.23E + 1 4.36E + 3 0 0 0 0 6.10E$4 0 0
15r4 SN modela
Core M 1.897 1.40E + 12 1.28E$1 2.01E$1 $1000 $1000 2531 26034 5.28E$2 8.92E$22 3.09E + 6He/C zone M 3.054 3.76E + 9 5.59E + 0 8.57E$1 20582 9032 5688 59345 2.10E$3 4.03E$2 1.01E$3He/C zone M 3.307 1.28E + 6 2.53E + 0 1.17E + 0 4347 11409 3668 5018 6.59E$5 1.34E$2 1.54E$9He/N zone M 4.758 3.90E + 0 8.94E$1 1.27E + 5 0 0 0 0 1.76E$1 0 0Envelope M 5.012 1.89E + 1 2.90E$1 4.31E + 3 0 0 0 0 5.80E$4 0 0
Note. a For each SN layer M indicates the mass coordinates in solar masses.
Table 3Fit of Grain Isotopic Data to Supernova Models
Grain 12C/13C 14N/15N !29Si/28Si !30Si/28Si !33S/32S !34S/32S 26Al/27Al 32Si/28Si 44Ti/48Ti(‰) (‰) (‰) (‰) (%1000) (%1000) (%1000)
C grain a1–5–7 data 192 58.4 1345 1272 1.70 4.54 42.2
12 M model 244 61.6 253 360 1.69 4.51 42.215r model match C 195 270 1507 1628 1.69 4.51 42.215r model match N 832 58.0 1284 2233 1.70 4.48 41.715r4 model match C 194 679 1629 463 1.69 4.53 41.115r4 model match N 1050 58.8 1357 1721 1.66 4.56 42.0
X grain a1–33–7 data 235 187 $683 $501 $47 $128 333 213
12 M model 236 186 $658 $528 $800 $918 222 21215r model match C 233 516 $716 $456 362 $511 40.6 21415r model match N 665 188 $744 $396 383 $518 49.8 218
X grain a2–28–7 data 693 124 $382 $553 $144 $72 119 118
12 M model 694 125 $535 $438 $675 $764 118 11712 M model ba 696 124 $381 $553 $726 $820 117 12015r model 695 125 $706 $312 388 $510 26.6 216
Note. a See text for explanation.
Table 4 shows the mixing fractions of the selected SN layersthat give the best fit. As can be seen, the major contributionsrequired are from the He/C zone and the H envelope, with onlylittle contribution from the He/N zone, which lies between thesezones. This addresses an issue that has been discussed beforein connection with X grains: presolar grains from SNe appearto condense from mixtures of well-separated zones withoutincluding much material from zones in between. Recently, SNexplosion models in multiple dimensions (e.g., Muller et al.1991; Kifonidis et al. 2003; Joggerst et al. 2009; Hammeret al. 2010) have shown that during the explosion material frominner zones can penetrate into outer zones while overtakingintermediate zones. These models are still far from perfect, but
isotopic data from SN presolar grains such as C grain a1–5–7give evidence for these features during mixing.
3.2. X Grains and X-type Si3N4 Grains
The large 28Si excesses in the X and Si3N4 grains of this study(Table 1 and Figure 3(a)) are comparable to those of previouslystudied X grains (e.g., Lin et al. 2010; Figure 10). Also their Cand N isotopic ratios are typical of other X grains (Figure 1). Anexception is the Si3N4 grain a1–3–2, which has extremely smallC and N isotopic ratios (12C/13C = 7.9, 14N/15N = 4.5) but Siisotopic ratios in the range of X grains (!29Si/28Si = $434‰ ±6‰, !30Si/28Si = $317‰ ± 6‰; Figure 10). Although the C
11

The Astrophysical Journal, 799:156 (23pp), 2015 February 1 Xu et al.
Figure 9. Results of fitting calculations of isotopic ratios of the C grain a1–5–7 to mixtures of contributions from different layers of three SN models: (a) the 12 M"SN model by Woosley & Heger (2007) and ((b) and (c)) the 15r and 15r4 models by Pignatari et al. (2013c). Plotted are the isotopic ratios measured in the grain andthe ratios calculated for the mixture. For stable isotopes the ratios are normalized to the solar system ratios (left-hand scale), for the short-lived isotopes 26Al, 32Si, and44Ti the ratios are plotted (right-hand scale). Two fitting results are presented for the 15r and 15r4 models, one that matches the 12C/13C ratio, and one that matchesthe 14N/15N ratio of the grain.
12

The Astrophysical Journal, 799:156 (23pp), 2015 February 1 Xu et al.
Table 4Mixing Fractions of Different SN Layers
C-grain a1–5–7 X-grain a1–33–7 X-grain a2–28–7
12 M SN modela Fit bb
Core M 1.56 0.02 0.04 0.02 0.02Si/S zone M 1.64 and 1.67c 1.09 0.41 0.56He/C zone M 2.11 3.66 2.12 9.10 9.10He/C zone M 2.16 0.34He/C–He/N border M 2.31 39.41 36.28 35.90 35.94He/N zone M 3.125 0.28 54.43 26.33 26.35H envelope M 3.185 56.30 6.05 28.24 28.03
15r SN modela Match Cd Match Ne Match Cd Match Ne
Core M 1.682 0.04 0.01 0.10 0.00C/Si zone M 2.946 0.33 1.79 3.05 2.84He/C zone M 3.214 2.70 3.31He/C zone M 3.488 13.52 42.98 9.89 25.91 30.95He/N zone M 4.758 0.50 0.48 21.39 25.30 12.90H envelope M 4.87 83.23 52.90 66.83 45.73 53.31
15r4 SN modela Match Cd Match Ne
Core M 1.897 0.39 0.23He/C zone M 3.054 9.99 3.76He/C zone M 3.307 6.33 49.22He/N zone M 4.758 0.46 0.46Envelope M 5.012 82.83 46.32
Notes. Given are the fractions in percent of each SN layer to reproduce the isotopic compositions of three grains. The fitsare given in Table 2.a For each SN layer M indicates the mass coordinates in solar masses.b See text for explanation.c M = 1.64 for grain 2–28–7 and M = 1.67 for grain 1–33–7.d Mixture that best matches the 12C/13C ratio of the grain.e Mixture that best matches the 14N/15N ratio of the grain.
and N isotopic ratios of this grain are comparable to those ofnova candidates, an SN origin is more likely than a nova origin.Nittler & Hoppe (2005) found a SiC grain with similar C, N, andSi isotopic ratios, but measured a large 49Ti excess and proposedthat it has an SN origin. Unfortunately, our grain was consumedduring the S and N imaging analysis, and no material was leftfor Mg–Al and Ca–Ti measurements. Its S isotopic ratios arenormal within large errors (!33S/32S = $83‰ ± 121‰ and!34S/32S = $67‰ ± 51‰).
As seen in Table 1 and Figure 3(b), Type X grains tend to have32S excesses. The weighted means of the S isotopic ratios are!33S/32S = $64‰ ± 22‰ and !34S/32S = $53‰ ± 8‰ (1#errors). Errors of individual grain measurements however arelarge, and many grains have normal S isotopic ratios within 2#errors. Only three grains (a2–10–3, a2–28–7, and a2–45–9) have33S and 34S deficits of more than 2# , whereas another six grains(a1–20–7, a1–22–4, a1–37–7, a1–42–3, a1–48–1, and a2–14–8)have either 33S or 34S deficits of more than 2# . Excesses in 33Sand/or 34S in some grains are all smaller than 2# . In Figure 3(c),we show correlation plots between the !34S/32S and !30Si/28Sivalues for all of our X grains and for previously reported grains.It is generally accepted that X grains come from SNe becauseonly massive stars produce large 28Si excesses. In conventionalcore–collapse SN models (e.g., Rauscher et al. 2002), 28Si isproduced by oxygen burning, and the resulting Si/S zone is alsorich in 32S. In Figure 3(c) we plotted a mixing line of materialfrom the Si/S zone with a He/C–He/N mix of the 15 M" SNmodel by Rauscher et al. (2002). It is clear that, except for oneX grain, all other data points for X grains plot above this line,indicating that 32S excesses (34S deficits) are much smaller than
-1000
-800
-600
-400
-200
0
!29 S
i/28 S
i (‰
)
-1000 -800 -600 -400 -200 0
!30Si/28Si (‰)
Fits to SN-12
SN-12 Si/S zone15r Si/C zone
X grainsX grainsSi3N4
Solar
Sola
r
a1-33-7Fit of a1-33-7
a2-28-7
Fit of a2-28-7
Figure 10. Three-isotope plot of the Si isotopic ratios of X grains and Si3N4grains. The two lines at the bottom of the plot are the Si isotopic ratios in theSi/S zone of the 12 M" SN model and in the C/Si zone of the 15r model. Theisotopic ratios of two selected X grains and the ratios obtained by fitting allmeasured isotopic ratios except S to mixtures of layers of the 12 M" SN modelare indicated. The solid circle on the y-axis is the proposed ratio of the Si/Szone that would give a perfect fit for the Si isotopic ratios of grain a2–28–7.The line through this composition and that of the grain extrapolates to !29Si =163‰, !30Si = 200‰, the composition of the other layers in the mix.
13

The Astrophysical Journal, 799:156 (23pp), 2015 February 1 Xu et al.
expected for such a mix. The most likely explanations are lowintrinsic S concentrations and contamination with isotopicallynormal S. We will address this problem in detail below.
In the model by Pignatari et al. (2013b), 28Si is producedin explosive He-burning conditions by a chain of $-capturesstarting from 16O at the bottom of the He/C zone during passageof the shock wave. These authors proposed that X grains formedfrom this C/Si zone. The $-captures also produce other $-nucleiincluding 32S. In Figure 3(c) we plot the average !34S/32S and!30Si/28Si values in the C/Si zone of model 15r. Whereas thesevalues can explain the !34S/32S and !30Si/28Si values of mostX grains if we allow for contamination, the lowest !30Si/28Sivalue of the model is not quite as low as the values of someX grains. More importantly, the average !33S/32S value of theC/Si zone is + 650‰, in contrast to 33S depletions in many Xgrains (Figure 3(b)) and for the average of X grains. Due tothis discrepancy, the S isotopic ratios in X grains seem to argueagainst this model as a source of X grains. On the other hand, thePignatari et al. (2013b) model avoids the problem of the lack of54Fe excesses in X grain (Marhas et al. 2008), which are expectedfor the Si/S zone of conventional SN models such as those byRauscher et al. (2002). The Pignatari et al. (2013b) model hasnot yet been explored in all details. Here we restrict ourselves tothe isotopic ratios of a few elements with an emphasis on S, butin the future will compare the isotopic ratios of other elementssuch as Ti, Fe, and Ni with the model.
The N, Al, and Si isotopic ratios of X grains and the problemsof matching them with SN models have been discussed before(e.g., Besmehn & Hoppe 2003; Lin et al. 2010). Here we returnto these problems by considering two SN models that have notbeen considered before. Figure 1 compares the N and C isotopicratios of X grains and the two Si3N4 grains of this study withpredictions of mixtures for the 12 M" core–collapse SN modelby Woosley & Heger (2007) and the 15r model by Pignatariet al. (2013b, 2013c). As has been mentioned before, mixtures ofwhole zones do not come close to explaining the isotopic ratiosof essentially all the grains and for the 15r model the mixture ofthe mass 3.488 M" layer (layer c in Figures 7(b) and 8(b)) with alayer in the H envelope, which yields the lowest 14N/15N ratios,misses most of the grains. The situation is more promising formixtures involving the mass 2.31 M" layer of the 12 M" SNmodel (layer d in Figures 7(a) and 8(a)), which can cover mostof the grains. A recent analysis of 15N production in the He shellduring the SN explosion (Meyer & Bojazi 2011; Bojazi & Meyer2014) shows that the use of an updated set of nuclear reactionrates reduces by a factor of four the amount of 15N made in theHe/C zone compared to previous calculations (e.g., Rauscheret al. 2002). Considering the nuclear reaction rates affecting theproduction of 15N in the He shell (see Bojazi & Meyer 2014),the 12 M" SN model considered here was calculated by usinga network mostly consistent with that of Rauscher et al. (2002;e.g., Woosley et al. 2004). The set of nuclear reaction ratesadopted to calculate the 15r model is given by Pignatari et al.(2013a), and did not include the set of reaction rates by Iliadiset al. (2010). Therefore, the 15N peak obtained at 2.31 M" in the12 M" SN model (layer d) and at 3.488 M" in the 15r model(layer c) could be affected by the reaction rates adopted, makingit even more challenging to explain low 14N/15N ratio togetherthe low 12C/13C ratio. In any case, without considering potentialnuclear uncertainties, mixing with layer d layer in the 12 M"SN model (Figure 1) achieves lower 14N/15N ratios than anyprevious mixing not involving the 15N spike in the He/N zone(see Figure 17 in Lin et al. 2010).
Figure 2 shows the inferred initial 26Al/27Al and 44Ti/48Ti ofthe X grains of this study and of previously analyzed X grains(Lin et al. 2010). Many grains in the 26Al/27Al versus 12C/13C plot lie above mixing lines between the He/C and He/Nzones. That SN models cannot produce 26Al/27Al ratios as highas those observed in some X grains and low-density graphitegrains (Jadhav et al. 2013) has been discussed before (Lin et al.2010) and still awaits a solution. On the other hand, as discussedin connection with the C grain a1–5–7, intermediate 26Al/27Alratios can be produced by mixing with the H envelope. TiC sub-grains have been found in the transmission electron microscopein mainstream SiC grains (Bernatowicz et al. 1992) and possiblyin an X grains (Hynes et al. 2010). In X grains, Ti is concen-trated in small subgrains as evidenced by depth profiles duringisotopic analysis (Lin et al. 2010) and by ion imaging (Zinneret al. 2011). An important question is whether these subgrainscondensed before SiC formation or whether they are the resultof exsolution of Ti that condensed into SiC as solid solution. Ti-tanium isotopic heterogeneity among different subgrains withina given X grain would indicate the former. The X grains of thisstudy are too small to address this question, but we hope thatisotopic analysis of large X grains will provide an answer.
As we did for the C grain a1–5–7, we performed detailedfitting calculations of mixtures from our two SN models to allisotopic ratios measured in two selected X grains. In contrastto the C grain a1–5–7, we performed the fitting calculationson these two X grains only for model 15r and not for model15r4. The reason is that only model 15r produces 28Si excessesin the C/Si zone, whereas model 15r4 does not. Throughoutthe C/Si zone there are 29Si and 30Si excesses in the 15r4model. The smallest !29,30Si values in this zone are !29Si =+ 251‰ and !30Si = + 404‰. The selected grains both had their44Ti/48Ti ratios determined and they have different Si isotopicratios. One, grain a2–28–7, plots close to the correlation line(solid black line) along which most X grains plot in a Si 3-isotope diagram (Figure 10). Grain a1–33–7, in contrast, is thegrain that plots farthest away from this line among the X grainsof the present study. Shown in Figure 10 are also the Si isotopiccompositions of different layers of the Si/S zone of the 12 M"SN model by Woosley & Heger (2007) and the C/Si zone ofthe 15r model by Pignatari et al. (2013b, 2013c). These are themost 28Si-rich layers in these two models. In order to matchthe Si isotopic ratios of grain a1–33–7 we use the layer at 1.67internal mass of the 12 M" SN model (indicated by an arrow inFigure 10). A proper mixture of this layer with the mixture of allthe other layers (having !29Si = 163‰, !30Si = 200‰) yieldsa composition quite close to the original position. The results ofthe fit for all isotopic ratios are shown in Figure 11 and Table 3,with mixing fractions given in Table 4. The 26Al/27Al ratio ofthe grain is a little too high to be fitted by the 12 M" SN model.We have not tried to fit the measured S isotopic ratios of thisgrain but in Figure 11 have plotted the ratios of the mixturethat gives a close fit to the Si isotopic ratios. The fit to layersof the 15r model works almost equally well for the Si isotopicratios, but here we encounter the same problem as for the Cgrain a1–5–7: either we can achieve a close match for the Cisotopic ratio or for the N isotopic ratio, but not for both of them(Figure 11 and Table 3). Furthermore, we cannot match the26Al/27Al ratio of the grain: the 15r model does not achieve ashigh 26Al/27Al ratios as the 12 M" model in the He/N zone(Figures 2(a) and 7). Both models can achieve a perfect fit forthe 44Ti/48Ti ratio. In order to achieve such a fit for the caseof the match to the 12C/13C in the 15r model we need a small
14

The Astrophysical Journal, 799:156 (23pp), 2015 February 1 Xu et al.
1E-1
1E+0
1E+1
Rat
io/S
olar
0 2 4 6 8 10 12
SN fit
data
12C
/13 C
14N
/15 N
29Si
/28 S
i
30Si
/28 S
i
SN-12 model
33S/
32S
34S/
32S
1E-2
1E-1
1E+0
0 1 2 3 4
26A
l/27 A
l
44T
i/48 T
i
Rat
io
Fit to X grain a1-33-7
1E-1
1E+0
1E+1
Rat
io/S
olar
0 2 4 6 8 10 12
12C
/13 C
14N
/15 N
29Si
/28 S
i
30Si
/28 S
i
SN model 15r match C
33S/
32S
34S/
32S
1E-2
1E-1
1E+0
0 1 2 3 4
26A
l/27 A
l
44T
i/48 T
i Rat
io
1E-1
1E+0
1E+1
Rat
io/S
olar
12C
/13 C
14N
/15 N
29Si
/28 S
i
30Si
/28 S
i
SN model 15r match N
33S/
32S
34S/
32S
1E-2
1E-1
1E+0
26A
l/27 A
l
44T
i/48 T
i Rat
io
Figure 11. Results of fitting calculations of isotopic ratios of the X grain a1–33–7 to mixtures of contributions from different layers of the two SN models considered.The convention is the same as for Figure 9. For the 15r model two fitting results are presented, one that matches the 12C/13C ratio and one that matches the 14N/15Nratio of the grain.
contribution from the core (Table 4), whereas for the other casesthe 44Ti contribution from the C/Si zone is sufficient. This is incontrast to the claim by Pignatari et al. (2013b) that no contri-bution from the core is necessary. However, we need to pointout that grain a1–33–7 has the second-highest 44Ti/48Ti ratio(Figure 2) and it is possible that none of the X grains withsmaller 44Ti/48Ti ratios need any contributions from the core.Furthermore, the Pignatari et al. (2013b) models were calcu-lated for only one stellar mass. At the moment we do not knowwhether or not models with a lower initial mass (e.g., a 12 M"star) would fit the grain data, but it is our goal to investigate arange of initial masses in the future. Figure 1 shows that we canmatch the C and N isotopic ratios with a mix between layer c andthe H envelope, but such a mixture gives a complete mismatchfor the Al and Si isotopic ratios.
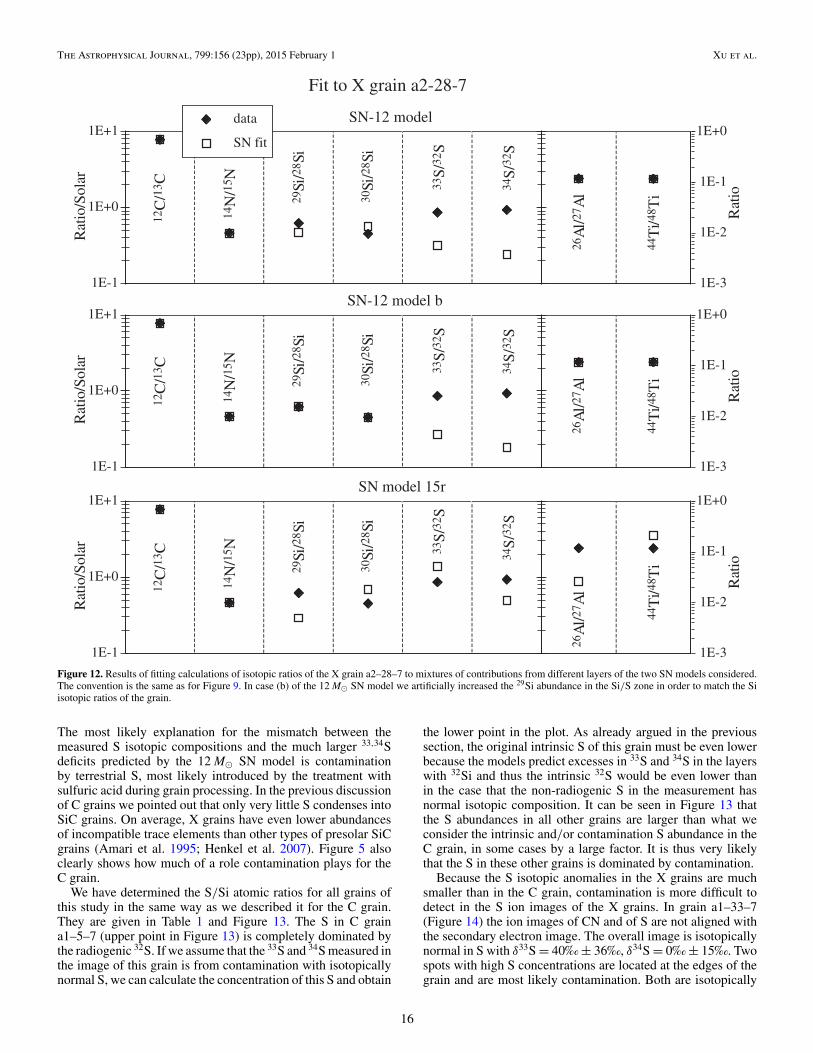
From Figure 10 it is clear that the Si isotopic ratios of graina2–28–7 cannot be matched if we use any compositions of theSN models in a mix with the rest of the layers (that have !29Si =
513‰, !30Si = 862‰ for the 12 M" model). The best matchachieved with the layer at internal mass 1.64 of the 12 M"model (that has a composition closest to the origin of the Si plotin Figure 10) lies on the mixing line between these compositionswith the closest distance to the measured data point (Figures 10and 12 and Table 3). As has been discussed before (Lin et al.2010), in order to achieve a match for grain a2–28–7 and most Xgrains along the major correlation line one needs a componentwith a much higher 29Si abundance. As an exercise we increasedthe 29Si abundance of the layer at internal mass 1.64 from 2.57 %10$4 to 7.40 % 10$3 and achieved a perfect fit (model (b) inFigure 12 and Table 3). For the 15r model we have not triedan artificial increase in the 29Si abundance in the C/Si zone.However, the model does not match the 26Al/27Al ratio of thegrain and produces too much 44Ti.
On the face of it, the 15r model comes closer to the measuredS isotopic ratios. However, as already mentioned, it predicts 33Sexcesses, whereas, on average, the X grains have 33S deficits.
15
The Astrophysical Journal, 799:156 (23pp), 2015 February 1 Xu et al.
1E-1
1E+0
1E+1
Rat
io/S
olar
0 2 4 6 8 10 12
SN fit
data
12C
/13 C
14N
/15 N
29Si
/28 S
i
30Si
/28 S
i
SN-12 model
33S/
32S
34S/
32S
1E-3
1E-2
1E-1
1E+0
0 1 2 3 4
26A
l/27 A
l
44T
i/48 T
i
Rat
io
Fit to X grain a2-28-7
1E-1
1E+0
1E+1
Rat
io/S
olar
0 2 4 6 8 10 12
12C
/13 C
14N
/15 N
29Si
/28 S
i
30Si
/28 S
i
SN-12 model b
33S/
32S
34S/
32S
1E-3
1E-2
1E-1
1E+0
0 1 2 3 4
26A
l/27 A
l
44T
i/48 T
i
Rat
io
1E-1
1E+0
1E+1
Rat
io/S
olar
0
12C
/13 C
14N
/15 N
29Si
/28 S
i
30Si
/28 S
i
SN model 15r
33S/
32S
34S/
32S
1E-3
1E-2
1E-1
1E+0
4
26A
l/27 A
l
44T
i/48 T
i
Rat
io
Figure 12. Results of fitting calculations of isotopic ratios of the X grain a2–28–7 to mixtures of contributions from different layers of the two SN models considered.The convention is the same as for Figure 9. In case (b) of the 12 M" SN model we artificially increased the 29Si abundance in the Si/S zone in order to match the Siisotopic ratios of the grain.
The most likely explanation for the mismatch between themeasured S isotopic compositions and the much larger 33,34Sdeficits predicted by the 12 M" SN model is contaminationby terrestrial S, most likely introduced by the treatment withsulfuric acid during grain processing. In the previous discussionof C grains we pointed out that only very little S condenses intoSiC grains. On average, X grains have even lower abundancesof incompatible trace elements than other types of presolar SiCgrains (Amari et al. 1995; Henkel et al. 2007). Figure 5 alsoclearly shows how much of a role contamination plays for theC grain.
We have determined the S/Si atomic ratios for all grains ofthis study in the same way as we described it for the C grain.They are given in Table 1 and Figure 13. The S in C graina1–5–7 (upper point in Figure 13) is completely dominated bythe radiogenic 32S. If we assume that the 33S and 34S measured inthe image of this grain is from contamination with isotopicallynormal S, we can calculate the concentration of this S and obtain
the lower point in the plot. As already argued in the previoussection, the original intrinsic S of this grain must be even lowerbecause the models predict excesses in 33S and 34S in the layerswith 32Si and thus the intrinsic 32S would be even lower thanin the case that the non-radiogenic S in the measurement hasnormal isotopic composition. It can be seen in Figure 13 thatthe S abundances in all other grains are larger than what weconsider the intrinsic and/or contamination S abundance in theC grain, in some cases by a large factor. It is thus very likelythat the S in these other grains is dominated by contamination.
Because the S isotopic anomalies in the X grains are muchsmaller than in the C grain, contamination is more difficult todetect in the S ion images of the X grains. In grain a1–33–7(Figure 14) the ion images of CN and of S are not aligned withthe secondary electron image. The overall image is isotopicallynormal in S with !33S = 40‰ ± 36‰, !34S = 0‰ ± 15‰. Twospots with high S concentrations are located at the edges of thegrain and are most likely contamination. Both are isotopically
16

The Astrophysical Journal, 799:156 (23pp), 2015 February 1 Xu et al.
0.0001
0.001
0.01
0.1
1S/
Si
1 10 100 1000 1000012C/13C
X grains
Z grainsY grainsSi3N4 grainsX grainsC grain
Sola
ra1-33-7
a2-28-7
Figure 13. Atomic S/Si ratios of the grains of this study are plotted againsttheir C isotopic ratios. The lower point for the C grain is the S abundance forcontamination assumed to have normal S isotopic ratios. For the two X grainsa1–33–7 and a2–28–7 the lower points are the amounts of S calculated to havethe S isotopic composition predicted by the fit to the Si isotopic ratios if the restof the S is isotopically normal contamination.
normal: the left spot has !33S = $14‰ ± 69‰, !34S = 5‰ ±29‰ and the right spot !33S = 44‰ ± 75‰, !34S = $28‰ ±31‰. However, we found three areas with anomalies in 34S.These areas are indicated by the two circles and the ellipsein Figure 14. Their combined !-values are !33S = $47‰ ±107‰, !34S = $128‰ ± 43‰ (spot 1: !33S = 251‰ ± 280‰,!34S = $156‰ ± 96‰; spot 2: !33S = $252‰ ± 200‰,!34S = $101‰ ± 92‰; spot 3: !33S = $66‰ ± 138‰, !34S =$129‰ ± 56‰). Of course, the question arises whether theseanomalies can be the result of statistical fluctuations. The datado not support this possibility. The total area of the three spots isabout 5% of the total area of the grain indicated by the secondaryelectron image (Figure 14(f)) and the total 32S count in thesespots is about 9% of the 32S count in the whole image. Theanomaly in 34S is 3# , which would happen in only 0.4% of thecases if it is the result of statistical fluctuations. We thus give thisS isotopic composition as that of the grain in Table 1. This stillfalls short of the S !-values predicted by the fitting to the 12 M"model (Table 3 and Figure 11). If we explain this difference bycontamination with isotopically normal S, we would have to add6.2 times as much isotopically normal S to S with the isotopiccomposition predicted by the fitting from the Si isotopic ratios toobtain !33S = $111‰, !34S = $128‰. Since the isotopicallyanomalous region has only 9% of the total S, the S/Si ratio ofthe S with the predicted S isotopic composition would be only1.8% of the total (lower point in Figure 13).
Grain a2–28–7 is different in that the whole grain has ananomalous S isotopic composition with !33S = $118‰ ±23‰, !34S = $54‰ ± 10‰. Table 1 gives a somewhat moreanomalous composition of a sub-region (!33S = $144‰ ±39‰, !34S = $72‰ ± 17‰), which, however, agrees withthat of the whole grain within errors. Here again, we cancalculate how much isotopically normal S do we have to addto a grain with the !-values !33S = $675‰, !34S = $764‰
predicted from the fit to the 12 M" SN model (Table 3) inorder to obtained the measured overall composition. Sulfurof the predicted composition mixed with about 3.7 times asmuch isotopically normal S results in a composition of !33S =$144‰, !34S = $163‰, agreeing with the measured !33Svalue, but not the !34S value. To achieve agreement with the!34S value we have to add 9.5 as much isotopically normal S.Figure 13 shows the amount of S in the putative original grainas the lower symbol of grain a2–28–7 if we add an average offive times as much normal S.
To demonstrate the difficulties faced in such measurements,we show isotopic images of three more X grains. In graina1–22–4 (Figure 15), the CN signal is well aligned with thesecondary electron signal and the 14N/15N ratios is uniformacross the grain. Most of the S signal comes from a strip along theleft edge of the grain and is isotopically normal (!33S = 3‰ ±32‰ !34S = $23‰ ± 14‰). On the other hand, the area withinthe circle, centered on the CN and secondary electron images,has anomalous S (!33S = $87‰ ± 61‰, !34S = $56‰ ±24‰). Again, there is strong circumstantial evidence that the Sis dominated by contamination with terrestrial S.
Grain a1–48–1 is another grain with complex isotopic images(Figure 16). Although the 12C15N signal is highest at the edges,the 14N/15N ratio is uniform over the main grain at the value107. However, there is a small grain located above the maingrain, easily recognized by the 12C14N hotspot in Figure 16(a).This grain has 14N/15N = 1197, typical of mainstream grains.We do not know what fraction of the Si signal came from thisattached grain. Although it must have been small, the !29,30Sivalues of grain a1–48–1 given in Table 1 must be consideredupper limits. Most of the S signal comes from a ring aroundthe main grain and it is isotopically normal within 2# (!33S =115‰ ± 60‰, !34S = 5‰ ± 23‰). In contrast, the area withinthe circle has a 34S deficit (!33S = 182‰ ± 159‰, !34S =$124‰ ± 57‰).
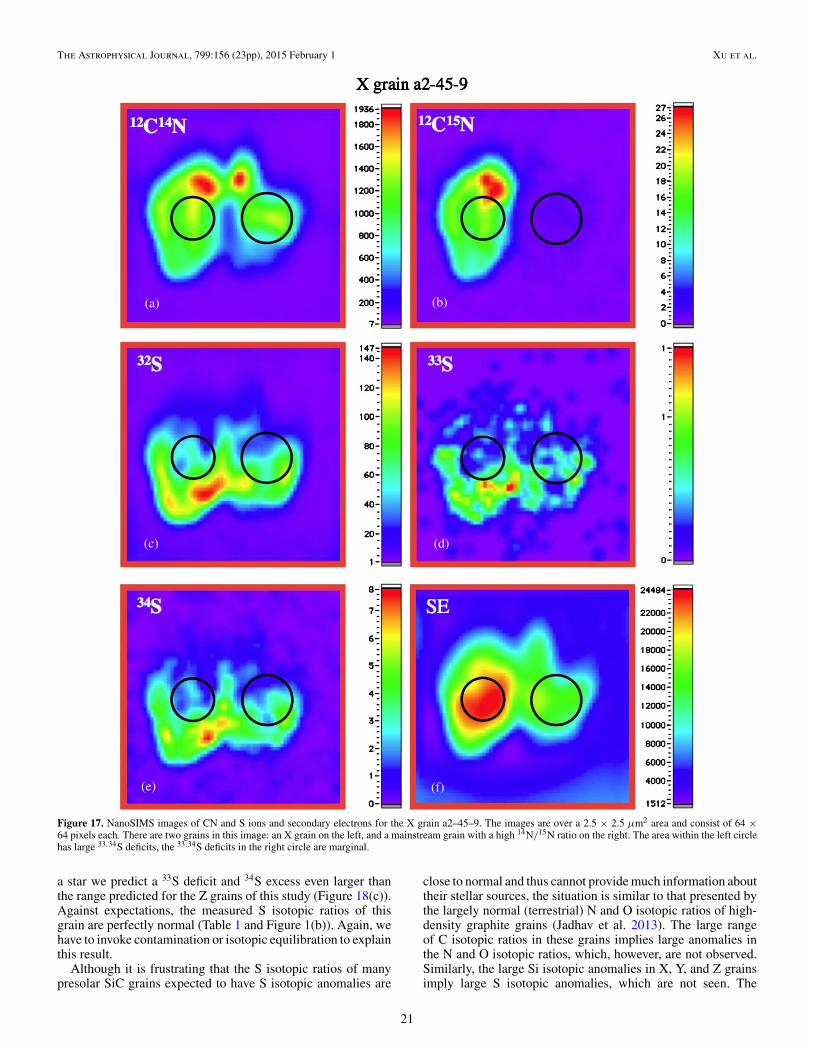
Finally, grain a2–45–9 is also complex. It consists of a maingrain on the left and a smaller grain on the right (Figure 17). Theseparation is clearly seen in the 12C15N image (Figure 17(b)).The main grain is the X grain with a 14N/15N ratio of 73,whereas the grain on the right has 14N/15N = 1369 and is mostlikely a mainstream grain. Again, because of the presence ofthe second grain, the !29,30Si values of this grain in Table 1must be considered upper limits. Most of the S signal comesfrom the lower edge of the grain and is isotopically normal. Thearea within the circle on the left is anomalous in S with !33S =$249‰ ± 109‰, !34S = $120‰ ± 49‰. Interestingly, thearea within the circle on the right is also anomalous (!33S =$98‰ ± 100‰, !34S = $74‰ ± 42‰), but not outside of 2# .
In summary, isotopic images are complex. In many cases, Ssignals appear to come from the edges of the grains, indicatingcontamination. These areas are almost always isotopicallynormal. Isotopic anomalies are found in areas with lower Sion signals but are still smaller than those expected on the basisof the Si isotopic ratios (Figure 3(c) and Table 3). Althoughwe cannot directly proof it, we believe that contamination withterrestrial S is the most likely explanation of this discrepancy.
3.3. One Y Grain and Five Z Grains
Only one Y grain and five Z grains were selected for N andS isotopic analysis. The Y grain has an extremely large 30Siexcess (!29Si/28Si = $154‰ ± 7‰, !30Si/28Si = 874‰ ±16‰) and all five Z grains have 30Si excesses larger than thoseof most other Z grains (see data base; Hynes & Gyngard 2009).
17

The Astrophysical Journal, 799:156 (23pp), 2015 February 1 Xu et al.
(a) (b)
(c) (d)
(e) (f)
Figure 14. NanoSIMS images of CN and S negative ions and secondary electrons for the X grain a1–33–7. The images are over a 2.5 % 2.5 µm2 area and consist of64 % 64 pixels each. In this and the next three figures, the color bars besides the images indicate counts pixel$1. The two black circles and the ellipse indicate areasisotopically anomalous in S. In contrast, the two areas with the strongest S signals are isotopically normal.
Presolar SiC grains of type Y and Z are thought to originatefrom low-mass AGB stars of 1/2 and 1/3 solar metallicity,respectively (Amari et al. 2001; Zinner et al. 2006); however,the Z grains of this study must have come from stars of evenlower metallicity. In Figure 18(a) we plot lines depicting theevolution of the Si isotopic ratios in AGB stars of 2 M" and3 M" and metallicity Z = 0.003, #1/6 of solar metallicity,and Z = 0.002, 1/10 of solar metallicity. The AGB models
we use are the Torino models described in detail by Gallinoet al. (1998) and Bisterzo et al. (2010). For predictions of the Siisotopic ratios we use the cross sections of Guber et al. (2003),which, as has been shown by Zinner et al. (2006), describe theSi isotopic ratios of Y and Z grains better than those of Bao et al.(2000). As can be seen, the 2 M" models do not reach the large!30Si/28Si values of our grains. Whereas almost all Z grains lieabove the M = 3 M" and Z = 0.003 line (Zinner et al. 2006),
18

The Astrophysical Journal, 799:156 (23pp), 2015 February 1 Xu et al.
(a) (b)
(c) (d)
(e) (f)
Figure 15. NanoSIMS images of CN and S ions and secondary electrons for the X grain a1–22–4. The images are over a 2 % 2 µm2 area and consist of 64 % 64 pixelseach. The area within the black circle has isotopically anomalous S.
all Z grains of this study and an additional previously studiedZ grain require a metallicity of Z = #0.002. As explained byZinner et al. (2006), we account for galactic evolution affectingthe initial Si and S isotopic compositions of stars of lower-than-solar metallicity by scaling the heavy isotopes with theFe abundances and by assuming that the abundances of the $-nuclei 28Si and 32Si increase with decreasing metallicity. For Z =0.003 and Z = 0.002, the resulting initial Si and S !-values are
–173‰ and –206‰, respectively. In Figure 18(a) we also plotthe predictions by the FRANEC Repository of Updated IsotopicTables and Yields (FRUITY) models for AGB stars with M =2 M" and 3 M" and Z = 0.003 (Cristallo et al. 2011). Not onlydo the FRUITY models not assume non-solar isotopic ratios forthe parent stars, the Si isotopic shifts predicted are much smallerthan those predicted by the Torino models, too small to explainthe Si isotopic ratios of the Z grains of this study.
19

The Astrophysical Journal, 799:156 (23pp), 2015 February 1 Xu et al.
(a) (b)
(c) (d)
(e) (f)
Figure 16. NanoSIMS images of CN and S ions and secondary electrons for the X grain a1–48–1. The images are over a 3 % 3 µm2 area and consist of 64 % 64 pixelseach. The area within the black circles has isotopically anomalous S. Above the main grain is a small attached grain with a high 14N/15N ratio (hotspot in panel (a)),most likely a mainstream grain.
In Figure 18(b) we show the AGB predictions for !30Si/28Siand !34S/32S values of the 3 M", Z = 0.003 and Z = 0.002models. The Z grains do not show the moderate 34S excessesexpected to correspond to their 30Si excesses. In Figure 18(c)we show the range of S isotopic ratios that would be predictedto correspond to their 30Si excesses. It is obvious that themeasured S isotopic ratios are quite different. While most of the
grains have close-to-normal ratios, it is puzzling that all grainshave 34S deficits, especially grain a1–17–4, whose low 34S/32Sratio cannot be explained by contamination with isotopicallynormal S.
The 30Si excess of Y grain a1–16–11 is much larger than anyof typical Y grains (Amari et al. 2001). An AGB star with Z =0.001 can reproduce the Si isotopic ratios of this grain. For such
20
The Astrophysical Journal, 799:156 (23pp), 2015 February 1 Xu et al.
(a) (b)
(c) (d)
(e) (f)
Figure 17. NanoSIMS images of CN and S ions and secondary electrons for the X grain a2–45–9. The images are over a 2.5 % 2.5 µm2 area and consist of 64 %64 pixels each. There are two grains in this image: an X grain on the left, and a mainstream grain with a high 14N/15N ratio on the right. The area within the left circlehas large 33,34S deficits, the 33,34S deficits in the right circle are marginal.
a star we predict a 33S deficit and 34S excess even larger thanthe range predicted for the Z grains of this study (Figure 18(c)).Against expectations, the measured S isotopic ratios of thisgrain are perfectly normal (Table 1 and Figure 1(b)). Again, wehave to invoke contamination or isotopic equilibration to explainthis result.
Although it is frustrating that the S isotopic ratios of manypresolar SiC grains expected to have S isotopic anomalies are
close to normal and thus cannot provide much information abouttheir stellar sources, the situation is similar to that presented bythe largely normal (terrestrial) N and O isotopic ratios of high-density graphite grains (Jadhav et al. 2013). The large rangeof C isotopic ratios in these grains implies large anomalies inthe N and O isotopic ratios, which, however, are not observed.Similarly, the large Si isotopic anomalies in X, Y, and Z grainsimply large S isotopic anomalies, which are not seen. The
21

The Astrophysical Journal, 799:156 (23pp), 2015 February 1 Xu et al.
Figure 18. Si and S isotopic ratios of Z grains of this study (solid diamonds) andgrains of previous studies whose S isotopes had been analyzed (open diamonds).The blue and red solid lines are predictions by the Torino models (Gallino et al.1998; Bisterzo et al. 2010) for AGB stars of 2 M" and 3 M" (top panel) and3 M" (lower panels) and metallicities Z = 0.002 and Z = 0.003. The green solidlines in panel (a) are predictions by the FRUITY model (Cristallo et al. 2011).The solid ellipse in Figure 6(c) is the range of S isotopic ratios predicted fromthe Si isotopic ratios of the grains (see text). As can be seen, the measured Sisotopic compositions do not agree with these model predictions.
S/Si ratios of Z grains are comparable to those of X grains(Figure 13). As for the X grains, the close-to-normal S isotopiccompositions of Z grains are most likely due to contaminationwith terrestrial S.
4. CONCLUSIONS
1. During a C–Si isotopic automatic-grain-mode search of1113 presolar SiC grains from the Murchison meteorite weidentified 1 C grain, 16 X grains, 1 Y grain, 5 Z grains, and2 X-type Si3N4 grains, which we analyzed in more detail,including S isotopic analyses of all selected grains.
2. The C grain has a large 32S excess, larger than that predictedfor the Si/S zone of core–collapse SNe. This is evidenceagainst the fractionation model by Hoppe et al. (2012). Amuch more likely explanation is a radiogenic origin of the32S excess from the decay of short-lived 32Si. Both the12 M" SN model by Woosley & Heger (2007) and the 15rand 15r4 SN models by Pignatari et al. (2013c) have C-richregions with high 32Si abundances produced by neutroncapture at high neutron densities and can explain the 32Sexcesses together with the large 29,30Si/28Si ratios and the12C/13C ratios of C grains. The Pignatari et al. model givesa better fit to the 29,30Si/28Si ratios of the C grain. However,it cannot match simultaneously its C and N isotopic ratios.Both models can explain all the other isotopic ratios of thegrain. Except for radiogenic 32S, intrinsic S concentrationsare extremely low and contamination with isotopicallynormal S affects the measured ratios.
3. The C, Si, N, inferred 26Al/27Al, and 44Ti/48Ti ratios in Xgrains are comparable to those found in previous studies.Sulfur isotopic ratios show, on average, 32S excesses, butthese are much smaller than expected, and contaminationmust be invoked to explain the data. The 32S excesses favorconventional SN models with 28Si production by O burning(e.g., Rauscher et al. 2002; Woosley & Heger 2007) overthe explosive SN model by Pignatari et al. (2013b) with 28Siproduction by a chain of $-captures. The 12 M" SN modelby Woosley & Heger (2007) also gives a better fit to the Nand Al isotopic ratios of the grains than the Pignatari et al.model. On the other hand, the reader should be remindedthat the Pignatari et al. (2013b) model avoids the problemwith the missing 54Fe excesses in SiC X grain faced bymixing models with the Si/S zone.
4. The extremely large 30Si excesses in the Y and the Z grainsof this study imply an origin in low-mass AGB stars withmetallicities between 0.001 and 0.002. The S isotopic ratiospredicted for such stars are not found in the grains and,again, contamination must be invoked. The relatively low12C/13C ratios of the grains are explained by extra mixing(cool bottom processing).
Y.X. is grateful to the Laboratory for Space Sciences and thePhysics Department of Washington University for their kind andfriendly support during all stages of isotopic analysis and dataprocessing. We thank Sachiko Amari for sample preparation,Frank Gyngard for assistance with NanoSIMS analysis, EvanGroopman for help with the AGB models, and Peter Hoppefor providing information on the S/Si ratios in C grains. Thiswork was supported by NASA (grant NNX11AH14G, E.Z.)and the Natural Science Foundation of China (40830421, Y.X.and Y.L.). A.H. was supported by an ARC Future Fellowship(FT120100363). M.P. acknowledges the support to NuGridfrom NSF grants PHY 02-16783 and PHY 09-22648 (JointInstitute for Nuclear Astrophysics, JINA) and EU MIRG-CT-2006-046520, from the Ambizione grant of the SNSF andthe SNF grant 200020-132816 (Switzerland) and Eurogenesis(MASCHE).
REFERENCES
Amari, S., Hoppe, P., Zinner, E., & Lewis, R. S. 1995, Metic, 30, 679Amari, S., Lewis, R. S., & Anders, E. 1994, GeCoA, 58, 459Amari, S., Nittler, L. R., Zinner, E., et al. 2001, ApJ, 546, 248Bao, Z. Y., Beer, H., Kappeler, F., et al. 2000, ADNDT, 76, 70Bernatowicz, T. J., Amari, S., & Lewis, R. S. 1992, LPSC, 23, 91Besmehn, A., & Hoppe, P. 2003, GeCoA, 67, 4693
22

The Astrophysical Journal, 799:156 (23pp), 2015 February 1 Xu et al.
Bisterzo, S., Gallino, R., Straniero, O., Cristallo, S., & Kappeler, F.2010, MNRAS, 404, 1529
Blake, J. B., & Schramm, D. N. 1976, ApJ, 209, 846Bojazi, M. J., & Meyer, B. S. 2014, PhRvC, 89, 025807Clayton, D. D., & Nittler, L. R. 2004, ARA&A, 42, 39Cristallo, S., Piersanti, L., Straniero, O., et al. 2011, ApJS, 197, 17Davis, A. M. 2011, PNAS, 108, 19142Farouqi, K., Kratz, K.-L., & Pfeiffer, B. 2009, PASA, 26, 194Fryer, C. L., Belczynski, K., Wiktorowicz, G., et al. 2012, ApJ, 749, 91Gallino, R., Arlandini, C., Busso, M., et al. 1998, ApJ, 497, 388Grefenstette, B. W., Harrison, F. A., Boggs, S. E., et al. 2014, Natur,
506, 339Groopman, E., Bernatowicz, T., & Zinner, E. 2012, ApJL, 754, L8 (6pp)Guber, K. H., Koehler, P. E., Derrien, H., et al. 2003, PhRvC, 67, 062802Gyngard, F., Amari, S., Zinner, E., & Ott, U. 2009, ApJ, 694, 359Gyngard, F., Nittler, L. R., & Zinner, E. 2010a, M&PSA, 45, A72Gyngard, F., Orthous-Daunay, F.-R., Zinner, E., & Moynier, F. 2012, M&PSA,
47, 5255Gyngard, F., Zinner, E., Nittler, L. R., et al. 2010b, ApJ, 717, 107Hammer, N. J., Janka, H.-T., & Muller, E. 2010, ApJ, 714, 1371Henkel, T., Stephan, T., Jessberger, E. K., et al. 2007, M&PS, 42, 1121Hoppe, P., Fujiya, W., & Zinner, E. 2012, ApJL, 745, L26Huss, G. R., & Lewis, R. S. 1995, GeCoA, 59, 115Hynes, K. M., Croat, T. K., Amari, S., Mertz, A. F., & Bernatowicz, T. J. 2010,
M&PS, 45, 596Hynes, K. M., & Gyngard, F. 2009, LPSC, 40, 1198Iliadis, C., Longland, R., Champagne, A. E., Coc, A., & Fitzgerald, R. 2010,
NuPhA, 841, 31Jadhav, M., Zinner, E., Amari, S., et al. 2013, GeCoA, 113, 193Joggerst, C. C., Woosley, S. E., & Heger, A. 2009, ApJ, 693, 1780Kifonidis, K., Plewa, T., Janka, H.-T., & Muller, E. 2003, A&A, 408, 621Lin, Y. T., Gyngard, F., & Zinner, E. 2010, ApJ, 709, 1157Lodders, K., & Amari, S. 2005, ChEG, 65, 93Lugaro, M., Davis, A. M., Gallino, R., et al. 2003, ApJ, 593, 486Magkotsios, G., Timmes, F. X., Hungerford, A. L., et al. 2010, ApJS,
191, 66
Marhas, K. K., Amari, S., Gyngard, F., Zinner, E., & Gallino, R. 2008, ApJ,689, 622
Messenger, S., Keller, L. P., Stadermann, F. J., Walker, R. M., & Zinner, E.2003, Sci, 300, 105
Meyer, B. S., & Bojazi, M. J. 2011, LPSC, 42, 2376Meyer, B. S., Clayton, D. D., & The, L. S. 2000, ApJL, 540, L49Meyer, B. S., Weaver, T. A., & Woosley, S. E. 1995, Metic, 30, 325Muller, E., Fryxell, B., & Arnett, D. 1991, A&A, 251, 505Nittler, L. R. 2003, E&PSL, 209, 259Nittler, L. R., & Hoppe, P. 2005, ApJL, 631, L89Orthous-Daunay, F.-R., Gyngard, F., Moynier, F., & Zinner, E. 2012, LPSC, 43,
2697Pellin, M. J., Davis, A. M., Lewis, R. S., Amari, S., & Clayton, R. N. 1999,
LPSC, 30, 1969Pignatari, M., Herwig, F., Hirschi, F., et al. 2013a, arXiv1307.6961PPignatari, M., Wiescher, M., Timmes, F. X., et al. 2013b, ApJL, 767, L22Pignatari, M., Zinner, E., Bertolli, M. G., et al. 2013c, ApJL, 771, L7Rauscher, T., Heger, A., Hoffman, R. D., & Woosley, S. E. 2002, ApJ,
576, 323Slodzian, G., Hillion, F., Stadermann, F. J., & Zinner, E. 2004, ApSS, 231, 874Stadermann, F. J., Hoppe, P., Floss, C., et al. 2008, M&PS, 43, 299Timmes, F. X., Woosley, S. E., Hartmann, D. H., & Hoffman, R. D. 1996, ApJ,
464, 332Travaglio, C., Gallino, R., Amari, S., et al. 1999, ApJ, 510, 325Woosley, S. E., & Heger, A. 2007, PhR, 442, 269Woosley, S. E., Heger, A., Cumming, A., et al. 2004, ApJS, 151, 75Woosley, S. E., & Weaver, T. A. 1995, ApJS, 101, 181Xu, Y. C., Amari, S., Gyngard, F., Zinner, E., & Lin, Y. 2012, M&PS, 47, 5104Yada, T., Floss, C., Stadermann, F. J., et al. 2008, M&PS, 43, 1287Yoshida, T. 2007, ApJ, 666, 1048Zinner, E. 2014, in Treatise on Geochemistry Vol 1.4, ed. H. D. Holland, K. K.
Turekian, & A. Davis (2nd ed.; Oxford: Elsevier), 181Zinner, E., Amari, S., Guinness, R., et al. 2007, GeCoA, 71, 4786Zinner, E., & Jadhav, M. 2013, ApJ, 768, 100Zinner, E., Jadhav, M., Gyngard, F., & Nittler, L. R. 2011, LPSC, 42, 1070Zinner, E., Nittler, L. R., Gallino, R., et al. 2006, ApJ, 650, 350
23