Embed Size (px)
Citation preview
P
D
E
Re
S
Re
SR1C16
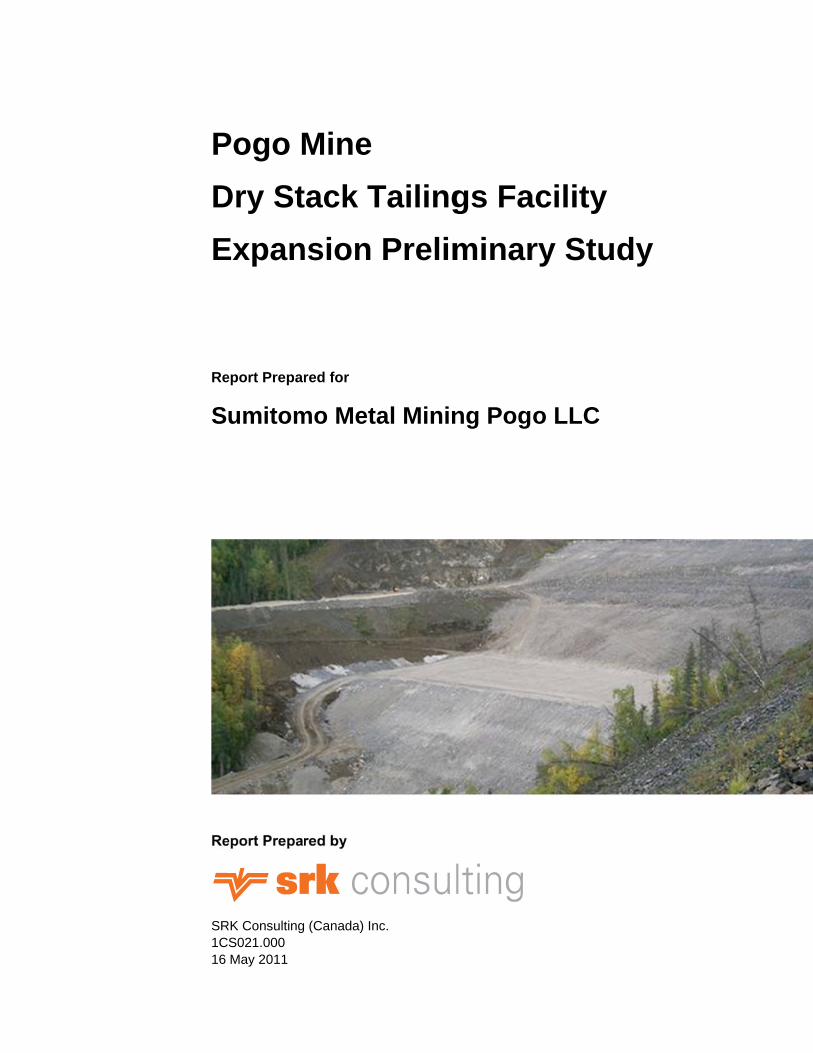
Pogo M
Dry St
Expan
eport Prepar
umitom
eport Prepar
RK ConsultingS021.000 May 2011
Mine
tack T
nsion
red for
mo Meta
red by
(Canada) Inc
Tailing
Prelim
al Minin
c.
gs Fa
minar
ng Pog
acility
ry Stu
o LLC
udy
SRK Consulting Pogo Mine - Dry Stack Tailings Facility Expansion Preliminary Study Page i
LEB/cl 2011 PogoMine_DSTFExpansionStudyReport_1CS021 000_LEB_TM_20110516_FNL Month Year
Pogo Mine
Dry Stack Tailings Facility Expansion Preliminary Study
Sumitomo Metal Mining Pogo LLC P.O. Box 145 Delta Junction, Alaska 99737
SRK Consulting (Canada) Inc. Suite 2200 – 1066 West Hastings Street Vancouver, BC V6E 3X2 e-mail: [email protected] website: www.srk.com Tel: +1.604.681.4196 Fax: +1.604.687.5532 SRK Project Number 1CS021.000 May 2011 Author: Lois Boxill P.E. Senior Geotechnical Engineer Peer Reviewed by: Terry Mandziak, P.E. Senior Civil Engineer
SRK Consulting Pogo Mine - Dry Stack Tailings Facility Expansion Preliminary Study Page ii
LEB/cl 2011 PogoMine_DSTFExpansionStudyReport_1CS021 000_LEB_TM_20110516_FNL May 2011
Table of Contents
Disclaimer .................................................................................................................................... iv
Copyright ..................................................................................................................................... iv
1 Introduction and Scope of Report .............................................................................. 1
2 DSTF Material Balance Update ................................................................................... 2
2.1 Procedure ............................................................................................................................ 2
2.1.1 Key Assumptions ...................................................................................................... 2
2.2 Results ................................................................................................................................ 3
2.3 Key Findings ....................................................................................................................... 4
3 Preliminary Assessment of Expanded DSTF ............................................................. 5
4 Structural Stability of Expanded DSTF ...................................................................... 5
4.1 Introduction ......................................................................................................................... 5
4.1.1 Design Criteria .......................................................................................................... 6
4.2 Approach ............................................................................................................................. 6
4.3 Material Strength Parameters ............................................................................................. 7
4.3.1 Phreatic Surface ..................................................................................................... 10
4.3.2 Pseudo-static Evaluation ........................................................................................ 10
4.4 Stability Analysis ............................................................................................................... 10
4.4.1 Results .................................................................................................................... 11
4.5 Conclusions ....................................................................................................................... 15
5 Recommendations for Future Work ......................................................................... 15
5.1 Recommendations for Detailed Engineering Design ........................................................ 15
5.2 Recommendations for Best Practices ............................................................................... 16
6 Closure ........................................................................................................................ 18
7 References .................................................................................................................. 19
SRK Consulting Pogo Mine - Dry Stack Tailings Facility Expansion Preliminary Study Page iii
LEB/cl 2011 PogoMine_DSTFExpansionStudyReport_1CS021 000_LEB_TM_20110516_FNL May 2011
List of Tables Table 4.1: Design Criteria for Stability Analyses ............................................................................... 6
Table 4.2: Material Parameters Used for Stability Analysis of Expanded DSTF ............................... 9
Table 4.3: Frictional Strength of Filtered Tailings Used for Stability Analysis ................................. 11
Table 4.4: Factor of Safety with Water Table 10 feet Below Ground .............................................. 12
Table 4.5: Factor of Safety with Water Table at Original Ground .................................................... 12
Table 4.6: Factor of Safety with Elevated Water Table ................................................................... 13
Table 5.1: Recommended Work to Support Detailed Design of DSTF ........................................... 17
List of Figures Figure 1: Storage Elevation Curve for DSTF ..................................................................................... 3
Figure 2: Estimated Rate of Rise of the DSTF .................................................................................. 4
Figure 3: Variation of Factor of Safety with Peak Ground Acceleration for Deep Rotational Failure through the GPA ............................................................................................................. 14
Figure 4: Preliminary Piezometer Locations .................................................................................... 16
Appendices Appendix A: Updated DSTF Material Balance
Appendix B: Stability Analysis Results
SRK Consulting Pogo Mine - Dry Stack Tailings Facility Expansion Preliminary Study Page iv
LEB/cl 2011 PogoMine_DSTFExpansionStudyReport_1CS021 000_LEB_TM_20110516_FNL May 2011
Disclaimer The opinions expressed in this Report have been based on the information supplied to SRK
Consulting (Canada) Inc. (SRK) by Sumitomo Metal Mining Pogo LLC (SMMP). These opinions
are provided in response to a specific request from SMMP to do so, and are subject to the contractual
terms between SRK and SMMP. SRK has exercised all due care in reviewing the supplied
information. Whilst SRK has compared key supplied data with expected values, the accuracy of the
results and conclusions from the review are entirely reliant on the accuracy and completeness of the
supplied data. SRK does not accept responsibility for any errors or omissions in the supplied
information and does not accept any consequential liability arising from commercial decisions or
actions resulting from them. Opinions presented in this report apply to the site conditions and
features as they existed at the time of SRK’s investigations, and those reasonably foreseeable. These
opinions do not necessarily apply to conditions and features that may arise after the date of this
Report.
Copyright This report is protected by copyright vested in SRK Consulting Canada Inc. It may not be
reproduced or transmitted in any form or by any means whatsoever to any person without the written
permission of the copyright holder, SRK.
SRK Consulting Pogo Mine - Dry Stack Tailings Facility Expansion Preliminary Study Page 1
LEB/cl 2011 PogoMine_DSTFExpansionStudyReport_1CS021 000_LEB_TM_20110516_FNL May 2011
1 Introduction and Scope of Report In January 2011, SRK Consulting Inc. (SRK) was retained by Sumitomo Metal Mining Pogo LLC
(hereafter SMMP) to complete preliminary study of proposed expansion of Pogo Mine’s Dry Stack
Tailings facility (DSTF) to a total capacity of approximately 20 M tons. The primary objectives of
the study were to:
Develop configurations to expand the capacity of the existing DSTF; and
Analyse the stability of the expanded facility.
This report was prepared to support internal decision making associated with the proposed DSTF
expansion and facilitate conversations with the appropriate regulatory agencies in advance of
SMMP’s submittal of a request to the regulators to permit expansion of the current DSTF. SRK’s
scope included the following:
Updating the existing mass balance for the DSTF with information from the September 2010 topographic survey and preparing annual section and plan views for placement of waste rock and tailings materials in the DSTF through the end of 2017;
Preparing plan and section views for expansion of the DSTF up to a storage volume of 20 M tons of combined waste rock and tailings. Drawings include recommended alignment for new diversion ditches and extension of the existing finger drains;
Completing stability analysis for the 20 M ton configuration of the DSTF. This analysis accounted for original design criteria, field and laboratory test data obtained during 2009 and 2010 for tailings material placed within the General Placement Area (GPA) of the DSTF, and assessed potential impacts on stability resulting from possible variability in tailings friction angle and phreatic surface within the facility; and
Providing recommendations for work to be completed both in support of the detailed engineering design of the expanded DSTF and to maintain best operating and management practice in the DSTF.
Key documents reviewed to complete this work included the following:
Mass balance for tailings and waste rock production through 2017 prepared by SMMP;
Original design report for the DSTF that was prepared by AMEC in 2004 (AMEC 2004a); and
Discussion about seismic design criteria for site infrastructure included in the Pogo Project Feasibility Study (Teck-Pogo 2004).
The results of the work completed as part of this study are summarized and presented in this report.
Furthermore it should be noted that final year-round construction recommendations for the expanded
DSTF will be provided in two separate technical memos that will be prepared after completion of
each phase of a field verification program that was developed to provide recommendations for
construction procedures to be included in a revised Construction and Maintenance Manual for the
DSTF. The first phase of the field and laboratory test program was completed in March 2011 to
verify material properties (including friction angle from Direct Shear testing), and to measure the
degree of compaction achieved for filtered tailings material placed during the winter period. The
second phase of the program will be completed during summer 2011 to complement the winter
program. The results of both programs will form a basis for recommending any modifications to
current construction methods used for year round placement of materials in the DSTF.
SRK Consulting Pogo Mine - Dry Stack Tailings Facility Expansion Preliminary Study Page 2
LEB/cl 2011 PogoMine_DSTFExpansionStudyReport_1CS021 000_LEB_TM_20110516_FNL May 2011
2 DSTF Material Balance Update The updated material balance accounts for the Life-of-Mine (LOM) plan developed by SMMP in
January 2010 which provides estimated quantities of filtered tailings and waste rock (Potentially
Acid Generating (PAG)/Red Rock and Not Potentially Acid Generating (NPAG)/Green Rock) to be
produced at the mine through 2017. The updated material balance assumes that the mine life extends
to at least 2017 and will have a milling rate of 920,000 tons per year (tpy). All waste rock, in
addition to 60% of the filtered tailings, will be placed in the DSTF. The current LOM plan also
anticipates use of a reduced quantity of filtered tailings to construct the facility’s shell based on the
projected availability of Green Rock. As a result, the construction of Shell 1 is entirely from green
rock, as is the outer surface of Shell 2 and Shell 3. As will be described in Section 4 of this report,
use of rock in shell construction has enhanced and increased stability of the DSTF over the original
design configurations analyzed by AMEC in which the shell of the DSTF was entirely comprised of
compacted tailings (AMEC 2004a).
2.1 Procedure The total volume of material stored in the DSTF through September 2010 was estimated using the
as-built survey from September 2009 and September 2010 provided by SMMP. By comparing the
as-built survey from 2009 and 2010, the incremental volume of material placed in the DSTF was
calculated and entered into the Excel-based material balance. A print out of the updated mass
balance is presented in Appendix A of this report.
Consistent with current construction design and operational experience gained since 2008 the
material balance assumes that there is a 2:1 split between green rock and red rock placed in the
DSTF and an almost 5:1 split between filtered tailings placed in the GPA and filtered tailings used to
construct the composite shells (Shell 2, and Shell 3). The average difference between total DSTF
volumes calculated using survey data and total volume estimates calculated using truck count data is
3 percent. This suggests that truck count data using the indicated material densities provides a
reasonable volumetric estimate of material placed in the DSTF. Furthermore, good reconciliation
between the two total volume estimates between 2006 and 2009 suggests that assumed densities of
filtered tailings and waste rock are reasonable for purposes of volume determination.
Using the surveyed crest elevation for Shell 1 and the as-built survey of the GPA surface through
September 2010, SRK used AutoCAD Civil 3D® to estimate additional volumes of material placed
in both Shell 1 and the GPA since September 2009. Using estimated quantities of filtered tailings
and waste rock to be placed in the DSTF provided by SMMP, annual material deposition plans
(presented on Drawings 1 through 8) were developed using the material densities assumed in the
material balance.
2.1.1 Key Assumptions
The annual plans were developed assuming the following:
Shell 1 would continue to be constructed from compacted green rock and have a width of 100 feet;
SRK ConsultinPogo Mine - D
LEB/cl
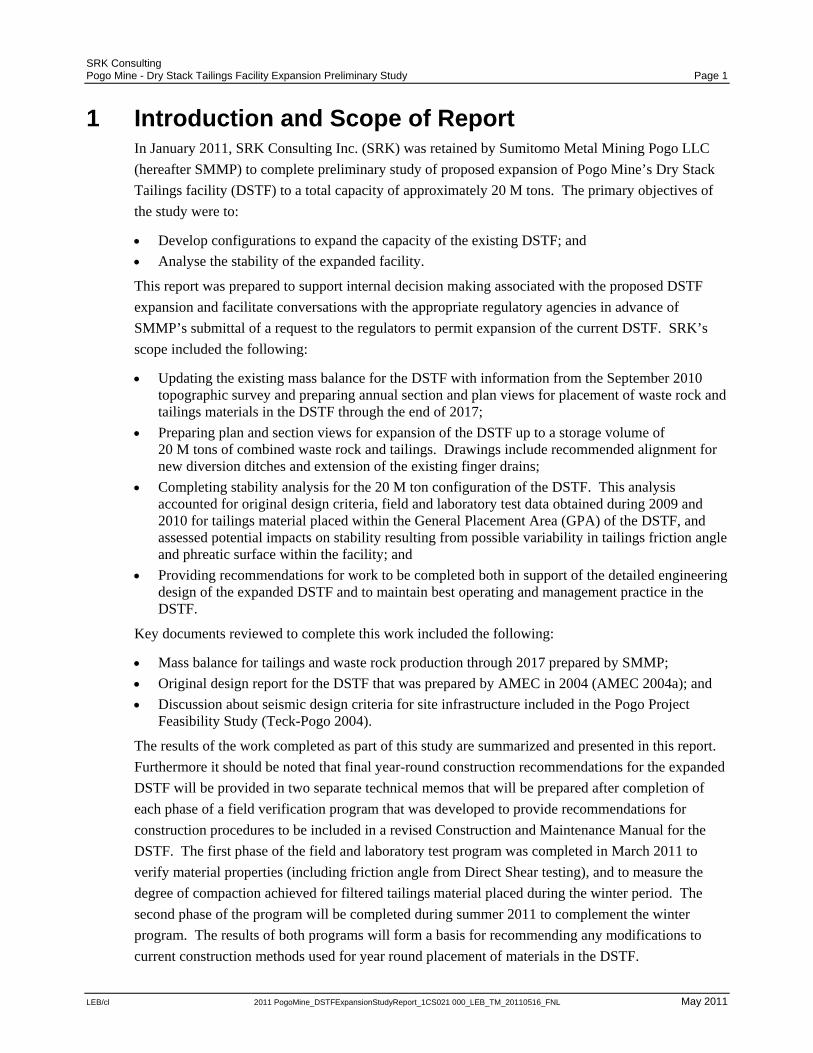
2.2 ReGra
201
S:\Pog
Fig
ng Dry Stack Tailings
A combinatiGPA. All rewould be uswithin the G
Volumes of equally divi
Shell 2 wouto the downs
Shell 3 wouto the downs
The surface surfaces of t
A 3H: 1V sl
Existing flow
The north anthe raised D
esults aphic presenta
17 are present
go\1CS021.000_Dry Sta
gure 1: Stor
s Facility Expans
2011 PogoMin
ion of red roced rock placedsed to create aGPA;
filtered tailinded and used
ld be 180 feetstream slope
ld be 150 feetstream slope
of the GPA, the DSTF;
lope will be u
w through dra
nd south diveSTF.
ations of the s
ted in Figures
ack TF Expansion\Task
rage Elevati
sion Preliminary
ne_DSTFExpansionStu
ck, filtered taid in the GPA
a buffer zone
ngs not used fduring const
t wide and coof a 160 foot
t wide and coof a 130 foot
and of all She
used for all DS
ains would be
rsion ditch w
storage elevat
s 1 and 2 resp
005_Reporting\Report\F
ion Curve fo
Study
udyReport_1CS021 0
ilings and grewould be encbetween the o
for paste prodruction of Sh
onsist of a 20 wide layer of
onsist of a 20 wide layer of
ells would ha
STF shells, co
e extended be
would be reloc
tion curves an
pectively.
Figures\ Figures 1_and_2
or DSTF
000_LEB_TM_201105
een rock woulcapsulated byoriginal valle
duction or plachell 2 and She
foot wide layf compacted f
foot wide layf compacted f
ave a slope of
onsistent with
eneath the exp
cated to maint
nd estimated
2_Storage Elevation cur
16_FNL
ld continue toy filtered tailiy walls and m
cement in theell 3;
yer of green rofiltered tailing
yer of green rofiltered tailing
f 2% to mitiga
h original des
panded DSTF
tain freshwate
rate of rise fo
rves from updated Mass
M
o be placed inngs, and gree
materials plac
e GPA would
ock placed adgs;
ock placed adgs;
ate ponding on
ign criteria;
F footprint; an
er diversion a
or the DSTF t
Balance.xlxs
Page 3
May 2011
the en rock ed
be
djacent
djacent
n
nd
around
through
SRK ConsultinPogo Mine - D
LEB/cl
Fig
and
DS
app
the
cur
bel
S:\Pog
Fig
Ass
upd
ass
of a
esti
the
2.3 KeDu
not
ng Dry Stack Tailings
gure 1 indicate
d compacted i
TF over its el
proximately 9
end of 2017.
rrent capacity
ow the crest o
go\1CS021.000_Dry Sta
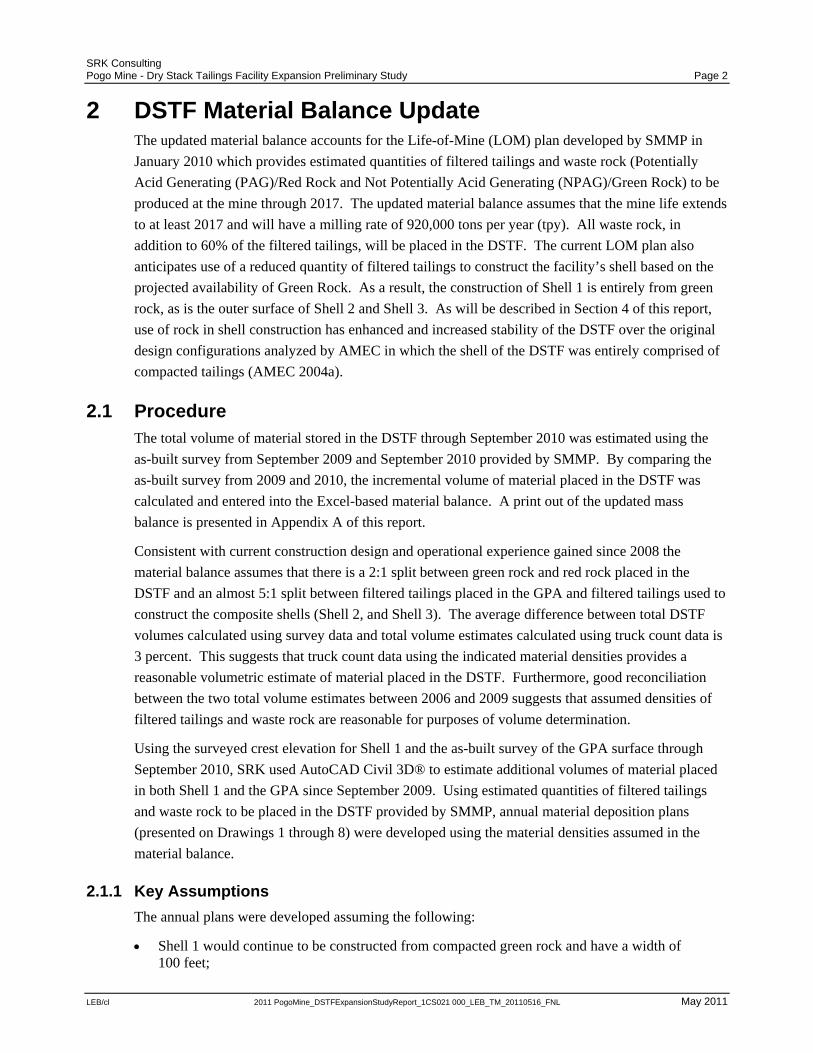
gure 2: Estim
suming that m
dated materia
umed in the m
approximately
imated as 12
anticipated r
ey Findinring the cours
ted the follow
The surface the end of 2
s Facility Expans
2011 PogoMin
es approxima
in the GPA th
levation at the
9.8 M tons of
Both Figure
the crest elev
of Shell 1 and
ack TF Expansion\Task
mated Rate
material produ
l balance, and
mass balance,
y 10 feet per
feet/year and
rate of rise for
gs se of preparin
wing:
elevation of t013. The nor
sion Preliminary
ne_DSTFExpansionStu
ately 85 M cub
hrough the en
e end of 2010
combined wa
e 1 and Drawi
vations of She
d the GPA sur
005_Reporting\Report\F
e of Rise of
uction and dis
d that the com
, it is anticipa
year while th
15 feet/year
r the various c
ng the annual
the GPA surprth diversion d
Study
udyReport_1CS021 0
bic feet of com
d of 2017 res
0. The 2010 L
aste rock and
ing 8 indicate
ell 2 and Shel
rface if the pr
Figures\ Figures 1_and_2
the DSTF
stribution are
mpacted densi
ated that the cr
he rate of rise
respectively.
components o
material plac
passed the eleditch would b
000_LEB_TM_201105
mbined waste
sulting in a 68
Life-of-Mine
filtered tailin
e that as the D
ll 3 will gener
roposed raise
2_Storage Elevation cur
consistent wi
ity of placed m
rest of Shell
of the crests o
Figure 2 pro
of the DSTF.
cement plans
evation of the be similarly su
16_FNL
e rock and tai
8 foot rise of t
plan anticipa
ngs will be sto
DSTF is expan
rally be appro
configuration
rves from updated Mass
ith those pres
material is co
1 and the GPA
of Shell 2 and
ovides a graph
for the 2010 L
existing souturpassed by t
M
ilings will be
the crest of th
ates that a tota
ored in the DS
nded beyond
oximately 200
ns are implem
Balance.xlxs
sented in the
onsistent with
A will rise at
d Shell 3 are
hic representa
LOM plan, S
th diversion dthe end of 201
Page 4
May 2011
placed
he
al of
STF by
its
0 feet
mented.
values
a rate
ation of
RK
ditch at 14.
SRK Consulting Pogo Mine - Dry Stack Tailings Facility Expansion Preliminary Study Page 5
LEB/cl 2011 PogoMine_DSTFExpansionStudyReport_1CS021 000_LEB_TM_20110516_FNL May 2011
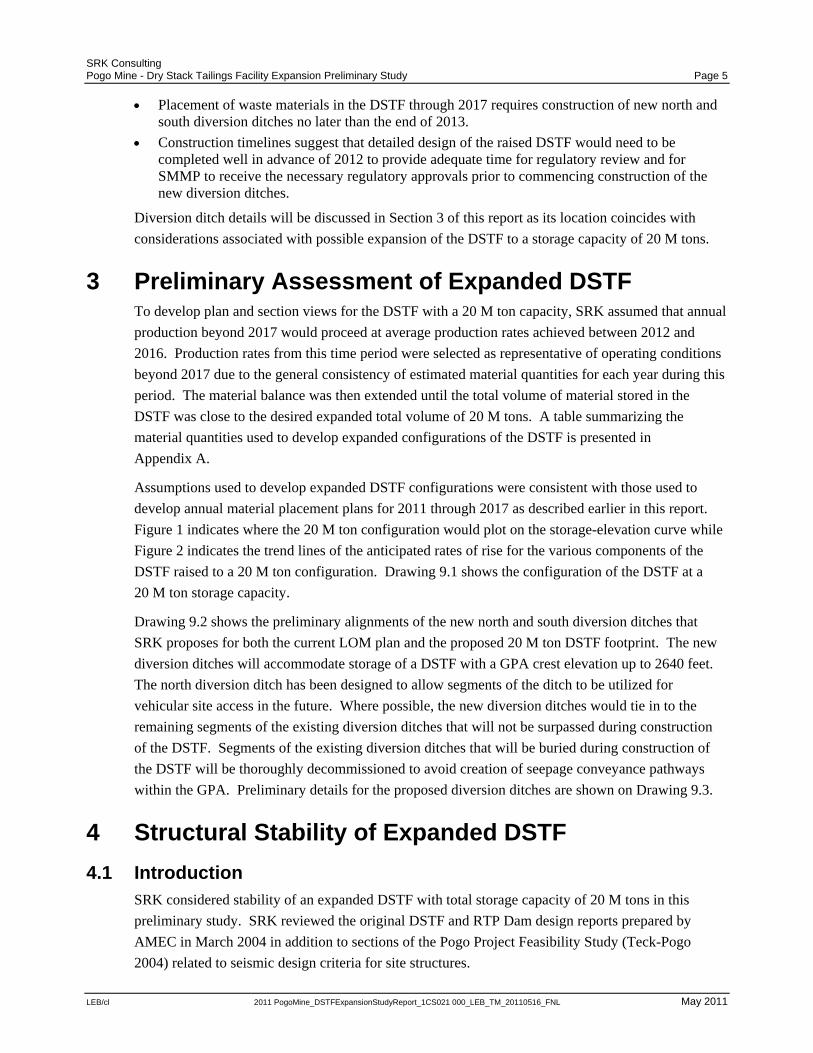
Placement of waste materials in the DSTF through 2017 requires construction of new north and south diversion ditches no later than the end of 2013.
Construction timelines suggest that detailed design of the raised DSTF would need to be completed well in advance of 2012 to provide adequate time for regulatory review and for SMMP to receive the necessary regulatory approvals prior to commencing construction of the new diversion ditches.
Diversion ditch details will be discussed in Section 3 of this report as its location coincides with
considerations associated with possible expansion of the DSTF to a storage capacity of 20 M tons.
3 Preliminary Assessment of Expanded DSTF To develop plan and section views for the DSTF with a 20 M ton capacity, SRK assumed that annual
production beyond 2017 would proceed at average production rates achieved between 2012 and
2016. Production rates from this time period were selected as representative of operating conditions
beyond 2017 due to the general consistency of estimated material quantities for each year during this
period. The material balance was then extended until the total volume of material stored in the
DSTF was close to the desired expanded total volume of 20 M tons. A table summarizing the
material quantities used to develop expanded configurations of the DSTF is presented in
Appendix A.
Assumptions used to develop expanded DSTF configurations were consistent with those used to
develop annual material placement plans for 2011 through 2017 as described earlier in this report.
Figure 1 indicates where the 20 M ton configuration would plot on the storage-elevation curve while
Figure 2 indicates the trend lines of the anticipated rates of rise for the various components of the
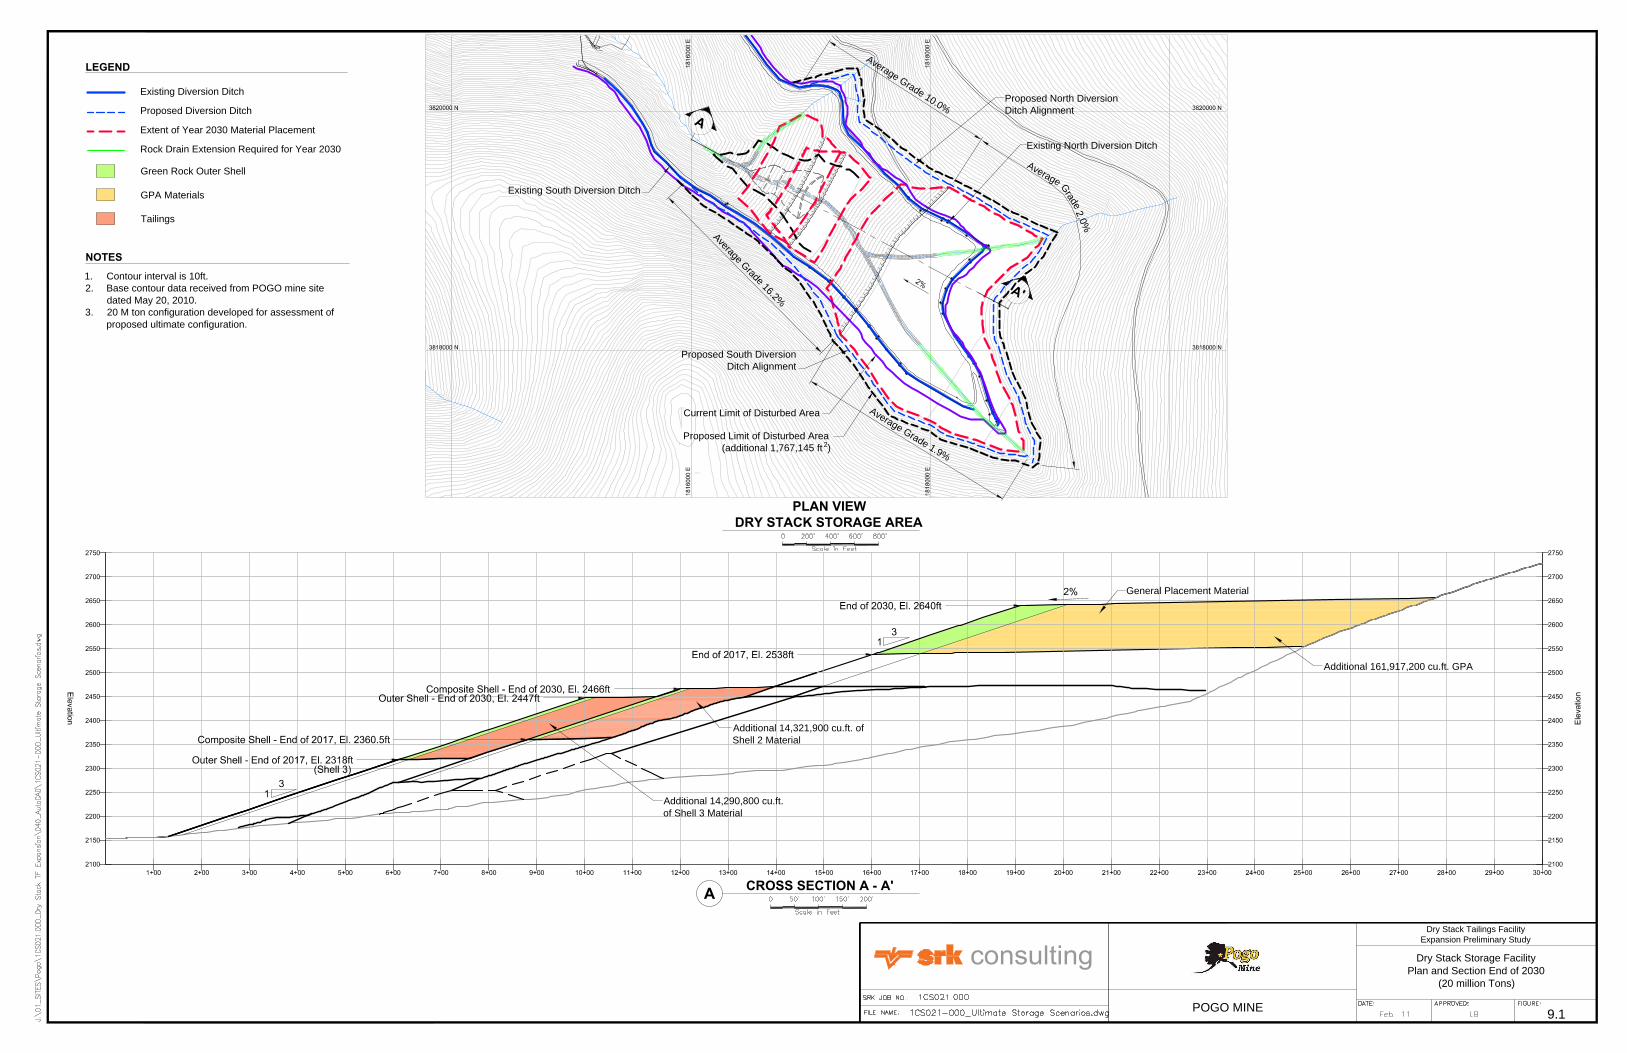
DSTF raised to a 20 M ton configuration. Drawing 9.1 shows the configuration of the DSTF at a
20 M ton storage capacity.
Drawing 9.2 shows the preliminary alignments of the new north and south diversion ditches that
SRK proposes for both the current LOM plan and the proposed 20 M ton DSTF footprint. The new
diversion ditches will accommodate storage of a DSTF with a GPA crest elevation up to 2640 feet.
The north diversion ditch has been designed to allow segments of the ditch to be utilized for
vehicular site access in the future. Where possible, the new diversion ditches would tie in to the
remaining segments of the existing diversion ditches that will not be surpassed during construction
of the DSTF. Segments of the existing diversion ditches that will be buried during construction of
the DSTF will be thoroughly decommissioned to avoid creation of seepage conveyance pathways
within the GPA. Preliminary details for the proposed diversion ditches are shown on Drawing 9.3.
4 Structural Stability of Expanded DSTF
4.1 Introduction SRK considered stability of an expanded DSTF with total storage capacity of 20 M tons in this
preliminary study. SRK reviewed the original DSTF and RTP Dam design reports prepared by
AMEC in March 2004 in addition to sections of the Pogo Project Feasibility Study (Teck-Pogo
2004) related to seismic design criteria for site structures.
SRK Consulting Pogo Mine - Dry Stack Tailings Facility Expansion Preliminary Study Page 6
LEB/cl 2011 PogoMine_DSTFExpansionStudyReport_1CS021 000_LEB_TM_20110516_FNL May 2011
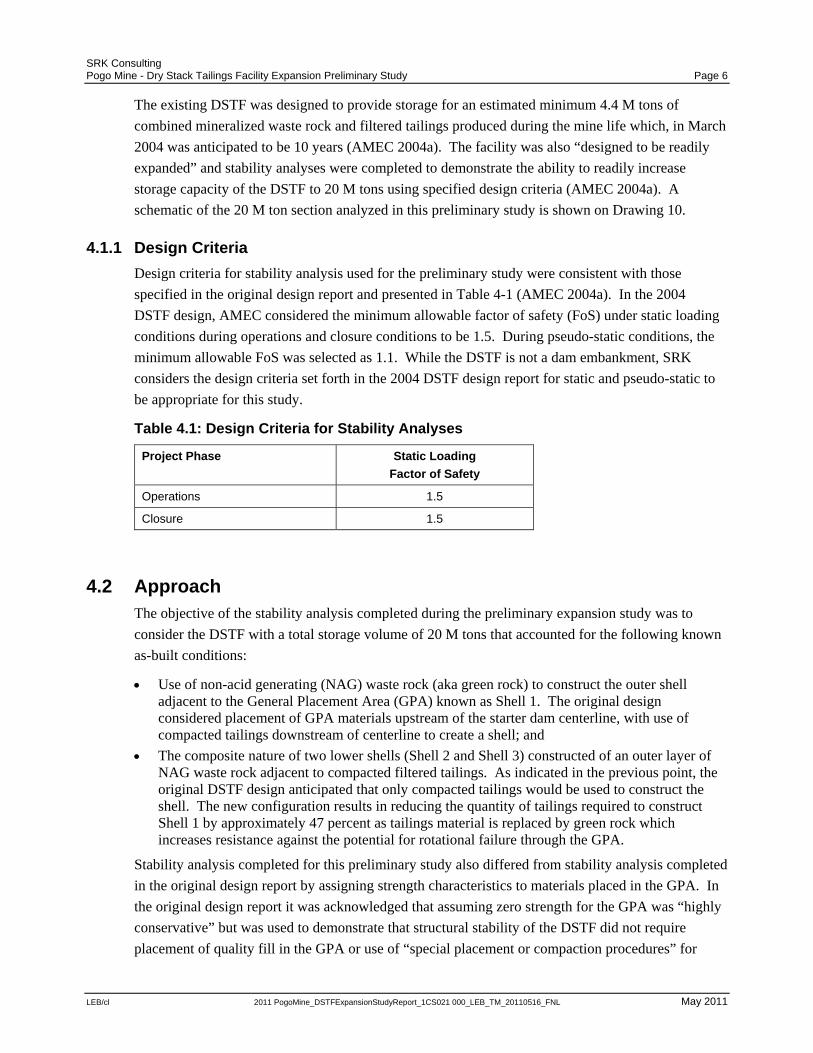
The existing DSTF was designed to provide storage for an estimated minimum 4.4 M tons of
combined mineralized waste rock and filtered tailings produced during the mine life which, in March
2004 was anticipated to be 10 years (AMEC 2004a). The facility was also “designed to be readily
expanded” and stability analyses were completed to demonstrate the ability to readily increase
storage capacity of the DSTF to 20 M tons using specified design criteria (AMEC 2004a). A
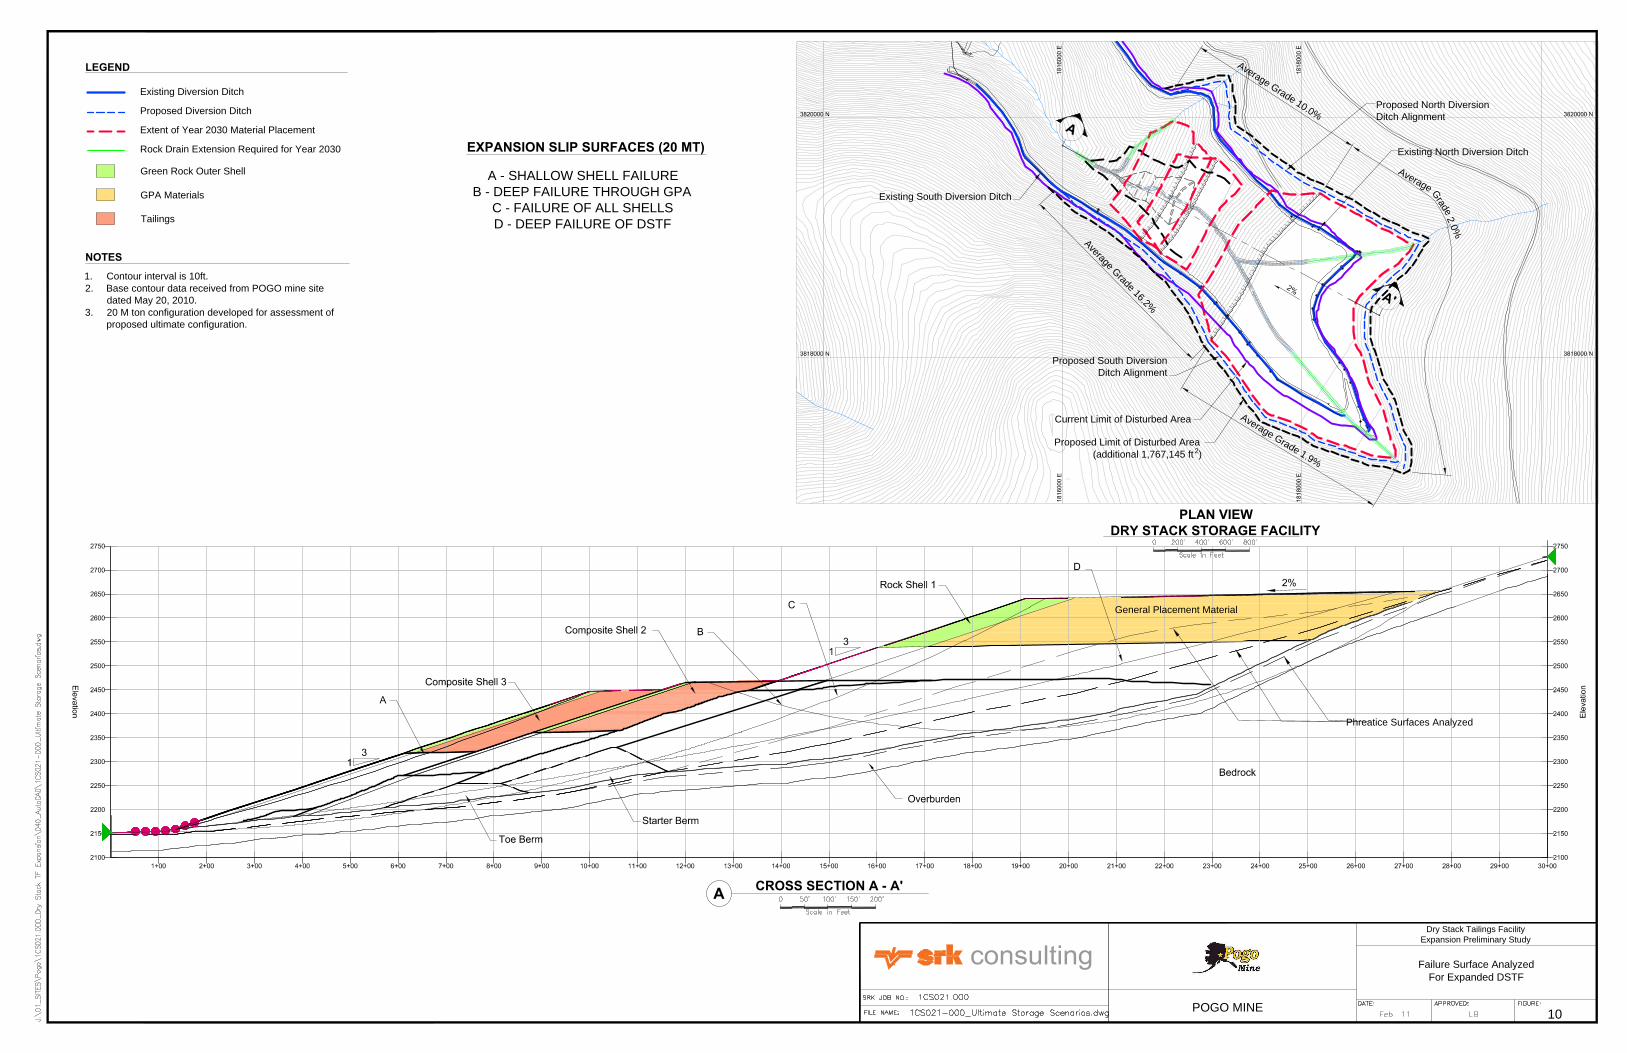
schematic of the 20 M ton section analyzed in this preliminary study is shown on Drawing 10.
4.1.1 Design Criteria
Design criteria for stability analysis used for the preliminary study were consistent with those
specified in the original design report and presented in Table 4-1 (AMEC 2004a). In the 2004
DSTF design, AMEC considered the minimum allowable factor of safety (FoS) under static loading
conditions during operations and closure conditions to be 1.5. During pseudo-static conditions, the
minimum allowable FoS was selected as 1.1. While the DSTF is not a dam embankment, SRK
considers the design criteria set forth in the 2004 DSTF design report for static and pseudo-static to
be appropriate for this study.
Table 4.1: Design Criteria for Stability Analyses
Project Phase Static Loading
Factor of Safety
Operations 1.5
Closure 1.5
4.2 Approach The objective of the stability analysis completed during the preliminary expansion study was to
consider the DSTF with a total storage volume of 20 M tons that accounted for the following known
as-built conditions:
Use of non-acid generating (NAG) waste rock (aka green rock) to construct the outer shell adjacent to the General Placement Area (GPA) known as Shell 1. The original design considered placement of GPA materials upstream of the starter dam centerline, with use of compacted tailings downstream of centerline to create a shell; and
The composite nature of two lower shells (Shell 2 and Shell 3) constructed of an outer layer of NAG waste rock adjacent to compacted filtered tailings. As indicated in the previous point, the original DSTF design anticipated that only compacted tailings would be used to construct the shell. The new configuration results in reducing the quantity of tailings required to construct Shell 1 by approximately 47 percent as tailings material is replaced by green rock which increases resistance against the potential for rotational failure through the GPA.
Stability analysis completed for this preliminary study also differed from stability analysis completed
in the original design report by assigning strength characteristics to materials placed in the GPA. In
the original design report it was acknowledged that assuming zero strength for the GPA was “highly
conservative” but was used to demonstrate that structural stability of the DSTF did not require
placement of quality fill in the GPA or use of “special placement or compaction procedures” for
SRK Consulting Pogo Mine - Dry Stack Tailings Facility Expansion Preliminary Study Page 7
LEB/cl 2011 PogoMine_DSTFExpansionStudyReport_1CS021 000_LEB_TM_20110516_FNL May 2011
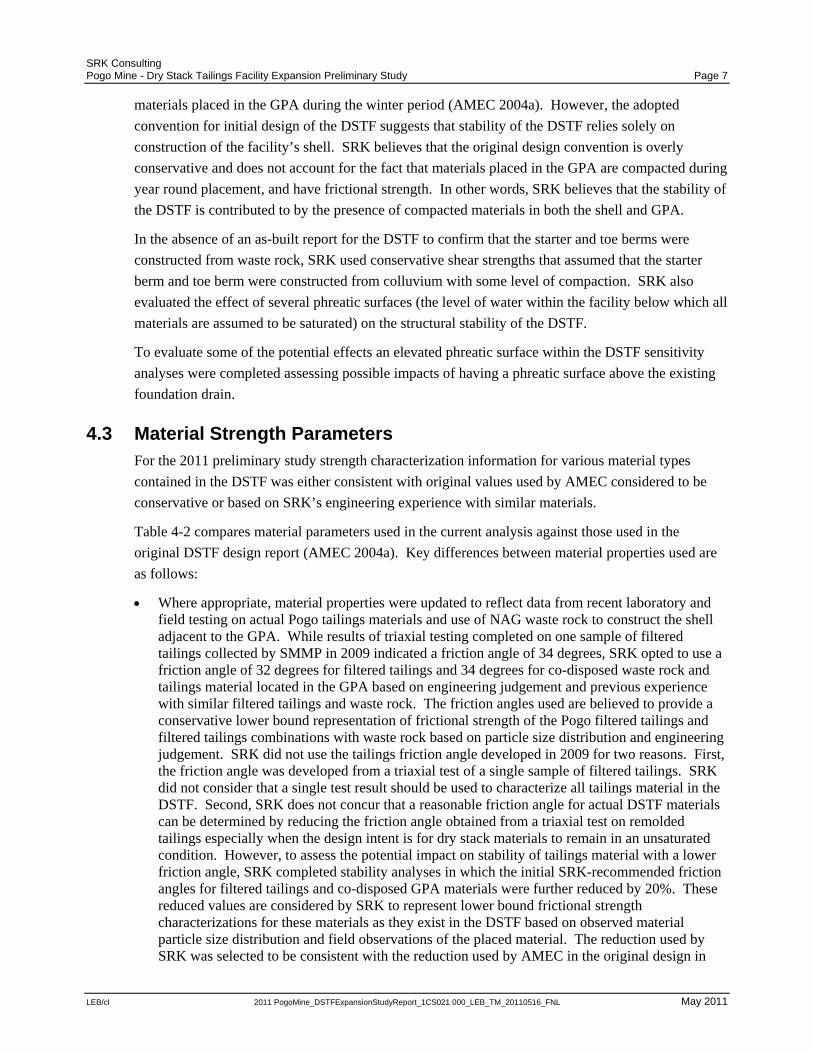
materials placed in the GPA during the winter period (AMEC 2004a). However, the adopted
convention for initial design of the DSTF suggests that stability of the DSTF relies solely on
construction of the facility’s shell. SRK believes that the original design convention is overly
conservative and does not account for the fact that materials placed in the GPA are compacted during
year round placement, and have frictional strength. In other words, SRK believes that the stability of
the DSTF is contributed to by the presence of compacted materials in both the shell and GPA.
In the absence of an as-built report for the DSTF to confirm that the starter and toe berms were
constructed from waste rock, SRK used conservative shear strengths that assumed that the starter
berm and toe berm were constructed from colluvium with some level of compaction. SRK also
evaluated the effect of several phreatic surfaces (the level of water within the facility below which all
materials are assumed to be saturated) on the structural stability of the DSTF.
To evaluate some of the potential effects an elevated phreatic surface within the DSTF sensitivity
analyses were completed assessing possible impacts of having a phreatic surface above the existing
foundation drain.
4.3 Material Strength Parameters For the 2011 preliminary study strength characterization information for various material types
contained in the DSTF was either consistent with original values used by AMEC considered to be
conservative or based on SRK’s engineering experience with similar materials.
Table 4-2 compares material parameters used in the current analysis against those used in the
original DSTF design report (AMEC 2004a). Key differences between material properties used are
as follows:
Where appropriate, material properties were updated to reflect data from recent laboratory and field testing on actual Pogo tailings materials and use of NAG waste rock to construct the shell adjacent to the GPA. While results of triaxial testing completed on one sample of filtered tailings collected by SMMP in 2009 indicated a friction angle of 34 degrees, SRK opted to use a friction angle of 32 degrees for filtered tailings and 34 degrees for co-disposed waste rock and tailings material located in the GPA based on engineering judgement and previous experience with similar filtered tailings and waste rock. The friction angles used are believed to provide a conservative lower bound representation of frictional strength of the Pogo filtered tailings and filtered tailings combinations with waste rock based on particle size distribution and engineering judgement. SRK did not use the tailings friction angle developed in 2009 for two reasons. First, the friction angle was developed from a triaxial test of a single sample of filtered tailings. SRK did not consider that a single test result should be used to characterize all tailings material in the DSTF. Second, SRK does not concur that a reasonable friction angle for actual DSTF materials can be determined by reducing the friction angle obtained from a triaxial test on remolded tailings especially when the design intent is for dry stack materials to remain in an unsaturated condition. However, to assess the potential impact on stability of tailings material with a lower friction angle, SRK completed stability analyses in which the initial SRK-recommended friction angles for filtered tailings and co-disposed GPA materials were further reduced by 20%. These reduced values are considered by SRK to represent lower bound frictional strength characterizations for these materials as they exist in the DSTF based on observed material particle size distribution and field observations of the placed material. The reduction used by SRK was selected to be consistent with the reduction used by AMEC in the original design in
SRK Consulting Pogo Mine - Dry Stack Tailings Facility Expansion Preliminary Study Page 8
LEB/cl 2011 PogoMine_DSTFExpansionStudyReport_1CS021 000_LEB_TM_20110516_FNL May 2011
which the friction angle for tailings was taken to be 80% of the friction angle obtained from a triaxial test of pilot test plant tailings. This exercise was completed to assess the sensitivity of DSTF stability to changes in the frictional strength of tailings materials contained in the DSTF;
Since actual construction materials for the starter berm and toe berm were not confirmed in an as-built report, SRK assigned lower frictional strength to these components as part of the analysis;
The frictional strength of overburden soils in the foundation of the DSTF was also reduced to assess the potential impact of having increased amounts of fines in the foundation; and
The bedrock layer was included in the analysis for completeness of the analysed section.
SRK Consulting Pogo Mine - Dry Stack Tailings Facility Expansion Preliminary Study Page 9
LEB/cl 2011 PogoMine_DSTFExpansionStudyReport_1CS021 000_LEB_TM_20110516_FNL May 2011
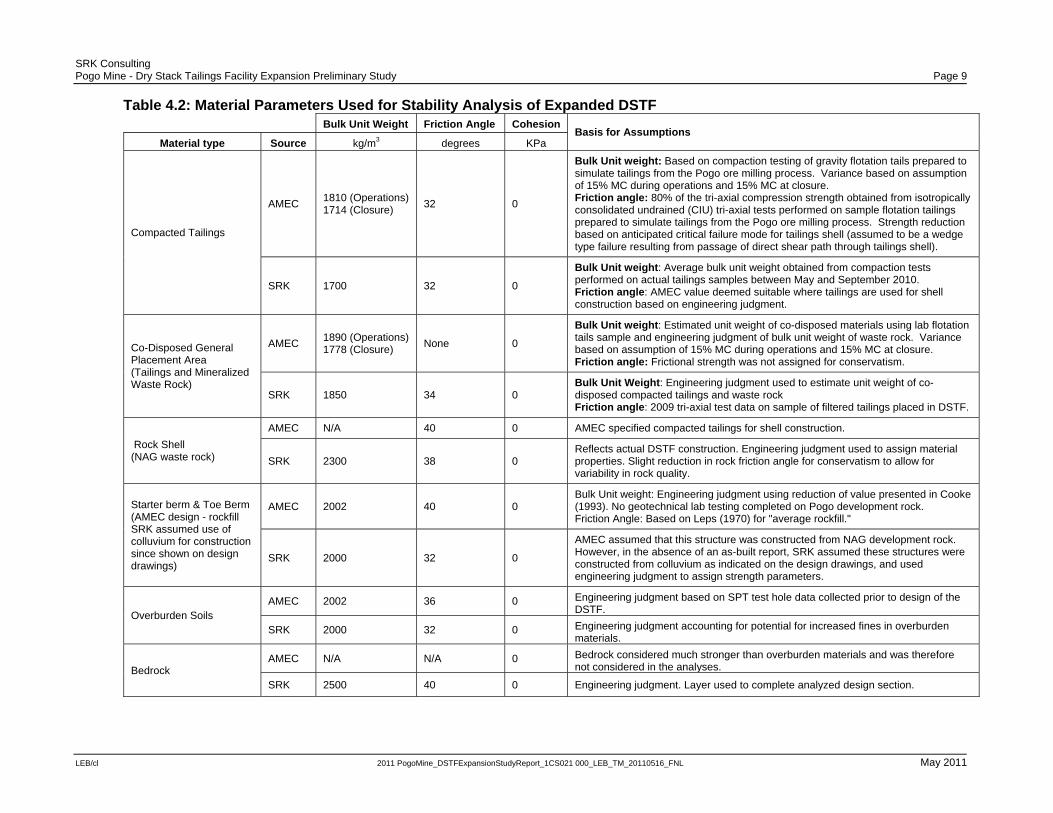
Table 4.2: Material Parameters Used for Stability Analysis of Expanded DSTF Bulk Unit Weight Friction Angle Cohesion
Basis for Assumptions Material type Source kg/m3 degrees KPa
Compacted Tailings
AMEC 1810 (Operations)1714 (Closure)
32 0
Bulk Unit weight: Based on compaction testing of gravity flotation tails prepared to simulate tailings from the Pogo ore milling process. Variance based on assumption of 15% MC during operations and 15% MC at closure. Friction angle: 80% of the tri-axial compression strength obtained from isotropically consolidated undrained (CIU) tri-axial tests performed on sample flotation tailings prepared to simulate tailings from the Pogo ore milling process. Strength reduction based on anticipated critical failure mode for tailings shell (assumed to be a wedge type failure resulting from passage of direct shear path through tailings shell).
SRK 1700 32 0
Bulk Unit weight: Average bulk unit weight obtained from compaction tests performed on actual tailings samples between May and September 2010. Friction angle: AMEC value deemed suitable where tailings are used for shell construction based on engineering judgment.
Co-Disposed General Placement Area (Tailings and Mineralized Waste Rock)
AMEC 1890 (Operations)1778 (Closure)
None 0
Bulk Unit weight: Estimated unit weight of co-disposed materials using lab flotation tails sample and engineering judgment of bulk unit weight of waste rock. Variance based on assumption of 15% MC during operations and 15% MC at closure. Friction angle: Frictional strength was not assigned for conservatism.
SRK 1850 34 0 Bulk Unit Weight: Engineering judgment used to estimate unit weight of co-disposed compacted tailings and waste rock Friction angle: 2009 tri-axial test data on sample of filtered tailings placed in DSTF.
Rock Shell (NAG waste rock)
AMEC N/A 40 0 AMEC specified compacted tailings for shell construction.
SRK 2300 38 0 Reflects actual DSTF construction. Engineering judgment used to assign material properties. Slight reduction in rock friction angle for conservatism to allow for variability in rock quality.
Starter berm & Toe Berm (AMEC design - rockfill SRK assumed use of colluvium for construction since shown on design drawings)
AMEC 2002 40 0 Bulk Unit weight: Engineering judgment using reduction of value presented in Cooke (1993). No geotechnical lab testing completed on Pogo development rock. Friction Angle: Based on Leps (1970) for "average rockfill."
SRK 2000 32 0
AMEC assumed that this structure was constructed from NAG development rock. However, in the absence of an as-built report, SRK assumed these structures were constructed from colluvium as indicated on the design drawings, and used engineering judgment to assign strength parameters.
Overburden Soils AMEC 2002 36 0 Engineering judgment based on SPT test hole data collected prior to design of the
DSTF.
SRK 2000 32 0 Engineering judgment accounting for potential for increased fines in overburden materials.
Bedrock AMEC N/A N/A 0 Bedrock considered much stronger than overburden materials and was therefore
not considered in the analyses.
SRK 2500 40 0 Engineering judgment. Layer used to complete analyzed design section.
SRK Consulting Pogo Mine - Dry Stack Tailings Facility Expansion Preliminary Study Page 10
LEB/cl 2011 PogoMine_DSTFExpansionStudyReport_1CS021 000_LEB_TM_20110516_FNL May 2011
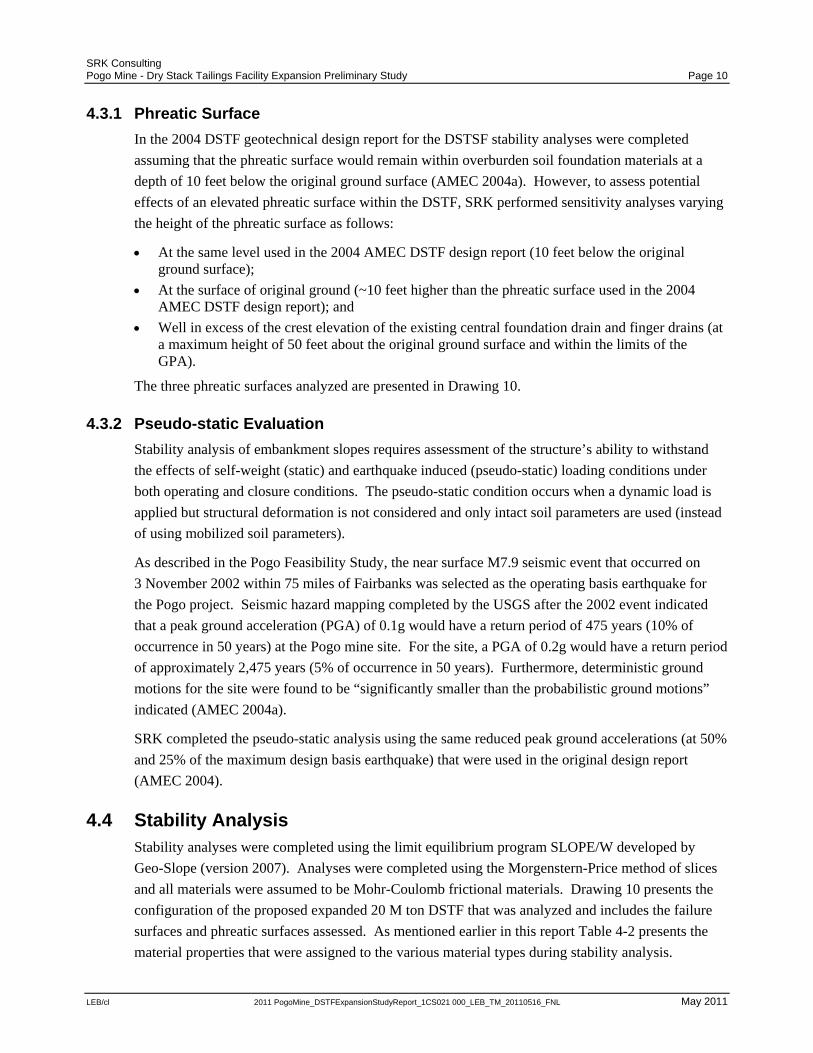
4.3.1 Phreatic Surface
In the 2004 DSTF geotechnical design report for the DSTSF stability analyses were completed
assuming that the phreatic surface would remain within overburden soil foundation materials at a
depth of 10 feet below the original ground surface (AMEC 2004a). However, to assess potential
effects of an elevated phreatic surface within the DSTF, SRK performed sensitivity analyses varying
the height of the phreatic surface as follows:
At the same level used in the 2004 AMEC DSTF design report (10 feet below the original ground surface);
At the surface of original ground (~10 feet higher than the phreatic surface used in the 2004 AMEC DSTF design report); and
Well in excess of the crest elevation of the existing central foundation drain and finger drains (at a maximum height of 50 feet about the original ground surface and within the limits of the GPA).
The three phreatic surfaces analyzed are presented in Drawing 10.
4.3.2 Pseudo-static Evaluation
Stability analysis of embankment slopes requires assessment of the structure’s ability to withstand
the effects of self-weight (static) and earthquake induced (pseudo-static) loading conditions under
both operating and closure conditions. The pseudo-static condition occurs when a dynamic load is
applied but structural deformation is not considered and only intact soil parameters are used (instead
of using mobilized soil parameters).
As described in the Pogo Feasibility Study, the near surface M7.9 seismic event that occurred on
3 November 2002 within 75 miles of Fairbanks was selected as the operating basis earthquake for
the Pogo project. Seismic hazard mapping completed by the USGS after the 2002 event indicated
that a peak ground acceleration (PGA) of 0.1g would have a return period of 475 years (10% of
occurrence in 50 years) at the Pogo mine site. For the site, a PGA of 0.2g would have a return period
of approximately 2,475 years (5% of occurrence in 50 years). Furthermore, deterministic ground
motions for the site were found to be “significantly smaller than the probabilistic ground motions”
indicated (AMEC 2004a).
SRK completed the pseudo-static analysis using the same reduced peak ground accelerations (at 50%
and 25% of the maximum design basis earthquake) that were used in the original design report
(AMEC 2004).
4.4 Stability Analysis Stability analyses were completed using the limit equilibrium program SLOPE/W developed by
Geo-Slope (version 2007). Analyses were completed using the Morgenstern-Price method of slices
and all materials were assumed to be Mohr-Coulomb frictional materials. Drawing 10 presents the
configuration of the proposed expanded 20 M ton DSTF that was analyzed and includes the failure
surfaces and phreatic surfaces assessed. As mentioned earlier in this report Table 4-2 presents the
material properties that were assigned to the various material types during stability analysis.
SRK Consulting Pogo Mine - Dry Stack Tailings Facility Expansion Preliminary Study Page 11
LEB/cl 2011 PogoMine_DSTFExpansionStudyReport_1CS021 000_LEB_TM_20110516_FNL May 2011
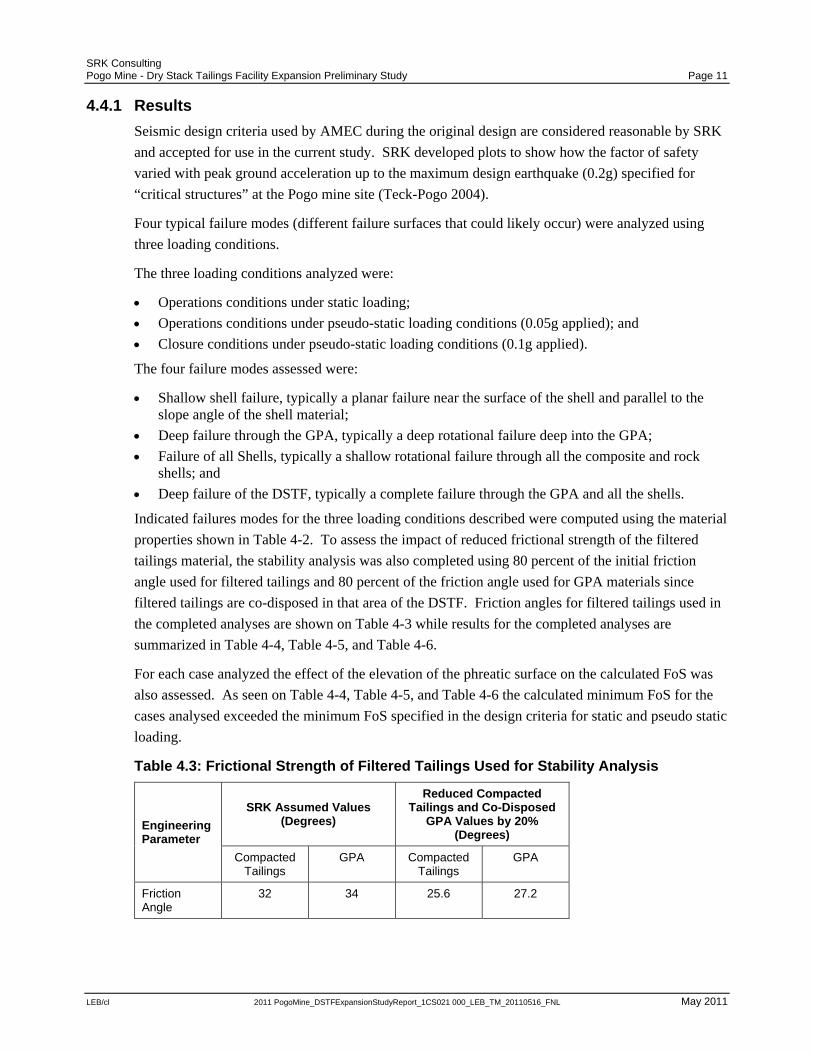
4.4.1 Results
Seismic design criteria used by AMEC during the original design are considered reasonable by SRK
and accepted for use in the current study. SRK developed plots to show how the factor of safety
varied with peak ground acceleration up to the maximum design earthquake (0.2g) specified for
“critical structures” at the Pogo mine site (Teck-Pogo 2004).
Four typical failure modes (different failure surfaces that could likely occur) were analyzed using
three loading conditions.
The three loading conditions analyzed were:
Operations conditions under static loading;
Operations conditions under pseudo-static loading conditions (0.05g applied); and
Closure conditions under pseudo-static loading conditions (0.1g applied).
The four failure modes assessed were:
Shallow shell failure, typically a planar failure near the surface of the shell and parallel to the slope angle of the shell material;
Deep failure through the GPA, typically a deep rotational failure deep into the GPA;
Failure of all Shells, typically a shallow rotational failure through all the composite and rock shells; and
Deep failure of the DSTF, typically a complete failure through the GPA and all the shells.
Indicated failures modes for the three loading conditions described were computed using the material
properties shown in Table 4-2. To assess the impact of reduced frictional strength of the filtered
tailings material, the stability analysis was also completed using 80 percent of the initial friction
angle used for filtered tailings and 80 percent of the friction angle used for GPA materials since
filtered tailings are co-disposed in that area of the DSTF. Friction angles for filtered tailings used in
the completed analyses are shown on Table 4-3 while results for the completed analyses are
summarized in Table 4-4, Table 4-5, and Table 4-6.
For each case analyzed the effect of the elevation of the phreatic surface on the calculated FoS was
also assessed. As seen on Table 4-4, Table 4-5, and Table 4-6 the calculated minimum FoS for the
cases analysed exceeded the minimum FoS specified in the design criteria for static and pseudo static
loading.
Table 4.3: Frictional Strength of Filtered Tailings Used for Stability Analysis
Engineering Parameter
SRK Assumed Values (Degrees)
Reduced Compacted Tailings and Co-Disposed
GPA Values by 20% (Degrees)
Compacted Tailings
GPA Compacted Tailings
GPA
Friction Angle
32 34 25.6 27.2
SRK Consulting Pogo Mine - Dry Stack Tailings Facility Expansion Preliminary Study Page 12
LEB/cl 2011 PogoMine_DSTFExpansionStudyReport_1CS021 000_LEB_TM_20110516_FNL May 2011
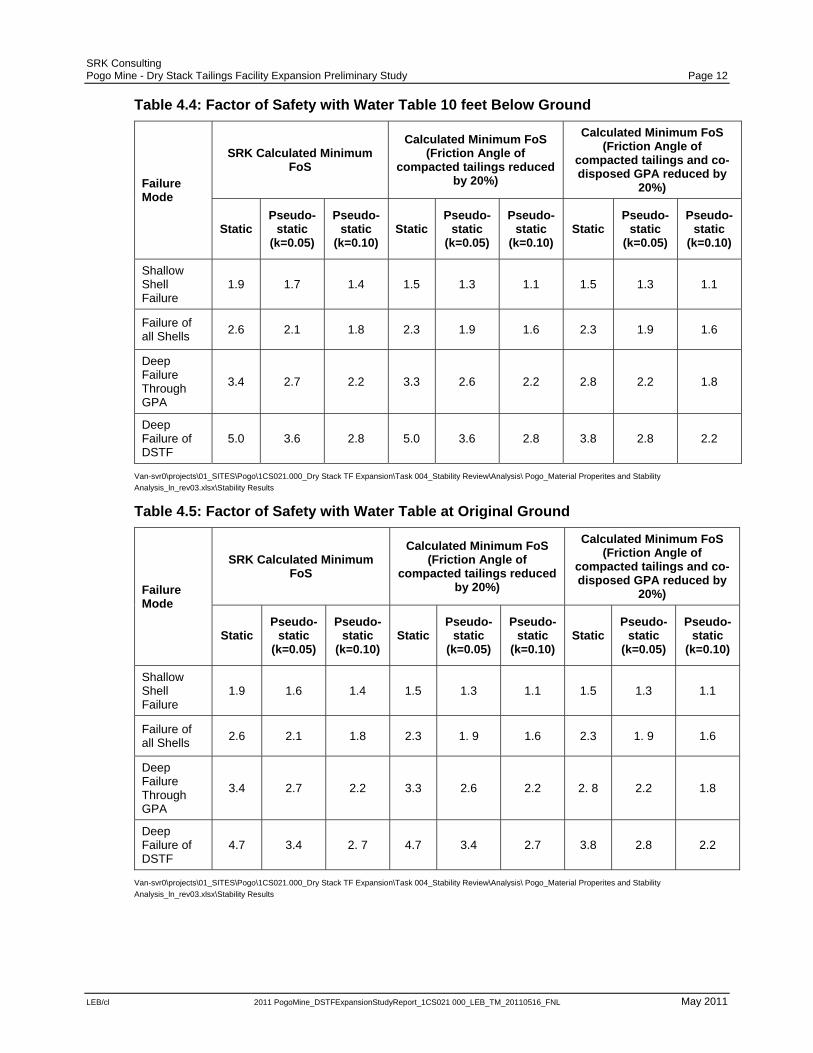
Table 4.4: Factor of Safety with Water Table 10 feet Below Ground
Failure Mode
SRK Calculated Minimum FoS
Calculated Minimum FoS (Friction Angle of
compacted tailings reduced by 20%)
Calculated Minimum FoS (Friction Angle of
compacted tailings and co-disposed GPA reduced by
20%)
Static Pseudo-
static (k=0.05)
Pseudo-static
(k=0.10) Static
Pseudo-static
(k=0.05)
Pseudo-static
(k=0.10) Static
Pseudo-static
(k=0.05)
Pseudo-static
(k=0.10)
Shallow Shell Failure
1.9 1.7 1.4 1.5 1.3 1.1 1.5 1.3 1.1
Failure of all Shells
2.6 2.1 1.8 2.3 1.9 1.6 2.3 1.9 1.6
Deep Failure Through GPA
3.4 2.7 2.2 3.3 2.6 2.2 2.8 2.2 1.8
Deep Failure of DSTF
5.0 3.6 2.8 5.0 3.6 2.8 3.8 2.8 2.2
Van-svr0\projects\01_SITES\Pogo\1CS021.000_Dry Stack TF Expansion\Task 004_Stability Review\Analysis\ Pogo_Material Properites and Stability
Analysis_ln_rev03.xlsx\Stability Results
Table 4.5: Factor of Safety with Water Table at Original Ground
Failure Mode
SRK Calculated Minimum FoS
Calculated Minimum FoS (Friction Angle of
compacted tailings reduced by 20%)
Calculated Minimum FoS (Friction Angle of
compacted tailings and co-disposed GPA reduced by
20%)
Static Pseudo-
static (k=0.05)
Pseudo-static
(k=0.10) Static
Pseudo-static
(k=0.05)
Pseudo-static
(k=0.10) Static
Pseudo-static
(k=0.05)
Pseudo-static
(k=0.10)
Shallow Shell Failure
1.9 1.6 1.4 1.5 1.3 1.1 1.5 1.3 1.1
Failure of all Shells
2.6 2.1 1.8 2.3 1. 9 1.6 2.3 1. 9 1.6
Deep Failure Through GPA
3.4 2.7 2.2 3.3 2.6 2.2 2. 8 2.2 1.8
Deep Failure of DSTF
4.7 3.4 2. 7 4.7 3.4 2.7 3.8 2.8 2.2
Van-svr0\projects\01_SITES\Pogo\1CS021.000_Dry Stack TF Expansion\Task 004_Stability Review\Analysis\ Pogo_Material Properites and Stability
Analysis_ln_rev03.xlsx\Stability Results
SRK Consulting Pogo Mine - Dry Stack Tailings Facility Expansion Preliminary Study Page 13
LEB/cl 2011 PogoMine_DSTFExpansionStudyReport_1CS021 000_LEB_TM_20110516_FNL May 2011
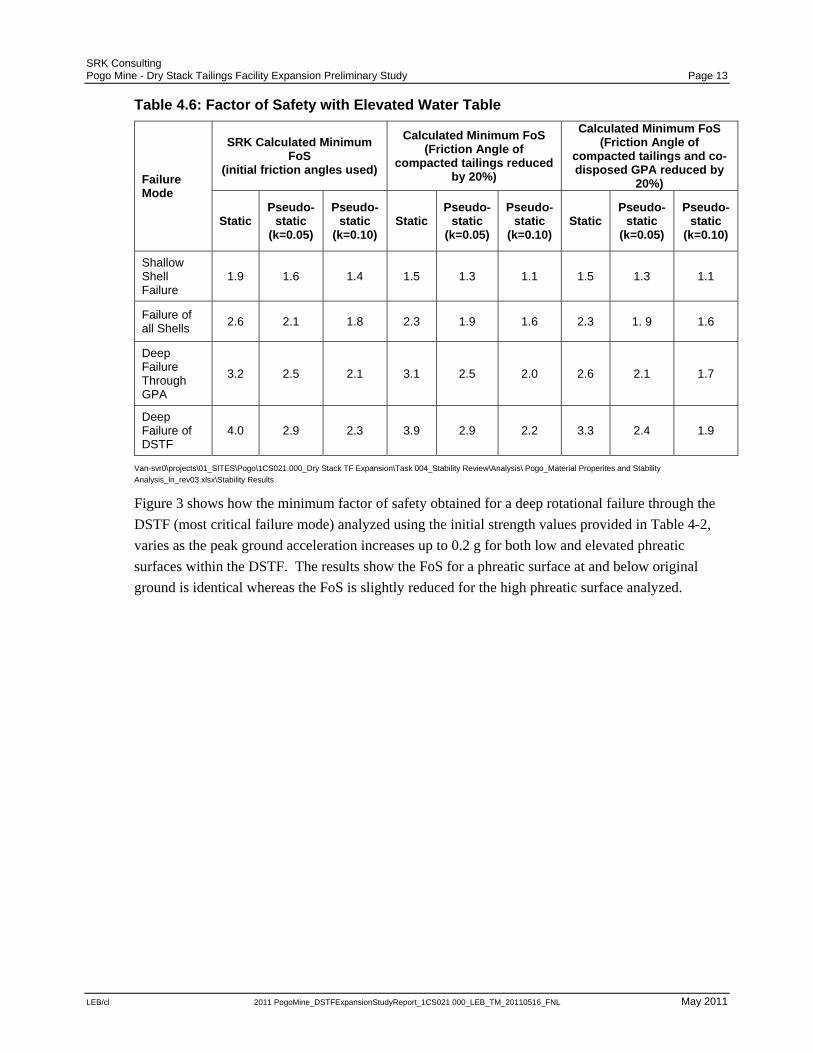
Table 4.6: Factor of Safety with Elevated Water Table
Failure Mode
SRK Calculated Minimum FoS
(initial friction angles used)
Calculated Minimum FoS (Friction Angle of
compacted tailings reduced by 20%)
Calculated Minimum FoS (Friction Angle of
compacted tailings and co-disposed GPA reduced by
20%)
Static Pseudo-
static (k=0.05)
Pseudo-static
(k=0.10) Static
Pseudo-static
(k=0.05)
Pseudo-static
(k=0.10) Static
Pseudo-static
(k=0.05)
Pseudo-static
(k=0.10)
Shallow Shell Failure
1.9 1.6 1.4 1.5 1.3 1.1 1.5 1.3 1.1
Failure of all Shells
2.6 2.1 1.8 2.3 1.9 1.6 2.3 1. 9 1.6
Deep Failure Through GPA
3.2 2.5 2.1 3.1 2.5 2.0 2.6 2.1 1.7
Deep Failure of DSTF
4.0 2.9 2.3 3.9 2.9 2.2 3.3 2.4 1.9
Van-svr0\projects\01_SITES\Pogo\1CS021.000_Dry Stack TF Expansion\Task 004_Stability Review\Analysis\ Pogo_Material Properites and Stability
Analysis_ln_rev03.xlsx\Stability Results
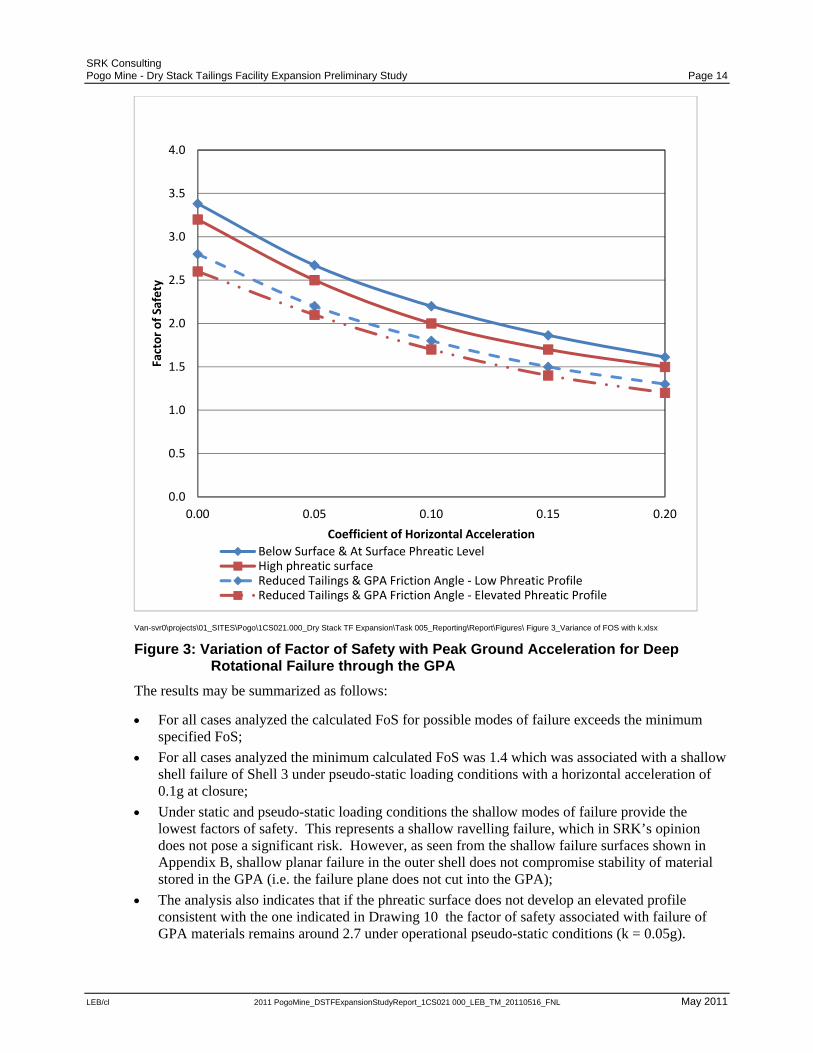
Figure 3 shows how the minimum factor of safety obtained for a deep rotational failure through the
DSTF (most critical failure mode) analyzed using the initial strength values provided in Table 4-2,
varies as the peak ground acceleration increases up to 0.2 g for both low and elevated phreatic
surfaces within the DSTF. The results show the FoS for a phreatic surface at and below original
ground is identical whereas the FoS is slightly reduced for the high phreatic surface analyzed.
SRK Consulting Pogo Mine - Dry Stack Tailings Facility Expansion Preliminary Study Page 14
LEB/cl 2011 PogoMine_DSTFExpansionStudyReport_1CS021 000_LEB_TM_20110516_FNL May 2011
Van-svr0\projects\01_SITES\Pogo\1CS021.000_Dry Stack TF Expansion\Task 005_Reporting\Report\Figures\ Figure 3_Variance of FOS with k.xlsx
Figure 3: Variation of Factor of Safety with Peak Ground Acceleration for Deep Rotational Failure through the GPA
The results may be summarized as follows:
For all cases analyzed the calculated FoS for possible modes of failure exceeds the minimum specified FoS;
For all cases analyzed the minimum calculated FoS was 1.4 which was associated with a shallow shell failure of Shell 3 under pseudo-static loading conditions with a horizontal acceleration of 0.1g at closure;
Under static and pseudo-static loading conditions the shallow modes of failure provide the lowest factors of safety. This represents a shallow ravelling failure, which in SRK’s opinion does not pose a significant risk. However, as seen from the shallow failure surfaces shown in Appendix B, shallow planar failure in the outer shell does not compromise stability of material stored in the GPA (i.e. the failure plane does not cut into the GPA);
The analysis also indicates that if the phreatic surface does not develop an elevated profile consistent with the one indicated in Drawing 10 the factor of safety associated with failure of GPA materials remains around 2.7 under operational pseudo-static conditions (k = 0.05g).
0.0
0.5
1.0
1.5
2.0
2.5
3.0
3.5
4.0
0.00 0.05 0.10 0.15 0.20
Factor of Safety
Coefficient of Horizontal Acceleration
Below Surface & At Surface Phreatic LevelHigh phreatic surfaceReduced Tailings & GPA Friction Angle ‐ Low Phreatic ProfileReduced Tailings & GPA Friction Angle ‐ Elevated Phreatic Profile
SRK Consulting Pogo Mine - Dry Stack Tailings Facility Expansion Preliminary Study Page 15
LEB/cl 2011 PogoMine_DSTFExpansionStudyReport_1CS021 000_LEB_TM_20110516_FNL May 2011
The presence of an elevated phreatic surface within the DSTF reduces the FoS associated with a deep failure through the GPA under a pseudo-static load of 0.1g to 2.1 which is well above the design criteria of 1.1.
The static and pseudo-static design criteria are met using a 20% reduction of the initially SRK assumed friction angle of filtered tailings and co-disposed filtered tailings and waste rock.
Complete results obtained from the stability analyses are presented in Appendix B.
4.5 Conclusions Stability analysis performed by SRK for the expanded DSTF configuration (raised to elevation
2640 ft. with material properties indicated) suggests that the factors of safety for the overall structure
exceed the minimum FoS values specified by the design criteria, even with an elevated phreatic
surface and for a range of failure modes.
Results from the analysis also demonstrate that the GPA provides frictional resistance within the
DSTF and as such stability of the overall structure is not entirely reliant on the strength and stability
of the outer shells. Construction of composite shells (Shell 2 and Shell 3) is still in its early stages.
SRK recommends that performance of the outer shells be verified through both observation, field
density testing, and laboratory testing as discussed in the following section.
5 Recommendations for Future Work
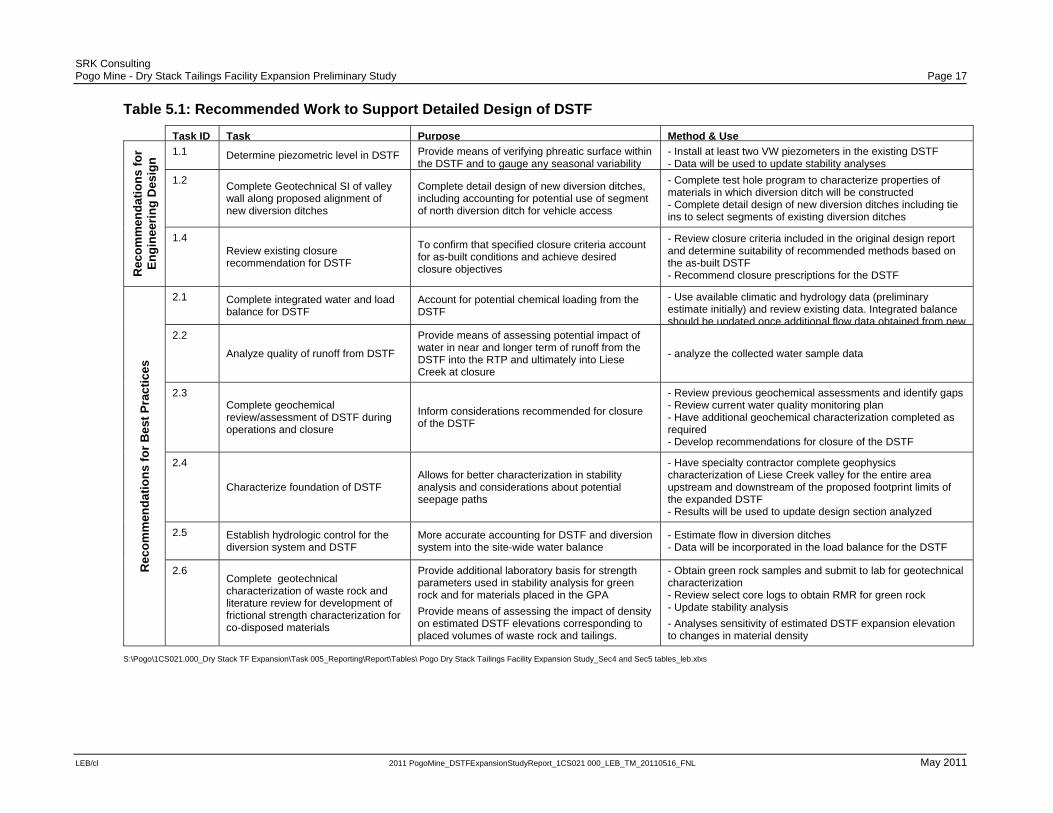
5.1 Recommendations for Detailed Engineering Design SRK recommends completion of the tasks indicated in Table 5-1. Key considerations for advancing
design and construction of the expanded DSTF are as follows:
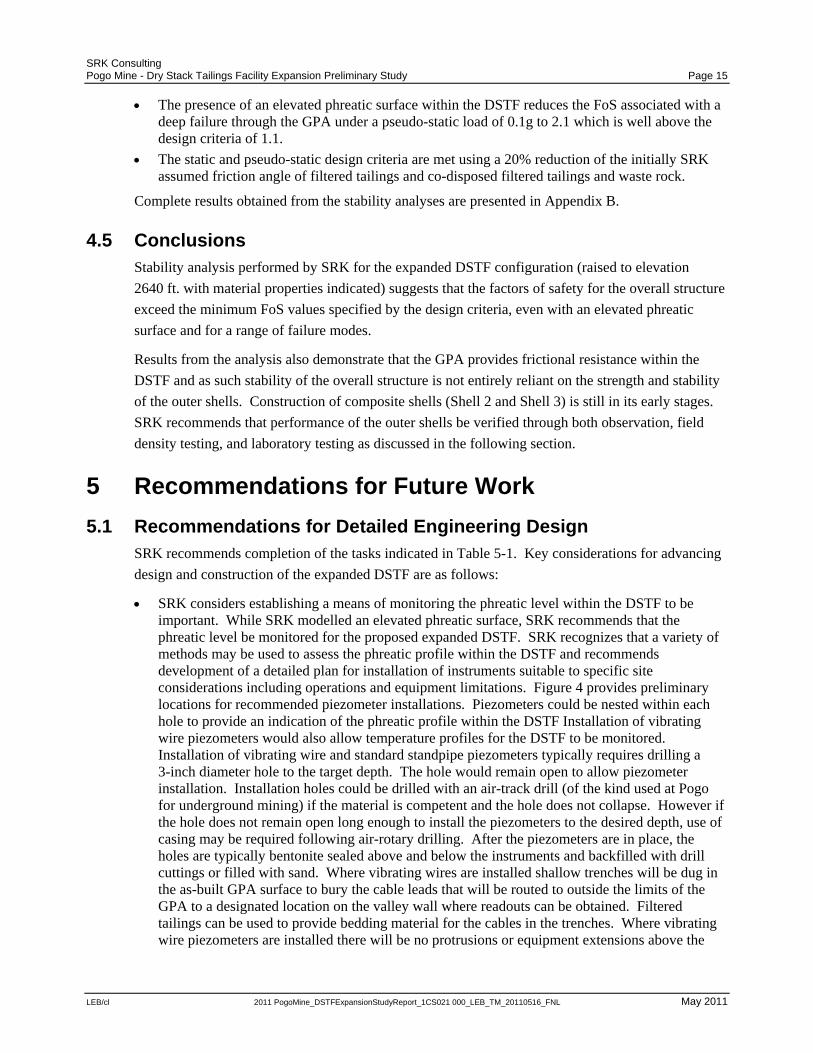
SRK considers establishing a means of monitoring the phreatic level within the DSTF to be important. While SRK modelled an elevated phreatic surface, SRK recommends that the phreatic level be monitored for the proposed expanded DSTF. SRK recognizes that a variety of methods may be used to assess the phreatic profile within the DSTF and recommends development of a detailed plan for installation of instruments suitable to specific site considerations including operations and equipment limitations. Figure 4 provides preliminary locations for recommended piezometer installations. Piezometers could be nested within each hole to provide an indication of the phreatic profile within the DSTF Installation of vibrating wire piezometers would also allow temperature profiles for the DSTF to be monitored. Installation of vibrating wire and standard standpipe piezometers typically requires drilling a 3-inch diameter hole to the target depth. The hole would remain open to allow piezometer installation. Installation holes could be drilled with an air-track drill (of the kind used at Pogo for underground mining) if the material is competent and the hole does not collapse. However if the hole does not remain open long enough to install the piezometers to the desired depth, use of casing may be required following air-rotary drilling. After the piezometers are in place, the holes are typically bentonite sealed above and below the instruments and backfilled with drill cuttings or filled with sand. Where vibrating wires are installed shallow trenches will be dug in the as-built GPA surface to bury the cable leads that will be routed to outside the limits of the GPA to a designated location on the valley wall where readouts can be obtained. Filtered tailings can be used to provide bedding material for the cables in the trenches. Where vibrating wire piezometers are installed there will be no protrusions or equipment extensions above the
SRK ConsultinPogo Mine - D
LEB/cl
Van-s
Fig
5.2 ReThe
ope
ng Dry Stack Tailings
working surof the DSTF
A geotechniwould be pru
The existingconstructiongeochemica
svr0\projects\01_SITE
gure 4: Prel
ecommene following re
erations and c
Review and loading frompotential imrecommenda
The potentiaerosion of roclosure perio
s Facility Expans
2011 PogoMin
rface of the GF.
ical evaluationudent if areas
g closure plann of the DSTFl assessment
ES\Pogo\1CS021.000_
iminary Pie
ndations ecommended
closure:
compile exism the DSTF.
mpact of runofations to miti
al for erosion ock included od. Tests suc
sion Preliminary
ne_DSTFExpansionStu
PA thereby a
n of the valleys are accessib
n for the DSTFF to date. Thifor the DSTF
_Dry Stack TF Expans
ezometer Lo
for Best tasks will im
sting water anBased on rev
ff from the DSgate potential
of the outer rin the shells h
ch as slate dur
Study
udyReport_1CS021 0
avoiding obstr
y slope alongle to identify
F should be reis review shouF to ensure all
sion\040_AutoCAD in
ocations
Practicesmprove best m
nd load balancview of availaSTF on Liese l impacts.
rock face of thhas implicatiorability, sound
000_LEB_TM_201105
ructions for eq
g the proposedpotential pro
eviewed and uld include a l closure crite
file 1CS021-000_2010
s management p
ce for the DSTable water qua
Creek at clos
he DSTF sheons for maintedness using s
16_FNL
quipment wo
d alignment ooblematic foun
compared to desktop revie
eria can be sat
0-2017.dwg Layout 1
ractices for th
TF to evaluatality data, SRsure. SRK w
lls should be enance requir
sodium sulpha
M
rking on the s
of the new divndation condi
the actual ew of the tisfied.
he DSTF duri
te the chemicaRK would asse
ould also pro
verified. Therements durinate, and freez
Page 16
May 2011
surface
version itions.
ing
al ess the vide
e ng the e thaw
SRK Consulting Pogo Mine - Dry Stack Tailings Facility Expansion Preliminary Study Page 17
LEB/cl 2011 PogoMine_DSTFExpansionStudyReport_1CS021 000_LEB_TM_20110516_FNL May 2011
durability could be completed to provide data on long-term rock durability. Furthermore, Proctor and direct shear tests for large diameter specimens could be completed to provide additional engineering parameters such as density and friction angle for further evaluation on the impact of material density on projected DSTF elevations throughout facility expansion.
Using the hydrological data from the existing diversion ditches and from Liese Creek, better water balance control could be established to provide better input to a revised water quality model for the DSTF and for the site.
SRK Consulting Pogo Mine - Dry Stack Tailings Facility Expansion Preliminary Study Page 17
LEB/cl 2011 PogoMine_DSTFExpansionStudyReport_1CS021 000_LEB_TM_20110516_FNL May 2011
Table 5.1: Recommended Work to Support Detailed Design of DSTF
Task ID Task Purpose Method & UseR
eco
mm
end
atio
ns
for
En
gin
eeri
ng
Des
ign
1.1 Determine piezometric level in DSTF Provide means of verifying phreatic surface within the DSTF and to gauge any seasonal variability
- Install at least two VW piezometers in the existing DSTF - Data will be used to update stability analyses
1.2 Complete Geotechnical SI of valley wall along proposed alignment of new diversion ditches
Complete detail design of new diversion ditches, including accounting for potential use of segment of north diversion ditch for vehicle access
- Complete test hole program to characterize properties of materials in which diversion ditch will be constructed - Complete detail design of new diversion ditches including tie ins to select segments of existing diversion ditches
1.4 Review existing closure recommendation for DSTF
To confirm that specified closure criteria account for as-built conditions and achieve desired closure objectives
- Review closure criteria included in the original design report and determine suitability of recommended methods based on the as-built DSTF - Recommend closure prescriptions for the DSTF
Rec
om
men
da
tio
ns
for
Bes
t P
ract
ices
2.1 Complete integrated water and load balance for DSTF
Account for potential chemical loading from the DSTF
- Use available climatic and hydrology data (preliminary estimate initially) and review existing data. Integrated balance should be updated once additional flow data obtained from new
2.2
Analyze quality of runoff from DSTF
Provide means of assessing potential impact of water in near and longer term of runoff from the DSTF into the RTP and ultimately into Liese Creek at closure
- analyze the collected water sample data
2.3 Complete geochemical review/assessment of DSTF during operations and closure
Inform considerations recommended for closure of the DSTF
- Review previous geochemical assessments and identify gaps- Review current water quality monitoring plan - Have additional geochemical characterization completed as required - Develop recommendations for closure of the DSTF
2.4
Characterize foundation of DSTF Allows for better characterization in stability analysis and considerations about potential seepage paths
- Have specialty contractor complete geophysics characterization of Liese Creek valley for the entire area upstream and downstream of the proposed footprint limits of the expanded DSTF - Results will be used to update design section analyzed
2.5 Establish hydrologic control for the diversion system and DSTF
More accurate accounting for DSTF and diversion system into the site-wide water balance
- Estimate flow in diversion ditches - Data will be incorporated in the load balance for the DSTF
2.6 Complete geotechnical characterization of waste rock and literature review for development of frictional strength characterization for co-disposed materials
Provide additional laboratory basis for strength parameters used in stability analysis for green rock and for materials placed in the GPA
Provide means of assessing the impact of density on estimated DSTF elevations corresponding to placed volumes of waste rock and tailings.
- Obtain green rock samples and submit to lab for geotechnical characterization - Review select core logs to obtain RMR for green rock - Update stability analysis
- Analyses sensitivity of estimated DSTF expansion elevation to changes in material density
S:\Pogo\1CS021.000_Dry Stack TF Expansion\Task 005_Reporting\Report\Tables\ Pogo Dry Stack Tailings Facility Expansion Study_Sec4 and Sec5 tables_leb.xlxs
SRK Consulting Pogo Mine - Dry Stack Tailings Facility Expansion Preliminary Study Page 19
LEB/cl 2011 PogoMine_DSTFExpansionStudyReport_1CS021 000_LEB_TM_20110516_FNL May 2011
7 References AMEC Earth and Environmental. 2004a. Pogo Gold Project Dry Stack Tailings Facility
Geotechnical Design Report. March.
AMEC Earth and Environmental. 2004b. RTP Dam Design Report. March.
Teck-Pogo. 2004. Pogo Project Feasibility Study.

Drawings
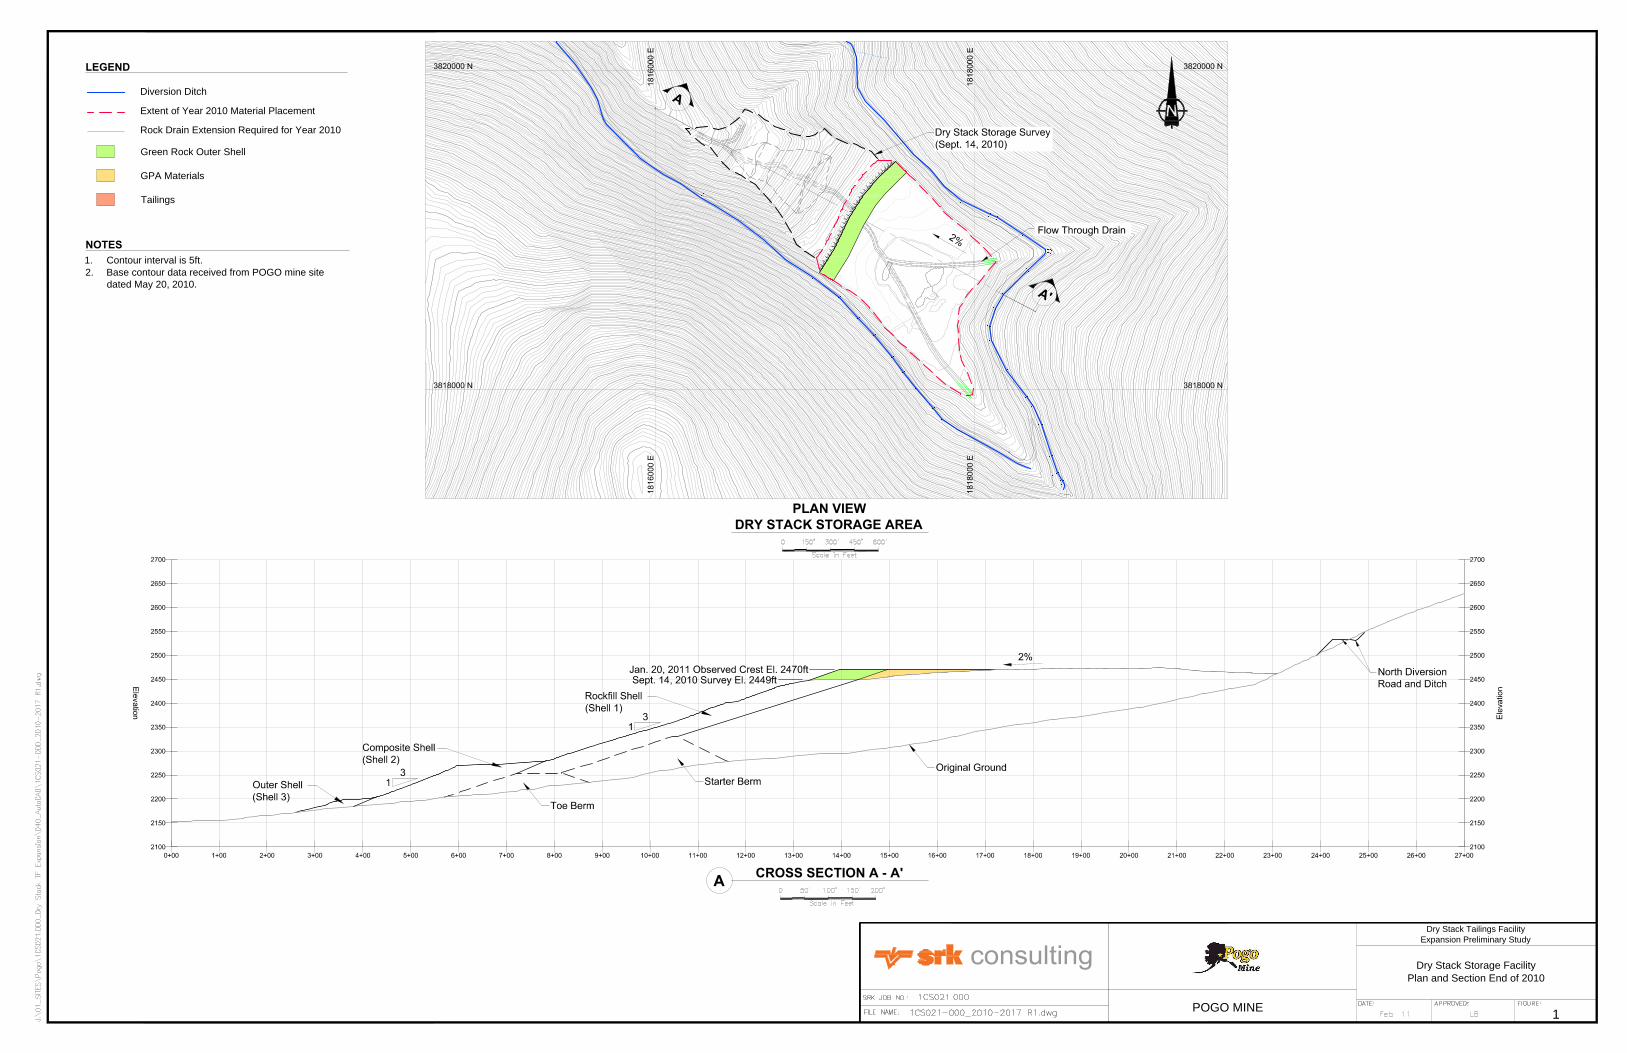
CROSS SECTION A - A'
A
PLAN VIEW
DRY STACK STORAGE AREA
Dry Stack Storage Facility
Plan and Section End of 2010
A
'
A
LEGEND
NOTES
1. Contour interval is 5ft.
2. Base contour data received from POGO mine site
dated May 20, 2010.
Diversion Ditch
Extent of Year 2010 Material Placement
Rock Drain Extension Required for Year 2010
Green Rock Outer Shell
GPA Materials
Tailings
Dry Stack Tailings Facility
Expansion Preliminary Study
POGO MINE
1
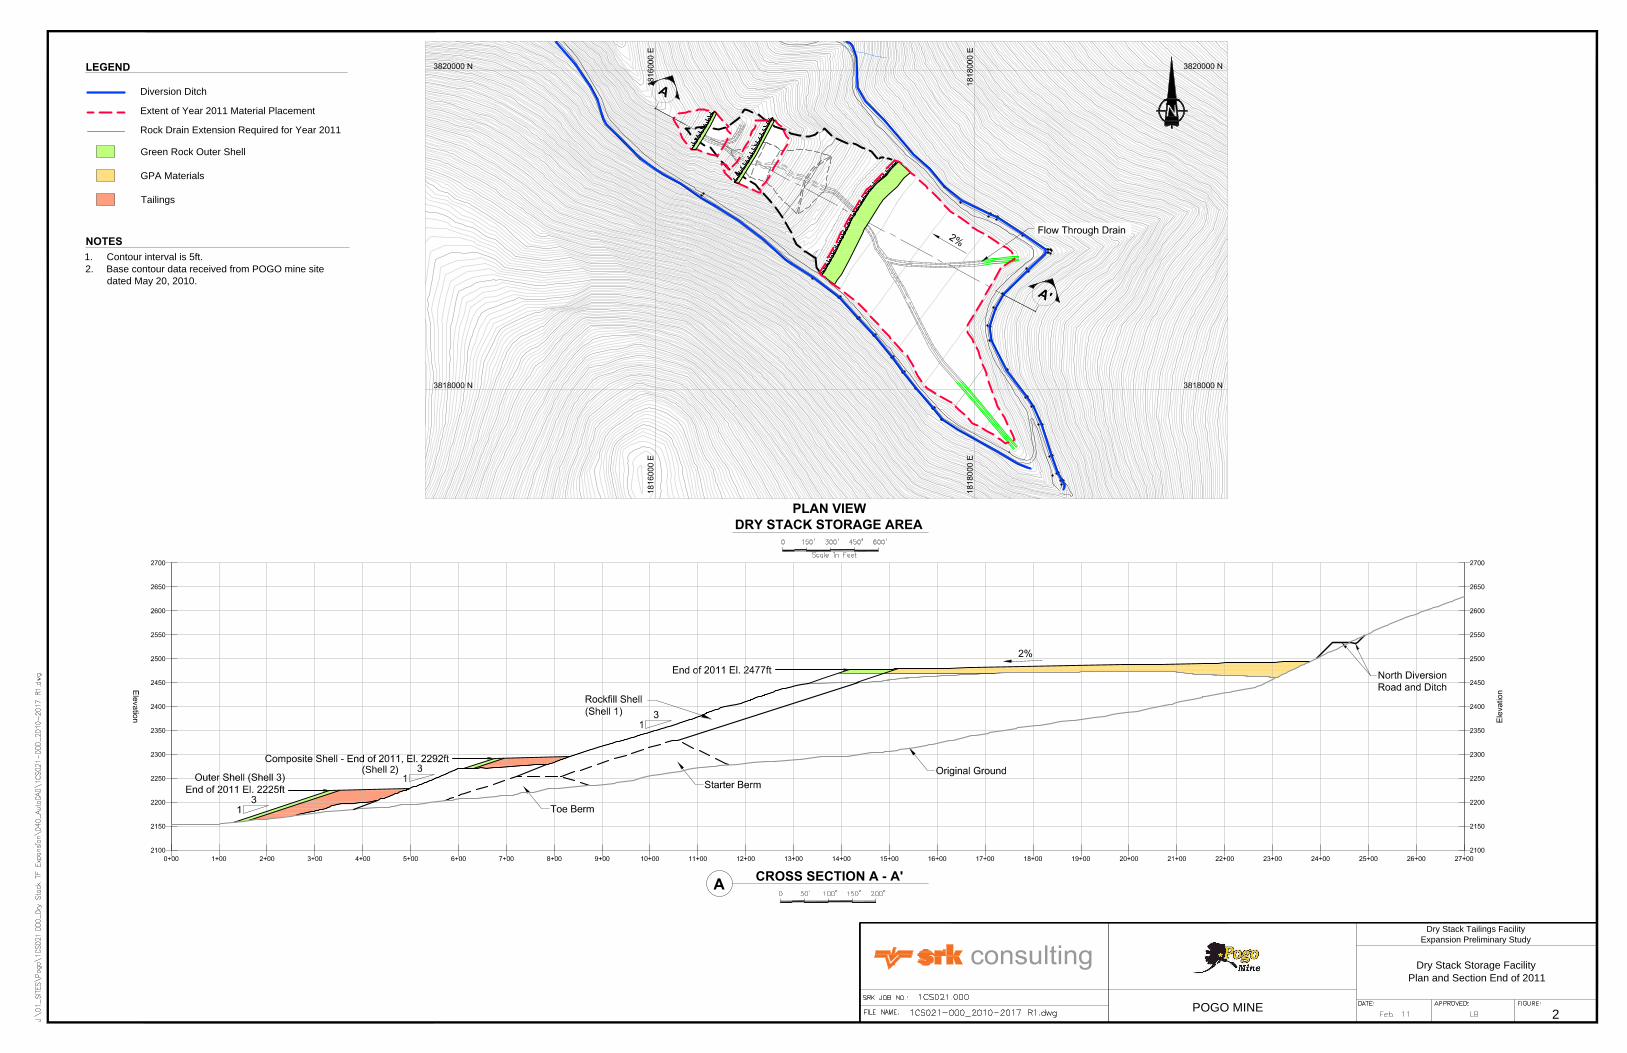
CROSS SECTION A - A'
A
PLAN VIEW
DRY STACK STORAGE AREA
Dry Stack Storage Facility
Plan and Section End of 2011
A
'
A
LEGEND
NOTES
Diversion Ditch
Extent of Year 2011 Material Placement
Rock Drain Extension Required for Year 2011
Green Rock Outer Shell
GPA Materials
Tailings
1. Contour interval is 5ft.
2. Base contour data received from POGO mine site
dated May 20, 2010.
(Shell 2)
Dry Stack Tailings Facility
Expansion Preliminary Study
POGO MINE
2
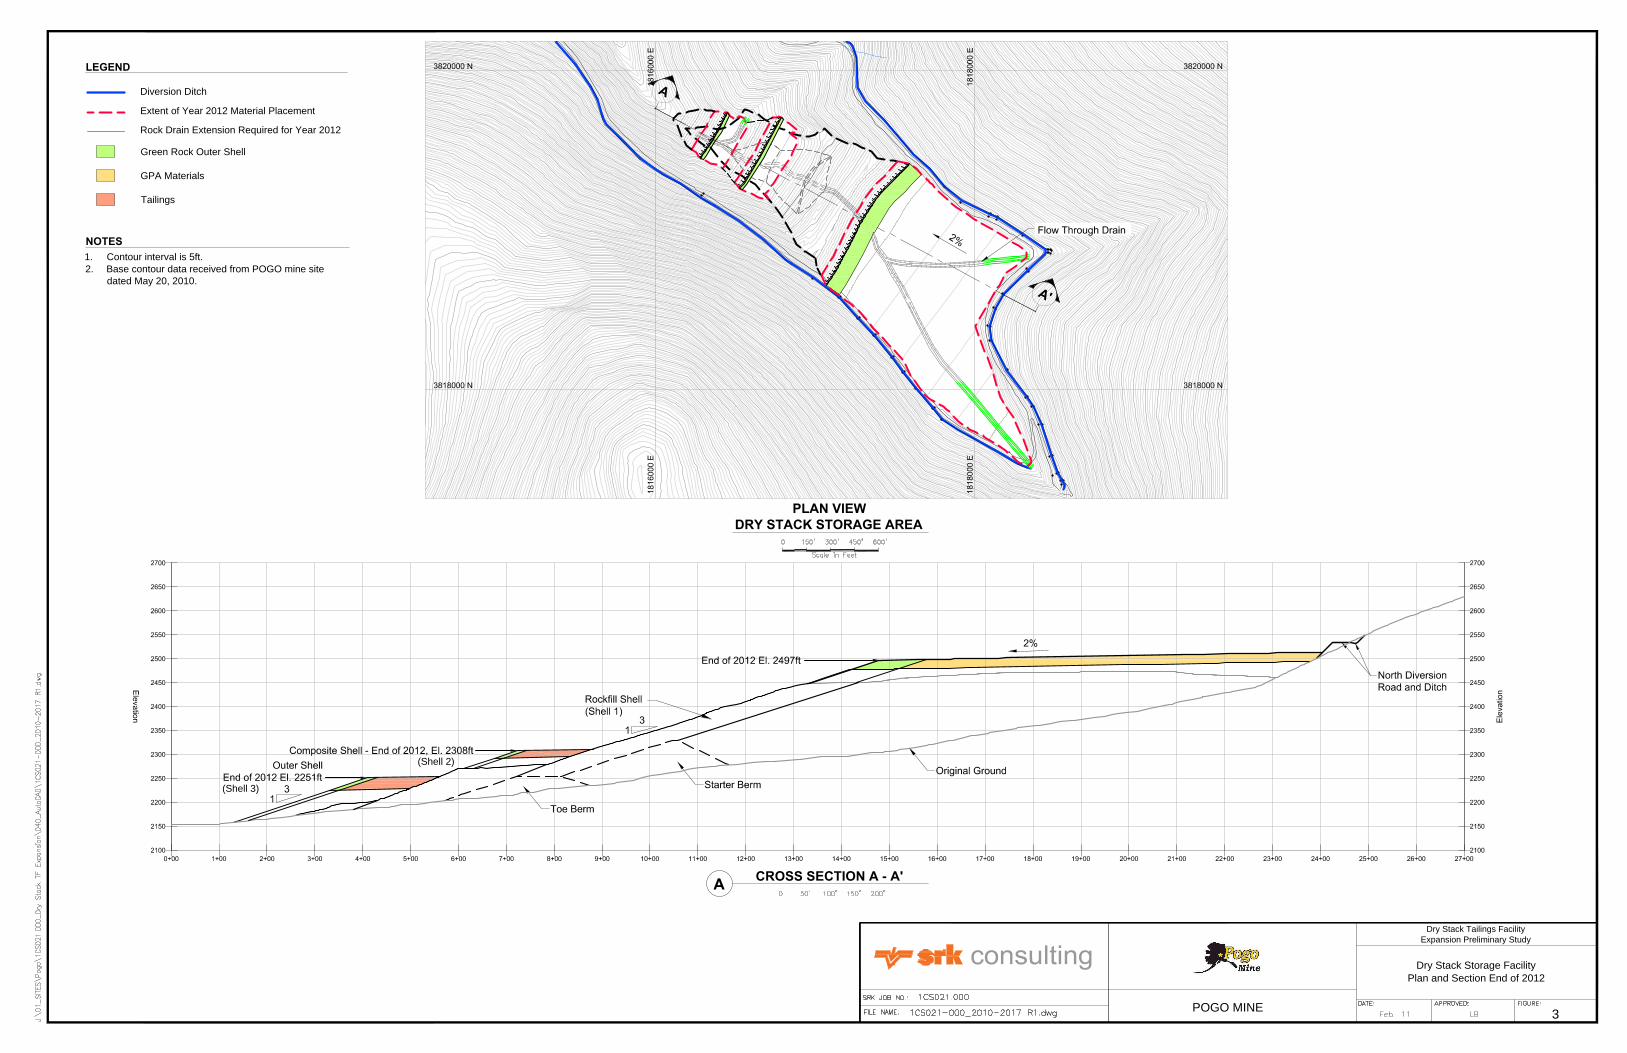
CROSS SECTION A - A'
A
PLAN VIEW
DRY STACK STORAGE AREA
A
'
A
LEGEND
Diversion Ditch
Extent of Year 2012 Material Placement
Rock Drain Extension Required for Year 2012
NOTES
Green Rock Outer Shell
GPA Materials
Tailings
1. Contour interval is 5ft.
2. Base contour data received from POGO mine site
dated May 20, 2010.
(Shell 2)
(Shell 3)
Dry Stack Storage Facility
Plan and Section End of 2012
Dry Stack Tailings Facility
Expansion Preliminary Study
POGO MINE
3
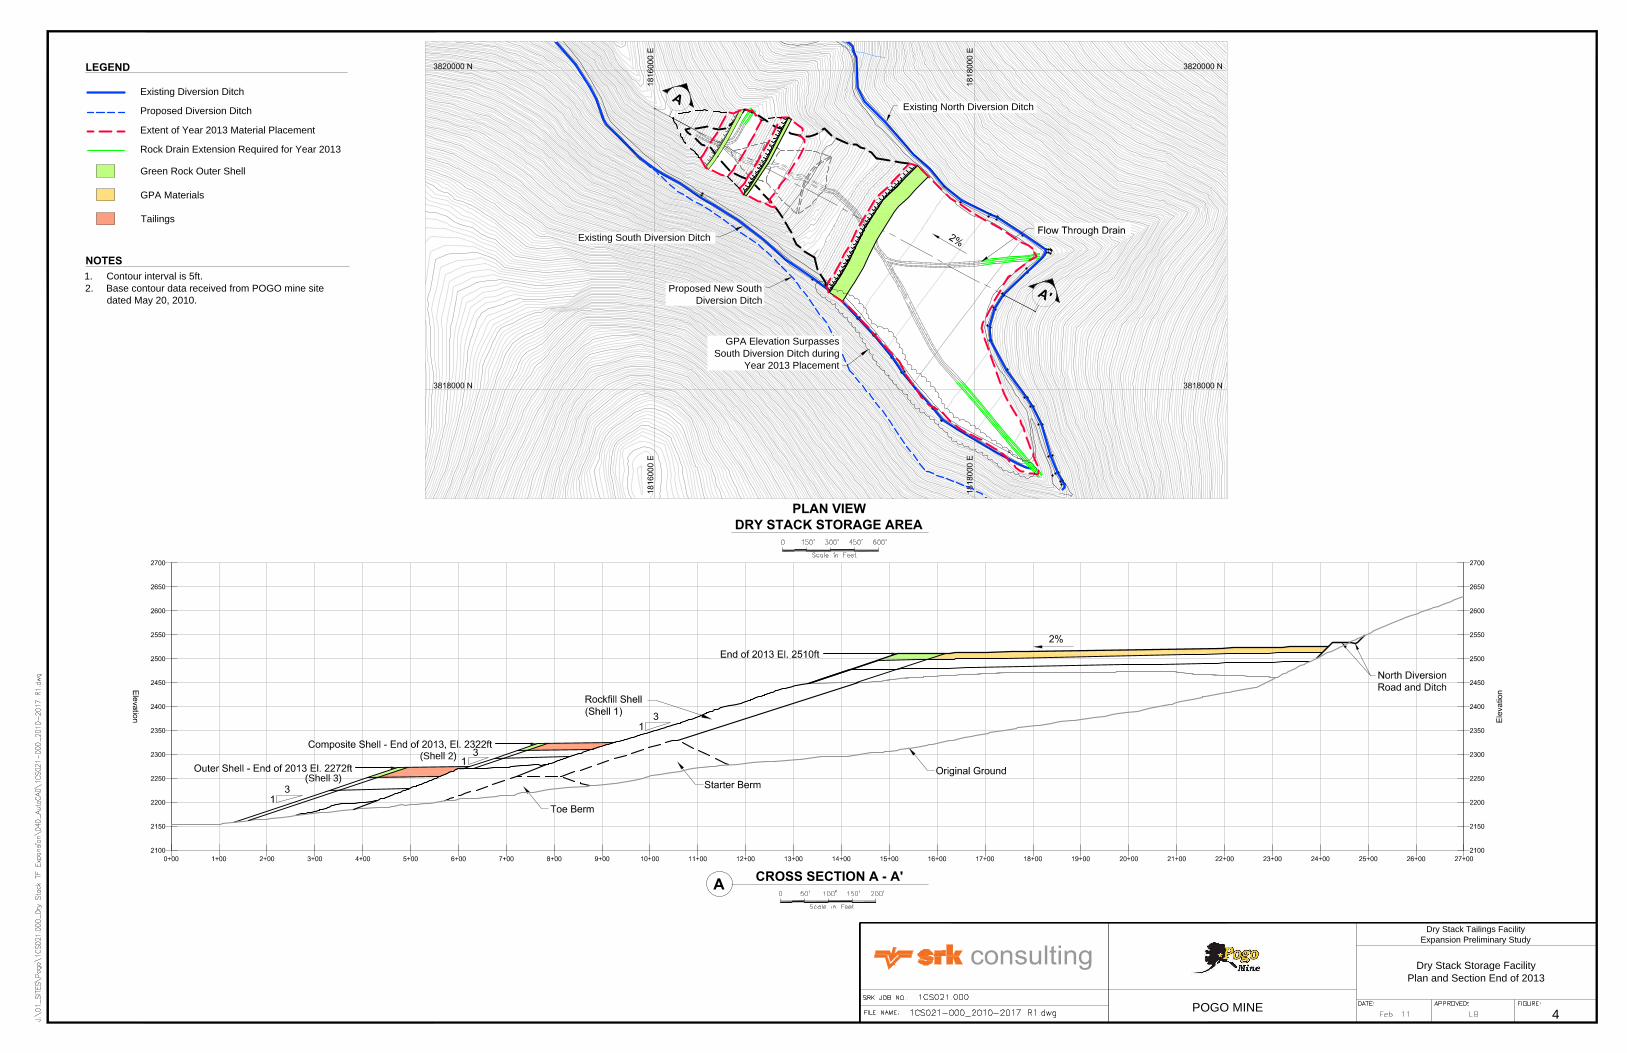
Existing South Diversion Ditch
CROSS SECTION A - A'
A
PLAN VIEW
DRY STACK STORAGE AREA
A
'
A
LEGEND
Existing Diversion Ditch
Extent of Year 2013 Material Placement
Rock Drain Extension Required for Year 2013
NOTES
Green Rock Outer Shell
GPA Materials
Tailings
GPA Elevation Surpasses
South Diversion Ditch during
Year 2013 Placement
Proposed Diversion Ditch
1. Contour interval is 5ft.
2. Base contour data received from POGO mine site
dated May 20, 2010.
Existing North Diversion Ditch
Proposed New South
Diversion Ditch
(Shell 2)
(Shell 3)
Dry Stack Storage Facility
Plan and Section End of 2013
Dry Stack Tailings Facility
Expansion Preliminary Study
POGO MINE
4
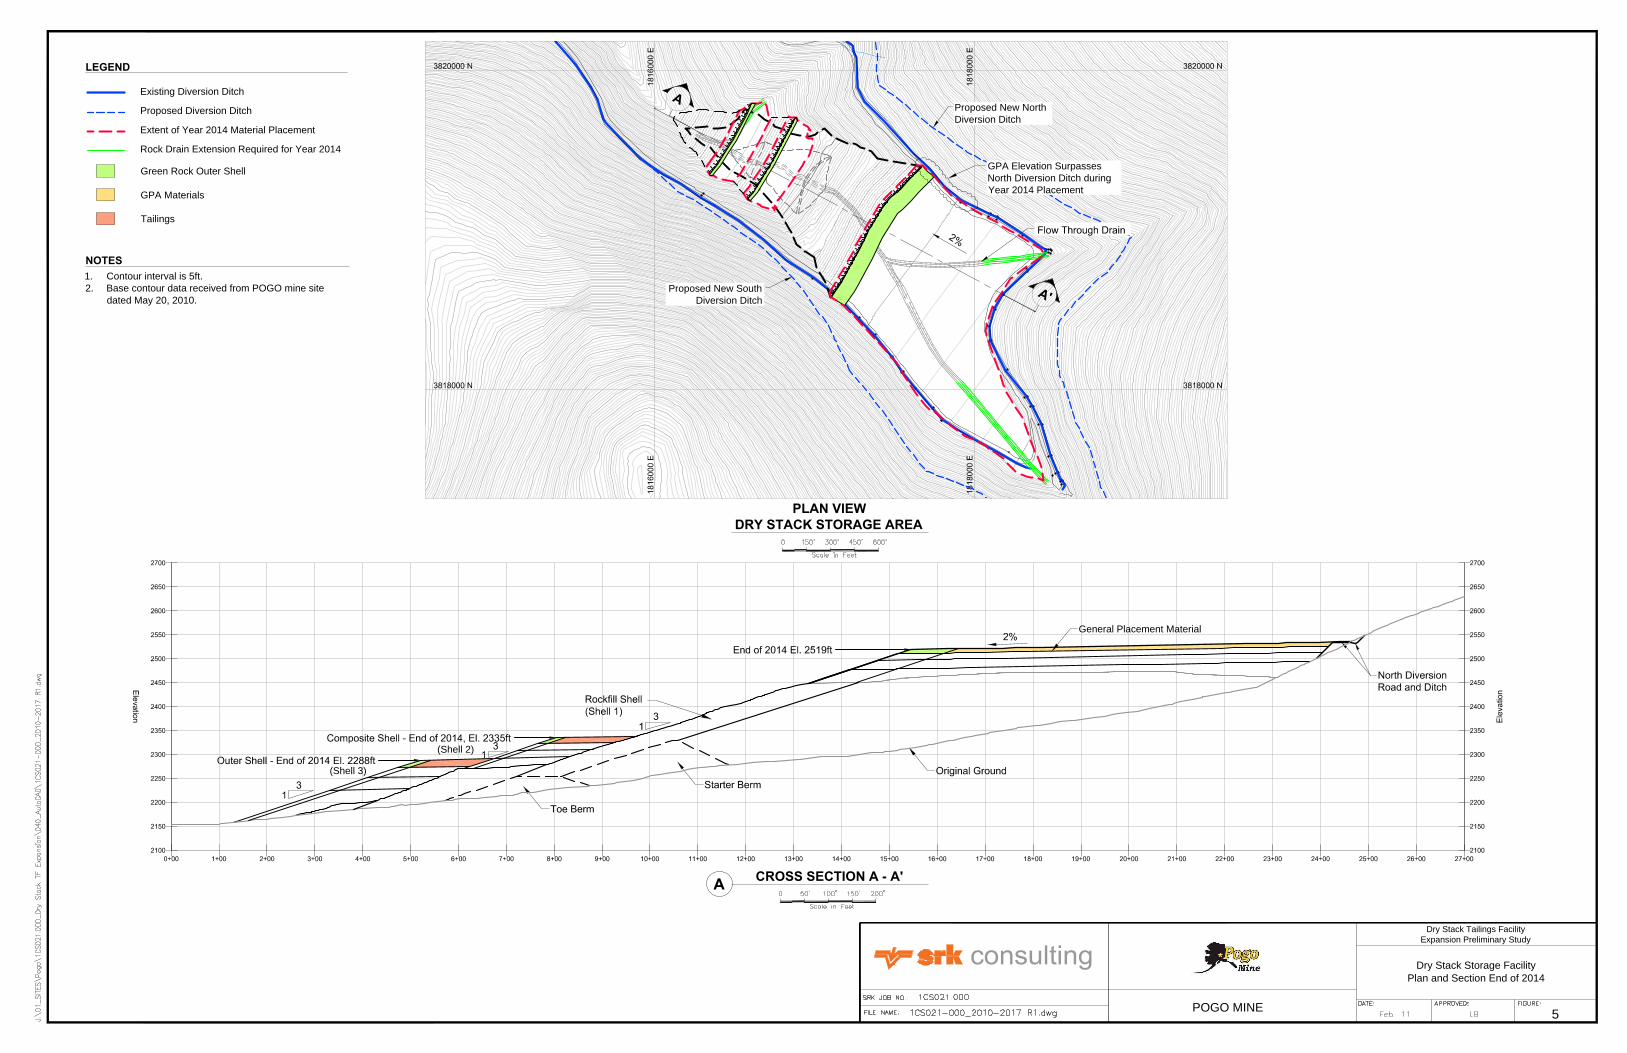
General Placement Material
CROSS SECTION A - A'
A
PLAN VIEW
DRY STACK STORAGE AREA
A
'
A
LEGEND
GPA Elevation Surpasses
North Diversion Ditch during
Year 2014 Placement
Existing Diversion Ditch
Extent of Year 2014 Material Placement
Rock Drain Extension Required for Year 2014
NOTES
Green Rock Outer Shell
GPA Materials
Tailings
Proposed Diversion Ditch
1. Contour interval is 5ft.
2. Base contour data received from POGO mine site
dated May 20, 2010.
Proposed New South
Diversion Ditch
Proposed New North
Diversion Ditch
(Shell 2)
(Shell 3)
Dry Stack Storage Facility
Plan and Section End of 2014
Dry Stack Tailings Facility
Expansion Preliminary Study
POGO MINE
5
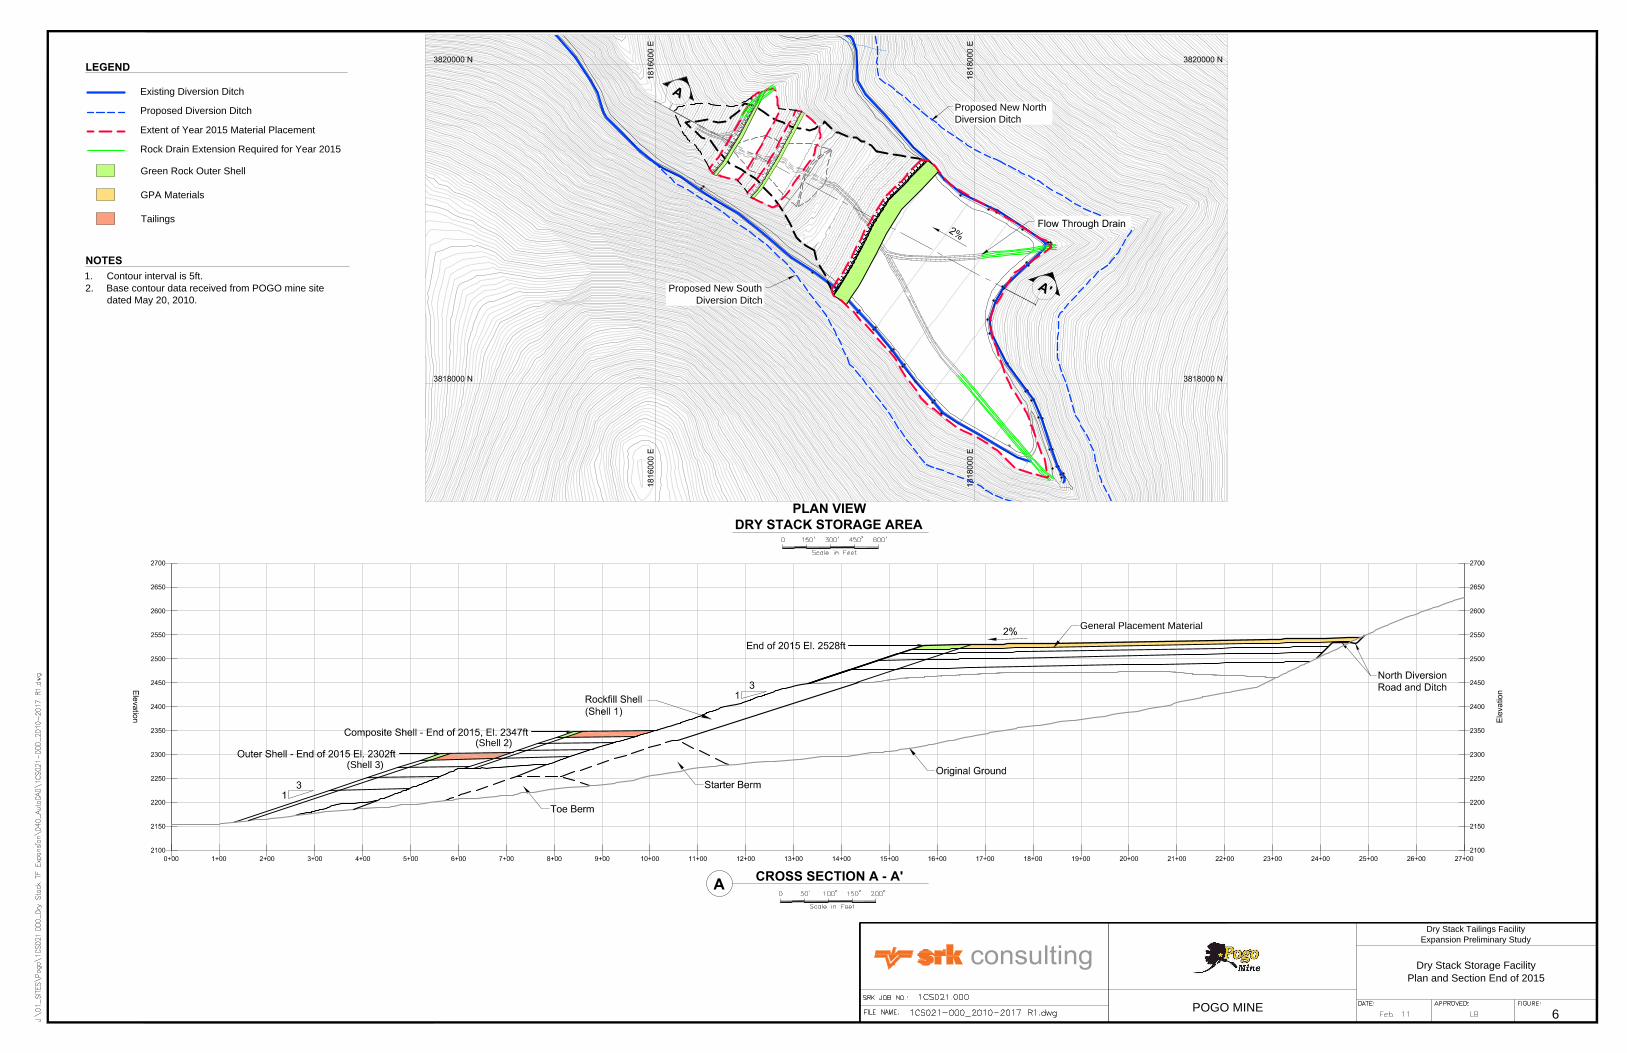
CROSS SECTION A - A'
A
PLAN VIEW
DRY STACK STORAGE AREA
A
'
A
LEGEND
General Placement Material
Existing Diversion Ditch
Extent of Year 2015 Material Placement
Rock Drain Extension Required for Year 2015
NOTES
Green Rock Outer Shell
GPA Materials
Tailings
Proposed Diversion Ditch
1. Contour interval is 5ft.
2. Base contour data received from POGO mine site
dated May 20, 2010.
Proposed New South
Diversion Ditch
Proposed New North
Diversion Ditch
(Shell 2)
(Shell 3)
Dry Stack Storage Facility
Plan and Section End of 2015
Dry Stack Tailings Facility
Expansion Preliminary Study
POGO MINE
6
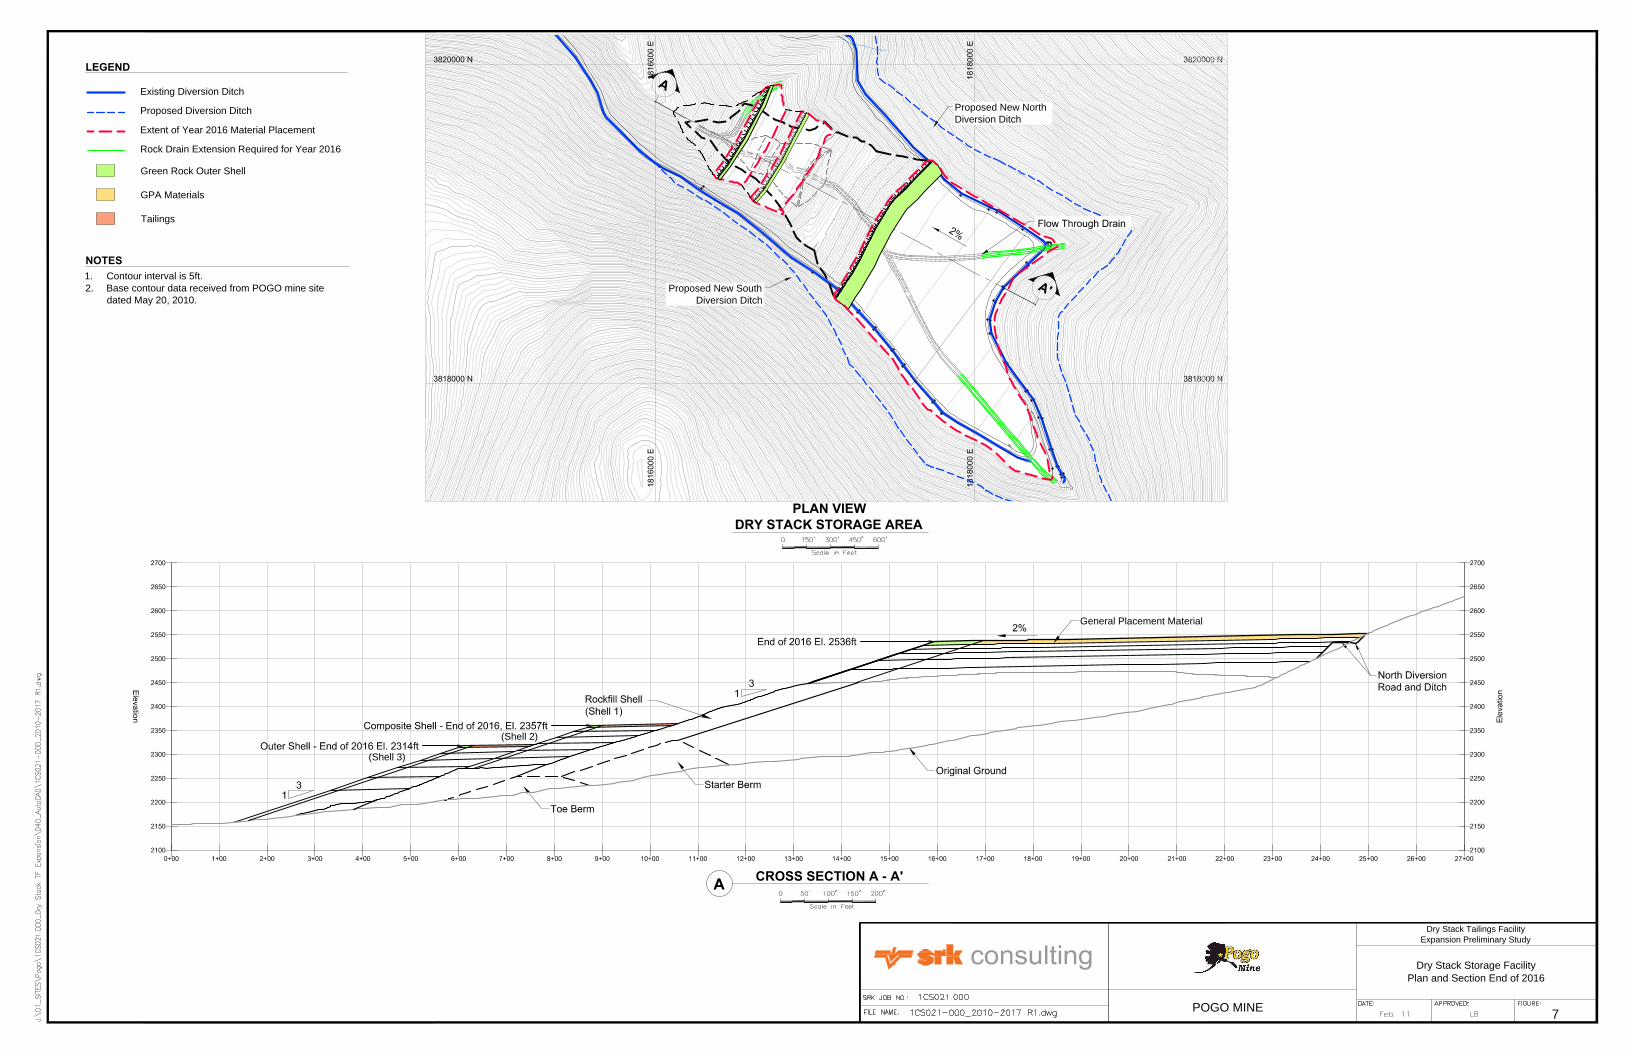
CROSS SECTION A - A'
A
PLAN VIEW
DRY STACK STORAGE AREA
A
'
A
LEGEND
General Placement Material
Existing Diversion Ditch
Extent of Year 2016 Material Placement
Rock Drain Extension Required for Year 2016
NOTES
Green Rock Outer Shell
GPA Materials
Tailings
Proposed Diversion Ditch
1. Contour interval is 5ft.
2. Base contour data received from POGO mine site
dated May 20, 2010.
Proposed New South
Diversion Ditch
Proposed New North
Diversion Ditch
(Shell 2)
(Shell 3)
Dry Stack Storage Facility
Plan and Section End of 2016
Dry Stack Tailings Facility
Expansion Preliminary Study
POGO MINE
7
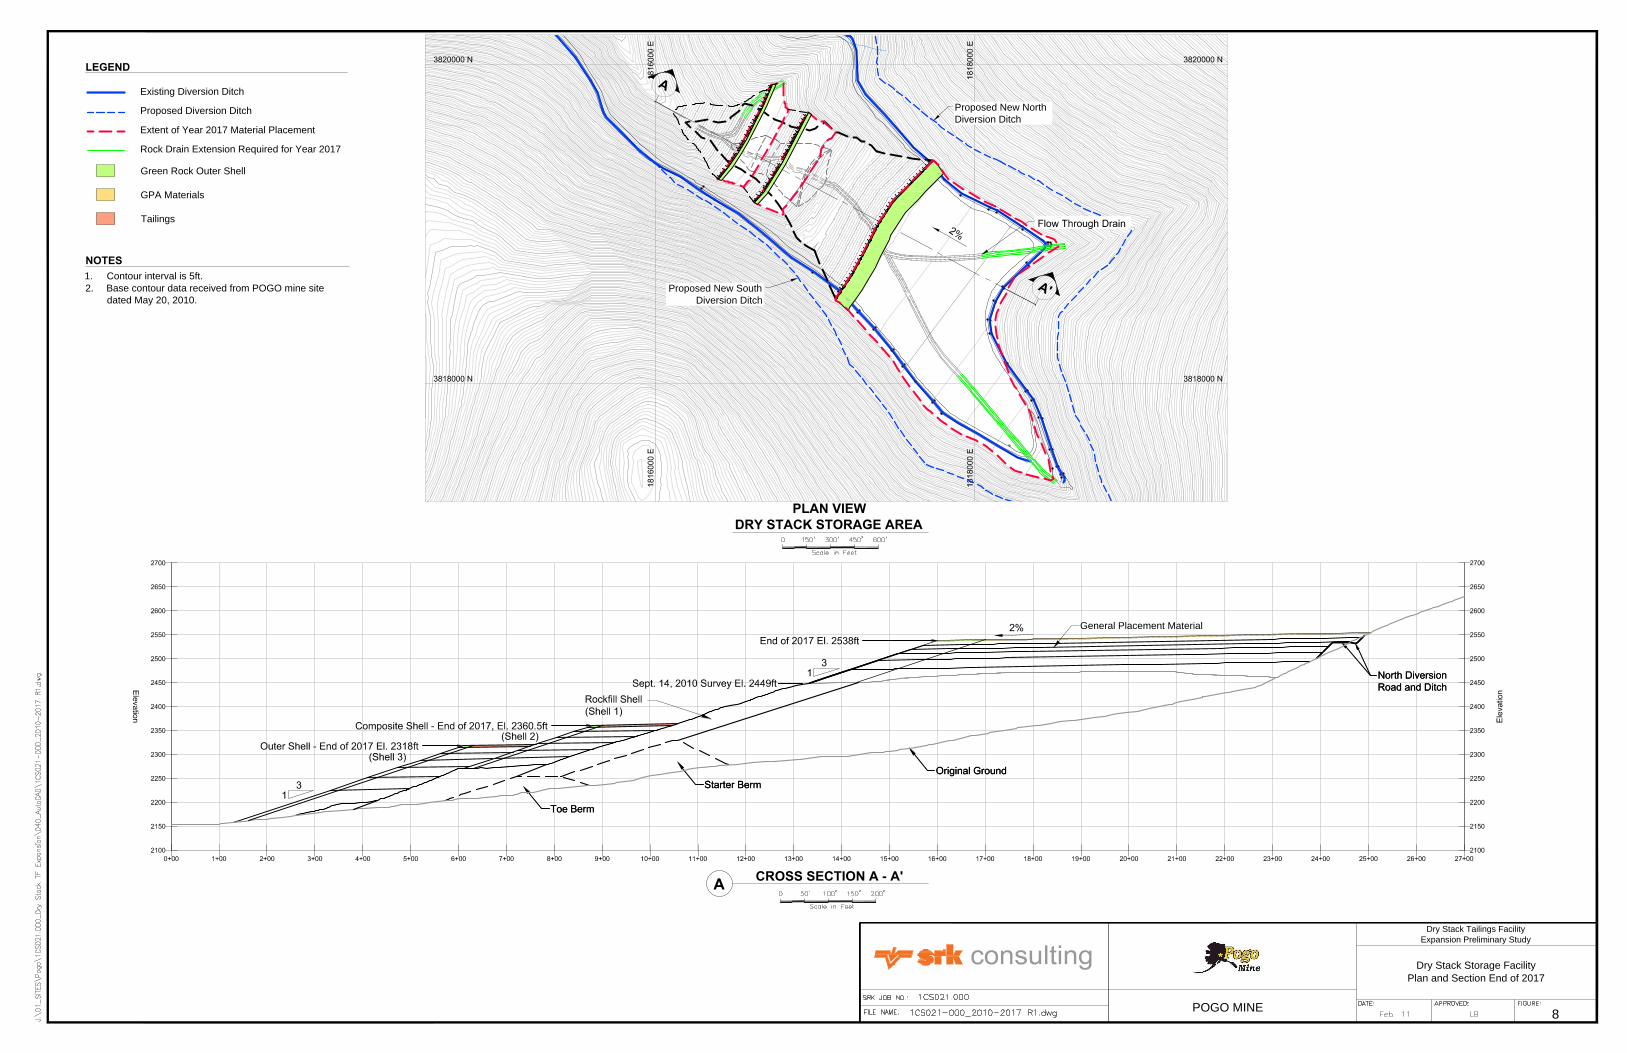
CROSS SECTION A - A'
A
PLAN VIEW
DRY STACK STORAGE AREA
A
'
A
LEGEND
General Placement Material
Existing Diversion Ditch
Extent of Year 2017 Material Placement
Rock Drain Extension Required for Year 2017
NOTES
Green Rock Outer Shell
GPA Materials
Tailings
Proposed Diversion Ditch
1. Contour interval is 5ft.
2. Base contour data received from POGO mine site
dated May 20, 2010.
Proposed New South
Diversion Ditch
Proposed New North
Diversion Ditch
Dry Stack Storage Facility
Plan and Section End of 2017
Dry Stack Tailings Facility
Expansion Preliminary Study
POGO MINE
8
CROSS SECTION A - A'
A
PLAN VIEW
DRY STACK STORAGE AREA
A
'
A
LEGEND
General Placement Material
A
v
e
r
a
g
e
G
r
a
d
e
1
6
.
2
%
A
v
e
r
a
g
e
G
r
a
d
e
1
.
9
%
A
v
e
r
a
g
e
G
r
a
d
e
1
0
.
0
%
Existing North Diversion Ditch
Existing South Diversion Ditch
Proposed South Diversion
Ditch Alignment
Proposed North Diversion
Ditch Alignment
A
v
e
r
a
g
e
G
r
a
d
e
2
.
0
%
Current Limit of Disturbed Area
Proposed Limit of Disturbed Area
(additional 1,767,145 ft
2
)
Additional 161,917,200 cu.ft. GPA
Additional 14,321,900 cu.ft. of
Shell 2 Material
Additional 14,290,800 cu.ft.
of Shell 3 Material
NOTES
Existing Diversion Ditch
Extent of Year 2030 Material Placement
Rock Drain Extension Required for Year 2030
Green Rock Outer Shell
GPA Materials
Tailings
Proposed Diversion Ditch
1. Contour interval is 10ft.
2. Base contour data received from POGO mine site
dated May 20, 2010.
3. 20 M ton configuration developed for assessment of
proposed ultimate configuration.
Dry Stack Storage Facility
Plan and Section End of 2030
(20 million Tons)
Dry Stack Tailings Facility
Expansion Preliminary Study
POGO MINE
9.1
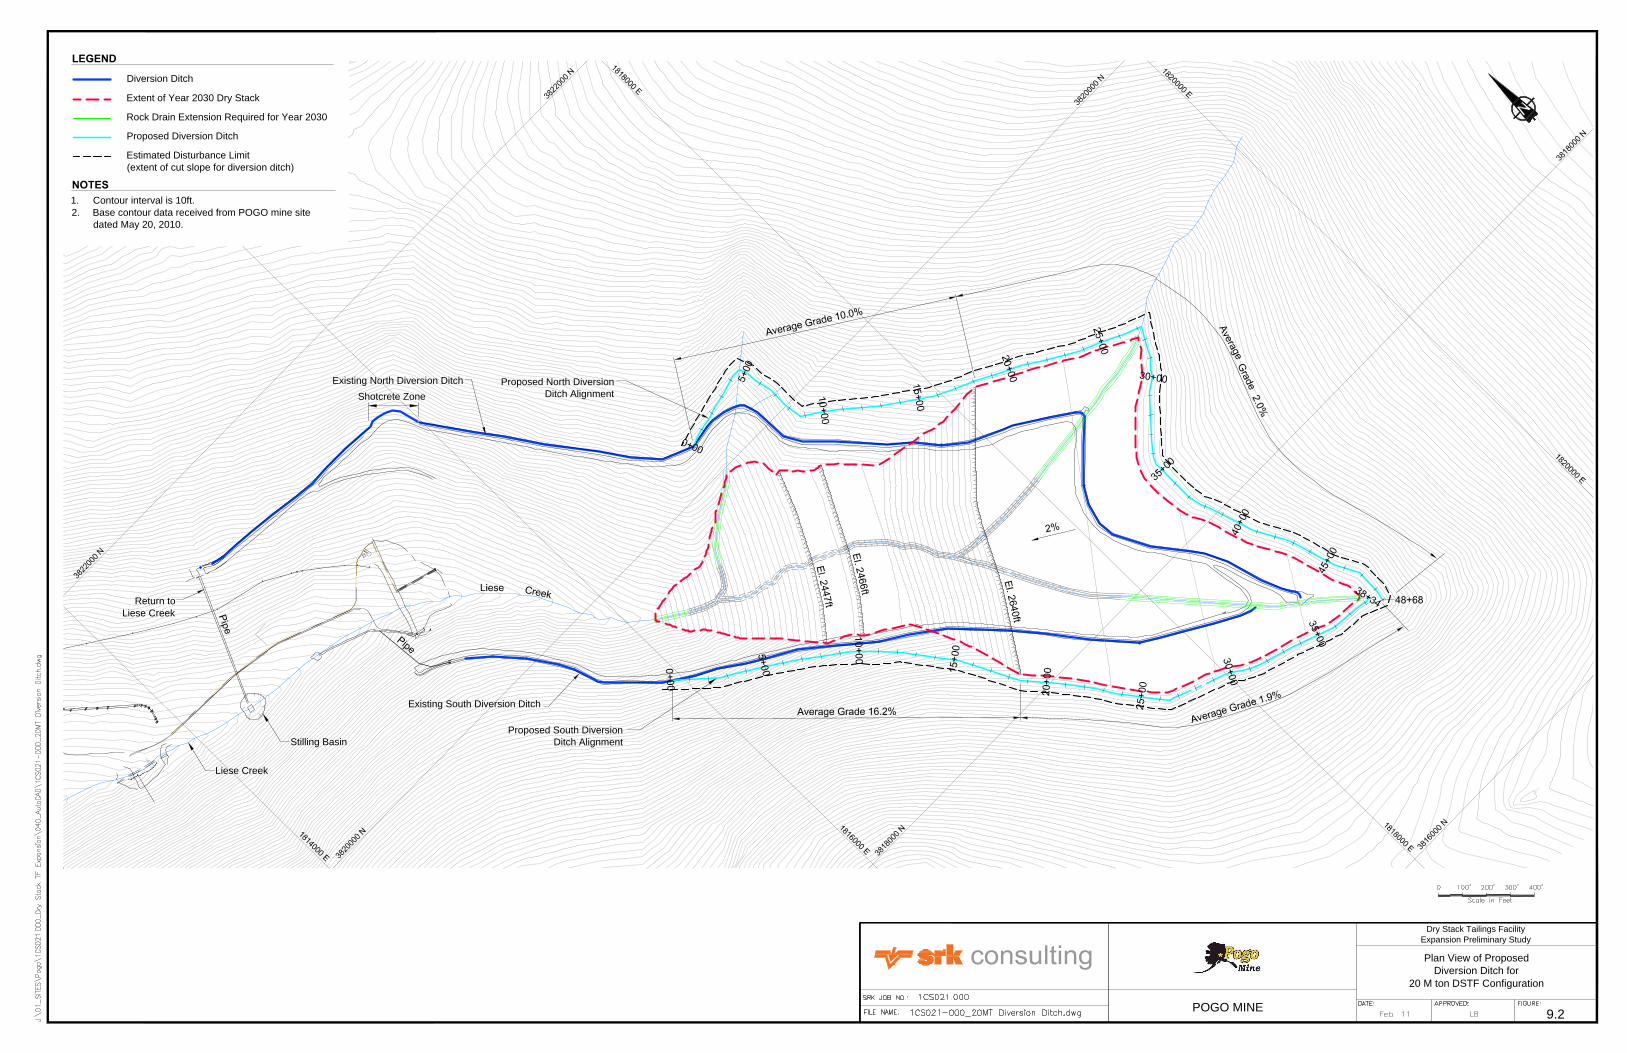
LEGEND
Diversion Ditch
Extent of Year 2030 Dry Stack
Rock Drain Extension Required for Year 2030
NOTES
1. Contour interval is 10ft.
2. Base contour data received from POGO mine site
dated May 20, 2010.
Existing North Diversion Ditch
Existing South Diversion Ditch
Proposed South Diversion
Ditch Alignment
Proposed North Diversion
Ditch Alignment
Stilling Basin
Shotcrete Zone
Liese Creek
Return to
Liese Creek
Proposed Diversion Ditch
Estimated Disturbance Limit
(extent of cut slope for diversion ditch)
Plan View of Proposed
Diversion Ditch for
20 M ton DSTF Configuration
Dry Stack Tailings Facility
Expansion Preliminary Study
POGO MINE
9.2
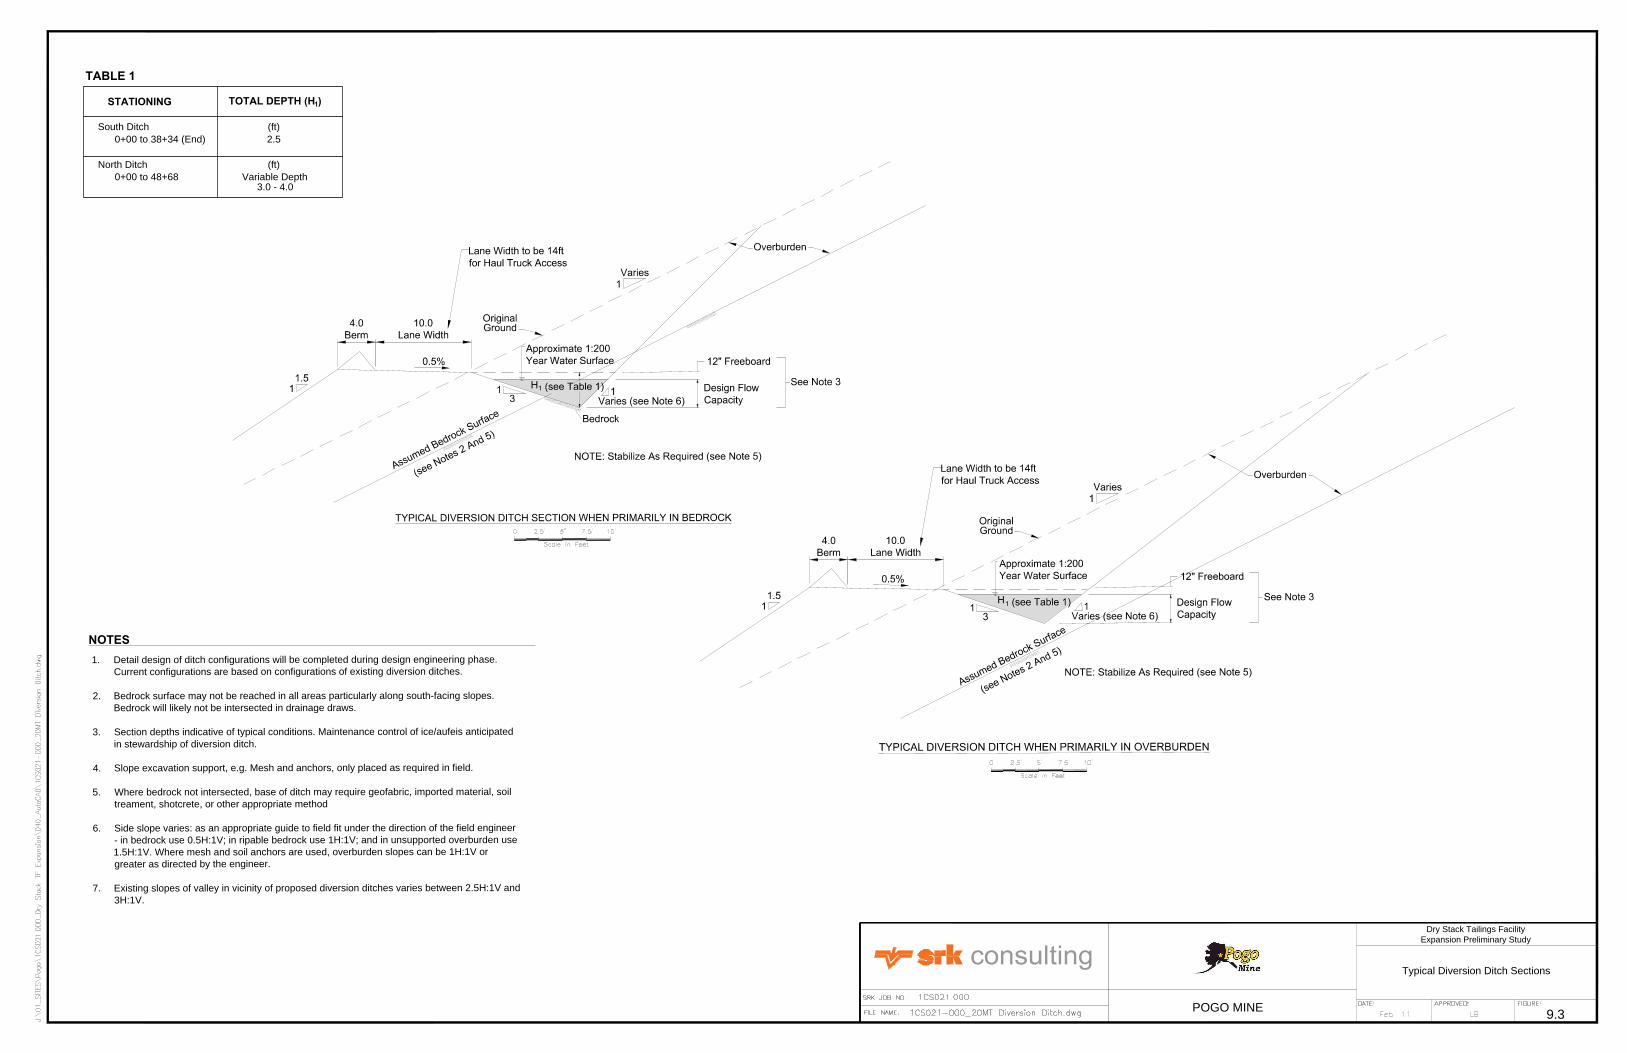
1. Detail design of ditch configurations will be completed during design engineering phase.
Current configurations are based on configurations of existing diversion ditches.
2. Bedrock surface may not be reached in all areas particularly along south-facing slopes.
Bedrock will likely not be intersected in drainage draws.
3. Section depths indicative of typical conditions. Maintenance control of ice/aufeis anticipated
in stewardship of diversion ditch.
4. Slope excavation support, e.g. Mesh and anchors, only placed as required in field.
5. Where bedrock not intersected, base of ditch may require geofabric, imported material, soil
treament, shotcrete, or other appropriate method
6. Side slope varies: as an appropriate guide to field fit under the direction of the field engineer
- in bedrock use 0.5H:1V; in ripable bedrock use 1H:1V; and in unsupported overburden use
1.5H:1V. Where mesh and soil anchors are used, overburden slopes can be 1H:1V or
greater as directed by the engineer.
7. Existing slopes of valley in vicinity of proposed diversion ditches varies between 2.5H:1V and
3H:1V.
NOTES
South Ditch (ft)
0+00 to 38+34 (End) 2.5
North Ditch (ft)
0+00 to 48+68 Variable Depth
STATIONINGTOTAL DEPTH (H )
1
TABLE 1
3.0 - 4.0
Typical Diversion Ditch Sections
Dry Stack Tailings Facility
Expansion Preliminary Study
POGO MINE
9.3
CROSS SECTION A - A'
A
PLAN VIEW
DRY STACK STORAGE FACILITY
A
'
A
LEGEND
General Placement Material
A
v
e
r
a
g
e
G
r
a
d
e
1
6
.
2
%
A
v
e
r
a
g
e
G
r
a
d
e
1
.
9
%
A
v
e
r
a
g
e
G
r
a
d
e
1
0
.
0
%
Existing North Diversion Ditch
Existing South Diversion Ditch
Proposed South Diversion
Ditch Alignment
Proposed North Diversion
Ditch Alignment
A
v
e
r
a
g
e
G
r
a
d
e
2
.
0
%
Current Limit of Disturbed Area
Proposed Limit of Disturbed Area
(additional 1,767,145 ft
2
)
Phreatice Surfaces Analyzed
NOTES
Existing Diversion Ditch
Extent of Year 2030 Material Placement
Rock Drain Extension Required for Year 2030
Green Rock Outer Shell
GPA Materials
Tailings
Proposed Diversion Ditch
1. Contour interval is 10ft.
2. Base contour data received from POGO mine site
dated May 20, 2010.
3. 20 M ton configuration developed for assessment of
proposed ultimate configuration.
EXPANSION SLIP SURFACES (20 MT)
A - SHALLOW SHELL FAILURE
B - DEEP FAILURE THROUGH GPA
C - FAILURE OF ALL SHELLS
D - DEEP FAILURE OF DSTF
Failure Surface Analyzed
For Expanded DSTF
Dry Stack Tailings Facility
Expansion Preliminary Study
POGO MINE
10

Appendices

Appendix A: Updated DSTF Material Balance
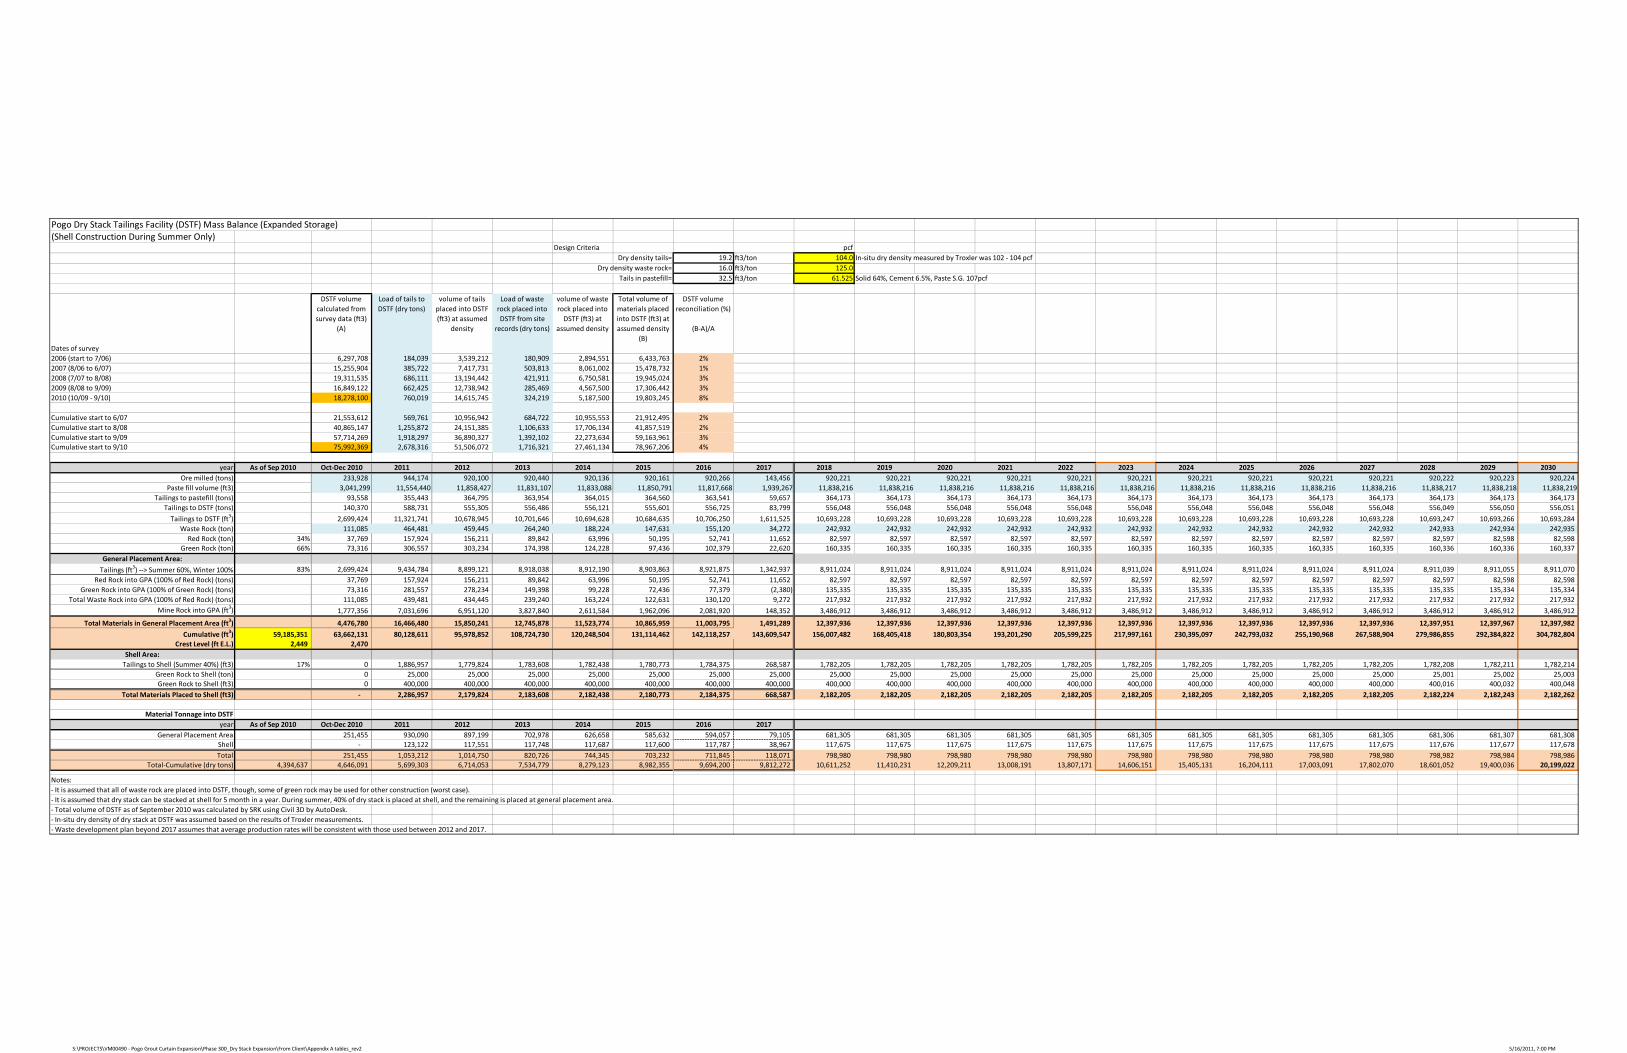
Pogo Dry Stack Tailings Facility (DSTF) Mass Balance (Expanded Storage)(Shell Construction During Summer Only)
Design Criteria pcf
Dry density tails= 19.2 ft3/ton 104.0 In‐situ dry density measured by Troxler was 102 ‐ 104 pcf
Dry density waste rock= 16.0 ft3/ton 125.0
Tails in pastefill= 32.5 ft3/ton 61.525 Solid 64%, Cement 6.5%, Paste S.G. 107pcf
Dates of survey
DSTF volume
calculated from
survey data (ft3)
(A)
Load of tails to
DSTF (dry tons)
volume of tails
placed into DSTF
(ft3) at assumed
density
Load of waste
rock placed into
DSTF from site
records (dry tons)
volume of waste
rock placed into
DSTF (ft3) at
assumed density
Total volume of
materials placed
into DSTF (ft3) at
assumed density
(B)
DSTF volume
reconciliation (%)
(B‐A)/A
2006 (start to 7/06) 6,297,708 184,039 3,539,212 180,909 2,894,551 6,433,763 2%
2007 (8/06 to 6/07) 15,255,904 385,722 7,417,731 503,813 8,061,002 15,478,732 1%
2008 (7/07 to 8/08) 19,311,535 686,111 13,194,442 421,911 6,750,581 19,945,024 3%
2009 (8/08 to 9/09) 16,849,122 662,425 12,738,942 285,469 4,567,500 17,306,442 3%
2010 (10/09 ‐ 9/10) 18,278,100 760,019 14,615,745 324,219 5,187,500 19,803,245 8%
Cumulative start to 6/07 21,553,612 569,761 10,956,942 684,722 10,955,553 21,912,495 2%
Cumulative start to 8/08 40,865,147 1,255,872 24,151,385 1,106,633 17,706,134 41,857,519 2%
Cumulative start to 9/09 57,714,269 1,918,297 36,890,327 1,392,102 22,273,634 59,163,961 3%
Cumulative start to 9/10 75,992,369 2,678,316 51,506,072 1,716,321 27,461,134 78,967,206 4%
year As of Sep 2010 Oct‐Dec 2010 2011 2012 2013 2014 2015 2016 2017 2018 2019 2020 2021 2022 2023 2024 2025 2026 2027 2028 2029 2030
Ore milled (tons) 233,928 944,174 920,100 920,440 920,136 920,161 920,266 143,456 920,221 920,221 920,221 920,221 920,221 920,221 920,221 920,221 920,221 920,221 920,222 920,223 920,224
Paste fill volume (ft3) 3,041,299 11,554,440 11,858,427 11,831,107 11,833,088 11,850,791 11,817,668 1,939,267 11,838,216 11,838,216 11,838,216 11,838,216 11,838,216 11,838,216 11,838,216 11,838,216 11,838,216 11,838,216 11,838,217 11,838,218 11,838,219
Tailings to pastefill (tons) 93,558 355,443 364,795 363,954 364,015 364,560 363,541 59,657 364,173 364,173 364,173 364,173 364,173 364,173 364,173 364,173 364,173 364,173 364,173 364,173 364,173
Tailings to DSTF (tons) 140,370 588,731 555,305 556,486 556,121 555,601 556,725 83,799 556,048 556,048 556,048 556,048 556,048 556,048 556,048 556,048 556,048 556,048 556,049 556,050 556,051
Tailings to DSTF (ft3) 2,699,424 11,321,741 10,678,945 10,701,646 10,694,628 10,684,635 10,706,250 1,611,525 10,693,228 10,693,228 10,693,228 10,693,228 10,693,228 10,693,228 10,693,228 10,693,228 10,693,228 10,693,228 10,693,247 10,693,266 10,693,284
Waste Rock (ton) 111,085 464,481 459,445 264,240 188,224 147,631 155,120 34,272 242,932 242,932 242,932 242,932 242,932 242,932 242,932 242,932 242,932 242,932 242,933 242,934 242,935
Red Rock (ton) 34% 37,769 157,924 156,211 89,842 63,996 50,195 52,741 11,652 82,597 82,597 82,597 82,597 82,597 82,597 82,597 82,597 82,597 82,597 82,597 82,598 82,598
Green Rock (ton) 66% 73,316 306,557 303,234 174,398 124,228 97,436 102,379 22,620 160,335 160,335 160,335 160,335 160,335 160,335 160,335 160,335 160,335 160,335 160,336 160,336 160,337
General Placement Area:
Tailings (ft3) ‐‐> Summer 60%, Winter 100% 83% 2,699,424 9,434,784 8,899,121 8,918,038 8,912,190 8,903,863 8,921,875 1,342,937 8,911,024 8,911,024 8,911,024 8,911,024 8,911,024 8,911,024 8,911,024 8,911,024 8,911,024 8,911,024 8,911,039 8,911,055 8,911,070
Red Rock into GPA (100% of Red Rock) (tons) 37,769 157,924 156,211 89,842 63,996 50,195 52,741 11,652 82,597 82,597 82,597 82,597 82,597 82,597 82,597 82,597 82,597 82,597 82,597 82,598 82,598
Green Rock into GPA (100% of Green Rock) (tons) 73,316 281,557 278,234 149,398 99,228 72,436 77,379 (2,380) 135,335 135,335 135,335 135,335 135,335 135,335 135,335 135,335 135,335 135,335 135,335 135,334 135,334
Total Waste Rock into GPA (100% of Red Rock) (tons) 111,085 439,481 434,445 239,240 163,224 122,631 130,120 9,272 217,932 217,932 217,932 217,932 217,932 217,932 217,932 217,932 217,932 217,932 217,932 217,932 217,932
Mine Rock into GPA (ft3) 1,777,356 7,031,696 6,951,120 3,827,840 2,611,584 1,962,096 2,081,920 148,352 3,486,912 3,486,912 3,486,912 3,486,912 3,486,912 3,486,912 3,486,912 3,486,912 3,486,912 3,486,912 3,486,912 3,486,912 3,486,912
Total Materials in General Placement Area (ft3) 4,476,780 16,466,480 15,850,241 12,745,878 11,523,774 10,865,959 11,003,795 1,491,289 12,397,936 12,397,936 12,397,936 12,397,936 12,397,936 12,397,936 12,397,936 12,397,936 12,397,936 12,397,936 12,397,951 12,397,967 12,397,982
Cumulative (ft3) 59,185,351 63,662,131 80,128,611 95,978,852 108,724,730 120,248,504 131,114,462 142,118,257 143,609,547 156,007,482 168,405,418 180,803,354 193,201,290 205,599,225 217,997,161 230,395,097 242,793,032 255,190,968 267,588,904 279,986,855 292,384,822 304,782,804
Crest Level (ft E.L.) 2,449 2,470
Shell Area:
Tailings to Shell (Summer 40%) (ft3) 17% 0 1,886,957 1,779,824 1,783,608 1,782,438 1,780,773 1,784,375 268,587 1,782,205 1,782,205 1,782,205 1,782,205 1,782,205 1,782,205 1,782,205 1,782,205 1,782,205 1,782,205 1,782,208 1,782,211 1,782,214
Green Rock to Shell (ton) 0 25,000 25,000 25,000 25,000 25,000 25,000 25,000 25,000 25,000 25,000 25,000 25,000 25,000 25,000 25,000 25,000 25,000 25,001 25,002 25,003
Green Rock to Shell (ft3) 0 400,000 400,000 400,000 400,000 400,000 400,000 400,000 400,000 400,000 400,000 400,000 400,000 400,000 400,000 400,000 400,000 400,000 400,016 400,032 400,048
Total Materials Placed to Shell (ft3) ‐ 2,286,957 2,179,824 2,183,608 2,182,438 2,180,773 2,184,375 668,587 2,182,205 2,182,205 2,182,205 2,182,205 2,182,205 2,182,205 2,182,205 2,182,205 2,182,205 2,182,205 2,182,224 2,182,243 2,182,262
Material Tonnage into DSTF
year As of Sep 2010 Oct‐Dec 2010 2011 2012 2013 2014 2015 2016 2017
General Placement Area 251,455 930,090 897,199 702,978 626,658 585,632 594,057 79,105 681,305 681,305 681,305 681,305 681,305 681,305 681,305 681,305 681,305 681,305 681,306 681,307 681,308
Shell ‐ 123,122 117,551 117,748 117,687 117,600 117,787 38,967 117,675 117,675 117,675 117,675 117,675 117,675 117,675 117,675 117,675 117,675 117,676 117,677 117,678
Total 251,455 1,053,212 1,014,750 820,726 744,345 703,232 711,845 118,071 798,980 798,980 798,980 798,980 798,980 798,980 798,980 798,980 798,980 798,980 798,982 798,984 798,986
Total‐Cumulative (dry tons) 4,394,637 4,646,091 5,699,303 6,714,053 7,534,779 8,279,123 8,982,355 9,694,200 9,812,272 10,611,252 11,410,231 12,209,211 13,008,191 13,807,171 14,606,151 15,405,131 16,204,111 17,003,091 17,802,070 18,601,052 19,400,036 20,199,022
Notes:
‐ It is assumed that all of waste rock are placed into DSTF, though, some of green rock may be used for other construction (worst case).
‐ It is assumed that dry stack can be stacked at shell for 5 month in a year. During summer, 40% of dry stack is placed at shell, and the remaining is placed at general placement area.
‐ Total volume of DSTF as of September 2010 was calculated by SRK using Civil 3D by AutoDesk.
‐ In‐situ dry density of dry stack at DSTF was assumed based on the results of Troxler measurements.
‐ Waste development plan beyond 2017 assumes that average production rates will be consistent with those used between 2012 and 2017.
S:\PROJECTS\VM00490 ‐ Pogo Grout Curtain Expansion\Phase 300_Dry Stack Expansion\From Client\Appendix A tables_rev2 5/16/2011, 7:00 PM

Appendix B: Stability Analysis Results
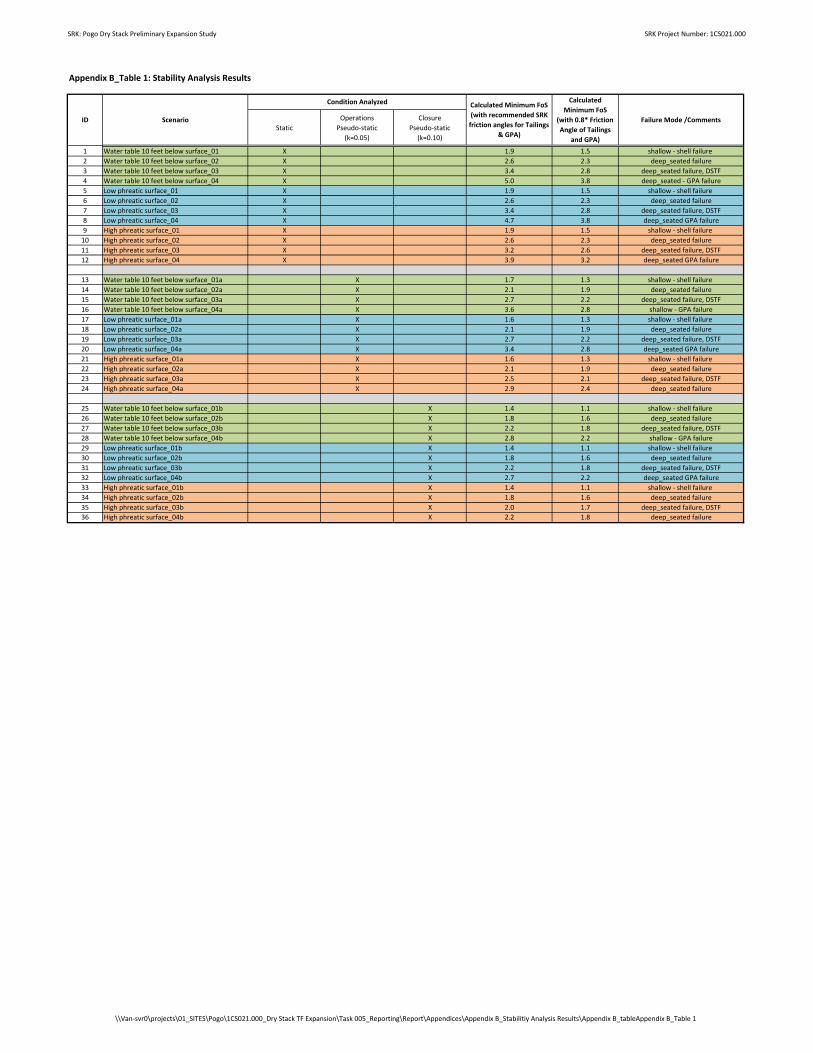
SRK: Pogo Dry Stack Preliminary Expansion Study SRK Project Number: 1CS021.000
Appendix B_Table 1: Stability Analysis Results
Static
Operations
Pseudo‐static
(k=0.05)
Closure
Pseudo‐static
(k=0.10)
1 Water table 10 feet below surface_01 X 1.9 1.5 shallow ‐ shell failure
2 Water table 10 feet below surface_02 X 2.6 2.3 deep_seated failure
3 Water table 10 feet below surface_03 X 3.4 2.8 deep_seated failure, DSTF
4 Water table 10 feet below surface_04 X 5.0 3.8 deep_seated ‐ GPA failure
5 Low phreatic surface_01 X 1.9 1.5 shallow ‐ shell failure
6 Low phreatic surface_02 X 2.6 2.3 deep_seated failure
7 Low phreatic surface_03 X 3.4 2.8 deep_seated failure, DSTF
8 Low phreatic surface_04 X 4.7 3.8 deep_seated GPA failure
9 High phreatic surface_01 X 1.9 1.5 shallow ‐ shell failure
10 High phreatic surface_02 X 2.6 2.3 deep_seated failure
11 High phreatic surface_03 X 3.2 2.6 deep_seated failure, DSTF
12 High phreatic surface_04 X 3.9 3.2 deep_seated GPA failure
13 Water table 10 feet below surface_01a X 1.7 1.3 shallow ‐ shell failure
14 Water table 10 feet below surface_02a X 2.1 1.9 deep_seated failure
15 Water table 10 feet below surface_03a X 2.7 2.2 deep_seated failure, DSTF
16 Water table 10 feet below surface_04a X 3.6 2.8 shallow ‐ GPA failure
17 Low phreatic surface_01a X 1.6 1.3 shallow ‐ shell failure
18 Low phreatic surface_02a X 2.1 1.9 deep_seated failure
19 Low phreatic surface_03a X 2.7 2.2 deep_seated failure, DSTF
20 Low phreatic surface_04a X 3.4 2.8 deep_seated GPA failure
21 High phreatic surface_01a X 1.6 1.3 shallow ‐ shell failure
22 High phreatic surface_02a X 2.1 1.9 deep_seated failure
23 High phreatic surface_03a X 2.5 2.1 deep_seated failure, DSTF
24 High phreatic surface_04a X 2.9 2.4 deep_seated failure
25 Water table 10 feet below surface_01b X 1.4 1.1 shallow ‐ shell failure
26 Water table 10 feet below surface_02b X 1.8 1.6 deep_seated failure
27 Water table 10 feet below surface_03b X 2.2 1.8 deep_seated failure, DSTF
28 Water table 10 feet below surface_04b X 2.8 2.2 shallow ‐ GPA failure
29 Low phreatic surface_01b X 1.4 1.1 shallow ‐ shell failure
30 Low phreatic surface_02b X 1.8 1.6 deep_seated failure
31 Low phreatic surface_03b X 2.2 1.8 deep_seated failure, DSTF
32 Low phreatic surface_04b X 2.7 2.2 deep_seated GPA failure
33 High phreatic surface_01b X 1.4 1.1 shallow ‐ shell failure
34 High phreatic surface_02b X 1.8 1.6 deep_seated failure
35 High phreatic surface_03b X 2.0 1.7 deep_seated failure, DSTF
36 High phreatic surface_04b X 2.2 1.8 deep_seated failure
ID Scenario
Condition Analyzed Calculated Minimum FoS
(with recommended SRK
friction angles for Tailings
& GPA)
Failure Mode /Comments
Calculated
Minimum FoS
(with 0.8* Friction
Angle of Tailings
and GPA)
\\Van‐svr0\projects\01_SITES\Pogo\1CS021.000_Dry Stack TF Expansion\Task 005_Reporting\Report\Appendices\Appendix B_Stabilitiy Analysis Results\Appendix B_tableAppendix B_Table 1

Operations Static Loading

4.987
Distance
-10 90 190 290 390 490 590 690 790 890 990
Ele
vatio
n
600
620
640
660
680
700
720
740
760
780
800
820
840
860
880
900

3.382
Distance
-10 90 190 290 390 490 590 690 790 890 990
Ele
vatio
n
600
620
640
660
680
700
720
740
760
780
800
820
840
860
880
900
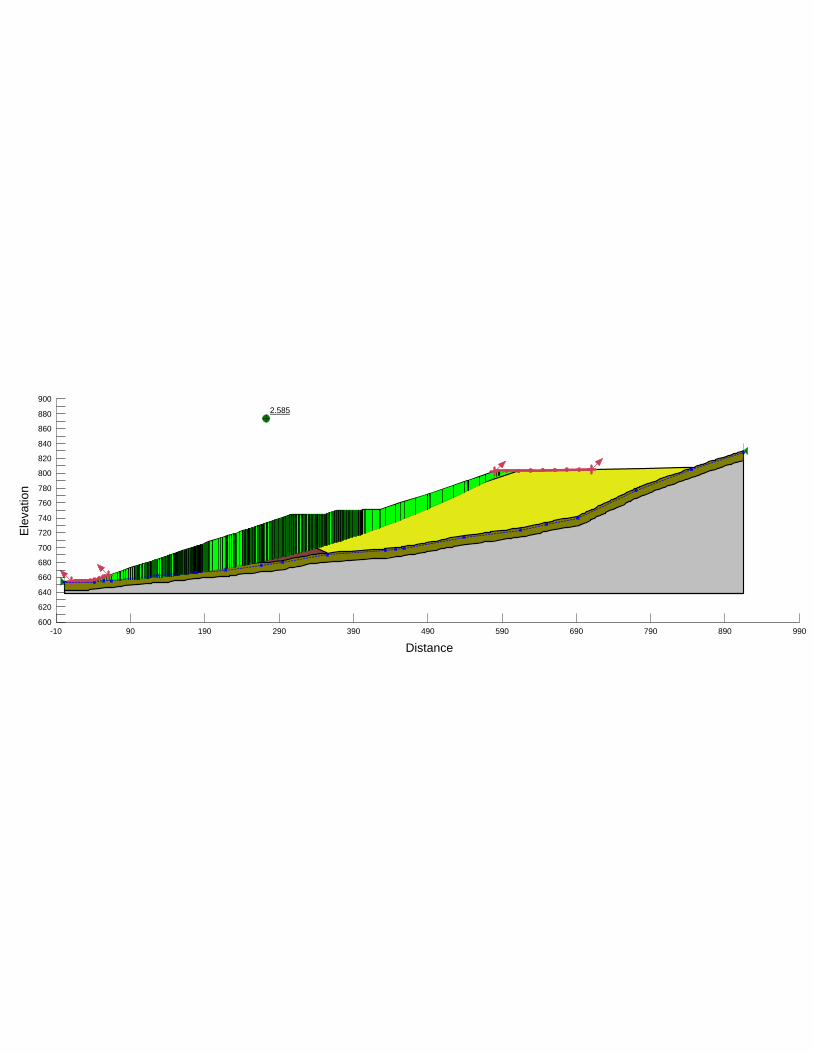
2.585
Distance
-10 90 190 290 390 490 590 690 790 890 990
Ele
vatio
n
600
620
640
660
680
700
720
740
760
780
800
820
840
860
880
900

1.915
Distance
-10 90 190 290 390 490 590 690 790 890 990
Ele
vatio
n
600
620
640
660
680
700
720
740
760
780
800
820
840
860
880
900

4.713
Distance
-10 90 190 290 390 490 590 690 790 890 990
Ele
vatio
n
600
620
640
660
680
700
720
740
760
780
800
820
840
860
880
900

3.382
Distance
-10 90 190 290 390 490 590 690 790 890 990
Ele
vatio
n
600
620
640
660
680
700
720
740
760
780
800
820
840
860
880
900

2.585
Distance
-10 90 190 290 390 490 590 690 790 890 990
Ele
vatio
n
600
620
640
660
680
700
720
740
760
780
800
820
840
860
880
900

1.915
Distance
-10 90 190 290 390 490 590 690 790 890 990
Ele
vatio
n
600
620
640
660
680
700
720
740
760
780
800
820
840
860
880
900
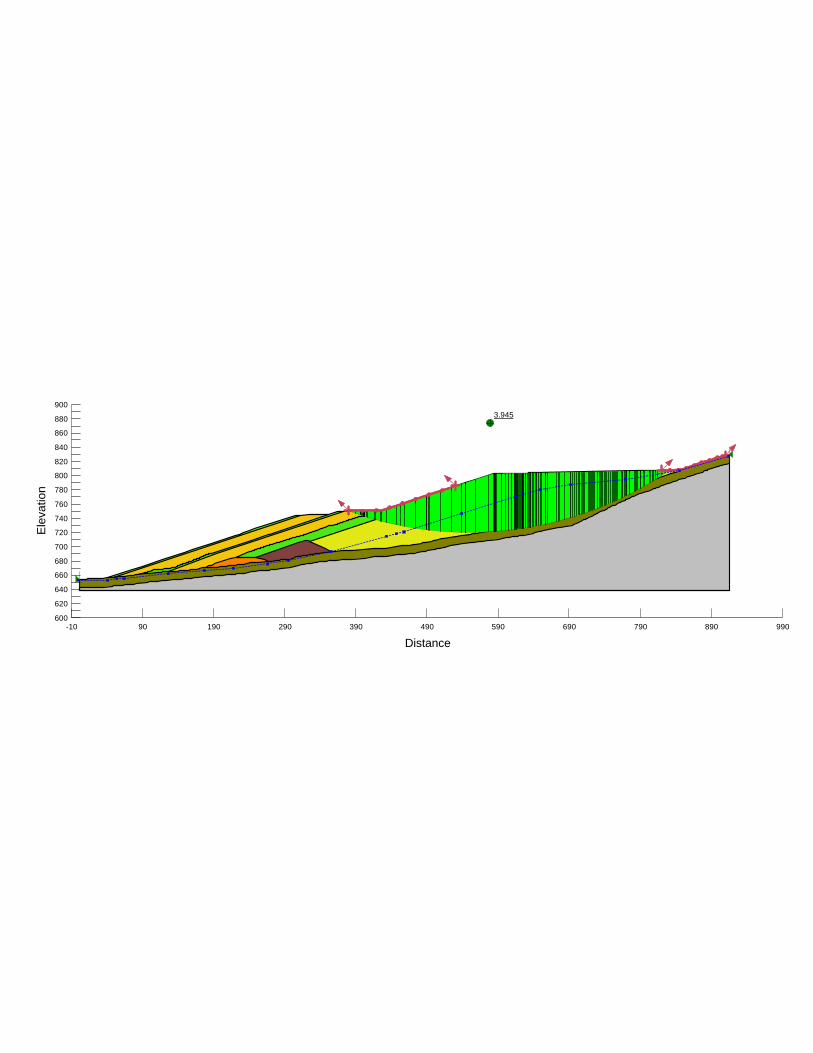
3.945
Distance
-10 90 190 290 390 490 590 690 790 890 990
Ele
vatio
n
600
620
640
660
680
700
720
740
760
780
800
820
840
860
880
900

3.165
Distance
-10 90 190 290 390 490 590 690 790 890 990
Ele
vatio
n
600
620
640
660
680
700
720
740
760
780
800
820
840
860
880
900
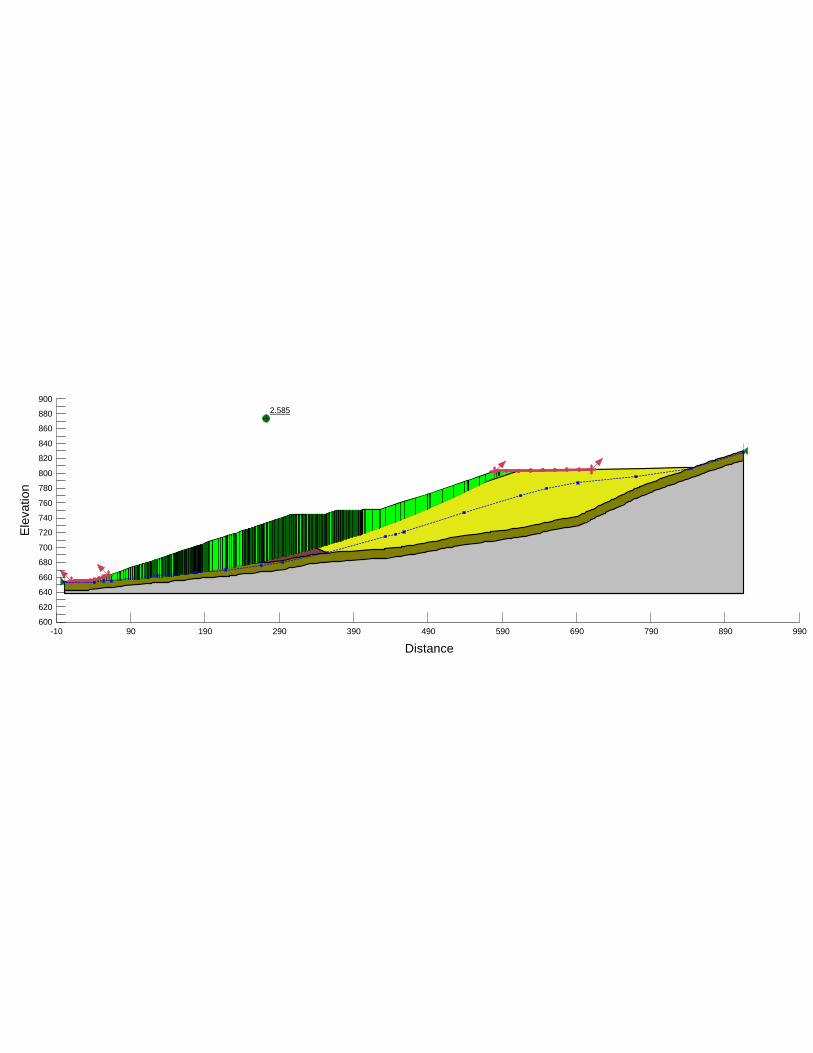
2.585
Distance
-10 90 190 290 390 490 590 690 790 890 990
Ele
vatio
n
600
620
640
660
680
700
720
740
760
780
800
820
840
860
880
900

1.915
Distance
-10 90 190 290 390 490 590 690 790 890 990
Ele
vatio
n
600
620
640
660
680
700
720
740
760
780
800
820
840
860
880
900

Operations Pseudo-Static Loading

3.627
Distance
-10 90 190 290 390 490 590 690 790 890 990
Ele
vatio
n
600
620
640
660
680
700
720
740
760
780
800
820
840
860
880
900

2.671
Distance
-10 90 190 290 390 490 590 690 790 890 990
Ele
vatio
n
600
620
640
660
680
700
720
740
760
780
800
820
840
860
880
900

2.133
Distance
-10 90 190 290 390 490 590 690 790 890 990
Ele
vatio
n
600
620
640
660
680
700
720
740
760
780
800
820
840
860
880
900

1.637
Distance
-10 90 190 290 390 490 590 690 790 890 990
Ele
vatio
n
600
620
640
660
680
700
720
740
760
780
800
820
840
860
880
900
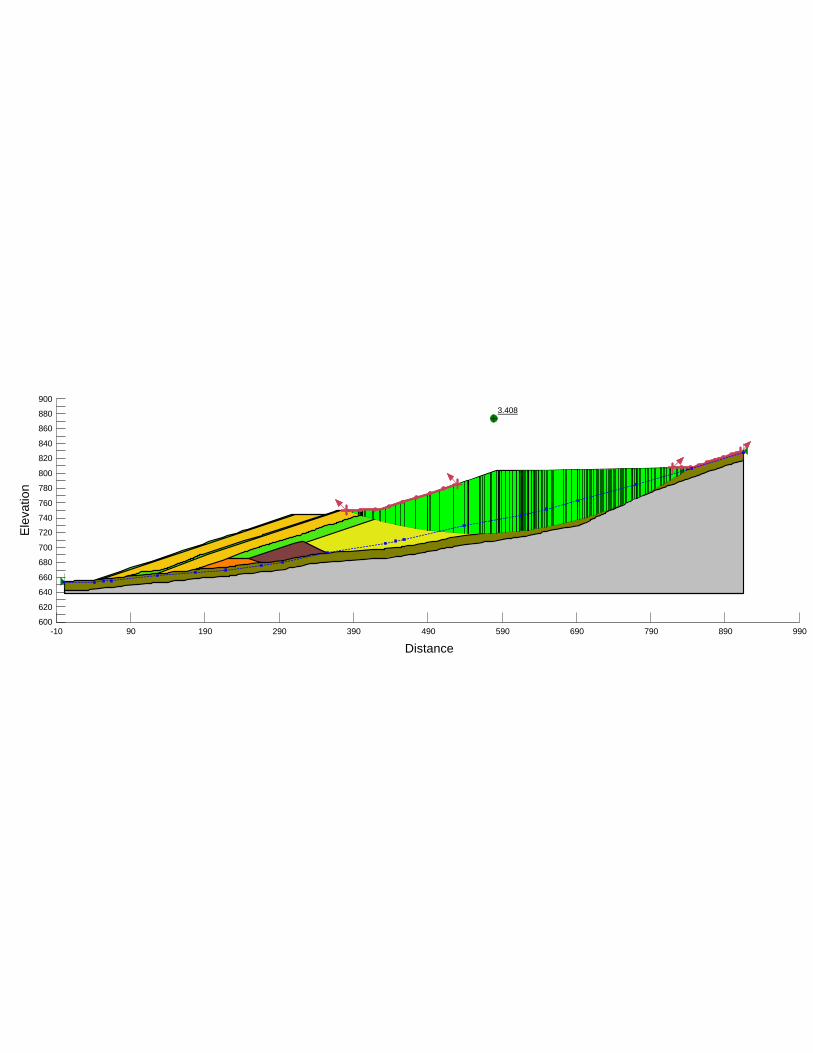
3.408
Distance
-10 90 190 290 390 490 590 690 790 890 990
Ele
vatio
n
600
620
640
660
680
700
720
740
760
780
800
820
840
860
880
900

2.671
Distance
-10 90 190 290 390 490 590 690 790 890 990
Ele
vatio
n
600
620
640
660
680
700
720
740
760
780
800
820
840
860
880
900

2.133
Distance
-10 90 190 290 390 490 590 690 790 890 990
Ele
vatio
n
600
620
640
660
680
700
720
740
760
780
800
820
840
860
880
900

1.637
Distance
-10 90 190 290 390 490 590 690 790 890 990
Ele
vatio
n
600
620
640
660
680
700
720
740
760
780
800
820
840
860
880
900

2.868
Distance
-10 90 190 290 390 490 590 690 790 890 990
Ele
vatio
n
600
620
640
660
680
700
720
740
760
780
800
820
840
860
880
900

2.493
Distance
-10 90 190 290 390 490 590 690 790 890 990
Ele
vatio
n
600
620
640
660
680
700
720
740
760
780
800
820
840
860
880
900

2.133
Distance
-10 90 190 290 390 490 590 690 790 890 990
Ele
vatio
n
600
620
640
660
680
700
720
740
760
780
800
820
840
860
880
900
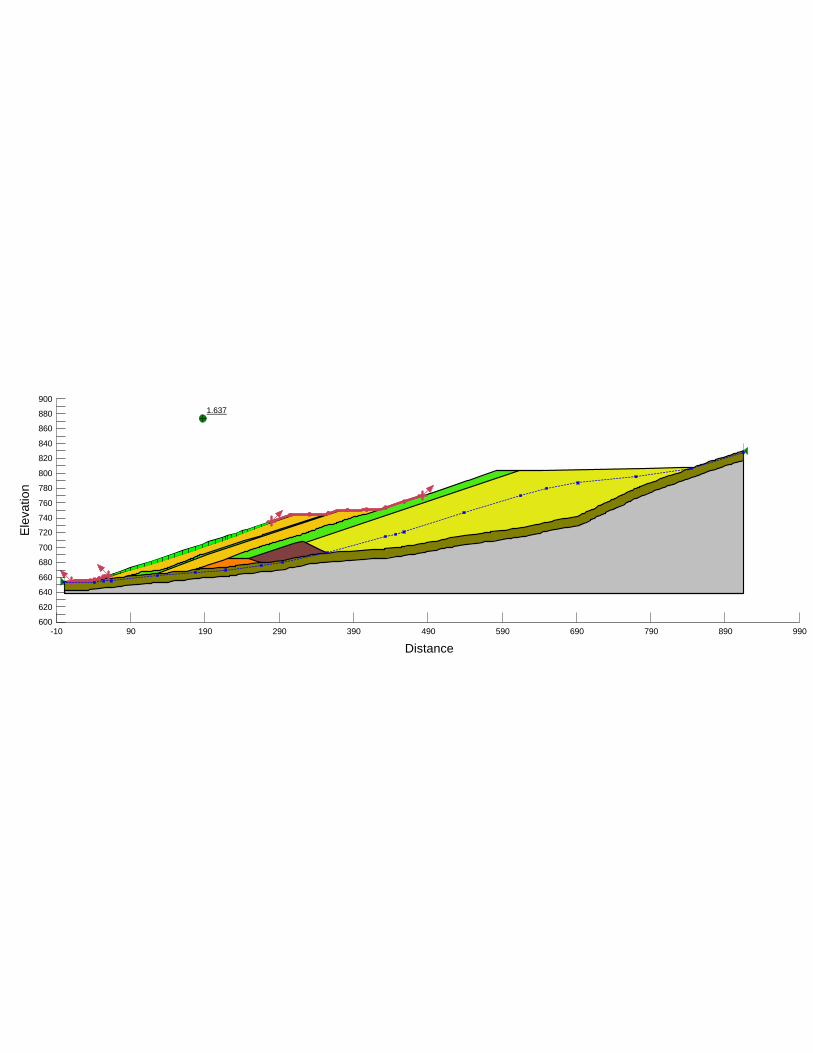
1.637
Distance
-10 90 190 290 390 490 590 690 790 890 990
Ele
vatio
n
600
620
640
660
680
700
720
740
760
780
800
820
840
860
880
900

Closure Pseudo-Static Loading
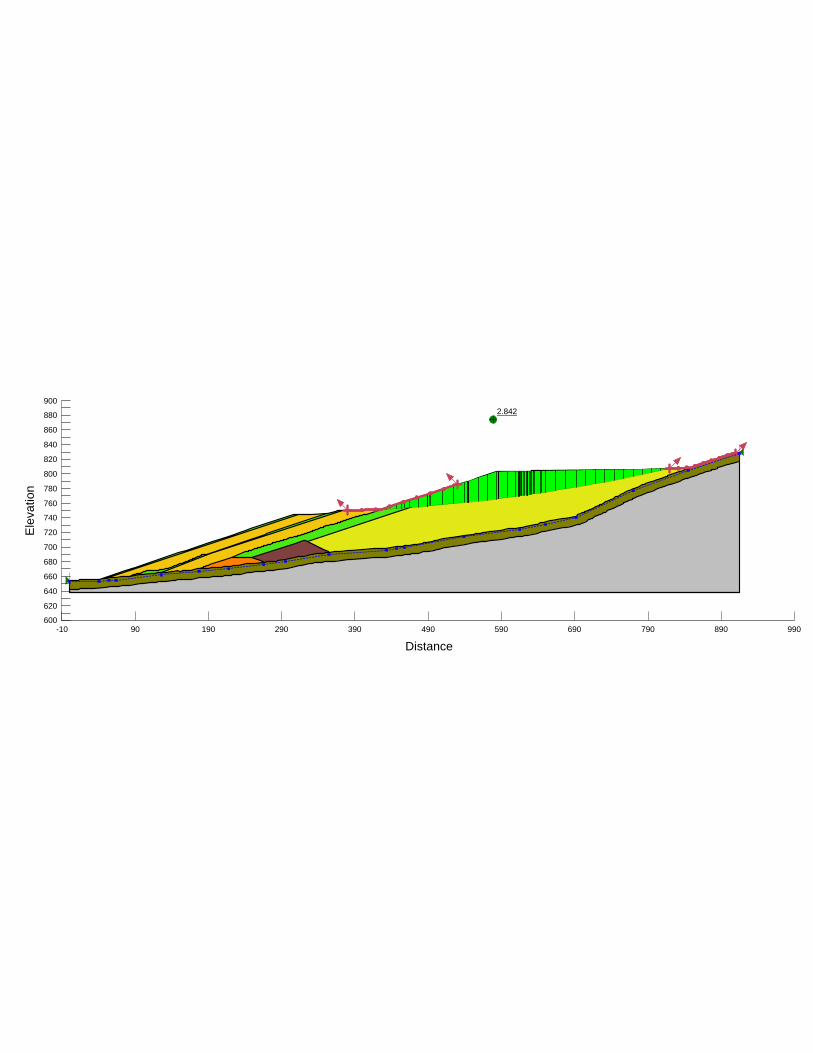
2.842
Distance
-10 90 190 290 390 490 590 690 790 890 990
Ele
vatio
n
600
620
640
660
680
700
720
740
760
780
800
820
840
860
880
900
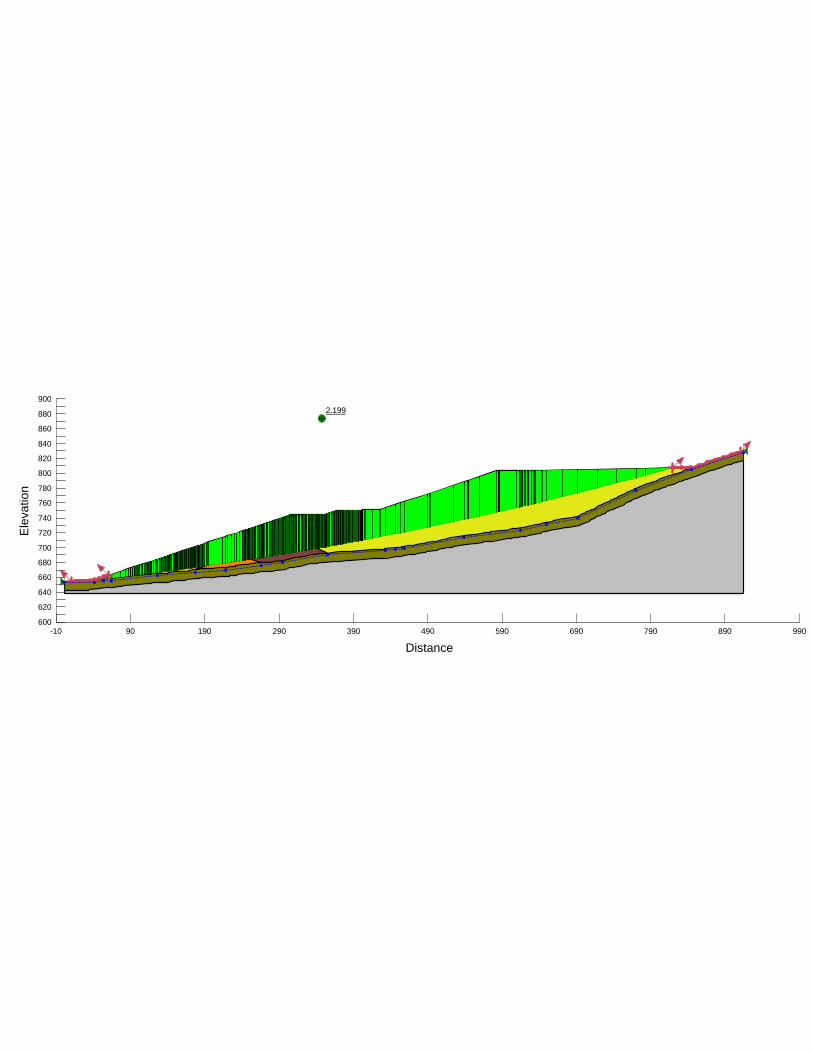
2.199
Distance
-10 90 190 290 390 490 590 690 790 890 990
Ele
vatio
n
600
620
640
660
680
700
720
740
760
780
800
820
840
860
880
900

1.809
Distance
-10 90 190 290 390 490 590 690 790 890 990
Ele
vatio
n
600
620
640
660
680
700
720
740
760
780
800
820
840
860
880
900

1.423
Distance
-10 90 190 290 390 490 590 690 790 890 990
Ele
vatio
n
600
620
640
660
680
700
720
740
760
780
800
820
840
860
880
900

2.667
Distance
-10 90 190 290 390 490 590 690 790 890 990
Ele
vatio
n
600
620
640
660
680
700
720
740
760
780
800
820
840
860
880
900

2.199
Distance
-10 90 190 290 390 490 590 690 790 890 990
Ele
vatio
n
600
620
640
660
680
700
720
740
760
780
800
820
840
860
880
900

1.809
Distance
-10 90 190 290 390 490 590 690 790 890 990
Ele
vatio
n
600
620
640
660
680
700
720
740
760
780
800
820
840
860
880
900
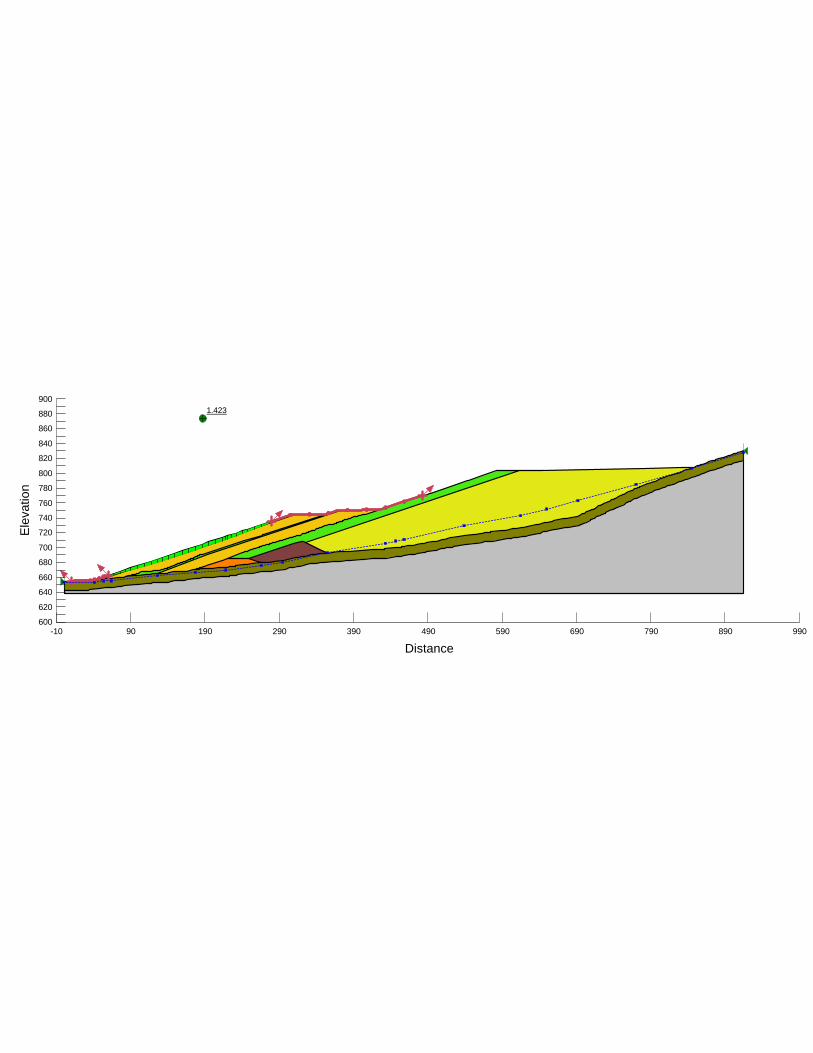
1.423
Distance
-10 90 190 290 390 490 590 690 790 890 990
Ele
vatio
n
600
620
640
660
680
700
720
740
760
780
800
820
840
860
880
900

2.247
Distance
-10 90 190 290 390 490 590 690 790 890 990
Ele
vatio
n
600
620
640
660
680
700
720
740
760
780
800
820
840
860
880
900
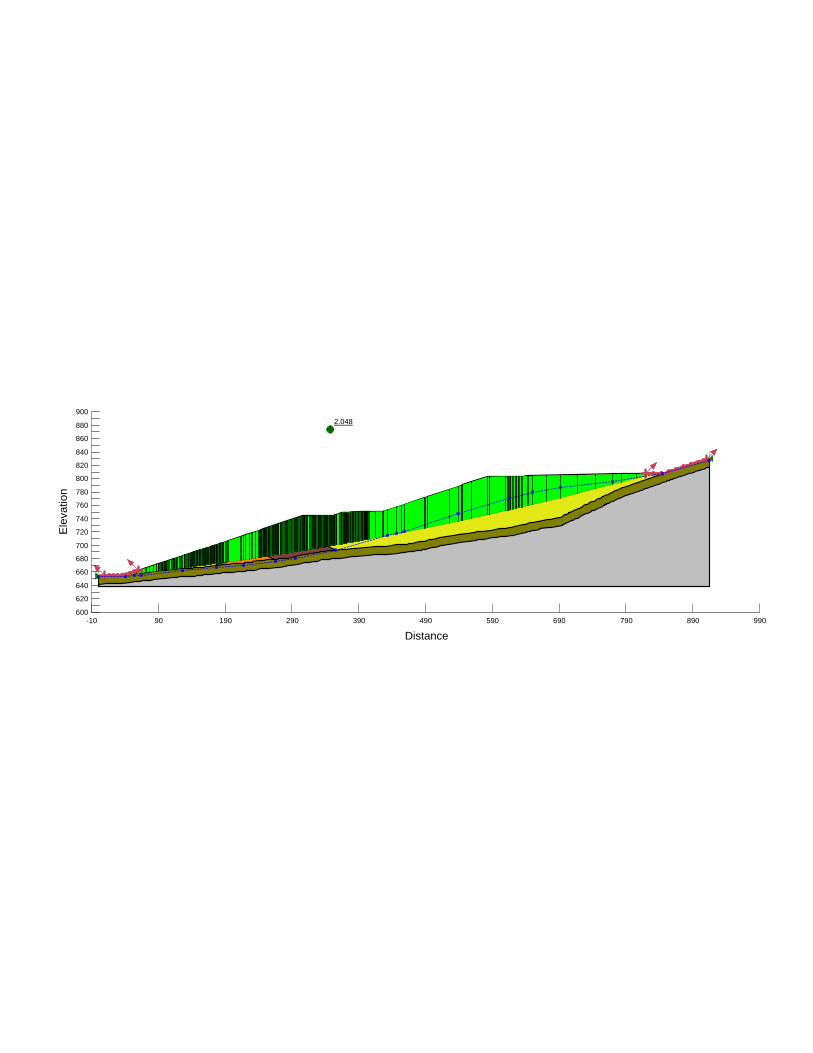
2.048
Distance
-10 90 190 290 390 490 590 690 790 890 990
Ele
vatio
n
600
620
640
660
680
700
720
740
760
780
800
820
840
860
880
900
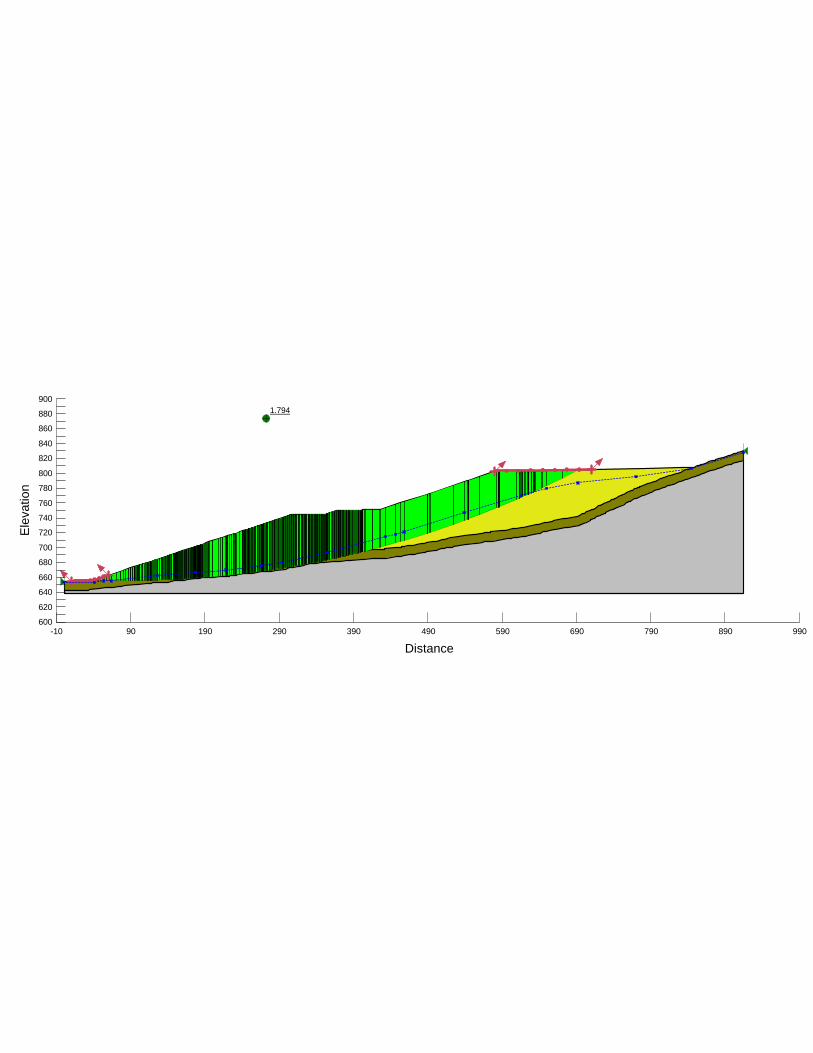
1.794
Distance
-10 90 190 290 390 490 590 690 790 890 990
Ele
vatio
n
600
620
640
660
680
700
720
740
760
780
800
820
840
860
880
900

1.423
Distance
-10 90 190 290 390 490 590 690 790 890 990
Ele
vatio
n
600
620
640
660
680
700
720
740
760
780
800
820
840
860
880
900