Embed Size (px)
Citation preview

Regional State of the Environment Report Summary
For the North Coast Region of NSWOctober 2021
2020

2Regional State of the Environment Report Summary 2020
The authors would like to acknowledge the traditional custodians of the land reported on, including the Bundjalung, Yaegl, Gumbaynggirr, Dunghutti, Biripi, Bunyah, Nganyaywana and Ngarabal nations and their people, and pay respect to the Elders past and present and emerging of these nations.
Published by North Coast Region State of the Environment Report Working Group (on behalf of the participating councils)Coffs Harbour City Council | Locked Bag 155 Coffs Harbour NSW 2450P: (02) 6648 4000 | E: [email protected] | W: coffsharbour.nsw.gov.auVersion 1 - October 2021 - Prepared by North Coast Region State of the Environment Report Working GroupDesign by GP Design | E: [email protected] Photo: Bellingen Shire Council
2020
Regional State of the Environment Report Summary

3Regional State of the Environment Report Summary 2020
Table of Contents
Introduction 05
01 People & the Environment 06
1.1 Regional climate characteristics 07
1.2 Population characteristics and change 08
1.3 Climate change: reducing emissions & preparing for change 09
1.4 Surface water demand 13
1.5 Waste 15
1.6 Environmental levy 18
02 Biodiversity & Vegetation 19
2.1 Ecologically functional landscapes 20
2.2 Native vegetation restoration 25
2.3 Conservation: reserves & agreements 26
2.3.1 Protection of Native vegetation 26
2.3.2 Council land-use zoning 27
2.4 Native Flora & Fauna 28
2.5 Invasive species 29
2.5.1 Invasive weed species 29
2.5.2 Invasive fauna species 30
03 Land & Soils 31
3.1 Soil condition 33
3.2 Landuse 34
3.3 Funded land & soils management activities 35
3.4 Acid sulfate soils 35
3.5 Mining 36
04 Water 37
4.1 Estuarine & freshwater rivers 38
4.1.7 River restoration works & riparian vegetation 45
4.1.8 Stormwater improvement works & WSUD 45
4.2 Wetlands -
4.3 Groundwater 46
4.4 Near-shore marine 47

4Regional State of the Environment Report Summary 2020
List of Abbreviations
ASS Acid sulfate soils
CMP Coastal management program
CO2 Carbon dioxide
CZMP Coastal zone management plan
DISER Department of Industry, Science, Energy and Resources
DCP Development control plan
DPIE NSW Department of Planning, Industry and Environment
EHA Effective habitat area
EPA Environment protection agency
GDE Groundwater dependent ecosystem
ICOLL Intermittently closed or open lakes or lagoons
IP&R Integrated planning and reporting
LEP Local environmental plan
LGA Local government area
LiDAR Light Detection and Ranging
LLS Local land services
LULUCF Land use, land-use change and forestry
MEMS Marine estate management strategy
MPA Marine protected area
NRAR Natural resources access regulator
NRM Natural resource management
OSMS Onsite sewage management system
PNF Private native forestry
RSoE Regional State of the Environment Report
SLATS State-wide land cover and trees study
SoE State of the Environment report
WSP Water sharing plan
WSUD Water sensitive urban design
WWTP Waste water treatment plant

5Regional State of the Environment Report Summary 2020
AIM: To increase community awareness of environmental issues, and to guide natural resource managers in prioritising and addressing management actions
Introduction
This Regional State of the Environment 2020 (RSoE) is the third prepared for the North Coast Region of New South Wales (NSW). It involved collaboration between the 12 general purpose councils (councils) along the Region’s coast, from Port Macquarie-Hastings Council in the south to Tweed Shire Council in the north, including Lismore and Kyogle councils, and Rous County Council. It aims to report on environmental condition at both a regional and local level from 2012 to 2020. This condition information may inform the community and local and state governments on key pressures acting on the environment, and responses to those key pressures. This condition–pressure–response information can be used to increase community awareness of environmental issues, and to guide natural resource managers in prioritising and addressing management actions.This document is a summary for the 2016 to 2020 reporting period.
Image: Map of North Coast Region of NSW

6 Regional State of the Environment Report Summary 2020
People & the Environment01
Photo: Bellingen Shire Council

7Regional State of the Environment Report Summary 2020
1.1 Regional climate characteristics
Hottestyear on record for Australia
Driestyear on record
2019 2019
2019August
2018
DroughtWhole of NSW declared
July
2019
Bushfiresstarted in North Coast region
2013201520162017 &2020
Floodsimpacted the region
Highest Sea Surface Temperatureson record
Photo: Coffs Harbour City Council

8Regional State of the Environment Report Summary 2020
0
20,000
40,000
60,000
80,000
100,0002009
2016
2020
Popu
lati
on
Ballin
aBell
inge
n
Byron
Kempse
yKyo
gle
Lism
oreNam
bucca
Valle
yPort
Macquar
ie-H
astin
gsRich
mond
Valle
yTw
eed
Clare
nce Va
lley
Co�s Har
bour
Regional State of the Environment Report 2020Graphs
• Port Macquarie-Hastings had the highest increase in population over 10 years at 17.2% followed closely by Byron at 17.1%
• Both were above the NSW 10 year average of15.5% population increase.
• Tweed, Ballina and Coffs Harbour also hadsubstantial population increases over 10 years at 13.7%, 12.2% and 12% respectively.
1.2 Population characteristics & change
Population by local government area from 2009-2020
• Kyogle and Lismore experienced a slight decline inpopulation over 10 years.
• Population density is highest in Ballina at 93 peopleper square kilometre, followed by Tweed at 75, CoffsHarbour at 66, and Byron at 63.
• Kyogle has the lowest at 2.5 people per square kilometre, with Clarence Valley at 5, and RichmondValley at 7.7.
Port Macquarie Hastings and Byron LGAs at over
17%since 2009
Highest Population Growth
per square kilometre
Highest Population Density
93People
Ballina
per square kilometre
Lowest Population Density
2.5People
Kyogle

9Regional State of the Environment Report Summary 2020
Australia’s annual total greenhouse gas emissions peaked in 2007 at 632.93 Mt CO2-e. Since our reporting began in 2012, the annual emissions have decreased from 546.8 Mt CO2-e in March 2012 to 513.45 Mt CO2-e in June 2020, down to 499 Mt CO2-e in December 2020 – the lowest level in 31 years. This was due to the ongoing steady decrease in emissions from
Atmospheric carbon dioxide (CO2)Atmospheric carbon dioxide concentrations have
been measured at Cape Grim, Tasmania since 1976 and continue to increase.
Figure 4: Share of total emissions, by sector, for the year to December 2020 (Source: DISER 2021)
1.3 Climate change: reducing emissions & preparing for change
Australia’s Greenhouse Gas Emissions (megatonnes carbon dioxide equivalent – Mt CO2-e)
electricity, a drop in fugitive emissions from reduced coal production, and the impacts of COVID-19 reducing transport emissions, which fell 12% from 2019 (source: DISER 2021).Electricity use continues to be the greatest contributor to emissions in Australia.
2012388.8 ppm
(parts per million)
2020410 ppm
(parts per million)
632.93Mt CO2-e
(10 times the average monthly emissions)
2007peak emissons at
(the COVID19 effect!)
499Mt CO2-e
181Terragrams CO2-e
2020lowest emissons
in 31 years
2019NSW alone emitted
Bushfires increased NSW CO2 emissions
in December

10 Regional State of the Environment Report Summary 2020
PV Installs LGAs 2020
Percentage of dwellings with roof-top solar
2016
2020
Ballin
aBell
inge
n
Byron
Kempse
yKyo
gleLis
more
Nambucc
aVa
lley
Port Mac
quarie
-Has
tings
Richm
ond Va
lley
Twee
dReg
ional
Avera
ge
Claren
ce Va
lley
Co�s Har
bour
0
10
20
30
40
50
Total Electricity Consumption
Renewable energy from roof-top solar installations now provides 10% of total electricity consumption for the north coast region, up from 4% in 2014. Note this does not include the rooftop solar energy used by each solar household or business.
Total electricity consumption from the grid has remained steady since 2014 due to the increased number and capacity of solar installations.
Total electricity generated by solar sent back to the grid was 225,658 megawatt hours.
2020 of the region’s electricity comes from solar.
10%of buildings have solar installations in the North Coast Region of NSW, up by 33% across most LGAs since 2016.
30-43%

11 Regional State of the Environment Report Summary 2020
The following graph show emissions by source for each council General trends show:
All councils have reduced street lighting emissions due to LED retrofits.
Fuel use is variable and often increases when large works are required such as road repairs after flood.
Electricity use from the grid is decreasing due to increased solar installations.
Abatement measures are now showing a real impact on reducing emissions for some councils.
*Note that waste and waste water emissions are not included.
Each Council’s electricity and fuel consumption has been collected since 2010 in most cases. For all Councils, emissions from general electricity consumption are the largest contributor to total greenhouse gases (75% on average), usually followed by fuel (17%) and street lighting (8%).
Almost all councils have adopted targets for renewable energy and/or policies for net zero emissions by certain dates, with some investing in multiple large solar installations, purchasing green power, and transitioning their fleet to hybrid and electric vehicles. Byron Council has a 100% carbon neutral electricity agreement, thereby offsetting nearly 100% of electricity emissions. Rous County Council generates enough solar power to run their administrative premises.
Photo: Bellingen Council

12 Regional State of the Environment Report Summary 2020
Regional State of the Environment Report 2020Graphs - Total Council Emissons by LGA for 2016 and 2020
Byron TweedBellingen Co�s Harbour
Nambucca Valley
KyogleKempsey Lismore RousCounty
Ballina
2016
2020
Abat
emen
t 202
0
2016
2020
Abat
emen
t 202
0
2016
2020
Abat
emen
t 202
0
2016
2020
Abat
emen
t 202
0
2016
2020
Abat
emen
t 202
0
2016
2020
Abat
emen
t 202
0
2016
2020
Abat
emen
t 202
0
2016
2020
Abat
emen
t 202
0
2016
2020
Abat
emen
t 202
0
2016
2020
Abat
emen
t 202
0
2016
2020
Abat
emen
t 202
0
Clarence Valley
0
5,000
10,000
15,000
20,000
25,000
Total Council Emissions by LGA for 2016 and 2020
Tonn
es C
O2-e
Fuel emissions
Abatement
Electricity emissions
Streetlighting emissions
Progress towards net zero emissions for each Council
LGA
Renewableenergytarget
Emissionsreductiontarget
Ballina 100% by 2030 100% by 2030
Bellingen 100% by 2030 100% by 2040
Byron 100% by 2027 100% by 2025
Clarence Valley 50% by 2030 40% by 2030
Coffs Harbour 100% by 2030 50% by 2025
Kempsey 100% by 2030 70% by 2030 for energy
Kyogle 100% by 2030 -
Lismore 100% by 2023 -
Nambucca Valley 60% by 2030 70% by 2030
Port Macquarie - Hastings 100% by 2027 -
Richmond Valley - -
Rous County 100% by 2030 -
Tweed 25% by 2022; 50% by 2025
100% by 2030Photo: Byron Shire Council
13 Regional State of the Environment Report Summary 2020
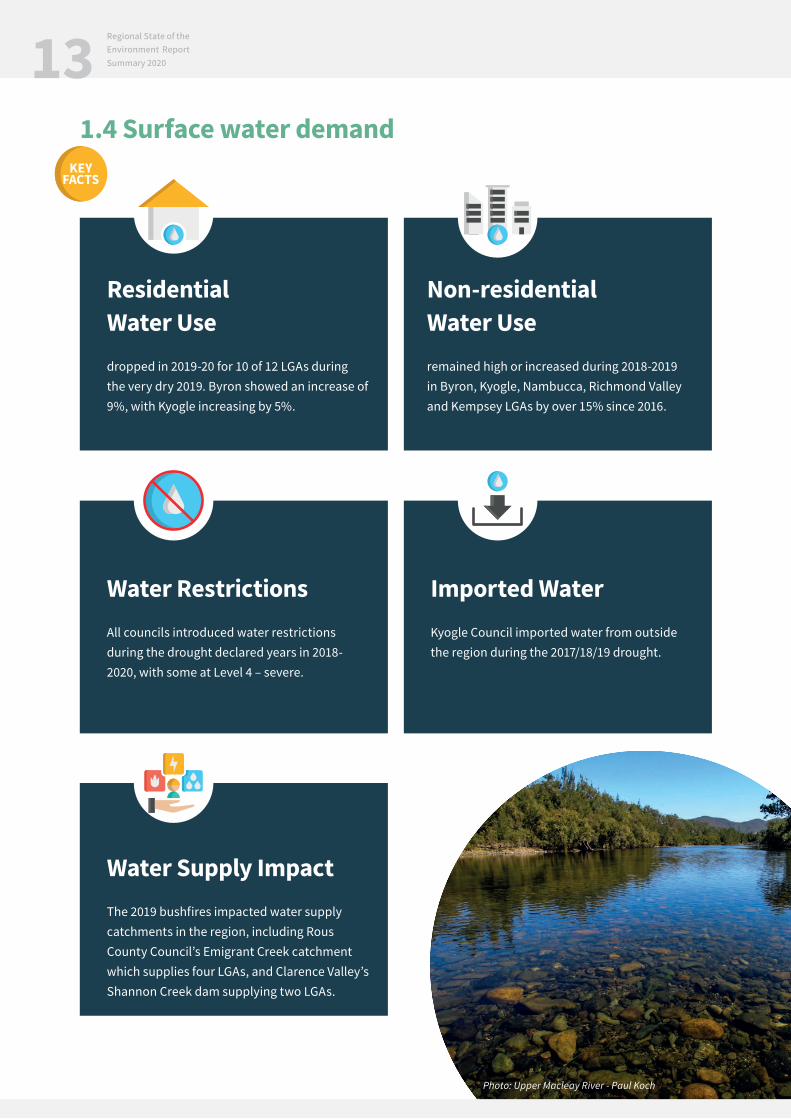
Water RestrictionsAll councils introduced water restrictions during the drought declared years in 2018-2020, with some at Level 4 – severe.
Water Supply ImpactThe 2019 bushfires impacted water supply catchments in the region, including Rous County Council’s Emigrant Creek catchment which supplies four LGAs, and Clarence Valley’s Shannon Creek dam supplying two LGAs.
Imported WaterKyogle Council imported water from outside the region during the 2017/18/19 drought.
1.4 Surface water demand
Residential Water Usedropped in 2019-20 for 10 of 12 LGAs during the very dry 2019. Byron showed an increase of 9%, with Kyogle increasing by 5%.
Non-residential Water Useremained high or increased during 2018-2019 in Byron, Kyogle, Nambucca, Richmond Valley and Kempsey LGAs by over 15% since 2016.
Photo: Upper Macleay River - Paul Koch

14 Regional State of the Environment Report Summary 2020
0
50
100
150
200
Regional State of the Environment Report 2020Graphs - Residential Water Use - Kilolitres per connection 2019/20
Graphs - Residential Water Use - Kilolitres per connection
Graphs - Residential Versus Non-residential Water Use - 2019/20
Byro
n
Byro
n
Twee
d
Twee
d
Balli
na
Balli
na
Rich
mon
d Va
lley
Rich
mon
d Va
lley
Co�s
Har
bour
Co�s
Har
bour
Nambu
cca
Valle
y
Nambu
cca V
alle
y
Kyog
le
Kyog
le
Kem
psey
Kem
psey
Port
Macqu
arie
- Has
tings
Port
Macqu
arie
- Has
tings
Lism
ore
Lism
ore
Belli
ngen
Belli
ngen
Clar
ence
Va
lley
Clar
ence
Valle
y
Byro
n
Twee
d
Balli
na
Rich
mon
d Va
lley
Co�s
Har
bour
Nambu
cca V
alle
y
Kyog
le
Kem
psey
Port
Macqu
arie
- Has
tingsLi
smor
e
Belli
ngen
Clar
ence
Valle
y
0
50
100
150
200 200
177
157 153 150 149 146 144
127 126115
168
0
500
1000
1500
2000
2500
3000
0
50
100
150
200
Regional State of the Environment Report 2020Graphs - Residential Water Use - Kilolitres per connection 2019/20
Graphs - Residential Water Use - Kilolitres per connection
Graphs - Residential Versus Non-residential Water Use - 2019/20
Byro
n
Byro
n
Twee
d
Twee
d
Balli
na
Balli
na
Rich
mon
d Va
lley
Rich
mon
d Va
lley
Co�s
Har
bour
Co�s
Har
bour
Nambu
cca
Valle
y
Nambu
cca V
alle
y
Kyog
le
Kyog
le
Kem
psey
Kem
psey
Port
Macqu
arie
- Has
tings
Port
Macqu
arie
- Has
tings
Lism
ore
Lism
ore
Belli
ngen
Belli
ngen
Clar
ence
Va
lley
Clar
ence
Valle
y
Byro
n
Twee
d
Balli
na
Rich
mon
d Va
lley
Co�s
Har
bour
Nambu
cca V
alle
y
Kyog
le
Kem
psey
Port
Macqu
arie
- Has
tingsLi
smor
e
Belli
ngen
Clar
ence
Valle
y
0
50
100
150
200 200
177
157 153 150 149 146 144
127 126115
168
0
500
1000
1500
2000
2500
3000
Residential Water Use - Kilolitres per connection 2019/20
Residential Water Use - Kilolitres per connection
Residential Versus Non-residential Water Use - 2019/20
0
50
100
150
200
Regional State of the Environment Report 2020Graphs - Residential Water Use - Kilolitres per connection 2019/20
Graphs - Residential Water Use - Kilolitres per connection
Graphs - Residential Versus Non-residential Water Use - 2019/20
Byro
n
Byro
n
Twee
d
Twee
d
Balli
na
Balli
na
Rich
mon
d Va
lley
Rich
mon
d Va
lley
Co�s
Har
bour
Co�s
Har
bour
Nambu
cca
Valle
y
Nambu
cca V
alle
y
Kyog
le
Kyog
le
Kem
psey
Kem
psey
Port
Macqu
arie
- Has
tings
Port
Macqu
arie
- Has
tings
Lism
ore
Lism
ore
Belli
ngen
Belli
ngen
Clar
ence
Va
lley
Clar
ence
Valle
y
Byro
n
Twee
d
Balli
na
Rich
mon
d Va
lley
Co�s
Har
bour
Nambu
cca V
alle
y
Kyog
le
Kem
psey
Port
Macqu
arie
- Has
tingsLi
smor
e
Belli
ngen
Clar
ence
Valle
y
0
50
100
150
200 200
177
157 153 150 149 146 144
127 126115
168
0
500
1000
1500
2000
2500
3000
Kilo
litre
s per
conn
ectio
nKi
lolit
res p
er co
nnec
tion
Kilo
litre
s per
conn
ectio
n
2013/14
2016/17
2019/20
Residential
Non-residential

15 Regional State of the Environment Report Summary 2020
Waste Datais variable so trends are difficult to identify
Natural disasters and legislative changes substantially increase the amount of waste produced
The container deposit schemehas shown a reduction in bottles on beaches and in waterways for the North Coast Region
Many LGAS are nearing capacity for their landfill sites
1.5 Waste
domestic waste recycled/reused and has remained steady since 2012
On average, 50% of
total waste50%
59%+
Trends show an increase in construction/demolition waste to landfill in recent years
Photo: Hat Head - Paul Koch

16 Regional State of the Environment Report Summary 2020
Waste is a key issue for the north coast region with many landfill sites nearing capacity, pressure to find better ways to manage our waste, and the need to reduce greenhouse gas emissions from landfill. Trends are difficult to identify in the waste data as it is variable, and natural disasters cause large inputs into waste facilities. For example, in 2013, Ballina’s storms increased green waste by 12,000 tonnes, in 2016 floods added waste to landfill for many LGAs, and the 2019-20 bushfires impacted Clarence Valley Council’s waste more than any other LGA in the region despite hazardous waste such as asbestos being removed to separate facilities under the NSW Government’s clean up. Coffs Harbour’s biomass facility had a fire in 2016 which closed it for 10 months, resulting in much of Nambucca Valley, Bellingen and Coffs Harbour waste going to landfill.
Additional pressures to landfill came in late 2018 when the NSW Environmental Protection Authority (EPA) revoked the recovery of organics from mixed waste (ie red bins) for use in composting due to risks associated with chemical and physical contaminants.
For total waste generated in 2020, Bellingen, Nambucca Valley and Coffs Harbour had the highest
rates of diversion from landfill at 68%, 67% and 60% respectively, while Kyogle and Clarence Valley had the lowest at 26% each. However, the waste data is of low confidence and is impacted by natural disasters.
For domestic waste only in 2020, Bellingen, Nambucca Valley and Coffs Harbour again had the highest rates of diversion from landfill at 73%, 71% and 72% respectively, while Kyogle and Kempsey had the lowest at 29% and 35%.
Per capita domestic waste shows a decreasing trend since 2012, dropping from a regional average of 435 kilograms of waste per person in 2012 to 358 in 2019. In 2020, Byron and Coffs Harbour have the highest per capita domestic waste rates, with Kyogle by far the lowest, followed by Lismore, Richmond Valley and Bellingen.
The container deposit scheme was introduced in NSW in 2018, and collected 44.2 million bottles and cans in its first 6 months for the North Coast Region. This has increased to 86.3 million bottles and cans in the first 6 months of 2020. This program has contributed to fewer bottles and cans on beaches and in waterways in recent litter and debris research which is still ongoing (see section 4.1).
Photo: Bellingen threatened species tree planting day - R Dwyer

17 Regional State of the Environment Report Summary 2020 Regional State of the Environment Report 2020
Graphs - Per capita domestic waste generated in 2013, 2016 and 2019 in kilograms
Byro
n
Twee
d
Balli
na
Rich
mon
d Va
lley
Co�s
Har
bour
Nambu
cca
Valle
y
Kyog
le
Kem
psey
Port
Mac
quar
ie- H
astin
gs
Lism
ore
Regi
onal
Av
erag
e
Belli
ngen
Clar
ence
Valle
y
Byro
n
Twee
d
Balli
na
Rich
mon
d Va
lley
Co�s
Har
bour
Nambu
cca
Valle
y
Kyog
le
Kem
psey
Port
Mac
quar
ie- H
astin
gs
Lism
ore
Belli
ngen
Clar
ence
Valle
y
0
30,000
60,000
90,000
120,000
150,000
0
100
200
300
400
500
600
700
800
Regional State of the Environment Report 2020Graphs - Per capita domestic waste generated in 2013, 2016 and 2019 in kilograms
Byro
n
Twee
d
Balli
na
Rich
mon
d Va
lley
Co�s
Har
bour
Nambu
cca
Valle
y
Kyog
le
Kem
psey
Port
Mac
quar
ie- H
astin
gs
Lism
ore
Regi
onal
Av
erag
e
Belli
ngen
Clar
ence
Valle
y
Byro
n
Twee
d
Balli
na
Rich
mon
d Va
lley
Co�s
Har
bour
Nambu
cca
Valle
y
Kyog
le
Kem
psey
Port
Mac
quar
ie- H
astin
gs
Lism
ore
Belli
ngen
Clar
ence
Valle
y
0
30,000
60,000
90,000
120,000
150,000
0
100
200
300
400
500
600
700
800
Per capita domestic waste generated in 2013, 2016 and 2019 in kilogramskerbside collection only
Total waste generated in tonnes by year and LGA
Kilo
gram
s of w
aste
per
per
son
per y
ear
Tonn
es p
er a
nnum
2018/192015/162012/13
2016/172015/162014/15 2019/202018/192017/182013/142012/132011/12

18 Regional State of the Environment Report Summary 2020
Total Electricity Consumption
councils in the region have a levy on rates to fund environmental works and programs either conducted by council themselves or used to fund community and other projects to carry out necessary on-ground works.Some councils have other levys such as stormwater levys to fund other works that benefit the environment.
North Coast region Councils has an environmental levy
8 of 12$5 million dollars raised from environmental levies
2020
1.6 Environmental levy
8 of 12
Environmental Levy Funding 2020
LGA $ 2019 - 20Ballina $323,100
Bellingen $246,900
Byron $401,164
Clarence Valley no levy
Coffs Harbour $1,300,000
Kempsey $814,308
Kyogle no levy
Lismore $578,260
Nambucca Valley $425,000
Port Macquarie - Hastings $875,800
Richmond Valley no levy
Rous County no levy
Tweed no levy
TOTAL $4,964,532.00
Photo: Urunga boardwalk - Bellingen Shire Council

19 Regional State of the Environment Report Summary 2020
Biodiversity & Vegetation02
Photo: Brett Vercoe

20 Regional State of the Environment Report Summary 2020
2.1 Ecologically functional landscapes
The data reported on in the 2012 and 2016 reports has not been updated since then. However, a new method for measuring habitat condition was developed in 2017 after the introduction of the NSW Biodiversity Conservation Act 2016 in order to monitor changes.The indicator reported on here is ecological carrying capacity, which is defined as “the ability of an area to maintain self-sustaining and interacting populations of all species naturally expected to occur there, given the habitat resources, such as food and water, and connections to other habitat, needed for persistence”. (DPIE 2020)

21 Regional State of the Environment Report Summary 2020
Results from this modelling are summarised below by LGA and for the region:
Ecological carrying capacity
Regional State of the Environment Report 2020Graphs - Avaerage Ecological Carrying Capacity
Byro
n
Twee
d
Balli
na
Rich
mon
d Va
lley
Co�s
Har
bour
Nambu
cca V
alle
y
Kyog
le
Kem
psey
Port
Macqu
arie
- Has
tings Li
smor
eNor
th C
oast
Regi
on
NSW
Belli
ngen
Clar
ence
Valle
y
200
177
0.0
0.1
0.2
0.3
0.4
0.5
0.6
0.7
0.8
0.61 0.60 0.58 0.57 0.570.54
0.48 0.47 0.470.45
0.41
0.300.33
0.53
The modelling indicates the northern LGAs have a below-average score for ecological carrying capacity, with Lismore being the lowest at 0.30 – below the NSW average of 0.33 – primarily due to historical clearing and smaller protected areas. The southern LGAs are above the regional average and the NSW average, with the third highest values in the state (DPIE 2020).
Scale Range0.8 - High0.1 - Low0.53 - Regional Average0.33 - NSW average
Photo: Tiger quoll (top left) - Brett Vercoe, Yellow-bellied glider (bottom left) - Coffs Harbour City Council, Brush-tailed rock-wallaby (right) - Brett Vercoe

22 Regional State of the Environment Report Summary 2020
Regional State of the Environment Report 2020Graphs - Woody Vegetation: North Coast Region
0
10000
20000
30000
40000
50000
60000
70000
80000
Nor
th C
oast
LL
S re
gion
Twee
d
Rich
mon
d Va
lley
Port
Mac
quar
ie-H
astin
gs
Nam
bucc
a Va
lley
Lism
ore
Kyog
le
Kem
psey
Co�s
Har
bour
Clar
ence
Val
ley
Byro
n
Belli
ngen
2009
2010
2011
2012
2013
2014
2015
2016
2017
2018
2019
0
2000
4000
6000
8000
10000
2016 saw a significant increase in vegetation clearing NSW-wide which has remained above the average of the previous 10 years since then, which was under a different legislative framework (DPIE 2021). The LGAs with the highest level of vegetation loss are Clarence Valley and Port Macquarie-Hastings, Kyogle, then Richmond Valley. A significant increase in vegetation loss was observed in these LGAs from 2016 with the change in legislation.
Woody Vegetation Loss: North Coast Region
Vegetation Loss by LGA 2009 - 2019(not including fire)
Hec
atre
s alte
red/
rem
oved
per
yea
rH
ecat
res a
ltere
d/re
mov
ed p
er y
ear
Net Vegetation Change
Agriculture
Forestry
Infrastructure
Linear (Forestry)
2016

23 Regional State of the Environment Report Summary 2020
The 2019-20 bushfires impacted 1,098,479 hectares of bushland in the North Coast region of NSW. Clarence Valley topped the region for bushfire impact with 562,603 hectares burned, or 54% of the LGA, followed by Kempsey with 160,072 hectares burned or 47% of the LGA, then Richmond Valley with 140,692 hectares or 46% burned, and Port Macquarie-Hastings with 142,283 hectares or 39% burned.Mapping shows the extent of the bushfires, and the land tenure. 51% of the Region’s National Park was impacted (337,300 hectares), 41% of the Region’s State Forest (266,800 hectares), and 494,400 hectares or 26% was private land.
% Land bushfire-impacted 2019-20
Bushfires 2019-2020
Regional State of the Environment Report 2020Graphs - % Land Bushfire-impacted Area
Byro
n
Twee
d
Balli
na
Rich
mon
d Va
lley
Co�s
Har
bour
Nam
bucc
a Va
lley
Kyog
le
Kem
psey
Port
Mac
quar
ie- H
astin
gs
Lism
ore
Nat
iona
l Par
ks
(reg
ion-
wid
e)
Stat
e Fo
rest
(r
egio
n-w
ide)
Priv
ate
Land
(r
egio
n-w
ide)
Nor
th C
oast
Reg
ion
Belli
ngen
Clar
ence
Val
ley
2
11
5
54
47
47
25
39
46
51
41
26
34
31
0
10
20
30
40
50
60
of entire north coast region was bushfire-impacted
over 1 million hectares.
of region's National Park area was bushfire-impacted
34%
51%
In 2019/20

24 Regional State of the Environment Report Summary 2020
Private native forestry (PNF) is an approved form of forestry on private land. Landholders must apply for a PNF plan approval under the Local Land Services Act 2013. There continues to be concern that approvals are being given for areas designated as koala habitat under gazetted koala management plans, and for areas of rainforest, and that PNF is inappropriate in areas with very poor habitat particularly post the 2019-20 bushfires. Data for the 2016-2020 period has not been made available by LLS for this report.
Area of Private Native Forestry approvals by year and LGA (source: EPA 2016)
LGA 2007 2008 2009 2010 2011 2012 2013 2014 2015
Ballina - - - - 25 14 49 - -
Bellingen 17 1,398 947 794 1,786 1,381 377 554 280
Byron - - - - 59 94 85 - -
Clarence Valley 4,655 22,859 35,663 17,561 22,793 16,804 9,684 9,921 2,364
Coffs Harbour 32 881 1,100 1,229 610 797 604 570 11
Kempsey 1,950 4,460 2,789 2,190 2,076 2,345 3,182 1,649 91
Kyogle 1,728 3,016 4,022 3,287 3,079 3,628 1,241 2,433 12
Lismore - 397 150 176 34 259 59 - -
Nambucca Valley 785 1,091 2,094 1,415 1,765 1,383 714 704 267
Port Macquarie - Hastings
1,428 3,288 1,381 2,986 2,790 2,548 1,336 1,664 1,259
Richmond Valley 6,146 8,026 5,634 2,808 2,650 4,506 2,877 2,571 507
Tweed - 139 124 215 11 79 274 20 -
Total Area (Ha) 16,741 45,555 53,904 32,652 37,678 33,838 20,482 20,086 4,791
Private Native Forestry
Photo: Bellingen Shire Council

25 Regional State of the Environment Report Summary 2020
2.2 Native Vegetation Restoration
LGA or County Council
Annual average area restored
(ha)Annual average
trees plantedVolunteer
hours*Ballina 775 5,540 9,000
Bellingen 210 1,800 500
Byron 265 2,500 9,000
Clarence Valley 500 2,000 2,500
Coffs Harbour 1050 3,000 12,000
Kempsey 200 500 2,000
Kyogle 50 2,300
Lismore 210 7,000 6,500
Nambucca Valley 260 1,000 2,000
Port Macquarie - Hastings 500 400 10,000
Richmond Valley 50 2,000
Tweed 100 1,500 7000
* Volunteer hours are estimates based on approximate volunteer numbers and working bee days and may be underestimated
Landcare Volunteers
contribute the equivalent of
full time positions each year!
Landcare Groupsworking on
community proprieties
Landcare MembersRegion-wide
External Grant Funding
is essential for habitat rehabilitation projects
Councils, Landcare Groups & Local Aboriginal Land
Councils all collaborate on environmental
projects rehabilitation projects
325 5,500 35
Hectaresof land rehabilitated
annually in the Region
4,000 Over
Each LGA manages its own public land, and works on both public and private land are achieved through the work of Councils and the various Landcare groups, the Local Aboriginal Land Councils and other community groups. Vegetation rehabilitation is dependent on external grant funding in most cases, from organisations such as North Coast Local Land Services, NSW Environmental Trust, NSW DPIE Fisheries, Saving our Species program, and the Australian Landcare Program among others. Works target riparian rehabilitation, weed control, revegetation, livestock exclusion fencing, wetland and dune rehabilitation, and threatened species habitat. Since the 2019 bushfires, regeneration works have also targeted affected areas of both private and public land. Volunteers and landholders provide a vast rehabilitation workforce, which is generally underestimated.

26 Regional State of the Environment Report Summary 2020
Photo: Dorrigo National Park - Bellingen Shire Council
for the North Coast Region:
With the area of both private and public forested land as well as National Parks impacted by the 2019 bushfires, the increasing area of private land under conservation agreements is very important. However, it represents a very small area (0.2%) of the total privately-owned rural land in the region.
2.3.1 Protection of Native vegetation2.3 Conservation: reserves & agreements
Over
hectares added to National Parks since
8,000
2016
of the region is in National Park
21%
of private land is under environmental
zoning through Council LEPs
4%
is State Forest24%
of private land is under conservation
agreements
0.2% Up from
hectares in25,128 2016 to over
in43,000 2020
Land use by LGA
Balli
na
100%
80%
60%
40%
20%
0%
Byro
n
Bellin
gen
Clar
ence
Valle
yCo
ffs H
arbo
ur
Kem
psey
Kyog
le
Lism
ore
Nambu
cca V
alle
yPo
rt Mac
quar
ie-H
astin
gsRi
chm
ond
Valle
y
Twee
d
National Park
Flora Reserve
State Forest
Urban/Rural

27 Regional State of the Environment Report Summary 2020
All LGAs have a Local Environmental Plan (LEP) which governs land use and includes areas of environmental protection. In 2012, the northern LGAs of Byron, Ballina, Kyogle, Lismore and Tweed had their environmental zones (E zones) deferred by the then Department of Planning and Environment. Since 2016, the affected LGAs have each worked to finalise their chosen option for environmental protection. In some cases, the area under environmental protection has reduced, in others it has remained the same. One council is in the process of proposing to use a biodiversity overlay in rural zones in place of environmental zones, which would still provide protections for riparian and other high biodiversity land.
2.3.2 Council land-use zoning
Council Environmental Land-use Zoning by LGA in 2020
LGA
Area national parks estate
(ha) % LGA
Area environmental protection (ha) % LGA
Change since 2012
%Ballina 1,453 3.0 not finalised
Bellingen 51,915 32.5 10,873 6.8
Byron 6,570 11.6 2,290 4.0
Clarence Valley 227,541 21.8 56,781 5.4
Coffs Harbour 15,168 12.9 7,866 7
Kempsey 99,645 29.5 12,092 3.6
Kyogle 73,725 20.6 not finalisedProposed
biodiversity overlay
Lismore 9,128 7.1 377 0.3
Nambucca Valley 30,273 20.3 1,784 1.2
Port Macquarie - Hastings 93,523 25.4 5,871 1.6
Richmond Valley 35,128 11.5 not finalised
Tweed 21,467 16.3 13,613 10.3
Reporting region 665,536 20.8 129,565 4.0 -0.28
Photo: Nest box installation post-bushfire - S Hessey

28 Regional State of the Environment Report Summary 2020
2.4 Native flora & fauna
Status in NSW
Total in North Coast
Region
Change since 2016 Species Relevant LGA
Critically endangered species
- E4A 14 5 new flora
Scrub Turpentine - Rhodamnia rubescens North Coast Region
Native Guava - Rhodomyrtus psidioides North Coast Region
Kardomia prominens - a shrub Clarence Valley
Lenwebbia sp. Main Range - small tree restricted to
higher altitudesTweed to Clarence Valley
Phebalium speciosum - a shrubTweed, Lismore, Kyogle,
Richmond Valley
Critically endangered
community - E4B2 1
White Box - Yellow Box - Blakely’s Red Gum Grassy
Woodland and Derived Native Grassland in the
NSW North Coast
Most of North Coast region
Endangered population - E2 6 no change
Endangered ecological
community - E317 no change
Endangered species - E1
150 - 38
fauna, 112
flora
3 new flora
Gingidia rupicola - a small herbCoffs escarpment; Clarence
Valley, Bellingen
Magenta Lilly Pilly - Syzygium paniculatumPort Macquarie-Hastings,
Kempsey
Knicker nut - Caesalpinia bonduc - recently
discovered in the region
Port Macquarie-Hastings,
Kempsey, Clarence Valley
Key Threatening Processes -
KTP37 No change
Aqautic Species
Critically endangered 2 no changeGrey nurse shark, marine brown alga Neriea
lophocladia
Endangered 6 1
Eastern freshwater cod, Oxleyan pygmy perch,
Southern bluefin tuna, Scalloped hammerhead
shark, Southern purple spotted gudgeon,
Whites seahorse
North Coast Region
Since our previous report in 2016 and the introduction of the Biodiversity Conservation Act 2016, the classifications for endangered species have been amended. To ensure our reporting is consistent with previous reports, the previous categories have been used.Eight of the additions to endangered species listings in the region since 2016 have been flora, with one aquatic species – Whites seahorse.
The Saving our Species program was introduced in 2016 with the new Biodiversity Conservation Act 2016. It currently has projects in all LGAs within the region covering 92 endangered or vulnerable species, populations and communities. Program actions include surveys and monitoring, vertebrate pest control, weed control, fire control, managing human disturbance, landholder engagement, and species translocations. Councils assist with implementation of species recovery and threat abatement plans through a range of strategic plans, operational practices, and environmental assessments for development.
critically endangered species critically endangered community endangered species
5 New 1 New 4 New

29 Regional State of the Environment Report Summary 2020
Key current weed threats are:• Tropical soda apple – key region-wide weed threat – further resources needed after fires and floods• Cockspur coral tree – increasing spread• Grader grass – newly introduced since 2016 during the Pacific Highway upgradeBiological controls are being used for salvinia, madeira vine and parramatta grassAdditional funding from various sources such as Local Land Services and bushfire recovery funding has allowed additional targeted weed control programs, particularly in bushfire-impacted areas. Ongoing riparian weedcontrol is required to protect rivers and riverbanks.
2.5 Invasive species2.5.1 Invasive weed species
In 2020, nearly 8,000 km of high-risk pathways and
2,700 high-risk sites were treated for weeds in the region
through the Weeds Action Program.
The Biosecurity Act 2015 came into force in July 2017, and aims to prevent the
introduction and spread of pests, diseases, weeds
and contaminants.
Numerous local control authorities reported new weeds appearing during and after Pacific Highway upgrade works.
* Rous County Council is the local control authority for Tweed, Byron, Ballina, Lismore, Kyogle and Richmond Valley LGAs
2020 High risk weed sites
& pathwaysBellingen Clarence
ValleyCoffs
HarbourKempsey Nambucca
Valley
Port Macquarie-
Hastings
Rous County
Council*
Region total
High risk sites inspected
(number)113 817 420 275 32 258 1,500 3,302
High risk pathways inspected
(km)3,428 3,512 884 1,006 482 2,084 5,731 17,127
High risk sites treated (ha) 190 93 310 155 215 324 1,424 2,711
High risk pathways treated
(km) 646 597 342 370 1,200 1,245 3,458 7,858

30 Regional State of the Environment Report Summary 2020
From 1 July 2017, the management of pest animals came under the Biosecurity Act 2015.
In the North Coast region, key fauna pest species are deer, pigs, wild dogs, foxes, feral cats, cane toads, indian mynas, rabbits and hares, carp, mosquito fish.
Deer have reportedly increased their distribution and abundance by up to 60% in NSW since 2016, and have become an increasing issue in the north coast region, particularly in Port Macquarie-Hastings and Coffs Harbour LGAs.
Carp and goldfish sightings have increased in areas where they are not usually seen.
Feral cats are a continuing problem.
Fall army worm were detected in the north coast region in 2020.
Crazy ants were detected in Lismore in 2018.
Cane toads populations appear to be static with management containing their spread in the region.Pathogens are of increasing concern in the area and include –
• Myrtle rust affecting plants from thefamily Myrtaceae.
• The frog fungus infection chytrid fungus.
• Phytophthora cinnamomi (root rot fungus) which causes native plant dieback.
Councils continue to manage vertebrate pests, often in conjunction with Local Land Services and the regional and local Landcare groups.Actions include:• Loan of traps for Indian mynas, cats,
wild dogs, foxes, rabbits.• Cane toad musters, exclusion fencing,
tadpole/egg collections.• Collaborating with Local Land Services
and for wild dog and fox control.• Carp musters in the Richmond Valley.• Education campaigns.• Regional feral deer program in Tweed,
Byron and Kyogle LGAs• Regional cat management issues paper
in development with a number ofstakeholders in the northern LGAs
Key Fauna Pest SpeciesDeer, pigs, wild dogs, foxes, feral cats, cane toads, indian mynas, rabbits and hares, carp, mosquito fish.
Pathogensare of increasing concern in the area
Councilsare involved in managing vertebrate pests
2.5.2 Invasive Fauna Species
Photo: Cane Toad - Nigel CotsellPhoto: Cow eating tropical soda apple - Geoff Foster

31 Regional State of the Environment Report Summary 2020
Land Use & Soils03
Photo: Lismore City Council

32 Regional State of the Environment Report Summary 2020
Soil ConditionIs decreasing due to intensification of landuse.
Land Use MappingConfirms intensification in the North Coast Region.
Since the 2016 report, landuse mapping was completed, and some new analyses conducted of soil acidification. There has been no comprehensive update of soil condition and land management within capability since our previous report in 2016.
Photo: Lismore City Council

33 Regional State of the Environment Report Summary 2020
A new study by the CSIRO has found the intensification of landuse from cropping and horticulture, with associated increased use of high nitrogen fertilisers, has increased soil acidity on the NSW North Coast, in areas that were previously unaffected. Overuse of fertilisers also creates increases in on-farm acidity and deficiencies in other soil nutrients, and off-farm with high inputs into waterways, into groundwater, and nitrous oxide emissions (McKenzie et al, 2017).Soil organic carbon levels are declining under current land management, and this region has the highest hillslope soil erosion rates in NSW, averaging 5.57 tonnes per hectare per year over the period 2000 to 2014. Salinity is another concern for soil quality in the North Coast region, with low lying areas north of the Richmond River to the Queensland border, and coastal areas in the south of the region at highest risk of very high salinity. Acid sulfate soils are being managed in the region, and there is an improvement due to remediation works conducted (McKenzie et al, 2017).
3.1 Soil condition
Photo: Ryan Fowler

34 Regional State of the Environment Report Summary 2020
Photo: Dairy - Kyogle Council
Photo: Horticulture Coffs Harbour - Shane White
The landuse mapping completed by DPIE in 2016 used aerial imagery to classify landuse in the region. The figures below are similar to those from the 2013 landuse mapping and do not capture the recently observed substantial intensification of landuse since 2016. For example, in the Coffs Harbour region, bananas have been replaced by hothouses, which are a more intensive landuse requiring land modification, construction of hothouses, and large water, fertiliser and pesticide applications when compared to bananas, but are still considered as horticulture. Although land use practices have generally improved, the increase in intensity has increased pressure on soil condition.
Monitoring of land disturbance has shown an increase in disturbance from higher intensity land uses (NSW SOE 2018), which reflects what has been observed in the region with the transition from grazing and former lower intensity horticulture to intensive plant agriculture, particularly nuts, hothouse horticulture (cucumbers, tomatoes) and berries.
3.2 Landuse
Land Use Summary 2016
Area (hectares)
% North Coast
Region
Conservation/minimal use 1,306,657 40.79
Grazing 1,021,256 31.88
Forestry 542,241 16.93
Residential and farm infrastructure 86,378 2.70
Cropping (sugar, coffee, silage, cereals) 61,755 1.93
Intensive plant agriculture - IPA (includes transition land that was IPA)
31,858 0.99
Transport and communication 14,991 0.47
Services and utilities 9,526 0.30
Mining 1,628 0.05
Intensive livestock agriculture 1,581 0.05
Manufacturing/industrial 1,134 0.04
Monitoring of land disturbance has shown an increase in disturbance from higher intensity land uses (NSW SOE 2018).

35 Regional State of the Environment Report Summary 2020
3.3 Funded land & soil management activities
3.4 Acid sulfate soils
Data for soil improvements and erosion controls was not available for this summary. However it will be reported on in the main Regional State of the Environment 2020 report due in November 2021.
Acid sulfate soils (ASS) are found in all coastal LGAs in the region. Comprehensive mapping has identified and classified them, and the current status of management in each LGA is in the table below. Most LGAs manage ASS through their Local Environmental Plan (LEP) and Development Control Plans (DCP). Rous County Council is the Flood Mitigation Authority for the Richmond River floodplain, responsible for reducing the environmental impact of flood management infrastructure including those located in areas of acid sulfate soils. Sugar cane is often grown in areas of ASS and the industry self-regulates the management of ASS.
LGA Acid Sulfate Soils ManagementBallina Managed through Local Environmental Plan except for sugar cane
Bellingen Managed through Development Control Plan
Byron Managed through Development Control Plan
Clarence Valley Managed through Local Environmental Plan and ongoing liaison with landholders who have had remedia-tion works or control structures on their properties
Coffs Harbour Managed through Development Control Plan
Kempsey Managed through Local Environmental Plan and ongoing lision with landholders who have had remedia-tion works on their properties
Kyogle NA
Lismore NA
Nambucca Valley Managed through Local Environmental Plan together with remediation undertaken by Council on private land with ongoing monitoring
Port Macquarie-Hastings All ASS remediated in LGA
Richmond Valley Managed through Local Environmental Plan except for sugar cane
Rous County Council Works cooperatively with landowners and stakeholders to remediate historical disturbance of acid sulfate soils; has an Active Floodgate Management Program.
Tweed Managed through Local Environmental Plan and ongoing liaison with landholders who have had remedia-tion works on their properties
Photo: Craig Stehn Photo: Lismore City Council Photo: Bill Larkin

36 Regional State of the Environment Report Summary 2020
3.5 Mining
Activity Year NumberArea (Hectares) Substances identified
Active mines
2016 8 399.6 Antimony, Gold, Silver, clay, dolomite, phosphate, limestone, gold, silver
2020 4 284.7 Antimony, Gold, Silver, clay, dolomite, phosphate, limestone, gold, silver
Exploration licences
2016 30 168,061 Metallic minerals, non-metallic minerals, mineral sands
2020 30 303,414 Metallic minerals, non-metallic minerals, semi-precious stones, mineral sands
The area under active mining has reduced since 2016, from 399.6 hectares to 284.7 hectares in 2020, with the closure of a clay extraction site and 2 very small mineral mines.
The area under current exploration license has increased since 2016 from 168,061 ha to 303,414 ha in 2020. Exploration is not an approval to mine, but a search for what minerals may lie below the surface. If suitable minerals are found, then a separate comprehensive approvals process must be undertaken. The majority of exploration licences are not developed into active mines (NSW Mining 2021).
4 active mining licencesrecorded in the region in 2020,
down from 8 in 2016
has increased by 80% since 2016
Area under exploration licences
Photo: Farmhouse - Lismore City Council

37 Regional State of the Environment Report Summary 2020
Water04
Photo: Bellingen Shire Council

38 Regional State of the Environment Report Summary 2020
Photo: Upper Clarence Bonalbo - KyogleCouncil
4.1 Estuarine & freshwater riversComprehensive River Health Assessment
Since the 2016 report, the NSW Marine Estate Management Strategy (MEMS) 2018-2028 was released by NSW DPI to respond to priority threats to water quality, habitat and biodiversity of NSW coastal waters and estuaries.
since 2016.
All the region’s waterwayshave had comprehensive ecosystem health assessments conducted
Key findings for all programs are:• General slight decline in water quality• Concern with increasing nutrient loads on many waterways• Poor tidal exchange and infrequent natural ICOLL opening during the dry years• Poor riparian vegetation and geomorphic condition are common
Most monitoring indicates slight declines in water quality, with increasingly high nutrients loads and reduced flows particularly during the dry years.
All 12 LGAs in the reporting region conduct some type of regular river health monitoring. Tweed conducts its own comprehensive water quality monitoring program, Byron conducts comprehensive monthly and event-based water quality parameters and bi-annual vegetation transects
in Belongil and Tallow Creeks, all other LGA's have had at least one round of the University of New England’s Ecohealth program, which monitors water quality as well as riparian and geomorphic condition, macroinvertebrates and sometimes fish and zooplankton. Bellingen has taken a citizen science approach teaming up with Bellinger Riverwatch to take basic water quality metrics, but not nutrients, macroinvertebrates or riparian condition.

39 Regional State of the Environment Report Summary 2020
Council-led Water Quality MonitoringLGA Catchment Unit 2018 2019 2020
Tweed
Tweed estuary
Water quality assessed annually by Council for bacteria, Chlorophyll-a, total phosphorous, total nitrogen, turbidity, pH, dissolved oxygen
A A A
Tweed mid & upper estuary
B C B
Coastal Creeks B B B
Cobaki-Terranora A A A
Upper Cobaki-Terranora
D D D
Upper Catchment B B B
Rous estuary D C C
Byron
Tallow Creek A variety of water quality monitoring (monthly, event based and environmental health) by Council - no scorecard
Not graded but concerns with nutrient loads and low dissolved oxygen at timesBelongil Creek
Bellingen Bellinger & Kalang Bellingen RiverwatchMonthly monitoring of water temperature, pH, electrical conductivity (salinity) , dissolved oxygen, turbidity, available phosphate.
Ecohealth program (University of New England)
LGA Catchment Unit Assessment YearOverall Grade
Water Quality
RiparianMacro- Inver-tebrates
Geo- Morphic Fish
Ballina, Byron, Kyogle, Lismore, Richmond Valley (combined Ecohealth 2015)
Wilsons River Ecohealth 2015 F F D- D C-
Richmond River (main stem)
Ecohealth 2015 D- F D- D D+
Eden, Iron Pot Creeks, Shannon Brook
Ecohealth 2015 D+ D- C- D C-
Bungawalbin, Myrtle, Sandy Creeks
Ecohealth 2015 D D- D D- C
Richmond - Emi-grant, Macguires, North Creeks
Ecohealth 2015 D+ D D- C D+
Clarence - Northern tributaries
Ecohealth 2015 C+ C+ D+ C- - A-
Clarence
Clarence River (main stem)
Ecohealth 2014 C+ C D+ D+ - A
Mann-Nymboida-Boyd
Ecohealth 2014 C+ C+ D+ C+ - B+
Coffs Harbour
Coastal tributaries (Orara)
Ecohealth 2014 C- D C+ F - A
Coffs coastal cat-chments
Ecohealth 2012 C C C+ D- C+
Ecohealth 2015 C- C C+ F C+ B-
BellingenBellinger
Ecohealth 2009B- B C+ C+
Kalang C+ B- C C-
Nambucca Valley
Nambucca Ecohealth 2018 C- D C- D+ C B-
Kempsey Macleay Ecohealth 2016 C- D+ D+ D+ C B-
Port Macqua-rie-Hastings
Hastings catchmentEcohealth 2011 B- C+ C- C+ B
Ecohealth 2015 C- C- D- C- B- B
Lake Innes/Lake Cathie
Ecohealth 2011 B- C- A- B+
Ecohealth 2015 C+ D- B+ B+
Camden Haven catchment
Ecohealth 2011 C C C C- B
Ecohealth 2015 C D- C F B B
Water quality monitoring by LGA

40 Regional State of the Environment Report Summary 2020
Photo: Nambucca Heads - Seen Australia
Best estuarieswere in Tweed with Cudgen Creek (A) improving steadily over thepast years, Jerusalem Creek(Richmond Valley) and DalhousieCreek (Bellingen) consistentlyscoring an A, and the Macleayalso scored an A in 2018-19.
2018 samplingshowed the majority (60%) scoring B – Good.
Conducted regularlyby the NSW DPIE
Estuarine water quality monitoring is conductedregularly by the NSW Department of Planning, Industry and Environment (DPIE). The program was initially conducted under the NSW Monitoring Evaluation and reporting strategy until 2015, and is now conducted as part of the Marine Estate Management Strategy (MEMS).
The 2018 sampling showed a decrease overall in the percentage of estuaries scoring A - Very good down from 28% in 2015 to 13% in 2018, with the majority (60%) scoring B – Good.
The poorest estuaries were in Byron LGA, scoring D, and Flat Top Point in the Solitary Islands Marine Park at Coffs Harbour scoring an F. The best were in Tweed with Cudgen Creek (A) improving steadily over the past years, Jerusalem Creek (Richmond Valley) and Dalhousie Creek (Bellingen) consistently scoring an A, and the Macleay also scored an A in 2018-19.
In response to increasing pressures on waterways, the MEMS has funded rehabilitation works in the region, with initial projects targeting the Richmond River catchment managed by Local Land Services and the Soil Conservation Service. At this stage MEMS funding is not directly available to Councils for on-ground rehabilitation works, however Councils are encouraged to integrate management actions into Coastal Management Programs (CMP) for future implementation.
Estuarine water quality

41 Regional State of the Environment Report Summary 2020
Percentage of estuaries attaining each grade
A B C D F
2009 0 61 26 10 3
2012 43 40 17 0 0
2015 28 41 28 3 0
2018 13 60 17 7 3Location (north to south) 2009/10 2012/13 2015/16 2018/19
Tweed River B B
Cudgen Creek B C B A
Mooball Creek B B
Brunswick River C C C D
Belongil Creek C C C D
Tallow Creek B A B B
Broken Head Creek B
Richmond River B C C
Salty Lagoon A B
Evans River C C
Jerusalem Creek B A A A
Lake Arragan C A
Sandon River B A A B
Wooli River B A B B
Station Creek B A A B
Corindi River B A B B
Pipe Clay Creek C B A
Arrawarra Creek D B B B
Darkum Creek B A C
Woolgoolga Lake B B A B
Flat Top Point E B C E
Hearnes Lake D A C B
Moonee Creek B A B B
Pine Brush Creek C B B B
Coffs Creek D C C C
Boambee Creek B C
Bonville Creek B B B B
Bellinger River B B
Dalhousie Creek A A A
Oyster Creek B B
Deep Creek B A B
Nambucca River B A B B
Macleay River B A
South West Rocks Creek
B
Saltwater Creek (Frederickton)
B
Korogoro Creek C C
Killick Creek C C
Hastings River B A B B
Cathie Creek B A
Duchess Gully C C B
Camden Haven B
Key
A Very good
B Good
C Fair
D Poor
F Very poor

42 Regional State of the Environment Report Summary 2020
A collaboration between universities, government agencies and community groups in NSW has comprehensively researched litter entering waterways, estuaries and beaches. This research is still in progress, but preliminary results indicate:• Mangroves are the main debris collection areas – they are litter traps!• Ocean beaches have far less litter than estuaries and waterways• Plastic is the greatest litter type – over 91%• Cigarette butts and fishing related debris are the next most littered items• The plastic bag ban has resulted in measurably fewer plastic bags in waterways• The container deposit scheme has shown benefits for the north coast with fewer bottles in waterways (Smith et al 2020 - NSW Container Deposit Scheme Monitoring Program - Key Littered Items Study – KLIS)
Key facts:
Marine and estuarine debris
4.1.6 Waste water treatment plant performance and onsite sewage management system performance
to waterways
reused, mostly for
agriculture, some for
urban use
70%to the ocean15%
to land5%10%
4.1.3 Aquatic macroinvertebrates 4.1.4 Fish condition4.1.5 Riparian vegetation
No new information. Please see the Regional State of the Environment Report 2016 for details of previous condition.
Waste water reuse is now at 10% of the total
treated waste water in the region up from 6.6% in 2012Where does treated wastewater go:
Ballina is treating some wastewater to drinking water standards, and is
reusing it for toilets and gardens in
urban areas
Water shortages during the 2019 drought may
prompt more reuse of wastewater for
industry, agriculture – the largest water users
Most LGAs had lower wastewater
treatment volumes during
the dry 2018-2019Lismore and
Bellingen have the
lowest reuse
Kyogle and Coffs Harbour have the
highest reuse, generally for agriculture

43 Regional State of the Environment Report Summary 2020
Percent waste water discharged by location in 2020
Regional State of the Environment Report 2020Graphs - Percent wastewater discharged by location 2020
0%
20%
40%
60%
80%
100%
120%
Byro
n
Twee
d
Balli
na
Rich
mon
d Va
lley
Co�s
Har
bour
Nambu
cca V
alle
y
Kyog
le
Kem
psey
Port
Macqu
arie
- Has
tingsLi
smor
e
Regi
onal
aver
age
Belli
ngen
Clar
ence
Valle
y
% to land % recycled% to ocean%to waterways
Photo: Nambucca Valley Council

44 Regional State of the Environment Report Summary 2020
On-site sewage management system performance• For Councils with fully resourced inspections, compliance rates are generally over 90%• When resourcing is an issue, only systems with complaints are inspected, leading to a high failure rate• An estimated 10% of all systems are unregistered • Some LGAs have audited all unregistered systems to register and document them• Cost is an issue for residents needing to register an unregistered septic system
Note that not all data was available for this summary report.
Regional State of the Environment Report 2020Graphs - OSMS 2020
Byro
n
Twee
d
Balli
na
Rich
mon
d Va
lley
Co�s
Har
bour
Nambu
cca V
alle
y
Kyog
le
Kem
psey
Port
Macqu
arie
- Has
tings
Lism
ore
Belli
ngen
Clar
ence
Valle
y
0
20
40
60
80
100
2018/19 2019/202017/182016/17
% co
mpl
ianc
e
Photo: Tweed Heads - Ryan Fowler

45 Regional State of the Environment Report Summary 2020
4.1.7 River restoration works & riparian vegetation
• All LGAs and Rous County Council are working to improve waterways andriparian condition, often in conjunctionwith local Landcare groups
• Many are reliant on external funding toconduct these works
• Funding provided through the Marine Estate Management Strategy hasfunded some substantial works on the Richmond River
• Habitat rehabilitation works are summarised in section 2.2. Of theseworks, over 60% are riparian habitats,indicating the importance of thesehabitats and the need for improvement as indicated by all the region’s waterquality studies. Information canbe used to increase communityawareness of environmental issues, and to guide natural resource managers in prioritising and addressing management actions.
See the Regional State of the Environment Report 2016 for details of previous wetland condition.
4.2 Wetlands – no new information for this summary
4.1.8 Stormwater improvement works & WSUD
• All LGAs in the reporting region have Water Sensitive Urban Design (WSUD)requirements for new developments
• Many are modifying stormwaterdrainage to include filtration devices,ponds, outlet protection, buffer strips,dispersal trenches, increasing naturalvegetation, and stormwater storage
• Gross pollutant traps have been upgraded in many LGAs to capturelitter and debris
Photo: Coffs Harbour City Council

46 Regional State of the Environment Report Summary 2020
Groundwater is an essential water source for both ecological systems such as wetlands, streams and their surrounds, but also for rural landholders and towns. Some water sharing plans in the region now include groundwater, recognising the links between ground and surface water.
• Since 2016, all water sources in the North Coast region are covered by a Water Sharing Plan• Four are due for review but have been extended by two years to allow for further resourcing and information
gathering• New mapping of high ecological value waterways and groundwater dependent ecosystems (GDE) completed• Metering for licensed water users will be implemented in the coastal regions by 1 December 2023• Natural Resources Access Regulator (NRAR) created in 2018 to be an independent water compliance unit• Alstonville plateau has the majority of known GDEs in the region and has previously been an overallocated
water supply area of concern• At this stage there is no data on groundwater quality for the region
4.3 Groundwater
Water Sharing Plan (WSP) - North to south StatusCommence date Cease date
Brunswick Unregulated and Alluvial Water Sources 2016 In force July, 2016 June, 2026
North Coast Coastal Sands Groundwater Sources 2016 In force July, 2016 June, 2026
North Coast Fractured and Porous Rock Groundwater Sources 2016 In force July, 2016 June, 2026
Richmond River Area Unregulated, Regulated and Alluvial Water Sources 2010
In force - 2 year extension
December, 2010 July, 2023
Tweed River Area Unregulated and Alluvial Water Sources 2010 In force - 2 year extension
December, 2010 July, 2023
Bellinger River Area Unregulated and Alluvial Water Sources 2020 In force July, 2020 June, 2030
Clarence River Unregulated and Alluvial Water Sources 2016 In force July, 2016 June, 2026
Coffs Harbour Area Unregulated and Alluvial Water Sources 2009 In force - 2 year extension
August, 2009 June, 2022
Hastings Unregulated and Alluvial Water Sources 2019 In force July, 2019 June, 2029
Lower North Coast Unregulated and Alluvial Water Sources 2009 In force - 2 year extension
August, 2009 June, 2022
Macleay Unregulated and Alluvial Water Sources 2016 In force July, 2016 June, 2026
Nambucca Unregulated and Alluvial Water Sources 2016 In force September, 2016 June, 2027
North Coast Coastal Sands Groundwater Sources 2016 In force July, 2016 June, 2026
North Coast Fractured and Porous Rock Groundwater Sources 2016 In force July, 2016 June, 2026
Photo: Crescent Head Beach bridge - Paul Koch

47 Regional State of the Environment Report Summary 2020
Marine Water QualityThere is little comprehensive data on marine water quality for the region. However, new research underway by DPIE, CSIRO and supported by MEMS is investigating trends in ocean water quality.
Two LGAs – Ballina and Richmond Valley Council, continue to monitor beach and swimming water quality through the NSW Beachwatch program. "Coffs Habour and Byron LGAs have recently rejoined the program.
Beachwatch monitoring confirms that ocean beaches are generally always good or very good for swimming and recreational use due to the constant tidal flushing. Estuarine sites are variable depending on the level of tidal flushing and impacts of stormwater pollution after rain. Lake/lagoon sites are generally good in dry weather, but they are highly susceptible to the impacts of wet weather during and for up to three days after rain.
4.4 Near-shore Marine
Swimming Site Site Type Beach Suitability Grade
Ballina Shire Council 2016/17 2017/18 2018/19 2019/20
Seven Mile Beach Ocean beach VG VG VG VG
Lake Ainsworth North Lake/Lagoon - P P P
Lake Ainsworth East Lake/Lagoon G P P G
Lake Ainsworth South Lake/Lagoon G G G G
Lake Ainsworth West Lake/Lagoon P P P P
Shelly Beach Ocean beach G G G G
Lighthouse Beach Ocean beach VG VG VG VG
Shaws Bay North Estuarine G G G G
Shaws Bay East Estuarine G G G G
Shaws Bay East Arm Estuarine - G G G
Shaws Bay East Beach Estuarine - G G G
Shaws Bay West Estuarine G G G G
The Serpentine Estuarine G G G G
Richmond Valley Council 2016/17 2017/18 2018/19 2019/20
Airforce Beach Ocean beach VG VG VG VG
Main Beach Ocean beach VG VG VG VG
Shark Bay Ocean beach VG VG VG VG
Evans River Estuarine G P P P
Elm Street Bridge North (Evans River) Estuarine G G G G
Photo: Port Macquarie - Matt Cramer
Photo: Wooli River - Clarence Valley Council
Key
VG Very good
G Good
F Fair
P Poor
VP Very poor

48 Regional State of the Environment Report Summary 2020
Rocky Reef Biota
Rocky reef biota are the flora and fauna that inhabit the reefs along the coast. There is little comprehensive state-wide information on the status of rocky reef biota, but due to the presence of two marine protected areas in the region, there is some continued local research.Since 2016, there has been:• Coastal LiDAR surveys for the entire region
from 200m inland out to 25m deep whichgives far more detailed imagery of subtidalhabitats in the near-shore
• A study of the effect of no-take marine reserve areas compared to other areas in NSW has shown commercially fished species such as pink snapper (Chrysophrys auratus) were significantly more abundant in no-take reserves thanin fished areas. Other non-fished species remained in similar abundance regardlessof zoning, indicating no-take reserves are a useful fisheries management tool
• Research into the impacts of climate change in ocean waters and modellingrefuge areas for various species
• Research demonstrating that oceanwaters south of 32°S are warming twice asfast as those north of 32°S.
These will be further detailed in the full
Regional State of the Environment 2020 report.
Photo: (top) Grassy Head - Paul Koch,(Bottom) Brett Vercoe

49 Regional State of the Environment Report Summary 2020
Marine Protected Areas (MPA)There are two marine parks – Cape Byron and Solitary Islands – and one aquatic reserve – Cook Island – in the reporting region. As Lord Howe Island is not included in the reporting region, the Lord Howe Island Marine Park is not included.
Since the 2016 report, minor changes to sanctuary zones (complete no-take protection zones) in NSW marine protected areas were made in 2018 to allow shore-based recreational fishing from some ocean beaches and headlands. Six percent of the Region’s marine waters are completely protected from any extractive activity, with 17.7% zoned for low impact fishing activities.
Coastal Management
All coastal LGAs are working towards preparation of Coastal Management Programs (CMPs) for their coasts and estuaries under the NSW Coastal Management Framework, which incorporates the new Coastal Management Act 2016, Coastal Management SEPP, and the Coastal Management Manual. The five-stage process is being worked through by all LGAs in the regional to either create new CMPs or update existing Coastal Zone Management Plans (CZMPs) to the new framework. The new framework encourages whole-of-catchment approaches incorporating other tenures such as National Parks and Crown Lands.
Marine protected area 2020 Total reserve area (ha)Area zoned for complete protection — no fishing
(ha)
Area zoned for low impact fishing activities
— recreational and commercial (ha)
Solitary Islands Marine Park 72,329 8,675 39,370
Cape Byron Marine Park 22,275 6,118 4,271
Cook Island Aquatic Reserve 74 29 45
TOTAL 94,678 14,822 43,686
% of North Coast Region marine area under
protection (excl. Lord Howe Island)38.3 6.0 17.7
TOTAL marine area of North Coast Region (excl. Lord
Howe Island waters) (ha)247,233
LGA/County Council
Number of CMPs Coastal Management Status
Ballina 51 CMP finalised, 1 CMP in progress, 2 existing CZMPs for updating to CMPs collaboration with Rous County Council for the Richmond River CMP preparation
Bellingen 1 Scoping study in progress, 1 certified CZMP
Byron 5
Two Scoping studies completed for the open coast and ICOLLS. 1 not yet commenced. 1 in progress (Richmond River CMP being produced by Rous County Council and Ballina Council)
Clarence Valley 2Coastal CMP scoping study complete and estuary CMP scoping study commencing
Coffs Harbour 5 3 in progress, 2 not yet commenced
Kempsey 5 4 in progress
Kyogle 1Partnering with Rous County Council on the Richmond CMP
Lismore 1Partnering with Rous County Council on the Richmond CMP
Nambucca Valley 1 At stage 4 - awaiting finalisation and certification
Port Macquarie-Hastings
1 Whole of LGA CMP at scoping stage
Richmond Valley 1Partnering with Rous County Council on the Richmond CMP
Rous County 1
Richmond River CMP at Stage 1 - scoping study - on behalf of Ballina, Richmond Valley, Lismore and Kyogle LGAs, and parts of Byron and Clarence Valley LGAs. It will replace the existing Richmond River CZMP
Tweed 2 Tweed River Estuary CMP at stage 4, Tweed Coast CMP Stage 1 scoping study complete

Published by North Coast Region State of the Environment 2020 Working Group (on behalf of the participating councils)Coffs Harbour City CouncilLocked Bag 155, Coffs Harbour NSW 2450P: (02) 6648 4000E: [email protected]: coffsharbour.nsw.gov.auVersion 1 - October 2021 Prepared by North Coast Region State of the Environment Report Working GroupDesigned by GP DesignE: [email protected]
References - please see the full Regional State of the Environment 2020 report
Photo: Coffs Harbour City Council