Embed Size (px)
Citation preview
Michigan State Employees’ Retirement System
Summary Annual Reportfor Fiscal Year 2014
Prepared byThe Office of Retirement Services
P.O. Box 30171Lansing, MI 48909-7671
(517) 322-5103(800) 381-5111
A Pension and Other Employee Benefit Trust Fund of the State of Michigan
Michigan State Employees’ Retirement System2
About the Michigan State Employees’ Retirement System This report is in compliance with Public Act 314 of 1965, as amended. The contents came from the complete Michigan State Employees’ Retirement System 2014 Comprehensive Annual Financial Report (CAFR), an existing public data source available on our website at www.michigan.gov/orsstatedb, and additional analysis performed after September 30, 2014.
The Michigan State Employees’ Retirement System serves 56,615 retirees receiving monthly benefits, and 15,439 active members. State employee pensions are protected by Michigan’s Constitution. The System’s net assets are held in trust to meet future benefit payments.
The State Treasurer is the investment fiduciary and custodian of all investments of the System pursuant to State law.
Michigan State Employees’ Retirement System Service Providers A service provider is any individual, third-party agent or consultant, or other entity that receives direct or indirect compensation for consulting, investment management, brokerage, or custody services related to the system’s assets.
AccelAdventAEW Capital ManagementAffinity ApaxApollo Global ManagementArboretumArdianAresArgusAttucks Asset ManagementAustin VenturesAvanath Capital ManagementAvenue InternationalAXAAxiom-AsiaBaillie Gifford International, LLCBalfour Beatty GroupBanc FundsBank of America/MerrillBank of MontrealBarclay’s CapitalBattery VenturesBB&T Capital MarketsBC European CapitalBeacon Capital PartnersBentall KennedyBerkshireBGC Partners
Bivium Capital PartnersBlackRock Inc.Blackstone GroupBNP ParibasBNY ConvergExBridgepointBrockway Moran & PartnersBrookfield Asset Management IncBTIG, IncCapital Institutional ServicesCapri Capital PartnersCarlyleCastle HarlanCCMP Centerbridge Capital PartnersCerberusCIM GroupCitigroup Global Markets, Inc.Clarion PartnersClarkston Capital PartnersClarusClearstoneCMEACobalt Capital PartnersColler CapitalColumbia Management Investment
AdvisorsCoStar Realty Information Inc.Cowen Group
Cramer Rosenthal McGlynnCredit Suisse Securities, LLCCredit Suisse/DLJCrescentDA Davidson & Co.Dalmore Capital LimitedDeutsche BankDevon Self StorageDodge & CoxDomain Capital AdvisorsDoughty HansonDover StreetDrexel HamiltonEdens Limited PartnershipEDF VenturesEssex WoodlandsFirst Tennessee FinancialFirstMark CapitalFisher InvestmentsFive Star Realty PartnersFlagship VenturesFox Paine Franklin TempletonFreeman Spogli Equity PartnersFrontenacGateway CapitalGE CapitalGlencoeGlobespan
3 Michigan State Employees’ Retirement System
Michigan State Employees’ Retirement System Service Providers, continued
Goldman SachsGreen Equity InvestorsGrosvenor Capital ManagementGrotechGSO GW Capital, Inc.H.I.G.HarbourvestHealthcare VenturesHeitman Capital ManagementHenderson Global InvestorsHewitt Ennis KnuppHuronInsight Venture PartnersInterWest Partners Invesco LtdJAFCOJP Morgan ChaseJP Morgan Investment ManagementKBS Realty AdvisorsKelsoKensington Realty AdvisorsKevin Miller Financial ServicesKhoslaKKRKohlberg Kravis Roberts & CoL&B Realty AdvisorsLandmark Realty AdvisorsLaSalle Investment ManagementLazard Asset ManagementLightspeed Venture PartnersLion CapitalLloyds Banking GroupLong Point CapitalLoomis Sayles & CompanyLos Angeles Capital ManagementLowe Enterprises Investment
ManagementMarathon Asset ManagementMatlin PattersonMenlo VenturesMeritechMerrill Lynch Pierce Fenner & SmithMesirow Financial IncMetropolitan West Asset Management
MFR SecuritiesMFS Institutional AdvisorsMischler Financial GroupMorgan StanleyMPMMulti-Bank SecuritiesNew Leaf VenturesNordic CapitalNorth Castle PartnersNorthPointe CapitalNV PartnersOak Investment PartnersOaktreeOne LibertyOTA Ltd PartnershipPaine & PartnersPaladin Realty PartnersParthenonPeninsulaPermiraPhiladelphia Financial Life Assurance
CompanyPhoenix Equity PartnersPiper JaffrayPrimusPrincipal CMBSPrincipal Financial GroupProprium Capital PartnersProvidence Equity PartnersPrudential Investment ManagementPublic Pension CapitalPyramis Global AdvisorsQuestor Raymond James & AssocRBC Capital MarketsRBS GreenwichRFERhone PartnersRialto CapitalRiversideRW BairdRW Pressprich & CoSanford C. Bernstein & Co, Inc.Seizert Capital PartnersSG Americas
Silver LakeSociete GeneraleSouthwest SecuritiesSproutState Street BankState Street Global AdvisorsSterne AgeeStifel Nicolaus & CoStockbridge Capital GroupStonepeak Advisors LLCSun Trust, Robinson, HumphreySusquehanna Intl GroupT Rowe Price Associates, IncTCWThe John Buck CompanyThe Shansby GroupTPGTrilanticTrue North Management GroupTullis DickersonTurnbridge Capital PartnersUBS SecuritiesUnitasUS BankVeritas Capital PartnersVictory Capital ManagementVista Equity PartnersWarburg PincusWayne CoWeiss, Peck & GreerWellington Management CompanyWells Fargo Securities LLCWestAmWestern National GroupWindpointWinnington Capital Limited
Michigan State Employees’ Retirement System4
Membership Members of the system include employees of the State of Michigan and its noncentral agencies as listed below:• Classified or unclassified state employees,
including civil service employees, appointed officials in the executive branch, and employees of the legislature and judiciary branch.
• Employees who work for the Business Enterprise Program, Mackinac Island State Park, or Michigan State Bar and were hired before March 31, 1997.
• Employees hired before October 1, 1996, and employed by the American Legion, American Veterans, Disabled American Veterans, Marine Corps League, Military Order of the Purple Heart, Wayne County Clerk Recorders Court, Third Circuit Court, or 36th District Court.
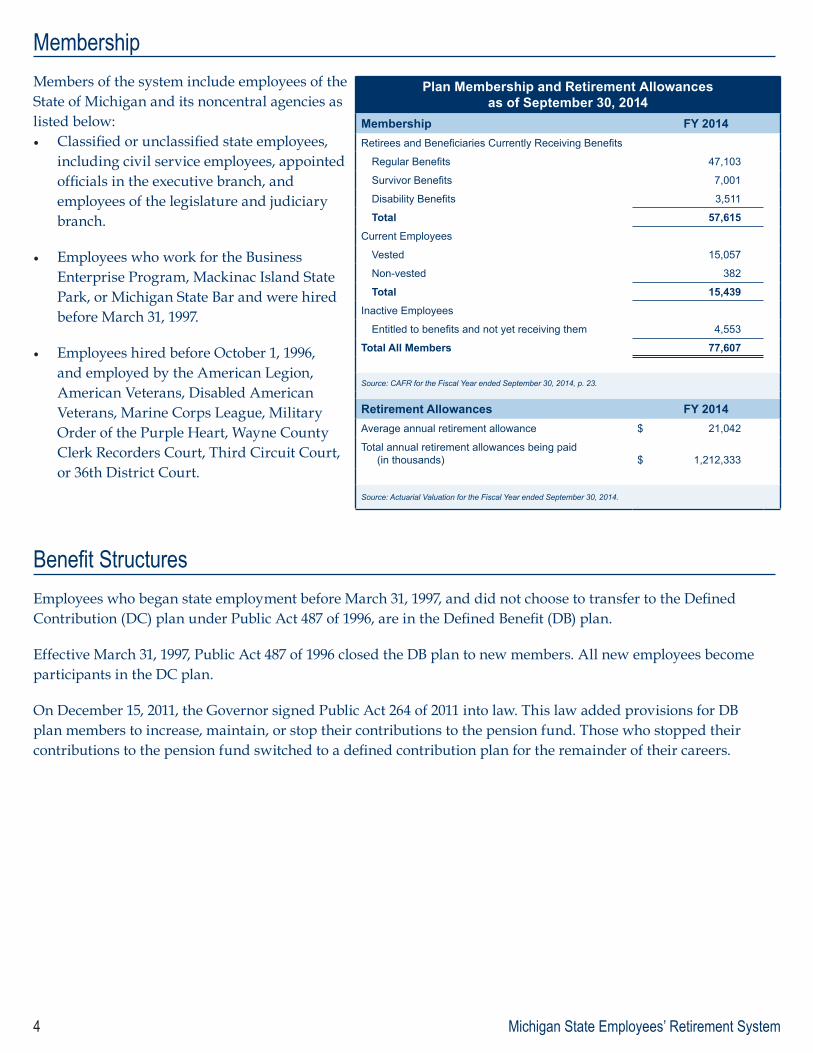
Plan Membership and Retirement Allowances as of September 30, 2014
Membership FY 2014Retirees and Beneficiaries Currently Receiving Benefits
Regular Benefits 47,103
Survivor Benefits 7,001
Disability Benefits 3,511
Total 57,615
Current Employees
Vested 15,057
Non-vested 382
Total 15,439
Inactive Employees
Entitled to benefits and not yet receiving them 4,553
Total All Members 77,607
Source: CAFR for the Fiscal Year ended September 30, 2014, p. 23.
Retirement Allowances FY 2014Average annual retirement allowance $ 21,042
Total annual retirement allowances being paid (in thousands) $ 1,212,333
Source: Actuarial Valuation for the Fiscal Year ended September 30, 2014.
Benefit Structures Employees who began state employment before March 31, 1997, and did not choose to transfer to the Defined Contribution (DC) plan under Public Act 487 of 1996, are in the Defined Benefit (DB) plan.
Effective March 31, 1997, Public Act 487 of 1996 closed the DB plan to new members. All new employees become participants in the DC plan.
On December 15, 2011, the Governor signed Public Act 264 of 2011 into law. This law added provisions for DB plan members to increase, maintain, or stop their contributions to the pension fund. Those who stopped their contributions to the pension fund switched to a defined contribution plan for the remainder of their careers.
5 Michigan State Employees’ Retirement System
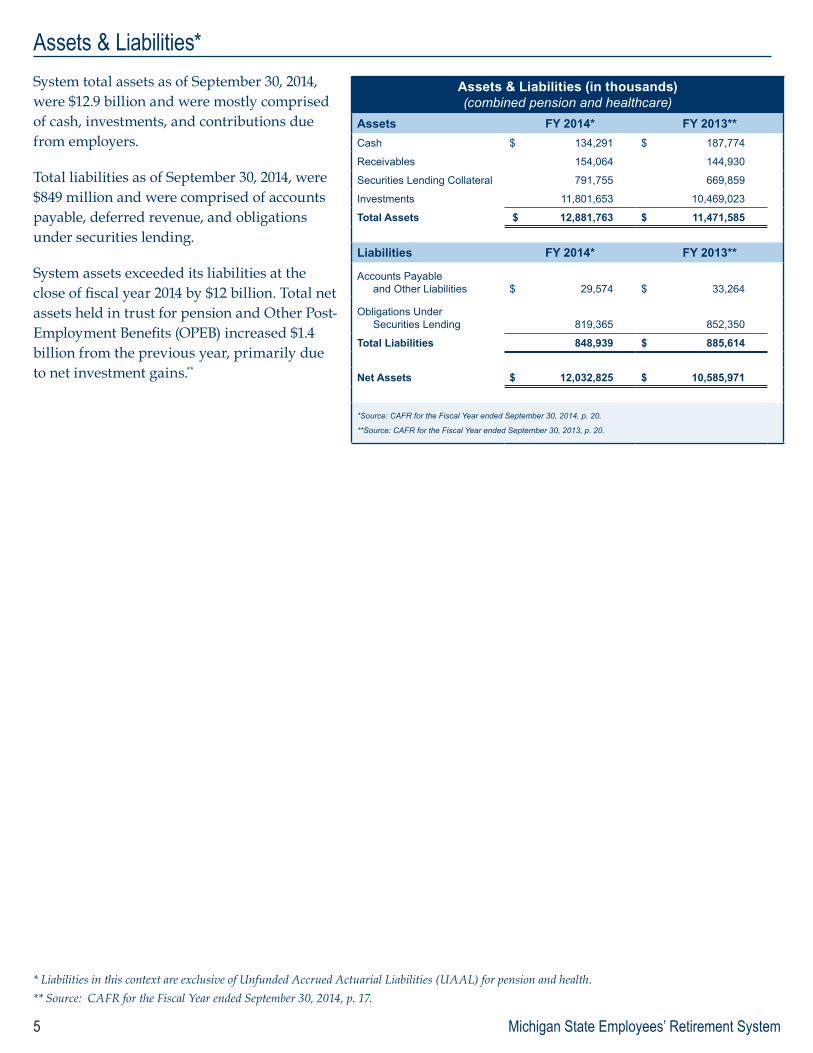
Assets & Liabilities* System total assets as of September 30, 2014, were $12.9 billion and were mostly comprised of cash, investments, and contributions due from employers.
Total liabilities as of September 30, 2014, were $849 million and were comprised of accounts payable, deferred revenue, and obligations under securities lending.
System assets exceeded its liabilities at the close of fiscal year 2014 by $12 billion. Total net assets held in trust for pension and Other Post-Employment Benefits (OPEB) increased $1.4 billion from the previous year, primarily due to net investment gains.**
Assets & Liabilities (in thousands)(combined pension and healthcare)
Assets FY 2014* FY 2013**Cash $ 134,291 $ 187,774
Receivables 154,064 144,930
Securities Lending Collateral 791,755 669,859
Investments 11,801,653 10,469,023
Total Assets $ 12,881,763 $ 11,471,585
Liabilities FY 2014* FY 2013**
Accounts Payable and Other Liabilities $ 29,574 $ 33,264
Obligations Under Securities Lending 819,365 852,350
Total Liabilities 848,939 $ 885,614
Net Assets $ 12,032,825 $ 10,585,971
*Source: CAFR for the Fiscal Year ended September 30, 2014, p. 20.
**Source: CAFR for the Fiscal Year ended September 30, 2013, p. 20.
* Liabilities in this context are exclusive of Unfunded Accrued Actuarial Liabilities (UAAL) for pension and health.** Source: CAFR for the Fiscal Year ended September 30, 2014, p. 17.
Michigan State Employees’ Retirement System6
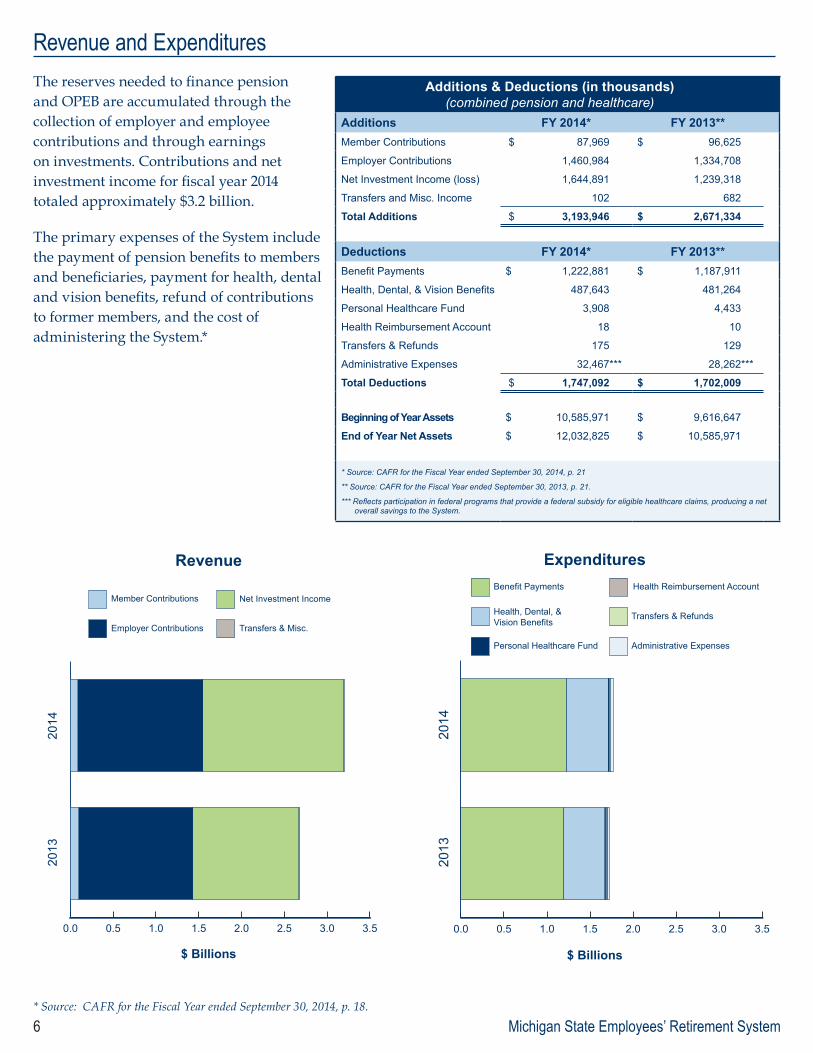
Revenue and Expenditures The reserves needed to finance pension and OPEB are accumulated through the collection of employer and employee contributions and through earnings on investments. Contributions and net investment income for fiscal year 2014 totaled approximately $3.2 billion.
The primary expenses of the System include the payment of pension benefits to members and beneficiaries, payment for health, dental and vision benefits, refund of contributions to former members, and the cost of administering the System.*
Additions & Deductions (in thousands)(combined pension and healthcare)
Additions FY 2014* FY 2013**Member Contributions $ 87,969 $ 96,625
Employer Contributions 1,460,984 1,334,708
Net Investment Income (loss) 1,644,891 1,239,318
Transfers and Misc. Income 102 682
Total Additions $ 3,193,946 $ 2,671,334
Deductions FY 2014* FY 2013**Benefit Payments $ 1,222,881 $ 1,187,911
Health, Dental, & Vision Benefits 487,643 481,264
Personal Healthcare Fund 3,908 4,433
Health Reimbursement Account 18 10
Transfers & Refunds 175 129
Administrative Expenses 32,467*** 28,262***
Total Deductions $ 1,747,092 $ 1,702,009
Beginning of Year Assets $ 10,585,971 $ 9,616,647
End of Year Net Assets $ 12,032,825 $ 10,585,971
* Source: CAFR for the Fiscal Year ended September 30, 2014, p. 21
** Source: CAFR for the Fiscal Year ended September 30, 2013, p. 21.
*** Reflects participation in federal programs that provide a federal subsidy for eligible healthcare claims, producing a net overall savings to the System.
Member Contributions
Employer Contributions
Net Investment Income
$ Billions
2013
2014
0.0 0.5 1.0 1.5 2.0 2.5 3.0 3.5
Revenue
Transfers & Misc.
$ Billions
2013
2014
Benefit Payments
Health, Dental, &Vision Benefits
Health Reimbursement Account
Transfers & Refunds
0.0 0.5 1.0 1.5 2.0 2.5 3.0 3.5
Expenditures
Personal Healthcare Fund Administrative Expenses
* Source: CAFR for the Fiscal Year ended September 30, 2014, p. 18.
7 Michigan State Employees’ Retirement System
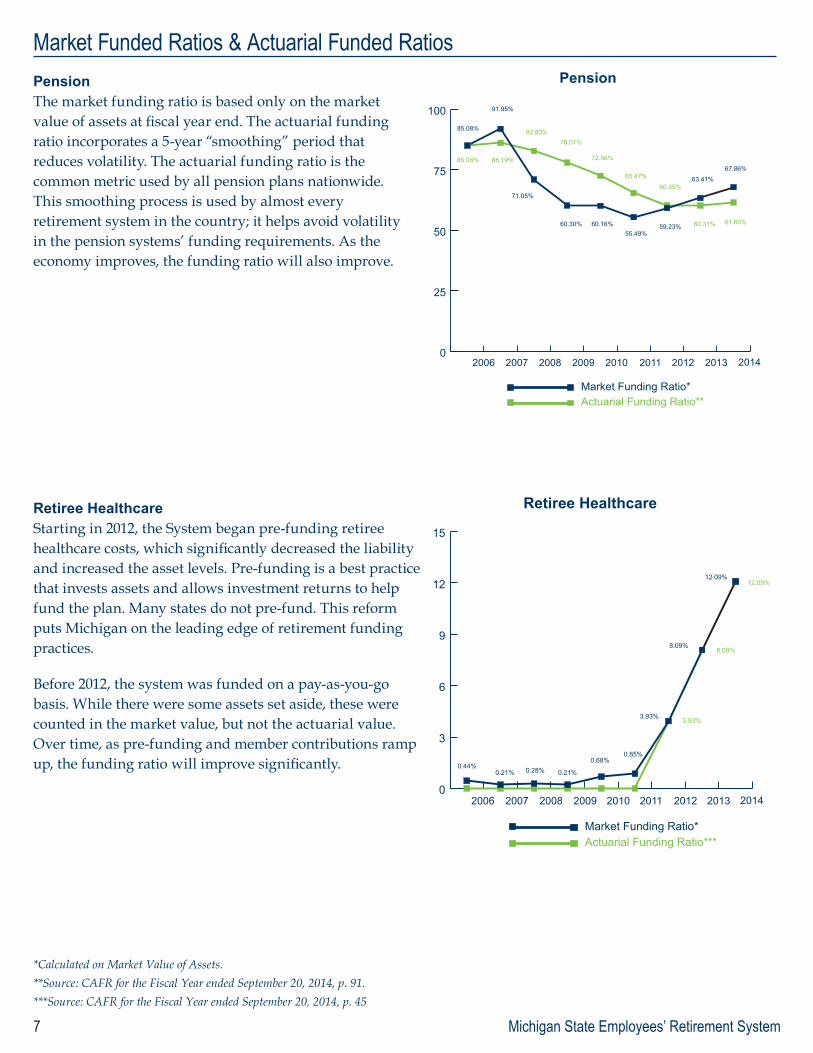
Market Funded Ratios & Actuarial Funded Ratios PensionThe market funding ratio is based only on the market value of assets at fiscal year end. The actuarial funding ratio incorporates a 5-year “smoothing” period that reduces volatility. The actuarial funding ratio is the common metric used by all pension plans nationwide. This smoothing process is used by almost every retirement system in the country; it helps avoid volatility in the pension systems’ funding requirements. As the economy improves, the funding ratio will also improve.
Retiree HealthcareStarting in 2012, the System began pre-funding retiree healthcare costs, which significantly decreased the liability and increased the asset levels. Pre-funding is a best practice that invests assets and allows investment returns to help fund the plan. Many states do not pre-fund. This reform puts Michigan on the leading edge of retirement funding practices.
Before 2012, the system was funded on a pay-as-you-go basis. While there were some assets set aside, these were counted in the market value, but not the actuarial value. Over time, as pre-funding and member contributions ramp up, the funding ratio will improve significantly.
*Calculated on Market Value of Assets.**Source: CAFR for the Fiscal Year ended September 20, 2014, p. 91.***Source: CAFR for the Fiscal Year ended September 20, 2014, p. 45
2006 2007 2008 2009 2010 2011 2012 2013
85.08% 86.19%
82.83%78.01%
65.47%
60.35%
60.31%
91.95%
71.05%
60.30% 60.16%55.49%
59.23%
63.41%
Market Funding Ratio*Actuarial Funding Ratio**
0
25
50
75
100
Pension
85.08%
72.56%
61.60%
67.86%
2014
2006 2007 2008 2009 2010 2011 2012 2013
3.93%
8.09%
0.44%0.21% 0.28% 0.21%
0.68%0.85%
3.93%
8.09%
Market Funding Ratio*Actuarial Funding Ratio***
0
3
6
9
12
15
Retiree Healthcare
2014
12.09%12.09%
Michigan State Employees’ Retirement System8
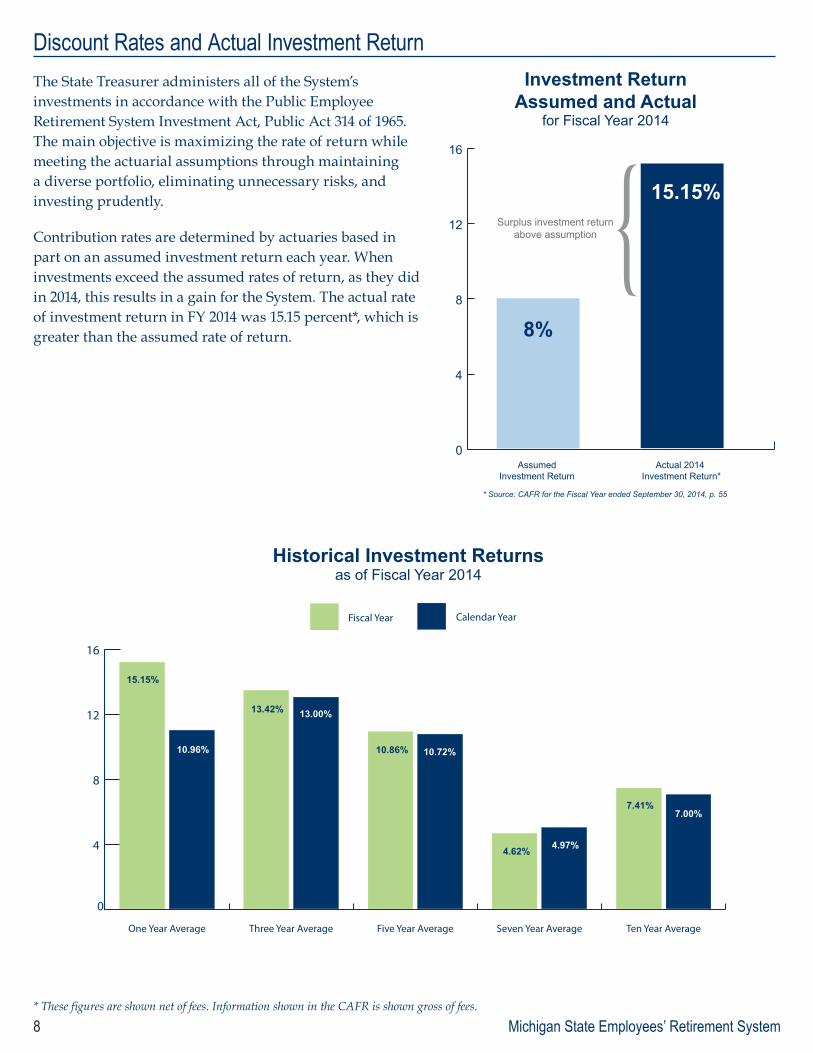
Discount Rates and Actual Investment Return The State Treasurer administers all of the System’s investments in accordance with the Public Employee Retirement System Investment Act, Public Act 314 of 1965. The main objective is maximizing the rate of return while meeting the actuarial assumptions through maintaining a diverse portfolio, eliminating unnecessary risks, and investing prudently.
Contribution rates are determined by actuaries based in part on an assumed investment return each year. When investments exceed the assumed rates of return, as they did in 2014, this results in a gain for the System. The actual rate of investment return in FY 2014 was 15.15 percent*, which is greater than the assumed rate of return.
* These figures are shown net of fees. Information shown in the CAFR is shown gross of fees.
0
4
8
12
16
8%
15.15%Surplus investment return
above assumption
Assumed Investment Return
Actual 2014 Investment Return*
Investment ReturnAssumed and Actual
for Fiscal Year 2014
Historical Investment Returns as of Fiscal Year 2014
0
4
8
12
16
Calendar YearFiscal Year
Ten Year AverageSeven Year AverageFive Year AverageThree Year AverageOne Year Average
15.15%
13.42%
10.86%
4.62%
7.41%
13.00%15.92%
10.72%
4.97%
7.00%
10.96%
* Source: CAFR for the Fiscal Year ended September 30, 2014, p. 55
9 Michigan State Employees’ Retirement System
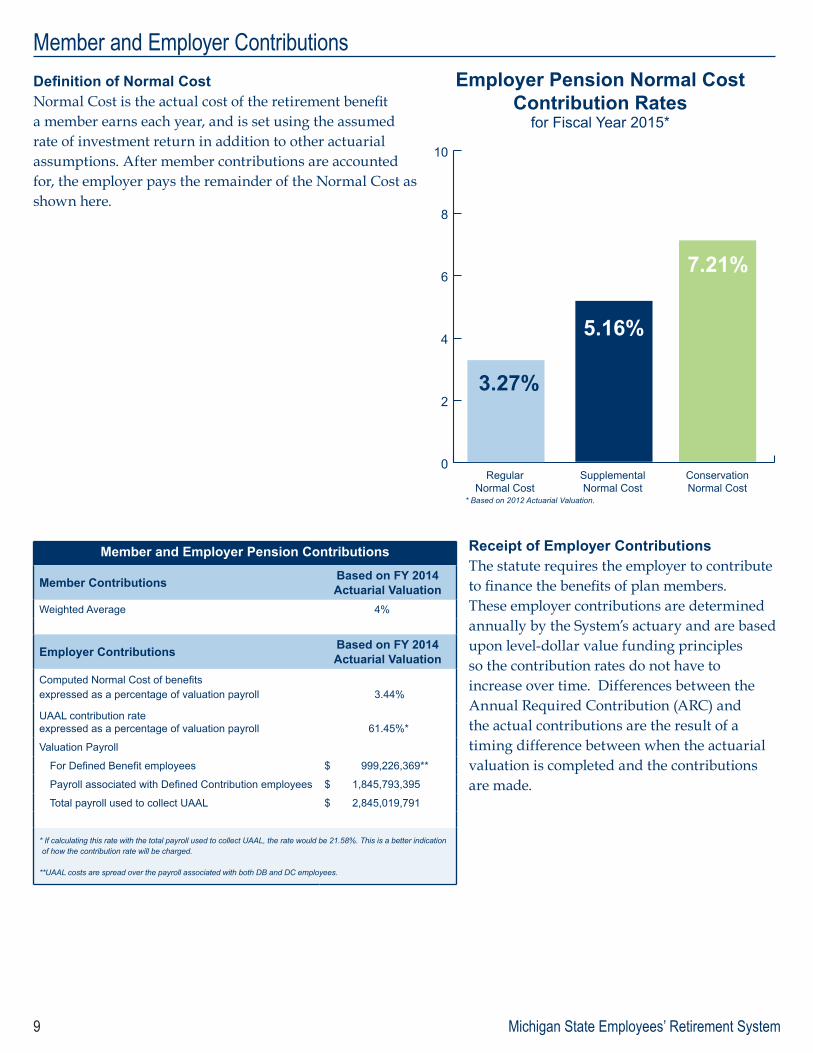
Member and Employer Contributions Definition of Normal CostNormal Cost is the actual cost of the retirement benefit a member earns each year, and is set using the assumed rate of investment return in addition to other actuarial assumptions. After member contributions are accounted for, the employer pays the remainder of the Normal Cost as shown here.
Receipt of Employer ContributionsThe statute requires the employer to contribute to finance the benefits of plan members. These employer contributions are determined annually by the System’s actuary and are based upon level-dollar value funding principles so the contribution rates do not have to increase over time. Differences between the Annual Required Contribution (ARC) and the actual contributions are the result of a timing difference between when the actuarial valuation is completed and the contributions are made.
Member and Employer Pension Contributions
Member Contributions Based on FY 2014 Actuarial Valuation
Weighted Average 4%
Employer Contributions Based on FY 2014 Actuarial Valuation
Computed Normal Cost of benefits expressed as a percentage of valuation payroll 3.44%
UAAL contribution rate expressed as a percentage of valuation payroll 61.45%*
Valuation Payroll
For Defined Benefit employees $ 999,226,369**
Payroll associated with Defined Contribution employees $ 1,845,793,395
Total payroll used to collect UAAL $ 2,845,019,791
* If calculating this rate with the total payroll used to collect UAAL, the rate would be 21.58%. This is a better indication of how the contribution rate will be charged.
**UAAL costs are spread over the payroll associated with both DB and DC employees.
0
2
4
6
8
10
3.27%
5.16%
RegularNormal Cost
ConservationNormal Cost
Employer Pension Normal Cost Contribution Rates
for Fiscal Year 2015*
7.21%
SupplementalNormal Cost
* Based on 2012 Actuarial Valuation.
Michigan State Employees’ Retirement System10
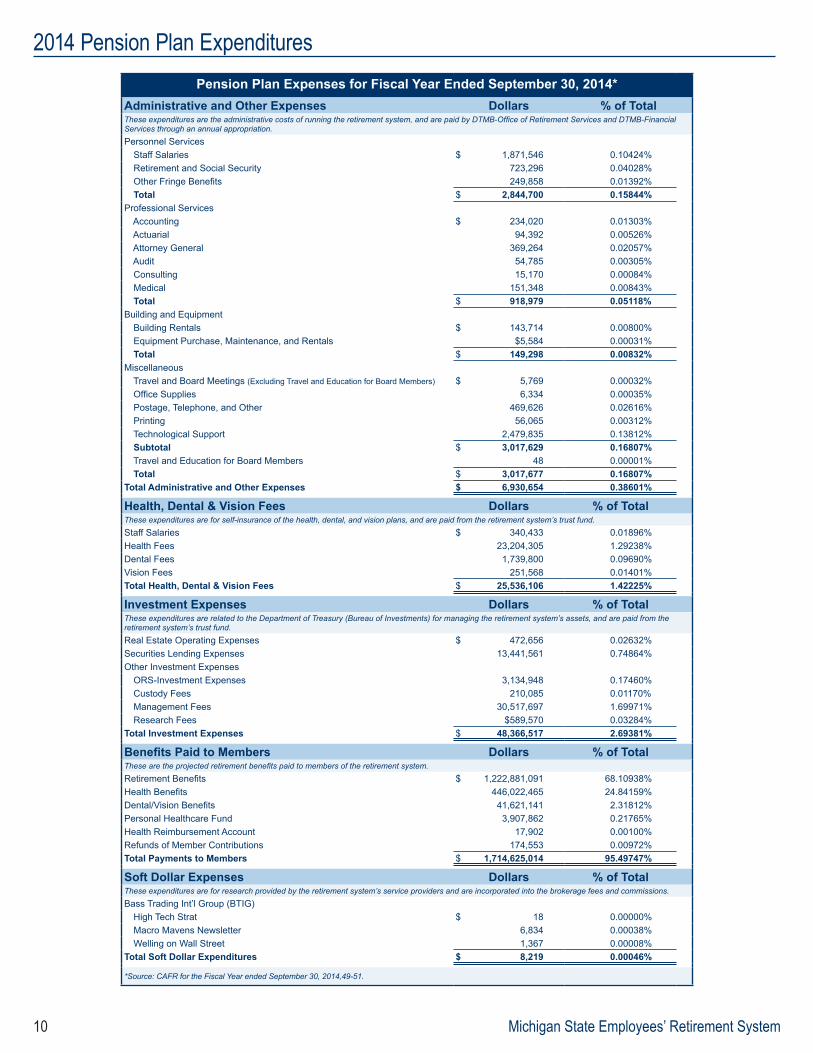
2014 Pension Plan Expenditures Pension Plan Expenses for Fiscal Year Ended September 30, 2014*
Administrative and Other Expenses Dollars % of TotalThese expenditures are the administrative costs of running the retirement system, and are paid by DTMB-Office of Retirement Services and DTMB-Financial Services through an annual appropriation.Personnel Services Staff Salaries $ 1,871,546 0.10424% Retirement and Social Security 723,296 0.04028% Other Fringe Benefits 249,858 0.01392% Total $ 2,844,700 0.15844%Professional Services Accounting $ 234,020 0.01303% Actuarial 94,392 0.00526% Attorney General 369,264 0.02057% Audit 54,785 0.00305% Consulting 15,170 0.00084% Medical 151,348 0.00843% Total $ 918,979 0.05118%Building and Equipment Building Rentals $ 143,714 0.00800% Equipment Purchase, Maintenance, and Rentals $5,584 0.00031% Total $ 149,298 0.00832%Miscellaneous Travel and Board Meetings (Excluding Travel and Education for Board Members) $ 5,769 0.00032% Office Supplies 6,334 0.00035% Postage, Telephone, and Other 469,626 0.02616% Printing 56,065 0.00312% Technological Support 2,479,835 0.13812% Subtotal $ 3,017,629 0.16807% Travel and Education for Board Members 48 0.00001% Total $ 3,017,677 0.16807%Total Administrative and Other Expenses $ 6,930,654 0.38601%
Health, Dental & Vision Fees Dollars % of TotalThese expenditures are for self-insurance of the health, dental, and vision plans, and are paid from the retirement system’s trust fund.Staff Salaries $ 340,433 0.01896%Health Fees 23,204,305 1.29238%Dental Fees 1,739,800 0.09690%Vision Fees 251,568 0.01401%Total Health, Dental & Vision Fees $ 25,536,106 1.42225%
Investment Expenses Dollars % of TotalThese expenditures are related to the Department of Treasury (Bureau of Investments) for managing the retirement system’s assets, and are paid from the retirement system’s trust fund.Real Estate Operating Expenses $ 472,656 0.02632%Securities Lending Expenses 13,441,561 0.74864%Other Investment Expenses ORS-Investment Expenses 3,134,948 0.17460% Custody Fees 210,085 0.01170% Management Fees 30,517,697 1.69971% Research Fees $589,570 0.03284%Total Investment Expenses $ 48,366,517 2.69381%
Benefits Paid to Members Dollars % of TotalThese are the projected retirement benefits paid to members of the retirement system.Retirement Benefits $ 1,222,881,091 68.10938%Health Benefits 446,022,465 24.84159%Dental/Vision Benefits 41,621,141 2.31812%Personal Healthcare Fund 3,907,862 0.21765%Health Reimbursement Account 17,902 0.00100%Refunds of Member Contributions 174,553 0.00972%Total Payments to Members $ 1,714,625,014 95.49747%
Soft Dollar Expenses Dollars % of TotalThese expenditures are for research provided by the retirement system’s service providers and are incorporated into the brokerage fees and commissions.Bass Trading Int’l Group (BTIG) High Tech Strat $ 18 0.00000% Macro Mavens Newsletter 6,834 0.00038% Welling on Wall Street 1,367 0.00008%Total Soft Dollar Expenditures $ 8,219 0.00046%
*Source: CAFR for the Fiscal Year ended September 30, 2014,49-51.
11 Michigan State Employees’ Retirement System
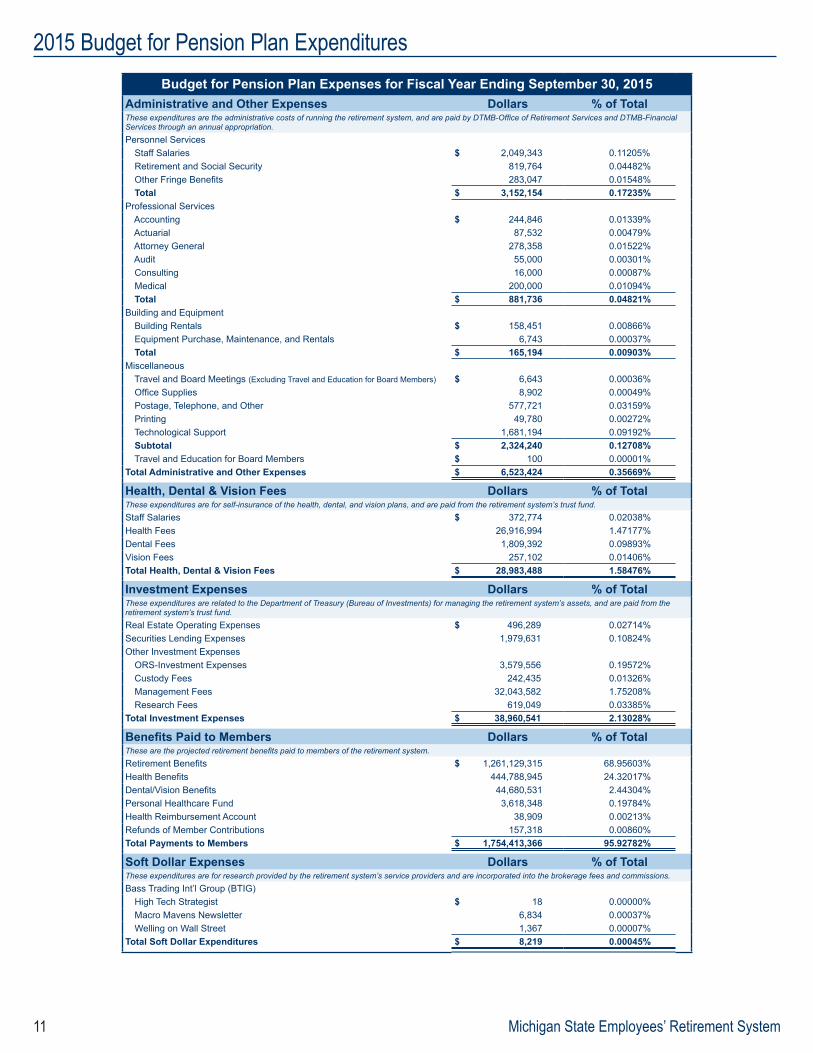
2015 Budget for Pension Plan Expenditures Budget for Pension Plan Expenses for Fiscal Year Ending September 30, 2015
Administrative and Other Expenses Dollars % of TotalThese expenditures are the administrative costs of running the retirement system, and are paid by DTMB-Office of Retirement Services and DTMB-Financial Services through an annual appropriation.Personnel Services Staff Salaries $ 2,049,343 0.11205% Retirement and Social Security 819,764 0.04482% Other Fringe Benefits 283,047 0.01548% Total $ 3,152,154 0.17235%Professional Services Accounting $ 244,846 0.01339% Actuarial 87,532 0.00479% Attorney General 278,358 0.01522% Audit 55,000 0.00301% Consulting 16,000 0.00087% Medical 200,000 0.01094% Total $ 881,736 0.04821%Building and Equipment Building Rentals $ 158,451 0.00866% Equipment Purchase, Maintenance, and Rentals 6,743 0.00037% Total $ 165,194 0.00903%Miscellaneous Travel and Board Meetings (Excluding Travel and Education for Board Members) $ 6,643 0.00036% Office Supplies 8,902 0.00049% Postage, Telephone, and Other 577,721 0.03159% Printing 49,780 0.00272% Technological Support 1,681,194 0.09192% Subtotal $ 2,324,240 0.12708% Travel and Education for Board Members $ 100 0.00001%Total Administrative and Other Expenses $ 6,523,424 0.35669%
Health, Dental & Vision Fees Dollars % of TotalThese expenditures are for self-insurance of the health, dental, and vision plans, and are paid from the retirement system’s trust fund.Staff Salaries $ 372,774 0.02038%Health Fees 26,916,994 1.47177%Dental Fees 1,809,392 0.09893%Vision Fees 257,102 0.01406%Total Health, Dental & Vision Fees $ 28,983,488 1.58476%
Investment Expenses Dollars % of TotalThese expenditures are related to the Department of Treasury (Bureau of Investments) for managing the retirement system’s assets, and are paid from the retirement system’s trust fund.Real Estate Operating Expenses $ 496,289 0.02714%Securities Lending Expenses 1,979,631 0.10824%Other Investment Expenses ORS-Investment Expenses 3,579,556 0.19572% Custody Fees 242,435 0.01326% Management Fees 32,043,582 1.75208% Research Fees 619,049 0.03385%Total Investment Expenses $ 38,960,541 2.13028%
Benefits Paid to Members Dollars % of TotalThese are the projected retirement benefits paid to members of the retirement system.Retirement Benefits $ 1,261,129,315 68.95603%Health Benefits 444,788,945 24.32017%Dental/Vision Benefits 44,680,531 2.44304%Personal Healthcare Fund 3,618,348 0.19784%Health Reimbursement Account 38,909 0.00213%Refunds of Member Contributions 157,318 0.00860%Total Payments to Members $ 1,754,413,366 95.92782%
Soft Dollar Expenses Dollars % of TotalThese expenditures are for research provided by the retirement system’s service providers and are incorporated into the brokerage fees and commissions.Bass Trading Int’l Group (BTIG) High Tech Strategist $ 18 0.00000% Macro Mavens Newsletter 6,834 0.00037% Welling on Wall Street 1,367 0.00007%Total Soft Dollar Expenditures $ 8,219 0.00045%
Michigan State Employees’ Retirement System12
Actuarial Assumptions
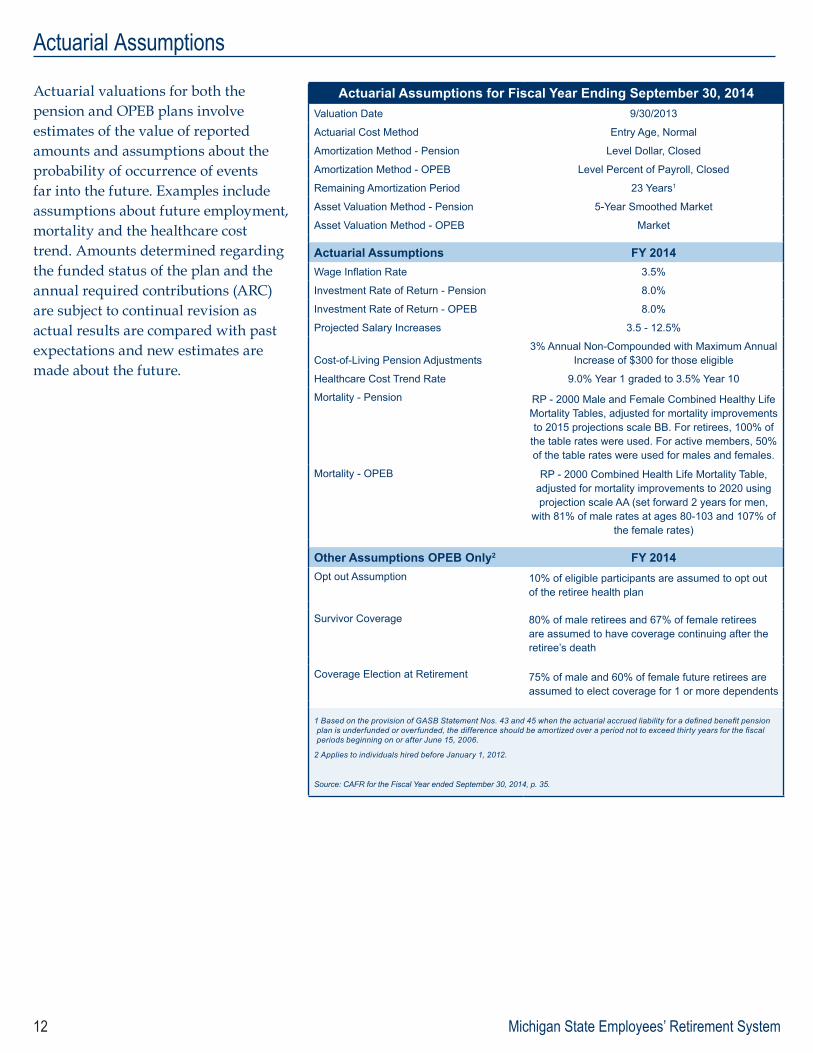
Actuarial valuations for both the pension and OPEB plans involve estimates of the value of reported amounts and assumptions about the probability of occurrence of events far into the future. Examples include assumptions about future employment, mortality and the healthcare cost trend. Amounts determined regarding the funded status of the plan and the annual required contributions (ARC) are subject to continual revision as actual results are compared with past expectations and new estimates are made about the future.
Actuarial Assumptions for Fiscal Year Ending September 30, 2014Valuation Date 9/30/2013
Actuarial Cost Method Entry Age, Normal
Amortization Method - Pension Level Dollar, Closed
Amortization Method - OPEB Level Percent of Payroll, Closed
Remaining Amortization Period 23 Years1
Asset Valuation Method - Pension 5-Year Smoothed Market
Asset Valuation Method - OPEB Market
Actuarial Assumptions FY 2014Wage Inflation Rate 3.5%
Investment Rate of Return - Pension 8.0%
Investment Rate of Return - OPEB 8.0%
Projected Salary Increases 3.5 - 12.5%
Cost-of-Living Pension Adjustments3% Annual Non-Compounded with Maximum Annual
Increase of $300 for those eligible
Healthcare Cost Trend Rate 9.0% Year 1 graded to 3.5% Year 10
Mortality - Pension RP - 2000 Male and Female Combined Healthy Life Mortality Tables, adjusted for mortality improvements to 2015 projections scale BB. For retirees, 100% of
the table rates were used. For active members, 50% of the table rates were used for males and females.
Mortality - OPEB RP - 2000 Combined Health Life Mortality Table, adjusted for mortality improvements to 2020 using projection scale AA (set forward 2 years for men,
with 81% of male rates at ages 80-103 and 107% of the female rates)
Other Assumptions OPEB Only2 FY 2014Opt out Assumption 10% of eligible participants are assumed to opt out
of the retiree health plan
Survivor Coverage 80% of male retirees and 67% of female retirees are assumed to have coverage continuing after the retiree’s death
Coverage Election at Retirement 75% of male and 60% of female future retirees are assumed to elect coverage for 1 or more dependents
1 Based on the provision of GASB Statement Nos. 43 and 45 when the actuarial accrued liability for a defined benefit pension plan is underfunded or overfunded, the difference should be amortized over a period not to exceed thirty years for the fiscal periods beginning on or after June 15, 2006.
2 Applies to individuals hired before January 1, 2012.
Source: CAFR for the Fiscal Year ended September 30, 2014, p. 35.
13 Michigan State Employees’ Retirement System
Office Closures
May 25 – Memorial Day July 3 – Independence Day September 7 – Labor Day
Our website is available seven days a week, even when our office is closed: www.michigan.gov/orsstatedb
Office of Retirement Services (ORS)P.O. Box 30171
Lansing, MI 48909-7671www.michigan.gov/ors
www.michigan.gov/orsmiaccount
Office of Retirement ServicesDirector Phil Stoddard
Printed by authority of 1965 P.A. 314, as amended.