Embed Size (px)
Citation preview
DRAFT
SUMMARY, CONTEXT MATERIALS AND RECOMMENDATIONS AFFORDABLE HOUSING NEXUS STUDIES
Prepared for: San Luis Obispo County
Prepared by: Keyser Marston Associates, Inc.
September 2017
Attachment 5
Page 1 of 34
TABLE OF CONTENTS Page
I. INTRODUCTION .................................................................................................................. 1
A. Existing San Luis Obispo County Program Requirements .............................................. 1
B. Affordable Unit Construction Supported by the Program ................................................ 2
C. Legal Context for Inclusionary Programs ........................................................................ 3
D. Organization of this Report ............................................................................................. 3
II. SUMMARY OF FINDINGS AND RECOMMENDATIONS .................................................... 5
A. Residential Findings and Recommendations .................................................................. 5
B. Non-Residential Findings and Recommendations .........................................................11
III. SUMMARY OF NEXUS ANALYSES ..................................................................................14
A. Residential Nexus Analysis Summary ...........................................................................14
B. Non-Residential Nexus Analysis Summary ....................................................................18
IV. CONTEXT MATERIALS .....................................................................................................21
A. On-Site Compliance Cost Financial Analysis .................................................................21
B. Affordable Unit Production Supported by the Program ..................................................24
C. Projected Housing Needs in San Luis Obispo County ...................................................25
D. Jobs Housing Linkage Fees in Other Jurisdictions ........................................................26
Attachment 5
Page 2 of 34
LIST OF TABLES Table 1 – Existing San Luis Obispo County Affordable Housing Requirements.......................... 2 Table 2 – Affordable Housing Production Supported .................................................................. 3 Table 3 – Maximum Supported Residential Impact Fees, San Luis Obispo County ................... 5 Table 4 – Affordable Housing Requirements in Other Counties - Ownership Units .................... 6 Table 5 – Comparison of Planning, Building and Impact Fees* .................................................. 7 Table 6 – Recommended In-Lieu Fee Schedule .......................................................................10 Table 7 – Illustration of Recommended Fees for Example Home Sizes ....................................10 Table 8 – Maximum Supported Non-Residential Fees ..............................................................11 Table 9 – Overview of Non-Residential Fees in Selected Jurisdictions .....................................12 Table 10 – KMA Recommended Fee Range, Non-Residential, County of San Luis Obispo ......13 Table 11 – Prototypical Residential Units for San Luis Obispo County ......................................15 Table 12 – Household Income, Expenditures, Job Generation, and Net New Worker Households .................................................................................................................................................16 Table 13 – Adjustment from No. of Workers to No. of Households ............................................16 Table 14 – New Worker Households per 100 Market Rate Units . Error! Bookmark not defined. Table 15 – Maximum Supported Residential Impact Fees, San Luis Obispo County ................18 Table 16 – Maximum Supported Non-Residential Fees ............................................................19 Table 17 – Cost of Onsite Compliance and Equivalent In-Lieu Fees .........................................23 Table 18 – Affordable Projects Supported with Fees .................................................................24 Table 19 – Projected Housing Need by Income Level ...............................................................25 Table 20 – Summary of Jobs Housing Linkage Fee Programs, California .................................27 ATTACHMENT A – RESIDENTIAL NEXUS ANALYSIS REPORT ATTACHMENT B – NON-RESIDENTIAL NEXUS ANALYSIS REPORT
Attachment 5
Page 3 of 34
Keyser Marston Associates, Inc. Page 1 \\SF-FS2\wp\19\19099\001\001-003.docx DRAFT
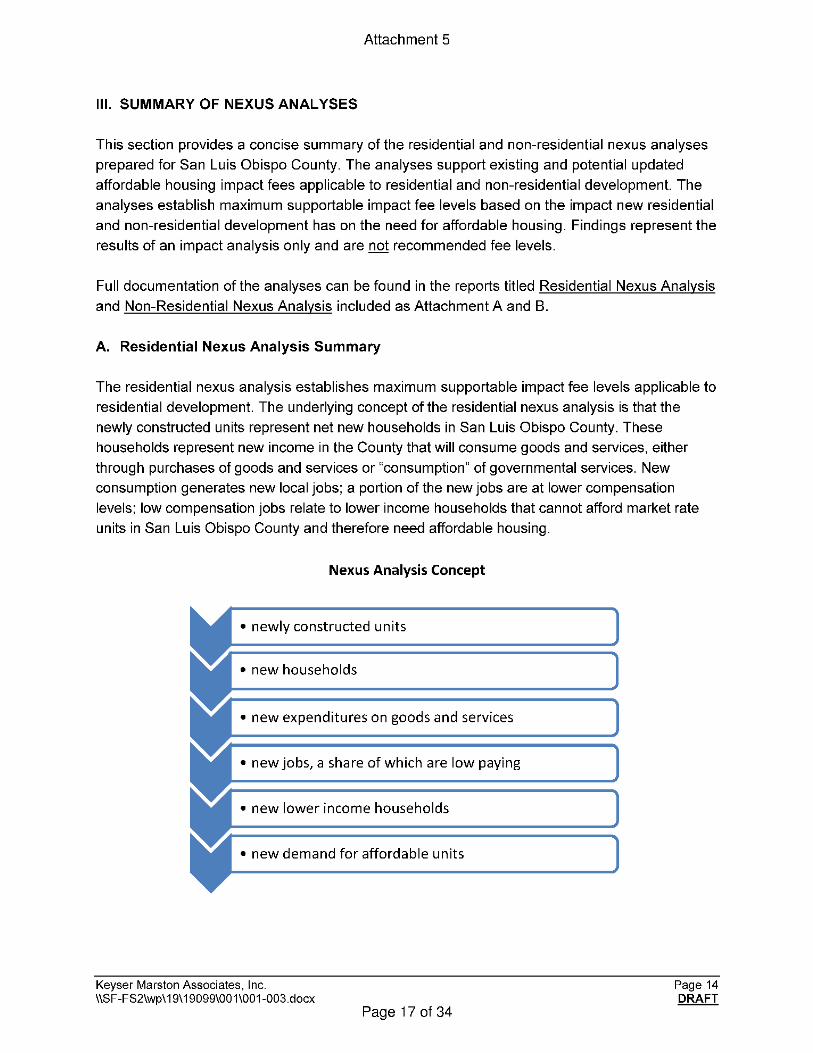
I. INTRODUCTION This Summary, Context Materials, and Recommendations report (“Summary Report”) provides a concise version of the affordable housing nexus studies prepared by Keyser Marston Associates, Inc. (KMA) and presents analyses designed to provide context for policy decisions regarding potential updates to affordable housing fees for residential and non-residential development in San Luis Obispo County. Section 29.04.040 of the San Luis Obispo County Code requires fees to be updated every five years. This report summarizes the nexus analysis and supporting materials prepared in compliance with this requirement and includes recommendations regarding updates to the County’s affordable housing fee schedule. Two separate nexus technical reports are attached to this Summary Report, Attachment A: Residential Nexus Analysis and Attachment B: Non-Residential Nexus Analysis. The two nexus reports provide the technical analyses and documentation to support existing and potential updated affordable housing fees in San Luis Obispo County. A. Existing San Luis Obispo County Program Requirements The County of San Luis Obispo adopted its Inclusionary Housing Ordinance (IHO) in 2008 requiring new residential development projects within the unincorporated area to include affordable units within the project or pay an in-lieu fee instead. Non-residential projects are required to pay a housing impact fee and also have an option to provide units onsite. Requirements were originally scheduled to be phased in over a five-year period following adoption; however, in consideration of the economic downturn following adoption of the ordinance in 2008, the County remained at the initial “Year One” level until 2017-18 when the County moved to the “Year Two” phase-in level. The “Year 2” requirement for residential projects is to set aside 6%1 of units as affordable or pay an in-lieu fee that equates to $1.50 per square foot. This represents 40% of the fully phased in requirement level of setting aside 15%2 of units as affordable or payment of an in-lieu fee of $3.75 per square foot. Nearly all projects have elected to pay the in-lieu fee rather than construct units onsite. Rental housing and for-sale units under 900 square feet are exempt. In the Coastal Zone, projects that have 11 or more units must include 15% of units as affordable. The 15% requirement is fully applicable today and there is no fee option. In 2016, the County adopted a new incentive program designed to encourage market rate projects that serve households qualifying in the Workforce income category, defined as up to 160% of Area Median Income (AMI). For qualifying projects, requirements under the IHO are reduced by 50%.
1 This is the effective onsite percentage requirement after consideration of the 25% reduction per County Code Section 22.12.080, G. for on-site construction of affordable units. 2 Ibid.
Attachment 5
Page 4 of 34

Keyser Marston Associates, Inc. Page 2 \\SF-FS2\wp\19\19099\001\001-003.docx DRAFT
Table 1 provides an overview of the requirements of the program.
Table 1 – Existing San Luis Obispo County Affordable Housing Requirements
Current Requirement (FY 17-18, “Year 2”)
Full Phase-In of Existing Ordinance ("Year 5")
Residential Requirements 6% affordable* OR 15% affordable* OR
Fee Option $1.50 / SF fee $3.75 / SF fee
Reduced Fees Under Workforce $0.75 / SF fee $1.88 / SF fee
Incentive Program
Coastal Zone projects 15% affordable 15% affordable
with 11+ units No fee option No fee option
Non-Residential Fees ($/Sq.Ft.)
Retail $1.36 $3.42
Office $.96 $2.38
Hotel / Motel $1.44 $3.59
Industrial / Warehouse $0.58 $1.43
Commercial Greenhouses $0.03 $0.08
Other Non-Residential $1.26 $3.14 *This is the effective onsite percentage requirement after consideration of the 25% reduction per County Code Section 22.12.080, G. for on-site construction of affordable units.
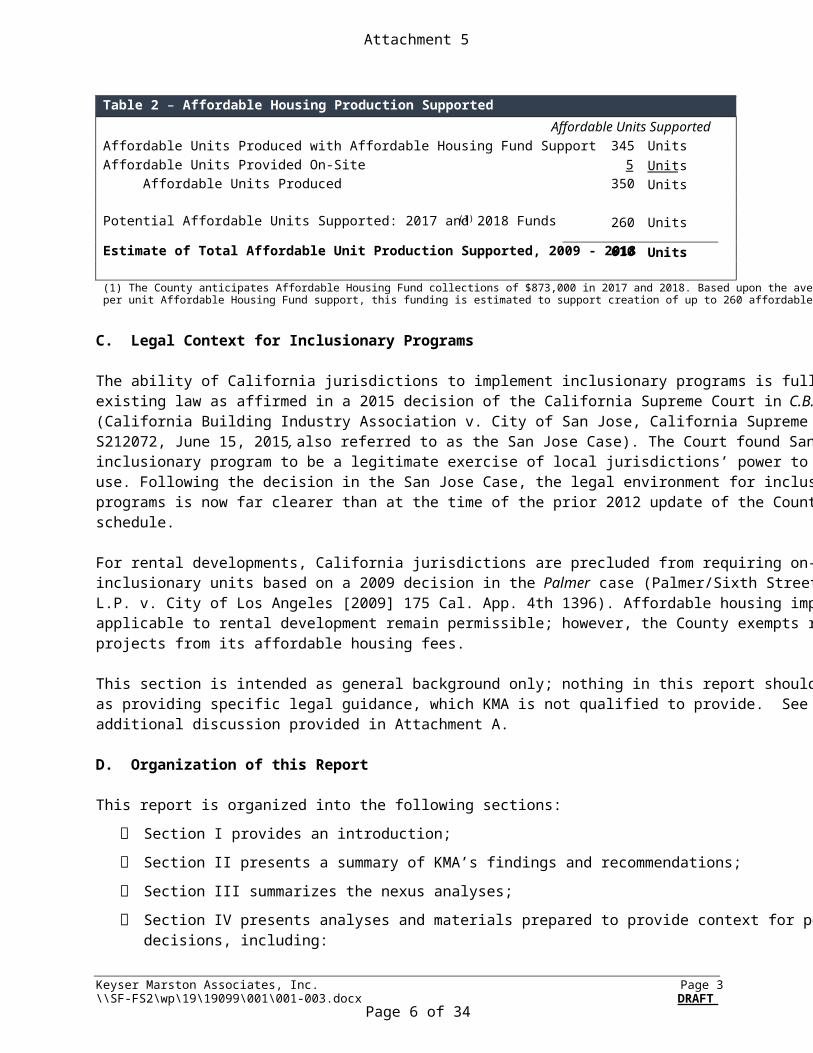
B. Affordable Unit Construction Supported by the Program The Inclusionary Housing Ordinance and Housing Impact Fee have supported creation of a total of 350 affordable units and are estimated to support creation of an additional 260 affordable units with Affordable Housing Fund collections in 2017 and estimated collections for 2018, for a total of 610 new affordable units supported since inception of the program in 2009. The program provides a key source of local gap financing which is then leveraged with non-local funding through the Federal and State government such as Low Income Housing Tax Credits to support construction of affordable housing. Section IV.B. provides information about the specific affordable projects that have been completed with support from the Program.
Attachment 5
Page 5 of 34
Keyser Marston Associates, Inc. Page 3 \\SF-FS2\wp\19\19099\001\001-003.docx DRAFT
Table 2 – Affordable Housing Production Supported Affordable Units Supported
Affordable Units Produced with Affordable Housing Fund Support 345 Units Affordable Units Provided On-Site 5 Units Affordable Units Produced 350 Units
Potential Affordable Units Supported: 2017 and 2018 Funds (1) 260 Units Estimate of Total Affordable Unit Production Supported, 2009 - 2018 610 Units
(1) The County anticipates Affordable Housing Fund collections of $873,000 in 2017 and 2018. Based upon the average of $3,300 per unit Affordable Housing Fund support, this funding is estimated to support creation of up to 260 affordable units.
C. Legal Context for Inclusionary Programs The ability of California jurisdictions to implement inclusionary programs is fully supported by existing law as affirmed in a 2015 decision of the California Supreme Court in C.B.I.A. (California Building Industry Association v. City of San Jose, California Supreme Court Case No. S212072, June 15, 2015, also referred to as the San Jose Case). The Court found San Jose’s inclusionary program to be a legitimate exercise of local jurisdictions’ power to regulate land use. Following the decision in the San Jose Case, the legal environment for inclusionary programs is now far clearer than at the time of the prior 2012 update of the County’s fee schedule. For rental developments, California jurisdictions are precluded from requiring on-site inclusionary units based on a 2009 decision in the Palmer case (Palmer/Sixth Street Properties L.P. v. City of Los Angeles [2009] 175 Cal. App. 4th 1396). Affordable housing impact fees applicable to rental development remain permissible; however, the County exempts rental projects from its affordable housing fees. This section is intended as general background only; nothing in this report should be interpreted as providing specific legal guidance, which KMA is not qualified to provide. See also the additional discussion provided in Attachment A. D. Organization of this Report This report is organized into the following sections:
Section I provides an introduction;
Section II presents a summary of KMA’s findings and recommendations;
Section III summarizes the nexus analyses;
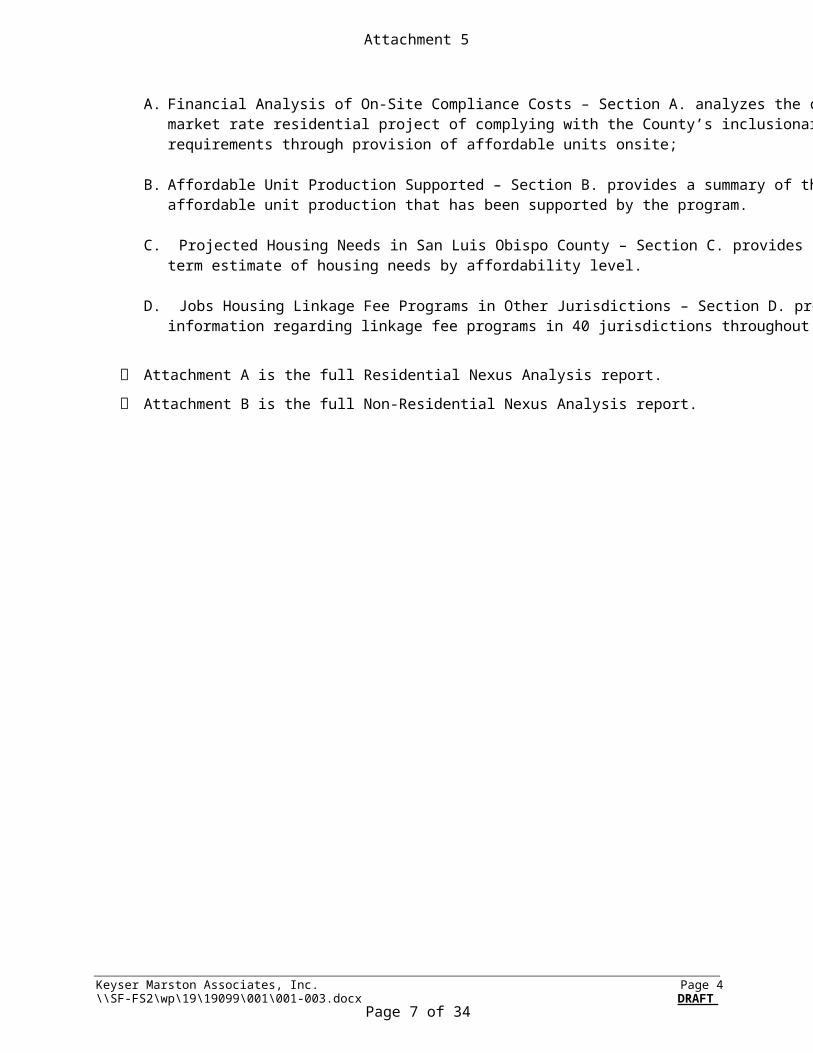
Section IV presents analyses and materials prepared to provide context for policy decisions, including:
Attachment 5
Page 6 of 34
Keyser Marston Associates, Inc. Page 4 \\SF-FS2\wp\19\19099\001\001-003.docx DRAFT
A. Financial Analysis of On-Site Compliance Costs – Section A. analyzes the cost to a market rate residential project of complying with the County’s inclusionary requirements through provision of affordable units onsite;
B. Affordable Unit Production Supported – Section B. provides a summary of the affordable unit production that has been supported by the program.
C. Projected Housing Needs in San Luis Obispo County – Section C. provides a long-term estimate of housing needs by affordability level.
D. Jobs Housing Linkage Fee Programs in Other Jurisdictions – Section D. provides information regarding linkage fee programs in 40 jurisdictions throughout California.
Attachment A is the full Residential Nexus Analysis report.
Attachment B is the full Non-Residential Nexus Analysis report.
Attachment 5
Page 7 of 34
Keyser Marston Associates, Inc. Page 5 \\SF-FS2\wp\19\19099\001\001-003.docx DRAFT
II. SUMMARY OF FINDINGS AND RECOMMENDATIONS In this section, KMA provides a summary of the analysis findings and provides recommendations for updates to the County’s residential and non-residential affordable housing requirements. Recommendations reflect consideration of the following factors:
1. The findings of the nexus analysis;
2. Requirements in neighboring counties;
3. A financial analysis of developer compliance costs under the program;
4. Setting a fee high enough to support a meaningful contribution to affordable housing in San Luis Obispo County;
5. Setting a fee low enough to not discourage development; and
6. Promoting market rate housing construction at levels affordable to households in the Workforce income category.
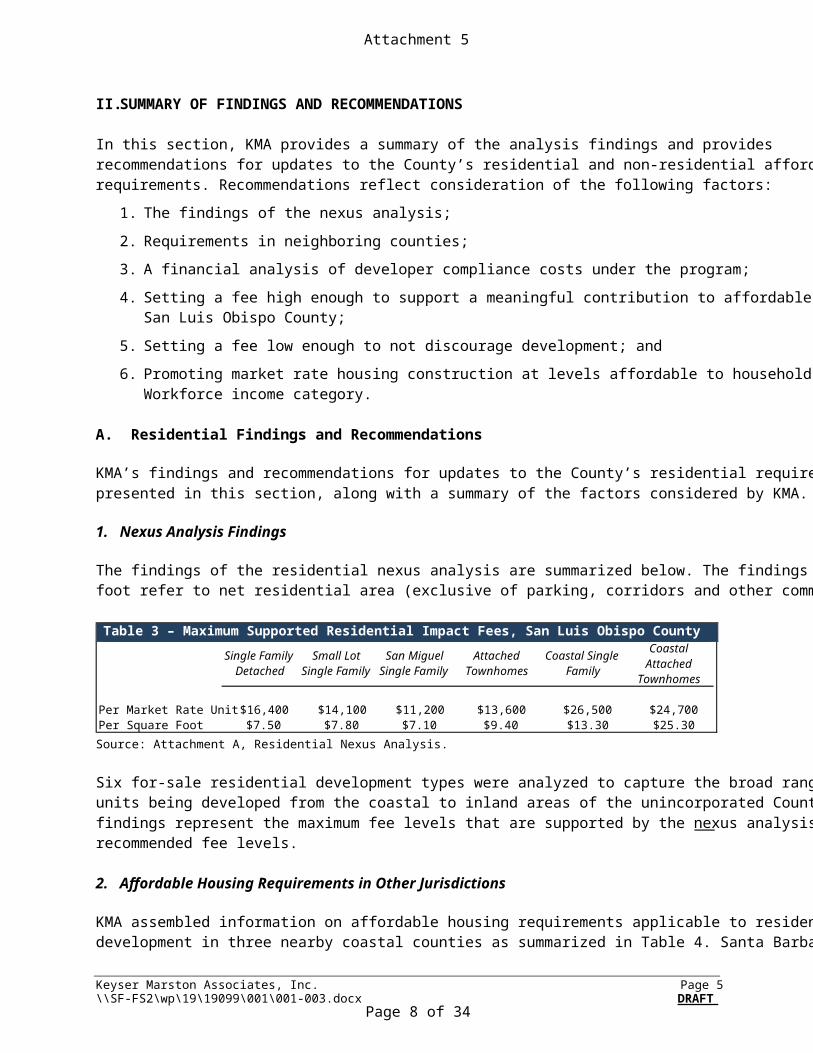
A. Residential Findings and Recommendations KMA’s findings and recommendations for updates to the County’s residential requirements are presented in this section, along with a summary of the factors considered by KMA. 1. Nexus Analysis Findings The findings of the residential nexus analysis are summarized below. The findings per square foot refer to net residential area (exclusive of parking, corridors and other common areas).
Table 3 – Maximum Supported Residential Impact Fees, San Luis Obispo County
Source: Attachment A, Residential Nexus Analysis. Six for-sale residential development types were analyzed to capture the broad range of for-sale units being developed from the coastal to inland areas of the unincorporated County. The above findings represent the maximum fee levels that are supported by the nexus analysis and are not recommended fee levels. 2. Affordable Housing Requirements in Other Jurisdictions KMA assembled information on affordable housing requirements applicable to residential development in three nearby coastal counties as summarized in Table 4. Santa Barbara and
Single Family Detached
Small Lot Single Family
San Miguel Single Family
Attached Townhomes
Coastal Single Family
Coastal Attached
Townhomes
Per Market Rate Unit $16,400 $14,100 $11,200 $13,600 $26,500 $24,700Per Square Foot $7.50 $7.80 $7.10 $9.40 $13.30 $25.30
Attachment 5
Page 8 of 34
Keyser Marston Associates, Inc. Page 6 \\SF-FS2\wp\19\19099\001\001-003.docx DRAFT
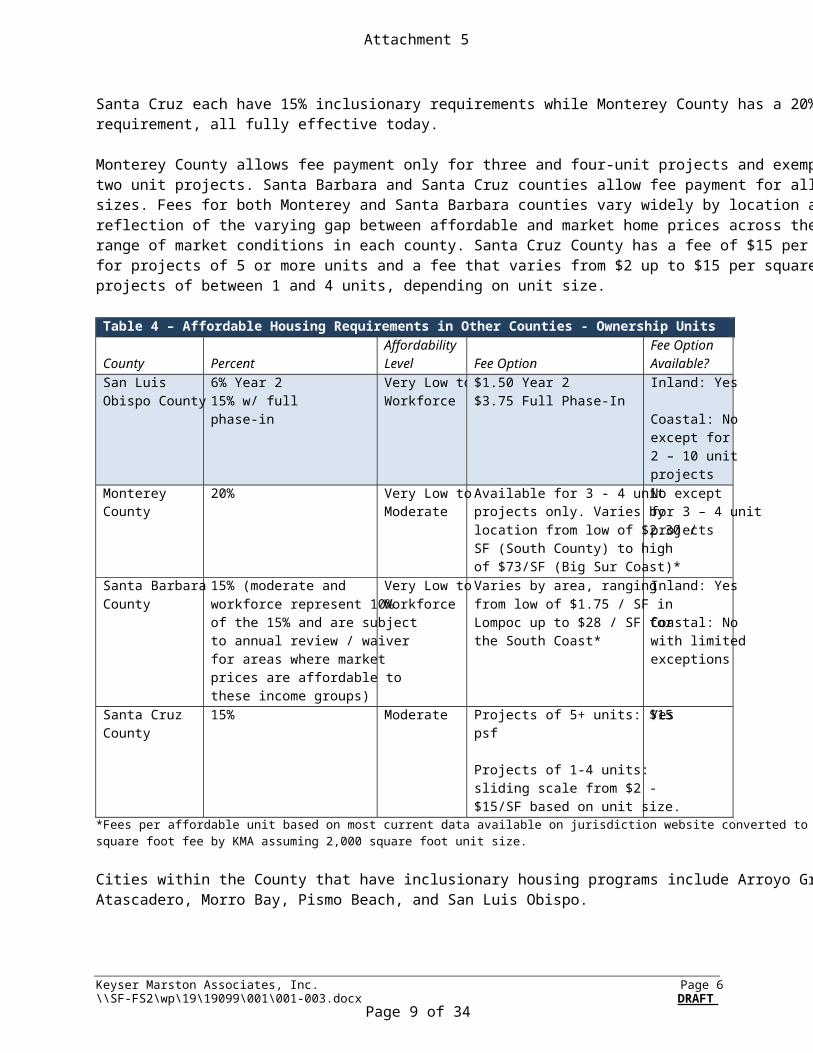
Santa Cruz each have 15% inclusionary requirements while Monterey County has a 20% requirement, all fully effective today. Monterey County allows fee payment only for three and four-unit projects and exempts one and two unit projects. Santa Barbara and Santa Cruz counties allow fee payment for all project sizes. Fees for both Monterey and Santa Barbara counties vary widely by location as a reflection of the varying gap between affordable and market home prices across the diverse range of market conditions in each county. Santa Cruz County has a fee of $15 per square foot for projects of 5 or more units and a fee that varies from $2 up to $15 per square foot for projects of between 1 and 4 units, depending on unit size. Table 4 – Affordable Housing Requirements in Other Counties - Ownership Units
County Percent Affordability Level Fee Option
Fee Option Available?
San Luis Obispo County
6% Year 2 15% w/ full phase-in
Very Low to Workforce
$1.50 Year 2 $3.75 Full Phase-In
Inland: Yes Coastal: No except for 2 – 10 unit projects
Monterey County
20% Very Low to Moderate
Available for 3 - 4 unit projects only. Varies by location from low of $2.30 / SF (South County) to high of $73/SF (Big Sur Coast)*
No except for 3 – 4 unit projects
Santa Barbara County
15% (moderate and workforce represent 10% of the 15% and are subject to annual review / waiver for areas where market prices are affordable to these income groups)
Very Low to Workforce
Varies by area, ranging from low of $1.75 / SF in Lompoc up to $28 / SF for the South Coast*
Inland: Yes Coastal: No with limited exceptions
Santa Cruz County
15% Moderate Projects of 5+ units: $15 psf Projects of 1-4 units: sliding scale from $2 - $15/SF based on unit size.
Yes
*Fees per affordable unit based on most current data available on jurisdiction website converted to equivalent per square foot fee by KMA assuming 2,000 square foot unit size. Cities within the County that have inclusionary housing programs include Arroyo Grande, Atascadero, Morro Bay, Pismo Beach, and San Luis Obispo.
Attachment 5
Page 9 of 34
Keyser Marston Associates, Inc. Page 7 \\SF-FS2\wp\19\19099\001\001-003.docx DRAFT
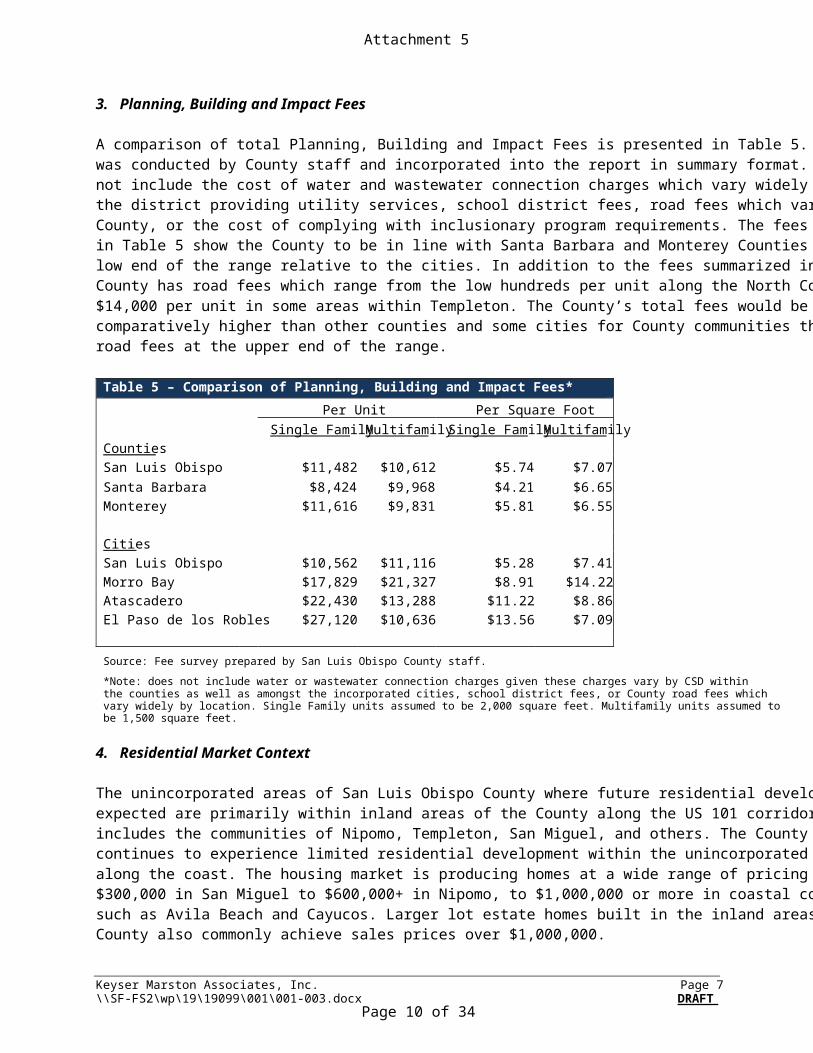
3. Planning, Building and Impact Fees A comparison of total Planning, Building and Impact Fees is presented in Table 5. The survey was conducted by County staff and incorporated into the report in summary format. Figures do not include the cost of water and wastewater connection charges which vary widely based on the district providing utility services, school district fees, road fees which vary by location in the County, or the cost of complying with inclusionary program requirements. The fees summarized in Table 5 show the County to be in line with Santa Barbara and Monterey Counties and at the low end of the range relative to the cities. In addition to the fees summarized in the chart, the County has road fees which range from the low hundreds per unit along the North Coast up to $14,000 per unit in some areas within Templeton. The County’s total fees would be comparatively higher than other counties and some cities for County communities that have road fees at the upper end of the range.
Table 5 – Comparison of Planning, Building and Impact Fees* Per Unit Per Square Foot Single Family Multifamily Single Family Multifamily Counties San Luis Obispo $11,482 $10,612 $5.74 $7.07 Santa Barbara $8,424 $9,968 $4.21 $6.65 Monterey $11,616 $9,831 $5.81 $6.55 Cities San Luis Obispo $10,562 $11,116 $5.28 $7.41 Morro Bay $17,829 $21,327 $8.91 $14.22 Atascadero $22,430 $13,288 $11.22 $8.86 El Paso de los Robles $27,120 $10,636 $13.56 $7.09
Source: Fee survey prepared by San Luis Obispo County staff.
*Note: does not include water or wastewater connection charges given these charges vary by CSD within the counties as well as amongst the incorporated cities, school district fees, or County road fees which vary widely by location. Single Family units assumed to be 2,000 square feet. Multifamily units assumed to be 1,500 square feet.
4. Residential Market Context The unincorporated areas of San Luis Obispo County where future residential development is expected are primarily within inland areas of the County along the US 101 corridor. This includes the communities of Nipomo, Templeton, San Miguel, and others. The County also continues to experience limited residential development within the unincorporated communities along the coast. The housing market is producing homes at a wide range of pricing from $300,000 in San Miguel to $600,000+ in Nipomo, to $1,000,000 or more in coastal communities such as Avila Beach and Cayucos. Larger lot estate homes built in the inland areas of the County also commonly achieve sales prices over $1,000,000.
Attachment 5
Page 10 of 34
Keyser Marston Associates, Inc. Page 8 \\SF-FS2\wp\19\19099\001\001-003.docx DRAFT
While less common in the unincorporated County, there is also development of attached townhome units. Prices for townhomes in inland areas of the County are estimated at $375,000 for a 1,450 square foot unit while, on the coast, a smaller attached unit of 975 square feet is estimated to command a price of $875,000. See Appendix A: Residential Market Survey, appended to the Residential Nexus Analysis, for more detail and supporting data. 5. Financial Analysis of On-Site Compliance Costs The financial analysis of the cost to developers of providing on-site units under the program compared with the in-lieu fee option found that:
Projects are strongly incentivized to pay the in-lieu fee rather than provide units on-site;
Coastal zone requirements incentivize projects to remain under 11 units to avoid the much stronger mandatory onsite affordability requirement; and
Within inland areas of the County, the market is producing units which serve the Workforce Income category, and in the lowest cost locations within the County, the Moderate-Income category.
6. Residential Fee Recommendations Following are KMA’s recommendations for updating the affordable housing fees in the unincorporated areas of San Luis Obispo County. These recommendations are based on the County’s residential market, the nexus analysis results, the financial analysis of compliance options, discussions with County staff, and review of programs in nearby counties. A key focus is on encouraging market rate housing construction that serves homebuyers at the Workforce income level while supporting the continued success of the program by maintaining or increasing fees for larger homes and coastal development which command higher prices and are generally less sensitive to fees.
1. Eliminate Fee for Modest-Sized Units – The housing market in the County is producing modestly-sized units affordable to homebuyers with incomes at the Workforce level (160% AMI), in some locations. KMA recommends eliminating fees for modest-sized units to incentivize construction of units that serve this segment of the market, which address one of the core objectives of the Inclusionary Housing Ordinance.
2. Implement Tiered Rate Structure – KMA recommends implementation of a tiered
rate structure to better tailor the program to the diverse housing market within the unincorporated County. A tiered rate structure will allow smaller moderately-priced units that are more sensitive to costs to be charged either no fee or a lower fee while
Attachment 5
Page 11 of 34
Keyser Marston Associates, Inc. Page 9 \\SF-FS2\wp\19\19099\001\001-003.docx DRAFT
larger units that serve a higher income / luxury market, and are more readily able to absorb the cost of a fee, are charged more. A tiered structure also helps to incentivize moderately sized units that are inherently more affordable.
3. Coastal Zone Rate – Consider implementation of a separate rate applicable to
projects of 2 to 10 units in size within the Coastal Zone. Newly built units within the Coastal Zone command sales prices well above those in inland areas especially on a per square foot basis. The greater market strength and higher pricing in the Coastal Zone means these projects can sustain a higher requirement. Increasing fees for Coastal Zone projects of 2 to 10 units in size will also reduce the incentive to remain just below the 11-unit threshold to avoid the requirement to provide onsite affordable units. Finally, the nexus analysis shows support for higher fees in the Coastal Zone based on the greater demand for services that purchasers of these higher priced coastal units create. Even with the higher recommended fee levels identified below, fees will remain significantly below the cost to the developer of providing units onsite.
4. Forgo Annual Phase-In – Establish a fee schedule that will govern until the next five-
year update, with automatic indexing, avoiding the need to reconsider a possible phase-in every year. This suggestion is in recognition of the fact that, in practice, the phase-in schedule is not being implemented as originally contemplated.
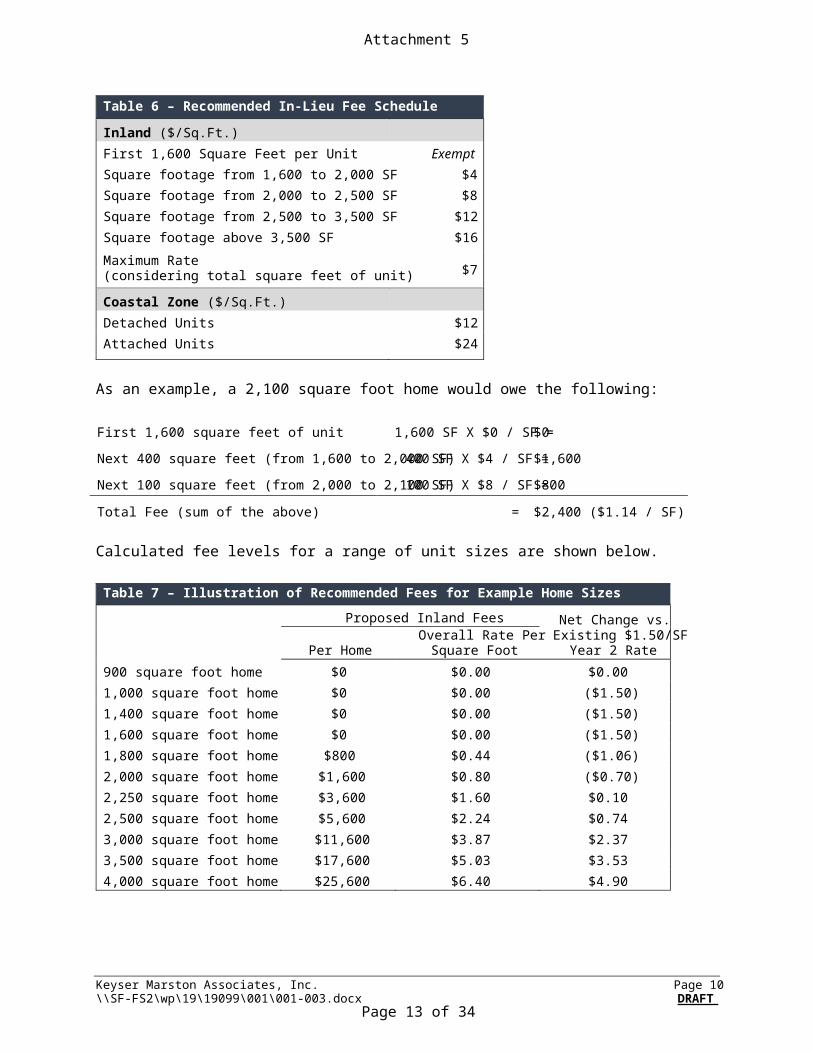
Table 6 on the following page presents a KMA recommended fee schedule implementing the four recommendations described above. Table 7 illustrates how this rate structure would affect units of various size. In summary, the fee schedule would:
Eliminate fees for units of 1,600 square feet and below;
Significantly reduce fees for units 1,600 to 2,200 square feet in size;
Keep fees close to the same for units 2,250 square feet in size; and
Increase fees for units above 2,250 square feet and in the Coastal Zone. While we believe these recommended fee levels and unit size thresholds to be reasonable, there is obviously potential for refinement based on the policy objectives of the County. With implementation of these recommendations, requirement levels will remain below those in the neighboring counties surveyed.
Attachment 5
Page 12 of 34
Keyser Marston Associates, Inc. Page 10 \\SF-FS2\wp\19\19099\001\001-003.docx DRAFT
Table 6 – Recommended In-Lieu Fee Schedule
Inland ($/Sq.Ft.) First 1,600 Square Feet per Unit Exempt Square footage from 1,600 to 2,000 SF $4 Square footage from 2,000 to 2,500 SF $8 Square footage from 2,500 to 3,500 SF $12 Square footage above 3,500 SF $16
Maximum Rate (considering total square feet of unit) $7
Coastal Zone ($/Sq.Ft.) Detached Units $12 Attached Units $24
As an example, a 2,100 square foot home would owe the following:
First 1,600 square feet of unit 1,600 SF X $0 / SF = $0
Next 400 square feet (from 1,600 to 2,000 SF) 400 SF X $4 / SF = $1,600
Next 100 square feet (from 2,000 to 2,100 SF) 100 SF X $8 / SF = $800
Total Fee (sum of the above) = $2,400 ($1.14 / SF) Calculated fee levels for a range of unit sizes are shown below.
Table 7 – Illustration of Recommended Fees for Example Home Sizes
Proposed Inland Fees Net Change vs. Existing $1.50/SF
Year 2 Rate Per Home Overall Rate Per
Square Foot
900 square foot home $0 $0.00 $0.00 1,000 square foot home $0 $0.00 ($1.50) 1,400 square foot home $0 $0.00 ($1.50) 1,600 square foot home $0 $0.00 ($1.50) 1,800 square foot home $800 $0.44 ($1.06) 2,000 square foot home $1,600 $0.80 ($0.70) 2,250 square foot home $3,600 $1.60 $0.10 2,500 square foot home $5,600 $2.24 $0.74 3,000 square foot home $11,600 $3.87 $2.37 3,500 square foot home $17,600 $5.03 $3.53 4,000 square foot home $25,600 $6.40 $4.90
Attachment 5
Page 13 of 34
Keyser Marston Associates, Inc. Page 11 \\SF-FS2\wp\19\19099\001\001-003.docx DRAFT
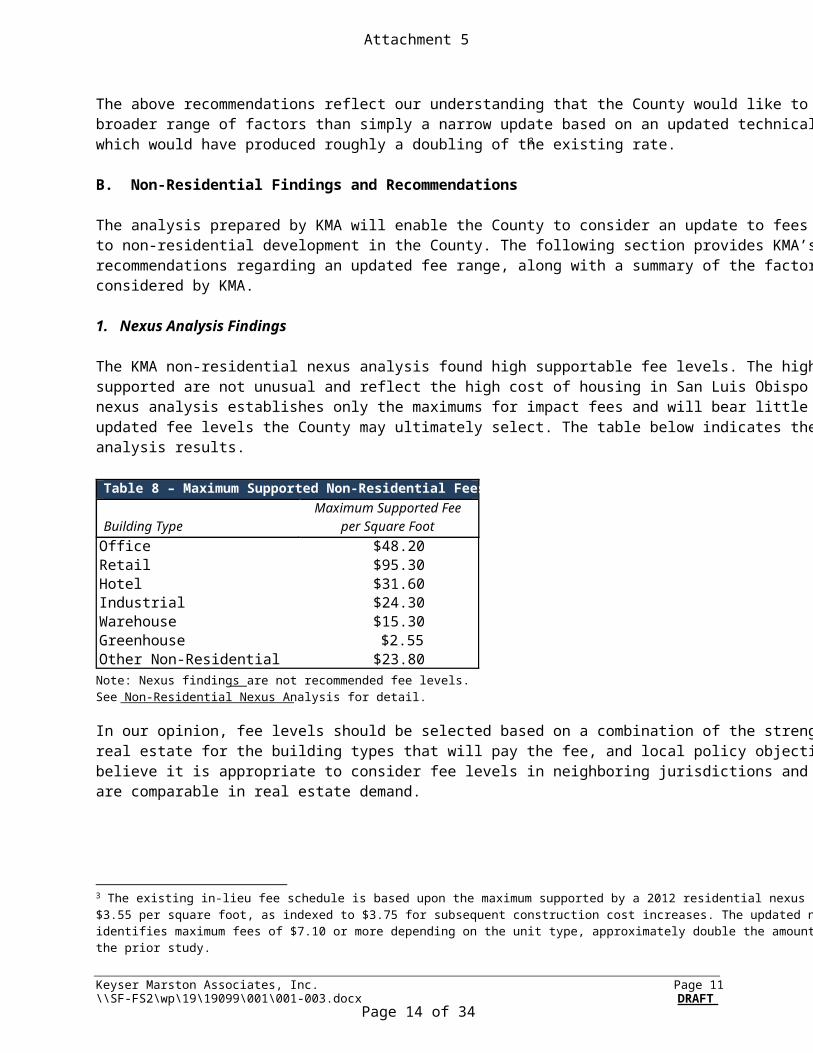
The above recommendations reflect our understanding that the County would like to consider a broader range of factors than simply a narrow update based on an updated technical analysis, which would have produced roughly a doubling of the existing rate.3 B. Non-Residential Findings and Recommendations The analysis prepared by KMA will enable the County to consider an update to fees applicable to non-residential development in the County. The following section provides KMA’s recommendations regarding an updated fee range, along with a summary of the factors considered by KMA. 1. Nexus Analysis Findings The KMA non-residential nexus analysis found high supportable fee levels. The high fee levels supported are not unusual and reflect the high cost of housing in San Luis Obispo County. The nexus analysis establishes only the maximums for impact fees and will bear little relationship to updated fee levels the County may ultimately select. The table below indicates the nexus analysis results.
Table 8 – Maximum Supported Non-Residential Fees
Building Type Maximum Supported Fee
per Square Foot
Note: Nexus findings are not recommended fee levels. See Non-Residential Nexus Analysis for detail.
In our opinion, fee levels should be selected based on a combination of the strength of the local real estate for the building types that will pay the fee, and local policy objectives. We also believe it is appropriate to consider fee levels in neighboring jurisdictions and jurisdictions that are comparable in real estate demand.
3 The existing in-lieu fee schedule is based upon the maximum supported by a 2012 residential nexus analysis of $3.55 per square foot, as indexed to $3.75 for subsequent construction cost increases. The updated nexus analysis identifies maximum fees of $7.10 or more depending on the unit type, approximately double the amount supported by the prior study.
Office $48.20Retail $95.30Hotel $31.60Industrial $24.30Warehouse $15.30Greenhouse $2.55Other Non-Residential $23.80
Attachment 5
Page 14 of 34
Keyser Marston Associates, Inc. Page 12 \\SF-FS2\wp\19\19099\001\001-003.docx DRAFT
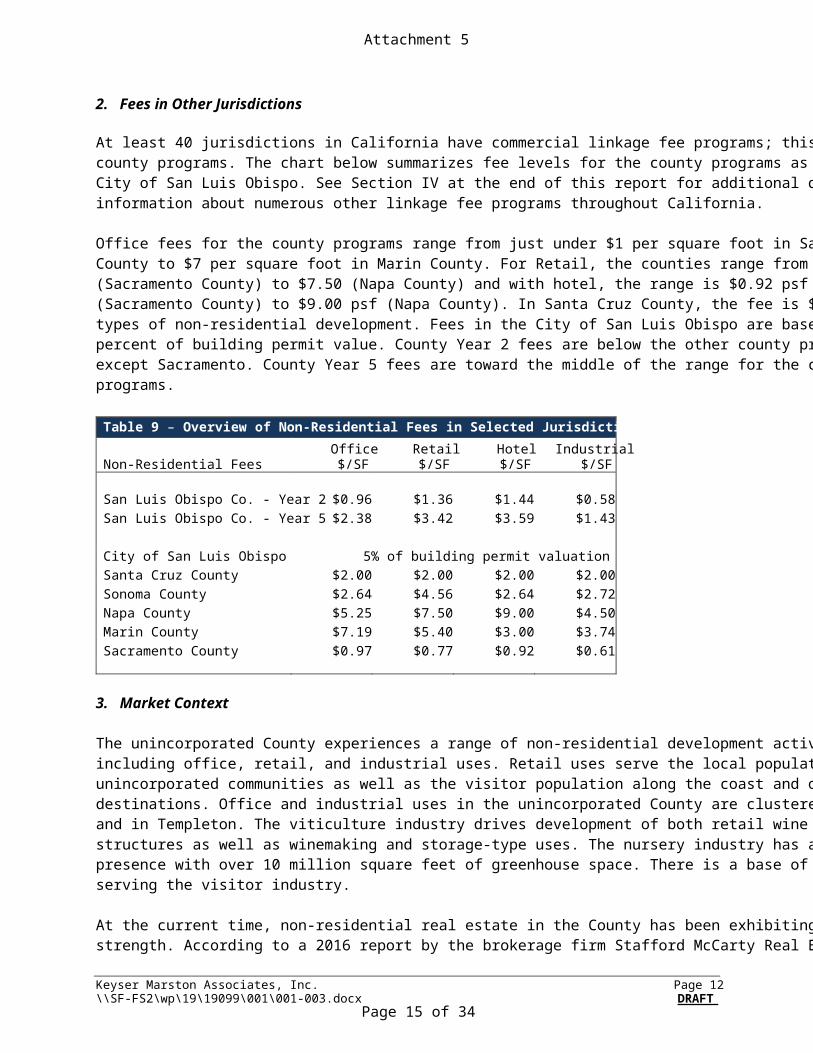
2. Fees in Other Jurisdictions At least 40 jurisdictions in California have commercial linkage fee programs; this includes six county programs. The chart below summarizes fee levels for the county programs as well as the City of San Luis Obispo. See Section IV at the end of this report for additional details as well as information about numerous other linkage fee programs throughout California. Office fees for the county programs range from just under $1 per square foot in Sacramento County to $7 per square foot in Marin County. For Retail, the counties range from $0.77 psf (Sacramento County) to $7.50 (Napa County) and with hotel, the range is $0.92 psf (Sacramento County) to $9.00 psf (Napa County). In Santa Cruz County, the fee is $2 for all types of non-residential development. Fees in the City of San Luis Obispo are based on 5% percent of building permit value. County Year 2 fees are below the other county programs, except Sacramento. County Year 5 fees are toward the middle of the range for the county programs.
Table 9 – Overview of Non-Residential Fees in Selected Jurisdictions
Non-Residential Fees Office $/SF
Retail $/SF
Hotel $/SF
Industrial $/SF
San Luis Obispo Co. - Year 2 $0.96 $1.36 $1.44 $0.58 San Luis Obispo Co. - Year 5 $2.38 $3.42 $3.59 $1.43 City of San Luis Obispo 5% of building permit valuation Santa Cruz County $2.00 $2.00 $2.00 $2.00 Sonoma County $2.64 $4.56 $2.64 $2.72 Napa County $5.25 $7.50 $9.00 $4.50 Marin County $7.19 $5.40 $3.00 $3.74 Sacramento County $0.97 $0.77 $0.92 $0.61
3. Market Context The unincorporated County experiences a range of non-residential development activity including office, retail, and industrial uses. Retail uses serve the local population in unincorporated communities as well as the visitor population along the coast and other visitor destinations. Office and industrial uses in the unincorporated County are clustered in the Airport and in Templeton. The viticulture industry drives development of both retail wine tasting structures as well as winemaking and storage-type uses. The nursery industry has a significant presence with over 10 million square feet of greenhouse space. There is a base of hotels serving the visitor industry. At the current time, non-residential real estate in the County has been exhibiting signs of strength. According to a 2016 report by the brokerage firm Stafford McCarty Real Estate,
Attachment 5
Page 15 of 34
Keyser Marston Associates, Inc. Page 13 \\SF-FS2\wp\19\19099\001\001-003.docx DRAFT
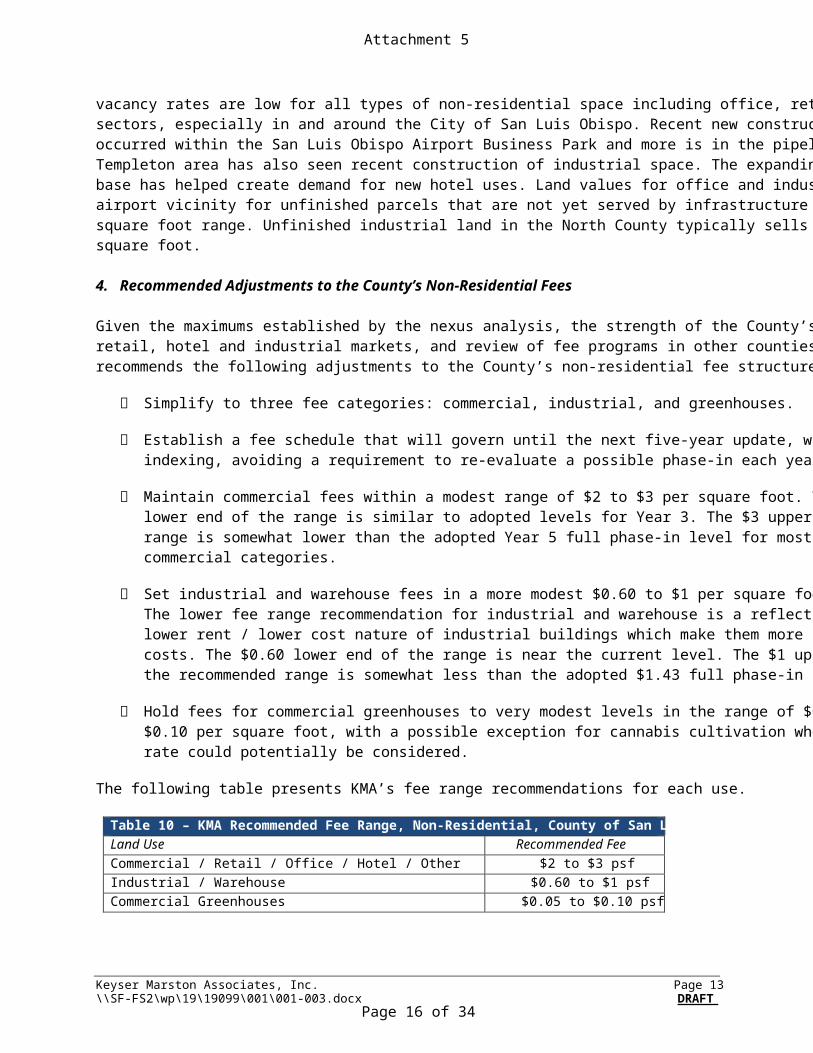
vacancy rates are low for all types of non-residential space including office, retail and industrial sectors, especially in and around the City of San Luis Obispo. Recent new construction has occurred within the San Luis Obispo Airport Business Park and more is in the pipeline. The Templeton area has also seen recent construction of industrial space. The expanding visitor base has helped create demand for new hotel uses. Land values for office and industrial in the airport vicinity for unfinished parcels that are not yet served by infrastructure are in the $7 per square foot range. Unfinished industrial land in the North County typically sells for under $2 per square foot. 4. Recommended Adjustments to the County’s Non-Residential Fees Given the maximums established by the nexus analysis, the strength of the County’s office, retail, hotel and industrial markets, and review of fee programs in other counties, KMA recommends the following adjustments to the County’s non-residential fee structure:
Simplify to three fee categories: commercial, industrial, and greenhouses.
Establish a fee schedule that will govern until the next five-year update, with automatic indexing, avoiding a requirement to re-evaluate a possible phase-in each year.
Maintain commercial fees within a modest range of $2 to $3 per square foot. The $2
lower end of the range is similar to adopted levels for Year 3. The $3 upper end of the range is somewhat lower than the adopted Year 5 full phase-in level for most of the commercial categories.
Set industrial and warehouse fees in a more modest $0.60 to $1 per square foot range.
The lower fee range recommendation for industrial and warehouse is a reflection of the lower rent / lower cost nature of industrial buildings which make them more sensitive to costs. The $0.60 lower end of the range is near the current level. The $1 upper end of the recommended range is somewhat less than the adopted $1.43 full phase-in level.
Hold fees for commercial greenhouses to very modest levels in the range of $0.05 to
$0.10 per square foot, with a possible exception for cannabis cultivation where a higher rate could potentially be considered.
The following table presents KMA’s fee range recommendations for each use.
Table 10 – KMA Recommended Fee Range, Non-Residential, County of San Luis Obispo Land Use Recommended Fee Commercial / Retail / Office / Hotel / Other $2 to $3 psf Industrial / Warehouse $0.60 to $1 psf Commercial Greenhouses $0.05 to $0.10 psf
Attachment 5
Page 16 of 34
Keyser Marston Associates, Inc. Page 15 \\SF-FS2\wp\19\19099\001\001-003.docx DRAFT
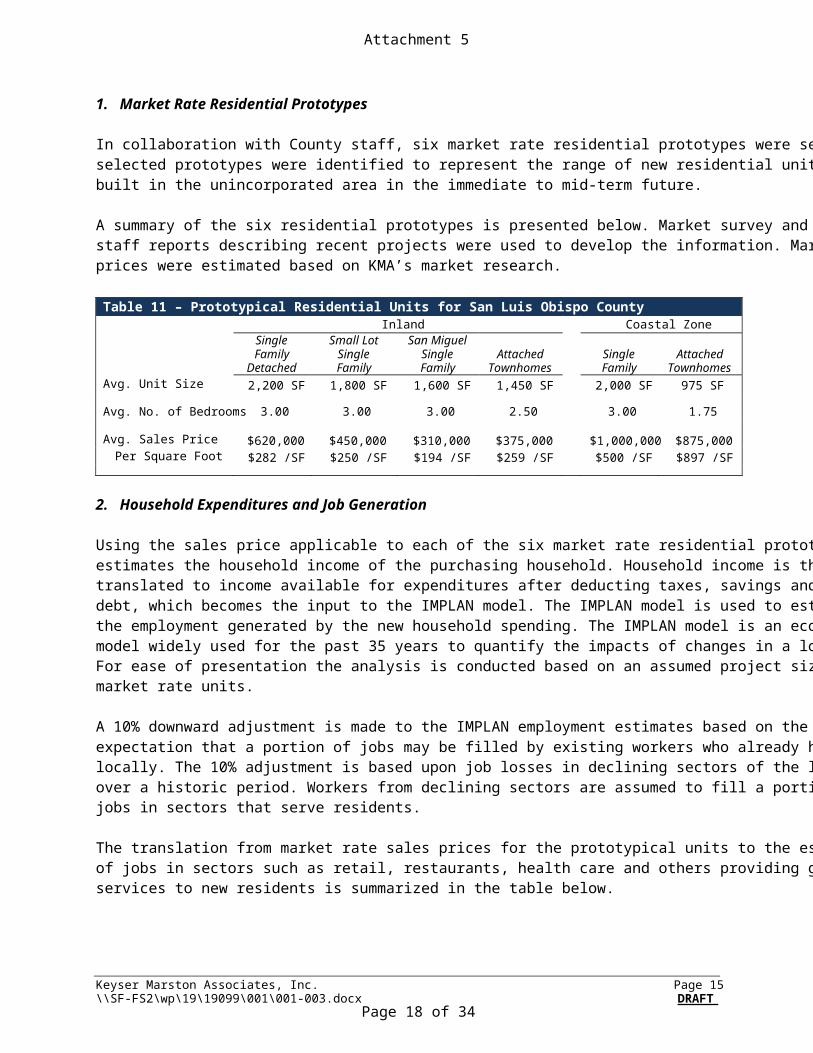
1. Market Rate Residential Prototypes
In collaboration with County staff, six market rate residential prototypes were selected. The selected prototypes were identified to represent the range of new residential units likely to be built in the unincorporated area in the immediate to mid-term future. A summary of the six residential prototypes is presented below. Market survey and data from staff reports describing recent projects were used to develop the information. Market sales prices were estimated based on KMA’s market research. Table 11 – Prototypical Residential Units for San Luis Obispo County Inland Coastal Zone
Single Family
Detached
Small Lot Single Family
San Miguel Single Family
Attached Townhomes
Single Family
Attached Townhomes
Avg. Unit Size 2,200 SF 1,800 SF 1,600 SF 1,450 SF 2,000 SF 975 SF Avg. No. of Bedrooms 3.00 3.00 3.00 2.50 3.00 1.75 Avg. Sales Price $620,000 $450,000 $310,000 $375,000 $1,000,000 $875,000
Per Square Foot $282 /SF $250 /SF $194 /SF $259 /SF $500 /SF $897 /SF
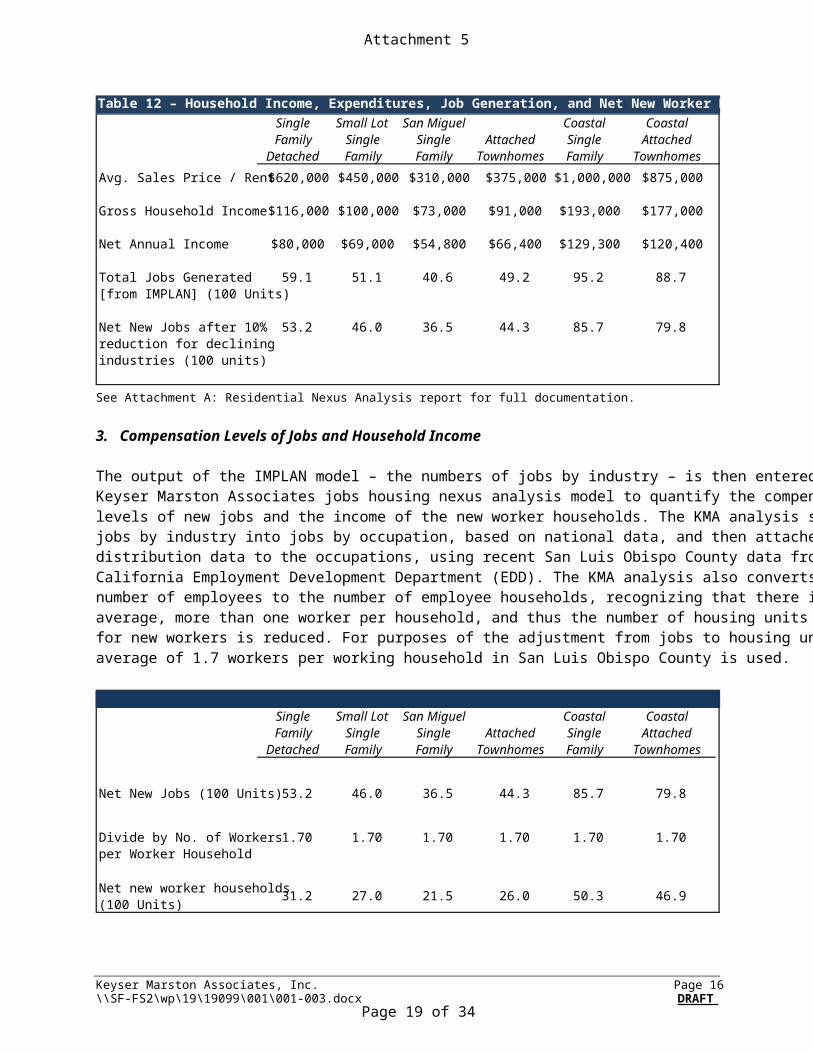
2. Household Expenditures and Job Generation Using the sales price applicable to each of the six market rate residential prototypes, KMA estimates the household income of the purchasing household. Household income is then translated to income available for expenditures after deducting taxes, savings and household debt, which becomes the input to the IMPLAN model. The IMPLAN model is used to estimate the employment generated by the new household spending. The IMPLAN model is an economic model widely used for the past 35 years to quantify the impacts of changes in a local economy. For ease of presentation the analysis is conducted based on an assumed project size of 100 market rate units. A 10% downward adjustment is made to the IMPLAN employment estimates based on the expectation that a portion of jobs may be filled by existing workers who already have housing locally. The 10% adjustment is based upon job losses in declining sectors of the local economy over a historic period. Workers from declining sectors are assumed to fill a portion of the new jobs in sectors that serve residents. The translation from market rate sales prices for the prototypical units to the estimated number of jobs in sectors such as retail, restaurants, health care and others providing goods and services to new residents is summarized in the table below.
Attachment 5
Page 18 of 34
Keyser Marston Associates, Inc. Page 16 \\SF-FS2\wp\19\19099\001\001-003.docx DRAFT
Table 12 – Household Income, Expenditures, Job Generation, and Net New Worker Households
See Attachment A: Residential Nexus Analysis report for full documentation. 3. Compensation Levels of Jobs and Household Income The output of the IMPLAN model – the numbers of jobs by industry – is then entered into the Keyser Marston Associates jobs housing nexus analysis model to quantify the compensation levels of new jobs and the income of the new worker households. The KMA analysis sorts the jobs by industry into jobs by occupation, based on national data, and then attaches local wage distribution data to the occupations, using recent San Luis Obispo County data from the California Employment Development Department (EDD). The KMA analysis also converts the number of employees to the number of employee households, recognizing that there is, on average, more than one worker per household, and thus the number of housing units in demand for new workers is reduced. For purposes of the adjustment from jobs to housing units, the average of 1.7 workers per working household in San Luis Obispo County is used. Table 13 – Adjustment from No. of Workers to No. of Households
Single Family
Detached
Small Lot Single Family
San Miguel Single Family
Attached Townhomes
Coastal Single Family
Coastal Attached
Townhomes
Avg. Sales Price / Rent $620,000 $450,000 $310,000 $375,000 $1,000,000 $875,000
Gross Household Income $116,000 $100,000 $73,000 $91,000 $193,000 $177,000
Net Annual Income $80,000 $69,000 $54,800 $66,400 $129,300 $120,400
Total Jobs Generated [from IMPLAN] (100 Units)
59.1 51.1 40.6 49.2 95.2 88.7
53.2 46.0 36.5 44.3 85.7 79.8Net New Jobs after 10% reduction for declining industries (100 units)
Single Family
Detached
Small Lot Single Family
San Miguel Single Family
Attached Townhomes
Coastal Single Family
Coastal Attached
Townhomes
Net New Jobs (100 Units) 53.2 46.0 36.5 44.3 85.7 79.8
Divide by No. of Workers per Worker Household
1.70 1.70 1.70 1.70 1.70 1.70
Net new worker households (100 Units)
31.2 27.0 21.5 26.0 50.3 46.9
Attachment 5
Page 19 of 34
Keyser Marston Associates, Inc. Page 17 \\SF-FS2\wp\19\19099\001\001-003.docx DRAFT
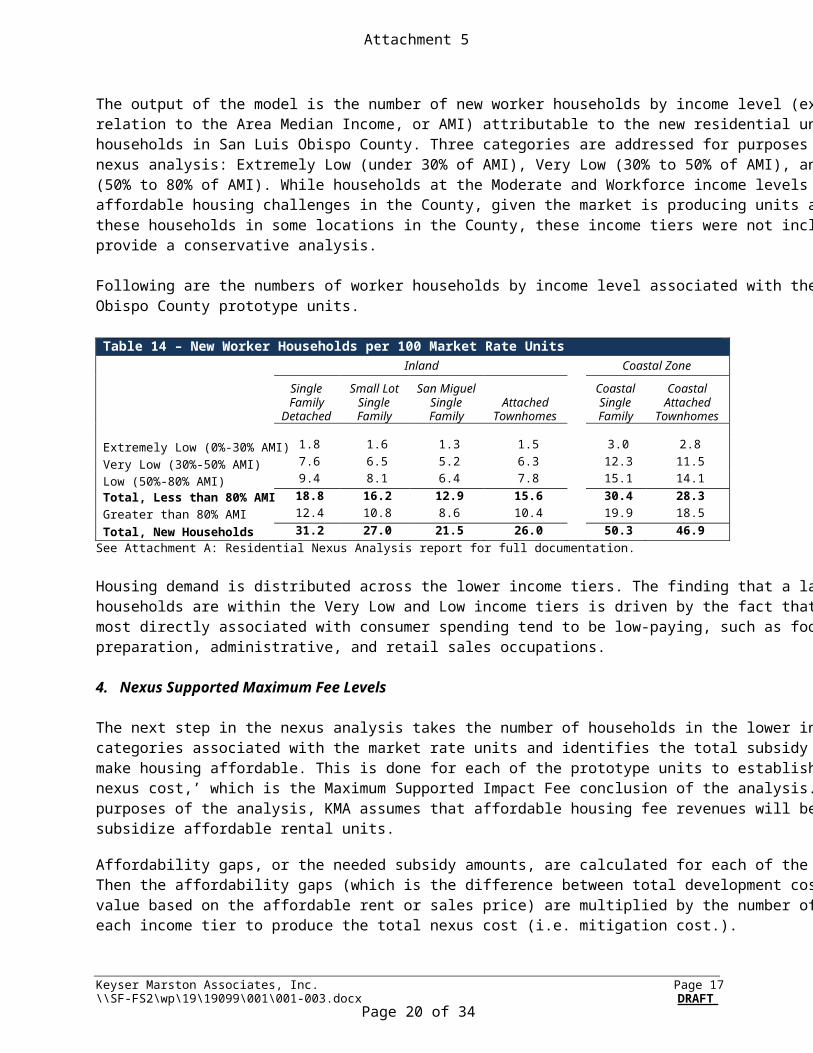
The output of the model is the number of new worker households by income level (expressed in relation to the Area Median Income, or AMI) attributable to the new residential units and new households in San Luis Obispo County. Three categories are addressed for purposes of the nexus analysis: Extremely Low (under 30% of AMI), Very Low (30% to 50% of AMI), and Low (50% to 80% of AMI). While households at the Moderate and Workforce income levels also face affordable housing challenges in the County, given the market is producing units affordable to these households in some locations in the County, these income tiers were not included to provide a conservative analysis. Following are the numbers of worker households by income level associated with the San Luis Obispo County prototype units. Table 14 – New Worker Households per 100 Market Rate Units Inland Coastal Zone
Single Family
Detached
Small Lot Single Family
San Miguel Single Family
Attached Townhomes
Coastal Single Family
Coastal Attached
Townhomes Extremely Low (0%-30% AMI) 1.8 1.6 1.3 1.5 3.0 2.8
Very Low (30%-50% AMI) 7.6 6.5 5.2 6.3 12.3 11.5
Low (50%-80% AMI) 9.4 8.1 6.4 7.8 15.1 14.1 Total, Less than 80% AMI 18.8 16.2 12.9 15.6 30.4 28.3 Greater than 80% AMI 12.4 10.8 8.6 10.4 19.9 18.5 Total, New Households 31.2 27.0 21.5 26.0 50.3 46.9
See Attachment A: Residential Nexus Analysis report for full documentation. Housing demand is distributed across the lower income tiers. The finding that a large share of households are within the Very Low and Low income tiers is driven by the fact that the jobs most directly associated with consumer spending tend to be low-paying, such as food preparation, administrative, and retail sales occupations. 4. Nexus Supported Maximum Fee Levels The next step in the nexus analysis takes the number of households in the lower income categories associated with the market rate units and identifies the total subsidy required to make housing affordable. This is done for each of the prototype units to establish the ‘total nexus cost,’ which is the Maximum Supported Impact Fee conclusion of the analysis. For the purposes of the analysis, KMA assumes that affordable housing fee revenues will be used to subsidize affordable rental units.
Affordability gaps, or the needed subsidy amounts, are calculated for each of the income tiers. Then the affordability gaps (which is the difference between total development cost and unit value based on the affordable rent or sales price) are multiplied by the number of households in each income tier to produce the total nexus cost (i.e. mitigation cost.).
Attachment 5
Page 20 of 34
Keyser Marston Associates, Inc. Page 18 \\SF-FS2\wp\19\19099\001\001-003.docx DRAFT
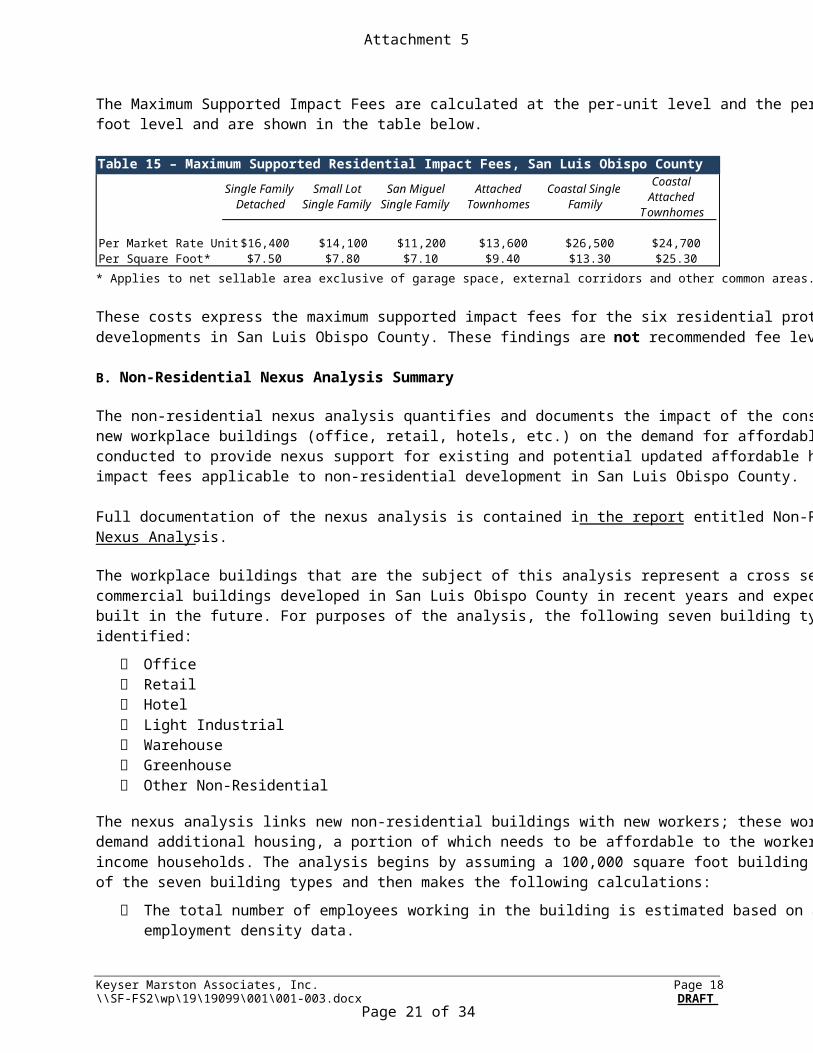
The Maximum Supported Impact Fees are calculated at the per-unit level and the per-square-foot level and are shown in the table below.
Table 15 – Maximum Supported Residential Impact Fees, San Luis Obispo County
* Applies to net sellable area exclusive of garage space, external corridors and other common areas.
These costs express the maximum supported impact fees for the six residential prototype developments in San Luis Obispo County. These findings are not recommended fee levels.
B. Non-Residential Nexus Analysis Summary
The non-residential nexus analysis quantifies and documents the impact of the construction of new workplace buildings (office, retail, hotels, etc.) on the demand for affordable housing. It is conducted to provide nexus support for existing and potential updated affordable housing impact fees applicable to non-residential development in San Luis Obispo County.
Full documentation of the nexus analysis is contained in the report entitled Non-Residential Nexus Analysis.
The workplace buildings that are the subject of this analysis represent a cross section of typical commercial buildings developed in San Luis Obispo County in recent years and expected to be built in the future. For purposes of the analysis, the following seven building types were identified:
Office Retail Hotel Light Industrial Warehouse Greenhouse Other Non-Residential
The nexus analysis links new non-residential buildings with new workers; these workers demand additional housing, a portion of which needs to be affordable to the workers in lower income households. The analysis begins by assuming a 100,000 square foot building for each of the seven building types and then makes the following calculations:
The total number of employees working in the building is estimated based on averageemployment density data.
Single Family Detached
Small Lot Single Family
San Miguel Single Family
Attached Townhomes
Coastal Single Family
Coastal Attached
Townhomes
$16,400 $14,100 $11,200 $13,600 $26,500 $24,700Per Market Rate Unit Per Square Foot* $7.50 $7.80 $7.10 $9.40 $13.30 $25.30
Attachment 5
Page 21 of 34
Keyser Marston Associates, Inc. Page 19 \\SF-FS2\wp\19\19099\001\001-003.docx DRAFT
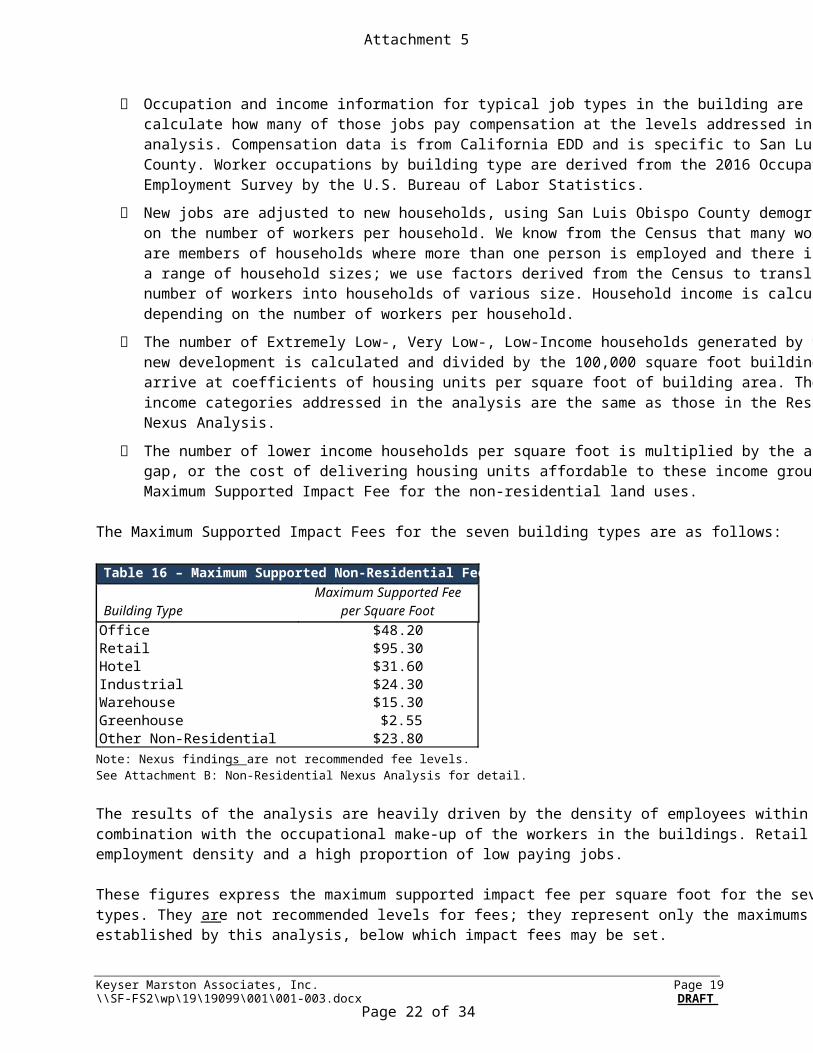
Occupation and income information for typical job types in the building are used to calculate how many of those jobs pay compensation at the levels addressed in the analysis. Compensation data is from California EDD and is specific to San Luis Obispo County. Worker occupations by building type are derived from the 2016 Occupational Employment Survey by the U.S. Bureau of Labor Statistics.
New jobs are adjusted to new households, using San Luis Obispo County demographics on the number of workers per household. We know from the Census that many workers are members of households where more than one person is employed and there is also a range of household sizes; we use factors derived from the Census to translate the number of workers into households of various size. Household income is calculated depending on the number of workers per household.
The number of Extremely Low-, Very Low-, Low-Income households generated by the new development is calculated and divided by the 100,000 square foot building size to arrive at coefficients of housing units per square foot of building area. The household income categories addressed in the analysis are the same as those in the Residential Nexus Analysis.
The number of lower income households per square foot is multiplied by the affordability gap, or the cost of delivering housing units affordable to these income groups. This is the Maximum Supported Impact Fee for the non-residential land uses.
The Maximum Supported Impact Fees for the seven building types are as follows:
Table 16 – Maximum Supported Non-Residential Fees
Building Type Maximum Supported Fee
per Square Foot
Note: Nexus findings are not recommended fee levels. See Attachment B: Non-Residential Nexus Analysis for detail. The results of the analysis are heavily driven by the density of employees within buildings in combination with the occupational make-up of the workers in the buildings. Retail has both high employment density and a high proportion of low paying jobs. These figures express the maximum supported impact fee per square foot for the seven building types. They are not recommended levels for fees; they represent only the maximums established by this analysis, below which impact fees may be set.
Office $48.20Retail $95.30Hotel $31.60Industrial $24.30Warehouse $15.30Greenhouse $2.55Other Non-Residential $23.80
Attachment 5
Page 22 of 34
Keyser Marston Associates, Inc. Page 20 \\SF-FS2\wp\19\19099\001\001-003.docx DRAFT
Overlap Analysis There is a potential for some degree of overlap between jobs counted in the Non-Residential Nexus Analysis and jobs counted in the Residential Nexus Analysis. The potential for overlap exists in jobs generated by the expenditures of County residents, such as expenditures for food, personal services, restaurant meals and entertainment. Retail is the building type that has the greatest potential for overlap to occur because it is often oriented to serving local residents. On the other hand, the potential for overlap is far less with office, industrial, warehouse and hotel buildings that often house businesses that serve a much broader, sometimes national or international, market and that are not focused on services to local residents. Appendix C to the Non-Residential Nexus Analysis provides additional discussion and an analysis demonstrating that, even in the improbable and theoretical case of complete overlap between jobs counted in the two nexus analyses, impact fees at the recommended levels would remain below the maximums supported by the nexus.
Attachment 5
Page 23 of 34
Keyser Marston Associates, Inc. Page 21 \\SF-FS2\wp\19\19099\001\001-003.docx DRAFT
IV. CONTEXT MATERIALS The purpose of this section is to provide information that may be useful to policy makers in considering potential updates to the County’s affordable housing fees applicable to residential development and non-residential development. The following analyses and summary materials are included:
Financial Analysis of On-Site Compliance Costs – Section A. analyzes the cost to a
market rate residential project of complying with the County’s inclusionary requirements through provision of affordable units onsite;
Affordable Unit Production Supported – Section B. provides a summary of the affordable unit production that has been supported by the program.
Projected Housing Needs in San Luis Obispo County – Section C. provides a long-term estimate of housing needs by affordability level.
Jobs Housing Linkage Fee Programs in Other Jurisdictions – Section D. provides information regarding linkage fee programs in 40 jurisdictions throughout California.
A. On-Site Compliance Cost Financial Analysis The inclusionary program in San Luis Obispo requires developers of new for-sale projects to set aside 15% of units for households with Very Low, Low, Moderate, and Workforce Incomes. KMA estimated the foregone revenue to the developer when units are sold at prices affordable to households with Very Low up through Workforce incomes; this is referred to as the ‘onsite compliance costs.’ KMA notes that the ‘cost’ is compared to the hypothetical condition of no requirement. A primary purpose of the onsite compliance analysis is to enable an understanding of the cost associated with complying with the County’s existing inclusionary requirements, which is often useful as context for consideration of potential fee obligations. Note that the analysis does not take into account the impact of a density bonus, which we understand is rarely used in the unincorporated County. Key findings are:
Projects are strongly incentivized to use the in-lieu fee option under the IHO. This is because it represents a lower cost to the developer than providing affordable units on-site. This is consistent with the County’s experience with the program in which all but one project has used the fee option. As an example, with single family units it is estimated that the cost of including affordable units onsite with current Year 2 requirements is $8.18 per square foot versus a fee option of $1.50 per square foot.
Attachment 5
Page 24 of 34
Keyser Marston Associates, Inc. Page 22 \\SF-FS2\wp\19\19099\001\001-003.docx DRAFT
Requirements in the Coastal Zone strongly incentivize projects to remain under 11-units to avoid the 15% onsite affordability requirement. The cost of including units onsite is estimated at $53 per square foot for single family and $95 per square foot for attached units, compared with fees for projects two to ten units in size of $1.50 per square foot.
Within inland areas of the County, the market is producing units that serve the Workforce Income category. In San Miguel, one of the lowest cost locations in the County, the market is producing units within the Moderate price range.
Attachment 5
Page 25 of 34
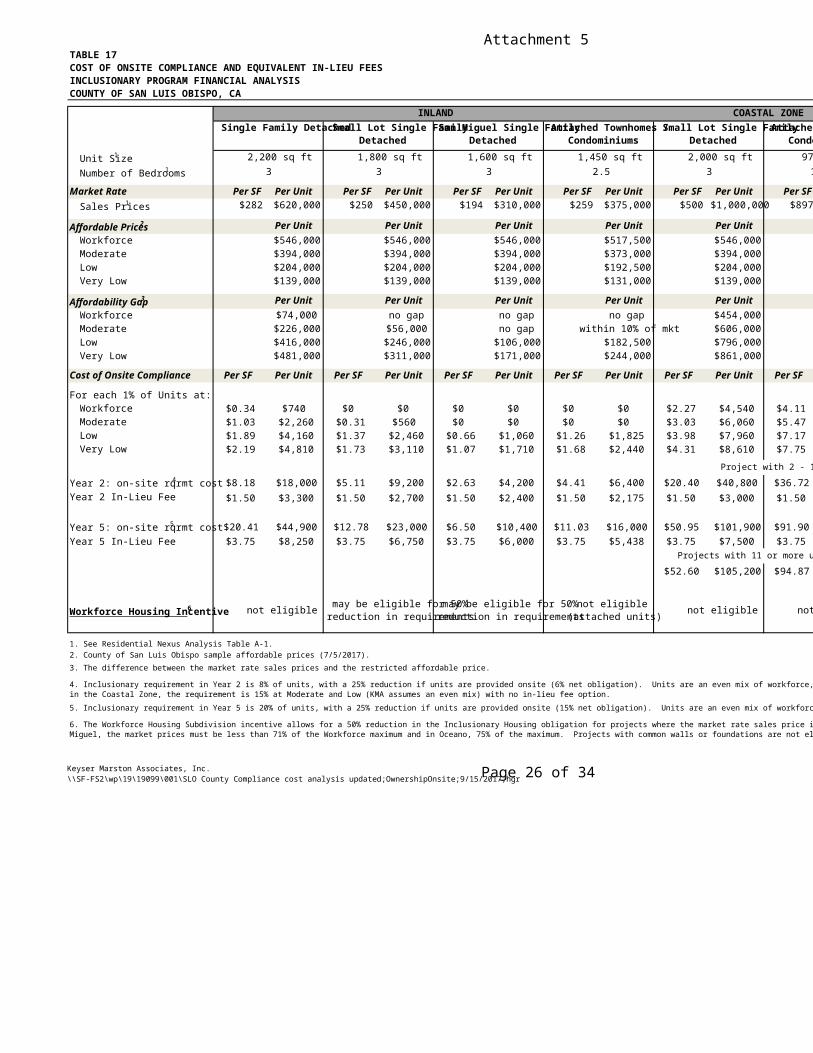
TABLE 17 COST OF ONSITE COMPLIANCE AND EQUIVALENT IN-LIEU FEES INCLUSIONARY PROGRAM FINANCIAL ANALYSISCOUNTY OF SAN LUIS OBISPO, CA
Unit Size1Number of Bedrooms1
Market Rate Per SF Per Unit Per SF Per Unit Per SF Per Unit Per SF Per Unit Per SF Per Unit Per SFSales Prices1 $620,000 $450,000 $310,000 $375,000 $1,000,000
Affordable Prices 2 Per Unit Per Unit Per Unit Per Unit Per UnitWorkforce $546,000 $546,000 $546,000 $517,500 $546,000 Moderate $394,000 $394,000 $394,000 $373,000 $394,000 Low $204,000 $204,000 $204,000 $192,500 $204,000 Very Low $139,000 $139,000 $139,000 $131,000 $139,000
Affordability Gap 3 Per Unit Per Unit Per Unit Per Unit Per UnitWorkforce $74,000 no gap no gap no gap $454,000 Moderate $226,000 $56,000 no gap within 10% of mkt $606,000 Low $416,000 $246,000 $106,000 $182,500 $796,000 Very Low $481,000 $311,000 $171,000 $244,000 $861,000
Cost of Onsite Compliance Per SF Per Unit Per SF Per Unit Per SF Per Unit Per SF Per Unit Per SF Per Unit Per SF
For each 1% of Units at:Workforce $0.34 $740 $0 $0 $0 $0 $0 $0 $2.27 $4,540 $4.11 Moderate $1.03 $2,260 $0.31 $560 $0 $0 $0 $0 $3.03 $6,060 $5.47 Low $1.89 $4,160 $1.37 $2,460 $0.66 $1,060 $1.26 $1,825 $3.98 $7,960 $7.17 Very Low $2.19 $4,810 $1.73 $3,110 $1.07 $1,710 $1.68 $2,440 $4.31 $8,610 $7.75
Year 2: on-site rqrmt cost 4 $8.18 $18,000 $5.11 $9,200 $2.63 $4,200 $4.41 $6,400 $20.40 $40,800 $36.72 Year 2 In-Lieu Fee $1.50 $3,300 $1.50 $2,700 $1.50 $2,400 $1.50 $2,175 $1.50 $3,000 $1.50
Year 5: on-site rqrmt cost5 $20.41 $44,900 $12.78 $23,000 $6.50 $10,400 $11.03 $16,000 $50.95 $101,900 $91.90 Year 5 In-Lieu Fee $3.75 $8,250 $3.75 $6,750 $3.75 $6,000 $3.75 $5,438 $3.75 $7,500 $3.75
$52.60 $105,200 $94.87
Workforce Housing Incentive6
1. See Residential Nexus Analysis Table A-1.2. County of San Luis Obispo sample affordable prices (7/5/2017).
3. The difference between the market rate sales prices and the restricted affordable price.
5. Inclusionary requirement in Year 5 is 20% of units, with a 25% reduction if units are provided onsite (15% net obligation). Units are an even mix of workforce, moderate, low and very low income units.
Project with 2 - 10 units:
Projects with 11 or more units onsite rqrmt cost:
may be eligible for 50% reduction in requirements
may be eligible for 50% reduction in requirementsnot eligible not eligible
(attached units) not eligible not eligible
Single Family Detached Small Lot Single Family Detached
San Miguel Single Family Detached
Attached Townhomes / Condominiums
Small Lot Single Family Detached
Attached Townhomes / Condominiums
COASTAL ZONEINLAND
2,200 sq ft 1,800 sq ft 1,600 sq ft 975 sq ft3 3 3 1.75
2,000 sq ft3
1,450 sq ft2.5
$282 $250 $194 $897 $500 $259
4. Inclusionary requirement in Year 2 is 8% of units, with a 25% reduction if units are provided onsite (6% net obligation). Units are an even mix of workforce, moderate, low and very low income units. For projects of 11 or more unitsin the Coastal Zone, the requirement is 15% at Moderate and Low (KMA assumes an even mix) with no in-lieu fee option.
6. The Workforce Housing Subdivision incentive allows for a 50% reduction in the Inclusionary Housing obligation for projects where the market rate sales price is less than the Affordable Sales Price for Workforce Income. In San Miguel, the market prices must be less than 71% of the Workforce maximum and in Oceano, 75% of the maximum. Projects with common walls or foundations are not eligible.
Keyser Marston Associates, Inc.\\SF-FS2\wp\19\19099\001\SLO County Compliance cost analysis updated;OwnershipOnsite;9/15/2017;hgr
Attachment 5
Page 26 of 34
Keyser Marston Associates, Inc. Page 24 \\SF-FS2\wp\19\19099\001\001-003.docx DRAFT
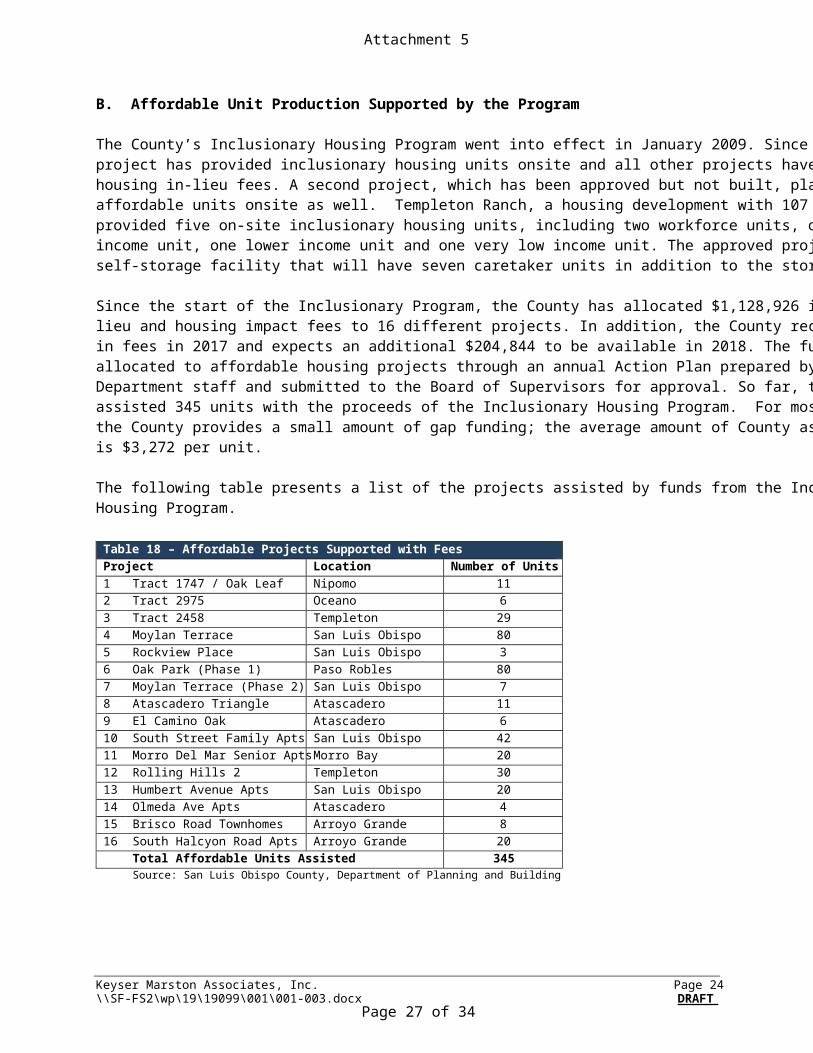
B. Affordable Unit Production Supported by the Program The County’s Inclusionary Housing Program went into effect in January 2009. Since then, one project has provided inclusionary housing units onsite and all other projects have chosen to pay housing in-lieu fees. A second project, which has been approved but not built, plans to include affordable units onsite as well. Templeton Ranch, a housing development with 107 units, provided five on-site inclusionary housing units, including two workforce units, one moderate income unit, one lower income unit and one very low income unit. The approved project is a self-storage facility that will have seven caretaker units in addition to the storage buildings. Since the start of the Inclusionary Program, the County has allocated $1,128,926 in housing in-lieu and housing impact fees to 16 different projects. In addition, the County received $667,752 in fees in 2017 and expects an additional $204,844 to be available in 2018. The funds are allocated to affordable housing projects through an annual Action Plan prepared by Planning Department staff and submitted to the Board of Supervisors for approval. So far, the County has assisted 345 units with the proceeds of the Inclusionary Housing Program. For most projects, the County provides a small amount of gap funding; the average amount of County assistance is $3,272 per unit. The following table presents a list of the projects assisted by funds from the Inclusionary Housing Program.
Table 18 – Affordable Projects Supported with Fees Project Location Number of Units 1 Tract 1747 / Oak Leaf Nipomo 11 2 Tract 2975 Oceano 6 3 Tract 2458 Templeton 29 4 Moylan Terrace San Luis Obispo 80 5 Rockview Place San Luis Obispo 3 6 Oak Park (Phase 1) Paso Robles 80 7 Moylan Terrace (Phase 2) San Luis Obispo 7 8 Atascadero Triangle Atascadero 11 9 El Camino Oak Atascadero 6 10 South Street Family Apts San Luis Obispo 42 11 Morro Del Mar Senior Apts Morro Bay 20 12 Rolling Hills 2 Templeton 30 13 Humbert Avenue Apts San Luis Obispo 20 14 Olmeda Ave Apts Atascadero 4 15 Brisco Road Townhomes Arroyo Grande 8 16 South Halcyon Road Apts Arroyo Grande 20 Total Affordable Units Assisted 345 Source: San Luis Obispo County, Department of Planning and Building
Attachment 5
Page 27 of 34
Keyser Marston Associates, Inc. Page 25 \\SF-FS2\wp\19\19099\001\001-003.docx DRAFT
C. Projected Housing Needs in San Luis Obispo County
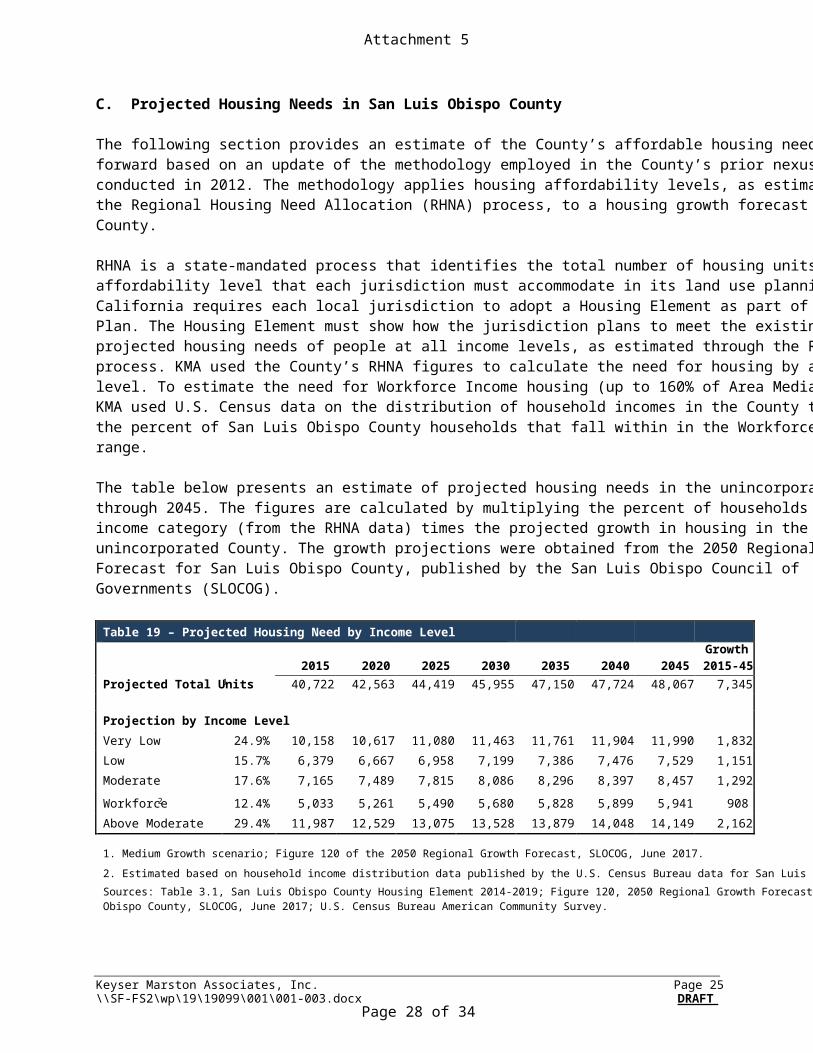
The following section provides an estimate of the County’s affordable housing needs going forward based on an update of the methodology employed in the County’s prior nexus study, conducted in 2012. The methodology applies housing affordability levels, as estimated through the Regional Housing Need Allocation (RHNA) process, to a housing growth forecast for the County. RHNA is a state-mandated process that identifies the total number of housing units by affordability level that each jurisdiction must accommodate in its land use planning. The State of California requires each local jurisdiction to adopt a Housing Element as part of its General Plan. The Housing Element must show how the jurisdiction plans to meet the existing and projected housing needs of people at all income levels, as estimated through the RHNA process. KMA used the County’s RHNA figures to calculate the need for housing by affordability level. To estimate the need for Workforce Income housing (up to 160% of Area Median Income), KMA used U.S. Census data on the distribution of household incomes in the County to estimate the percent of San Luis Obispo County households that fall within in the Workforce Income range. The table below presents an estimate of projected housing needs in the unincorporated County through 2045. The figures are calculated by multiplying the percent of households in each income category (from the RHNA data) times the projected growth in housing in the unincorporated County. The growth projections were obtained from the 2050 Regional Growth Forecast for San Luis Obispo County, published by the San Luis Obispo Council of Governments (SLOCOG).
Table 19 – Projected Housing Need by Income Level
2015 2020 2025 2030 2035 2040 2045 Growth 2015-45
Projected Total Units1 40,722 42,563 44,419 45,955 47,150 47,724 48,067 7,345
Projection by Income Level
Very Low 24.9% 10,158 10,617 11,080 11,463 11,761 11,904 11,990 1,832
Low 15.7% 6,379 6,667 6,958 7,199 7,386 7,476 7,529 1,151
Moderate 17.6% 7,165 7,489 7,815 8,086 8,296 8,397 8,457 1,292
Workforce2 12.4% 5,033 5,261 5,490 5,680 5,828 5,899 5,941 908
Above Moderate 29.4% 11,987 12,529 13,075 13,528 13,879 14,048 14,149 2,162
1. Medium Growth scenario; Figure 120 of the 2050 Regional Growth Forecast, SLOCOG, June 2017.
2. Estimated based on household income distribution data published by the U.S. Census Bureau data for San Luis Obispo County.
Sources: Table 3.1, San Luis Obispo County Housing Element 2014-2019; Figure 120, 2050 Regional Growth Forecast for San Luis Obispo County, SLOCOG, June 2017; U.S. Census Bureau American Community Survey.
Attachment 5
Page 28 of 34
Keyser Marston Associates, Inc. Page 26 \\SF-FS2\wp\19\19099\001\001-003.docx DRAFT
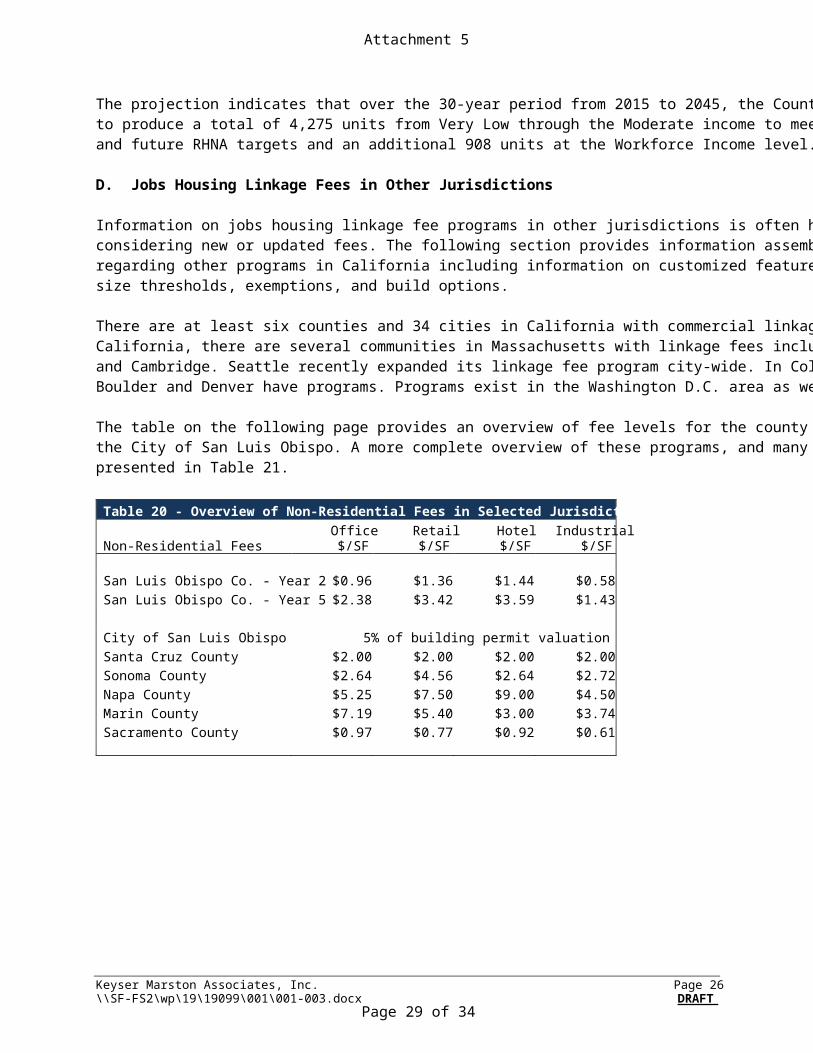
The projection indicates that over the 30-year period from 2015 to 2045, the County would need to produce a total of 4,275 units from Very Low through the Moderate income to meet existing and future RHNA targets and an additional 908 units at the Workforce Income level. D. Jobs Housing Linkage Fees in Other Jurisdictions Information on jobs housing linkage fee programs in other jurisdictions is often helpful context in considering new or updated fees. The following section provides information assembled regarding other programs in California including information on customized features such as size thresholds, exemptions, and build options. There are at least six counties and 34 cities in California with commercial linkage fees. Outside California, there are several communities in Massachusetts with linkage fees including Boston and Cambridge. Seattle recently expanded its linkage fee program city-wide. In Colorado, both Boulder and Denver have programs. Programs exist in the Washington D.C. area as well. The table on the following page provides an overview of fee levels for the county programs and the City of San Luis Obispo. A more complete overview of these programs, and many others, is presented in Table 21.
Table 20 - Overview of Non-Residential Fees in Selected Jurisdictions
Non-Residential Fees Office $/SF
Retail $/SF
Hotel $/SF
Industrial $/SF
San Luis Obispo Co. - Year 2 $0.96 $1.36 $1.44 $0.58 San Luis Obispo Co. - Year 5 $2.38 $3.42 $3.59 $1.43 City of San Luis Obispo 5% of building permit valuation Santa Cruz County $2.00 $2.00 $2.00 $2.00 Sonoma County $2.64 $4.56 $2.64 $2.72 Napa County $5.25 $7.50 $9.00 $4.50 Marin County $7.19 $5.40 $3.00 $3.74 Sacramento County $0.97 $0.77 $0.92 $0.61
Attachment 5
Page 29 of 34
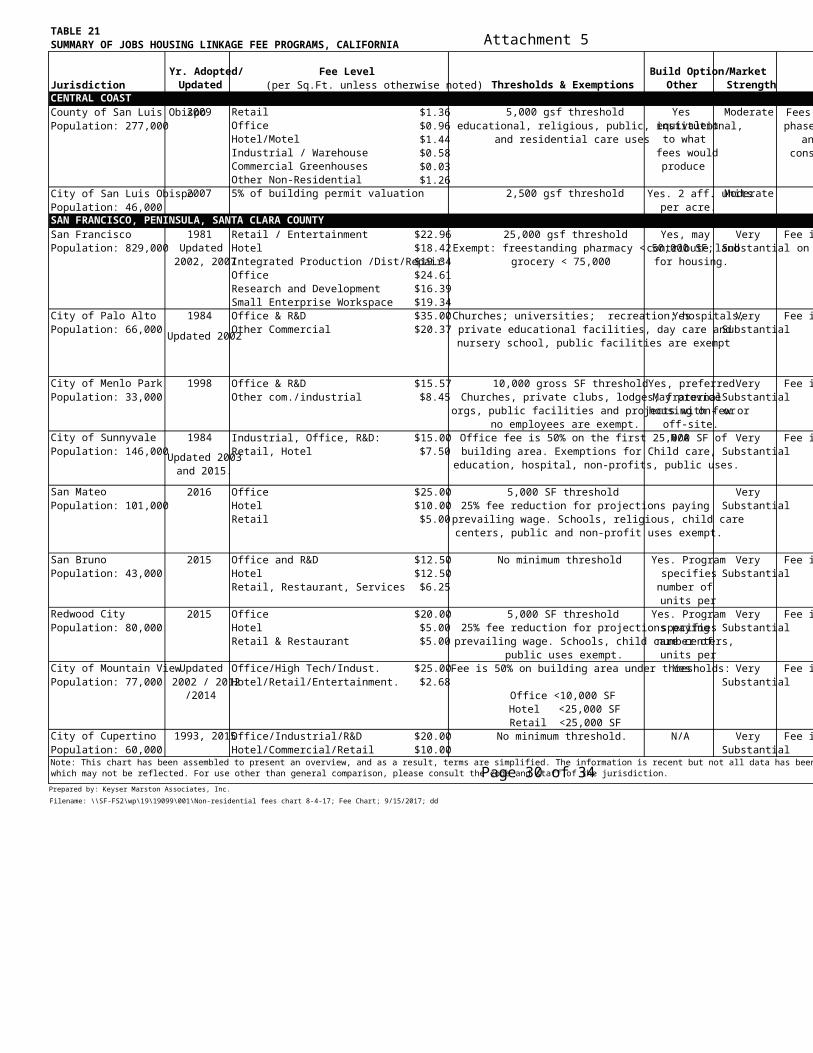
TABLE 21SUMMARY OF JOBS HOUSING LINKAGE FEE PROGRAMS, CALIFORNIA
JurisdictionYr. Adopted/
Updated Thresholds & ExemptionsBuild Option/
OtherMarket
Strength
County of San Luis Obispo2009 Retail $1.36 5,000 gsf threshold Yes ModeratePopulation: 277,000 Office $0.96 equivalent
Hotel/Motel $1.44 to what Industrial / Warehouse $0.58 fees wouldCommercial Greenhouses $0.03 produceOther Non-Residential $1.26
City of San Luis Obispo 2007 5% of building permit valuation 2,500 gsf threshold ModeratePopulation: 46,000
San Francisco 1981 Retail / Entertainment $22.96 25,000 gsf thresholdPopulation: 829,000 Updated Hotel $18.42
2002, 2007Integrated Production /Dist/Repair $19.34Office $24.61Research and Development $16.39Small Enterprise Workspace $19.34
City of Palo Alto 1984 Office & R&D $35.00Population: 66,000 Updated 2002Other Commercial $20.37
City of Menlo Park 1998 Office & R&D $15.57 10,000 gross SF thresholdPopulation: 33,000 Other com./industrial $8.45
City of Sunnyvale 1984 Industrial, Office, R&D: $15.00Population: 146,000 Retail, Hotel $7.50
San Mateo 2016 Office $25.00 5,000 SF thresholdPopulation: 101,000 Hotel $10.00
Retail $5.00
San Bruno 2015 Office and R&D $12.50 No minimum thresholdPopulation: 43,000 Hotel $12.50
Retail, Restaurant, Services $6.25
Redwood City 2015 Office $20.00 5,000 SF thresholdPopulation: 80,000 Hotel $5.00
Retail & Restaurant $5.00
City of Mountain View Updated Office/High Tech/Indust. $25.00Population: 77,000 2002 / 2012Hotel/Retail/Entertainment. $2.68
/2014 Office <10,000 SFHotel <25,000 SFRetail <25,000 SF
City of Cupertino 1993, 2015Office/Industrial/R&D $20.00Population: 60,000 Hotel/Commercial/Retail $10.00
Churches, private clubs, lodges, fraternal orgs, public facilities and projects with few or
no employees are exempt.Office fee is 50% on the first 25,000 SF of building area. Exemptions for Child care,
education, hospital, non-profits, public uses.
25% fee reduction for projections paying prevailing wage. Schools, child care centers,
public uses exempt.
Yes, preferred. May provide
housing on- or off-site.
Yes
No minimum threshold. N/A
N/A
Fee is adjusted annually based
Fee is adjusted annually based
Very Substantial25% fee reduction for projections paying
prevailing wage. Schools, religious, child care centers, public and non-profit uses exempt.
Yes. Program specifies
number of units per
Very Substantial
Fee is adjusted annually based
Very Substantial
Fee is adjusted annually based
Very Substantial
Yes
SAN FRANCISCO, PENINSULA, SANTA CLARA COUNTY Yes, may
contribute land for housing.
Fee is adjusted annually based on the construction cost
Very Substantial
Churches; universities; recreation; hospitals, private educational facilities, day care and nursery school, public facilities are exempt
Exempt: freestanding pharmacy < 50,000 SF; grocery < 75,000
Note: This chart has been assembled to present an overview, and as a result, terms are simplified. The information is recent but not all data has been updated as of the date of this report. In some cases, fees are adjusted by an index (such as CPI) which may not be reflected. For use other than general comparison, please consult the code and staff of the jurisdiction.
Updated 2003 and 2015.
Fee Level (per Sq.Ft. unless otherwise noted)
Very Substantial
Fee is adjusted annually based
Very Substantial
Very Substantial
Fee is adjusted annually based Yes. Program specifies
number of units per
Fee is 50% on building area under thresholds:
CENTRAL COASTFees indicated are 40% of full phase-in level and are indexed
annually based on the construction cost increases.
educational, religious, public, institutional, and residential care uses
Yes. 2 aff. units per acre.
Very Substantial
Fee is adjusted annually based
Prepared by: Keyser Marston Associates, Inc.Filename: \\SF-FS2\wp\19\19099\001\Non-residential fees chart 8-4-17; Fee Chart; 9/15/2017; dd
Attachment 5
Page 30 of 34
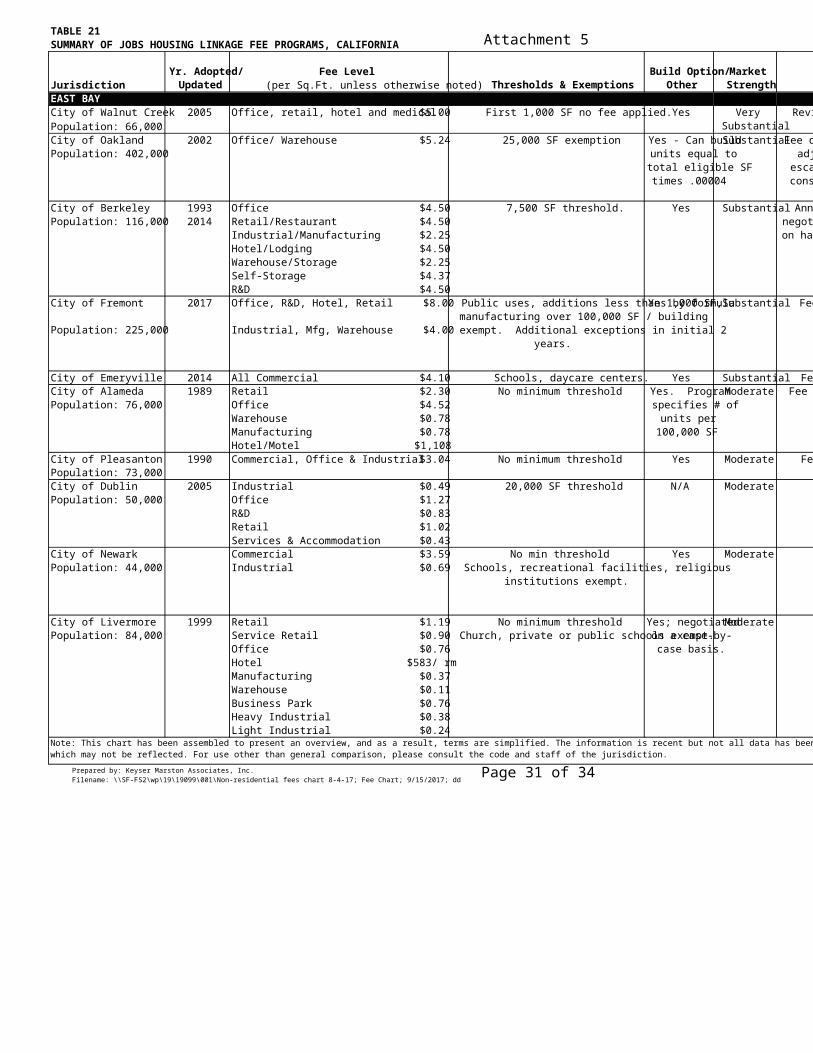
TABLE 21SUMMARY OF JOBS HOUSING LINKAGE FEE PROGRAMS, CALIFORNIA
JurisdictionYr. Adopted/
Updated Thresholds & ExemptionsBuild Option/
OtherMarket
StrengthFee Level
(per Sq.Ft. unless otherwise noted)EAST BAY City of Walnut Creek 2005 $5.00Population: 66,000City of Oakland 2002 Office/ Warehouse $5.24Population: 402,000
City of Berkeley 1993 Office $4.50Population: 116,000 2014 Retail/Restaurant $4.50
Industrial/Manufacturing $2.25Hotel/Lodging $4.50Warehouse/Storage $2.25Self-Storage $4.37R&D $4.50
City of Fremont 2017 Office, R&D, Hotel, Retail $8.00 Yes by formulaSubstantial
Population: 225,000 Industrial, Mfg, Warehouse $4.00
City of Emeryville 2014 All Commercial $4.10 Schools, daycare centers. Yes Substantial Fee adjusted annually.City of Alameda 1989 Retail $2.30Population: 76,000 Office $4.52
Warehouse $0.78Manufacturing $0.78Hotel/Motel $1,108
City of Pleasanton 1990 $3.04Population: 73,000City of Dublin 2005 Industrial $0.49 20,000 SF threshold N/APopulation: 50,000 Office $1.27
R&D $0.83Retail $1.02Services & Accommodation $0.43
City of Newark Commercial $3.59 No min threshold Yes ModeratePopulation: 44,000 Industrial $0.69
City of Livermore 1999 Retail $1.19 No minimum thresholdPopulation: 84,000 Service Retail $0.90
Office $0.76Hotel $583/ rmManufacturing $0.37Warehouse $0.11Business Park $0.76Heavy Industrial $0.38Light Industrial $0.24
Commercial, Office & Industrial No minimum threshold Yes
Note: This chart has been assembled to present an overview, and as a result, terms are simplified. The information is recent but not all data has been updated as of the date of this report. In some cases, fees are adjusted by an index (such as CPI) which may not be reflected. For use other than general comparison, please consult the code and staff of the jurisdiction.
No minimum threshold Yes. Program specifies # of
units per 100,000 SF
Moderate
Moderate
Reviewed every five years.
Fee due in 3 installments. Fee adjusted with an annual
escalator tied to residential construction cost increases.
Fee may be adjusted by CPI.
Fee adjusted annually.
Revised annually
Annual CPI increase. May negotiate fee downward based on hardship or reduced impact.
25,000 SF exemption
Moderate
Substantial
7,500 SF threshold.
Yes - Can build units equal to
total eligible SF times .00004
First 1,000 SF no fee applied. Yes Very Substantial
Office, retail, hotel and medical
Public uses, additions less than 1,000 SF, manufacturing over 100,000 SF / building exempt. Additional exceptions in initial 2
years.
Fees are as of 2020 full
Moderate
Schools, recreational facilities, religious institutions exempt.
Church, private or public schools exempt.Yes; negotiated on a case-by-case basis.
Yes Substantial
Prepared by: Keyser Marston Associates, Inc.Filename: \\SF-FS2\wp\19\19099\001\Non-residential fees chart 8-4-17; Fee Chart; 9/15/2017; dd
Attachment 5
Page 31 of 34

TABLE 21SUMMARY OF JOBS HOUSING LINKAGE FEE PROGRAMS, CALIFORNIA
JurisdictionYr. Adopted/
Updated Thresholds & ExemptionsBuild Option/
OtherMarket
StrengthFee Level
(per Sq.Ft. unless otherwise noted)
County of Santa Cruz 2015 All Non-Residential $2.00Population: 267,000County of Marin 2003 Office/R&D $7.19Population: 257,000 Retail/Rest. $5.40
Warehouse $1.94Hotel/Motel $1,745/rmManufacturing $3.74
San Rafael 2005 Office/R&D $7.64 SubstantialPopulation: 59,000 Retail/Rest./Pers. Services $5.73
Manufacturing/LI $4.14Warehouse $2.23Hotel/Motel $1.91
Town of Corte Madera 2001 Office $4.79Population: 9,000 R&D lab $3.20
Light Industrial $2.79Warehouse $0.40Retail $8.38Com Services $1.20Restaurant $4.39Hotel $1.20Health Club/Rec $2.00Training facility/School $2.39
City of St. Helena 2004 Office $4.11Population: 6,000 Comm./Retail $5.21
Hotel $3.80Winery/Industrial $1.26
City of Petaluma 2003 Commercial $2.19Population: 59,000 Industrial $2.26
Retail $3.78County of Sonoma 2005 Office $2.64 First 2,000 SF exemptPopulation: 492,000 Hotel $2.64
Retail $4.56Industrial $2.72R&D Ag Processing $2.72
City of Cotati 2006 Commercial $2.08 First 2,000 SF exemptPopulation: 7,000 Industrial $2.15 Non-profits exempt.
Retail $3.59County of Napa Office $5.25 No minimum thresholdPopulation: 139,000 Hotel $9.00 Non-profits are exempt
Retail $7.50Industrial $4.50Warehouse $3.60
City of Napa 1999 Office $1.00 No minimum threshold Moderate/Population: 79,000 Hotel $1.40 Non-profits are exempt Substantial
Retail $0.80Industrial, Wine Pdn $0.50Warehouse (30-100K) $0.30Warehouse (100K+) $0.20
Yes. Program specifies
number of units per 1,000
SF.
Non-profits, redevelopment areas exempt
Fee has not changed since 1999. Increases under consideration.
Units or land dedication; on a case by case
basis.
Yes, subject to City Council approval.
Substantial
No minimum threshold N/A Substantial
Units or land dedication; on a case by case
basis.
Yes. Specifies No. of units per
1,000 SF
Moderate
Yes. Program specifies
number of units per 1,000
SF.
Moderate
Fee adjusted annually by ENR construction cost index.
Moderate / Substantial
N/A Yes, subject to City Council approval.
Moderate/ Substantial
Fee adjusted annually by ENR construction cost index.
Fee adjusted annually by ENR construction cost index.
Updated 2014
No minimum threshold Yes, preferred.Substantial
MARIN, NAPA, SONOMA, SANTA CRUZ
5,000 SF threshold. Mixed use projects that provide affordable
housing are exempt.
No minimum threshold N/A Substantial
Small childcare facilities, churches, non-profits, vineyards, and public facilities are
exempt.
Note: This chart has been assembled to present an overview, and as a result, terms are simplified. The information is recent but not all data has been updated as of the date of this report. In some cases, fees are adjusted by an index (such as CPI) which may not be reflected. For use other than general comparison, please consult the code and staff of the jurisdiction.
Attachment 5
Page 32 of 34
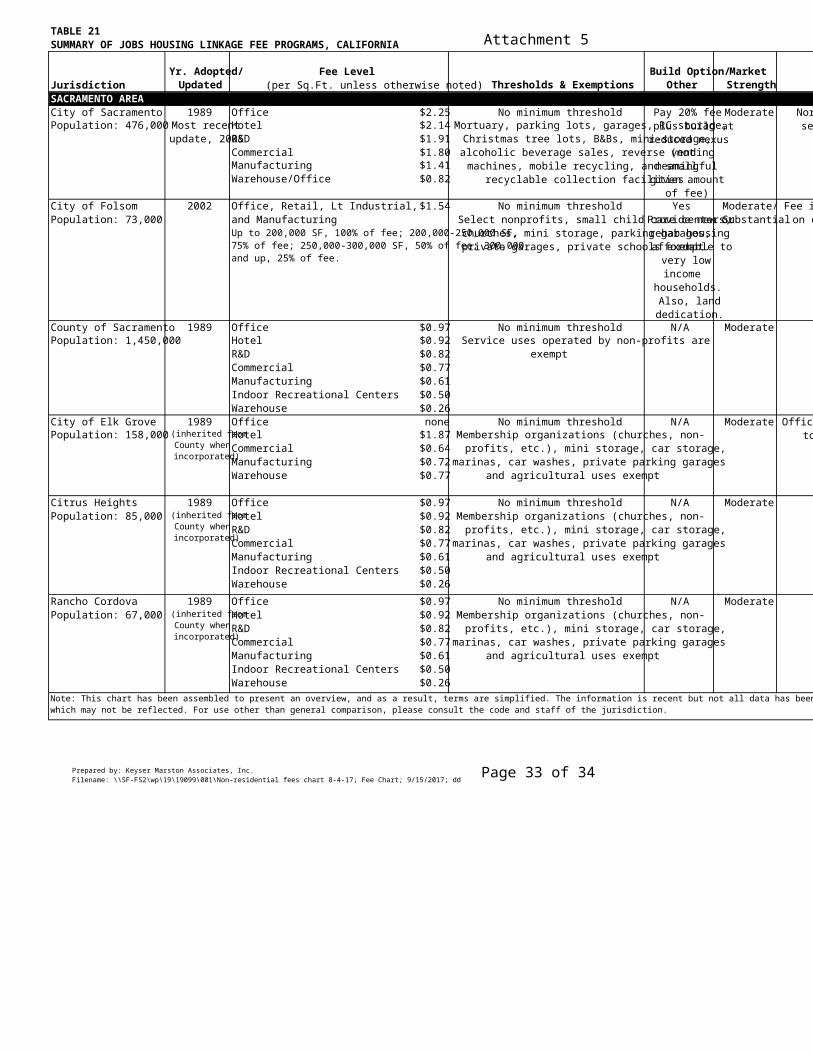
TABLE 21SUMMARY OF JOBS HOUSING LINKAGE FEE PROGRAMS, CALIFORNIA
JurisdictionYr. Adopted/
Updated Thresholds & ExemptionsBuild Option/
OtherMarket
StrengthFee Level
(per Sq.Ft. unless otherwise noted)SACRAMENTO AREACity of Sacramento 1989 Office $2.25 No minimum threshold ModeratePopulation: 476,000 Hotel $2.14
R&D $1.91Commercial $1.80Manufacturing $1.41Warehouse/Office $0.82
City of Folsom 2002 Office, Retail, Lt Industrial, $1.54 No minimum threshold Yes Moderate/Population: 73,000 and Manufacturing Substantial
County of Sacramento 1989 Office $0.97 No minimum threshold ModeratePopulation: 1,450,000 Hotel $0.92
R&D $0.82Commercial $0.77Manufacturing $0.61Indoor Recreational Centers $0.50Warehouse $0.26
City of Elk Grove 1989 Office none No minimum threshold ModeratePopulation: 158,000 Hotel $1.87
Commercial $0.64Manufacturing $0.72Warehouse $0.77
Citrus Heights 1989 Office $0.97 No minimum threshold ModeratePopulation: 85,000 Hotel $0.92
R&D $0.82Commercial $0.77Manufacturing $0.61Indoor Recreational Centers $0.50Warehouse $0.26
Rancho Cordova 1989 Office $0.97 No minimum threshold ModeratePopulation: 67,000 Hotel $0.92
R&D $0.82Commercial $0.77Manufacturing $0.61Indoor Recreational Centers $0.50Warehouse $0.26
Select nonprofits, small child care centers, churches, mini storage, parking garages, private garages, private schools exempt.
Service uses operated by non-profits are exempt
Membership organizations (churches, non-profits, etc.), mini storage, car storage,
marinas, car washes, private parking garages and agricultural uses exempt
Membership organizations (churches, non-profits, etc.), mini storage, car storage,
marinas, car washes, private parking garages and agricultural uses exempt
(inherited from County when incorporated)
Fee is adjusted annually based on construction cost index
North Natomas area has separate fee structure
Note: This chart has been assembled to present an overview, and as a result, terms are simplified. The information is recent but not all data has been updated as of the date of this report. In some cases, fees are adjusted by an index (such as CPI) which may not be reflected. For use other than general comparison, please consult the code and staff of the jurisdiction.
Most recent update, 2005
(inherited from County when incorporated)
(inherited from County when incorporated)
(not meaningful
given amount of fee)
Membership organizations (churches, non-profits, etc.), mini storage, car storage,
marinas, car washes, private parking garages and agricultural uses exempt
Pay 20% fee plus build at
reduced nexus
Office fee currently waived due to market conditions.
Provide new or rehab housing affordable to
very low income
households. Also, land dedication.
N/A
N/A
Up to 200,000 SF, 100% of fee; 200,000-250,000 SF, 75% of fee; 250,000-300,000 SF, 50% of fee; 300,000 and up, 25% of fee.
N/A
Mortuary, parking lots, garages, RC storage, Christmas tree lots, B&Bs, mini-storage, alcoholic beverage sales, reverse vending
machines, mobile recycling, and small recyclable collection facilities
N/A
Prepared by: Keyser Marston Associates, Inc.Filename: \\SF-FS2\wp\19\19099\001\Non-residential fees chart 8-4-17; Fee Chart; 9/15/2017; dd
Attachment 5
Page 33 of 34
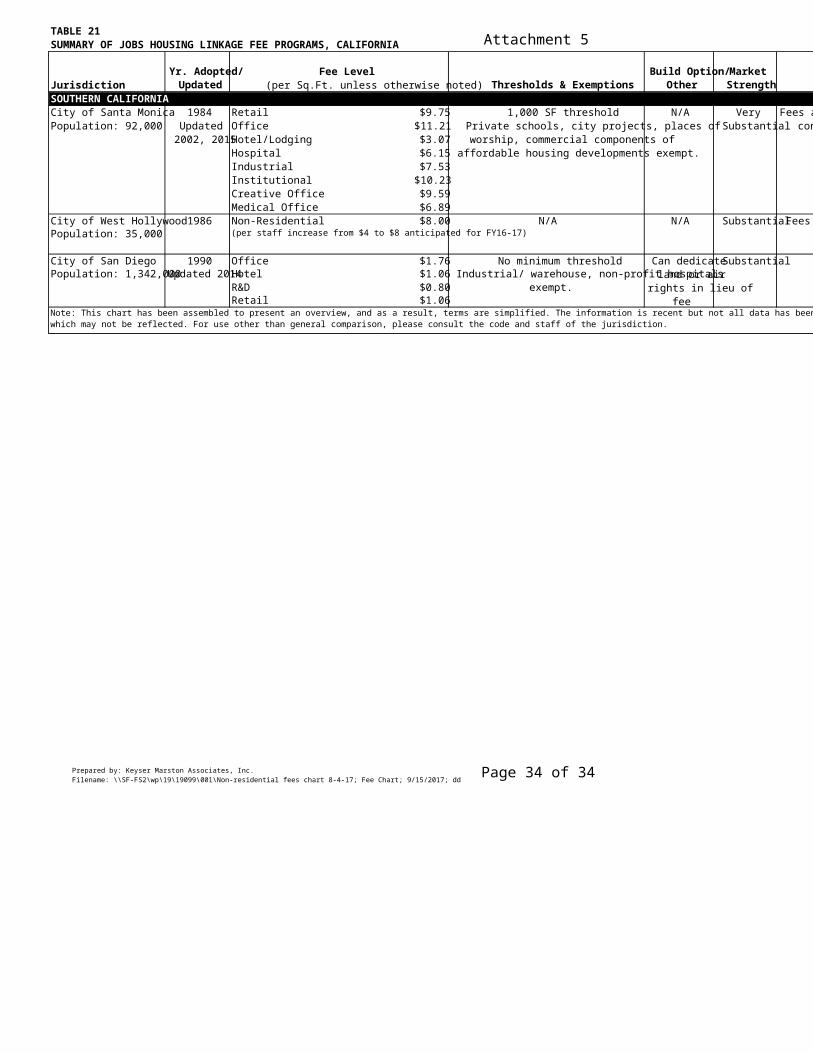
TABLE 21SUMMARY OF JOBS HOUSING LINKAGE FEE PROGRAMS, CALIFORNIA
JurisdictionYr. Adopted/
Updated Thresholds & ExemptionsBuild Option/
OtherMarket
StrengthFee Level
(per Sq.Ft. unless otherwise noted)SOUTHERN CALIFORNIACity of Santa Monica 1984 Retail $9.75 1,000 SF threshold N/A VeryPopulation: 92,000 Updated Office $11.21 Substantial
2002, 2015Hotel/Lodging $3.07Hospital $6.15Industrial $7.53Institutional $10.23Creative Office $9.59Medical Office $6.89
City of West Hollywood 1986 Non-Residential $8.00 N/A N/A SubstantialPopulation: 35,000 (per staff increase from $4 to $8 anticipated for FY16-17)
City of San Diego 1990 Office $1.76 No minimum threshold SubstantialPopulation: 1,342,000 Hotel $1.06
R&D $0.80Retail $1.06
Industrial/ warehouse, non-profit hospitals exempt.
Private schools, city projects, places of worship, commercial components of
affordable housing developments exempt.
Updated 2014
Fees adjusted by CPI annually
Note: This chart has been assembled to present an overview, and as a result, terms are simplified. The information is recent but not all data has been updated as of the date of this report. In some cases, fees are adjusted by an index (such as CPI) which may not be reflected. For use other than general comparison, please consult the code and staff of the jurisdiction.
Can dedicate land or air
rights in lieu of fee
Fees adjusted annually based on construction cost index.
Prepared by: Keyser Marston Associates, Inc.Filename: \\SF-FS2\wp\19\19099\001\Non-residential fees chart 8-4-17; Fee Chart; 9/15/2017; dd
Attachment 5
Page 34 of 34