Embed Size (px)
Citation preview

Ma
rke
t sum
ma
ries
FOOD OUTLOOKJUNE 2017
FAO’s latest forecasts for the 2016/17 season (October/
September) point towards an easing of the supply and
demand balance for oilseeds and oilcrop products.
Driven by outstanding yield levels, global oilseed
production is expected to leap to an all-time high in 2016/17.
Much of the anticipated rise will be on account of soybeans,
with favourable growing conditions boosting output in almost
all key producing countries. Global rapeseed production,
by contrast, is expected to post further losses, due to lower
plantings and adverse weather. Palm oil production is set to
rebound in 2017, as palms in Southeast Asia recover from
the protracted effects of dry weather in 2015–2016. On
aggregate, the current forecasts translate into a marked
expansion in global output of oilcrop products. However,
growth in total availabilities – especially of oils/fats – would be
less pronounced due to relatively low carry-in stocks.
On the demand side, relatively sluggish growth in
oils/fats consumption is expected to continue, reflecting
limited total supplies and/or modest economic growth in some
countries, together with slowing demand from the biodiesel
sector worldwide. More robust growth is observed in meal
consumption, supported by steady demand from the livestock
sector. With production of oilseed products anticipated
to exceed utilization, especially in the case of meals/cakes,
sizeable replenishments in global stocks are expected, resulting
in higher stock-to-use ratios. Responding to the positive supply
and demand outlook, international prices of oilseeds and
oilseeds products embarked on a downward trend towards
the middle of the 2016/17 season.
Highly tentative projections for the 2017/18 season,
which starts in October 2017, indicate that global oilseed
production could match the current season’s record. The
forecasts translate into a record output of oils/fats, while
meals/cakes output could slip below the current season’s all-
time high. Taking into account carry-in stocks and assuming
a continuation in current utilization trends, the supply and
demand balance for oils/fats could ease further, while markets
for meals/cakes should remain well supplied – thus providing
scope for oilseed and oilseed product prices to stabilize at their
current relatively low levels in the coming months.
OILCROPS
Contact:[email protected]
FAO - Trade and Markets DivisionFood Outlook June 2017
Summary

Ma
rke
t a
sse
ssm
en
ts
34 FOOD OUTLOOKJUNE 2017
Major Oilseed Exporters and Importers
Major ExportersMajor Importers
Figure 1. FAO monthly international price indices for oilseeds, vegetable oils and meals/cakes (2002-2004=100)
OILCROPS, OILS AND MEALS 1
1 Almost the entire volume of oilcrops harvested worldwide is crushed to obtain oils and fats for human nutrition or industrial purposes, and to obtain cakes and meals that are used as feed ingredients. Therefore, rather than referring to oilseeds, the analysis of the market situation is mainly undertaken in terms of oils/fats and cakes/meals. Production data for oils and meals are derived from domestic production of the relevant oilseeds in a specific year, i.e. they do not reflect the outcome of actual oilseed crushing in a given country and period. Regarding oilseed trade, situations where oilseeds are produced in one country but crushed in another one are reflected in national oil/meal consumption figures. It is important to note that data on trade in oils (meals) refer to the sum of trade in oils (meals) plus the oil (meal) equivalent of oilseeds traded. Similarly, stock figures for oils (meals) refer to the sum of oil (meal) stocks plus the oil (meal) equivalent of oilseed inventories.
PRICES 2
Prices for oilseeds and derived products under downward pressure
After temporarily strengthening during the initial months
of the 2016/17 (October/September) season, international
quotations for oilseeds and derived products embarked on
a downward trend towards February 2017, responding to
an increasingly positive supply and demand outlook. By
the end of April 2017, all three FAO price indices (tracking
international oilseed, oilmeal and vegetable oil prices) had
posted marked drops.
With regard to oilseeds, the drop in FAO’s monthly price
index towards February 2017 primarily reflects a sharp
fall in international soybean values. The price decline was
triggered by much improved prospects for South America’s
2 For details on prices and corresponding indices, see Appendix table 23.
2016/17 soybean harvest and indications that sowings for
the United States’ 2017/18 soybean crop could surge to
unprecedented levels, which both pointed to increasingly
abundant levels of global supply. At the same time,
rapeseed quotations also started easing on account of
larger than anticipated old-crop supplies and indications
that global production would recover in 2017/18. As for
meals/cakes, the recent slide in FAO’s oilmeal price index
mainly reflects two developments: i) the fact that global
soybean crushing was predominantly oriented towards
100
150
200
250
300
20172016201520142013201220112010
Meals/cakesVegetable oils
Oilseeds

35FOOD OUTLOOKJUNE 2017
OILC
RO
PS, O
ILS AN
D M
EA
LS
Figure 5. CBOT soybean futures for SeptemberFigure 2. FAO monthly price index for oilseeds (2002-2004=100)
Figure 4. FAO monthly price index for vegetable oils (2002-2004=100)
Figure 3. FAO monthly price index for oilmeals/cakes (2002-2004=100)
oil production (to compensate for poor output of other
vegetable oils), which inevitably led to a surplus in soymeal
stocks; and ii) rising competition from attractively priced
feed grains. As regards oils/fats, the sharp drop in FAO’s
price index for vegetable oils from February onward was
prompted by the concurrence of: i) firm gains in palm
oil output, which eased the former tightness in global
supplies; ii) an acceleration in global soybean crushing;
iii) a deceleration in global import demand; and iv) slower
vegetable oil uptake by biodiesel producers.
The much improved and possibly excessive supplies in
2016/17, along with first indications of a possible repeat
of bumper oil and meal outputs in 2017/18, suggests that
prices in the oilcrop complex could ease further over the
coming months. The recent contraction in the Chicago
Board of Trade (CBOT) futures prices for soybeans points
into the same direction, showing that, from mid-April 2017
onward, contracts traded below last year’s corresponding
values.
OILSEEDS
Record 2016/17 production confirmed After last season’s contraction, global oilseed production
is expected to leap to an all-time high in 2016/17,
owing primarily to outstanding yield levels. Much of the
anticipated rise would be on account of soybean, followed,
at some distance, by sunflowerseed, groundnut, cottonseed
and palmkernel. Rapeseed production, by contrast, is
bound to drop for the third consecutive year.
Global soybean production is forecast to climb by a
whopping 35 million tonnes, driven almost entirely by yield
improvements. In the Northern Hemisphere, production
has expanded in all key producing countries, led by the
130
150
170
190
2014/15
2016/17
2015/16
SAJJMAMFJDNO
140
170
200
230
2015/16
2014/15
2016/17
SAJJMAMFJDNO
300
320
340
360
380
400USD per tonne
S O N D J F M A M
2017 values
2015 values 2016 values130
140
150
160
170
180
2016/17
2014/15
2015/16
SAJJMAMFJDNO

Ma
rke
t a
sse
ssm
en
ts
36 FOOD OUTLOOKJUNE 2017
Note: The split years bring together northern hemisphere annual crops harvested in the latter part of the first year shown, with southern hemisphere annual crops harvested in the early part of the second year shown. For tree crops, which areproduced throughout the year, calendar year production for the second year shown is used.
2014/15 2015/16 2016/17 f’cast
Change 2016/17
over 2015/16
million tonnes %
Soybeans 319.8 314.6 349.8 11.2
Rapeseed 71.1 70.1 69.6 -0.7
Cottonseed 45.3 37.6 39.9 6.0
Groundnuts (unshelled) 38.1 37.9 41.4 9.3
Sunflower seed 41.7 43.0 48.0 11.4
Palm kernels 15.4 14.6 16.1 10.1
Copra 5.8 5.4 5.8 8.2
Total 536.9 523.0 570.3 9.0
Table 1. World production of major oilcrops
United States, which, at over 117 million tonnes, is
set to remain the world’s top producer. Owing to near-
ideal growing conditions, US average yields climbed to
3.5 tonnes per hectare. Record or near-record yields have
also driven production gains in Canada, India, the EU and
the CIS. In China, by contrast, higher production has been
achieved through an expansion in plantings, as soybean
growers enjoyed increased support payments relative to
producers of competing crops, notably maize. In South
America, production is anticipated to more than recover
from last season’s drop, probably climbing to an all-time
record. The rise will be led by Brazil, with output pegged
at 113 million tonnes, as exceptionally favourable growing
conditions boosted yields. However, in Argentina, output
could plateau at last year’s level due to lower plantings and
because excessive rainfalls towards the end of the growing
season may leave up to 1 million ha unharvested.
World rapeseed production could slide to a four-year
low. Production has dropped in the EU and China, fuelled
by, respectively, adverse weather and lower plantings. In
Canada, where record yields have offset a contraction in
area, production remained virtually unchanged. By contrast,
output in Australia and India received a boost from high
yields, which, in India’s case, was helped by a rebound in
plantings.
Underpinned by records in both sowings and yields,
global sunflowerseed output is heading towards an all-time
high. Production has expanded in the major producing
countries, with Ukraine and the Russian Federation taking
the lead. While in the EU beneficial weather conditions
facilitated a recovery in output, in Argentina the effects of
adverse weather should be offset by larger sowings.
Global groundnut output is also pegged to achieve
a record-high, following a strong rebound in plantings
combined with yield improvements. In the world’s two
leading producers, China and India, crops benefitted from
both larger plantings and good weather, offsetting losses
in the United States, where output dropped on reduced
sowings as well as hot and dry weather. As to cottonseed,
considerable production gains are reported from the
United States, Brazil, Pakistan and Australia, although
output is likely to remain flat in the two leading producers,
China and India. Global palmkernel and copra outputs are
expected to recover from last season’s multi-year lows, with
improvements concentrated in Southeast Asia.
OILS AND FATS 3
Global oils/fats production to resume growing in 2016/17 The above crop estimates translate into a 7 percent
expansion in global oils/fats production in 2016/17. Palm
oil and soyoil are expected to expand the most, followed by
sunflower, palmkernel and groundnut oils – while rapeseed
oil could see a third consecutive contraction and olive oil
could be subject to a cyclical setback. Palm oil production,
which posted losses in 2016 due to El Niño, is set to
rebound in 2017 as palms in Indonesia and Malaysia
recover from the protracted effects of dry weather in 2015–
2016. The recovery is expected to be more pronounced in
Indonesia, with domestic output climbing to a new record,
while in Malaysia production might merely return to the
level of two years ago.
Global oils/fats supplies, which comprise 2016/17
production and 2015/16 ending stocks, are forecast to
post a 4 percent year-on-year gain, with reduced carry-
in inventories limiting growth. Domestic availabilities are
envisaged to expand in several major producing countries,
in particular Brazil, Indonesia, the United States and
Malaysia, but also in India, the Russian Federation,
Australia and Ukraine. On the other hand, sizeable
contractions are expected in the world’s two leading oils/
fats importers – the EU, where domestic availabilities are
forecast to drop to multi-year lows on subdued production
and lower carry-in stocks, and China because of reduced
opening stocks. Modest supply contractions are also
expected in Argentina and Canada, underpinned by low
carry-in stocks.
3 This section refers to oils from all origins, which – in addition to products derived from the oil crops discussed under the section on oilseeds – includes palm oil, marine oils as well as animal fats.

37FOOD OUTLOOKJUNE 2017
OILC
RO
PS, O
ILS AN
D M
EA
LS
Note: Refer to footnote 1 on page 34 for overall definitions and methodology.1 Includes oils and fats of vegetable, animal and marine origin.2 Production plus opening stocks.3 Residual of the balance.4 Trade data refer to exports, based on a common October/September
marketing season.5 Major exporters include Argentina, Brazil, Canada, Indonesia, Malaysia,
Ukraine and the United States.6 All meal figures are expressed in protein equivalent; meals include all meals
and cakes derived from oilcrops as well as meals of marine and animal origin.7 Major exporters include Argentina, Brazil, Canada, India, Indonesia, Malaysia,
Paraguay, the Russian Federation, Ukraine, the United States and Uruguay.
Table 2. World oilcrop and product market ata glance
2014/15 2015/16 2016/17 f’cast
Change: 2016/17
over 2015/16
million tonnes %
TOTAL OILCROPS
Production 548.8 534.6 581.6 8.8
OILS AND FATS 1
Production 210.9 205.6 220.6 7.3
Supply 2 247.2 244.4 254.7 4.2
Utilization 3 205.5 211.5 216.9 2.6
Trade 4 114.5 115.3 121.6 5.4
Global stock-to-use ratio (%) 18.9 16.1 16.5
Major exporters stock-to-disappearance ratio (%) 5
10.9 9.7 10.4
MEALS AND CAKES 6
Production 141.2 137.8 151.8 10.2
Supply 2 162.8 163.9 176.6 7.8
Utilization 3 133.4 139.0 146.1 5.1
Trade 4 86.7 90.4 95.7 5.8
Global stock-to-use ratio (%) 19.5 17.8 19.5
Major exporters stock-to-disappearance ratio (%) 7
11.1 10.8 12.9
FAO PRICE INDICES (Oct/Sept) (2002-2004=100)
2014/15 2015/16 2016/17 (Oct-May)
Change: Oct-May 2017
over Oct-May 2016
%
Oilseeds 155 151 156 6.2
Oilmeals/cakes 194 168 163 1.8
Vegetable oils 153 155 174 15.6
Growth in oils/fats consumption to remain subdued in 2016/17 Global consumption of oils/fats is expected to post – for
the second year in succession – a relatively modest year-
on-year increase of 2.5 to 3 percent. Limited supplies and
protracted slow economic growth in a number of countries
continue to contain global demand expansion. With
regard to individual oils, soy and palm oils are set to lead
consumption growth. Soyoil uptake is expected to expand
the most, supported by record supplies and price discounts
relative to other vegetable oils. Palm oil consumption is
envisaged to expand at below-average rates, reflecting
subdued supply growth and smaller than usual price
discounts. Sizeable growth is also expected for sunflower
and groundnut oils, given pronounced production gains
in the respective seeds. Conversely, the consumption of
rapeseed oil, the world’s third most consumed oil, could
remain flat due to the persistent supply tightness.
In general, population and income growth remain
the key drivers behind the growing demand for oils/
fats for traditional food and non-food uses. Demand by
the biodiesel industry is expected to play a more limited
role compared with past years, hence contributing to
weaker overall growth. In 2017, increases in mandatory
consumption targets and blending rates for biodiesel are
expected to be less pronounced and will concern only a few
countries, notably the United States, Brazil and, possibly,
Malaysia. Moreover, in a number of countries, support
measures for biodiesel producers are being reviewed, while
in others, barriers to trade in biodiesel remain in place or
are under consideration – raising uncertainty among market
players. Furthermore, persistently high price premiums
of vegetable oils relative to mineral oil continue to erode
the profitability of discretionary blending of diesel with
vegetable oil-based biodiesel.
Developing nations in Asia continue to drive growth in
oils/fats consumption, with sustained economic growth
prevailing in the region as a whole. Consumption gains are
led by India, which enjoys steady economic growth and
rising domestic oils/fats supplies. As a result, India, as well
as other Asian countries, could see further improvements in
per caput consumption. In Malaysia and Indonesia, where
total uptake suffered a setback last year, consumption is
seen expanding as higher domestic availabilities trigger
fresh demand for industrial uses. In China, by contrast,
consumption expansion could be tempered – for the
second consecutive year – by weaker economic growth.
Elsewhere, bumper supplies are envisaged to support
higher usage in Brazil and the United States. In other
developed countries, growth rates should linger around
1 percent, except in the EU and Canada, where lower
domestic availabilities could result in contractions.
Global inventories of oils/fats to expand moderately Unlike last season, when a shortfall of global production
relative to demand led to a contraction in inventories, in
2016/17, a production surplus should permit a rebuilding
of stocks. Year-on-year, ending stocks (including the oil
contained in stored oilseeds) are forecast to rise by about
5 percent to 35.8 million tonnes. Commodity-wise, sizeable
replenishments in palm and soy oil stocks are expected to
Ma
rke
t a
sse
ssm
en
ts
38 FOOD OUTLOOKJUNE 2017
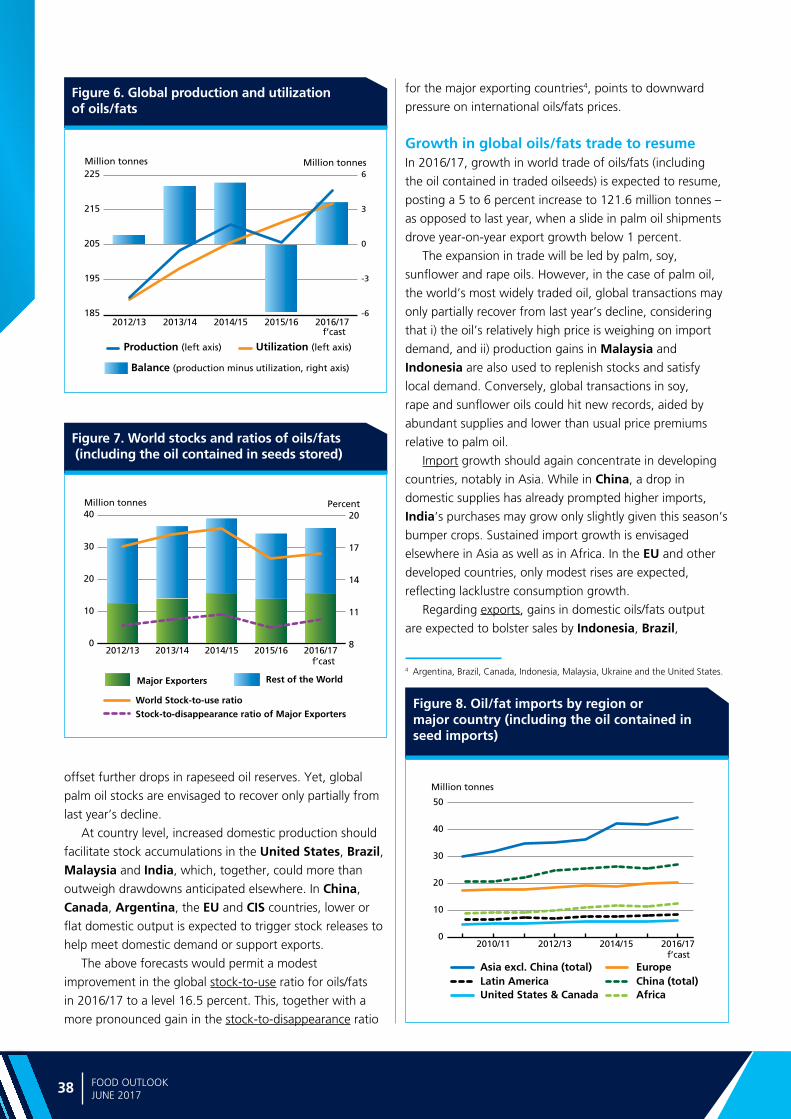
Figure 7. World stocks and ratios of oils/fats (including the oil contained in seeds stored)
Figure 6. Global production and utilizationof oils/fats
Figure 8. Oil/fat imports by region or major country (including the oil contained in seed imports)
offset further drops in rapeseed oil reserves. Yet, global
palm oil stocks are envisaged to recover only partially from
last year’s decline.
At country level, increased domestic production should
facilitate stock accumulations in the United States, Brazil, Malaysia and India, which, together, could more than
outweigh drawdowns anticipated elsewhere. In China,
Canada, Argentina, the EU and CIS countries, lower or
flat domestic output is expected to trigger stock releases to
help meet domestic demand or support exports.
The above forecasts would permit a modest
improvement in the global stock-to-use ratio for oils/fats
in 2016/17 to a level 16.5 percent. This, together with a
more pronounced gain in the stock-to-disappearance ratio
for the major exporting countries4, points to downward
pressure on international oils/fats prices.
Growth in global oils/fats trade to resumeIn 2016/17, growth in world trade of oils/fats (including
the oil contained in traded oilseeds) is expected to resume,
posting a 5 to 6 percent increase to 121.6 million tonnes –
as opposed to last year, when a slide in palm oil shipments
drove year-on-year export growth below 1 percent.
The expansion in trade will be led by palm, soy,
sunflower and rape oils. However, in the case of palm oil,
the world’s most widely traded oil, global transactions may
only partially recover from last year’s decline, considering
that i) the oil’s relatively high price is weighing on import
demand, and ii) production gains in Malaysia and
Indonesia are also used to replenish stocks and satisfy
local demand. Conversely, global transactions in soy,
rape and sunflower oils could hit new records, aided by
abundant supplies and lower than usual price premiums
relative to palm oil.
Import growth should again concentrate in developing
countries, notably in Asia. While in China, a drop in
domestic supplies has already prompted higher imports,
India’s purchases may grow only slightly given this season’s
bumper crops. Sustained import growth is envisaged
elsewhere in Asia as well as in Africa. In the EU and other
developed countries, only modest rises are expected,
reflecting lacklustre consumption growth.
Regarding exports, gains in domestic oils/fats output
are expected to bolster sales by Indonesia, Brazil,
4 Argentina, Brazil, Canada, Indonesia, Malaysia, Ukraine and the United States.
-6
-3
0
3
6
185
195
205
215
225
2016/172015/162014/152013/142012/13
Million tonnes Million tonnes
f’cast
Balance (production minus utilization, right axis)
Production (left axis) Utilization (left axis)
0
10
20
30
40
2016/172015/162014/152013/142012/138
11
14
17
20Million tonnes Percent
Major Exporters Rest of the World
World Stock-to-use ratio
Stock-to-disappearance ratio of Major Exporters
f’cast
0
10
20
30
40
50
2016/172014/152012/132010/11
Latin America
Asia excl. China (total) EuropeChina (total)
Million tonnes
United States & Canada Africa
f’cast

39FOOD OUTLOOKJUNE 2017
Figure 9. Oil/fat exports by major exporters (including the oil contained in seed exports)
OILC
RO
PS, O
ILS AN
D M
EA
LS
Ukraine, the Russian Federation and Australia, whereas
higher deliveries in Canada would mainly rest on stock
drawdowns. Shipments by Malaysia and Argentina
could remain flat, reflecting, respectively, increased local
requirements (including the need to replenish stocks),
and stagnating domestic production. Sales by the United States are forecast to remain close to last year’s all-time
high.
MEALS AND CAKES 5
Global supplies up in 2016/17, aided by large opening stocksBased on current crop forecasts, global meal/cake
production would more than recover from last season’s
setback. The anticipated 10 percent rise would rest strongly
on higher soybean meal output. While significant gains
are also envisaged for sunflower, groundnut, palmkernel
and fish meals, production of rapeseed meal is forecast to
contract further.
Global oilmeal supplies, which also include 2015/16
carry-over stocks, are seen expanding by 8 percent.
Underpinned by bumper harvests, extraordinary gains
are expected in Brazil, India and the United States, as
well as in some smaller producers, including Uruguay,
Paraguay, Australia and CIS countries. By contrast,
domestic availabilities should shrink in China and the EU,
reflecting, respectively, reduced carry-in stocks and lower
crop outturns.
5 This section refers to meals from all origins: in addition to products derived from the oilcrops discussed under the section on oilseeds, fish meal and meals of animal origin are also included.
World meal consumption to expand further in 2016/17 Global meal/cake consumption is forecast to hit a new
record in 2016/17, with a slight acceleration in annual
growth compared to last season. Consumption continues
to be supported by expanding demand from the livestock
sector. However, similar to last season, the availability
of bumper feed grain and DDGS (distiller’s dried grains
with solubles) supplies will continue to weigh on meal
consumption growth. Much of the anticipated expansion
would come from soybean meal, given record-high
availabilities. On the contrary, consumption of rape- and
cottonseed-meal should contract on lower availabilities.
Developing countries in Asia remain the main engine
of overall consumption growth, and the largest year-on-
year rise is expected in China, the world’s leading meal
consuming country. Interestingly, although China’s total
meat production may contract in 2017, the uptake of
meals by the country’s pig and poultry sectors is forecast
to expand further, given the on-going shift from small-
scale backyard production to industrial-scale compound
feed-based rearing methods. In addition, quality issues with
the country’s feed grain supplies could provide separate
support to meal demand. Elsewhere in Asia, consumption
is expected to expand at average or above-average rates,
including in India, Pakistan, the Philippines, Thailand,
Turkey and Viet Nam. Higher consumption is also
envisaged in Brazil and Argentina, spurred by record
high domestic availabilities, whereas, in the United States
and the EU, demand growth should be constrained by
burgeoning feed grain supplies.
0
10
20
30
2015/16 estimate
2016/17 forecast
Million tonnes
USAIndonesiaCanada MalaysiaArgentina Brazil
Figure 10. Global production and utilization of meals/cakes (in protein equivalent)
-5
0
5
10
115
130
145
160
2016/172015/162014/152013/142012/13
Million tonnes Million tonnes
f’cast
Balance (production minus utilization, right axis)
Production (left axis) Utilization (left axis)

Ma
rke
t a
sse
ssm
en
ts
40 FOOD OUTLOOKJUNE 2017
Figure 11. World stocks and ratios of meals/cakes (in protein equivalent and including the meal contained in seeds stored)
Global inventories possibly hitting new recordIn 2016/17, meal output is expected to outstrip
consumption – the reverse of last year, when global
production fell short of demand. If confirmed, the
portended production surplus should prompt a surge in
global end-of-season inventories. In particular, reserves
of the world’s leading protein meal, soymeal, are
forecast to swell to unprecedented levels. Estimated at
56 million tonnes (including the meal contained in stored
soybeans), soymeal carry-over stocks would exceed the
level recorded in recent years by a considerable margin.
Reserves of all other meals, including fishmeal, are also set
to rise – with the exception of rapeseed meal, whose stocks
could contract further.
Stock replenishments will be concentrated in the
United States and Brazil, where bumper crops are set
to boost domestic reserves. In both countries, carry-over
inventories could almost double compared with last year,
marking multi-year highs. Those increases should by far
offset the reductions expected in Argentina and the EU,
where stock drawdowns are required to cover for reduced
domestic supplies.
Based on the above forecasts, marked improvements
are expected in both the global stock-to-use ratio and
the stock-to-disappearance ratio for the major exporters6,
thus providing scope for international oilmeal prices to
weaken.
6 Argentina, Brazil, Canada, India, Indonesia, Malaysia, Paraguay, the Russian Federation, Ukraine, the United States and Uruguay.
0
10
20
30
2016/172015/162014/152013/142012/135
10
15
20Million tonnes Percent
Major Exporters Rest of the World
World Stock-to-use ratio
Stock-to-disappearance ratio of Major Exporters
f’cast
Figure 13. Meal/cake exports by major exporters (in protein equivalent and including the meal contained in seed exports)
Global meal trade to expand furtherInternational trade in meals/cakes – including the meal
contained in traded oilseeds – is estimated to post an about-
average 6 percent increase in 2016/17. Thanks to large
supplies and competitive prices, soybean meal is expected to
lead the expansion, aided by rape, sunflower and fish meals.
With regard to imports, Asian countries continue to
dominate the market – with China alone accounting for
one-third of global imports. To satisfy fast growing domestic
demand and given stalling domestic supplies, China’s meal
imports (mostly in the form of whole soybeans) are forecast
to expand by around 8 percent. Robust import growth is also
anticipated in other parts of Asia, where livestock industries
tend to increasingly rely on imported meals. Elsewhere,
Figure 12. Meal/cake imports by region or major country (in protein equivalent and including the meal contained in seed imports)
0
7
14
21
28
35
2016/172014/152012/132010/11
Latin America Asia excl. China (total) Europe
China (total)
Million tonnes
United States & Canada Africa
f’cast
0
10
20
30
2015/16 estimate2016/17 forecast
Million tonnes
USACanada India ParaguayArgentina Brazil

41FOOD OUTLOOKJUNE 2017
OILC
RO
PS, O
ILS AN
D M
EA
LS
purchases are envisaged to bounce up in Argentina (a
net exporter of meals), as the Government simplified the
procedures for importing soybeans destined for subsequent
exportation in the form of meal and oil. As for developed
countries, purchases by the EU, the world’s second largest
buyer after China, could stall in 2016/17, owing to the
availability of large feedgrain supplies.
Export growth is expected to concentrate in
South America, although sizeable increases are also likely
in the United States, India and CIS countries. Bolstered by
bumper soybean harvests, shipments by the world’s top
exporter, Brazil, could swell to 63.3 million tonnes (including
the meal contained in soybean sales). Domestic supplies
would support even larger shipments, but a relatively strong
Real vis-à-vis the US dollar has affected the competitiveness
of Brazil’s exports. Also sales by the United States, the
second largest exporter, are set to expand further, spurred
by a record soybean harvest. Deliveries by the world’s third
largest supplier, Argentina, could stabilize around last year’s
record level, given the portended plateauing in domestic soy
production. Elsewhere, domestic supply gains should support
a rebound in shipments from India, Ukraine and the
Russian Federation, while, in Canada, higher sales would
depend on the release of old-crop inventories.
2017/18 PRODUCTION OUTLOOK
With the 2016/17 season still ongoing, it is too early to
draw firm forecasts for world oilseeds supply and demand
in 2017/18. Currently available information is limited to
planting intentions in some Northern Hemisphere countries,
where preparations for the next crop year have started.
While the current season’s relatively ample supply-and-
demand balance would suggest that there may be limited
scope for increased oilcrop plantings in 2017/18, farmers’
planting decisions will be strongly influenced by the price
relationships between oilcrops and competing arable crops,
notably coarse grains and wheat. Considering that the
currently prevailing price structure tends to favour oilseeds
over rival crops, a further expansion in global oilcrop
sowings seems possible. However, such area expansions
would not necessarily lead to corresponding rises in output
because, based on the assumption of normal weather
conditions, crop yields should revert to historic trend
levels – as opposed to the peaks recorded in 2016/17.
With regard to individual crops, 2017/18 could see a
recovery in global rapeseed production as well as further
gains in groundnut, cotton, oil palm and coconut products.
However, these gains could be offset by a drop in world
soybean and sunflowerseed output. Global soybean
production could trail behind the current season’s all-time
record. The effect of additional area expansion in key
producing countries – triggered primarily by a favourable
soybean-maize price relationship – may well be outweighed
by a retreat of average yields to trend values, a scenario
that is particularly expected to apply to the United States,
Brazil and Paraguay. Meanwhile, in Argentina and India,
production could remain almost unchanged as area and
yield effects might offset each other. Only in Canada and
China production might expand on increased plantings,
while yields could remain close to last year’s average levels.
Global sunflowerseed production may shrink from the
current season’s extraordinary result. Year-on-year changes
are primarily expected in Ukraine, where contractions in
both area and yields could drive down production, and the
EU, where yield improvements, together with small gains in
area, could facilitate a rebound in output. Global rapeseed
output is expected to recover after three consecutive drops,
possibly climbing to an all-time record. Sizeable production
improvements are envisaged for Canada and Ukraine,
underpinned by area gains, as well in the EU, owing to
more favourable weather conditions. By contrast, China’s
rapeseed output could shrink further as farmers keep
reducing plantings in response to cuts in public support,
while Australia’s output could decline as yields revert
to trend levels. For both groundnut and cottonseed, it is
predicted that potential output gains would concentrate
in China, India and the United States. Normal weather
conditions could also facilitate fresh production gains in
coconut and, more importantly, oil palm products, with
year-on-year gains in Indonesia and Malaysia projected at
5 to 6 percent.
Based on the above highly tentative forecasts, the
world’s aggregate 2017/18 oilcrop production would
basically match the current seasons’ record level. The
new-season crop forecasts would translate into a record
output of oils/fats (thanks mainly to palm and rapeseed
oil), while global oilmeal production would fall slightly
from the current season’s peak. Assuming a continuation
of current utilization trends, in 2017/18, global oil output
would exceed demand for the second year in succession,
possibly facilitating fresh replenishments in stocks and
further improvement in fundamentals. By contrast, oilmeal
production would fall short of global demand, requiring
releases in inventories, in particular of high meal-yielding
soybeans. However, thanks to record-high carry-over stocks
of soybean and soymeal, the portended production deficit
should not result in tighter oilseeds and product balances.
Accordingly, the current outlook provides scope for
international oilseed, oil and meal prices to stabilize at their
current relatively low level during the coming months –
barring unexpected supply shocks.

Ma
jor p
olicy d
eve
lop
me
nts
88 89FOOD OUTLOOKJUNE 2017
OIL
CRO
PS:
MA
JOR
POLI
CY D
EVEL
OPM
ENTS
MID
-SEP
TEM
BER
2016
TO
MID
-MA
Y 2
017*
CO
UN
TRY
/INST
ITU
TIO
NPR
OD
UC
TD
ATE
POLI
CY
CA
TEG
OR
Y/IN
STR
UM
ENT
DES
CR
IPTI
ON
Alg
eria
Soym
eal
Ap
r-17
Tax
po
licy
Rai
sed
val
ue-
add
ed t
ax (
VA
T) o
n s
elec
ted
gra
in a
nd
fee
d p
rod
uct
s –
incl
ud
ing
imp
ort
ed s
oyb
ean
mea
l.
Arg
enti
na
Soyb
ean
, so
yoil,
so
ymea
lO
ct-1
6Ex
po
rt p
olic
yPo
stp
on
ed t
he
pla
nn
ed r
edu
ctio
n in
exp
ort
tax
es f
or
soyb
ean
, so
yoil
and
so
ymea
l to
201
8–20
19.
Mea
nw
hile
, sta
rtin
g M
arch
201
7, s
oy
gro
wer
s in
th
e co
un
try’
s 10
no
rth
ern
pro
vin
ces
will
be
pro
vid
ed
wit
h a
n e
xpo
rt t
ax r
efu
nd
eq
uiv
alen
t to
5 p
erce
nt
of
the
free
-on
-bo
ard
so
ybea
n p
rice
.
Oliv
e o
il, s
un
flo
wer
oil
Jan
-17
Exp
ort
po
licy
Mo
difi
ed e
xpo
rt r
ebat
es f
or
a w
ide
ran
ge
of
valu
e-ad
ded
ag
ricu
ltu
ral p
rod
uct
s, in
clu
din
g o
live
and
su
nfl
ow
er o
il, w
ith
a v
iew
to
su
pp
ort
reg
ion
al r
ura
l eco
no
mie
s an
d s
tren
gth
en t
hei
r ex
po
rt
com
pet
itiv
enes
s.
Soyb
ean
Jan
-17
Tran
spo
rtat
ion
po
licy
Aw
ard
ed c
on
trac
ts t
o la
y tr
ain
tra
cks
in t
he
no
rth
ern
pro
vin
ces
of
Juju
y an
d S
alta
, in
a b
id t
o s
tim
ula
te
pro
du
ctio
n a
nd
mar
keti
ng
of
soyb
ean
s an
d o
ther
pro
du
cts
in o
ne
of
the
cou
ntr
y's
po
ore
st r
egio
ns.
Soyb
ean
Mar
-17
Ag
ricu
ltu
ral p
olic
yIn
tro
du
ced
su
pp
ort
pay
men
ts f
or
soyb
ean
pro
du
cers
in t
he
cou
ntr
y's
dis
adva
nta
ged
no
rth
ern
reg
ion
s.
Bo
livia
Soyb
ean
Mar
-17
Exp
ort
po
licy
Exp
and
ed t
he
cou
ntr
y's
ann
ual
so
ybea
n e
xpo
rt q
uo
ta t
o 4
00 0
00 t
on
nes
, to
pro
mo
te f
ore
ign
sal
es w
hile
en
suri
ng
th
at d
om
esti
c co
nsu
mp
tio
n n
eed
s ar
e m
et.
Bra
zil
Ag
ricu
ltu
ral c
rop
sJa
n-1
7A
gri
cult
ura
l po
licy
Lau
nch
ed a
pre
-cro
p fi
nan
cin
g s
chem
e fo
r th
e 20
17/1
8 se
aso
n, a
llow
ing
med
ium
-siz
ed p
rod
uce
rs t
o
pu
rch
ase
agri
cult
ura
l in
pu
ts a
t a
pre
fere
nti
al in
tere
st r
ate.
Bu
rkin
a Fa
soSo
ybea
nFe
b-1
7Se
cto
r d
evel
op
men
tLa
un
ched
a p
roje
ct t
o d
evel
op
th
e d
om
esti
c so
ybea
n s
ecto
r fo
cusi
ng
on
: i)
rais
ing
pro
du
ctiv
ity
and
yi
eld
s in
th
e fi
eld
, ii)
str
eng
then
ing
pro
du
cer
org
aniz
atio
ns,
iii)
co
nso
lidat
ing
th
e p
roce
ssin
g s
ecto
r, iv
) cr
eati
ng
a n
atio
nal
so
ybea
n a
sso
ciat
ion
an
d v
) es
tab
lish
ing
a s
ecto
r d
evel
op
men
t fu
nd
.
Can
ada/
Eu
rop
ean
Un
ion
Rap
esee
d o
ilO
ct-1
6Tr
ade
agre
emen
tsSi
gn
ed b
ilate
ral C
om
pre
hen
sive
Eco
no
mic
an
d T
rad
e A
gre
emen
t (C
ETA
), o
pen
ing
th
e w
ay f
or
the
acco
rd’s
pro
visi
on
al a
pp
licat
ion
an
d f
or
form
al r
atifi
cati
on
s b
y n
atio
nal
par
liam
ents
. Un
der
th
e ac
cord
, ta
riff
s o
n C
anad
ian
rap
esee
d o
il en
teri
ng
th
e EU
will
be
elim
inat
ed.
Can
ada
Oils
eed
s, g
rain
sN
ov-
16Tr
ansp
ort
atio
n p
olic
yPr
op
ose
d t
o r
epla
ce t
emp
ora
ry m
easu
res
to e
nsu
re e
ffici
ent
rail
mo
vem
ent
of
gra
ins
and
oils
eed
s to
th
e co
un
try’
s ex
po
rt h
ub
s w
ith
per
man
ent
solu
tio
ns.
Satu
rate
d f
atN
ov-
16H
ealt
h p
olic
yPr
op
ose
d c
han
ges
to
fro
nt-
of-
pac
kag
e la
bel
ling
fo
r fo
od
s h
igh
in n
utr
ien
ts t
hat
are
of
a p
ub
lic h
ealt
h
con
cern
, in
clu
din
g s
atu
rate
d f
at.
Edib
le o
ilsA
pr-
17Fo
od
sta
nd
ard
s an
d s
afet
y Pr
op
ose
d t
o b
an t
he
use
of
par
tial
ly h
ydro
gen
ated
oils
in f
oo
ds
by
sum
mer
201
8, t
o a
chie
ve t
he
pu
blic
h
ealt
h o
bje
ctiv
e o
f re
du
cin
g c
on
sum
ers’
inta
ke o
f h
arm
ful t
ran
s fa
t.
Gly
ph
osa
teA
pr-
17H
ealt
h p
olic
yD
eter
min
ed t
hat
gly
ph
osa
te –
a h
erb
icid
e w
idel
y u
sed
in t
he
cult
ivat
ion
of
oils
eed
s, o
ther
ara
ble
cro
ps
and
fru
its
– is
nei
ther
gen
oto
xic
no
r lik
ely
to p
ose
a h
um
an c
ance
r ri
sk, a
nd
th
at d
ieta
ry e
xpo
sure
as
soci
ated
wit
h u
se o
f th
e h
erb
icid
e is
no
t ex
pec
ted
to
po
se a
ris
k o
f co
nce
rn t
o h
um
an h
ealt
h.
Can
ada/
Ind
iaR
apes
eed
oil
Ap
r-17
Exp
ort
po
licy
Faci
litat
ed t
he
sig
nin
g o
f se
vera
l Mem
ora
nd
a o
f U
nd
erst
and
ing
bet
wee
n C
anad
ian
rap
esee
d o
il ex
po
rter
s an
d In
dia
n im
po
rter
s/re
taile
rs.
Ch
ina/
Can
ada
Rap
esee
dO
ct-1
6Im
po
rt p
olic
ySi
gn
ed a
bila
tera
l Mem
ora
nd
um
of
Un
der
stan
din
g t
o f
acili
tate
sm
oo
th im
po
rtat
ion
of
Can
adia
n
rap
esee
d in
to C
hin
a, w
hile
pre
ven
tin
g t
he
spre
ad o
f b
lack
leg
dis
ease
fro
m C
anad
a in
to C
hin
a.
Ch
ina
Soyb
ean
Oct
-16
Pub
lic p
rocu
rem
ent/
stat
e re
serv
esSu
spen
ded
go
vern
men
t au
ctio
ns
of
soyb
ean
fro
m s
tate
res
erve
s (a
fter
hav
ing
so
ld a
to
tal o
f 1.
57 m
illio
n t
on
nes
), in
ord
er t
o f
acili
tate
mar
keti
ng
of
the
new
201
6/17
cro
p.
Edib
le m
eals
Dec
-16
Foo
d s
tan
dar
ds
and
saf
ety
Co
nfi
rmed
th
at r
evis
ed s
tan
dar
ds
for
edib
le m
eals
der
ived
fro
m o
ilsee
ds
and
oth
er c
rop
s ar
e d
ue
to
com
e in
to f
orc
e o
n 2
3 Ju
ne
2017
.
GM
so
ybea
nD
ec-1
6G
MO
po
licy
Pro
hib
ited
, as
of
1 M
ay 2
017,
th
e cu
ltiv
atio
n, p
roce
ssin
g a
nd
sel
ling
of
GM
so
ybea
ns,
ric
e an
d m
aize
in
Hei
lon
gjia
ng
, Ch
ina’
s m
ain
gra
in p
rod
uci
ng
pro
vin
ce.
Dis
tille
r's
dri
ed g
rain
s w
ith
so
lub
les
(DD
GS)
Feb
-17
Imp
ort
po
licy
Exte
nd
ed a
nti
-du
mp
ing
an
d a
nti
-su
bsi
dy
du
ties
on
th
e im
po
rtat
ion
of
dis
tille
r’s
dri
ed g
rain
s w
ith
so
lub
les
(DD
GS)
fro
m t
he
Un
ited
Sta
tes
un
til J
anu
ary
2022
.

Ma
jor
po
licy
de
velo
pm
en
ts
90 91FOOD OUTLOOKJUNE 2017
CO
UN
TRY
/INST
ITU
TIO
NPR
OD
UC
TD
ATE
POLI
CY
CA
TEG
OR
Y/IN
STR
UM
ENT
DES
CR
IPTI
ON
Ch
ina
Soyb
ean
Feb
-17
GM
O p
olic
yG
ran
ted
imp
ort
ap
pro
val f
or
a n
ew G
M s
oyb
ean
var
iety
ch
arac
teri
zed
by
tole
ran
ce t
o b
oth
gly
ph
osa
te
and
iso
xafl
uto
le-b
ased
her
bic
ides
.
Rap
esee
d o
il M
ar-1
7Pu
blic
pro
cure
men
t/st
ate
rese
rves
End
ed g
ove
rnm
ent
auct
ion
s o
f ra
pes
eed
oil
fro
m s
tate
res
erve
s fo
r th
e 20
16/1
7 se
aso
n, a
fter
hav
ing
so
ld a
to
tal o
f 2.
08 m
illio
n t
on
nes
of
the
pro
du
ct.
Ag
ricu
ltu
ral c
rop
sA
pr-
17A
gri
cult
ura
l po
licy
An
no
un
ced
pla
ns
to in
tro
du
ce n
ew a
gri
cult
ura
l in
sura
nce
pro
gra
mm
es t
o c
om
pen
sate
far
mer
s fo
r cr
op
lo
sses
res
ult
ing
fro
m n
atu
ral d
isas
ters
. Co
vera
ge
wo
uld
be
off
ered
to
fam
ily f
arm
s, la
rge-
scal
e g
row
ers
and
far
mer
s’ c
oo
per
ativ
es.
Ara
ble
cro
ps
Ap
r-17
Ag
ricu
ltu
ral p
olic
y
Issu
ed g
uid
elin
es c
on
cern
ing
th
e re
dis
trib
uti
on
of
avai
lab
le a
rab
le la
nd
, as
par
t o
f th
e co
un
try’
s n
atio
nal
fo
od
sec
uri
ty s
trat
egy.
In o
rder
to
en
sure
th
e ef
fect
ive
dis
trib
uti
on
of
agri
cult
ura
l go
od
s ac
ross
th
e co
un
try,
du
rin
g t
he
nex
t th
ree
year
s, 6
0 m
illio
n h
a w
ou
ld b
e al
loca
ted
to
ric
e, w
hea
t an
d m
aize
, an
d 1
9 m
illio
n h
a to
so
ybea
ns,
rap
esee
d, c
ott
on
, su
gar
an
d r
ub
ber
.
Soyb
ean
, mai
zeA
pr-
17A
gri
cult
ura
l po
licy
Co
nfi
rmed
pla
ns
to m
od
ify
the
cou
ntr
y’s
cro
p s
tru
ctu
re, g
rad
ual
ly e
xpan
din
g s
oyb
ean
pro
du
ctio
n a
s w
ell a
s m
aize
pro
du
ctio
n f
or
sila
ge,
wh
ile r
edu
cin
g m
aize
pro
du
ctio
n f
or
gra
in.
Soym
eal
Ap
r-17
Fin
anci
al in
stru
men
tsA
pp
rove
d t
he
lau
nch
of
soym
eal o
pti
on
s co
ntr
acts
by
a p
riva
te c
om
mo
dit
y ex
chan
ge,
in o
rder
to
hel
p
the
pro
cess
of
pri
ce d
isco
very
an
d t
o p
rovi
de
agri
cult
ura
l co
mp
anie
s w
ith
flex
ible
ris
k m
anag
emen
t to
ols
.
Ag
ricu
ltu
ral g
oo
ds
May
-17
Tax
po
licy
An
no
un
ced
a r
edu
ctio
n in
th
e va
lue-
add
ed t
ax o
n a
gri
cult
ura
l go
od
s –
effe
ctiv
e 1
July
201
7 –
as p
art
of
on
go
ing
ref
orm
s to
sim
plif
y th
e co
un
try’
s ta
x st
ruct
ure
an
d s
tim
ula
te e
con
om
ic g
row
th. T
he
mea
sure
w
ill a
pp
ly t
o o
ilsee
ds
and
oils
eed
pro
du
cts,
wh
eth
er lo
cally
pro
du
ced
or
imp
ort
ed.
Soyb
ean
May
-17
Ag
ricu
ltu
ral p
olic
yA
nn
ou
nce
d t
he
con
tin
uat
ion
of
sub
sid
y p
aym
ents
fo
r so
ybea
n p
rod
uce
rs d
uri
ng
201
7/18
, in
a b
id t
o
enco
ura
ge
farm
ers
to m
ake
furt
her
red
uct
ion
s to
mai
ze p
lan
tin
gs.
Ecu
ado
rSo
ybea
n m
eal
Jan
-17
Imp
ort
po
licy
Exte
nd
ed t
arif
f an
d d
uty
exe
mp
tio
ns
for
soyb
ean
mea
l im
po
rts
fro
m a
ll o
rig
ins
un
til 3
1 D
ecem
ber
201
9.
Euro
pea
n U
nio
n
Bio
die
sel
Sep
-16
Trad
e d
isp
ute
Rec
eive
d n
oti
fica
tio
n f
rom
th
e EU
’s G
ener
al C
ou
rt t
hat
th
e an
ti-d
um
pin
g d
uti
es im
po
sed
on
bio
die
sel
imp
ort
s fr
om
Arg
enti
na
and
Ind
on
esia
infr
ing
ed o
n b
asic
reg
ula
tio
ns
and
sh
ou
ld b
e an
nu
lled
.
Bio
die
sel
Oct
-16
Trad
e d
isp
ute
Rec
eive
d n
oti
fica
tio
n f
rom
th
e W
TO t
hat
its
Ap
pel
late
Bo
dy
had
: i)
up
hel
d a
n e
arlie
r ru
ling
reg
ard
ing
th
e an
ti-d
um
pin
g d
uti
es t
he
EU im
po
sed
on
bio
die
sel i
mp
ort
s fr
om
Arg
enti
na,
an
d ii
) re
com
men
ded
b
rin
gin
g t
he
EU's
dis
pu
ted
tra
de
mea
sure
into
co
nfo
rmit
y w
ith
WTO
ru
les.
Bio
die
sel
Dec
-16
Trad
e d
isp
ute
Init
iate
d a
n in
vest
igat
ion
of
its
anti
-du
mp
ing
du
ties
on
bio
die
sel i
mp
ort
ed f
rom
Arg
enti
na
and
In
do
nes
ia, w
ith
a v
iew
to
ach
ievi
ng
fu
ll co
mp
lian
ce w
ith
WTO
ru
les.
Fatt
y al
coh
ols
Dec
-16
Tra
de
dis
pu
teR
ecei
ved
a m
ixed
ru
ling
fro
m t
he
WTO
dis
pu
te s
ettl
emen
t b
od
y, r
egar
din
g t
he
EU’s
an
ti-d
um
pin
g
mea
sure
s ag
ain
st im
po
rts
of
cert
ain
fat
ty a
lco
ho
ls f
rom
Ind
on
esia
. Th
e p
anel
rec
om
men
ded
th
at t
he
EU
bri
ng
its
mea
sure
s in
to c
on
form
ity
wit
h W
TO r
ule
s.
Rap
esee
dD
ec-1
6G
MO
po
licy
Exte
nd
ed b
y 3
year
s th
e p
has
ing
-ou
t p
erio
d f
or
trac
es o
f th
ree
ob
sole
te G
M r
apes
eed
var
ieti
es.
Oliv
e tr
eeFe
b-1
7D
isea
se c
on
tro
lLa
un
ched
a m
ult
idis
cip
linar
y re
sear
ch p
rog
ram
me
aim
ed a
t im
pro
vin
g t
he
pre
ven
tio
n, e
arly
det
ecti
on
an
d c
on
tro
l of
the
xyle
lla f
asti
dio
sa d
isea
se.
Her
bic
ide
Mar
-17
Pest
icid
e re
gu
lati
on
Pro
po
sed
to
co
nve
rt a
tem
po
rary
mo
rato
riu
m o
n b
ee-h
arm
ing
neo
nic
oti
no
id-b
ased
pes
tici
des
(w
hic
h
are
wid
ely
use
d o
n o
ilsee
ds
and
oth
er c
rop
s) in
to a
per
man
ent
ban
.
Oliv
e o
ilA
pr-
17Fo
od
sta
nd
ard
s an
d s
afet
yA
do
pte
d n
ew, m
ore
str
ing
ent
reg
ula
tio
ns
on
fo
od
saf
ety
and
insp
ecti
on
in o
rder
to
tac
kle
frau
du
len
t p
ract
ices
in t
he
foo
d in
du
stry
acr
oss
th
e EU
, in
clu
din
g t
he
oliv
e o
il se
cto
r.
Palm
oil
Ap
r-17
Envi
ron
men
tal p
olic
y
Rec
eive
d a
res
olu
tio
n f
rom
th
e Eu
rop
ean
Par
liam
ent
calli
ng
fo
r a
sin
gle
cer
tifi
cati
on
sch
eme
for
pal
m
oil
ente
rin
g t
he
EU m
arke
t, t
o e
nsu
re t
hat
th
e o
il is
pro
du
ced
in a
n e
nvi
ron
men
tally
su
stai
nab
le w
ay.
The
reso
luti
on
als
o p
rop
ose
d t
o p
has
e o
ut,
by
2022
, th
e u
se o
f ve
get
able
oils
rel
ated
to
def
ore
stat
ion
as
bio
die
sel f
eed
sto
ck.
Her
bic
ide
May
-17
Pest
icid
e re
gu
lati
on
Issu
ed a
pro
po
sal,
bas
ed o
n t
he
late
st s
cien
tifi
c re
sear
ch, t
o e
xten
d t
he
app
rova
l of
gly
ph
osa
te-b
ased
h
erb
icid
es f
or
ten
yea
rs, u
nti
l th
e en
d o
f 20
28.

Ma
jor p
olicy d
eve
lop
me
nts
90 91FOOD OUTLOOKJUNE 2017
*A
col
lect
ion
of m
ajor
pol
icy
deve
lopm
ents
sta
rtin
g in
Jan
uary
201
1 is
ava
ilabl
e at
: ht
tp://
ww
w.f
ao.o
rg/e
cono
mic
/est
/est
-com
mod
ities
/com
mod
ity-p
olic
y-ar
chiv
e/en
/?gr
oupA
ND
com
mod
ity=
Oils
eeds
,%20
oils
%20
and%
20m
eals
CO
UN
TRY
/INST
ITU
TIO
NPR
OD
UC
TD
ATE
POLI
CY
CA
TEG
OR
Y/IN
STR
UM
ENT
DES
CR
IPTI
ON
Fiji
Co
con
ut
Oct
-16
Rel
ief
mea
sure
sSe
t as
ide
fun
ds
for
the
reh
abili
tati
on
of
the
cou
ntr
y’s
coco
nu
t in
du
stry
fo
llow
ing
th
e d
amag
e in
flic
ted
b
y cy
clo
ne
Win
sto
n a
nd
rai
sed
do
mes
tic
pro
du
cer
pri
ces
for
cop
ra.
Ind
ia
Edib
le o
ils, o
ilsee
ds
Oct
-16
Mar
ket
reg
ula
tio
nEx
ten
ded
, un
til S
epte
mb
er 2
017,
fed
eral
pro
visi
on
s lim
itin
g t
he
amo
un
t o
f ed
ible
oil
and
oils
eed
sto
cks
that
pri
vate
tra
der
s ar
e al
low
ed t
o h
old
.
Palm
oil,
ed
ible
oils
Oct
-16
Imp
ort
po
licy
Low
ered
imp
ort
du
ties
on
cru
de
pal
m o
il an
d r
efin
ed e
dib
le o
ils b
y 5
per
cen
t, b
rin
gin
g t
hem
to
7.
5 p
erce
nt
and
15
per
cen
t, r
esp
ecti
vely
.
Gro
un
dn
ut
Dec
-16
Ag
ricu
ltu
ral p
olic
yA
nn
ou
nce
d t
hat
insu
ran
ce c
laim
s b
y fa
rmer
s in
th
e st
ate
of
An
dra
Pra
des
h, w
ho
se g
rou
nd
nu
t cr
op
h
ad b
een
dam
aged
by
adve
rse
wea
ther
du
rin
g t
he
2016
Kh
arif
sea
son
, wo
uld
be
cove
red
by
the
go
vern
men
t.
Oil
pal
m
Dec
-16
Sect
or
dev
elo
pm
ent
Lau
nch
ed a
pac
kag
e o
f su
pp
ort
mea
sure
s in
th
e st
ate
of
Aru
nac
hal
Pra
des
h t
o e
nco
ura
ge
oil
pal
m
cult
ivat
ion
.
Oilc
rop
sD
ec-1
6A
gri
cult
ura
l po
licy
Rai
sed
min
imu
m s
up
po
rt p
rice
s fo
r R
abi o
ilcro
ps
by
10 p
erce
nt,
in a
bid
to
sti
mu
late
do
mes
tic
oilc
rop
p
rod
uct
ion
.
Fats
an
d o
ilsJa
n-1
7Fo
od
sta
nd
ard
s an
d s
afet
yPr
op
ose
d n
ew s
tan
dar
ds
for
shea
bu
tter
an
d b
orn
eo t
allo
w/il
lipe
bu
tter
an
d is
sued
tab
les
det
ailin
g t
he
fatt
y ac
id c
om
po
siti
on
fo
r al
l veg
etab
le o
ils.
Fats
an
d o
ilsJa
n-1
7Fo
od
sta
nd
ard
s an
d s
afet
yA
men
ded
sta
nd
ard
s o
n o
ils a
nd
fat
s –
effe
ctiv
e 1
July
201
7 –
incl
ud
ing
th
e u
se o
f ve
get
able
fat
s an
d o
ils
in r
efin
ing
pro
cess
es.
Ag
ricu
ltu
ral c
rop
sFe
b-1
7A
gri
cult
ura
l po
licy
Ap
pro
ved
a t
wo
-mo
nth
inte
rest
wai
ver
for
farm
ers
wh
o t
oo
k sh
ort
-ter
m c
rop
loan
s fr
om
co
op
erat
ive
ban
ks, t
o m
inim
ize
the
imp
act
of
the
cou
ntr
y's
earl
ier
dem
on
etiz
atio
n m
easu
res
on
th
e fa
rm s
ecto
r.
Co
pra
Feb
-17
Pub
lic p
rocu
rem
ent
Init
iate
d p
rocu
rem
ent
of
cop
ra in
th
e st
ate
of
Kar
nat
aka,
in a
bid
to
pro
tect
gro
wer
s fr
om
fal
ling
co
mm
od
ity
pri
ces.
Tran
s fa
t, s
atu
rate
d f
atFe
b-1
7H
ealt
h p
olic
ies
Set
27 F
ebru
ary
2017
as
the
enfo
rcem
ent
dat
e fo
r i)
man
dat
ory
dec
lara
tio
n o
f tr
ans
fat
and
sat
ura
ted
fa
t co
nte
nt
on
fo
od
pro
du
ct la
bel
s, a
nd
ii)
a 5
per
cen
t lim
it f
or
tran
s fa
tty
acid
co
nte
nt
in f
ats,
oils
an
d
fat
emu
lsio
ns.
Eve
ntu
ally
, th
e co
mp
lian
ce d
ate
was
po
stp
on
ed t
o 3
0 Ju
ne
2017
to
allo
w m
anu
fact
ure
rs
to u
tiliz
e th
e ex
isti
ng
sto
ck o
f th
eir
pac
kag
ing
mat
eria
l.
Co
con
ut
pal
m
Ap
r-17
Sect
or
dev
elo
pm
ent
Allo
cate
d f
un
ds
to t
he
stat
es o
f K
eral
a, K
arn
atak
a, T
amil
Nad
u a
nd
An
dh
ra P
rad
esh
, in
su
pp
ort
of
pro
ject
s fo
cusi
ng
on
i) c
oco
nu
t p
roce
ssin
g a
nd
pro
du
ct d
iver
sifi
cati
on
, ii)
mar
ket
pro
mo
tio
n a
nd
iii)
re
sear
ch.
Co
pra
Ap
r-17
Ag
ricu
ltu
ral p
olic
yR
aise
d m
inim
um
su
pp
ort
pri
ce f
or
cop
ra b
y 9
per
cen
t, in
ord
er t
o e
nsu
re r
emu
ner
ativ
e p
rice
s fo
r fa
rmer
s an
d s
tim
ula
te in
vest
men
t in
co
con
ut.
Edib
le o
ilsA
pr-
17Fo
od
sta
nd
ard
s an
d s
afet
yIn
itia
ted
th
e co
llect
ion
an
d t
esti
ng
of
edib
le o
il/g
hee
sam
ple
s in
th
e St
ate
of
Pun
jab
, wit
h a
vie
w t
o b
an
all s
ub
-sta
nd
ard
an
d a
du
lter
ated
oil
pro
du
cts
fro
m lo
cal m
arke
ts.
Edib
le o
ilsA
pr-
17Ex
po
rt p
olic
yLi
fted
a b
an o
n b
ulk
exp
ort
s o
f se
lect
ed e
dib
le o
ils –
no
tab
ly g
rou
nd
nu
t, s
esam
e an
d s
oyb
ean
oil
– in
o
rder
to
bo
ost
sh
ipm
ents
of
pre
miu
m v
eget
able
oils
.
Oil
pal
mA
pr-
17A
gri
cult
ura
l po
licy
Ap
pro
ved
go
vern
men
t-fu
nd
ed m
easu
res
to in
crea
se t
he
cou
ntr
y's
oil
pal
m a
rea,
wit
h t
he
ult
imat
e o
bje
ctiv
es o
f b
oo
stin
g d
om
esti
c p
rod
uct
ion
of
veg
etab
le o
ils a
nd
red
uci
ng
imp
ort
req
uir
emen
ts.
Sun
flo
wer
see
dA
pr-
17Im
po
rt p
olic
yA
nn
ou
nce
d a
tem
po
rary
cu
t in
th
e im
po
rt d
uty
on
su
nfl
ow
er s
eed
, wit
h a
vie
w t
o s
up
po
rt t
he
do
mes
tic
pro
cess
ing
ind
ust
ry.
Mu
star
d s
eed
May
-17
GM
O p
olic
yG
ran
ted
tec
hn
ical
cle
aran
ce f
or
com
mer
cial
use
of
gen
etic
ally
mo
difi
ed m
ust
ard
see
d, c
lear
ing
th
e w
ay
for
fin
al m
inis
teri
al a
uth
ori
zati
on
.
Ind
on
esia
Palm
oil
Oct
-16
- M
ay-1
7Ex
po
rt p
olic
yLe
ft in
pla
ce a
slid
ing
exp
ort
tax
reg
ime
for
pal
m o
il w
hic
h p
rote
cts
the
inte
rest
s o
f d
om
esti
c p
rod
uce
rs
and
co
nsu
mer
s.
Ind
on
esia
Soyb
ean
Oct
-16
Mar
ket
reg
ula
tio
nR
evis
ed t
he
farm
-gat
e an
d r
etai
l pri
ces
for
bas
ic f
oo
d it
ems,
incl
ud
ing
so
ybea
n, i
n o
rder
to
pro
tect
fa
rmer
s ag
ain
st s
har
p p
rice
dro
ps
wh
ile s
hie
ldin
g c
on
sum
ers
fro
m p
rice
incr
ease
s.
Ind
on
esia
/Mal
aysi
aPa
lm o
il D
ec-1
6B
ilate
ral c
oo
per
atio
nA
gre
ed t
o jo
in f
orc
es –
un
der
th
e au
spic
es o
f th
e C
ou
nci
l of
Palm
Oil
Pro
du
cin
g C
ou
ntr
ies
– to
ad
dre
ss
per
ceiv
ed b
arri
ers
in g
lob
al p
alm
oil
trad
e.

Ma
jor
po
licy
de
velo
pm
en
ts
92 93FOOD OUTLOOKJUNE 2017
CO
UN
TRY
/INST
ITU
TIO
NPR
OD
UC
TD
ATE
POLI
CY
CA
TEG
OR
Y/IN
STR
UM
ENT
DES
CR
IPTI
ON
Ind
on
esia
Co
con
ut
Feb
-17
Sect
or
dev
elo
pm
ent
Allo
cate
d p
ub
lic f
un
ds
to im
pro
ve d
om
esti
c co
con
ut
pro
du
ctio
n, s
o a
s to
mee
t p
roce
sso
rs’ g
row
ing
d
eman
d f
or
raw
mat
eria
ls.
Soyb
ean
Feb
-17
Pub
lic p
rocu
rem
ent
An
no
un
ced
pla
ns
to a
lloca
te f
un
ds
for
the
pro
cure
men
t o
f d
om
esti
c co
mm
od
itie
s, in
clu
din
g s
oyb
ean
s,
in a
n e
ffo
rt t
o s
tab
ilize
pri
ces.
Bio
die
sel
Ap
r-17
Bio
fuel
po
licy
Exp
lore
d w
ays
to lo
wer
su
bsi
die
s p
aid
to
ind
ivid
ual
pet
rol c
om
pan
ies
for
ble
nd
ing
bio
die
sel,
wit
h a
vi
ew t
o s
pre
ad a
vaila
ble
pu
blic
fu
nd
s ac
ross
a la
rger
vo
lum
e.
Oil
pal
m, m
aize
Ap
r-17
Ag
ricu
ltu
ral p
olic
yR
elea
sed
pla
ns
to e
nco
ura
ge
ind
epen
den
t o
il p
alm
far
mer
s to
intr
od
uce
mai
ze in
terc
rop
pin
g in
th
eir
pla
nta
tio
ns
– a
mea
sure
mea
nt
to im
pro
ve la
nd
use
effi
cien
cy, r
aise
pro
du
ctiv
ity
and
incr
ease
far
mer
s'
inco
mes
.
Palm
oil
Ap
r-17
Envi
ron
men
tal p
olic
yR
enew
ed e
ffo
rts
to la
un
ch a
nat
ion
wid
e, b
ind
ing
cer
tifi
cati
on
sch
eme
for
sust
ain
ably
pro
du
ced
pal
m
oil,
an
d is
sued
a n
atio
nal
su
stai
nab
ility
sta
nd
ard
fo
r p
alm
oil.
Oil
pal
mM
ay-1
7Se
cto
r d
evel
op
men
tA
nn
ou
nce
d p
lan
s to
allo
cate
pu
blic
fu
nd
s to
an
oil
pal
m r
epla
nti
ng
pro
gra
mm
e ai
med
at
incr
easi
ng
p
rod
uct
ivit
y le
vels
in in
dep
end
entl
y ru
n p
alm
oil
bu
sin
esse
s.
Inte
rnat
ion
al O
live
Oil
Co
un
cil
Oliv
e o
il Ja
n-1
7M
ult
ilate
ral c
oo
per
atio
nLa
un
ched
th
e si
xth
inte
rnat
ion
al a
gre
emen
t o
n o
live
oil
and
tab
le o
lives
. Th
e n
ew a
gre
emen
t, w
hic
h
dat
es f
rom
1 J
anu
ary
2017
, pay
s p
arti
cula
r at
ten
tio
n t
o t
he
invo
lvem
ent
of
imp
ort
ing
co
un
trie
s in
th
e C
ou
nci
l’s w
ork
.
Jap
anO
ilmea
lsD
ec-1
6Fe
ed s
tan
dar
ds
Pro
po
sed
to
per
mit
mix
ing
sel
ecte
d o
ilmea
ls w
ith
fee
d m
aize
in t
he
pro
du
ctio
n o
f co
mp
ou
nd
fee
d.
Cu
rren
tly,
mai
ze m
ay o
nly
be
mix
ed w
ith
an
imal
pro
tein
su
ch a
s fi
shm
eal.
Kaz
akh
stan
Ara
ble
cro
ps
Feb
-17
Ag
ricu
ltu
ral p
olic
yPr
esen
ted
a p
rog
ram
me
for
the
dev
elo
pm
ent
of
the
cou
ntr
y’s
agro
-in
du
stri
al c
om
ple
x in
201
7–20
21,
incl
ud
ing
pro
visi
on
s o
f in
cen
tive
s to
red
uce
wh
eat
cult
ivat
ion
in f
avo
ur
of
coar
se g
rain
s an
d o
ilsee
ds.
Kaz
akh
stan
/Ch
ina
Soyb
ean
Ap
r-17
Bila
tera
l co
op
erat
ion
Sig
ned
a p
roto
col o
n p
hyt
osa
nit
ary
req
uir
emen
ts t
o f
acili
tate
th
e ex
po
rtat
ion
of
Kaz
akh
so
ybea
ns
to
Ch
ina.
Ken
yaC
oco
nu
t p
alm
A
pr-
17Se
cto
r d
evel
op
men
tA
nn
ou
nce
d d
istr
ibu
tio
n o
f q
ual
ity
coco
nu
t se
edlin
gs
to f
arm
ers
in t
he
cou
ntr
y’s
coas
tal r
egio
n, w
ith
th
e g
oal
of
bo
ost
ing
pro
du
ctio
n a
nd
str
eng
then
ing
th
e co
con
ut
valu
e ch
ain
.
Mal
aysi
a
Palm
oil
Oct
-16
- M
ay-1
7Ex
po
rt p
olic
yLe
ft in
pla
ce a
slid
ing
exp
ort
tax
reg
ime
for
pal
m o
il th
at p
rote
cts
the
inte
rest
s o
f d
om
esti
c p
rod
uce
rs
and
co
nsu
mer
s.
Palm
oil
Feb
-17
Envi
ron
men
tal p
olic
yR
enew
ed e
ffo
rts
to la
un
ch a
bin
din
g n
atio
nal
sta
nd
ard
fo
r su
stai
nab
ly p
rod
uce
d p
alm
oil,
an
d
ann
ou
nce
d a
tim
elin
e fo
r th
e st
and
ard
’s m
and
ato
ry, n
atio
nw
ide
app
licat
ion
.
Palm
oil
Ap
r-17
Exp
ort
po
licy
Exp
lore
d t
he
po
ssib
ility
of
alig
nin
g t
he
cou
ntr
y's
vari
able
exp
ort
tax
reg
ime
wit
h t
hat
of
Ind
on
esia
, ai
min
g t
o m
ove
to
war
ds
a h
arm
on
ized
, mu
tual
ly b
enefi
cial
exp
ort
po
licy.
Mal
aysi
a/In
dia
Palm
oil
Ap
r-17
Exp
ort
pro
mo
tio
nSi
gn
ed a
Mem
ora
nd
um
of
Un
der
stan
din
g w
ith
Ind
ia, a
imed
at
hel
pin
g r
aise
th
e p
rese
nce
of
Mal
aysi
an
pal
m o
il in
th
e In
dia
n m
arke
t.
Mex
ico
Oilc
rop
sFe
b-1
7A
gri
cult
ura
l po
licy
Ret
ain
ed p
rog
ram
mes
to
en
cou
rag
e d
om
esti
c o
ilsee
d p
rod
uct
ion
bu
t an
no
un
ced
red
uct
ion
s in
th
e am
ou
nt
of
sub
sid
ies
pro
vid
ed t
o in
div
idu
al f
arm
ers
in 2
017.
Mya
nm
arEd
ible
oils
Ap
r-17
Foo
d s
tan
dar
ds
and
saf
ety
Co
nsi
der
ed t
akin
g a
ctio
n a
gai
nst
ille
gal
veg
etab
le o
il im
po
rts
and
fra
ud
ule
nt
sale
s o
f co
oki
ng
oils
on
th
e d
om
esti
c m
arke
t.
Nig
eria
Bio
die
sel
Ap
r-17
Bio
fuel
po
licy
An
no
un
ced
th
at it
is w
ork
ing
on
a n
atio
nal
bio
fuel
po
licy
and
ince
nti
ves
pro
gra
mm
e th
at w
ill s
pel
l ou
t p
rod
uct
ion
an
d p
rice
tar
get
s, a
nd
defi
ne
a re
gu
lato
ry f
ram
ewo
rk f
or
do
mes
tic
bio
fuel
s u
tiliz
atio
n.
Paci
fic
Co
mm
un
ity
Co
con
ut
Oct
-16
Sect
or
dev
elo
pm
ent
Lau
nch
ed a
reg
ion
al in
itia
tive
aim
ed a
t im
pro
vin
g t
he
com
pet
itiv
enes
s o
f sm
all c
oco
nu
t p
rod
uce
rs in
th
e Pa
cifi
c re
gio
n.
Paki
stan
Rap
esee
dA
pr-
17Se
cto
r d
evel
op
men
tLa
un
ched
a p
roje
ct in
th
e co
un
try'
s K
hyb
er P
akh
tun
khw
a Pr
ovi
nce
to
en
han
ce p
rod
uct
ivit
y in
rap
esee
d
cult
ivat
ion
.
Peru
Bio
die
sel
Oct
-16
Imp
ort
po
licy
An
no
un
ced
th
e re
pla
cem
ent
of
pro
visi
on
al a
nti
-du
mp
ing
du
ties
on
bio
die
sel i
mp
ort
s fr
om
Arg
enti
na
wit
h p
erm
anen
t o
nes
, so
as
to s
hie
ld d
om
esti
c b
iod
iese
l pro
du
ctio
n f
rom
alle
ged
ly u
nfa
ir c
om
pet
itio
n.

Ma
jor p
olicy d
eve
lop
me
nts
92 93FOOD OUTLOOKJUNE 2017
CO
UN
TRY
/INST
ITU
TIO
NPR
OD
UC
TD
ATE
POLI
CY
CA
TEG
OR
Y/IN
STR
UM
ENT
DES
CR
IPTI
ON
Rw
and
aB
iod
iese
lA
pr-
17B
iofu
el p
olic
yA
ban
do
ned
a b
iod
iese
l pro
ject
lau
nch
ed in
201
3, d
ue
to in
suffi
cien
t av
aila
bili
ty o
f th
e ke
y fe
edst
ock
(j
atro
ph
a o
il) a
nd
hig
h c
ost
s o
f p
rod
uct
ion
.
Sri L
anka
Veg
etab
le o
ilsO
ct-1
6Im
po
rt p
olic
yR
aise
d t
he
spec
ial c
om
mo
dit
y le
vy o
n im
po
rted
veg
etab
le o
ils, i
n o
rder
to
pro
tect
do
mes
tic
oils
eed
p
rod
uce
rs a
nd
oil
pro
cess
ors
.
Co
con
ut
oil
Ap
r-17
Imp
ort
po
licy
Ap
pro
ved
imp
ort
atio
n o
f co
con
ut
oil
and
dec
ided
to
low
er t
he
spec
ial c
om
mo
dit
y le
vy c
har
ged
on
im
po
rted
veg
etab
les
oils
, in
a b
id t
o c
urb
do
mes
tic
reta
il p
rice
s.
Thai
lan
dC
oco
nu
t p
alm
A
pr-
17Se
cto
r d
evel
op
men
tIn
stru
cted
sta
te a
gen
cies
to
dev
elo
p a
ctio
n p
lan
s fo
r b
oo
stin
g n
atio
nal
co
con
ut
pro
du
ctio
n, s
o a
s to
ad
dre
ss d
om
esti
c su
pp
ly s
ho
rtag
es a
nd
hal
t im
po
rts
of
coco
nu
t p
rod
uct
s.
Turk
ey
Saffl
ow
er o
il,
sun
flo
wer
oil
Sep
-16
Imp
ort
po
licy
Rai
sed
imp
ort
du
ties
on
saf
flo
wer
an
d s
un
flo
wer
oil
– to
pre
ven
t lo
w im
po
rt p
rice
s fr
om
hu
rtin
g
do
mes
tic
pro
du
cers
an
d c
rush
ers.
Soyb
ean
, su
nfl
ow
er,
saffl
ow
er, r
apes
eed
Feb
-17
Ag
ricu
ltu
ral p
olic
yLa
un
ched
a n
ew a
gri
cult
ura
l su
bsi
dy
pro
gra
mm
e, in
a b
id t
o d
iver
sify
th
e co
un
try’
s ag
ricu
ltu
ral
pro
du
ctio
n, r
aise
pro
du
ctiv
ity
leve
ls a
nd
red
uce
th
e cu
ltiv
atio
n o
f w
ater
-in
ten
sive
cro
ps
in s
tru
ctu
rally
d
isad
van
tag
ed a
reas
. Cro
ps
elig
ible
fo
r su
pp
ort
incl
ud
e so
ybea
n, s
un
flo
wer
, saf
flo
wer
an
d r
apes
eed
.
Sun
flo
wer
oil/
mea
lA
pr-
17Im
po
rt p
olic
yTe
mp
ora
rily
su
spen
ded
th
e R
uss
ian
Fed
erat
ion
fro
m t
he
list
of
tax-
free
ori
gin
s fo
r se
lect
ed a
gri
cult
ura
l p
rod
uct
s, w
hic
h in
clu
des
su
nfl
ow
er o
il an
d m
eal.
Ukr
ain
eSo
ybea
nD
ec-1
6G
MO
po
licy
Intr
od
uce
d b
ord
er c
on
tro
ls t
o c
hec
k th
e co
un
try'
s ag
ricu
ltu
ral e
xpo
rts
for
GM
O c
on
ten
t, p
arti
cula
rly
to
pre
ven
t ill
egal
ly g
row
n G
M s
oyb
ean
s fr
om
jeo
par
diz
ing
th
e co
un
try'
s st
atu
s as
a G
M-f
ree
sup
plie
r.
Un
ited
Sta
tes
Bio
die
sel
Oct
-16
Bio
fuel
po
licy
Ru
led
th
at b
iod
iese
l ble
nd
ing
man
dat
es a
pp
lied
in t
he
stat
e o
f M
inn
eso
ta a
re n
ot
in c
on
flic
t w
ith
th
e fe
der
al R
enew
able
Fu
el S
tan
dar
d (
RFS
), a
nd
th
at t
he
RFS
th
eref
ore
do
es n
ot
pre
-em
pt
Min
nes
ota
’s
man
dat
es.
Cam
elin
a sa
tiva
Feb
-17
Bio
fuel
po
licy
Allo
cate
d p
ub
lic f
un
ds
to a
res
earc
h p
roje
ct o
n c
amel
ina
sati
va, a
s p
art
of
nat
ion
al e
ffo
rts
to p
rom
ote
re
sear
ch o
n n
ew b
io-b
ased
fee
dst
ock
fo
r b
iod
iese
l.
Rap
esee
dA
pr-
17Se
cto
r d
evel
op
men
tM
ade
avai
lab
le f
un
din
g f
or
fun
dam
enta
l an
d a
pp
lied
res
earc
h t
o h
elp
dev
elo
p n
ew r
apes
eed
var
ieti
es,
exp
and
th
e cr
op
’s g
row
ing
reg
ion
an
d la
un
ch n
ew c
om
mer
cial
rap
esee
d-b
ased
pro
du
cts.
Bio
die
sel
May
-17
Bio
fuel
po
licy
Exte
nd
ed t
he
Ren
ewab
le F
uel
s In
fras
tru
ctu
re p
rog
ram
me
in t
he
stat
e o
f Io
wa.
Th
e p
rog
ram
me
is
des
ign
ed t
o e
nco
ura
ge
fuel
ret
aile
rs t
o o
ffer
bio
fuel
at
the
pu
mp
.
Bio
die
sel
May
-17
Imp
ort
po
licy
Lau
nch
ed a
n in
vest
igat
ion
into
US
imp
ort
s o
f ve
get
able
oil-
bas
ed b
iod
iese
l fro
m A
rgen
tin
a an
d
Ind
on
esia
, to
pro
be
alle
ged
du
mp
ing
an
d u
nfa
ir s
ub
sid
izat
ion
.
*A
det
aile
d de
scrip
tion
of m
ajor
pol
icy
deve
lopm
ents
fro
m J
anua
ry 2
011
onw
ard
is a
vaila
ble
at h
ttp:
//ww
w.f
ao.o
rg/e
cono
mic
/est
/est
-com
mod
ities
/com
mod
ity-p
olic
y-ar
chiv
e/en
/?gr
oupA
ND
com
mod
ity=
Oils
eeds
,%20
oils
%20
and%
20m
eals

Statistica
l ap
pe
nd
ix
114 115FOOD OUTLOOKJUNE 2017
APPENDIX TABLE 10: TOTAL OILCROPS STATISTICS (million tonnes)
12/13-14/15
average2015/16 2016/17
12/13-14/15 average
2015/16 2016/1712/13-14/15
average2015/16 2016/17
estim. f'cast estim. f'cast estim. f'cast
ASIA 134.5 123.5 135.1 100.3 119.6 129.2 3.0 3.4 3.5China 60.2 56.9 58.7 76.9 91.3 98.1 1.1 1.3 0.8 of which Taiwan Prov. 0.1 0.1 0.1 2.4 2.5 2.6 - - -India 36.9 31.3 39.1 0.3 0.3 0.2 0.8 0.8 1.3Indonesia 11.0 10.8 11.6 2.3 2.5 2.9 0.1 0.1 0.1Iran, Islamic Republic of 0.7 0.7 0.7 0.9 1.8 2.3 0.1 0.1 0.1Japan 0.3 0.3 0.3 5.7 6.0 6.1 - - -Korea, Republic.of 0.2 0.2 0.1 1.5 1.6 1.7 - - -Malaysia 5.0 4.3 5.0 0.7 0.8 0.9 - 0.1 0.1Pakistan 5.3 4.0 4.4 1.4 2.3 3.1 - - -Thailand 0.7 1.0 1.1 2.2 2.6 2.8 - - -Turkey 3.1 3.1 3.2 2.7 3.2 3.0 0.1 0.1 0.1
AFRICA 17.4 18.3 18.3 3.8 3.5 4.1 0.7 0.7 0.7Nigeria 5.1 5.0 5.0 - - - 0.1 0.1 0.1
CENTRAL AMERICA 1.7 1.8 2.0 6.3 6.5 6.9 0.2 0.2 0.2Mexico 1.2 1.3 1.5 5.6 5.7 6.1 - - -
SOUTH AMERICA 167.0 177.4 196.5 1.9 2.7 4.0 65.0 74.3 82.0Argentina 59.1 62.2 62.4 0.1 0.4 1.6 9.8 11.8 11.2Brazil 91.4 98.5 116.0 0.4 0.4 0.4 46.6 54.0 61.3Paraguay 8.9 9.8 10.6 - - - 4.9 5.4 6.2Uruguay 3.5 2.7 3.5 - - - 3.2 2.6 2.9
NORTH AMERICA 126.6 142.6 153.9 3.1 2.1 2.5 58.0 70.7 73.2Canada 23.2 26.2 26.0 0.6 0.6 0.6 13.1 15.3 16.0United States of America 103.4 116.5 127.9 2.5 1.4 1.9 44.9 55.3 57.2
EUROPE 62.2 66.6 69.6 20.2 22.9 23.2 5.7 5.8 6.7European Union 32.0 32.7 31.8 17.9 20.0 20.5 1.1 0.9 1.1Russian Federation 12.6 13.8 15.5 1.7 2.1 2.0 0.4 0.6 0.8Ukraine 15.2 17.9 20.1 - - - 3.7 3.7 4.2
OCEANIA 5.5 4.4 6.2 - - - 3.4 2.2 3.7Australia 5.1 4.0 5.7 - - - 3.3 2.1 3.6
WORLD 515.0 534.6 581.6 135.6 157.3 169.9 136.0 157.3 169.9Developing countries 320.8 321.1 352.1 106.5 126.3 138.1 68.9 78.7 86.4Developed countries 194.2 213.5 229.5 29.1 31.0 31.8 67.1 78.6 83.5LIFDC 55.7 50.4 57.8 1.7 2.4 2.6 1.5 1.6 2.1LDC 10.7 11.0 10.9 0.8 1.3 1.7 0.4 0.5 0.5
1 The split years bring together northern hemisphere annual crops harevested in the latter part of the first year shown, with southern hemisphere annual crops harvested in the early part of the second year shown; for tree crops which are produced throughout the year, calendar year production for the second year shown is used
APPENDIX TABLE 10: TOTAL OILCROPS STATISTICS (million tonnes)
Production 1 Imports Exports

Sta
tist
ica
l a
pp
en
dix
116 117FOOD OUTLOOKJUNE 2017
APPENDIX TABLE 11: TOTAL OILS AND FATS STATISTICS 1 (million tonnes)
12/13-14/15
average2015/16 2016/17
12/13-14/15 average
2015/16 2016/1712/13-14/15
average2015/16 2016/17
estim. f'cast estim. f'cast estim. f'cast
ASIA 44.0 45.1 47.4 49.6 48.4 50.3 101.4 109.5 113.3Bangladesh 1.8 2.0 2.2 - - - 2.1 2.4 2.6China 11.4 9.4 9.6 0.5 0.7 0.6 36.9 38.4 38.8 of which Taiwan Prov. 0.4 0.5 0.5 - - - 0.9 0.9 1.0India 12.3 15.2 15.4 0.4 0.2 0.2 21.6 24.2 24.9Indonesia 0.1 0.1 0.2 25.5 26.2 28.0 10.0 11.6 12.0Iran, Islamic Republic of 1.6 1.0 1.3 0.2 0.1 0.2 2.0 1.7 1.9Japan 1.3 1.3 1.3 - - - 3.1 3.2 3.3Korea, Republic.of 1.0 1.1 1.2 - - - 1.4 1.5 1.6Malaysia 1.5 1.3 1.5 19.2 18.0 18.0 4.4 4.4 5.0Pakistan 2.8 3.0 3.2 0.1 0.2 0.1 4.4 4.8 5.1Philippines 0.7 1.0 1.1 0.9 0.7 0.8 1.6 1.8 2.0Singapore 0.8 0.8 0.8 0.2 0.1 0.1 0.7 0.7 0.7Turkey 1.8 1.9 2.0 0.7 0.7 0.6 2.9 3.2 3.3
AFRICA 10.2 10.6 11.5 1.8 1.8 1.7 16.2 17.3 18.1Algeria 0.8 0.8 1.0 0.1 0.1 0.1 0.9 1.0 1.1Egypt 2.0 2.0 2.2 0.3 0.3 0.2 2.2 2.4 2.6Nigeria 1.5 1.4 1.7 0.2 0.1 0.1 3.2 3.4 3.6South Africa 0.8 0.9 0.8 0.1 0.1 - 1.3 1.5 1.5
CENTRAL AMERICA 2.5 2.6 2.8 1.0 1.4 1.4 5.0 5.1 5.6Mexico 1.4 1.5 1.6 0.1 0.1 - 3.3 3.4 3.7
SOUTH AMERICA 3.1 3.3 3.4 9.0 10.9 11.1 17.0 17.7 18.3Argentina 0.1 0.1 0.1 5.3 6.6 6.8 3.9 4.1 4.0Brazil 0.6 0.7 0.7 1.7 1.9 1.8 8.4 8.8 9.3Paraguay - - - 0.6 0.7 0.7 0.1 0.1 0.1Uruguay 0.1 0.1 0.1 - - - 0.1 0.1 0.2
NORTH AMERICA 4.9 5.4 5.4 6.6 7.0 7.2 19.7 21.0 21.2Canada 0.5 0.5 0.5 3.2 3.6 3.8 1.4 1.6 1.6United States of America 4.4 4.9 4.9 3.4 3.5 3.4 18.4 19.4 19.6
EUROPE 14.0 14.4 14.7 9.8 10.8 12.3 37.2 39.7 39.2European Union 11.5 11.8 12.0 3.3 3.3 3.3 30.7 32.6 32.2Russian Federation 1.2 1.4 1.3 2.0 2.3 2.7 4.3 4.7 4.7Ukraine 0.3 0.3 0.3 3.9 4.8 5.8 1.0 1.0 0.9
OCEANIA 0.6 0.7 0.7 1.8 1.9 1.9 1.2 1.2 1.2Australia 0.5 0.5 0.5 0.7 0.7 0.7 0.8 0.8 0.9
WORLD 79.3 82.2 85.9 79.6 82.3 85.9 197.6 211.5 216.9Developing countries 58.5 60.5 64.0 62.1 63.1 65.2 136.5 146.5 152.1Developed countries 20.7 21.8 22.0 17.5 19.1 20.8 61.1 65.0 64.8LIFDC 21.3 24.6 25.7 2.5 2.4 2.4 36.3 39.9 41.2LDC 6.4 7.1 7.6 0.5 0.7 0.7 9.4 10.2 10.6
1 Includes oils and fats of vegetable, marine and animal origin
APPENDIX TABLE 11: TOTAL OILS AND FATS STATISTICS 1 (million tonnes)
Imports Exports Utilization

Statistica
l ap
pe
nd
ix
116 117FOOD OUTLOOKJUNE 2017
APPENDIX TABLE 12: TOTAL MEALS AND CAKES STATISTICS 1 (million tonnes)
12/13-14/15
average2015/16 2016/17
12/13-14/15 average
2015/16 2016/1712/13-14/15
average2015/16 2016/17
estim. f'cast estim. f'cast estim. f'cast
ASIA 34.2 35.6 37.6 15.5 12.7 14.0 144.1 160.4 170.8China 2.7 2.9 3.4 2.1 2.4 1.9 78.9 88.4 94.5 of which Taiwan Prov. 0.6 0.5 0.5 - - - 2.5 2.5 2.5India 0.2 0.3 0.3 4.2 0.9 2.6 12.3 13.5 14.5Indonesia 4.0 4.4 4.5 4.1 4.4 4.5 6.0 6.6 6.8Iran, Islamic Republic of 2.5 1.5 2.0 0.1 - 0.1 3.2 3.5 3.9Japan 2.4 2.2 2.3 - - - 6.4 6.5 6.5Korea, Republic.of 3.9 3.9 3.8 0.2 0.2 0.2 4.9 5.1 5.1Malaysia 1.4 1.3 1.4 2.6 2.4 2.6 2.0 2.0 2.1Pakistan 0.8 0.7 0.7 0.2 0.3 0.3 3.6 3.5 4.3Philippines 2.3 2.8 2.8 0.6 0.4 0.4 2.7 3.2 3.5Saudi Arabia 0.9 1.0 1.1 - - - 1.2 1.4 1.6Thailand 3.4 3.1 3.1 0.2 0.2 0.2 5.6 6.0 6.2Turkey 1.8 2.0 2.1 0.1 0.2 0.1 4.7 5.5 5.6Viet Nam 4.2 5.5 5.7 0.2 0.3 0.3 5.2 6.9 7.3
AFRICA 5.3 6.7 6.4 0.9 1.0 0.9 12.3 14.0 14.3Egypt 1.1 2.4 1.7 - - - 2.7 3.4 3.1South Africa 1.1 0.9 1.0 0.1 0.1 0.1 2.1 2.2 2.4
CENTRAL AMERICA 3.6 4.5 4.7 0.2 0.2 0.2 8.6 9.9 10.3Mexico 1.9 2.7 2.7 0.1 0.1 0.1 6.3 7.2 7.7
SOUTH AMERICA 5.4 5.4 5.8 46.1 52.3 53.1 27.1 29.2 32.4Argentina - - - 27.2 31.8 32.1 3.6 4.6 5.7Bolivia - - - 1.6 1.9 1.9 0.2 0.2 0.2Brazil - - - 13.9 14.6 15.0 16.2 16.7 18.2Chile 1.2 1.2 1.3 0.2 0.2 0.2 1.6 1.6 1.8Paraguay - - - 2.2 2.7 2.8 0.5 0.4 0.6Peru 0.9 1.1 1.2 0.8 0.7 1.0 1.2 1.5 1.6Uruguay 0.2 0.2 0.2 - - - 0.2 0.2 0.2Venezuela 1.3 0.9 1.0 - - - 1.4 1.3 1.3
NORTH AMERICA 4.9 5.1 5.2 15.7 16.6 16.6 35.6 38.8 39.2Canada 1.0 0.9 0.9 4.5 5.3 5.4 2.2 2.3 2.3United States of America 3.9 4.2 4.3 11.3 11.4 11.3 33.4 36.6 36.9
EUROPE 30.0 30.7 30.9 7.5 7.9 8.8 64.8 69.5 70.5European Union 27.3 28.1 28.2 1.3 1.3 1.3 55.7 58.8 59.3Russian Federation 0.6 0.5 0.5 2.2 2.0 2.2 5.0 6.1 6.4Ukraine - - - 3.6 4.3 4.9 1.4 1.8 1.8
OCEANIA 2.9 3.1 3.2 0.3 0.3 0.3 3.6 4.0 4.0Australia 1.0 1.1 1.2 0.1 0.1 0.1 1.6 1.9 1.9
WORLD 86.2 91.0 93.9 86.3 91.1 93.9 296.1 325.8 341.5Developing countries 46.0 50.0 52.2 62.9 66.3 68.3 185.8 207.0 221.3Developed countries 40.1 41.0 41.6 23.4 24.8 25.6 110.3 118.7 120.2LIFDC 2.2 2.6 2.8 5.1 1.8 3.5 19.8 21.9 23.1LDC 0.8 0.9 0.9 0.4 0.4 0.4 4.2 4.7 5.0
1 Expressed in product weight; includes meals and cakes derived from oilcrops as well as fish meal and other meals from animal origin
APPENDIX TABLE 12: TOTAL MEALS AND CAKES STATISTICS
Imports Exports Utilization

Statistica
l ap
pe
nd
ix
126 127FOOD OUTLOOKJUNE 2017
APPENDIX TABLE 23: SELECTED INTERNATIONAL PRICES FOR OILCROP PRODUCTS
International prices 1 FAO indices 7
Period Soybeans 2 Soybean oil 3 Palm oil 4 Soybean cake 5 Rapeseed
meal 6
Oilseeds Vegetable oils Oilcakes/meals
.............................................. (USD per tonne) .............................................. ................... (2002-2004=100) ................
Annual (Oct/Sept)
2004/05 275 545 419 212 130 104 103 101
2005/06 259 572 451 202 130 100 107 96
2006/07 335 772 684 264 184 129 150 128
2007/08 549 1325 1050 445 296 216 246 214
2008/09 422 826 627 385 196 157 146 179
2009/10 429 924 806 388 220 162 177 183
2010/11 549 1308 1147 418 279 214 259 200
2011/12 562 1235 1051 461 295 214 232 219
2012/13 563 1099 835 539 345 213 193 255
2013/14 521 949 867 534 324 194 189 253
2014/15 407 777 658 406 270 155 153 194
2015/16 396 773 655 351 232 151 155 168
Monthly
2015 - October 377 743 581 351 255 146 143 170
2015 - November 367 726 561 328 232 142 138 159
2015 - December 372 757 568 317 215 144 141 153
2016 - January 368 722 564 316 217 142 139 152
2016 - February 370 762 639 303 203 142 150 146
2016 - March 379 761 694 301 219 145 160 145
2016 - April 398 797 723 339 242 152 166 163
2016 - May 425 790 708 406 261 160 163 193
2016 - June 455 797 679 430 259 169 162 204
2016 - July 429 790 652 400 234 159 157 189
2016 - August 414 812 736 375 228 156 169 178
2016 - September 403 825 755 344 219 153 172 165
2016 - October 404 853 712 340 214 153 168 161
2016 - November 409 875 755 343 218 155 176 163
2016 - December 420 902 783 344 211 159 183 163
2017 - January 425 879 806 355 216 161 186 168
2017 - February 428 838 779 357 241 162 179 170
2017 - March 408 809 735 346 238 155 168 164
2017 - April 389 788 693 331 240 149 161 158
2017 - May 392 827 732 329 239 150 169 157
1 Spot prices for nearest forward shipment 2 Soybeans: US, No.2 yellow, c.i.f. Rotterdam.3 Soybean oil: Dutch, fob ex-mill.4 Palm oil: Crude, c.i.f. Northwest Europe.5 Soybean cake: Pellets, 44/45 percent, Argentina, c.i.f. Rotterdam.6 Rapeseed meal: 34 percent, Hamburg, f.o.b. ex-mill.7 The FAO indices are based on the international prices of five selected seeds, ten selected oils and five selected cakes and meals. The indices are calculated using the
Laspeyres formula; the weights used are the export values of each commodity for the 2002-2004 period.
Sources: FAO and Oil World.