Embed Size (px)
Citation preview
Q1 2019 August, 2019 1
SummaryA new immunisation schedule was introduced for babies born on or after October 1st 2016. Changes to the schedule included theintroduction of the Meningococcal group B and Rotavirus vaccines, a change in the recommended timing of the first MenC vaccine,a change in the recommended timing of the third PCV vaccine and introduction of a combined Hib/MenC vaccine at 13 monthsinstead of the previous separate single doses of these vaccines. Changes to the schedule are outlined in Table 1. The Q1 2019 12month cohort are the sixth 12 month cohort recommended the new immunisation schedule and the Q1 2019 24 month cohort are thesecond 24 month cohort recommended the new schedule.
Children 12 months of age in Quarter 1-2019
National immunisation uptake rates were92% for MenB2 and89% for D3, T3, P3, Hib3, Polio3, HepB3, MenC1, PCV2 and Rota2.
Compared to Q4 2018 and based on available data, the national uptake rates in Q1-2019 declined by 1% for all vaccines exceptRota2 was unchanged.
The 12 month Q4 2017 cohort (children born 01/10/2016-31/12/2016) was the first cohort recommended the new immunisationschedule introduced for children born on or after 1st October 2016. In Q4 2017 compared to Q2 2017 D3, T3, P3, Hib3, Polio3, andHepB3 declined by 2%, PCV2 declined by 3% and MenC1 declined by 6%. In Q1 2019, compared to Q2 2017, MenC1 was 5%lower and D3, T3, P3, Hib3, Polio3, HepB3 and PCV2 were 2% lower. This low uptake of MenC1 is a concern as it leaves childrenvulnerable to preventable meningococcal serogroup C infection.
Among the Local Health Offices, the target uptake rate of ≥95% was reached in Q1 2019 inLaois/Offaly and Longford/Westmeath for all vaccines except Rota2 (and BCG)Galway and Tipperary North /East Limerick for MenB2 andRoscommon for Rota2
Children 24 months of age in Quarter 1-2019
National uptake rates for all vaccines (except Rota2) declined by 1-3% in Q1 2019 compared to the previous quarter
National uptake rates in Q1 2019 were- and changes compared to Q4 2018:93% for D3, T3, P3, Hib3, Polio3 and HepB3- decline of 1%;91% for MMR1 and MenBcomplete - decline of 1%;90% for Rota2- unchanged;89% for MenB3- decline of 1%;88% for Hibb, MenCb and MenC2- decline of 2%;87% for PCVb- decline of 2%;85% for PCV3- decline of 3%;84% for Hib4 – decline of 1%.MenBcomplete rate based on data from only 25 LHOs in Q1 and 21 LHOs in Q4;MenC2 rate based on data from only 10 LHOs in Q1 and 7 LHOs in Q4;Hib4 rate based on data from only 14 LHOs in Q1 and 15 LHOs in Q4;All other rates are based on data from 31 LHOs in Q1 and 28 LHOs in Q4.
PCV3 and PCVb had also declined in Q3 and Q4 2018 with both now 6% lower compared to Q2 2018 and both are at their lowestuptake rate since the introduction of PCV vaccine.
D3, T3, P3, Hib3, Polio3 and HepB3 rates declined by 1% to 93% in Q1 2019 and are now below the target rate of 95% for the fourthquarter in a row. The uptake rate was previously 93% in Q4 2009.
MMR1 was previously 91% in Q2 2011 and Hibb was previously 88% in Q1 2012 while uptake of MenC is low for a number ofyears.
While uptake rates of D3, T3, P3, Hib3, Polio3 and HepB3 were 93% uptake of the remaining vaccines in Q1 2019 are lower.Doses of these remaining vaccines (except Rota2) are given at 12 and 13 months of age suggesting that parents are less likely to getthe recommended vaccines for their children at this age.
HSE-Health Protection Surveillance Centre (HPSC) Tel: +353 1 876 5300 www.hpsc.ie25-27 Middle Gardiner Street, Dublin 1, Ireland Fax: +353 1 856 1299
Q1 2019 August, 2019 2
Background
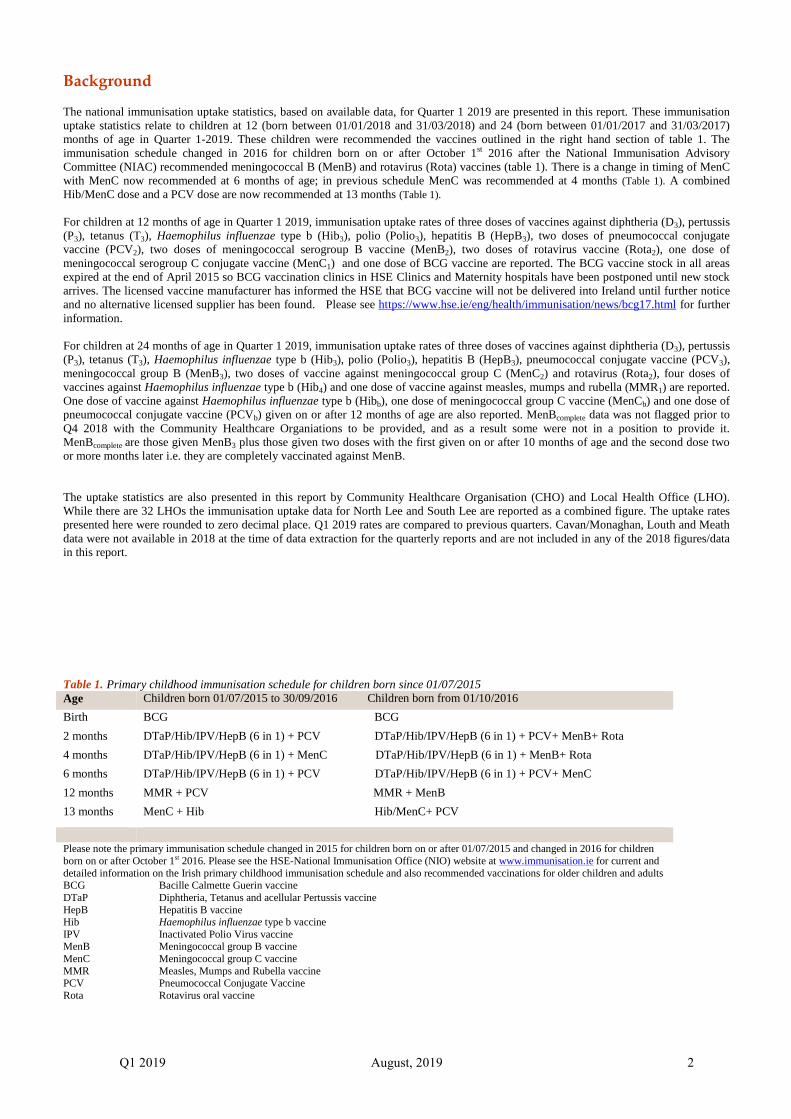
The national immunisation uptake statistics, based on available data, for Quarter 1 2019 are presented in this report. These immunisationuptake statistics relate to children at 12 (born between 01/01/2018 and 31/03/2018) and 24 (born between 01/01/2017 and 31/03/2017)months of age in Quarter 1-2019. These children were recommended the vaccines outlined in the right hand section of table 1. Theimmunisation schedule changed in 2016 for children born on or after October 1st 2016 after the National Immunisation AdvisoryCommittee (NIAC) recommended meningococcal B (MenB) and rotavirus (Rota) vaccines (table 1). There is a change in timing of MenCwith MenC now recommended at 6 months of age; in previous schedule MenC was recommended at 4 months (Table 1). A combinedHib/MenC dose and a PCV dose are now recommended at 13 months (Table 1).
For children at 12 months of age in Quarter 1 2019, immunisation uptake rates of three doses of vaccines against diphtheria (D3), pertussis(P3), tetanus (T3), Haemophilus influenzae type b (Hib3), polio (Polio3), hepatitis B (HepB3), two doses of pneumococcal conjugatevaccine (PCV2), two doses of meningococcal serogroup B vaccine (MenB2), two doses of rotavirus vaccine (Rota2), one dose ofmeningococcal serogroup C conjugate vaccine (MenC1) and one dose of BCG vaccine are reported. The BCG vaccine stock in all areasexpired at the end of April 2015 so BCG vaccination clinics in HSE Clinics and Maternity hospitals have been postponed until new stockarrives. The licensed vaccine manufacturer has informed the HSE that BCG vaccine will not be delivered into Ireland until further noticeand no alternative licensed supplier has been found. Please see https://www.hse.ie/eng/health/immunisation/news/bcg17.html for furtherinformation.
For children at 24 months of age in Quarter 1 2019, immunisation uptake rates of three doses of vaccines against diphtheria (D3), pertussis(P3), tetanus (T3), Haemophilus influenzae type b (Hib3), polio (Polio3), hepatitis B (HepB3), pneumococcal conjugate vaccine (PCV3),meningococcal group B (MenB3), two doses of vaccine against meningococcal group C (MenC2) and rotavirus (Rota2), four doses ofvaccines against Haemophilus influenzae type b (Hib4) and one dose of vaccine against measles, mumps and rubella (MMR1) are reported.One dose of vaccine against Haemophilus influenzae type b (Hibb), one dose of meningococcal group C vaccine (MenCb) and one dose ofpneumococcal conjugate vaccine (PCVb) given on or after 12 months of age are also reported. MenBcomplete data was not flagged prior toQ4 2018 with the Community Healthcare Organiations to be provided, and as a result some were not in a position to provide it.MenBcomplete are those given MenB3 plus those given two doses with the first given on or after 10 months of age and the second dose twoor more months later i.e. they are completely vaccinated against MenB.
The uptake statistics are also presented in this report by Community Healthcare Organisation (CHO) and Local Health Office (LHO).While there are 32 LHOs the immunisation uptake data for North Lee and South Lee are reported as a combined figure. The uptake ratespresented here were rounded to zero decimal place. Q1 2019 rates are compared to previous quarters. Cavan/Monaghan, Louth and Meathdata were not available in 2018 at the time of data extraction for the quarterly reports and are not included in any of the 2018 figures/datain this report.
Table 1. Primary childhood immunisation schedule for children born since 01/07/2015Age Children born 01/07/2015 to 30/09/2016 Children born from 01/10/2016
Birth BCG BCG
2 months DTaP/Hib/IPV/HepB (6 in 1) + PCV DTaP/Hib/IPV/HepB (6 in 1) + PCV+ MenB+ Rota
4 months DTaP/Hib/IPV/HepB (6 in 1) + MenC DTaP/Hib/IPV/HepB (6 in 1) + MenB+ Rota
6 months DTaP/Hib/IPV/HepB (6 in 1) + PCV DTaP/Hib/IPV/HepB (6 in 1) + PCV+ MenC
12 months MMR + PCV MMR + MenB
13 months MenC + Hib Hib/MenC+ PCV
Please note the primary immunisation schedule changed in 2015 for children born on or after 01/07/2015 and changed in 2016 for childrenborn on or after October 1st 2016. Please see the HSE-National Immunisation Office (NIO) website at www.immunisation.ie for current anddetailed information on the Irish primary childhood immunisation schedule and also recommended vaccinations for older children and adultsBCG Bacille Calmette Guerin vaccineDTaP Diphtheria, Tetanus and acellular Pertussis vaccineHepB Hepatitis B vaccineHib Haemophilus influenzae type b vaccineIPV Inactivated Polio Virus vaccineMenB Meningococcal group B vaccineMenC Meningococcal group C vaccineMMR Measles, Mumps and Rubella vaccinePCV Pneumococcal Conjugate VaccineRota Rotavirus oral vaccine
Q1 2019 August, 2019 3
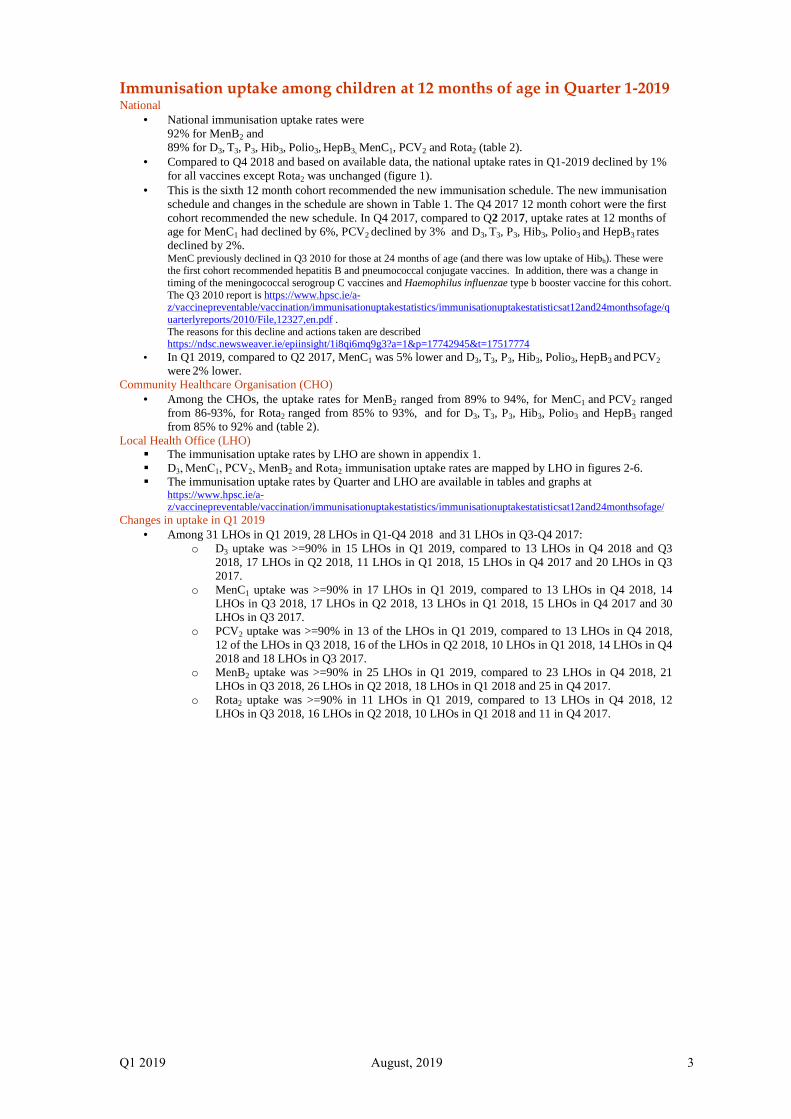
Immunisation uptake among children at 12 months of age in Quarter 1-2019National
National immunisation uptake rates were92% for MenB2 and89% for D3, T3, P3, Hib3, Polio3, HepB3, MenC1, PCV2 and Rota2 (table 2).
Compared to Q4 2018 and based on available data, the national uptake rates in Q1-2019 declined by 1%for all vaccines except Rota2 was unchanged (figure 1).
This is the sixth 12 month cohort recommended the new immunisation schedule. The new immunisationschedule and changes in the schedule are shown in Table 1. The Q4 2017 12 month cohort were the firstcohort recommended the new schedule. In Q4 2017, compared to Q2 2017, uptake rates at 12 months ofage for MenC1 had declined by 6%, PCV2 declined by 3% and D3, T3, P3, Hib3, Polio3 and HepB3 ratesdeclined by 2%.MenC previously declined in Q3 2010 for those at 24 months of age (and there was low uptake of Hibb). These werethe first cohort recommended hepatitis B and pneumococcal conjugate vaccines. In addition, there was a change intiming of the meningococcal serogroup C vaccines and Haemophilus influenzae type b booster vaccine for this cohort.The Q3 2010 report is https://www.hpsc.ie/a-z/vaccinepreventable/vaccination/immunisationuptakestatistics/immunisationuptakestatisticsat12and24monthsofage/quarterlyreports/2010/File,12327,en.pdf .The reasons for this decline and actions taken are describedhttps://ndsc.newsweaver.ie/epiinsight/1i8qi6mq9g3?a=1&p=17742945&t=17517774
In Q1 2019, compared to Q2 2017, MenC1 was 5% lower and D3, T3, P3, Hib3, Polio3, HepB3 and PCV2
were 2% lower.Community Healthcare Organisation (CHO)
Among the CHOs, the uptake rates for MenB2 ranged from 89% to 94%, for MenC1 and PCV2 rangedfrom 86-93%, for Rota2 ranged from 85% to 93%, and for D3, T3, P3, Hib3, Polio3 and HepB3 rangedfrom 85% to 92% and (table 2).
Local Health Office (LHO) The immunisation uptake rates by LHO are shown in appendix 1. D3, MenC1, PCV2, MenB2 and Rota2 immunisation uptake rates are mapped by LHO in figures 2-6. The immunisation uptake rates by Quarter and LHO are available in tables and graphs at
https://www.hpsc.ie/a-z/vaccinepreventable/vaccination/immunisationuptakestatistics/immunisationuptakestatisticsat12and24monthsofage/
Changes in uptake in Q1 2019 Among 31 LHOs in Q1 2019, 28 LHOs in Q1-Q4 2018 and 31 LHOs in Q3-Q4 2017:
o D3 uptake was >=90% in 15 LHOs in Q1 2019, compared to 13 LHOs in Q4 2018 and Q32018, 17 LHOs in Q2 2018, 11 LHOs in Q1 2018, 15 LHOs in Q4 2017 and 20 LHOs in Q32017.
o MenC1 uptake was >=90% in 17 LHOs in Q1 2019, compared to 13 LHOs in Q4 2018, 14LHOs in Q3 2018, 17 LHOs in Q2 2018, 13 LHOs in Q1 2018, 15 LHOs in Q4 2017 and 30LHOs in Q3 2017.
o PCV2 uptake was >=90% in 13 of the LHOs in Q1 2019, compared to 13 LHOs in Q4 2018,12 of the LHOs in Q3 2018, 16 of the LHOs in Q2 2018, 10 LHOs in Q1 2018, 14 LHOs in Q42018 and 18 LHOs in Q3 2017.
o MenB2 uptake was >=90% in 25 LHOs in Q1 2019, compared to 23 LHOs in Q4 2018, 21LHOs in Q3 2018, 26 LHOs in Q2 2018, 18 LHOs in Q1 2018 and 25 in Q4 2017.
o Rota2 uptake was >=90% in 11 LHOs in Q1 2019, compared to 13 LHOs in Q4 2018, 12LHOs in Q3 2018, 16 LHOs in Q2 2018, 10 LHOs in Q1 2018 and 11 in Q4 2017.

Q1 2019 August, 2019 4
Figure 1. National quarterly immunisation uptake rates at 12 monthsX-axis ranges from 60-100%.The Q3-2008 MenC3 uptake figure is based on data from six of the eight HSE Areas. The Q1-2009 HSE-Eastern Area D3, P3, T3, Polio3 and MMR1 uptake figures exclude those born on the 31/03/2007. The Q3-2009figures are incomplete as two HSE Areas were unable to provide data, two additional areas were unable to provide MenC2 data and one additional area was unable to provide PCV2 data. The Q4-2009 figures areincomplete as three HSE Areas were unable to provide data. The Q1-2010 figures are incomplete as two HSE Areas were unable to provide data and three were unable to provide MenC2 data. The Q2 -2010 figures areincomplete as two HSE Areas were unable to provide data. The Q4-2010 figures are incomplete as one HSE Area was unable to provide data. BCG uptake data are only displayed in this graph from Q1 2013 as BCGuptake data were available for only five of the eight HSE-Areas (this includes data from the HSE-Southern Area which relates to Kerry data only) from Q3 2003 to Q2 2009 (except Q3 2004 when HSE-Southern Area datawere not available), for three HSE-Areas in Q3 2009, for two HSE-Areas in Q4 2009, for three HSE-Areas in Q1 2010 and Q2 2010, for five HSE-Areas in Q4 2010, Q1 2011 and Q2 2011, for six HSE-Areas in Q3 2011to Q4 2012 and for seven HSE Areas from Q1 2013. From Q3 2011 to Q3 2014 HSE Western Area BCG data was not available by LHO, uptake was provided for the HSE Western Area as a whole. In Q4 2014 BCG datawas available for Galway and Roscommon- the BCG denominator for HSE Western Area in Q4 2014 was the sum of the Galway and Roscommon denominators. Since Q1 2015 BCG data was available for Galway, Mayoand Roscommon LHOs. See page 2 regarding BCG vaccine stock in Ireland since April 2015. Q1-Q4 2018 CN/MN, LH and MH data were not available at the time of data extraction for the report.
60
65
70
75
80
85
90
95
100
Q3
2000
Q2
2001
Q1
2002
Q4
2002
Q3
2003
Q2
2004
Q1
2005
Q4
2005
Q3
2006
Q2
2007
Q1
2008
Q4
2008
Q3
2009
Q2
2010
Q1
2011
Q4
2011
Q3
2012
Q2
2013
Q1
2014
Q4
2014
Q3
2015
Q2
2016
Q1
2017
Q4
2017
Q3
2018
% U
ptak
e
Quarter/YearD3 MenC3 MenC2 MenC1PCV2 MenB2 Rota2 BCG
Community HealthcareOrganisation/LHO*
No. in cohort# BCG†† D3T3/P3/
Hib3/Polio3
HepB3 MenB2 MenC1 PCV2 Rota2
CHO1 (CN/MN, DL, SO/LM) 1224 0 91 91 92 91 91 85CHO2 (G, MO, RN) 1364 0 92 92 94 93 93 93CHO3 (CE, L, TN) 1238 0 91 91 93 91 91 91CHO4 (NC, NSL, WC, KY) 2132 0 86 86 93 89 86 89CHO5 (CW/KK, TS, WD, WX) 1576 0.1 89 89 92 89 88 87CHO6 (DS, DSE, WW) 1129 0 89 89 89 88 88 87CHO7 (DSC, DSW, DW, KE) 2292 0 88 88 91 88 88 88CHO8 (LS/OY, LD/WH,LH, MH) 2028 0 92 92 93 91 92 90CHO9 (DNW, DNC, DN) 2089 0 85 85 89 86 86 87Ireland 15072 0.01 89 89 92 89 89 89na = not available at this time*Shown in brackets are the LHOs in each CHO. Please see Appendix 3 to translate LHO codes. The geographical boundaries of the CHOs are shown athttps://www.hse.ie/eng/services/publications/corporate/CHO_Chapter_1.pdf# The denominator/number in cohort varied slightly according to vaccine. D3T3 cohorts are shown here.†Number in cohort for BCG is 13536. BCG data are unavailable for the former HSE North Eastern Area i.e. CN/MN, LH, MH; therefore CHO1 and CHO8 BCG data are incomplete. At thetime of writing of this report the HSE continues to experience on-going delays with the supply of BCG vaccine. This continues to be a Europe wide issue. See Background section for furtherinformation.
Table 2. Immunisation uptake (%) at 12 months in cohort born 01/01/2018–31/03/2018
Q1 2019 August, 2019 5
A B
N
EW
S
No Data95 - 10090 - 9485 - 8980 - 840 - 79
% Immunisation Uptake
G
L
DL
KY
MO
CE
TS
RN
NC
MH
NSL
WX
LS/OY
WC
SO/LM
WD
KE/WW
LD/WH
LHCN/MN
CW/KKTN/EL
WW
DN
DW
DNW
DSW DSDSE
DNC
DSC
DSC
DNC
DSE DSDSW
DNW
DW
DN
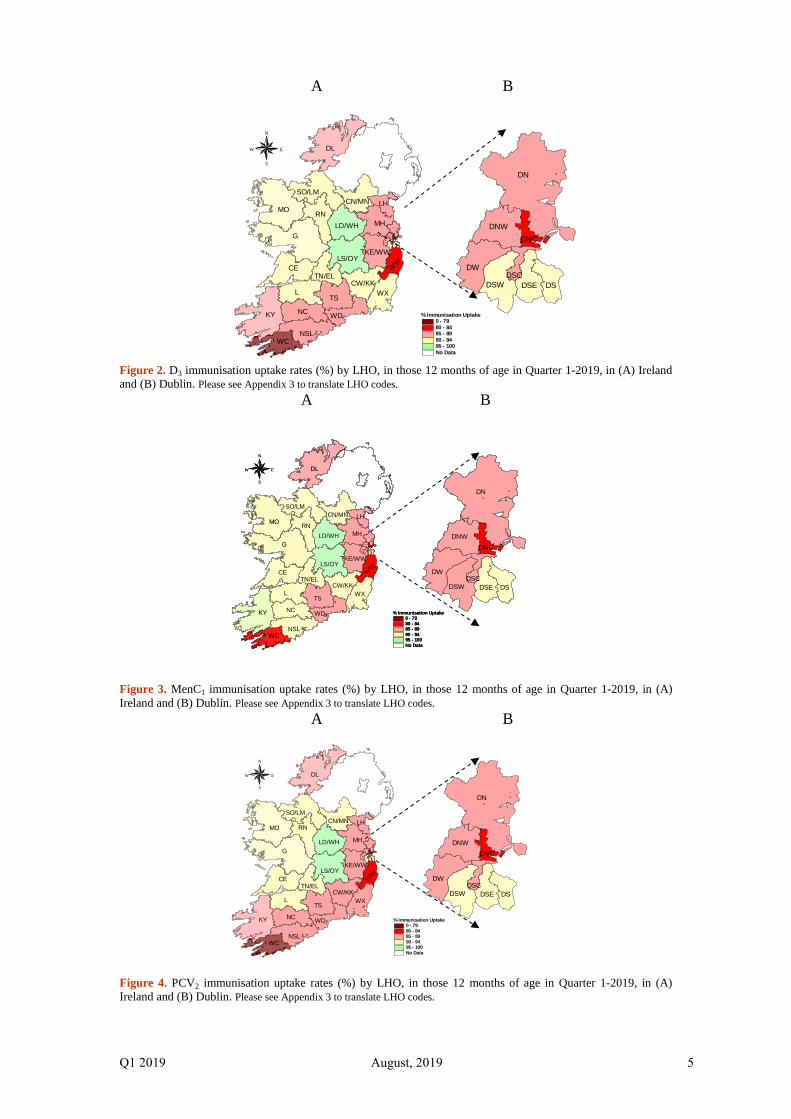
Figure 2. D3 immunisation uptake rates (%) by LHO, in those 12 months of age in Quarter 1-2019, in (A) Irelandand (B) Dublin. Please see Appendix 3 to translate LHO codes.
A B
No Data95 - 10090 - 9485 - 8980 - 840 - 79
% Immunisation Uptake
G
L
DL
KY
MO
CE
TS
RN
NC
MH
NSL
WX
LS/OY
WC
SO/LM
WD
KE/WW
LD/WH
LHCN/MN
CW/KKTN/EL
WW
DN
DW
DNW
DSW DSDSE
DNC
DSC
DSC
DNC
DSE DSDSW
DNW
DW
DN
No Data95 - 10090 - 9485 - 8980 - 840 - 79
% Immunisation Uptake
G
L
DL
KY
MO
CE
TS
RN
NC
MH
NSL
WX
LS/OY
WC
SO/LM
WD
KE/WW
LD/WH
LHCN/MN
CW/KKTN/EL
WW
DN
DW
DNW
DSW DSDSE
DNC
DSC
DSC
DNC
DSE DSDSW
DNW
DW
DN
N
EW
S
N
EW
S
Figure 3. MenC1 immunisation uptake rates (%) by LHO, in those 12 months of age in Quarter 1-2019, in (A)Ireland and (B) Dublin. Please see Appendix 3 to translate LHO codes.
A B
N
EW
S
No Data95 - 10090 - 9485 - 8980 - 840 - 79
% Immunisation Uptake
G
L
DL
KY
MO
CE
TS
NC
MH
NSL
WX
LS/OY
WC
SO/LM
WD
KE/WW
LD/WH
LHCN/MN
CW/KKTN/EL
WW
DN
DW
DNW
DSW DSDSE
DNC
DSC
DSC
DNC
DSE DSDSW
DNW
DW
DN
RN
Figure 4. PCV2 immunisation uptake rates (%) by LHO, in those 12 months of age in Quarter 1-2019, in (A)Ireland and (B) Dublin. Please see Appendix 3 to translate LHO codes.
Q1 2019 August, 2019 6
A B
N
EW
S
No Data95 - 10090 - 9485 - 8980 - 840 - 79
% Immunisation Uptake
G
L
DL
KY
MO
CE
TS
RN
NC
MH
NSL
WX
LS/OY
WC
SO/LM
WD
KE/WW
LD/WH
LHCN/MN
CW/KKTN/EL
WW
DN
DW
DNW
DSW DSDSE
DNC
DSC
DSC
DNC
DSE DSDSW
DNW
DW
DN
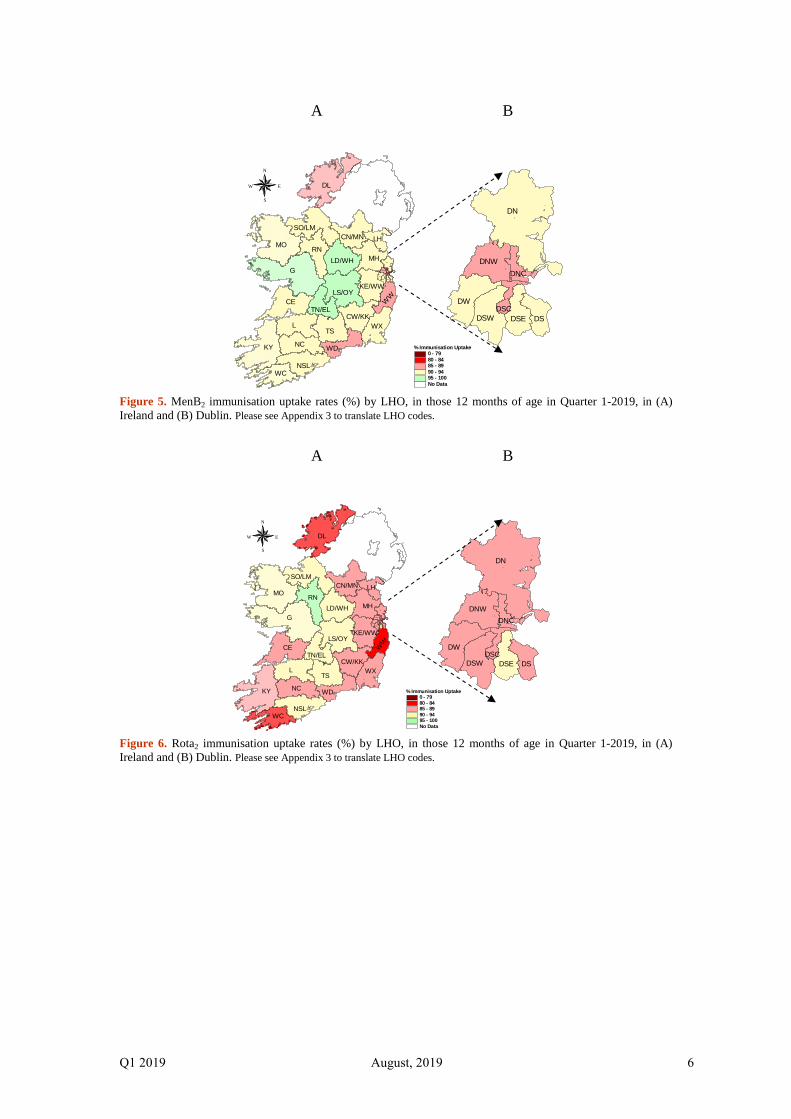
Figure 5. MenB2 immunisation uptake rates (%) by LHO, in those 12 months of age in Quarter 1-2019, in (A)Ireland and (B) Dublin. Please see Appendix 3 to translate LHO codes.
A B
N
EW
S
No Data95 - 10090 - 9485 - 8980 - 840 - 79
% Immunisation Uptake
G
L
DL
KY
MO
CE
TS
RN
NC
MH
NSL
WX
LS/OY
WC
SO/LM
WD
KE/WW
LD/WH
LHCN/MN
CW/KKTN/EL
WW
DN
DW
DNW
DSW DSDSE
DNC
DSC
DSC
DNC
DSE DSDSW
DNW
DW
DN
Figure 6. Rota2 immunisation uptake rates (%) by LHO, in those 12 months of age in Quarter 1-2019, in (A)Ireland and (B) Dublin. Please see Appendix 3 to translate LHO codes.
Q1 2019 August, 2019 7
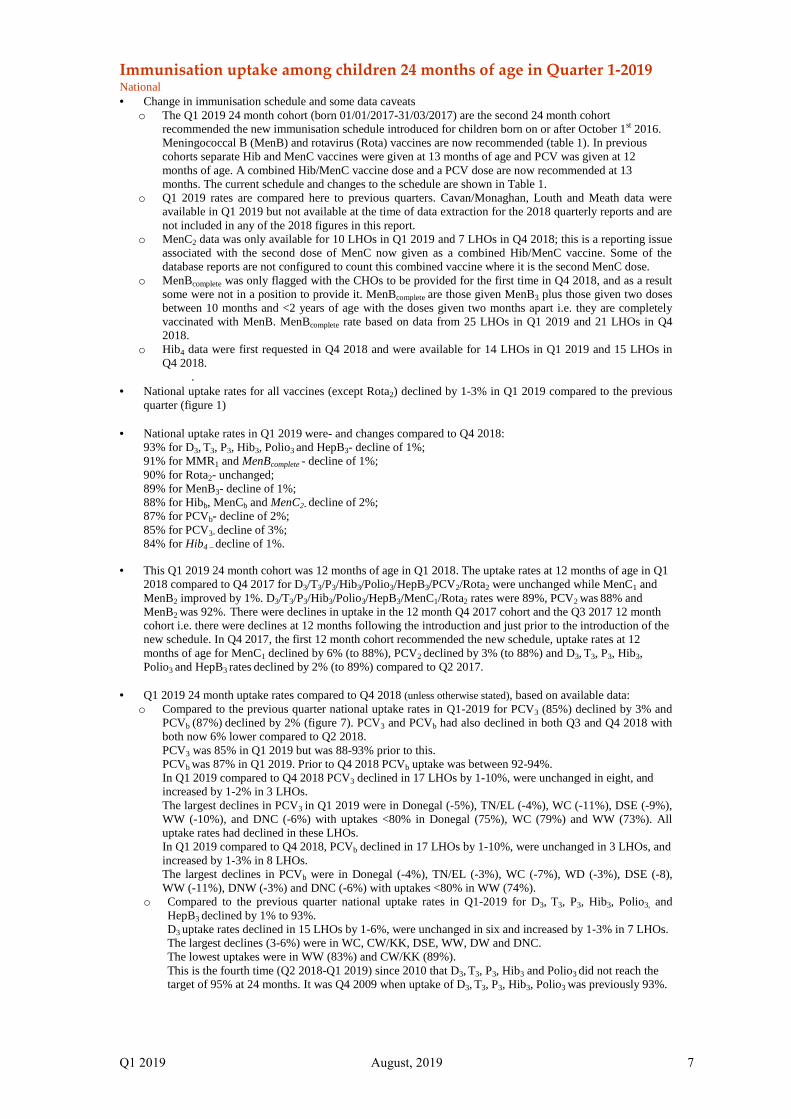
Immunisation uptake among children 24 months of age in Quarter 1-2019National Change in immunisation schedule and some data caveats
o The Q1 2019 24 month cohort (born 01/01/2017-31/03/2017) are the second 24 month cohortrecommended the new immunisation schedule introduced for children born on or after October 1st 2016.Meningococcal B (MenB) and rotavirus (Rota) vaccines are now recommended (table 1). In previouscohorts separate Hib and MenC vaccines were given at 13 months of age and PCV was given at 12months of age. A combined Hib/MenC vaccine dose and a PCV dose are now recommended at 13months. The current schedule and changes to the schedule are shown in Table 1.
o Q1 2019 rates are compared here to previous quarters. Cavan/Monaghan, Louth and Meath data wereavailable in Q1 2019 but not available at the time of data extraction for the 2018 quarterly reports and arenot included in any of the 2018 figures in this report.
o MenC2 data was only available for 10 LHOs in Q1 2019 and 7 LHOs in Q4 2018; this is a reporting issueassociated with the second dose of MenC now given as a combined Hib/MenC vaccine. Some of thedatabase reports are not configured to count this combined vaccine where it is the second MenC dose.
o MenBcomplete was only flagged with the CHOs to be provided for the first time in Q4 2018, and as a resultsome were not in a position to provide it. MenBcomplete are those given MenB3 plus those given two dosesbetween 10 months and <2 years of age with the doses given two months apart i.e. they are completelyvaccinated with MenB. MenBcomplete rate based on data from 25 LHOs in Q1 2019 and 21 LHOs in Q42018.
o Hib4 data were first requested in Q4 2018 and were available for 14 LHOs in Q1 2019 and 15 LHOs inQ4 2018.
. National uptake rates for all vaccines (except Rota2) declined by 1-3% in Q1 2019 compared to the previous
quarter (figure 1)
National uptake rates in Q1 2019 were- and changes compared to Q4 2018:93% for D3, T3, P3, Hib3, Polio3 and HepB3- decline of 1%;91% for MMR1 and MenBcomplete - decline of 1%;90% for Rota2- unchanged;89% for MenB3- decline of 1%;88% for Hibb, MenCb and MenC2- decline of 2%;87% for PCVb- decline of 2%;85% for PCV3- decline of 3%;84% for Hib4 – decline of 1%.
This Q1 2019 24 month cohort was 12 months of age in Q1 2018. The uptake rates at 12 months of age in Q12018 compared to Q4 2017 for D3/T3/P3/Hib3/Polio3/HepB3/PCV2/Rota2 were unchanged while MenC1 andMenB2 improved by 1%. D3/T3/P3/Hib3/Polio3/HepB3/MenC1/Rota2 rates were 89%, PCV2 was 88% andMenB2 was 92%. There were declines in uptake in the 12 month Q4 2017 cohort and the Q3 2017 12 monthcohort i.e. there were declines at 12 months following the introduction and just prior to the introduction of thenew schedule. In Q4 2017, the first 12 month cohort recommended the new schedule, uptake rates at 12months of age for MenC1 declined by 6% (to 88%), PCV2 declined by 3% (to 88%) and D3, T3, P3, Hib3,Polio3 and HepB3 rates declined by 2% (to 89%) compared to Q2 2017.
Q1 2019 24 month uptake rates compared to Q4 2018 (unless otherwise stated), based on available data:o Compared to the previous quarter national uptake rates in Q1-2019 for PCV3 (85%) declined by 3% and
PCVb (87%) declined by 2% (figure 7). PCV3 and PCVb had also declined in both Q3 and Q4 2018 withboth now 6% lower compared to Q2 2018.PCV3 was 85% in Q1 2019 but was 88-93% prior to this.PCVb was 87% in Q1 2019. Prior to Q4 2018 PCVb uptake was between 92-94%.In Q1 2019 compared to Q4 2018 PCV3 declined in 17 LHOs by 1-10%, were unchanged in eight, andincreased by 1-2% in 3 LHOs.The largest declines in PCV3 in Q1 2019 were in Donegal (-5%), TN/EL (-4%), WC (-11%), DSE (-9%),WW (-10%), and DNC (-6%) with uptakes <80% in Donegal (75%), WC (79%) and WW (73%). Alluptake rates had declined in these LHOs.In Q1 2019 compared to Q4 2018, PCVb declined in 17 LHOs by 1-10%, were unchanged in 3 LHOs, andincreased by 1-3% in 8 LHOs.The largest declines in PCVb were in Donegal (-4%), TN/EL (-3%), WC (-7%), WD (-3%), DSE (-8),WW (-11%), DNW (-3%) and DNC (-6%) with uptakes <80% in WW (74%).
o Compared to the previous quarter national uptake rates in Q1-2019 for D3, T3, P3, Hib3, Polio3, andHepB3 declined by 1% to 93%.D3 uptake rates declined in 15 LHOs by 1-6%, were unchanged in six and increased by 1-3% in 7 LHOs.The largest declines (3-6%) were in WC, CW/KK, DSE, WW, DW and DNC.The lowest uptakes were in WW (83%) and CW/KK (89%).This is the fourth time (Q2 2018-Q1 2019) since 2010 that D3, T3, P3, Hib3 and Polio3 did not reach thetarget of 95% at 24 months. It was Q4 2009 when uptake of D3, T3, P3, Hib3, Polio3 was previously 93%.
Q1 2019 August, 2019 8
Community HealthcareOrganisation/LHO
No. inCohort
*
D3/T3 Hib4 Hibb MenB3 MenBcomplete
MenC2 MenCb PCV3 PCVb Rota2 MMR1
CHO1(CN/MN$, DL, SO/LM) 1224 95 83 87 86 92 83 87 81 86 86 89CHO2 (G, MO, RN) 1409 96 87 94 94 96 94 92 97 92 97 95CHO3 (CE, L, TN) 1178 95 - 94 91 - - 93 87 91 91 93CHO4 (NC, NSL,WC, KY) 2157 95 - 86 91 92 - 88 86 88 90 91CHO5 (CW/KK,TS,WD,WX) 1623 92 80 87 89 90 - 86 83 86 87 91
CHO6 (DS, DSE, WW) 1227 89 - 83 84 86 - 84 81 82 86 87CHO7 (DSC, DSW, DW, KE) 2270 93 - 90 88 90 - 89 85 87 90 91CHO8 (LS/OY, LD/WH,LH$,MH$)
2186 94 87 89 90 96 87 88 85 87 91 91
CHO9 (DNW, DNC, DN) 1971 93 - 88 88 89 - 87 84 86 90 91Ireland 15245 93 84 88 89 91 88 88 85 87 90 91
Please see Appendix 3 to translate LHO codesP3/ Polio3/ Hib3/HepB3 are not shown here, they are mostly similar to DT3 rates.na = not available* As the denominator/number in cohort varied slightly according to vaccine D3T3 cohorts are shown hereHib4 ‘national’ uptake rate is calculated based on data from 14 LHOs only.MenBcomplete ‘national’ uptake rate is calculated based on data from 25 LHOs only.MenC2 ‘national’ uptake rate of 90% is calculated based on data from 10 LHOs only.
65
70
75
80
85
90
95
100
Q1
1999
Q4
1999
Q3
2000
Q2
2001
Q1
2002
Q4
2002
Q3
2003
Q2
2004
Q1
2005
Q4
2005
Q3
2006
Q2
2007
Q1
2008
Q4
2008
Q3
2009
Q2
2010
Q1
2011
Q4
2011
Q3
2012
Q2
2013
Q1
2014
Q4
2014
Q3
2015
Q2
2016
Q1
2017
Q4
2017
Q3
2018
% U
ptak
e
Quarter/YearD3 Hibb MenC3 MenC2 MenCbPCV3 PCVb MMR1 MenB3
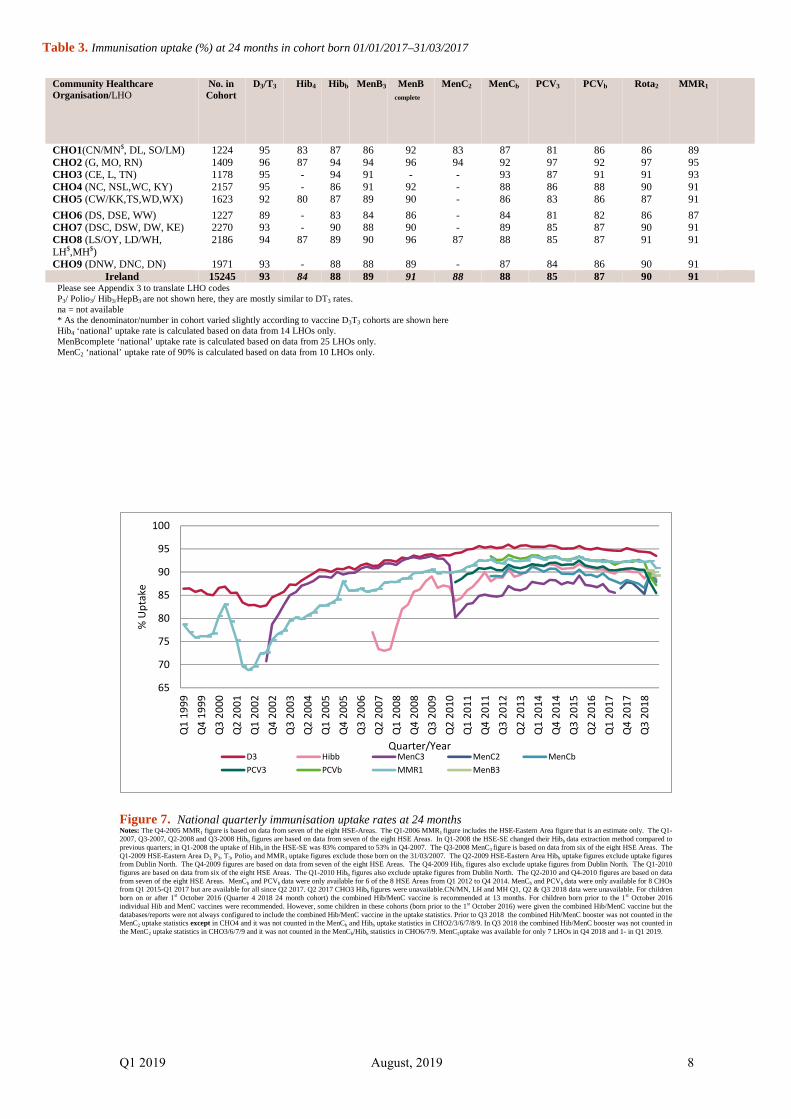
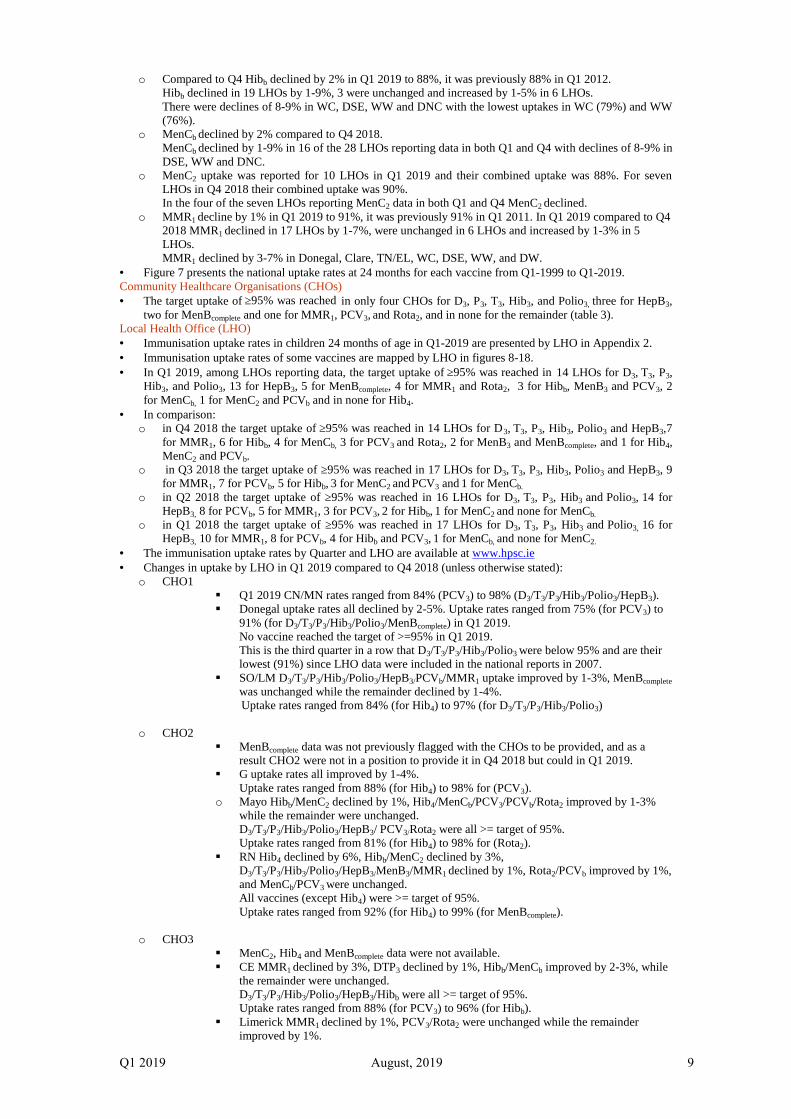
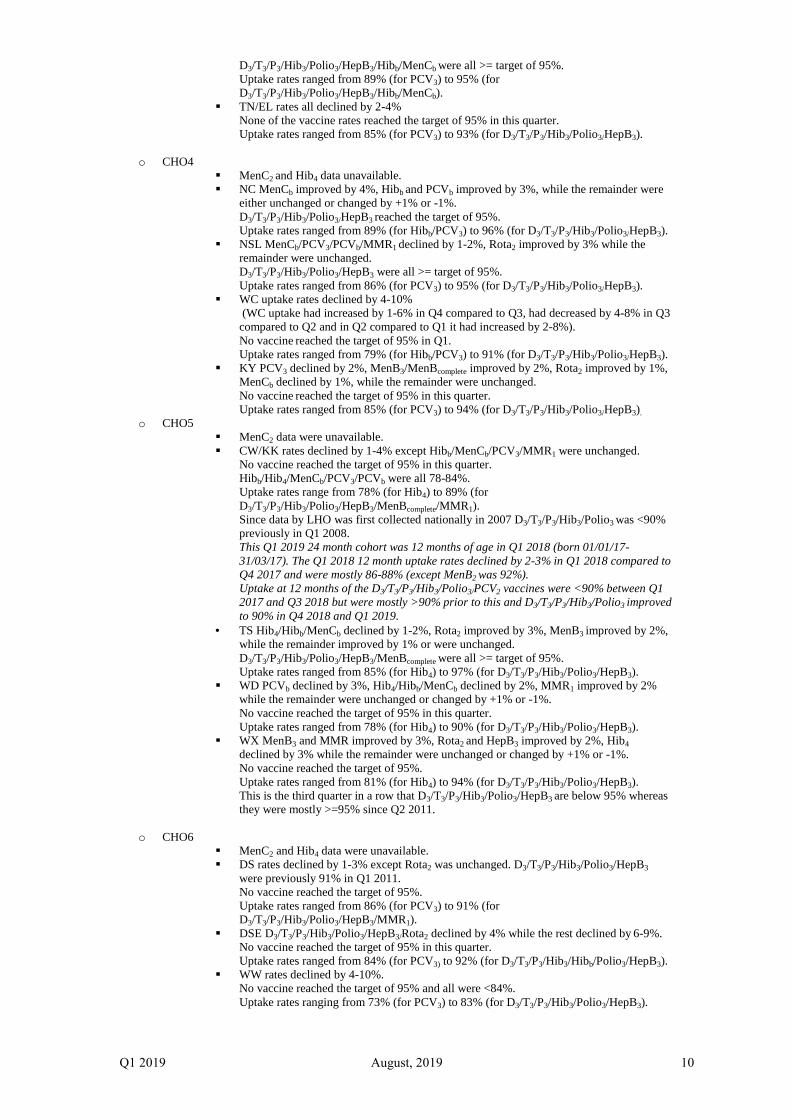
Figure 7. National quarterly immunisation uptake rates at 24 monthsNotes: The Q4-2005 MMR1 figure is based on data from seven of the eight HSE-Areas. The Q1-2006 MMR1 figure includes the HSE-Eastern Area figure that is an estimate only. The Q1-2007, Q3-2007, Q2-2008 and Q3-2008 Hibb figures are based on data from seven of the eight HSE Areas. In Q1-2008 the HSE-SE changed their Hibb data extraction method compared toprevious quarters; in Q1-2008 the uptake of Hibb in the HSE-SE was 83% compared to 53% in Q4-2007. The Q3-2008 MenC3 figure is based on data from six of the eight HSE Areas. TheQ1-2009 HSE-Eastern Area D3, P3, T3, Polio3 and MMR1 uptake figures exclude those born on the 31/03/2007. The Q2-2009 HSE-Eastern Area Hibb uptake figures exclude uptake figuresfrom Dublin North. The Q4-2009 figures are based on data from seven of the eight HSE Areas. The Q4-2009 Hibb figures also exclude uptake figures from Dublin North. The Q1-2010figures are based on data from six of the eight HSE Areas. The Q1-2010 Hibb figures also exclude uptake figures from Dublin North. The Q2-2010 and Q4-2010 figures are based on datafrom seven of the eight HSE Areas. MenCb and PCVb data were only available for 6 of the 8 HSE Areas from Q1 2012 to Q4 2014. MenCb and PCVb data were only available for 8 CHOsfrom Q1 2015-Q1 2017 but are available for all since Q2 2017. Q2 2017 CHO3 Hibb figures were unavailable.CN/MN, LH and MH Q1, Q2 & Q3 2018 data were unavailable. For childrenborn on or after 1st October 2016 (Quarter 4 2018 24 month cohort) the combined Hib/MenC vaccine is recommended at 13 months. For children born prior to the 1st October 2016individual Hib and MenC vaccines were recommended. However, some children in these cohorts (born prior to the 1st October 2016) were given the combined Hib/MenC vaccine but thedatabases/reports were not always configured to include the combined Hib/MenC vaccine in the uptake statistics. Prior to Q3 2018 the combined Hib/MenC booster was not counted in theMenC2 uptake statistics except in CHO4 and it was not counted in the MenCb and Hibb uptake statistics in CHO2/3/6/7/8/9. In Q3 2018 the combined Hib/MenC booster was not counted inthe MenC2 uptake statistics in CHO3/6/7/9 and it was not counted in the MenCb/Hibb statistics in CHO6/7/9. MenC2uptake was available for only 7 LHOs in Q4 2018 and 1- in Q1 2019.
Table 3. Immunisation uptake (%) at 24 months in cohort born 01/01/2017–31/03/2017
Q1 2019 August, 2019 9
o Compared to Q4 Hibb declined by 2% in Q1 2019 to 88%, it was previously 88% in Q1 2012.Hibb declined in 19 LHOs by 1-9%, 3 were unchanged and increased by 1-5% in 6 LHOs.There were declines of 8-9% in WC, DSE, WW and DNC with the lowest uptakes in WC (79%) and WW(76%).
o MenCb declined by 2% compared to Q4 2018.MenCb declined by 1-9% in 16 of the 28 LHOs reporting data in both Q1 and Q4 with declines of 8-9% inDSE, WW and DNC.
o MenC2 uptake was reported for 10 LHOs in Q1 2019 and their combined uptake was 88%. For sevenLHOs in Q4 2018 their combined uptake was 90%.In the four of the seven LHOs reporting MenC2 data in both Q1 and Q4 MenC2 declined.
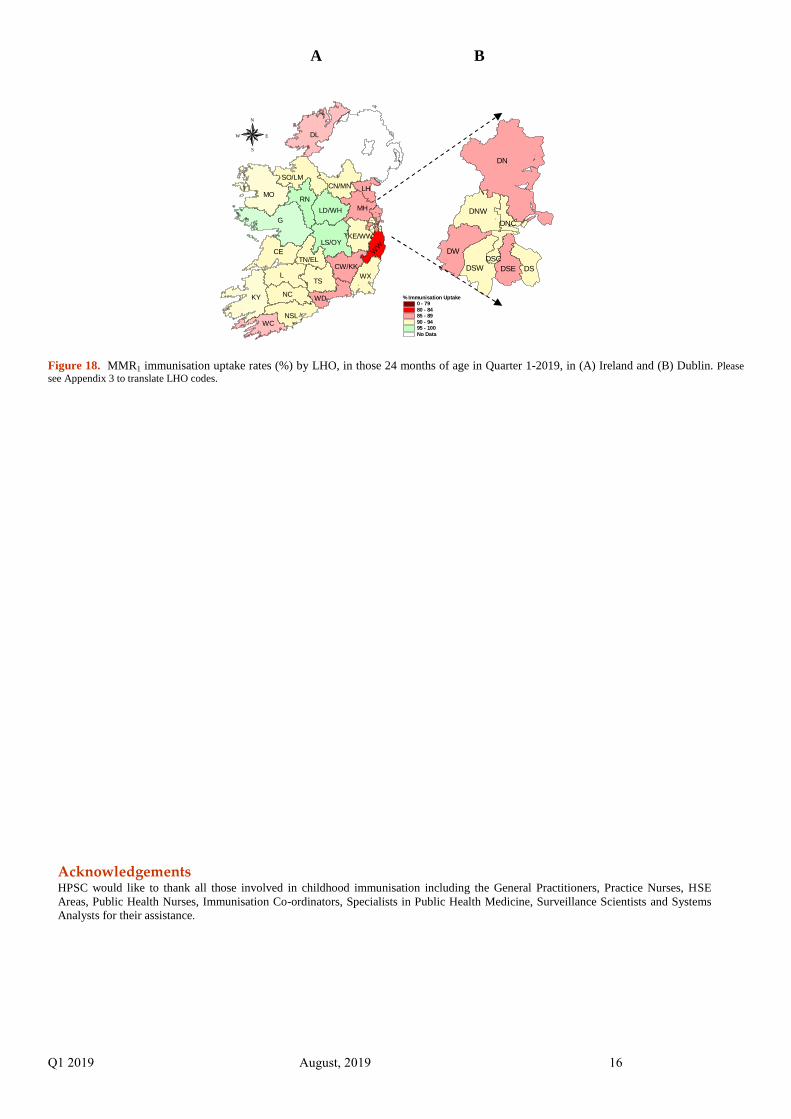
o MMR1 decline by 1% in Q1 2019 to 91%, it was previously 91% in Q1 2011. In Q1 2019 compared to Q42018 MMR1 declined in 17 LHOs by 1-7%, were unchanged in 6 LHOs and increased by 1-3% in 5LHOs.MMR1 declined by 3-7% in Donegal, Clare, TN/EL, WC, DSE, WW, and DW.
Figure 7 presents the national uptake rates at 24 months for each vaccine from Q1-1999 to Q1-2019.Community Healthcare Organisations (CHOs) The target uptake of ≥95% was reached in only four CHOs for D3, P3, T3, Hib3, and Polio3, three for HepB3,
two for MenBcomplete and one for MMR1, PCV3, and Rota2, and in none for the remainder (table 3).Local Health Office (LHO) Immunisation uptake rates in children 24 months of age in Q1-2019 are presented by LHO in Appendix 2. Immunisation uptake rates of some vaccines are mapped by LHO in figures 8-18. In Q1 2019, among LHOs reporting data, the target uptake of ≥95% was reached in 14 LHOs for D3, T3, P3,
Hib3, and Polio3, 13 for HepB3, 5 for MenBcomplete, 4 for MMR1 and Rota2, 3 for Hibb, MenB3 and PCV3, 2for MenCb, 1 for MenC2 and PCVb and in none for Hib4.
In comparison:o in Q4 2018 the target uptake of ≥95% was reached in 14 LHOs for D3, T3, P3, Hib3, Polio3 and HepB3,7
for MMR1, 6 for Hibb, 4 for MenCb, 3 for PCV3 and Rota2, 2 for MenB3 and MenBcomplete, and 1 for Hib4,MenC2 and PCVb.
o in Q3 2018 the target uptake of ≥95% was reached in 17 LHOs for D3, T3, P3, Hib3, Polio3 and HepB3, 9for MMR1, 7 for PCVb, 5 for Hibb, 3 for MenC2 and PCV3 and 1 for MenCb.
o in Q2 2018 the target uptake of ≥95% was reached in 16 LHOs for D3, T3, P3, Hib3 and Polio3, 14 forHepB3, 8 for PCVb, 5 for MMR1, 3 for PCV3, 2 for Hibb, 1 for MenC2 and none for MenCb.
o in Q1 2018 the target uptake of ≥95% was reached in 17 LHOs for D3, T3, P3, Hib3 and Polio3, 16 forHepB3, 10 for MMR1, 8 for PCVb, 4 for Hibb and PCV3, 1 for MenCb, and none for MenC2.
The immunisation uptake rates by Quarter and LHO are available at www.hpsc.ie Changes in uptake by LHO in Q1 2019 compared to Q4 2018 (unless otherwise stated):
o CHO1 Q1 2019 CN/MN rates ranged from 84% (PCV3) to 98% (D3/T3/P3/Hib3/Polio3/HepB3). Donegal uptake rates all declined by 2-5%. Uptake rates ranged from 75% (for PCV3) to
91% (for D3/T3/P3/Hib3/Polio3/MenBcomplete) in Q1 2019.No vaccine reached the target of >=95% in Q1 2019.This is the third quarter in a row that D3/T3/P3/Hib3/Polio3 were below 95% and are theirlowest (91%) since LHO data were included in the national reports in 2007.
SO/LM D3/T3/P3/Hib3/Polio3/HepB3/PCVb/MMR1 uptake improved by 1-3%, MenBcomplete
was unchanged while the remainder declined by 1-4%.Uptake rates ranged from 84% (for Hib4) to 97% (for D3/T3/P3/Hib3/Polio3)
o CHO2 MenBcomplete data was not previously flagged with the CHOs to be provided, and as a
result CHO2 were not in a position to provide it in Q4 2018 but could in Q1 2019. G uptake rates all improved by 1-4%.
Uptake rates ranged from 88% (for Hib4) to 98% for (PCV3).o Mayo Hibb/MenC2 declined by 1%, Hib4/MenCb/PCV3/PCVb/Rota2 improved by 1-3%
while the remainder were unchanged.D3/T3/P3/Hib3/Polio3/HepB3/ PCV3/Rota2 were all >= target of 95%.Uptake rates ranged from 81% (for Hib4) to 98% for (Rota2).
RN Hib4 declined by 6%, Hibb/MenC2 declined by 3%,D3/T3/P3/Hib3/Polio3/HepB3/MenB3/MMR1 declined by 1%, Rota2/PCVb improved by 1%,and MenCb/PCV3 were unchanged.All vaccines (except Hib4) were >= target of 95%.Uptake rates ranged from 92% (for Hib4) to 99% (for MenBcomplete).
o CHO3 MenC2, Hib4 and MenBcomplete data were not available. CE MMR1 declined by 3%, DTP3 declined by 1%, Hibb/MenCb improved by 2-3%, while
the remainder were unchanged.D3/T3/P3/Hib3/Polio3/HepB3/Hibb were all >= target of 95%.Uptake rates ranged from 88% (for PCV3) to 96% (for Hibb).
Limerick MMR1 declined by 1%, PCV3/Rota2 were unchanged while the remainderimproved by 1%.
Q1 2019 August, 2019 10
D3/T3/P3/Hib3/Polio3/HepB3/Hibb/MenCb were all >= target of 95%.Uptake rates ranged from 89% (for PCV3) to 95% (forD3/T3/P3/Hib3/Polio3/HepB3/Hibb/MenCb).
TN/EL rates all declined by 2-4%None of the vaccine rates reached the target of 95% in this quarter.Uptake rates ranged from 85% (for PCV3) to 93% (for D3/T3/P3/Hib3/Polio3/HepB3).
o CHO4 MenC2 and Hib4 data unavailable. NC MenCb improved by 4%, Hibb and PCVb improved by 3%, while the remainder were
either unchanged or changed by +1% or -1%.D3/T3/P3/Hib3/Polio3/HepB3 reached the target of 95%.Uptake rates ranged from 89% (for Hibb/PCV3) to 96% (for D3/T3/P3/Hib3/Polio3/HepB3).
NSL MenCb/PCV3/PCVb/MMR1 declined by 1-2%, Rota2 improved by 3% while theremainder were unchanged.D3/T3/P3/Hib3/Polio3/HepB3 were all >= target of 95%.Uptake rates ranged from 86% (for PCV3) to 95% (for D3/T3/P3/Hib3/Polio3/HepB3).
WC uptake rates declined by 4-10%(WC uptake had increased by 1-6% in Q4 compared to Q3, had decreased by 4-8% in Q3
compared to Q2 and in Q2 compared to Q1 it had increased by 2-8%).No vaccine reached the target of 95% in Q1.Uptake rates ranged from 79% (for Hibb/PCV3) to 91% (for D3/T3/P3/Hib3/Polio3/HepB3).
KY PCV3 declined by 2%, MenB3/MenBcomplete improved by 2%, Rota2 improved by 1%,MenCb declined by 1%, while the remainder were unchanged.No vaccine reached the target of 95% in this quarter.Uptake rates ranged from 85% (for PCV3) to 94% (for D3/T3/P3/Hib3/Polio3/HepB3).
o CHO5 MenC2 data were unavailable. CW/KK rates declined by 1-4% except Hibb/MenCb/PCV3/MMR1 were unchanged.
No vaccine reached the target of 95% in this quarter.Hibb/Hib4/MenCb/PCV3/PCVb were all 78-84%.Uptake rates range from 78% (for Hib4) to 89% (forD3/T3/P3/Hib3/Polio3/HepB3/MenBcomplete/MMR1).Since data by LHO was first collected nationally in 2007 D3/T3/P3/Hib3/Polio3 was <90%previously in Q1 2008.This Q1 2019 24 month cohort was 12 months of age in Q1 2018 (born 01/01/17-31/03/17). The Q1 2018 12 month uptake rates declined by 2-3% in Q1 2018 compared toQ4 2017 and were mostly 86-88% (except MenB2 was 92%).Uptake at 12 months of the D3/T3/P3/Hib3/Polio3/PCV2 vaccines were <90% between Q12017 and Q3 2018 but were mostly >90% prior to this and D3/T3/P3/Hib3/Polio3 improvedto 90% in Q4 2018 and Q1 2019.
TS Hib4/Hibb/MenCb declined by 1-2%, Rota2 improved by 3%, MenB3 improved by 2%,while the remainder improved by 1% or were unchanged.D3/T3/P3/Hib3/Polio3/HepB3/MenBcomplete were all >= target of 95%.Uptake rates ranged from 85% (for Hib4) to 97% (for D3/T3/P3/Hib3/Polio3/HepB3).
WD PCVb declined by 3%, Hib4/Hibb/MenCb declined by 2%, MMR1 improved by 2%while the remainder were unchanged or changed by +1% or -1%.No vaccine reached the target of 95% in this quarter.Uptake rates ranged from 78% (for Hib4) to 90% (for D3/T3/P3/Hib3/Polio3/HepB3).
WX MenB3 and MMR improved by 3%, Rota2 and HepB3 improved by 2%, Hib4
declined by 3% while the remainder were unchanged or changed by +1% or -1%.No vaccine reached the target of 95%.Uptake rates ranged from 81% (for Hib4) to 94% (for D3/T3/P3/Hib3/Polio3/HepB3).This is the third quarter in a row that D3/T3/P3/Hib3/Polio3/HepB3 are below 95% whereasthey were mostly >=95% since Q2 2011.
o CHO6 MenC2 and Hib4 data were unavailable. DS rates declined by 1-3% except Rota2 was unchanged. D3/T3/P3/Hib3/Polio3/HepB3
were previously 91% in Q1 2011.No vaccine reached the target of 95%.Uptake rates ranged from 86% (for PCV3) to 91% (forD3/T3/P3/Hib3/Polio3/HepB3/MMR1).
DSE D3/T3/P3/Hib3/Polio3/HepB3/Rota2 declined by 4% while the rest declined by 6-9%.No vaccine reached the target of 95% in this quarter.Uptake rates ranged from 84% (for PCV3) to 92% (for D3/T3/P3/Hib3/Hibb/Polio3/HepB3).
WW rates declined by 4-10%.No vaccine reached the target of 95% and all were <84%.Uptake rates ranging from 73% (for PCV3) to 83% (for D3/T3/P3/Hib3/Polio3/HepB3).
Q1 2019 August, 2019 11
o CHO7 MenC2 and Hib4 data were unavailable. DSC Rota2 and MMR1 were unchanged while the rest improved by 1-5%.
No vaccine reached the target of >= 95%.Uptake rates ranged from 87% (for PCV3) to 93% (for D3/T3/P3/Hib3/Polio3/HepB3).
DSW PCV3 and MenBcomplete declined by 3%, MenB3 and PCVb declined by 2%, MMR1
and HepB3 declined by 1%, Rota2 improved by 1% while the remainder were unchanged.D3/T3/P3/Hib3/Polio3/ reached the target of >= 95%.Uptake rates ranged from 85% (for PCV3) to 95% (for D3/T3/P3/Hib3/Polio3).
DW Rota2 improved by 1% while the remainder declined by 1-3%.No vaccine reached the target of 95% in this quarter.Uptake rates ranged from 80% (for PCV3) to 90% for (forD3/T3/P3/Hib3/Polio3/HepB3/Rota2).
KE rates were unchanged or changed by +1% or -1%.No vaccine reached the target of 95% in this quarter.Uptake rates ranged from 87% (for PCV3) to 93% (for D3/T3/P3/Hib3/Polio3/HepB3).
o CHO8 LS/OY Rota2 improved by 3% while the rest were unchanged or declined by 1-2%.
D3/T3/P3/Hib3/Polio3/HepB3/MenB3/MenBcomplete/Rota2/MMR1 reached the target of >=95% in this quarter.Uptake rates ranged from 91% (for Hib4/MenC2/PCV3) to 97% (forD3/T3/P3/Hib3/Polio3/HepB3).
LD/WH uptake rates were unchanged or declined by 1-2%.Uptake rates ranged from 91% (for MenC2 and Rota2) to 96% (forD3/T3/P3/Hib3/Polio3/HepB3).D3/T3/P3/Hib3/Polio3/HepB3/MenCb/MenBcomplete/MMR1 reached the target of >=95%.
Q4 2018 data for Louth and Meath were not available at the time of the data extraction forthe Q4 report.
Louth No vaccine reached the target of 95% in this quarter and rates ranged from 82%(for MenCb/PCV3) to 92% for D3/T3/P3/Hib3/Polio3/HepB3.
Meath No vaccine reached the target of 95% in this quarter and rates ranged from 79%(for PCV3) to 90% for D3/T3/P3/Hib3/Polio3/HepB3.
o CHO9 MenC2 and Hib4 data were unavailable. DNW D3/T3/P3/Hib3/Polio3/HepB3/Rota2 were unchanged while the remainder declined
by 2-3%.D3/T3/P3/Hib3/Polio3/HepB3 reached the target of >=95%.Uptake rates ranged from 86% (for PCV3) to 96% for D3/T3/P3/Hib3/Polio3/HepB3.
DNC MenCb declined by 9%, Hibb declined by 8%, PCV3/PCVb declined by 6%,D3/T3/P3/Hib3/Polio3/HepB3/MenBcomplete declined by 4%, MenB3 declined by 3%, Rota2
declined by 2%, and MMR1 declined by 1%.Uptake rates ranged from 83% (for PCV3) to 93% for MMR1.No vaccine reached the target of >=95%.
DN Hibb declined by 2%, MenB3 was unchanged while the remainder declined by 1%.No vaccine reached the target of 95% in this quarter.Uptake rates ranged from 83% (for PCV3) to 91% (for D3/T3/P3/Hib3/Polio3/HepB3).
Q1 2019 August, 2019 12
A BN
EW
S
0 - 7980 - 8485 - 8990 - 9495 - 100No Data
G
L
DL
KY
MO
CE
TS
RN
NC
MH
NSL
WX
LS/OY
WC
SO/LM
WD
LD/WH
LHCN/MN
CW/KK
WWTN/EL
KE/WW
DN
DW
DNW
DSW DSDSE
DNC
DSC
DN
DW
DNW
DSW DSDSE
DNC
DSC
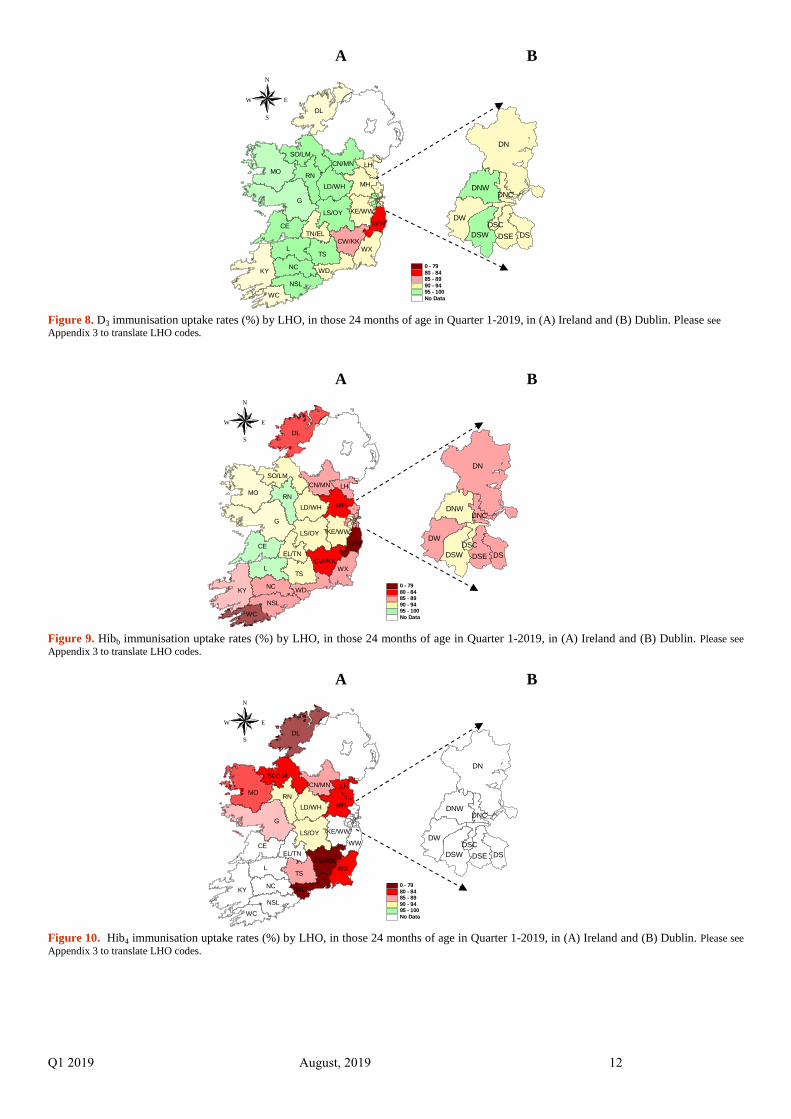
Figure 8. D3 immunisation uptake rates (%) by LHO, in those 24 months of age in Quarter 1-2019, in (A) Ireland and (B) Dublin. Please seeAppendix 3 to translate LHO codes.
A BN
EW
S
0 - 7980 - 8485 - 8990 - 9495 - 100No Data
G
L
DL
KY
MO
CE
TS
RN
NC
MH
NSL
WX
LS/OY
WC
SO/LM
WD
LD/WH
LHCN/MN
CW/KK
WWEL/TN
KE/WW
DN
DW
DNW
DSW DSDSE
DNC
DSC
DN
DW
DNW
DSW DSDSE
DNC
DSC
Figure 9. Hibb immunisation uptake rates (%) by LHO, in those 24 months of age in Quarter 1-2019, in (A) Ireland and (B) Dublin. Please seeAppendix 3 to translate LHO codes.
A BN
EW
S
0 - 7980 - 8485 - 8990 - 9495 - 100No Data
G
L
DL
KY
MO
CE
TS
RN
NC
MH
NSL
WX
LS/OY
WC
SO/LM
WD
LD/WH
LHCN/MN
CW/KK
WWEL/TN
KE/WW
DN
DW
DNW
DSW DSDSE
DNC
DSC
DN
DW
DNW
DSW DSDSE
DNC
DSC
Figure 10. Hib4 immunisation uptake rates (%) by LHO, in those 24 months of age in Quarter 1-2019, in (A) Ireland and (B) Dublin. Please seeAppendix 3 to translate LHO codes.
Q1 2019 August, 2019 13
A BN
EW
S
0 - 7980 - 8485 - 8990 - 9495 - 100No Data
G
L
DL
KY
MO
CE
TS
RN
NC
MH
NSL
WX
LS/OY
WC
SO/LM
WD
LD/WH
LHCN/MN
CW/KK
WWEL/TN
KE/WW
DN
DW
DNW
DSW DSDSE
DNC
DSC
DN
DW
DNW
DSW DSDSE
DNC
DSC
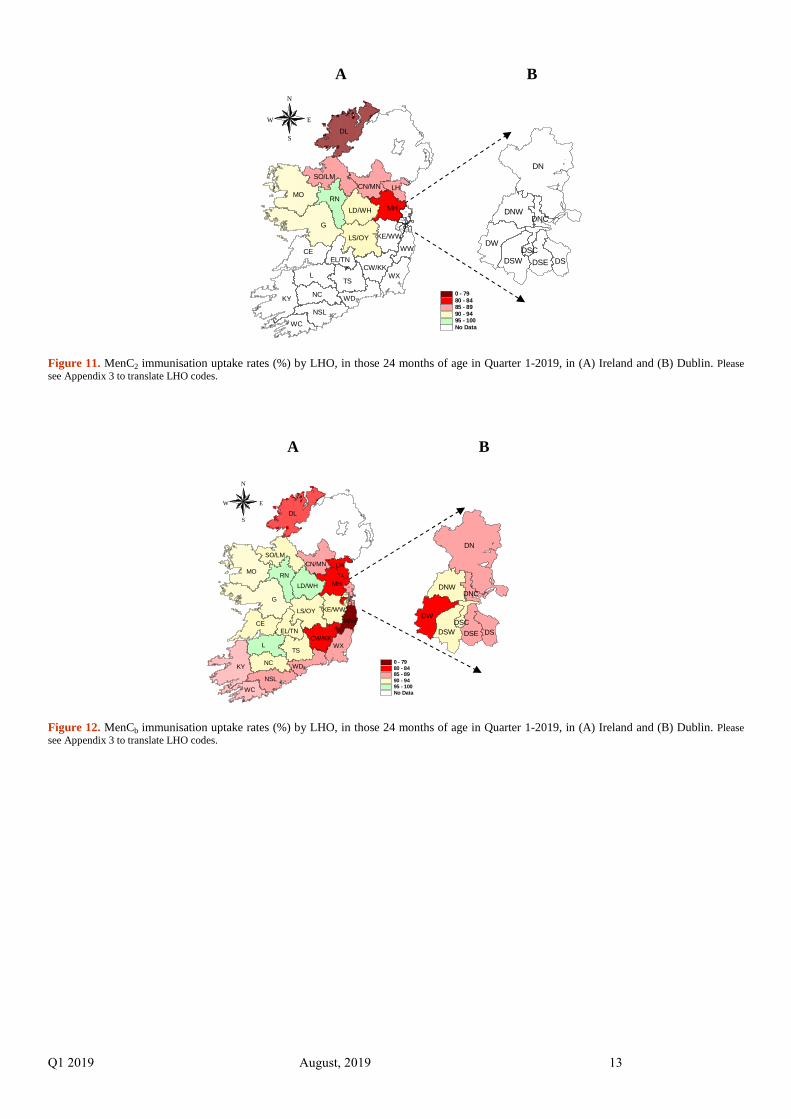
Figure 11. MenC2 immunisation uptake rates (%) by LHO, in those 24 months of age in Quarter 1-2019, in (A) Ireland and (B) Dublin. Pleasesee Appendix 3 to translate LHO codes.
A B
N
EW
S
0 - 7980 - 8485 - 8990 - 9495 - 100No Data
G
L
DL
KY
MO
CE
TS
RN
NC
MH
NSL
WX
LS/OY
WC
SO/LM
WD
LD/WH
LHCN/MN
CW/KK
WWEL/TN
KE/WW
DN
DW
DNW
DSW DSDSE
DNC
DSC
DN
DW
DNW
DSW DSDSE
DNC
DSC
Figure 12. MenCb immunisation uptake rates (%) by LHO, in those 24 months of age in Quarter 1-2019, in (A) Ireland and (B) Dublin. Pleasesee Appendix 3 to translate LHO codes.
Q1 2019 August, 2019 14
A B
No Data95 - 10090 - 9485 - 8980 - 840 - 79
% Immunisation Uptake
G
L
DL
KY
MO
CE
TS
RN
NC
MH
NSL
WX
LS/OY
WC
SO/LM
WD
KE/WW
LD/WH
LHCN/MN
CW/KKTN/EL
WW
DN
DW
DNW
DSW DSDSE
DNC
DSC
DSC
DNC
DSE DSDSW
DNW
DW
DN
N
EW
S
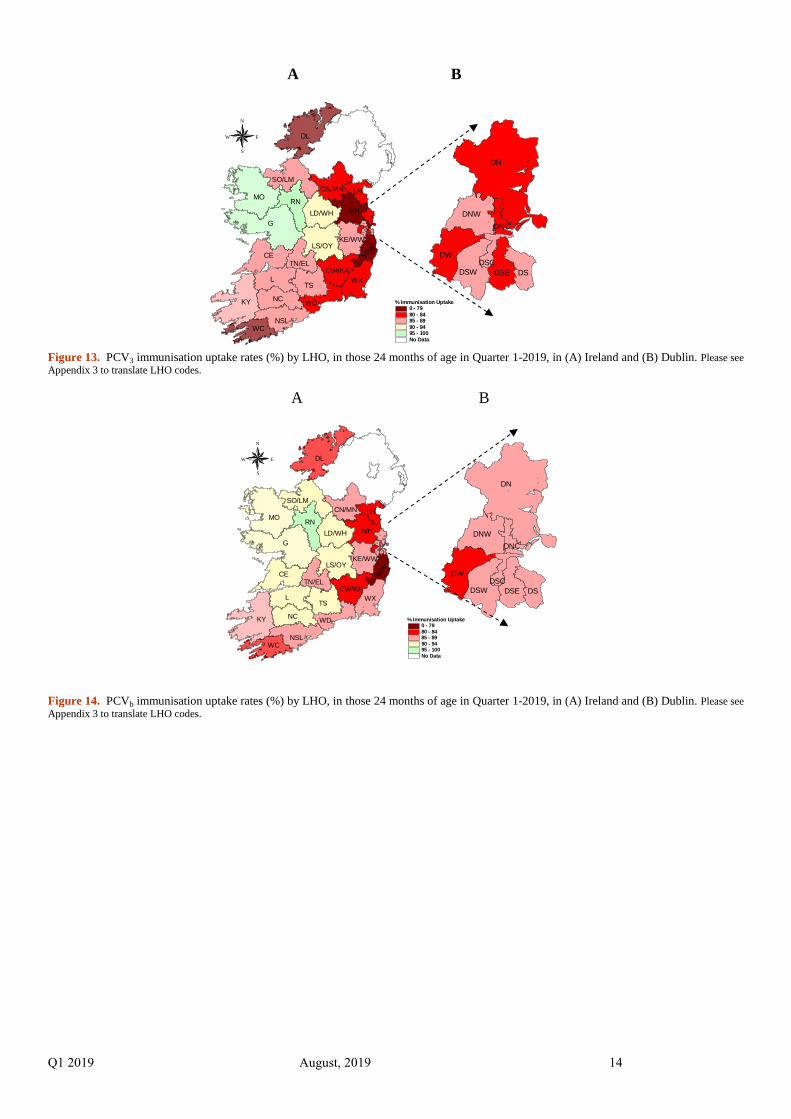
Figure 13. PCV3 immunisation uptake rates (%) by LHO, in those 24 months of age in Quarter 1-2019, in (A) Ireland and (B) Dublin. Please seeAppendix 3 to translate LHO codes.
A B
No Data95 - 10090 - 9485 - 8980 - 840 - 79
% Immunisation Uptake
G
L
DL
KY
MO
CE
TS
RN
NC
MH
NSL
WX
LS/OY
WC
SO/LM
WD
KE/WW
LD/WH
LHCN/MN
CW/KKTN/EL
WW
DN
DW
DNW
DSW DSDSE
DNC
DSC
DSC
DNC
DSE DSDSW
DNW
DW
DN
N
EW
S
Figure 14. PCVb immunisation uptake rates (%) by LHO, in those 24 months of age in Quarter 1-2019, in (A) Ireland and (B) Dublin. Please seeAppendix 3 to translate LHO codes.
Q1 2019 August, 2019 15
A B
No Data95 - 10090 - 9485 - 8980 - 840 - 79
% Immunisation Uptake
G
L
DL
KY
MO
CE
TS
RN
NC
MH
NSL
WX
LS/OY
WC
SO/LM
WD
KE/WW
LD/WH
LH
CW/KKTN/EL
WW
DN
DW
DNW
DSW DSDSE
DNC
DSC
DSC
DNC
DSE DSDSW
DNW
DW
DN
N
EW
S
CN/MN
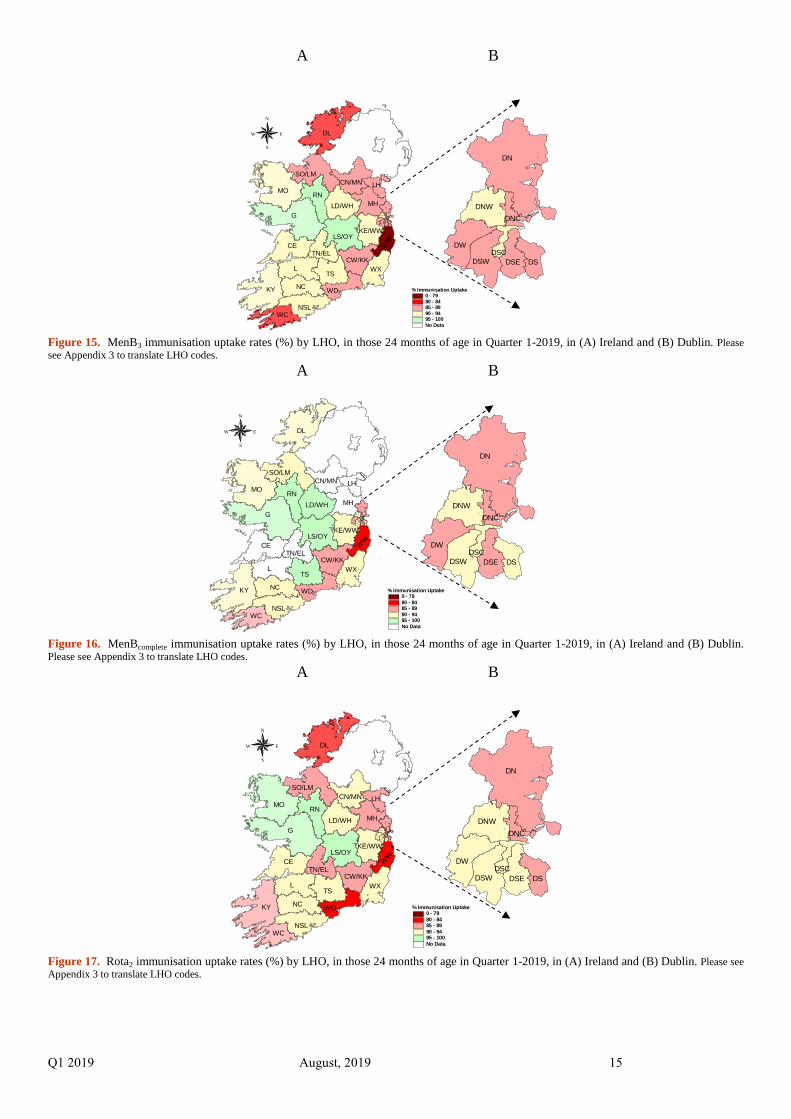
Figure 15. MenB3 immunisation uptake rates (%) by LHO, in those 24 months of age in Quarter 1-2019, in (A) Ireland and (B) Dublin. Pleasesee Appendix 3 to translate LHO codes.
A B
No Data95 - 10090 - 9485 - 8980 - 840 - 79
% Immunisation Uptake
G
L
DL
KY
MO
CE
TS
RN
NC
MH
NSL
WX
LS/OY
WC
SO/LM
WD
KE/WW
LD/WH
LH
CW/KKTN/EL
WW
DN
DW
DNW
DSW DSDSE
DNC
DSC
DSC
DNC
DSE DSDSW
DNW
DW
DN
N
EW
S
CN/MN
Figure 16. MenBcomplete immunisation uptake rates (%) by LHO, in those 24 months of age in Quarter 1-2019, in (A) Ireland and (B) Dublin.Please see Appendix 3 to translate LHO codes.
A B
N
EW
S
No Data95 - 10090 - 9485 - 8980 - 840 - 79
% Immunisation Uptake
G
L
DL
KY
MO
CE
TS
RN
NC
MH
NSL
WX
LS/OY
WC
SO/LM
WD
KE/WW
LD/WH
LHCN/MN
CW/KKTN/EL
WW
DN
DW
DNW
DSW DSDSE
DNC
DSC
DSC
DNC
DSE DSDSW
DNW
DW
DN
Figure 17. Rota2 immunisation uptake rates (%) by LHO, in those 24 months of age in Quarter 1-2019, in (A) Ireland and (B) Dublin. Please seeAppendix 3 to translate LHO codes.
Q1 2019 August, 2019 16
A B
No Data95 - 10090 - 9485 - 8980 - 840 - 79
% Immunisation Uptake
G
L
DL
KY
MO
CE
TS
RN
NC
MH
NSL
WX
LS/OY
WC
SO/LM
WD
KE/WW
LD/WH
LH
CW/KKTN/EL
WW
DN
DW
DNW
DSW DSDSE
DNC
DSC
DSC
DNC
DSE DSDSW
DNW
DW
DN
N
EW
S
CN/MN
Figure 18. MMR1 immunisation uptake rates (%) by LHO, in those 24 months of age in Quarter 1-2019, in (A) Ireland and (B) Dublin. Pleasesee Appendix 3 to translate LHO codes.
AcknowledgementsHPSC would like to thank all those involved in childhood immunisation including the General Practitioners, Practice Nurses, HSEAreas, Public Health Nurses, Immunisation Co-ordinators, Specialists in Public Health Medicine, Surveillance Scientists and SystemsAnalysts for their assistance.
Q1 2019 August, 2019 17
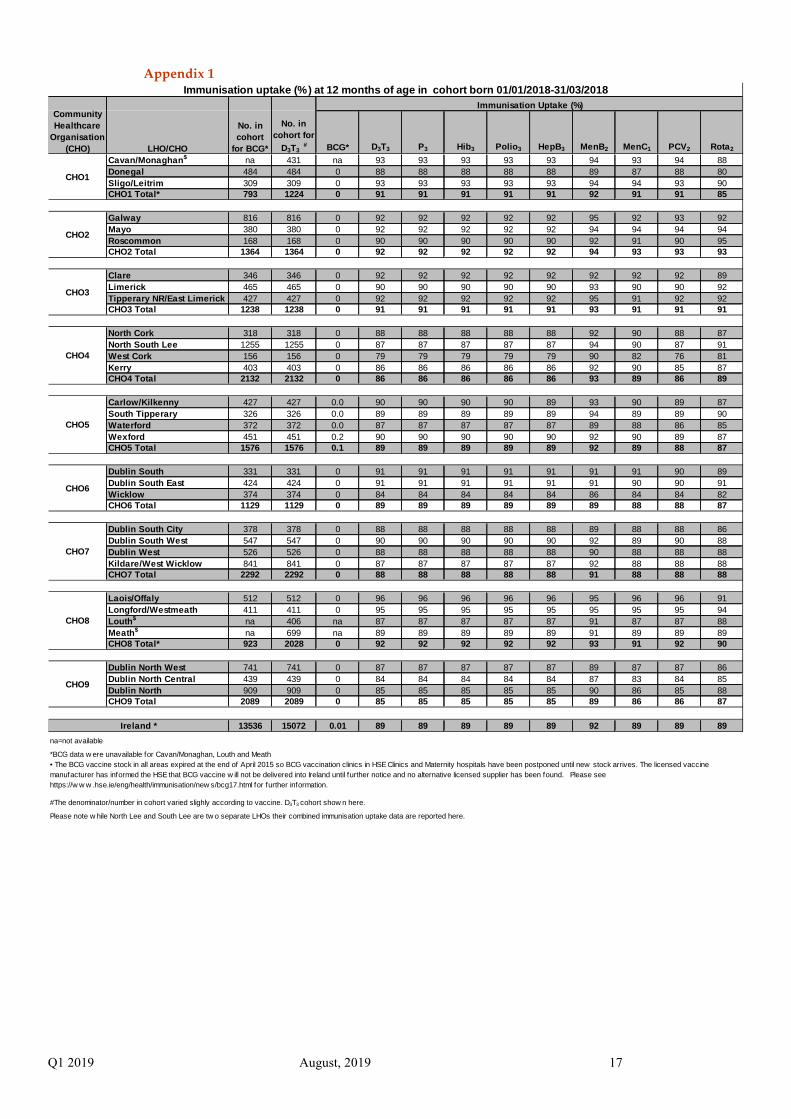
Appendix 1
BCG* D3T3 P3 Hib3 Polio3 HepB3 MenB2 MenC1 PCV2 Rota2
Cavan/Monaghan$ na 431 na 93 93 93 93 93 94 93 94 88Donegal 484 484 0 88 88 88 88 88 89 87 88 80Sligo/Leitrim 309 309 0 93 93 93 93 93 94 94 93 90CHO1 Total* 793 1224 0 91 91 91 91 91 92 91 91 85
Galway 816 816 0 92 92 92 92 92 95 92 93 92Mayo 380 380 0 92 92 92 92 92 94 94 94 94Roscommon 168 168 0 90 90 90 90 90 92 91 90 95CHO2 Total 1364 1364 0 92 92 92 92 92 94 93 93 93
Clare 346 346 0 92 92 92 92 92 92 92 92 89Limerick 465 465 0 90 90 90 90 90 93 90 90 92Tipperary NR/East Limerick 427 427 0 92 92 92 92 92 95 91 92 92CHO3 Total 1238 1238 0 91 91 91 91 91 93 91 91 91
North Cork 318 318 0 88 88 88 88 88 92 90 88 87North South Lee 1255 1255 0 87 87 87 87 87 94 90 87 91West Cork 156 156 0 79 79 79 79 79 90 82 76 81Kerry 403 403 0 86 86 86 86 86 92 90 85 87CHO4 Total 2132 2132 0 86 86 86 86 86 93 89 86 89
Carlow/Kilkenny 427 427 0.0 90 90 90 90 89 93 90 89 87South Tipperary 326 326 0.0 89 89 89 89 89 94 89 89 90Waterford 372 372 0.0 87 87 87 87 87 89 88 86 85Wexford 451 451 0.2 90 90 90 90 90 92 90 89 87CHO5 Total 1576 1576 0.1 89 89 89 89 89 92 89 88 87
Dublin South 331 331 0 91 91 91 91 91 91 91 90 89Dublin South East 424 424 0 91 91 91 91 91 91 90 90 91Wicklow 374 374 0 84 84 84 84 84 86 84 84 82CHO6 Total 1129 1129 0 89 89 89 89 89 89 88 88 87
Dublin South City 378 378 0 88 88 88 88 88 89 88 88 86Dublin South West 547 547 0 90 90 90 90 90 92 89 90 88Dublin West 526 526 0 88 88 88 88 88 90 88 88 88Kildare/West Wicklow 841 841 0 87 87 87 87 87 92 88 88 88CHO7 Total 2292 2292 0 88 88 88 88 88 91 88 88 88
Laois/Offaly 512 512 0 96 96 96 96 96 95 96 96 91Longford/Westmeath 411 411 0 95 95 95 95 95 95 95 95 94Louth$ na 406 na 87 87 87 87 87 91 87 87 88Meath$ na 699 na 89 89 89 89 89 91 89 89 89CHO8 Total* 923 2028 0 92 92 92 92 92 93 91 92 90
Dublin North West 741 741 0 87 87 87 87 87 89 87 87 86Dublin North Central 439 439 0 84 84 84 84 84 87 83 84 85Dublin North 909 909 0 85 85 85 85 85 90 86 85 88CHO9 Total 2089 2089 0 85 85 85 85 85 89 86 86 87
13536 15072 0.01 89 89 89 89 89 92 89 89 89na=not available
*BCG data w ere unavailable for Cavan/Monaghan, Louth and Meath
Immunisation uptake (%) at 12 months of age in cohort born 01/01/2018-31/03/2018
CommunityHealthcare
Organisation(CHO) LHO/CHO
No. incohort
for BCG*
No. incohort for
D3T3#
Immunisation Uptake (%)
CHO1
CHO2
CHO3
CHO4
CHO5
CHO6
Please note w hile North Lee and South Lee are tw o separate LHOs their combined immunisation uptake data are reported here.
CHO7
CHO8
CHO9
Ireland *
• The BCG vaccine stock in all areas expired at the end of April 2015 so BCG vaccination clinics in HSE Clinics and Maternity hospitals have been postponed until new stock arrives. The licensed vaccinemanufacturer has informed the HSE that BCG vaccine w ill not be delivered into Ireland until further notice and no alternative licensed supplier has been found. Please seehttps://w w w .hse.ie/eng/health/immunisation/new s/bcg17.html for further information.
#The denominator/number in cohort varied slighly according to vaccine. D3T3 cohort show n here.
Q1 2019 August, 2019 18
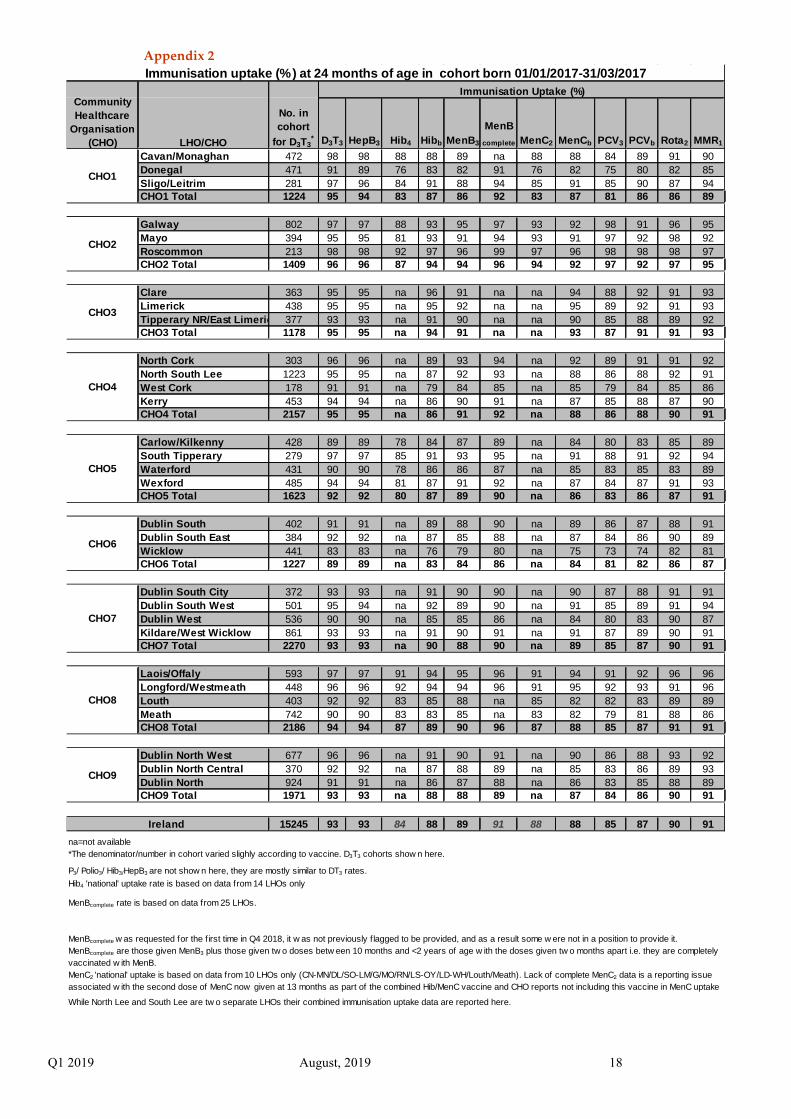
Appendix 2
D3T3 HepB3 Hib4 Hibb MenB3
MenBcomplete MenC2 MenCb PCV3 PCVb Rota2 MMR1
Cavan/Monaghan 472 98 98 88 88 89 na 88 88 84 89 91 90Donegal 471 91 89 76 83 82 91 76 82 75 80 82 85Sligo/Leitrim 281 97 96 84 91 88 94 85 91 85 90 87 94CHO1 Total 1224 95 94 83 87 86 92 83 87 81 86 86 89
Galway 802 97 97 88 93 95 97 93 92 98 91 96 95Mayo 394 95 95 81 93 91 94 93 91 97 92 98 92Roscommon 213 98 98 92 97 96 99 97 96 98 98 98 97CHO2 Total 1409 96 96 87 94 94 96 94 92 97 92 97 95
Clare 363 95 95 na 96 91 na na 94 88 92 91 93Limerick 438 95 95 na 95 92 na na 95 89 92 91 93Tipperary NR/East Limerick 377 93 93 na 91 90 na na 90 85 88 89 92CHO3 Total 1178 95 95 na 94 91 na na 93 87 91 91 93
North Cork 303 96 96 na 89 93 94 na 92 89 91 91 92North South Lee 1223 95 95 na 87 92 93 na 88 86 88 92 91West Cork 178 91 91 na 79 84 85 na 85 79 84 85 86Kerry 453 94 94 na 86 90 91 na 87 85 88 87 90CHO4 Total 2157 95 95 na 86 91 92 na 88 86 88 90 91
Carlow/Kilkenny 428 89 89 78 84 87 89 na 84 80 83 85 89South Tipperary 279 97 97 85 91 93 95 na 91 88 91 92 94Waterford 431 90 90 78 86 86 87 na 85 83 85 83 89Wexford 485 94 94 81 87 91 92 na 87 84 87 91 93CHO5 Total 1623 92 92 80 87 89 90 na 86 83 86 87 91
Dublin South 402 91 91 na 89 88 90 na 89 86 87 88 91Dublin South East 384 92 92 na 87 85 88 na 87 84 86 90 89Wicklow 441 83 83 na 76 79 80 na 75 73 74 82 81CHO6 Total 1227 89 89 na 83 84 86 na 84 81 82 86 87
Dublin South City 372 93 93 na 91 90 90 na 90 87 88 91 91Dublin South West 501 95 94 na 92 89 90 na 91 85 89 91 94Dublin West 536 90 90 na 85 85 86 na 84 80 83 90 87Kildare/West Wicklow 861 93 93 na 91 90 91 na 91 87 89 90 91CHO7 Total 2270 93 93 na 90 88 90 na 89 85 87 90 91
Laois/Offaly 593 97 97 91 94 95 96 91 94 91 92 96 96Longford/Westmeath 448 96 96 92 94 94 96 91 95 92 93 91 96Louth 403 92 92 83 85 88 na 85 82 82 83 89 89Meath 742 90 90 83 83 85 na 83 82 79 81 88 86CHO8 Total 2186 94 94 87 89 90 96 87 88 85 87 91 91
Dublin North West 677 96 96 na 91 90 91 na 90 86 88 93 92Dublin North Central 370 92 92 na 87 88 89 na 85 83 86 89 93Dublin North 924 91 91 na 86 87 88 na 86 83 85 88 89CHO9 Total 1971 93 93 na 88 88 89 na 87 84 86 90 91
15245 93 93 84 88 89 91 88 88 85 87 90 91na=not available
P3/ Polio3/ Hib3/HepB3 are not show n here, they are mostly similar to DT3 rates.Hib4 'national' uptake rate is based on data from 14 LHOs only
MenBcomplete rate is based on data from 25 LHOs.
While North Lee and South Lee are tw o separate LHOs their combined immunisation uptake data are reported here.
Immunisation uptake (%) at 24 months of age in cohort born 01/01/2017-31/03/2017
CommunityHealthcare
Organisation(CHO) LHO/CHO
No. incohort
for D3T3*
Immunisation Uptake (%)
CHO1
CHO2
CHO3
CHO4
CHO5
CHO6
CHO7
CHO8
CHO9
Ireland
*The denominator/number in cohort varied slighly according to vaccine. D3T3 cohorts show n here.
MenBcomplete w as requested for the f irst time in Q4 2018, it w as not previously f lagged to be provided, and as a result some w ere not in a position to provide it.MenBcomplete are those given MenB3 plus those given tw o doses betw een 10 months and <2 years of age w ith the doses given tw o months apart i.e. they are completelyvaccinated w ith MenB.MenC2 'national' uptake is based on data from 10 LHOs only (CN-MN/DL/SO-LM/G/MO/RN/LS-OY/LD-WH/Louth/Meath). Lack of complete MenC2 data is a reporting issueassociated w ith the second dose of MenC now given at 13 months as part of the combined Hib/MenC vaccine and CHO reports not including this vaccine in MenC uptakerates
Q1 2019 August, 2019 19
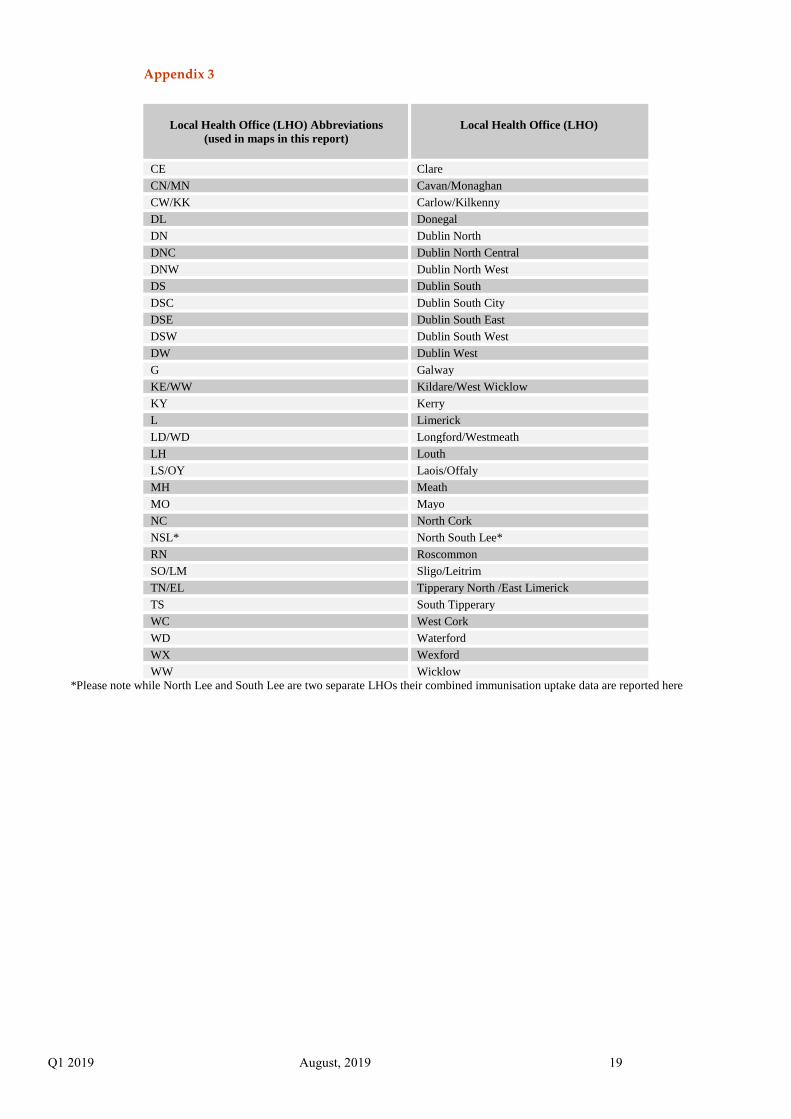
Appendix 3
Local Health Office (LHO) Abbreviations(used in maps in this report)
Local Health Office (LHO)
CE Clare
CN/MN Cavan/Monaghan
CW/KK Carlow/Kilkenny
DL Donegal
DN Dublin North
DNC Dublin North Central
DNW Dublin North West
DS Dublin South
DSC Dublin South City
DSE Dublin South East
DSW Dublin South West
DW Dublin West
G Galway
KE/WW Kildare/West Wicklow
KY Kerry
L Limerick
LD/WD Longford/Westmeath
LH Louth
LS/OY Laois/Offaly
MH Meath
MO Mayo
NC North Cork
NSL* North South Lee*
RN Roscommon
SO/LM Sligo/Leitrim
TN/EL Tipperary North /East Limerick
TS South Tipperary
WC West Cork
WD Waterford
WX Wexford
WW Wicklow*Please note while North Lee and South Lee are two separate LHOs their combined immunisation uptake data are reported here