Embed Size (px)
Citation preview
49Report of the Auditor General • • • January 2014
4 Indicators of Financial Condition
Summary
The consolidated financial statements provide a snapshot of the Province’s financial position at its fiscal year end and the results of its operations, and changes in both cash flow and net debt for the preceding fiscal year. For the past four years, this Office has provided information on certain indicators of financial condition not included in the consolidated financial statements including comparative indicators for other provinces and territories. Several of these demonstrate the Province’s financial sustainability, flexibility, and vulnerability, and are recommended for reporting in the Public Sector Accounting Board’s Statement of Recommended Practice 4: Indicators of Financial Condition.
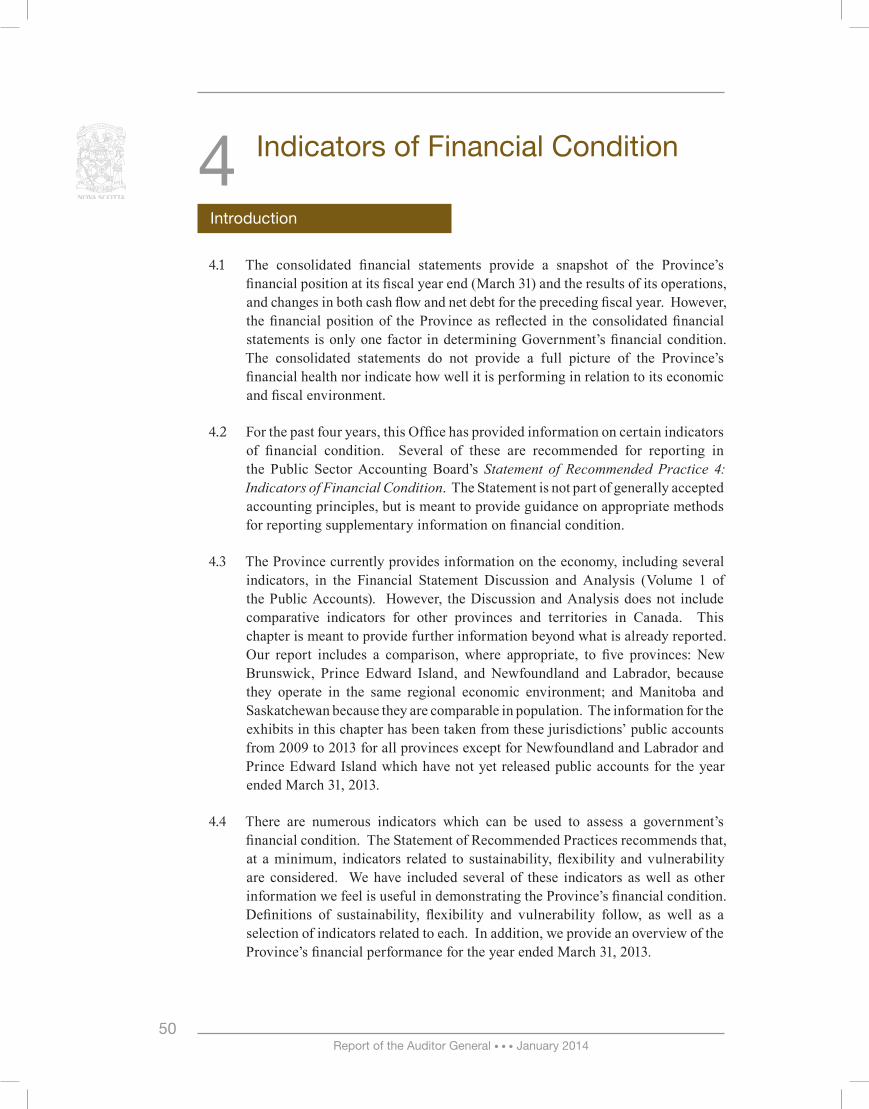
The indicators selected are for information purposes only. There was no significant change in nine of the 17 indicators we analyzed. There were changes in budget to actual variances in both operating results and capital expenditures.
The estimated deficit of $211.2 million for the year ended March 31, 2013 increased by 43.2% to $302.5 million. Lower than anticipated federal transfers were offset by increased Provincial source revenue. This was reduced by increased expenditures, especially in the Department of Health and Wellness. In addition, the net debt of the Province at March 31, 2013 increased from an estimate of $13.7 billion to an actual balance of $13.9 billion – a 5.3% increase. The Province’s net long term debt also increased from $12.7 billion at March 31, 2012 to $12.9 billion at March 31, 2013.
We examined estimated and actual capital asset expenditures by department. Capital expenditures in each of the Departments of Education, Health and Wellness, and Transportation and Infrastructure Renewal were under budget by an average of 15.5 %. The Department of Natural Resources’ capital expenditures exceeded budget by 2100%.
Net debt per capita continues to increase and remains the second-highest of all jurisdictions we compared. It increased from $14,161 in 2012 to $14,832 in 2013. We examined several other sustainability indicators in addition to net debt per capita and observed that four of the ten indicators had an unfavourable variance between 2012 and 2013.
50Report of the Auditor General • • • January 2014
4 Indicators of Financial Condition
Introduction
The consolidated financial statements provide a snapshot of the Province’s 4.1 financial position at its fiscal year end (March 31) and the results of its operations, and changes in both cash flow and net debt for the preceding fiscal year. However, the financial position of the Province as reflected in the consolidated financial statements is only one factor in determining Government’s financial condition. The consolidated statements do not provide a full picture of the Province’s financial health nor indicate how well it is performing in relation to its economic and fiscal environment.
For the past four years, this Office has provided information on certain indicators 4.2 of financial condition. Several of these are recommended for reporting in the Public Sector Accounting Board’s Statement of Recommended Practice 4: Indicators of Financial Condition. The Statement is not part of generally accepted accounting principles, but is meant to provide guidance on appropriate methods for reporting supplementary information on financial condition.
The Province currently provides information on the economy, including several 4.3 indicators, in the Financial Statement Discussion and Analysis (Volume 1 of the Public Accounts). However, the Discussion and Analysis does not include comparative indicators for other provinces and territories in Canada. This chapter is meant to provide further information beyond what is already reported. Our report includes a comparison, where appropriate, to five provinces: New Brunswick, Prince Edward Island, and Newfoundland and Labrador, because they operate in the same regional economic environment; and Manitoba and Saskatchewan because they are comparable in population. The information for the exhibits in this chapter has been taken from these jurisdictions’ public accounts from 2009 to 2013 for all provinces except for Newfoundland and Labrador and Prince Edward Island which have not yet released public accounts for the year ended March 31, 2013.
There are numerous indicators which can be used to assess a government’s 4.4 financial condition. The Statement of Recommended Practices recommends that, at a minimum, indicators related to sustainability, flexibility and vulnerability are considered. We have included several of these indicators as well as other information we feel is useful in demonstrating the Province’s financial condition. Definitions of sustainability, flexibility and vulnerability follow, as well as a selection of indicators related to each. In addition, we provide an overview of the Province’s financial performance for the year ended March 31, 2013.
Report of the Auditor General • • • January 201451
Indicators of Financial Condition
Summary of Financial Indicators
Type Indicator One-year Trend Five-year Trend Page #
Fina
ncia
l P
erfo
rman
ce
Budget-to-actual Variance Unfavourable A five-year trend is not applicable because the purpose of these indicators is to compare current year to the prior year.
52
Capital Expenditures Variance
Unfavourable 54
Actual-to-actual Variance N/A 52
Expenses by Department or type as a Percentage of Total Expenses
The trend differs by department
The trend differs by department.
53
Sus
tain
abili
ty
Long-term Debt Unfavourable Unfavourable 55
Net Debt Unfavourable Unfavourable 55
Net Debt Per Capita Unfavourable Unfavourable 56
Net Debt as a Percentage of Total Revenues
Stable Unfavourable 57
Annual Surplus or Deficit Unfavourable Unfavourable 58
Assets-to-liabilities Ratio Stable Favourable 59
Financial Assets-to-liabilities Ratio
Stable Stable 60
Net Debt as a Percentage of Provincial GDP
Stable Unfavourable 61
Accumulated Deficit as a Percentage of Provincial GDP
Stable Stable 61
Total Expenses as a Percentage of Provincial GDP
Stable Unfavourable 62
Flex
ibili
ty
Debt Servicing Costs as a Percentage of Total Revenues
Stable Stable 63
Net Book Value of Tangible Capital Assets as a Percentage of Costs of Capital Assets
Stable Unfavourable 64
Vuln
erab
ility
Federal Government Transfers as a Percentage of Total Revenues
Stable Unfavourable 65
Favourable/Unfavourable – theoretical concept due to nature and direction of indicator, not a comment on performance
N/A – increase or decrease of this indicator is not considered indicative of either favourable or unfavourable.
Stable – a change of 1% or less
Report of the Auditor General • • • January 2014 52
Indicators of Financial Condition
Financial Performance 2012-13
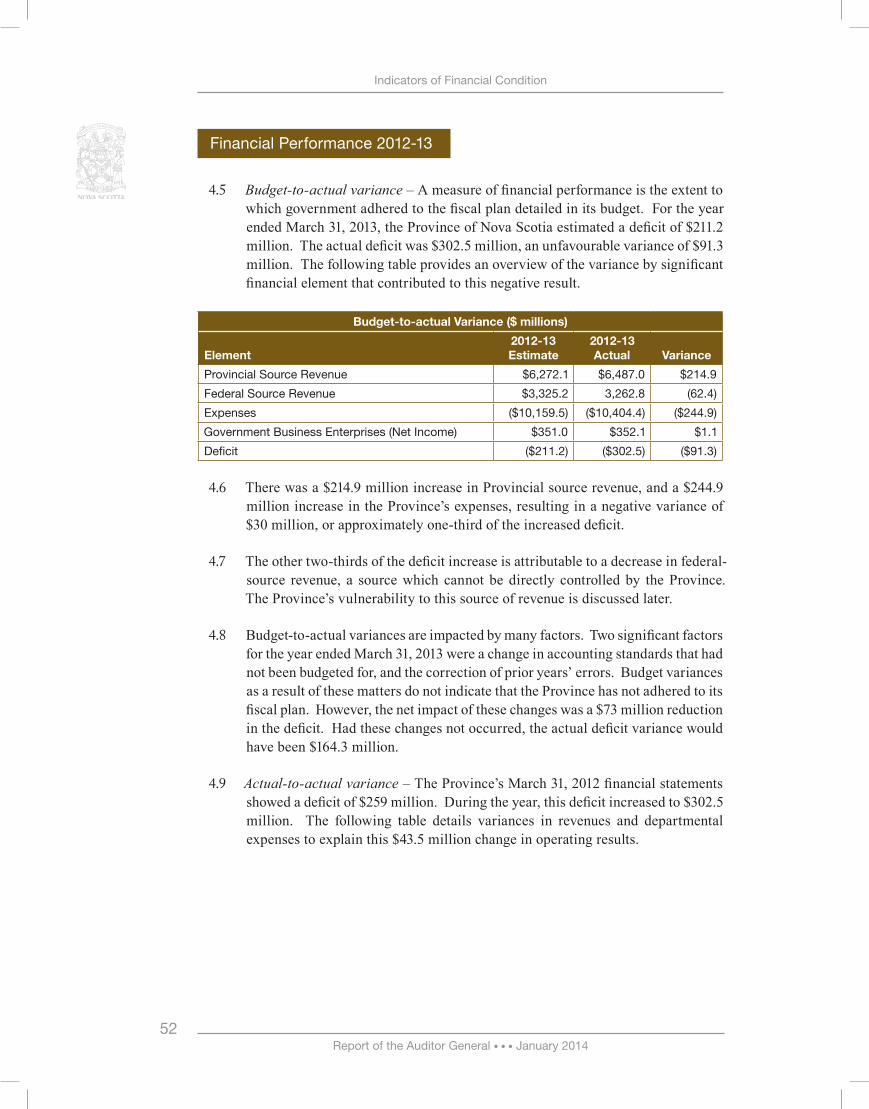
Budget-to-actual variance4.5 – A measure of financial performance is the extent to which government adhered to the fiscal plan detailed in its budget. For the year ended March 31, 2013, the Province of Nova Scotia estimated a deficit of $211.2 million. The actual deficit was $302.5 million, an unfavourable variance of $91.3 million. The following table provides an overview of the variance by significant financial element that contributed to this negative result.
Budget-to-actual Variance ($ millions)
Element2012-13 Estimate
2012-13 Actual Variance
Provincial Source Revenue $6,272.1 $6,487.0 $214.9
Federal Source Revenue $3,325.2 3,262.8 (62.4)
Expenses ($10,159.5) ($10,404.4) ($244.9)
Government Business Enterprises (Net Income) $351.0 $352.1 $1.1
Deficit ($211.2) ($302.5) ($91.3)
There was a $214.9 million increase in Provincial source revenue, and a $244.9 4.6 million increase in the Province’s expenses, resulting in a negative variance of $30 million, or approximately one-third of the increased deficit.
The other two-thirds of the deficit increase is attributable to a decrease in federal-4.7 source revenue, a source which cannot be directly controlled by the Province. The Province’s vulnerability to this source of revenue is discussed later.
Budget-to-actual variances are impacted by many factors. Two significant factors 4.8 for the year ended March 31, 2013 were a change in accounting standards that had not been budgeted for, and the correction of prior years’ errors. Budget variances as a result of these matters do not indicate that the Province has not adhered to its fiscal plan. However, the net impact of these changes was a $73 million reduction in the deficit. Had these changes not occurred, the actual deficit variance would have been $164.3 million.
Actual-to-actual variance4.9 – The Province’s March 31, 2012 financial statements showed a deficit of $259 million. During the year, this deficit increased to $302.5 million. The following table details variances in revenues and departmental expenses to explain this $43.5 million change in operating results.
Report of the Auditor General • • • January 201453
Indicators of Financial Condition
Actual-to-actual Variance ($ millions)
Revenues and Departmental Expenses Revenue ExpensesSurplus(Deficit)
2011-12 Deficit $9,760.3 $10,019.3 ($259.0)
Increased Provincial Tax Revenue $249.7
Increased Federal Revenue $83.5
Decreased Net Income from GBEs ($17.3)
Increased Other Provincial Revenue $26.5
Decreased Investment Income ($0.8)
Increased Economic and Rural Development Expenses
$53.1
Decreased Education Expenses ($38.8)
Increased Health and Wellness Expenses $146.4
Increased Restructuring Costs $43.1
Restructuring of Nova Scotia Agricultural College $37.0
Increased Pension Valuation Adjustment $67.3
Increased Debt Servicing Costs $58.5
Increased Other Expenses $18.5
2012-13 Deficit $10,101.9 $10,404.4 ($302.5)
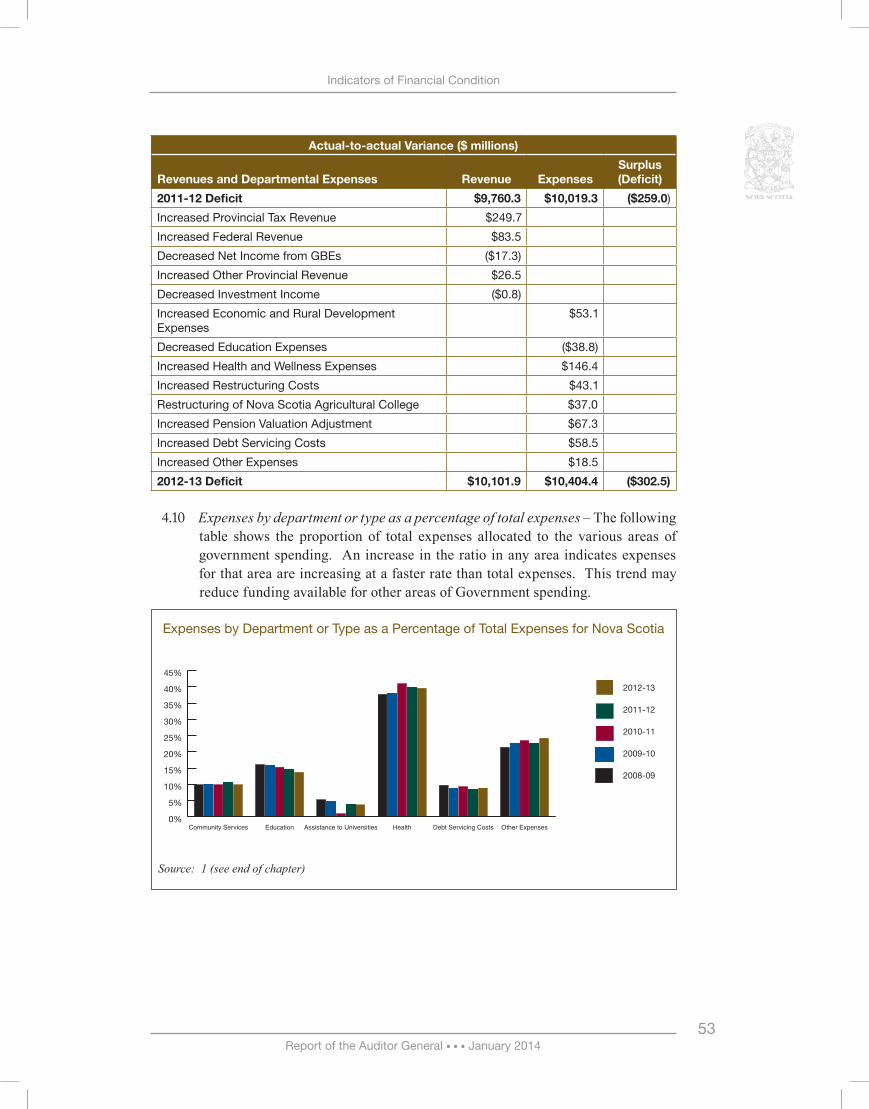
Expenses by department or type as a percentage of total expenses4.10 – The following table shows the proportion of total expenses allocated to the various areas of government spending. An increase in the ratio in any area indicates expenses for that area are increasing at a faster rate than total expenses. This trend may reduce funding available for other areas of Government spending.
Expenses by Department or Type as a Percentage of Total Expenses for Nova Scotia
Source: 1 (see end of chapter)
0%
5%
10%
15%
20%
25%
30%
35%
40%
45%
2012-13
2011-12
2010-11
2009-10
2008-09
Other ExpensesDebt Servicing CostsHealthAssistance to UniversitiesEducationCommunity Services
Report of the Auditor General • • • January 2014 54
Indicators of Financial Condition
Expenses by Department or Type as a Percentage of Total Expense for Nova Scotia
2008-09 2009-10 2010-11 2011-12 2012-13
Community Services 9.9% 9.9% 9.9% 10.5% 9.9%
Education 16.1% 15.7% 15.3% 14.7% 13.7%
Assistance to Universities 5.3% 4.7% 1.0% 3.9% 3.7%
Health 37.7% 37.9% 41.0% 39.7% 39.6%
Debt Servicing Costs 9.7% 8.9% 9.3% 8.6% 8.9%
Other Expenses 21.3% 22.9% 23.5% 22.6% 24.2%
Total Expenses 100.0% 100.0% 100.0% 100.0% 100.0%
Capital expenditures variance4.11 – Capital planning is important to ensuring the Province can deliver its services and provide necessary and safe infrastructure to its citizens. Tangible capital assets, such as schools, buildings, highways and equipment, need to be repaired or replaced as they wear out or become obsolete. If government delays the repair and replacement of assets, they may need to be replaced earlier because the assets will have deteriorated to a level where they require extensive repair work, or are beyond repair and must be replaced. If delays become frequent and widespread, these costs could become burdensome. In order to afford this greater cost government will need to significantly increase debt, raise taxes or reduce services.
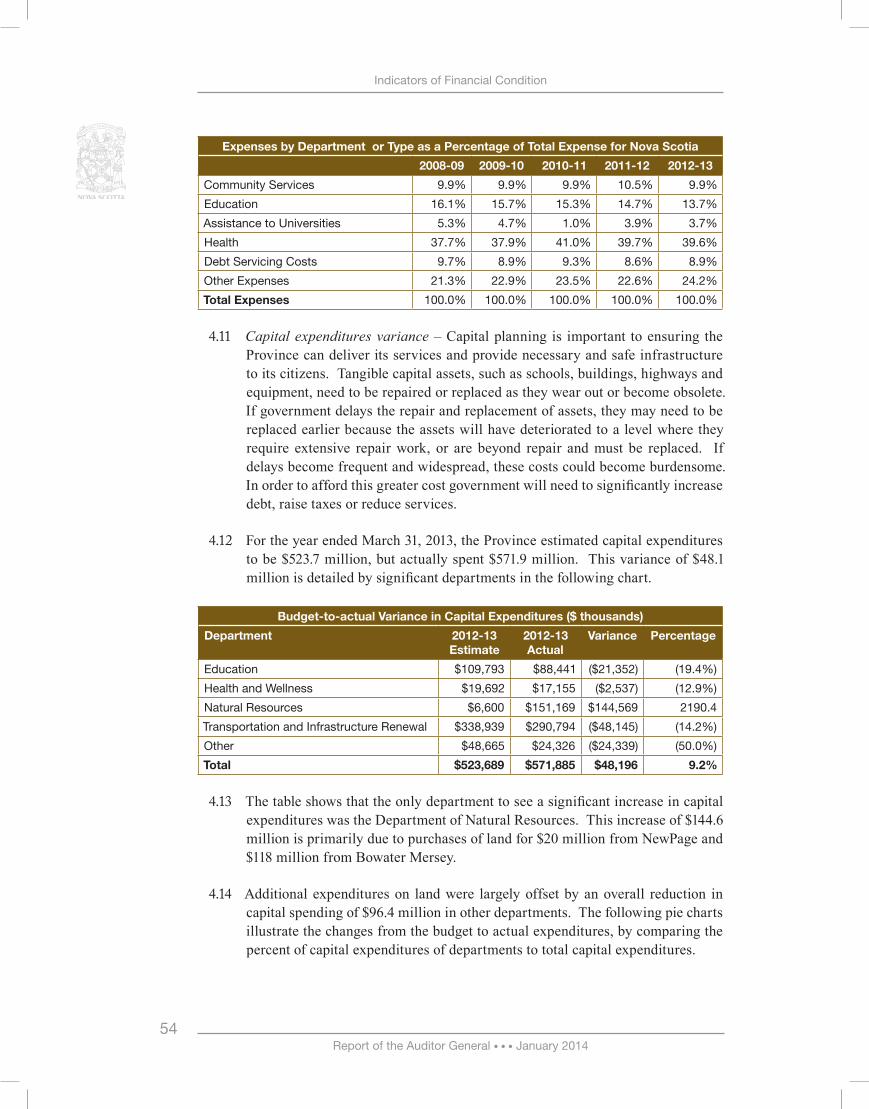
For the year ended March 31, 2013, the Province estimated capital expenditures 4.12 to be $523.7 million, but actually spent $571.9 million. This variance of $48.1 million is detailed by significant departments in the following chart.
Budget-to-actual Variance in Capital Expenditures ($ thousands)
Department 2012-13 Estimate
2012-13 Actual
Variance Percentage
Education $109,793 $88,441 ($21,352) (19.4%)
Health and Wellness $19,692 $17,155 ($2,537) (12.9%)
Natural Resources $6,600 $151,169 $144,569 2190.4
Transportation and Infrastructure Renewal $338,939 $290,794 ($48,145) (14.2%)
Other $48,665 $24,326 ($24,339) (50.0%)
Total $523,689 $571,885 $48,196 9.2%
The table shows that the only department to see a significant increase in capital 4.13 expenditures was the Department of Natural Resources. This increase of $144.6 million is primarily due to purchases of land for $20 million from NewPage and $118 million from Bowater Mersey.
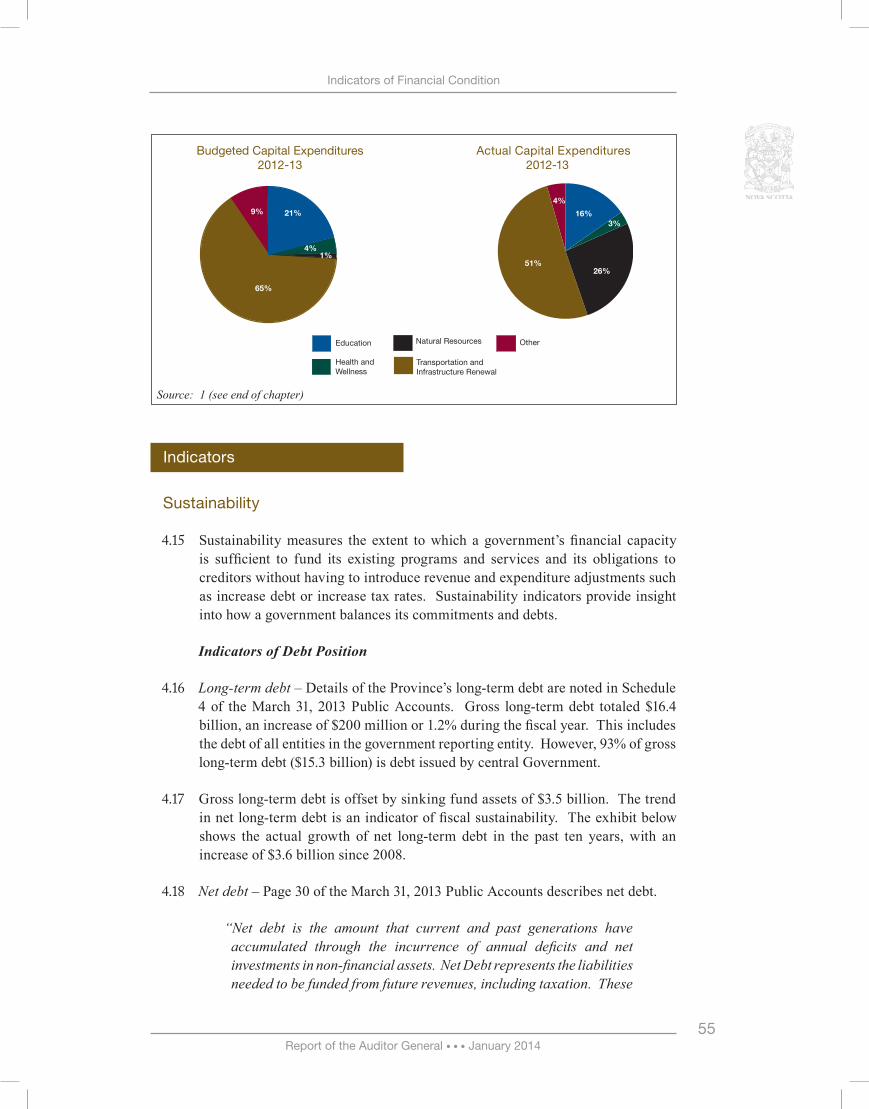
Additional expenditures on land were largely offset by an overall reduction in 4.14 capital spending of $96.4 million in other departments. The following pie charts illustrate the changes from the budget to actual expenditures, by comparing the percent of capital expenditures of departments to total capital expenditures.
Report of the Auditor General • • • January 201455
Indicators of Financial Condition
Other
Transportation andInfrastructure Renewal
Natural Resources
Health andWellness
Education
65%
21%9%
1%4%
Source: 1 (see end of chapter)
Indicators
Sustainability
Sustainability measures the extent to which a government’s financial capacity 4.15 is sufficient to fund its existing programs and services and its obligations to creditors without having to introduce revenue and expenditure adjustments such as increase debt or increase tax rates. Sustainability indicators provide insight into how a government balances its commitments and debts.
Indicators of Debt Position
Long-term debt4.16 – Details of the Province’s long-term debt are noted in Schedule 4 of the March 31, 2013 Public Accounts. Gross long-term debt totaled $16.4 billion, an increase of $200 million or 1.2% during the fiscal year. This includes the debt of all entities in the government reporting entity. However, 93% of gross long-term debt ($15.3 billion) is debt issued by central Government.
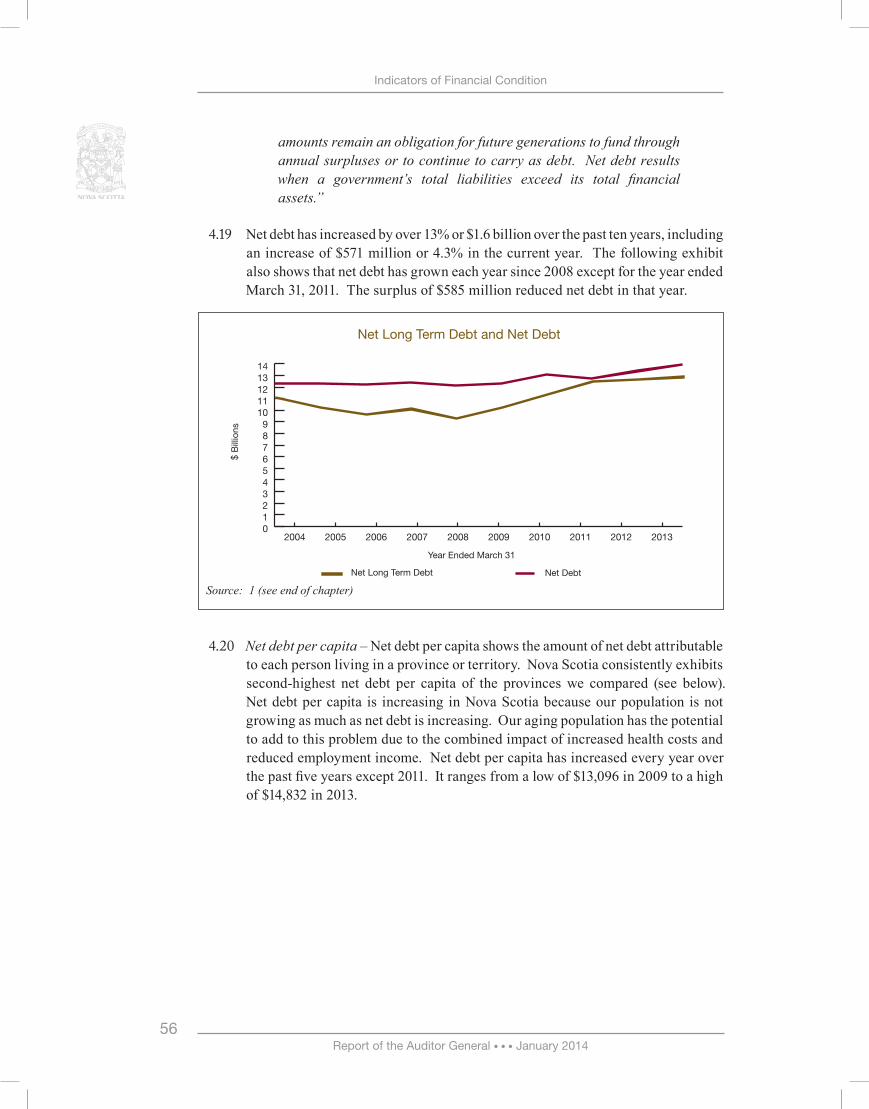
Gross long-term debt is offset by sinking fund assets of $3.5 billion. The trend 4.17 in net long-term debt is an indicator of fiscal sustainability. The exhibit below shows the actual growth of net long-term debt in the past ten years, with an increase of $3.6 billion since 2008.
Net debt4.18 – Page 30 of the March 31, 2013 Public Accounts describes net debt.
“Net debt is the amount that current and past generations have accumulated through the incurrence of annual deficits and net investments in non-financial assets. Net Debt represents the liabilities needed to be funded from future revenues, including taxation. These
Budgeted Capital Expenditures 2012-13
Actual Capital Expenditures 2012-13
Other
Transportation andInfrastructure Renewal
Natural Resources
Health andWellness
Education
51%
16%
4%
3%
26%
Report of the Auditor General • • • January 2014 56
Indicators of Financial Condition
amounts remain an obligation for future generations to fund through annual surpluses or to continue to carry as debt. Net debt results when a government’s total liabilities exceed its total financial assets.”
Net debt has increased by over 13% or $1.6 billion over the past ten years, including 4.19 an increase of $571 million or 4.3% in the current year. The following exhibit also shows that net debt has grown each year since 2008 except for the year ended March 31, 2011. The surplus of $585 million reduced net debt in that year.
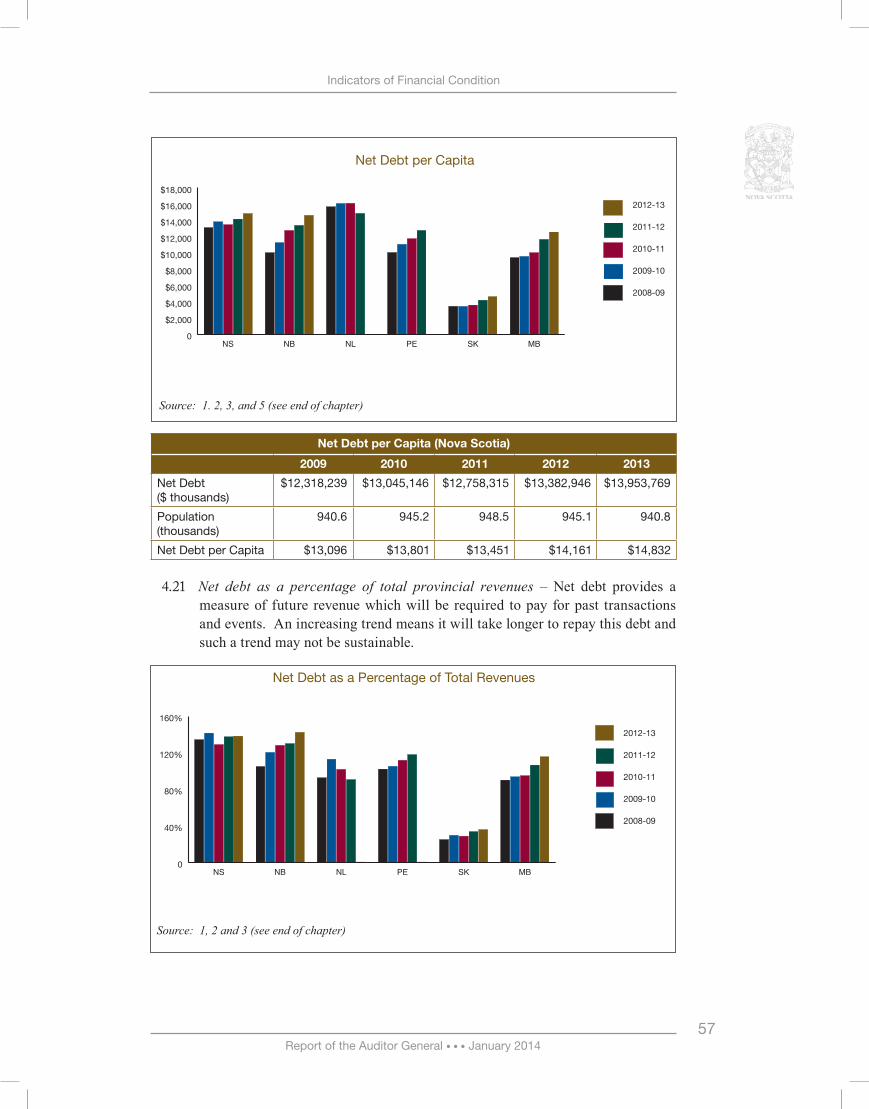
Net debt per capita4.20 – Net debt per capita shows the amount of net debt attributable to each person living in a province or territory. Nova Scotia consistently exhibits second-highest net debt per capita of the provinces we compared (see below). Net debt per capita is increasing in Nova Scotia because our population is not growing as much as net debt is increasing. Our aging population has the potential to add to this problem due to the combined impact of increased health costs and reduced employment income. Net debt per capita has increased every year over the past five years except 2011. It ranges from a low of $13,096 in 2009 to a high of $14,832 in 2013.
Net Long Term Debt and Net Debt
Source: 1 (see end of chapter)
0123456789
1011121314
Net DebtNet Long Term Debt
2013201220112010200920082007200620052004
Year Ended March 31
$ B
illio
ns
Report of the Auditor General • • • January 201457
Indicators of Financial Condition
Net Debt per Capita
Source: 1. 2, 3, and 5 (see end of chapter)
Net Debt per Capita (Nova Scotia)
2009 2010 2011 2012 2013
Net Debt ($ thousands)
$12,318,239 $13,045,146 $12,758,315 $13,382,946 $13,953,769
Population (thousands)
940.6 945.2 948.5 945.1 940.8
Net Debt per Capita $13,096 $13,801 $13,451 $14,161 $14,832
Net debt as a percentage of total provincial revenues4.21 – Net debt provides a measure of future revenue which will be required to pay for past transactions and events. An increasing trend means it will take longer to repay this debt and such a trend may not be sustainable.
Net Debt as a Percentage of Total Revenues
Source: 1, 2 and 3 (see end of chapter)
0
$2,000
$4,000
$6,000
$8,000
$10,000
$12,000
$14,000
$16,000
$18,000
2012-13
2011-12
2010-11
2009-10
2008-09
MBSKPENLNBNS
0
40%
80%
120%
160%
2012-13
2011-12
2010-11
2009-10
2008-09
MBSKPENLNBNS
Report of the Auditor General • • • January 2014 58
Indicators of Financial Condition
Net Debt as a Percentage of Total Revenues
Year Ending March 31 2009 2010 2011 2012 2013
Net Debt ($ millions) $12,318 $13,045 $12,758 $13,383 $13,954
Total Revenues ($ millions) $9,196 $9,231 $9,919 $9,760 $10,102
Net Debt/Revenue 134.0% 141.3% 128.6% 137.1% 138.1%
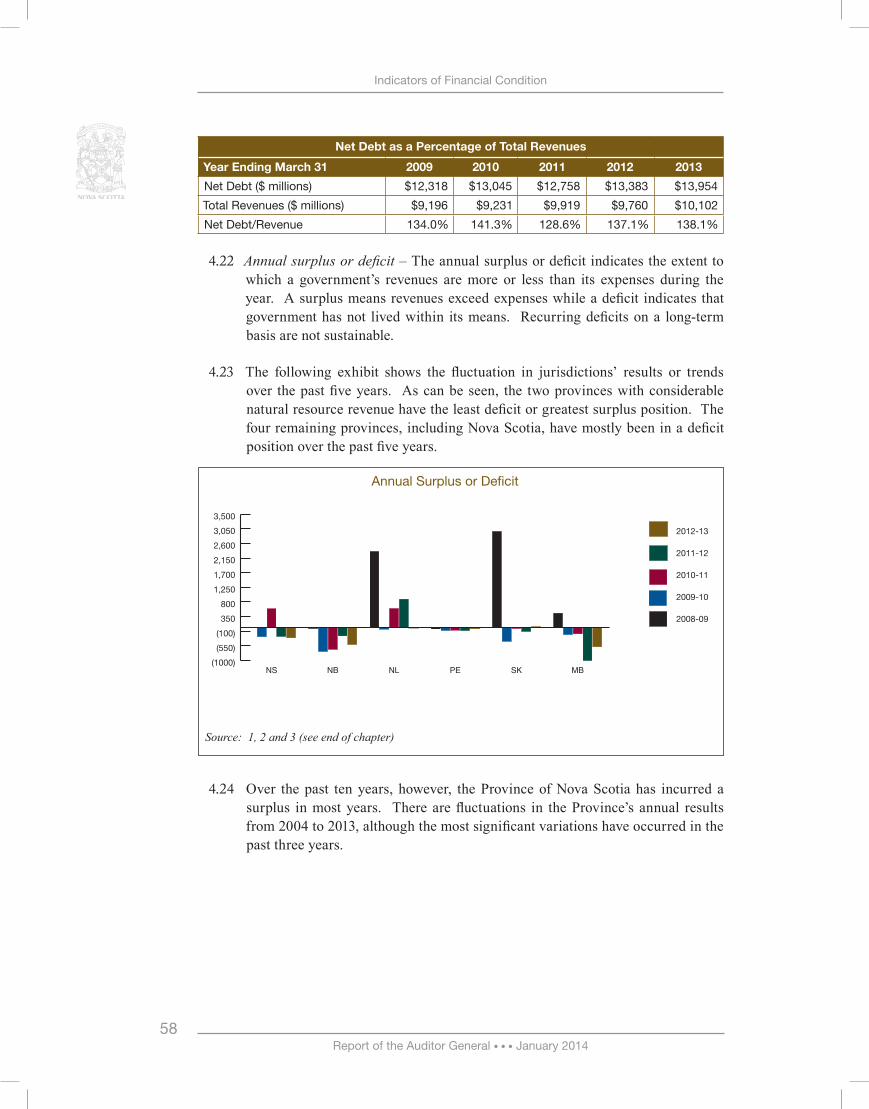
Annual surplus or deficit4.22 – The annual surplus or deficit indicates the extent to which a government’s revenues are more or less than its expenses during the year. A surplus means revenues exceed expenses while a deficit indicates that government has not lived within its means. Recurring deficits on a long-term basis are not sustainable.
The following exhibit shows the fluctuation in jurisdictions’ results or trends 4.23 over the past five years. As can be seen, the two provinces with considerable natural resource revenue have the least deficit or greatest surplus position. The four remaining provinces, including Nova Scotia, have mostly been in a deficit position over the past five years.
Annual Surplus or Deficit
Source: 1, 2 and 3 (see end of chapter)
Over the past ten years, however, the Province of Nova Scotia has incurred a 4.24 surplus in most years. There are fluctuations in the Province’s annual results from 2004 to 2013, although the most significant variations have occurred in the past three years.
(1000)
(550)
(100)
350
800
1,250
1,700
2,150
2,600
3,050
3,500
2012-13
2011-12
2010-11
2009-10
2008-09
MBSKPENLNBNS
Report of the Auditor General • • • January 201459
Indicators of Financial Condition
Nova Scotia Annual Surplus or Deficit ($ millions)
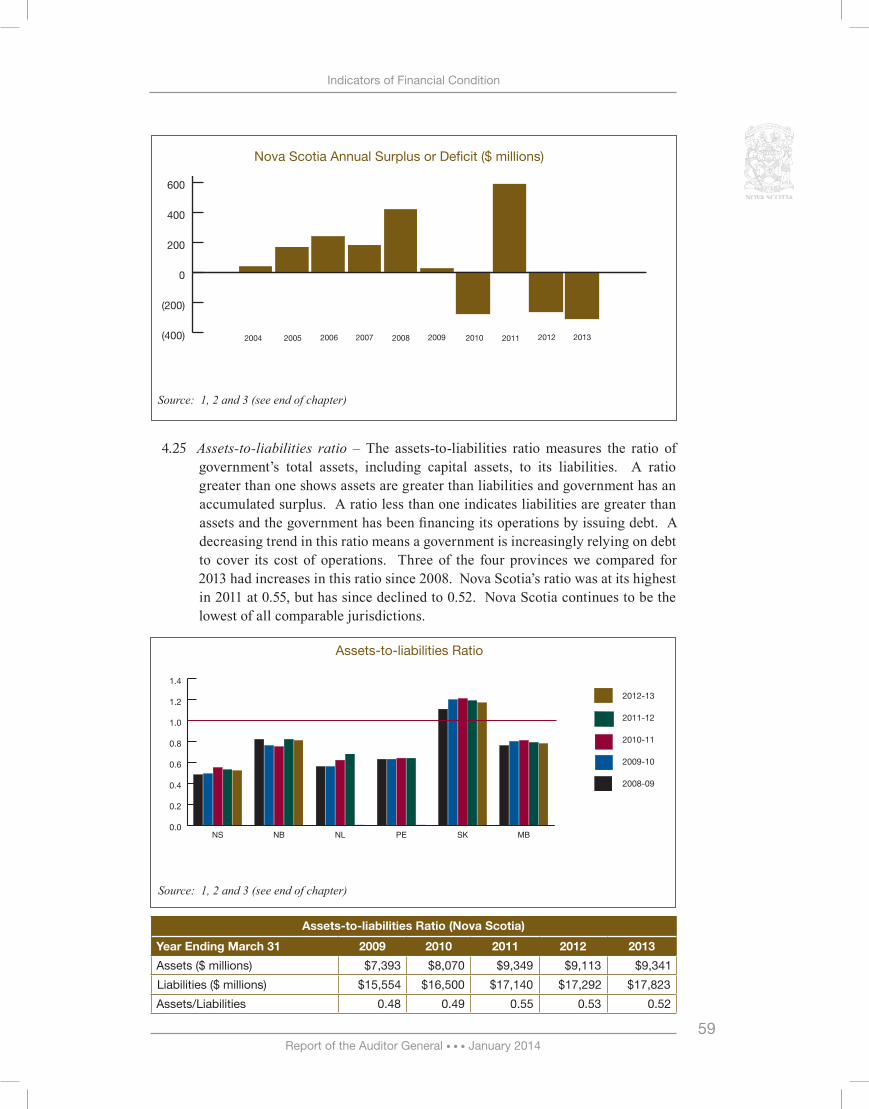
Assets-to-liabilities ratio4.25 – The assets-to-liabilities ratio measures the ratio of government’s total assets, including capital assets, to its liabilities. A ratio greater than one shows assets are greater than liabilities and government has an accumulated surplus. A ratio less than one indicates liabilities are greater than assets and the government has been financing its operations by issuing debt. A decreasing trend in this ratio means a government is increasingly relying on debt to cover its cost of operations. Three of the four provinces we compared for 2013 had increases in this ratio since 2008. Nova Scotia’s ratio was at its highest in 2011 at 0.55, but has since declined to 0.52. Nova Scotia continues to be the lowest of all comparable jurisdictions.
Assets-to-liabilities Ratio
Source: 1, 2 and 3 (see end of chapter)
Assets-to-liabilities Ratio (Nova Scotia)
Year Ending March 31 2009 2010 2011 2012 2013
Assets ($ millions) $7,393 $8,070 $9,349 $9,113 $9,341
Liabilities ($ millions) $15,554 $16,500 $17,140 $17,292 $17,823
Assets/Liabilities 0.48 0.49 0.55 0.53 0.52
Source: 1, 2 and 3 (see end of chapter)
(400)
(200)
0
200
400
600
800
201220112010200920082007200620052004 2013
0.0
0.2
0.4
0.6
0.8
1.0
1.2
1.4
2012-13
2011-12
2010-11
2009-10
2008-09
MBSKPENLNBNS
Report of the Auditor General • • • January 2014 60
Indicators of Financial Condition
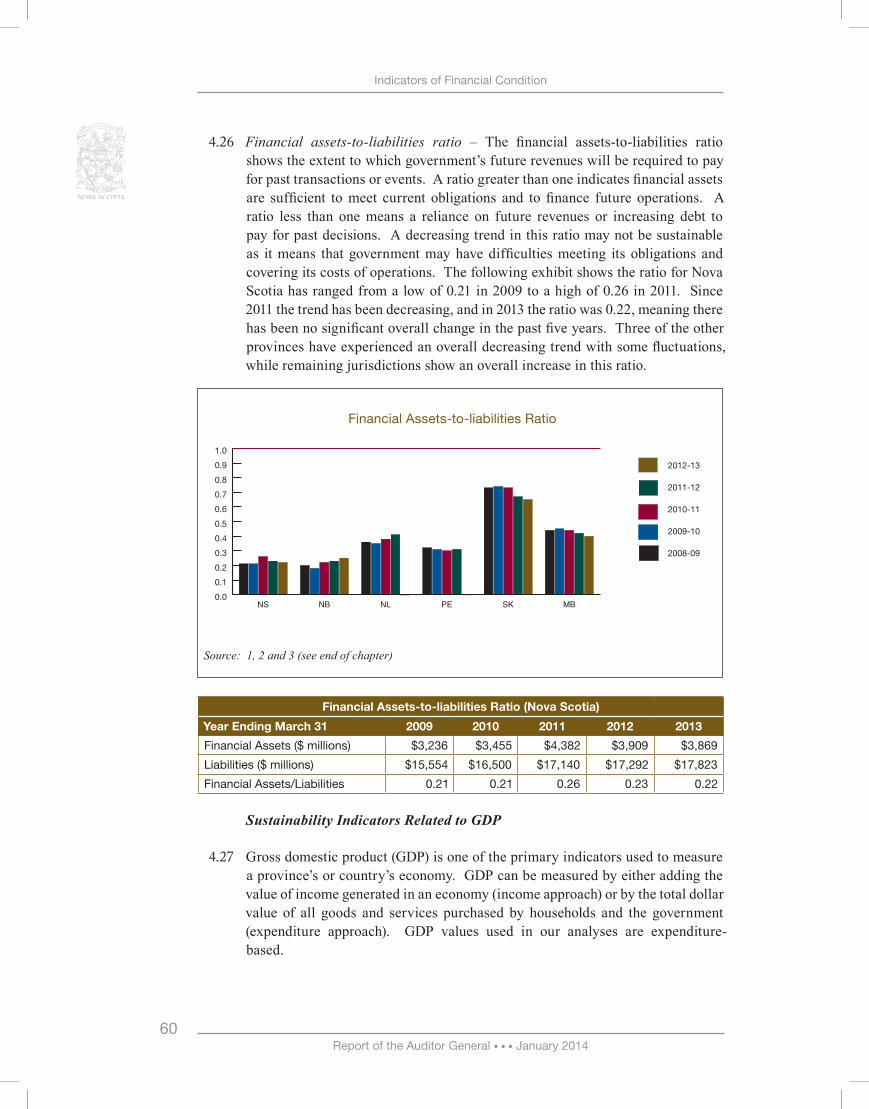
Financial assets-to-liabilities ratio4.26 – The financial assets-to-liabilities ratio shows the extent to which government’s future revenues will be required to pay for past transactions or events. A ratio greater than one indicates financial assets are sufficient to meet current obligations and to finance future operations. A ratio less than one means a reliance on future revenues or increasing debt to pay for past decisions. A decreasing trend in this ratio may not be sustainable as it means that government may have difficulties meeting its obligations and covering its costs of operations. The following exhibit shows the ratio for Nova Scotia has ranged from a low of 0.21 in 2009 to a high of 0.26 in 2011. Since 2011 the trend has been decreasing, and in 2013 the ratio was 0.22, meaning there has been no significant overall change in the past five years. Three of the other provinces have experienced an overall decreasing trend with some fluctuations, while remaining jurisdictions show an overall increase in this ratio.
Financial Assets-to-liabilities Ratio
Source: 1, 2 and 3 (see end of chapter)
Financial Assets-to-liabilities Ratio (Nova Scotia)
Year Ending March 31 2009 2010 2011 2012 2013
Financial Assets ($ millions) $3,236 $3,455 $4,382 $3,909 $3,869
Liabilities ($ millions) $15,554 $16,500 $17,140 $17,292 $17,823
Financial Assets/Liabilities 0.21 0.21 0.26 0.23 0.22
Sustainability Indicators Related to GDP
Gross domestic product (GDP) is one of the primary indicators used to measure 4.27 a province’s or country’s economy. GDP can be measured by either adding the value of income generated in an economy (income approach) or by the total dollar value of all goods and services purchased by households and the government (expenditure approach). GDP values used in our analyses are expenditure-based.
0.0
0.1
0.2
0.3
0.4
0.5
0.6
0.7
0.8
0.9
1.0
2012-13
2011-12
2010-11
2009-10
2008-09
MBSKPENLNBNS
Report of the Auditor General • • • January 201461
Indicators of Financial Condition
GDP is usually stated as a rate of change in a three-month period over the prior 4.28 three-month period. An economy with two consecutive periods of negative growth is said to be in recession.
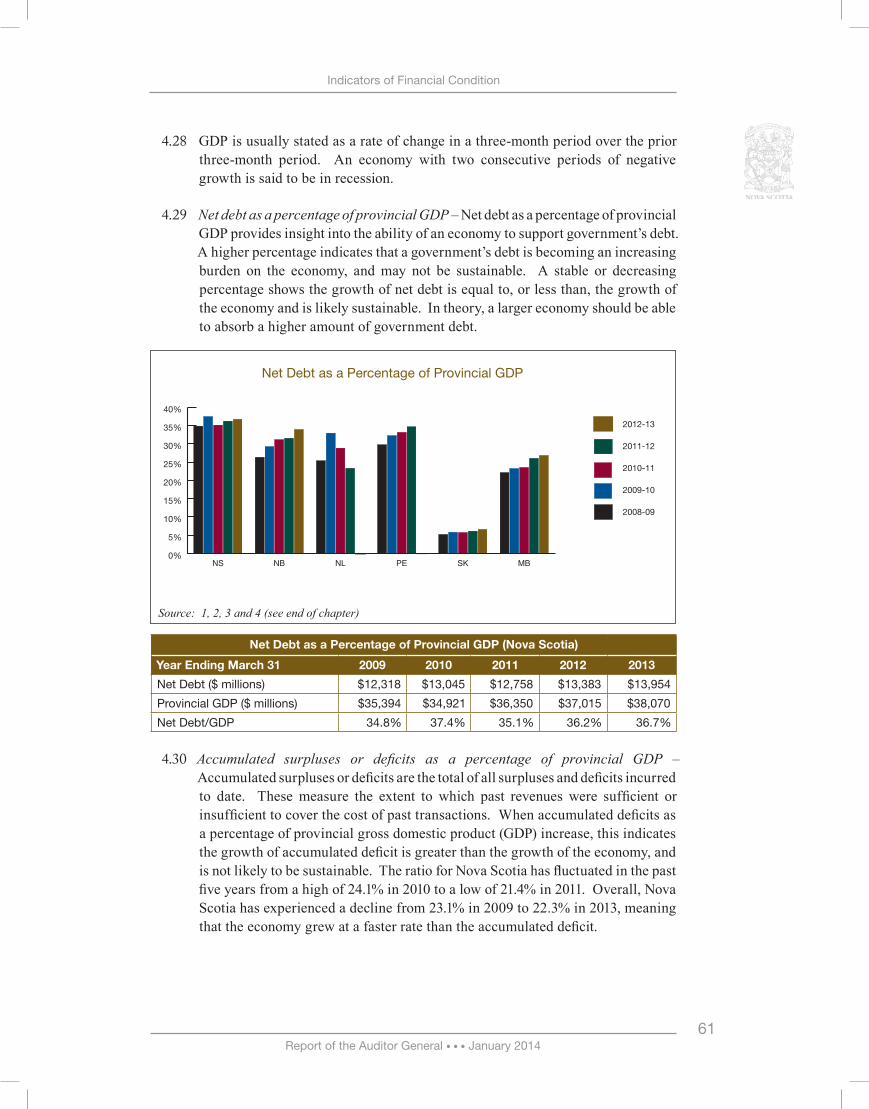
Net debt as a percentage of provincial GDP4.29 – Net debt as a percentage of provincial GDP provides insight into the ability of an economy to support government’s debt. A higher percentage indicates that a government’s debt is becoming an increasing burden on the economy, and may not be sustainable. A stable or decreasing percentage shows the growth of net debt is equal to, or less than, the growth of the economy and is likely sustainable. In theory, a larger economy should be able to absorb a higher amount of government debt.
Net Debt as a Percentage of Provincial GDP (Nova Scotia)
Year Ending March 31 2009 2010 2011 2012 2013
Net Debt ($ millions) $12,318 $13,045 $12,758 $13,383 $13,954
Provincial GDP ($ millions) $35,394 $34,921 $36,350 $37,015 $38,070
Net Debt/GDP 34.8% 37.4% 35.1% 36.2% 36.7%
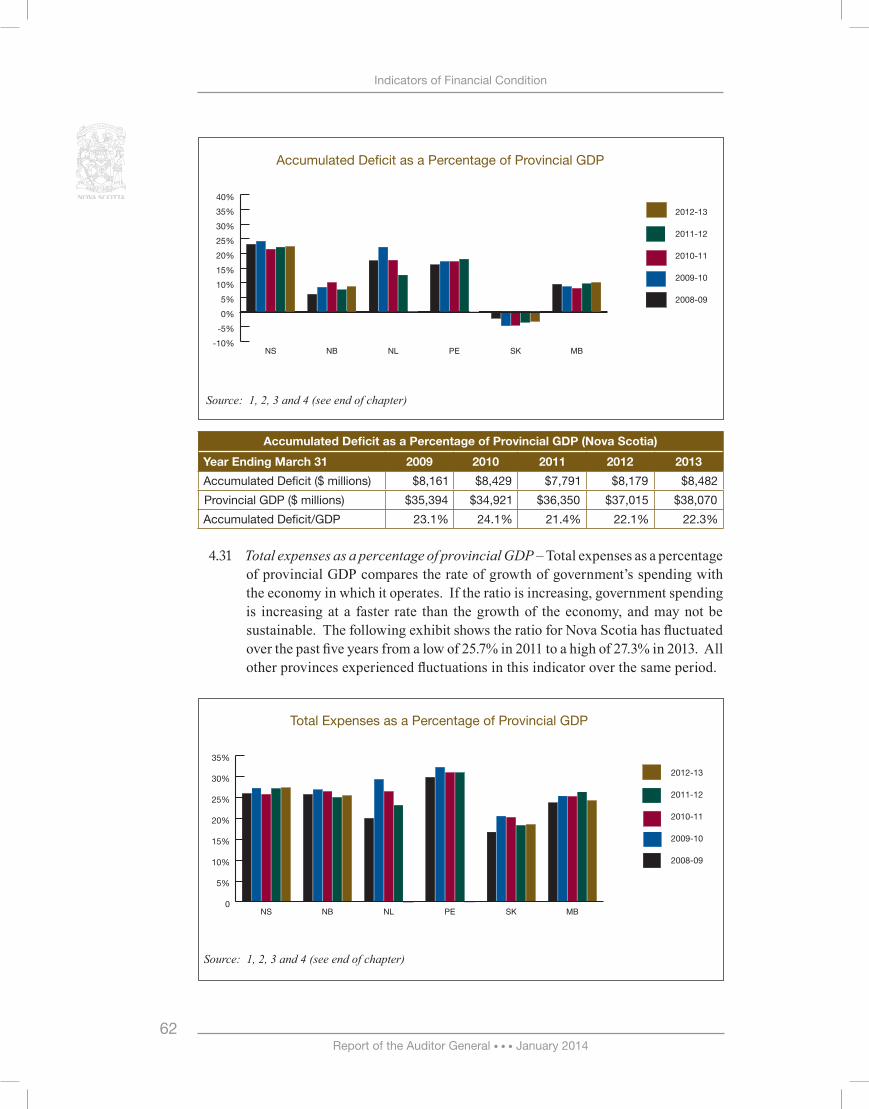
Accumulated surpluses or deficits as a percentage of provincial GDP4.30 – Accumulated surpluses or deficits are the total of all surpluses and deficits incurred to date. These measure the extent to which past revenues were sufficient or insufficient to cover the cost of past transactions. When accumulated deficits as a percentage of provincial gross domestic product (GDP) increase, this indicates the growth of accumulated deficit is greater than the growth of the economy, and is not likely to be sustainable. The ratio for Nova Scotia has fluctuated in the past five years from a high of 24.1% in 2010 to a low of 21.4% in 2011. Overall, Nova Scotia has experienced a decline from 23.1% in 2009 to 22.3% in 2013, meaning that the economy grew at a faster rate than the accumulated deficit.
Net Debt as a Percentage of Provincial GDP
Source: 1, 2, 3 and 4 (see end of chapter)
0%
5%
10%
15%
20%
25%
30%
35%
40%
2012-13
2011-12
2010-11
2009-10
2008-09
MBSKPENLNBNS
Report of the Auditor General • • • January 2014 62
Indicators of Financial Condition
Accumulated Deficit as a Percentage of Provincial GDP (Nova Scotia)
Year Ending March 31 2009 2010 2011 2012 2013
Accumulated Deficit ($ millions) $8,161 $8,429 $7,791 $8,179 $8,482
Provincial GDP ($ millions) $35,394 $34,921 $36,350 $37,015 $38,070
Accumulated Deficit/GDP 23.1% 24.1% 21.4% 22.1% 22.3%
Total expenses as a percentage of provincial GDP4.31 – Total expenses as a percentage of provincial GDP compares the rate of growth of government’s spending with the economy in which it operates. If the ratio is increasing, government spending is increasing at a faster rate than the growth of the economy, and may not be sustainable. The following exhibit shows the ratio for Nova Scotia has fluctuated over the past five years from a low of 25.7% in 2011 to a high of 27.3% in 2013. All other provinces experienced fluctuations in this indicator over the same period.
Total Expenses as a Percentage of Provincial GDP
Source: 1, 2, 3 and 4 (see end of chapter)
Accumulated Deficit as a Percentage of Provincial GDP
Source: 1, 2, 3 and 4 (see end of chapter)
-10%
-5%
0%
5%
10%
15%
20%
25%
30%
35%
40%
2012-13
2011-12
2010-11
2009-10
2008-09
MBSKPENLNBNS
0
5%
10%
15%
20%
25%
30%
35%
2012-13
2011-12
2010-11
2009-10
2008-09
MBSKPENLNBNS
Report of the Auditor General • • • January 201463
Indicators of Financial Condition
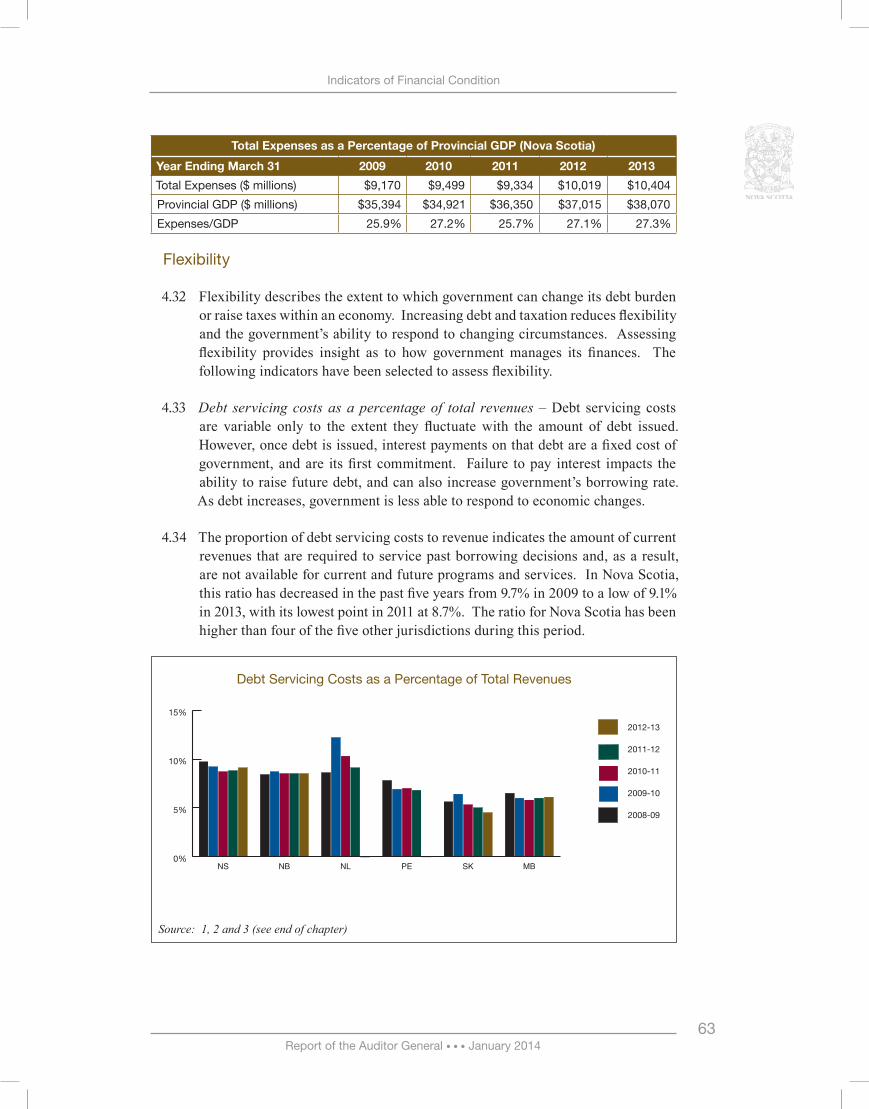
Total Expenses as a Percentage of Provincial GDP (Nova Scotia)
Year Ending March 31 2009 2010 2011 2012 2013
Total Expenses ($ millions) $9,170 $9,499 $9,334 $10,019 $10,404
Provincial GDP ($ millions) $35,394 $34,921 $36,350 $37,015 $38,070
Expenses/GDP 25.9% 27.2% 25.7% 27.1% 27.3%
Flexibility
Flexibility describes the extent to which government can change its debt burden 4.32 or raise taxes within an economy. Increasing debt and taxation reduces flexibility and the government’s ability to respond to changing circumstances. Assessing flexibility provides insight as to how government manages its finances. The following indicators have been selected to assess flexibility.
Debt servicing costs as a percentage of total revenues4.33 – Debt servicing costs are variable only to the extent they fluctuate with the amount of debt issued. However, once debt is issued, interest payments on that debt are a fixed cost of government, and are its first commitment. Failure to pay interest impacts the ability to raise future debt, and can also increase government’s borrowing rate. As debt increases, government is less able to respond to economic changes.
The proportion of debt servicing costs to revenue indicates the amount of current 4.34 revenues that are required to service past borrowing decisions and, as a result, are not available for current and future programs and services. In Nova Scotia, this ratio has decreased in the past five years from 9.7% in 2009 to a low of 9.1% in 2013, with its lowest point in 2011 at 8.7%. The ratio for Nova Scotia has been higher than four of the five other jurisdictions during this period.
Source: 1, 2 and 3 (see end of chapter)
Debt Servicing Costs as a Percentage of Total Revenues
0%
5%
10%
15%
2012-13
2011-12
2010-11
2009-10
2008-09
MBSKPENLNBNS
Report of the Auditor General • • • January 2014 64
Indicators of Financial Condition
Debt Servicing Costs as a Percentage of Total Revenues (Nova Scotia)
Year Ending March 31 2009 2010 2011 2012 2013
Debt Servicing Costs ($ millions)
$887 $850 $866 $863 $921
Total Revenues ($ millions) $9,196 $9,231 $9,919 $9,760 $10,102
Debt Servicing Costs as a Percentage of Revenues 9.7% 9.2% 8.7% 8.8% 9.1%
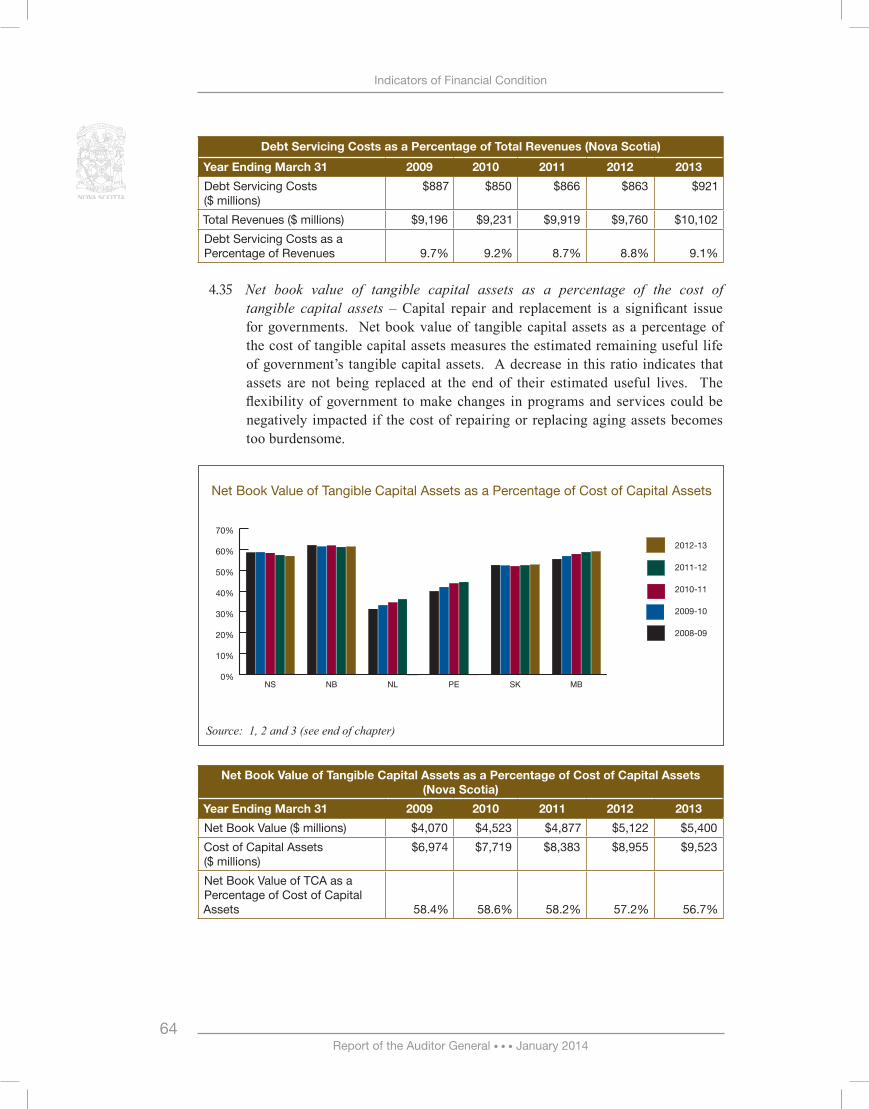
Net book value of tangible capital assets as a percentage of the cost of 4.35 tangible capital assets – Capital repair and replacement is a significant issue for governments. Net book value of tangible capital assets as a percentage of the cost of tangible capital assets measures the estimated remaining useful life of government’s tangible capital assets. A decrease in this ratio indicates that assets are not being replaced at the end of their estimated useful lives. The flexibility of government to make changes in programs and services could be negatively impacted if the cost of repairing or replacing aging assets becomes too burdensome.
Net Book Value of Tangible Capital Assets as a Percentage of Cost of Capital Assets (Nova Scotia)
Year Ending March 31 2009 2010 2011 2012 2013
Net Book Value ($ millions) $4,070 $4,523 $4,877 $5,122 $5,400
Cost of Capital Assets ($ millions)
$6,974 $7,719 $8,383 $8,955 $9,523
Net Book Value of TCA as a Percentage of Cost of Capital Assets 58.4% 58.6% 58.2% 57.2% 56.7%
Net Book Value of Tangible Capital Assets as a Percentage of Cost of Capital Assets
Source: 1, 2 and 3 (see end of chapter)
0%
10%
20%
30%
40%
50%
60%
70%
2012-13
2011-12
2010-11
2009-10
2008-09
MBSKPENLNBNS
Report of the Auditor General • • • January 201465
Indicators of Financial Condition
Vulnerability
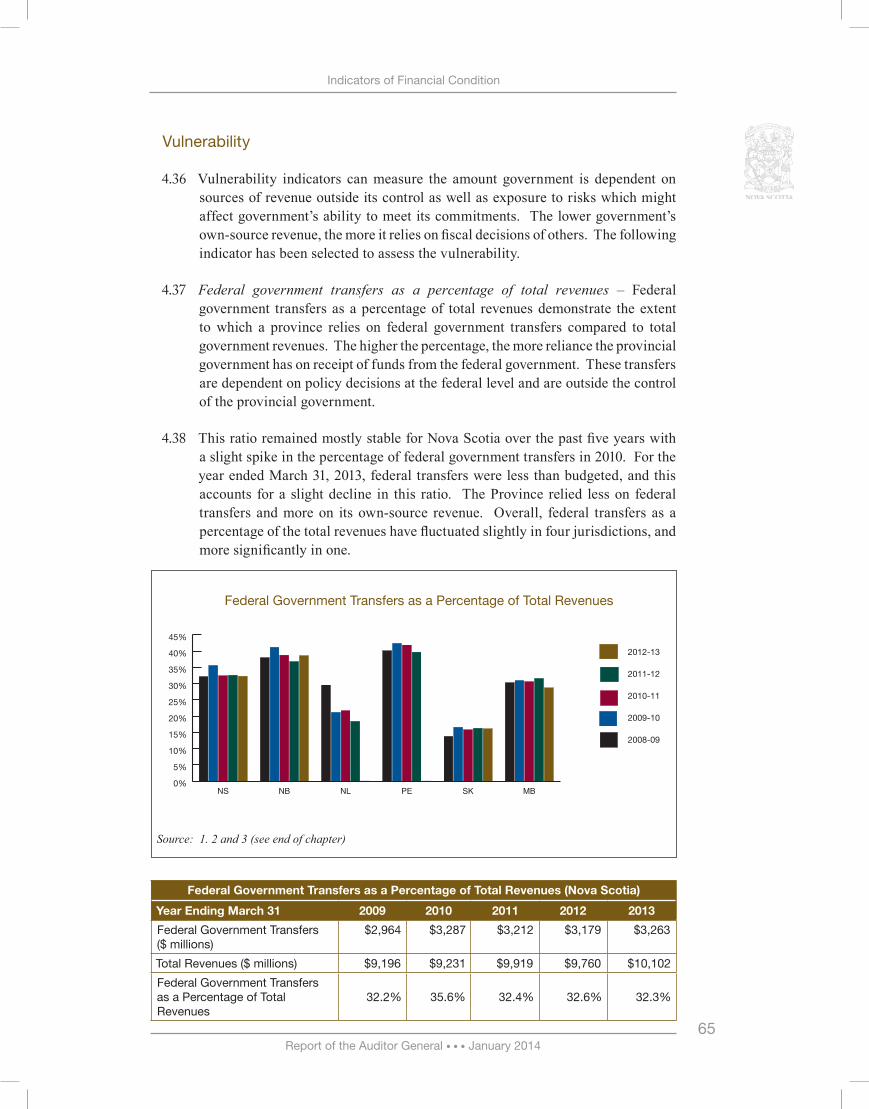
Vulnerability indicators can measure the amount government is dependent on 4.36 sources of revenue outside its control as well as exposure to risks which might affect government’s ability to meet its commitments. The lower government’s own-source revenue, the more it relies on fiscal decisions of others. The following indicator has been selected to assess the vulnerability.
Federal government transfers as a percentage of total revenues4.37 – Federal government transfers as a percentage of total revenues demonstrate the extent to which a province relies on federal government transfers compared to total government revenues. The higher the percentage, the more reliance the provincial government has on receipt of funds from the federal government. These transfers are dependent on policy decisions at the federal level and are outside the control of the provincial government.
This ratio remained mostly stable for Nova Scotia over the past five years with 4.38 a slight spike in the percentage of federal government transfers in 2010. For the year ended March 31, 2013, federal transfers were less than budgeted, and this accounts for a slight decline in this ratio. The Province relied less on federal transfers and more on its own-source revenue. Overall, federal transfers as a percentage of the total revenues have fluctuated slightly in four jurisdictions, and more significantly in one.
Federal Government Transfers as a Percentage of Total Revenues
Source: 1. 2 and 3 (see end of chapter)
Federal Government Transfers as a Percentage of Total Revenues (Nova Scotia)
Year Ending March 31 2009 2010 2011 2012 2013
Federal Government Transfers ($ millions)
$2,964 $3,287 $3,212 $3,179 $3,263
Total Revenues ($ millions) $9,196 $9,231 $9,919 $9,760 $10,102
Federal Government Transfers as a Percentage of Total Revenues
32.2% 35.6% 32.4% 32.6% 32.3%
0%
5%
10%
15%
20%
25%
30%
35%
40%
45%
2012-13
2011-12
2010-11
2009-10
2008-09
MBSKPENLNBNS
Report of the Auditor General • • • January 2014 66
Indicators of Financial Condition
Sources:
1. Nova Scotia – Public Accounts for March 31, 2004 – March 31, 2013
2. New Brunswick, Saskatchewan and Manitoba – Public Accounts March 31, 2009 – March 31, 2013
3. Newfoundland and Labrador, and Prince Edward Island – Public Accounts March 31, 2009 to March 31, 2012 (2012-13 Public Accounts not released at the time this chapter was written.)
4. Statistics Canada – Gross domestic product, expenditure-based, by province and territory (2007-2011)
5. Statistics Canada – Population by year, by province and territory (July 2008 – July 2012)
6. Statistics Canada – Annual population estimates (July 2012 – July 2013)
Note: Income from Government Business Enterprises (GBE) has been included in the calculation of own source revenue, and total revenue for all provinces. This change ensures that information presented is comparable among Provinces and is consistent with the way in which most provinces report financial indicators.


![The Jewish Legion at Fort Edward, Nova Scotia - rusi-ns.ca · [Army Museum, Halifax Citadel] Major W.F.D. Bremner. Joseph Bernbaum, Toronto Harry Brookman, Winnipeg ... The Hants](https://img.pdfslide.net/doc/110x75/5b1ac5a77f8b9a19258e199f/the-jewish-legion-at-fort-edward-nova-scotia-rusi-nsca-army-museum-halifax.jpg)