Embed Size (px)
Citation preview
Apple Inc. v. Samsung Electronics Co., LTD., et al.
Summary of Apple's Damages Calculations
Prepared by Invotex Group
PLAINTIFF’S EXHIBIT NO. United States District Court
Northern District of CaliforniaNo. 11-CV-01846-LHK (PSG)
Apple Inc. v. Samsung Elecs.
Date Admitted:__________ By:_________
25A
Apple Inc. v. Samsung Electronics Co., LTD., et al.
Prepared by Invotex GroupSubmitted Under Seal; Highly Confidential;
Outside Counsel Eyes' Only
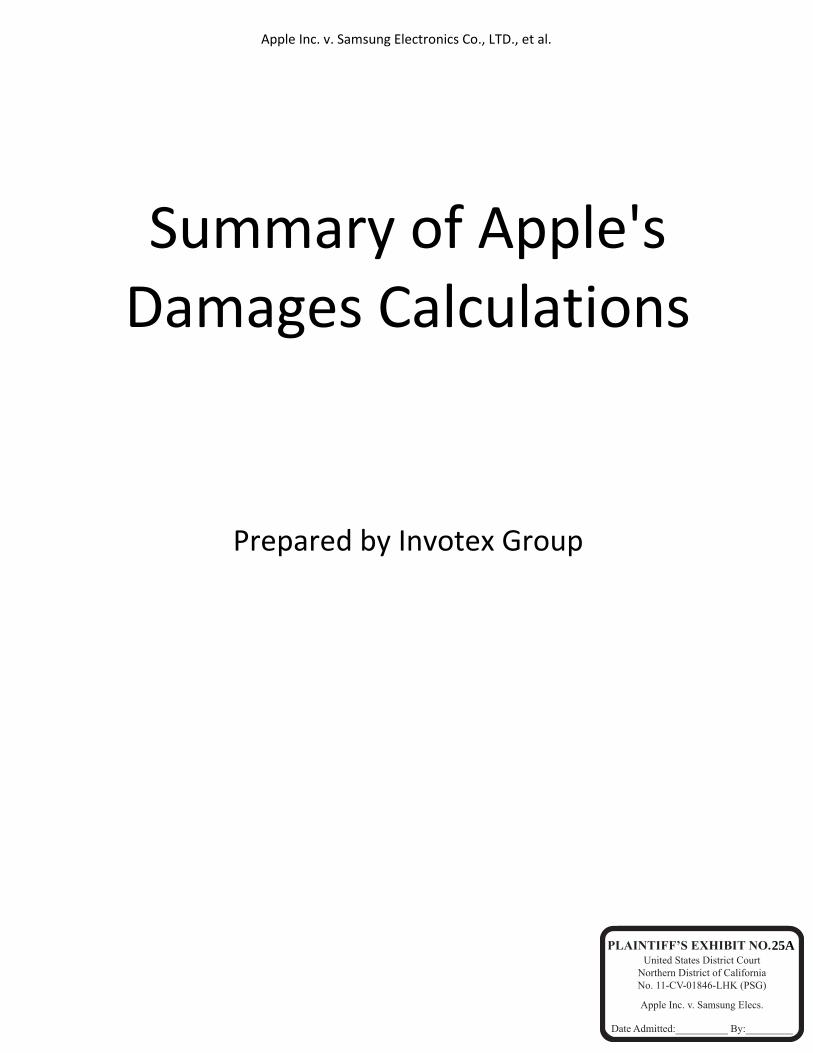
Table of Four Damages Scenarios
Apple's Lost Profits, Samsung's Profits, and Reasonable Royalty
NOTICE PERIOD 1 1/ NOTICE PERIOD 2 2/
Apple's Lost Profits Portion $ 488,777,933 $ 717,153,309 Samsung's Profits Portion 2,240,567,255 2,141,009,095 Reasonable Royalty Portion 21,244,907 16,978,469 Total $ 2,750,590,095 $ 2,875,140,873
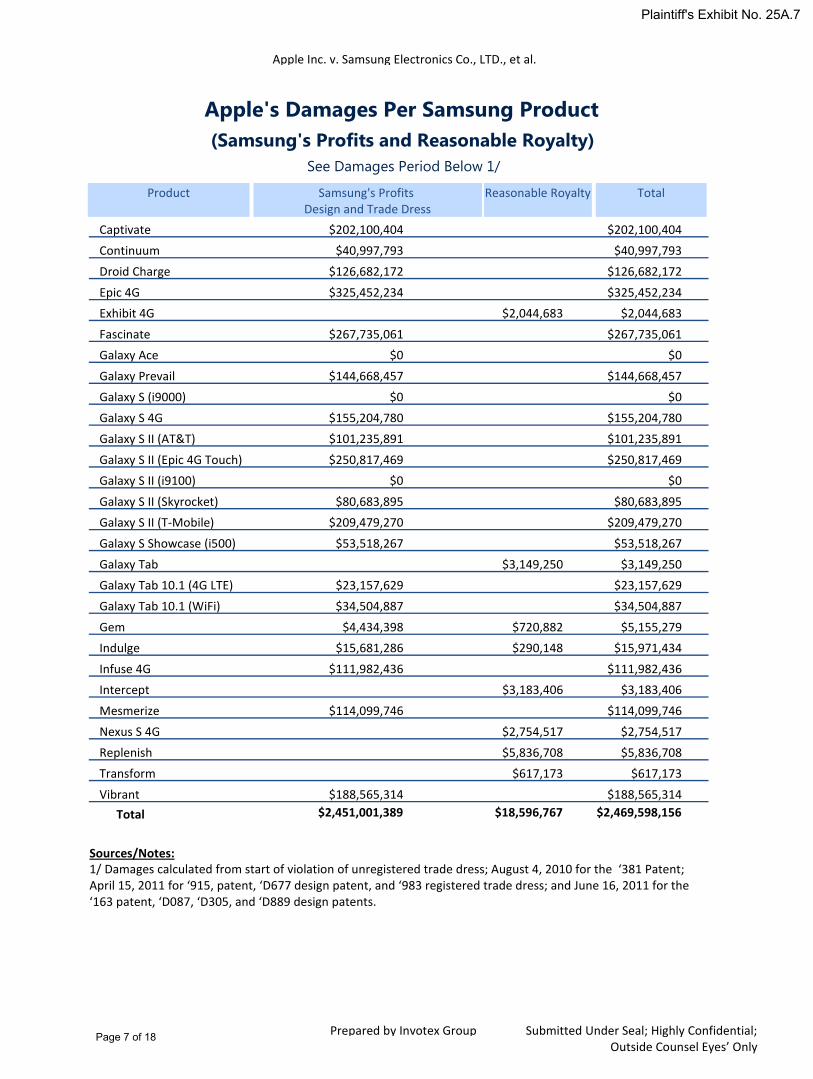
Samsung's Profits and Reasonable Royalty
NOTICE PERIOD 1 1/ NOTICE PERIOD 2 2/
Samsung's Profits Portion $ 2,481,102,629 $ 2,451,001,389 Reasonable Royalty Portion 22,844,274 18,596,767 Total $ 2,503,946,903 $ 2,469,598,156
Source/Notes:1/ Damages calculated from start of violation of unregistered trade dress; for registered trade dress, design patents and utility patents damages calculated as of the first unlawful sale occurring on or after August 4, 2010. 2/ Damages calculated from start of violation of unregistered trade dress; August 4, 2010 for the ‘381 Patent; April 15, 2011 for ‘915, patent, ‘D677 design patent, and ‘983 registered trade dress; and June 16, 2011 for the ‘163 patent, ‘D087, ‘D305, and ‘D889 design patents.
Page 2 of 18
Plaintiff's Exhibit No. 25A.2
Apple Inc. v. Samsung Electronics Co., LTD., et al.
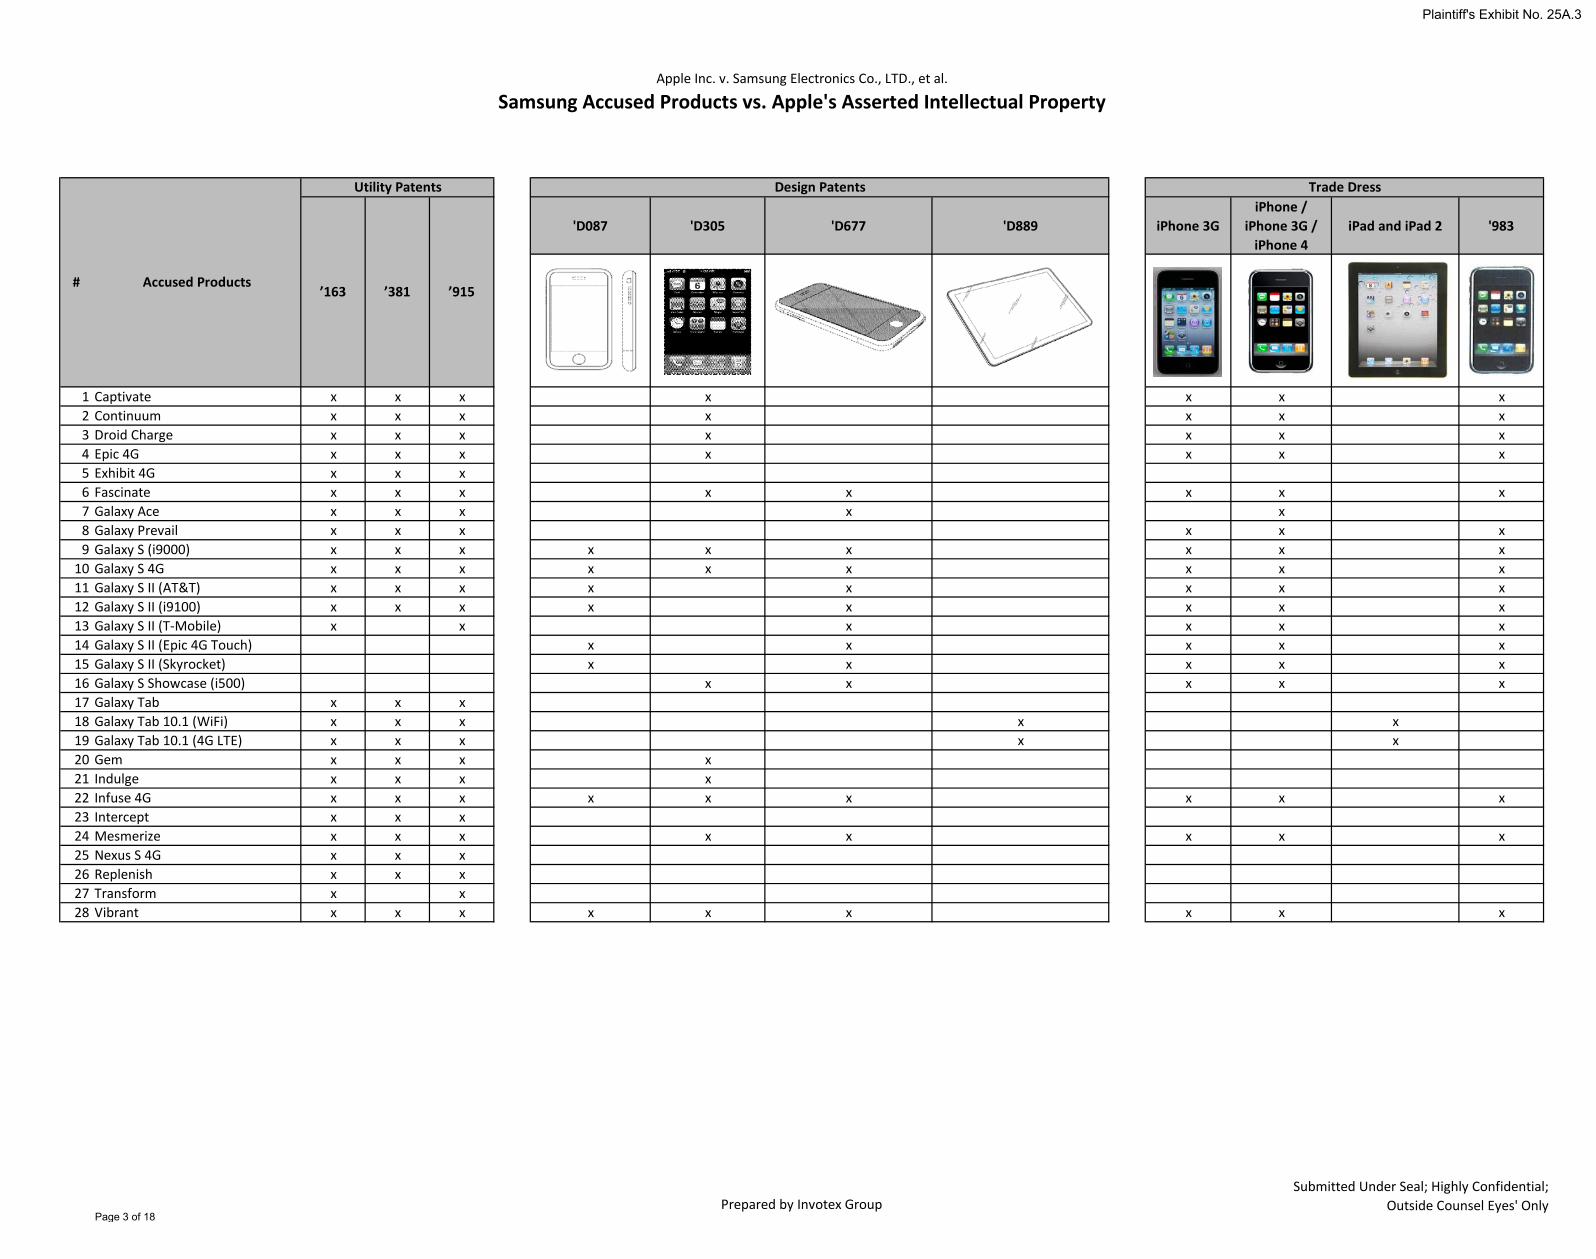
Samsung Accused Products vs. Apple's Asserted Intellectual Property
Prepared by Invotex GroupSubmitted Under Seal; Highly Confidential;
Outside Counsel Eyes' Only
'D087 'D305 'D677 'D889 iPhone 3GiPhone /
iPhone 3G / iPhone 4
iPad and iPad 2 '983
1 Captivate x x x x x x x2 Continuum x x x x x x x3 Droid Charge x x x x x x x4 Epic 4G x x x x x x x5 Exhibit 4G x x x6 Fascinate x x x x x x x x7 Galaxy Ace x x x x x8 Galaxy Prevail x x x x x x9 Galaxy S (i9000) x x x x x x x x x
10 Galaxy S 4G x x x x x x x x x11 Galaxy S II (AT&T) x x x x x x x x12 Galaxy S II (i9100) x x x x x x x x13 Galaxy S II (T-Mobile) x x x x x x14 Galaxy S II (Epic 4G Touch) x x x x x15 Galaxy S II (Skyrocket) x x x x x16 Galaxy S Showcase (i500) x x x x x17 Galaxy Tab x x x18 Galaxy Tab 10.1 (WiFi) x x x x x19 Galaxy Tab 10.1 (4G LTE) x x x x x20 Gem x x x x21 Indulge x x x x22 Infuse 4G x x x x x x x x x23 Intercept x x x24 Mesmerize x x x x x x x x25 Nexus S 4G x x x26 Replenish x x x27 Transform x x28 Vibrant x x x x x x x x x
# Accused Products
Utility Patents Design Patents Trade Dress
’163 ’381 ’915
Page 3 of 18
Plaintiff's Exhibit No. 25A.3
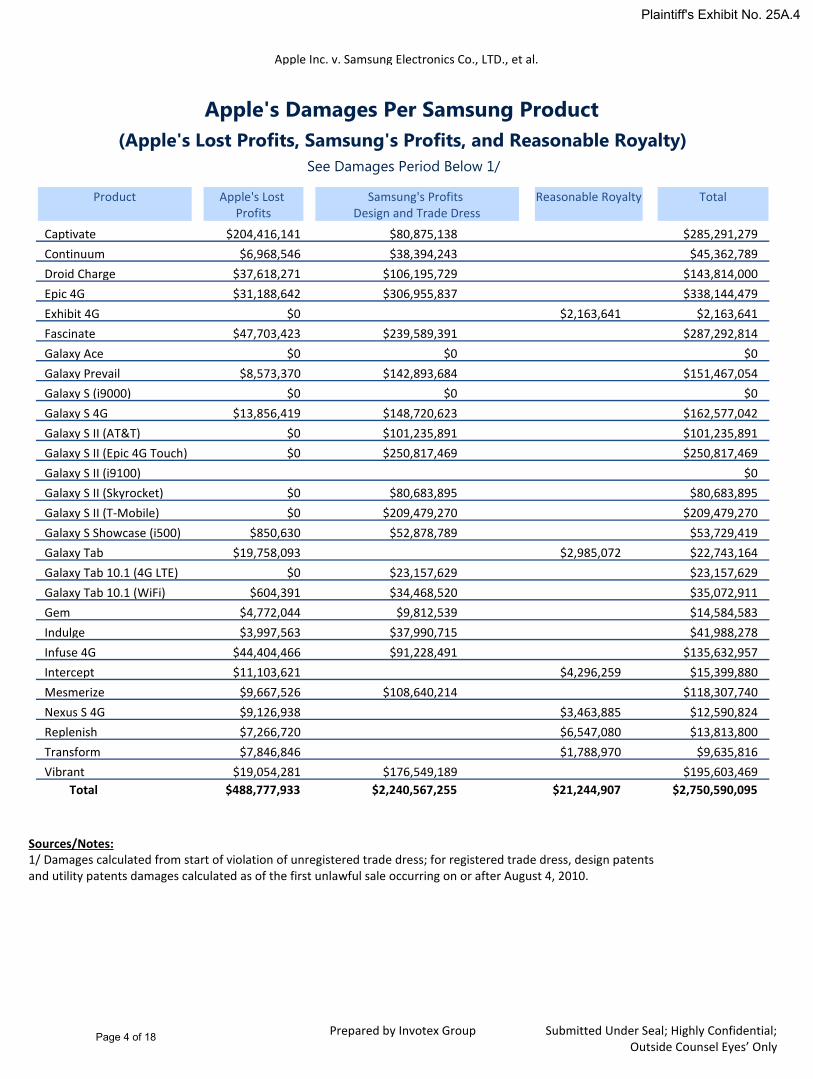
Apple's Damages Per Samsung Product
Apple Inc. v. Samsung Electronics Co., LTD., et al.
(Apple's Lost Profits, Samsung's Profits, and Reasonable Royalty)See Damages Period Below 1/
Product Apple's Lost Profits
Samsung's Profits Design and Trade Dress
Reasonable Royalty Total
$204,416,141 $80,875,138 $285,291,279Captivate
$6,968,546 $38,394,243 $45,362,789Continuum
$37,618,271 $106,195,729 $143,814,000Droid Charge
$31,188,642 $306,955,837 $338,144,479Epic 4G
$0 $2,163,641 $2,163,641Exhibit 4G
$47,703,423 $239,589,391 $287,292,814Fascinate
$0 $0 $0Galaxy Ace
$8,573,370 $142,893,684 $151,467,054Galaxy Prevail
$0 $0 $0Galaxy S (i9000)
$13,856,419 $148,720,623 $162,577,042Galaxy S 4G
$0 $101,235,891 $101,235,891Galaxy S II (AT&T)
$0 $250,817,469 $250,817,469Galaxy S II (Epic 4G Touch)
$0Galaxy S II (i9100)
$0 $80,683,895 $80,683,895Galaxy S II (Skyrocket)
$0 $209,479,270 $209,479,270Galaxy S II (T‐Mobile)
$850,630 $52,878,789 $53,729,419Galaxy S Showcase (i500)
$19,758,093 $2,985,072 $22,743,164Galaxy Tab
$0 $23,157,629 $23,157,629Galaxy Tab 10.1 (4G LTE)
$604,391 $34,468,520 $35,072,911Galaxy Tab 10.1 (WiFi)
$4,772,044 $9,812,539 $14,584,583Gem
$3,997,563 $37,990,715 $41,988,278Indulge
$44,404,466 $91,228,491 $135,632,957Infuse 4G
$11,103,621 $4,296,259 $15,399,880Intercept
$9,667,526 $108,640,214 $118,307,740Mesmerize
$9,126,938 $3,463,885 $12,590,824Nexus S 4G
$7,266,720 $6,547,080 $13,813,800Replenish
$7,846,846 $1,788,970 $9,635,816Transform
$19,054,281 $176,549,189 $195,603,469Vibrant
$488,777,933 $2,240,567,255 $21,244,907 $2,750,590,095Total
Sources/Notes:1/ Damages calculated from start of violation of unregistered trade dress; for registered trade dress, design patents and utility patents damages calculated as of the first unlawful sale occurring on or after August 4, 2010.
Prepared by Invotex Group Submitted Under Seal; Highly Confidential;Outside Counsel Eyes’ Only
Page 4 of 18
Plaintiff's Exhibit No. 25A.4
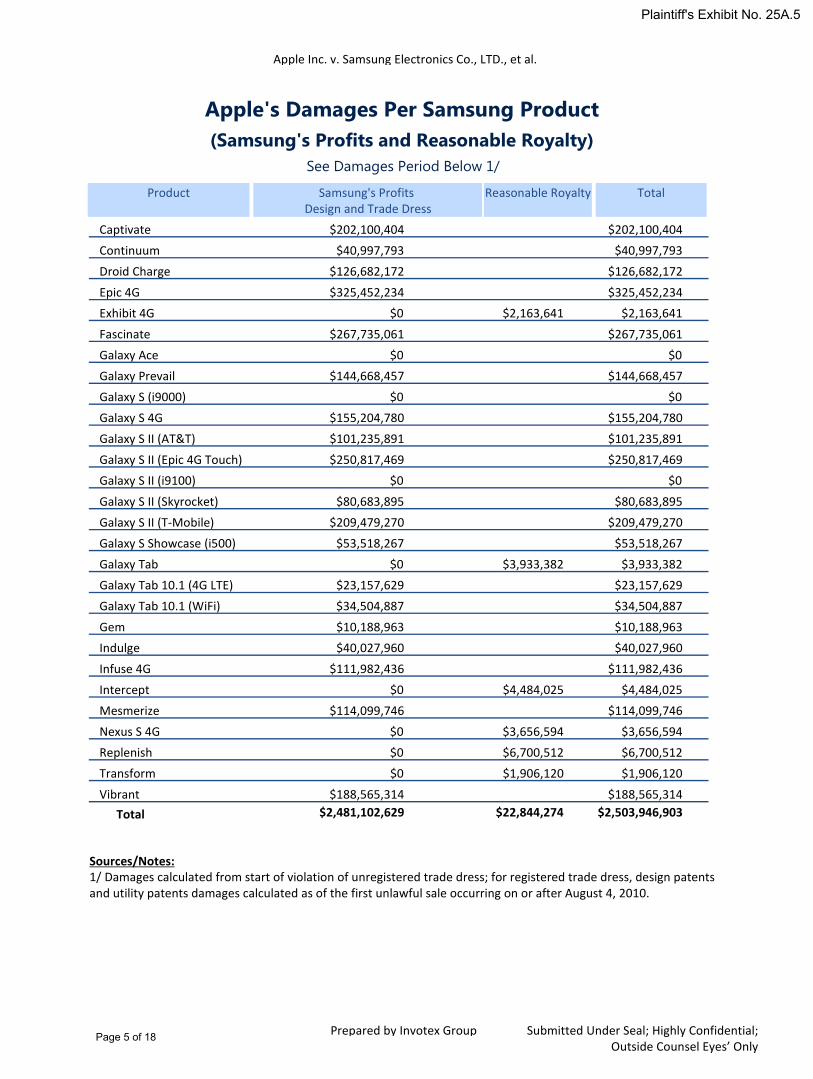
Apple's Damages Per Samsung Product
Apple Inc. v. Samsung Electronics Co., LTD., et al.
(Samsung's Profits and Reasonable Royalty)See Damages Period Below 1/
Product Samsung's Profits Design and Trade Dress
Reasonable Royalty Total
Captivate $202,100,404 $202,100,404
Continuum $40,997,793 $40,997,793
Droid Charge $126,682,172 $126,682,172
Epic 4G $325,452,234 $325,452,234
Exhibit 4G $0 $2,163,641 $2,163,641
Fascinate $267,735,061 $267,735,061
Galaxy Ace $0 $0
Galaxy Prevail $144,668,457 $144,668,457
Galaxy S (i9000) $0 $0
Galaxy S 4G $155,204,780 $155,204,780
Galaxy S II (AT&T) $101,235,891 $101,235,891
Galaxy S II (Epic 4G Touch) $250,817,469 $250,817,469
Galaxy S II (i9100) $0 $0
Galaxy S II (Skyrocket) $80,683,895 $80,683,895
Galaxy S II (T‐Mobile) $209,479,270 $209,479,270
Galaxy S Showcase (i500) $53,518,267 $53,518,267
Galaxy Tab $0 $3,933,382 $3,933,382
Galaxy Tab 10.1 (4G LTE) $23,157,629 $23,157,629
Galaxy Tab 10.1 (WiFi) $34,504,887 $34,504,887
Gem $10,188,963 $10,188,963
Indulge $40,027,960 $40,027,960
Infuse 4G $111,982,436 $111,982,436
Intercept $0 $4,484,025 $4,484,025
Mesmerize $114,099,746 $114,099,746
Nexus S 4G $0 $3,656,594 $3,656,594
Replenish $0 $6,700,512 $6,700,512
Transform $0 $1,906,120 $1,906,120
Vibrant $188,565,314 $188,565,314
$2,481,102,629 $22,844,274 $2,503,946,903Total
Sources/Notes:1/ Damages calculated from start of violation of unregistered trade dress; for registered trade dress, design patents and utility patents damages calculated as of the first unlawful sale occurring on or after August 4, 2010.
Prepared by Invotex Group Submitted Under Seal; Highly Confidential;Outside Counsel Eyes’ Only
Page 5 of 18
Plaintiff's Exhibit No. 25A.5
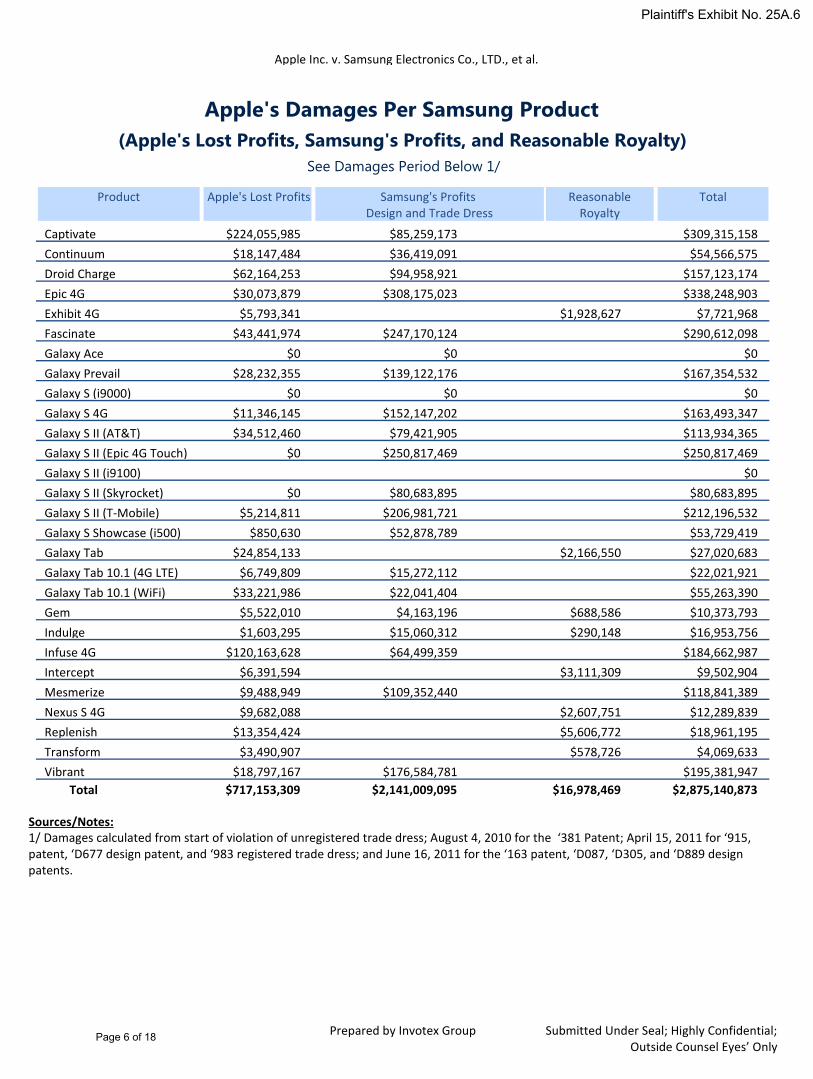
Apple's Damages Per Samsung Product
Apple Inc. v. Samsung Electronics Co., LTD., et al.
(Apple's Lost Profits, Samsung's Profits, and Reasonable Royalty)See Damages Period Below 1/
Product Apple's Lost Profits Samsung's Profits Design and Trade Dress
Reasonable Royalty
Total
$224,055,985 $85,259,173 $309,315,158Captivate
$18,147,484 $36,419,091 $54,566,575Continuum
$62,164,253 $94,958,921 $157,123,174Droid Charge
$30,073,879 $308,175,023 $338,248,903Epic 4G
$5,793,341 $1,928,627 $7,721,968Exhibit 4G
$43,441,974 $247,170,124 $290,612,098Fascinate
$0 $0 $0Galaxy Ace
$28,232,355 $139,122,176 $167,354,532Galaxy Prevail
$0 $0 $0Galaxy S (i9000)
$11,346,145 $152,147,202 $163,493,347Galaxy S 4G
$34,512,460 $79,421,905 $113,934,365Galaxy S II (AT&T)
$0 $250,817,469 $250,817,469Galaxy S II (Epic 4G Touch)
$0Galaxy S II (i9100)
$0 $80,683,895 $80,683,895Galaxy S II (Skyrocket)
$5,214,811 $206,981,721 $212,196,532Galaxy S II (T‐Mobile)
$850,630 $52,878,789 $53,729,419Galaxy S Showcase (i500)
$24,854,133 $2,166,550 $27,020,683Galaxy Tab
$6,749,809 $15,272,112 $22,021,921Galaxy Tab 10.1 (4G LTE)
$33,221,986 $22,041,404 $55,263,390Galaxy Tab 10.1 (WiFi)
$5,522,010 $4,163,196 $688,586 $10,373,793Gem
$1,603,295 $15,060,312 $290,148 $16,953,756Indulge
$120,163,628 $64,499,359 $184,662,987Infuse 4G
$6,391,594 $3,111,309 $9,502,904Intercept
$9,488,949 $109,352,440 $118,841,389Mesmerize
$9,682,088 $2,607,751 $12,289,839Nexus S 4G
$13,354,424 $5,606,772 $18,961,195Replenish
$3,490,907 $578,726 $4,069,633Transform
$18,797,167 $176,584,781 $195,381,947Vibrant
$717,153,309 $2,141,009,095 $16,978,469 $2,875,140,873Total
Sources/Notes:1/ Damages calculated from start of violation of unregistered trade dress; August 4, 2010 for the ‘381 Patent; April 15, 2011 for ‘915, patent, ‘D677 design patent, and ‘983 registered trade dress; and June 16, 2011 for the ‘163 patent, ‘D087, ‘D305, and ‘D889 design patents.
Prepared by Invotex Group Submitted Under Seal; Highly Confidential;Outside Counsel Eyes’ Only
Page 6 of 18
Plaintiff's Exhibit No. 25A.6
Apple's Damages Per Samsung Product
Apple Inc. v. Samsung Electronics Co., LTD., et al.
(Samsung's Profits and Reasonable Royalty)See Damages Period Below 1/
Product Samsung's Profits Design and Trade Dress
Reasonable Royalty Total
Captivate $202,100,404 $202,100,404
Continuum $40,997,793 $40,997,793
Droid Charge $126,682,172 $126,682,172
Epic 4G $325,452,234 $325,452,234
Exhibit 4G $2,044,683 $2,044,683
Fascinate $267,735,061 $267,735,061
Galaxy Ace $0 $0
Galaxy Prevail $144,668,457 $144,668,457
Galaxy S (i9000) $0 $0
Galaxy S 4G $155,204,780 $155,204,780
Galaxy S II (AT&T) $101,235,891 $101,235,891
Galaxy S II (Epic 4G Touch) $250,817,469 $250,817,469
Galaxy S II (i9100) $0 $0
Galaxy S II (Skyrocket) $80,683,895 $80,683,895
Galaxy S II (T‐Mobile) $209,479,270 $209,479,270
Galaxy S Showcase (i500) $53,518,267 $53,518,267
Galaxy Tab $3,149,250 $3,149,250
Galaxy Tab 10.1 (4G LTE) $23,157,629 $23,157,629
Galaxy Tab 10.1 (WiFi) $34,504,887 $34,504,887
Gem $4,434,398 $720,882 $5,155,279
Indulge $15,681,286 $290,148 $15,971,434
Infuse 4G $111,982,436 $111,982,436
Intercept $3,183,406 $3,183,406
Mesmerize $114,099,746 $114,099,746
Nexus S 4G $2,754,517 $2,754,517
Replenish $5,836,708 $5,836,708
Transform $617,173 $617,173
Vibrant $188,565,314 $188,565,314
$2,451,001,389 $18,596,767 $2,469,598,156Total
Sources/Notes:1/ Damages calculated from start of violation of unregistered trade dress; August 4, 2010 for the ‘381 Patent; April 15, 2011 for ‘915, patent, ‘D677 design patent, and ‘983 registered trade dress; and June 16, 2011 for the ‘163 patent, ‘D087, ‘D305, and ‘D889 design patents.
Prepared by Invotex Group Submitted Under Seal; Highly Confidential;Outside Counsel Eyes’ Only
Page 7 of 18
Plaintiff's Exhibit No. 25A.7
Apple Inc. v. Samsung Electronics Co., LTD., et al.
Prepared by Invotex GroupSubmitted Under Seal; Highly Confidential;
Outside Counsel Eyes' Only
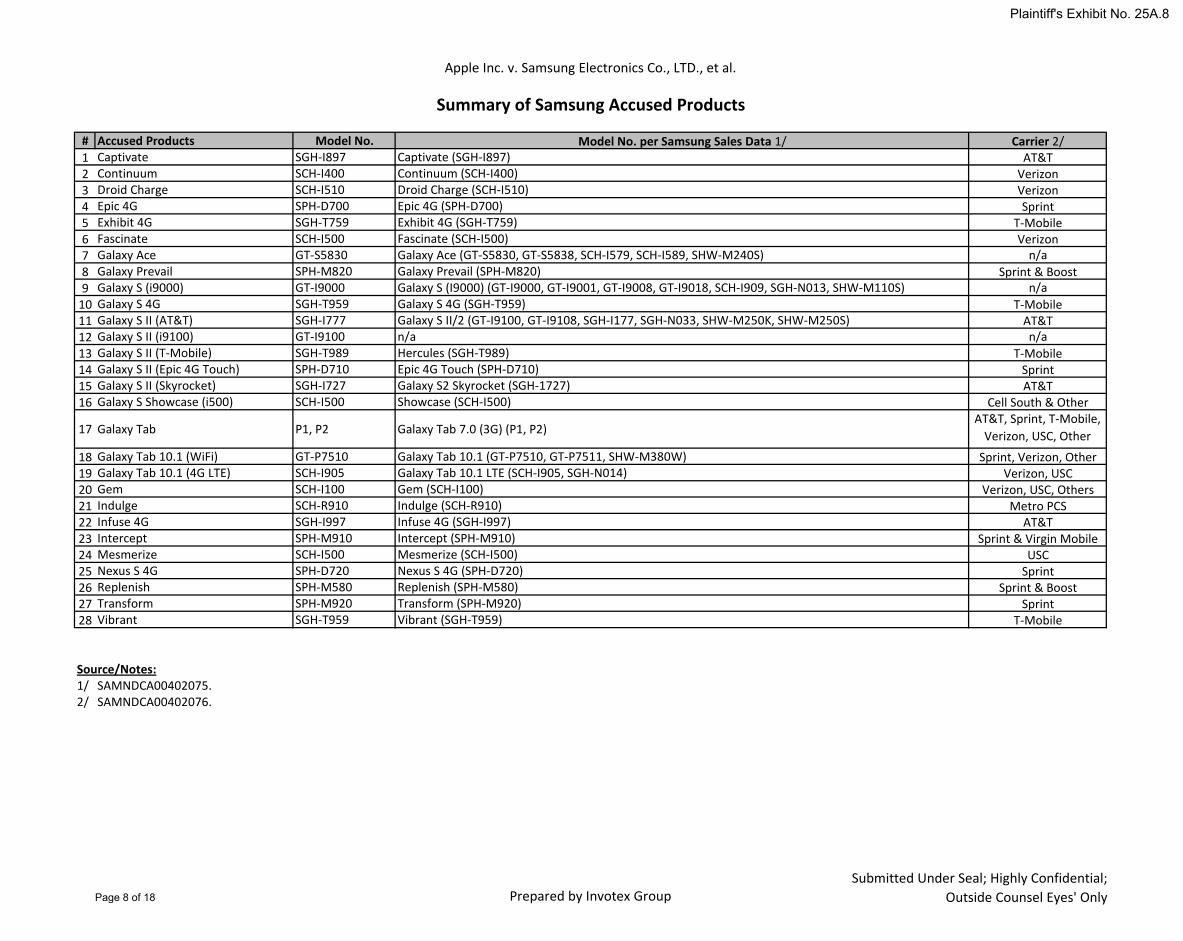
Summary of Samsung Accused Products
# Accused Products Model No. Model No. per Samsung Sales Data 1/ Carrier 2/1 Captivate SGH-I897 Captivate (SGH-I897) AT&T2 Continuum SCH-I400 Continuum (SCH-I400) Verizon3 Droid Charge SCH-I510 Droid Charge (SCH-I510) Verizon4 Epic 4G SPH-D700 Epic 4G (SPH-D700) Sprint5 Exhibit 4G SGH-T759 Exhibit 4G (SGH-T759) T-Mobile6 Fascinate SCH-I500 Fascinate (SCH-I500) Verizon7 Galaxy Ace GT-S5830 Galaxy Ace (GT-S5830, GT-S5838, SCH-I579, SCH-I589, SHW-M240S) n/a8 Galaxy Prevail SPH-M820 Galaxy Prevail (SPH-M820) Sprint & Boost9 Galaxy S (i9000) GT-I9000 Galaxy S (I9000) (GT-I9000, GT-I9001, GT-I9008, GT-I9018, SCH-I909, SGH-N013, SHW-M110S) n/a
10 Galaxy S 4G SGH-T959 Galaxy S 4G (SGH-T959) T-Mobile11 Galaxy S II (AT&T) SGH-I777 Galaxy S II/2 (GT-I9100, GT-I9108, SGH-I177, SGH-N033, SHW-M250K, SHW-M250S) AT&T12 Galaxy S II (i9100) GT-I9100 n/a n/a13 Galaxy S II (T-Mobile) SGH-T989 Hercules (SGH-T989) T-Mobile14 Galaxy S II (Epic 4G Touch) SPH-D710 Epic 4G Touch (SPH-D710) Sprint15 Galaxy S II (Skyrocket) SGH-I727 Galaxy S2 Skyrocket (SGH-1727) AT&T16 Galaxy S Showcase (i500) SCH-I500 Showcase (SCH-I500) Cell South & Other
17 Galaxy Tab P1, P2 Galaxy Tab 7.0 (3G) (P1, P2)AT&T, Sprint, T-Mobile,
Verizon, USC, Other
18 Galaxy Tab 10.1 (WiFi) GT-P7510 Galaxy Tab 10.1 (GT-P7510, GT-P7511, SHW-M380W) Sprint, Verizon, Other19 Galaxy Tab 10.1 (4G LTE) SCH-I905 Galaxy Tab 10.1 LTE (SCH-I905, SGH-N014) Verizon, USC20 Gem SCH-I100 Gem (SCH-I100) Verizon, USC, Others21 Indulge SCH-R910 Indulge (SCH-R910) Metro PCS22 Infuse 4G SGH-I997 Infuse 4G (SGH-I997) AT&T23 Intercept SPH-M910 Intercept (SPH-M910) Sprint & Virgin Mobile24 Mesmerize SCH-I500 Mesmerize (SCH-I500) USC25 Nexus S 4G SPH-D720 Nexus S 4G (SPH-D720) Sprint26 Replenish SPH-M580 Replenish (SPH-M580) Sprint & Boost27 Transform SPH-M920 Transform (SPH-M920) Sprint28 Vibrant SGH-T959 Vibrant (SGH-T959) T-Mobile
Source/Notes:1/2/
SAMNDCA00402075.SAMNDCA00402076.
Page 8 of 18
Plaintiff's Exhibit No. 25A.8
Apple Inc. v. Samsung Electronics Co., LTD., et al.
Prepared by Invotex GroupSubmitted Under Seal; Highly Confidential;
Outside Counsel Eyes' Only
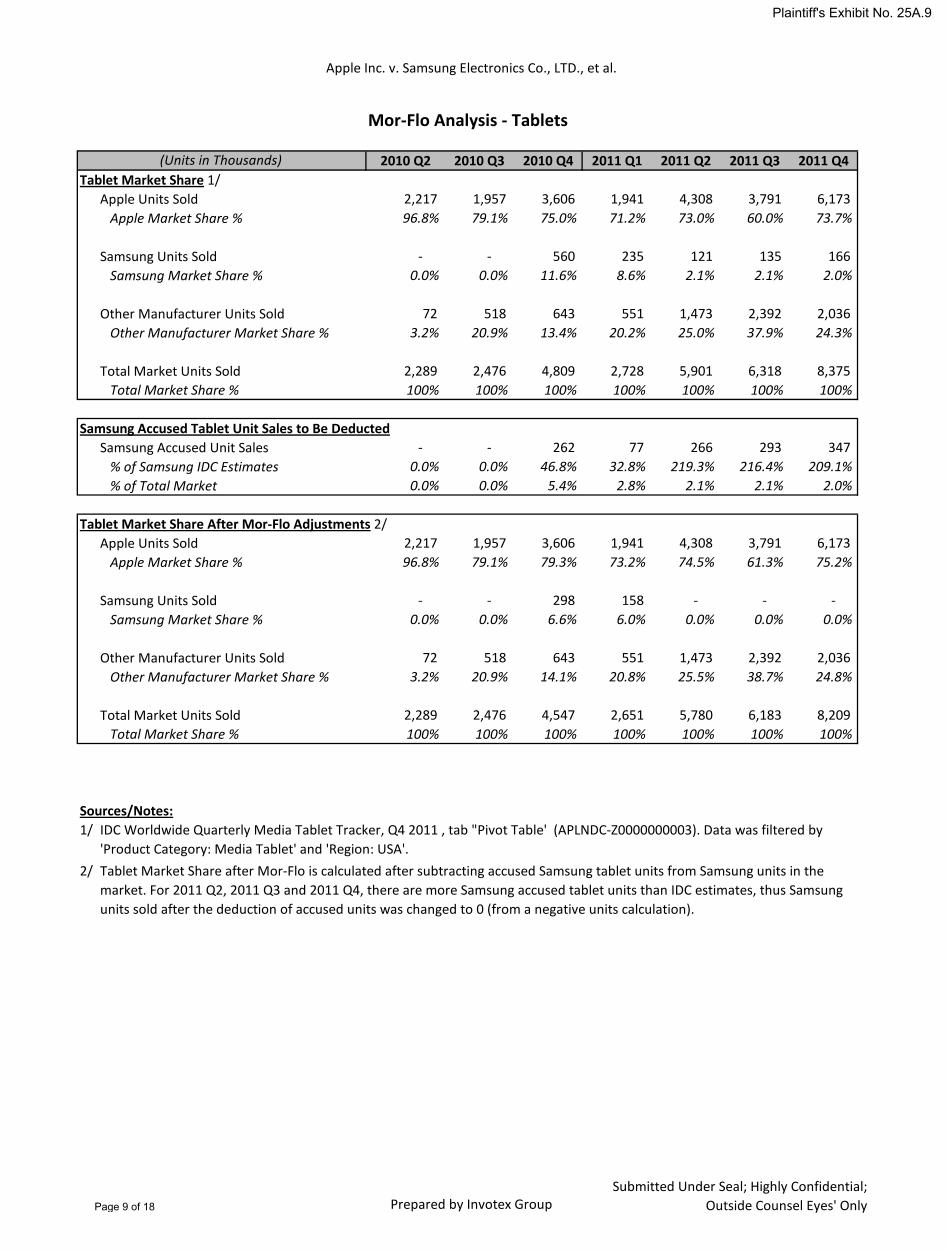
2010 Q2 2010 Q3 2010 Q4 2011 Q1 2011 Q2 2011 Q3 2011 Q4Tablet Market Share 1/
Apple Units Sold 2,217 1,957 3,606 1,941 4,308 3,791 6,173 Apple Market Share % 96.8% 79.1% 75.0% 71.2% 73.0% 60.0% 73.7%
Samsung Units Sold - - 560 235 121 135 166 Samsung Market Share % 0.0% 0.0% 11.6% 8.6% 2.1% 2.1% 2.0%
Other Manufacturer Units Sold 72 518 643 551 1,473 2,392 2,036 Other Manufacturer Market Share % 3.2% 20.9% 13.4% 20.2% 25.0% 37.9% 24.3%
Total Market Units Sold 2,289 2,476 4,809 2,728 5,901 6,318 8,375 Total Market Share % 100% 100% 100% 100% 100% 100% 100%
Samsung Accused Tablet Unit Sales to Be DeductedSamsung Accused Unit Sales - - 262 77 266 293 347
% of Samsung IDC Estimates 0.0% 0.0% 46.8% 32.8% 219.3% 216.4% 209.1%% of Total Market 0.0% 0.0% 5.4% 2.8% 2.1% 2.1% 2.0%
Tablet Market Share After Mor-Flo Adjustments 2/Apple Units Sold 2,217 1,957 3,606 1,941 4,308 3,791 6,173
Apple Market Share % 96.8% 79.1% 79.3% 73.2% 74.5% 61.3% 75.2%
Samsung Units Sold - - 298 158 - - - Samsung Market Share % 0.0% 0.0% 6.6% 6.0% 0.0% 0.0% 0.0%
Other Manufacturer Units Sold 72 518 643 551 1,473 2,392 2,036 Other Manufacturer Market Share % 3.2% 20.9% 14.1% 20.8% 25.5% 38.7% 24.8%
Total Market Units Sold 2,289 2,476 4,547 2,651 5,780 6,183 8,209 Total Market Share % 100% 100% 100% 100% 100% 100% 100%
Sources/Notes:1/
2/
Mor-Flo Analysis - Tablets
(Units in Thousands)
IDC Worldwide Quarterly Media Tablet Tracker, Q4 2011 , tab "Pivot Table' (APLNDC-Z0000000003). Data was filtered by 'Product Category: Media Tablet' and 'Region: USA'.Tablet Market Share after Mor-Flo is calculated after subtracting accused Samsung tablet units from Samsung units in the market. For 2011 Q2, 2011 Q3 and 2011 Q4, there are more Samsung accused tablet units than IDC estimates, thus Samsung units sold after the deduction of accused units was changed to 0 (from a negative units calculation).
Page 9 of 18
Plaintiff's Exhibit No. 25A.9
Apple Inc. v. Samsung Electronics Co., LTD., et al.
Prepared by Invotex GroupSubmitted Under Seal; Highly Confidential;
Outside Counsel Eyes' Only
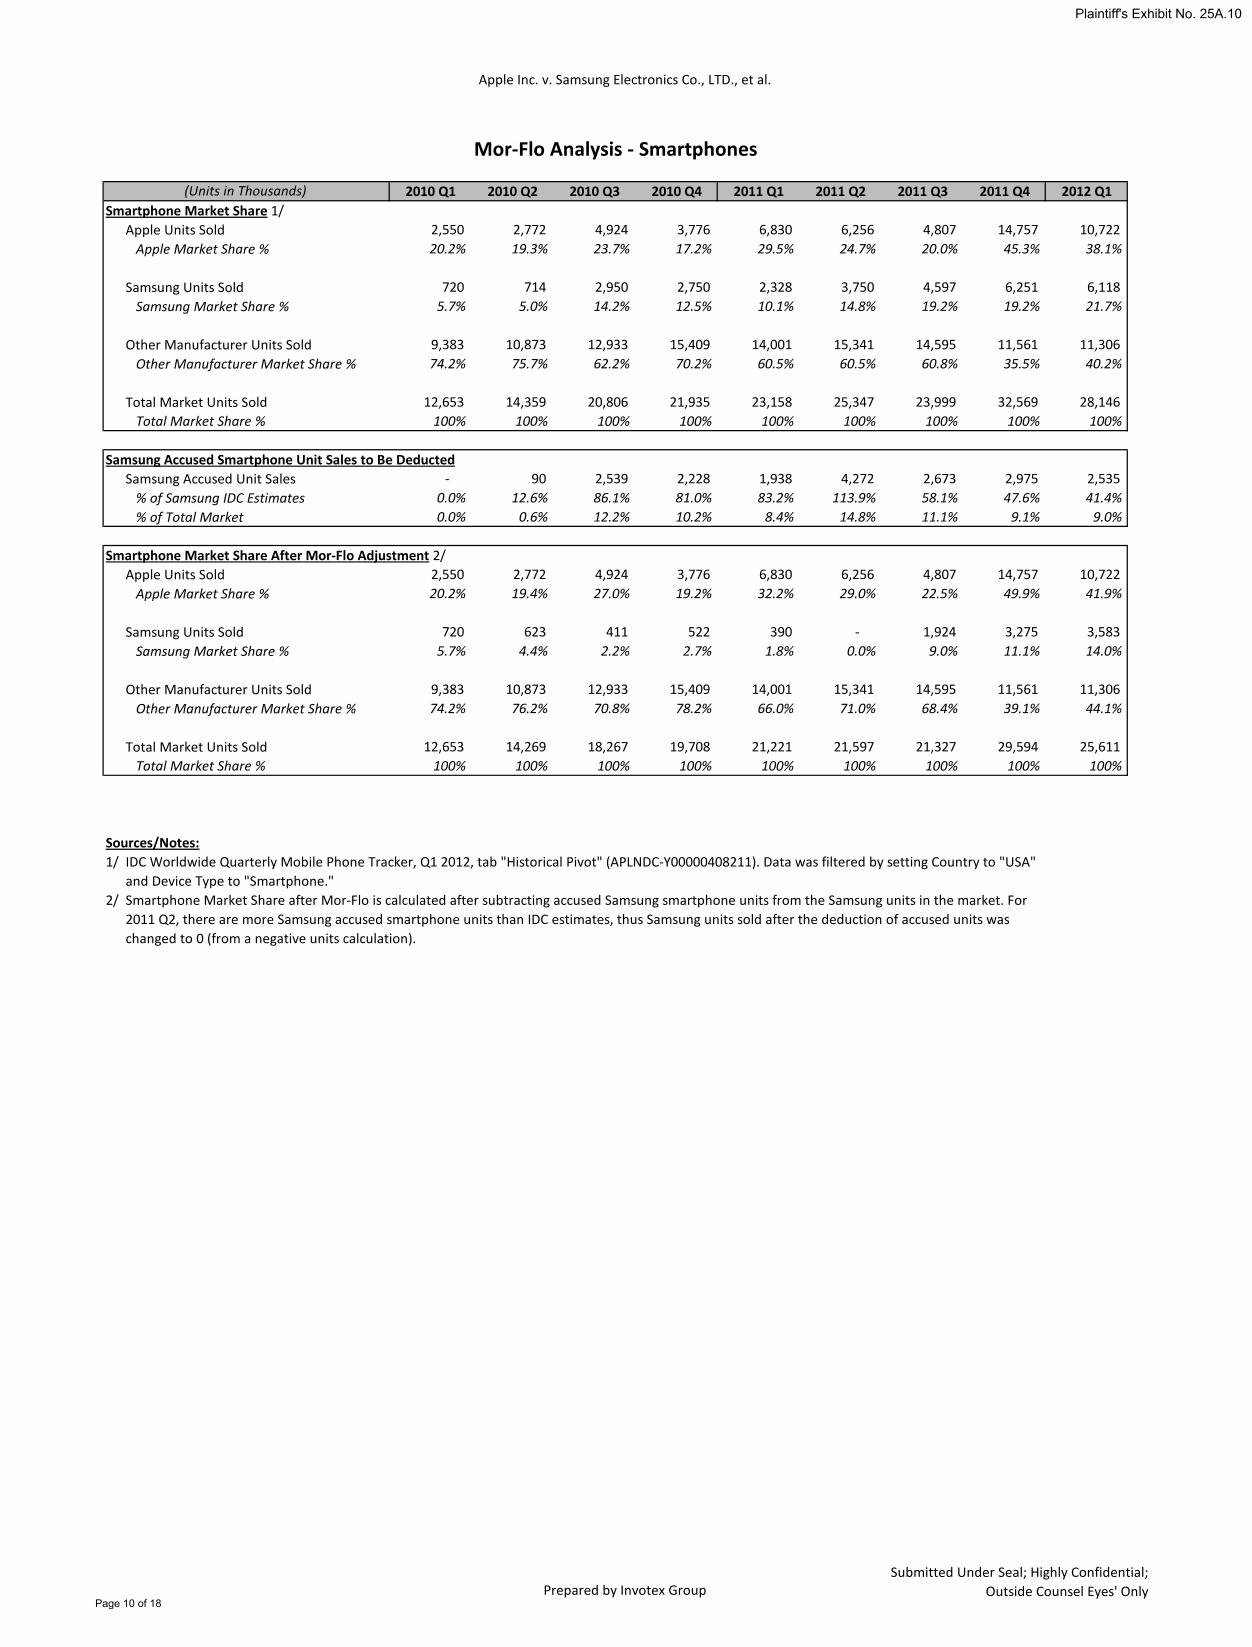
2010 Q1 2010 Q2 2010 Q3 2010 Q4 2011 Q1 2011 Q2 2011 Q3 2011 Q4 2012 Q1Smartphone Market Share 1/
Apple Units Sold 2,550 2,772 4,924 3,776 6,830 6,256 4,807 14,757 10,722 Apple Market Share % 20.2% 19.3% 23.7% 17.2% 29.5% 24.7% 20.0% 45.3% 38.1%
Samsung Units Sold 720 714 2,950 2,750 2,328 3,750 4,597 6,251 6,118 Samsung Market Share % 5.7% 5.0% 14.2% 12.5% 10.1% 14.8% 19.2% 19.2% 21.7%
Other Manufacturer Units Sold 9,383 10,873 12,933 15,409 14,001 15,341 14,595 11,561 11,306 Other Manufacturer Market Share % 74.2% 75.7% 62.2% 70.2% 60.5% 60.5% 60.8% 35.5% 40.2%
Total Market Units Sold 12,653 14,359 20,806 21,935 23,158 25,347 23,999 32,569 28,146 Total Market Share % 100% 100% 100% 100% 100% 100% 100% 100% 100%
Samsung Accused Smartphone Unit Sales to Be DeductedSamsung Accused Unit Sales - 90 2,539 2,228 1,938 4,272 2,673 2,975 2,535
% of Samsung IDC Estimates 0.0% 12.6% 86.1% 81.0% 83.2% 113.9% 58.1% 47.6% 41.4%% of Total Market 0.0% 0.6% 12.2% 10.2% 8.4% 14.8% 11.1% 9.1% 9.0%
Smartphone Market Share After Mor-Flo Adjustment 2/Apple Units Sold 2,550 2,772 4,924 3,776 6,830 6,256 4,807 14,757 10,722
Apple Market Share % 20.2% 19.4% 27.0% 19.2% 32.2% 29.0% 22.5% 49.9% 41.9%
Samsung Units Sold 720 623 411 522 390 - 1,924 3,275 3,583 Samsung Market Share % 5.7% 4.4% 2.2% 2.7% 1.8% 0.0% 9.0% 11.1% 14.0%
Other Manufacturer Units Sold 9,383 10,873 12,933 15,409 14,001 15,341 14,595 11,561 11,306 Other Manufacturer Market Share % 74.2% 76.2% 70.8% 78.2% 66.0% 71.0% 68.4% 39.1% 44.1%
Total Market Units Sold 12,653 14,269 18,267 19,708 21,221 21,597 21,327 29,594 25,611 Total Market Share % 100% 100% 100% 100% 100% 100% 100% 100% 100%
Sources/Notes:1/
2/
(Units in Thousands)
IDC Worldwide Quarterly Mobile Phone Tracker, Q1 2012, tab "Historical Pivot" (APLNDC-Y00000408211). Data was filtered by setting Country to "USA" and Device Type to "Smartphone." Smartphone Market Share after Mor-Flo is calculated after subtracting accused Samsung smartphone units from the Samsung units in the market. For 2011 Q2, there are more Samsung accused smartphone units than IDC estimates, thus Samsung units sold after the deduction of accused units was changed to 0 (from a negative units calculation).
Mor-Flo Analysis - Smartphones
Page 10 of 18
Plaintiff's Exhibit No. 25A.10
Apple Inc. v. Samsung Electronics Co., LTD., et al.
Perpared by Invotex GroupSubmitted Under Seal; Highly Confidential;
Outside Counsel Eyes' Only
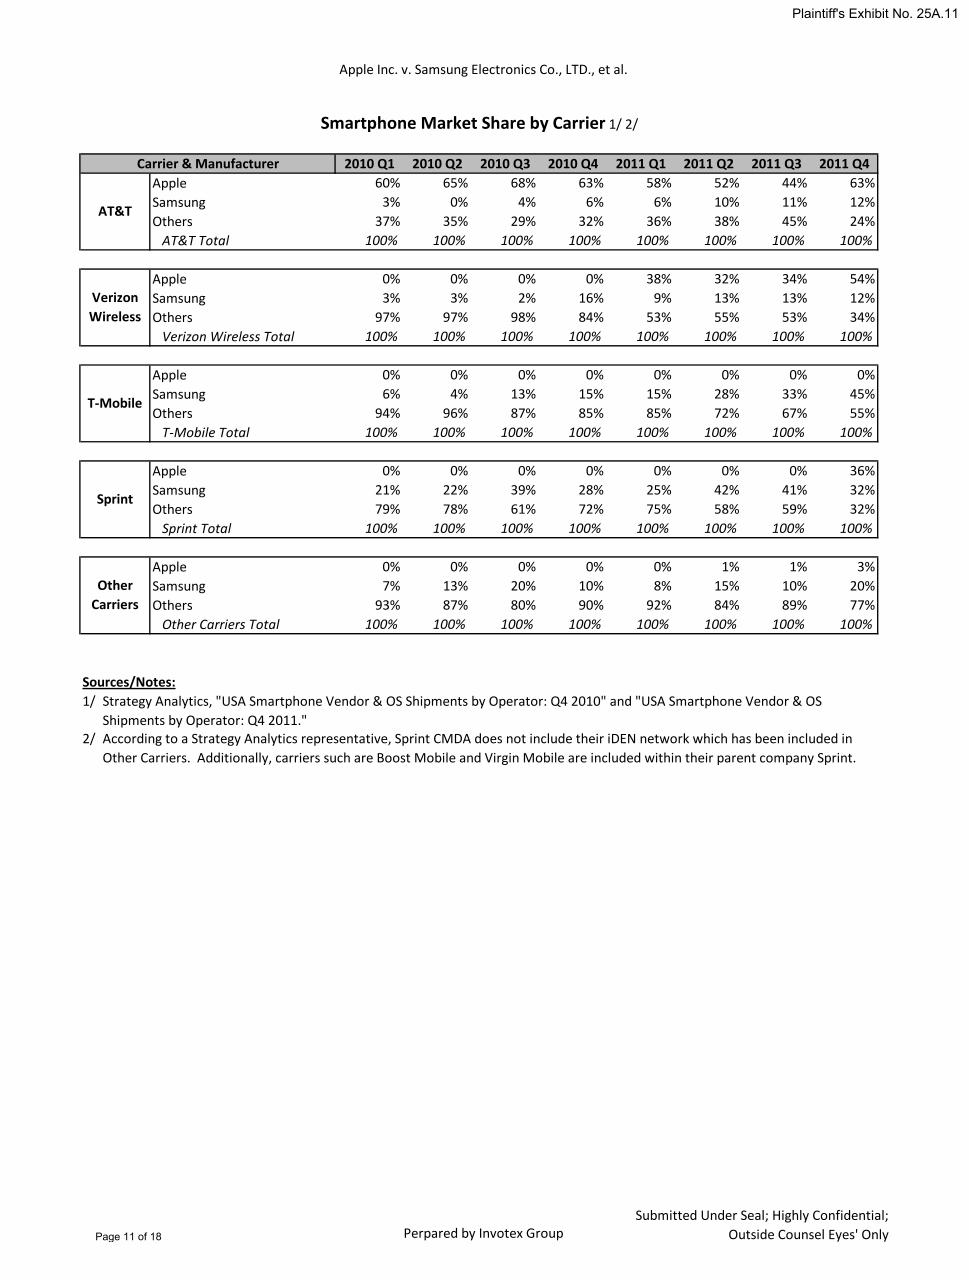
2010 Q1 2010 Q2 2010 Q3 2010 Q4 2011 Q1 2011 Q2 2011 Q3 2011 Q4Apple 60% 65% 68% 63% 58% 52% 44% 63%Samsung 3% 0% 4% 6% 6% 10% 11% 12%Others 37% 35% 29% 32% 36% 38% 45% 24%
AT&T Total 100% 100% 100% 100% 100% 100% 100% 100%
Apple 0% 0% 0% 0% 38% 32% 34% 54%Samsung 3% 3% 2% 16% 9% 13% 13% 12%Others 97% 97% 98% 84% 53% 55% 53% 34%
Verizon Wireless Total 100% 100% 100% 100% 100% 100% 100% 100%
Apple 0% 0% 0% 0% 0% 0% 0% 0%Samsung 6% 4% 13% 15% 15% 28% 33% 45%Others 94% 96% 87% 85% 85% 72% 67% 55%
T-Mobile Total 100% 100% 100% 100% 100% 100% 100% 100%
Apple 0% 0% 0% 0% 0% 0% 0% 36%Samsung 21% 22% 39% 28% 25% 42% 41% 32%Others 79% 78% 61% 72% 75% 58% 59% 32%
Sprint Total 100% 100% 100% 100% 100% 100% 100% 100%
Apple 0% 0% 0% 0% 0% 1% 1% 3%Samsung 7% 13% 20% 10% 8% 15% 10% 20%Others 93% 87% 80% 90% 92% 84% 89% 77%
Other Carriers Total 100% 100% 100% 100% 100% 100% 100% 100%
Sources/Notes:1/
2/
Other Carriers
Strategy Analytics, "USA Smartphone Vendor & OS Shipments by Operator: Q4 2010" and "USA Smartphone Vendor & OS Shipments by Operator: Q4 2011."According to a Strategy Analytics representative, Sprint CMDA does not include their iDEN network which has been included in Other Carriers. Additionally, carriers such are Boost Mobile and Virgin Mobile are included within their parent company Sprint.
Smartphone Market Share by Carrier 1/ 2/
Carrier & Manufacturer
AT&T
Verizon Wireless
T-Mobile
Sprint
Page 11 of 18
Plaintiff's Exhibit No. 25A.11
Apple Inc. v. Samsung Electronics Co., LTD., et al.
Prepared by Invotex GroupSubmitted Under Seal; Highly Confidential;
Outside Counsel Eyes' Only
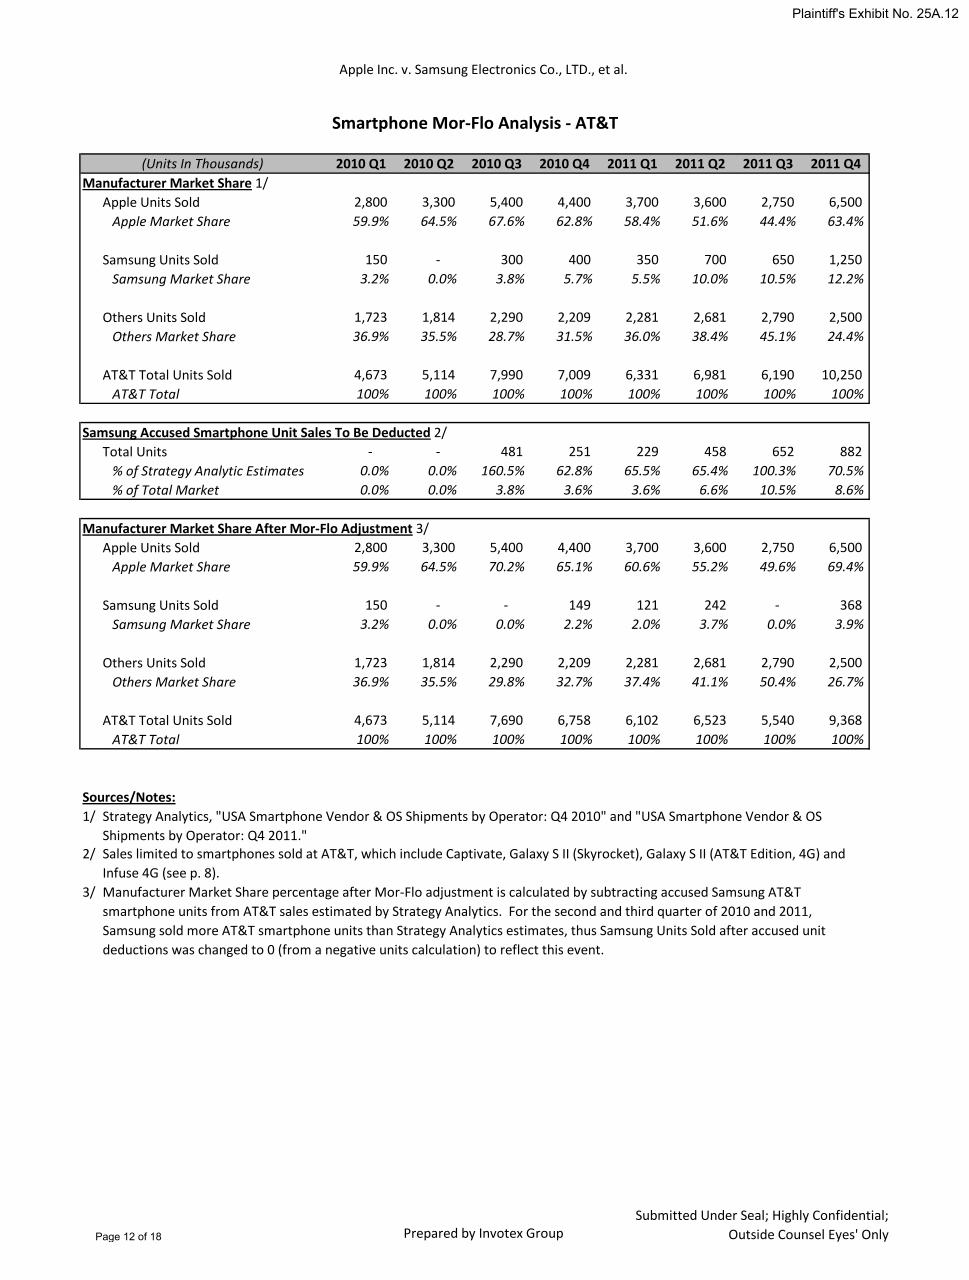
2010 Q1 2010 Q2 2010 Q3 2010 Q4 2011 Q1 2011 Q2 2011 Q3 2011 Q4Manufacturer Market Share 1/
Apple Units Sold 2,800 3,300 5,400 4,400 3,700 3,600 2,750 6,500 Apple Market Share 59.9% 64.5% 67.6% 62.8% 58.4% 51.6% 44.4% 63.4%
Samsung Units Sold 150 - 300 400 350 700 650 1,250 Samsung Market Share 3.2% 0.0% 3.8% 5.7% 5.5% 10.0% 10.5% 12.2%
Others Units Sold 1,723 1,814 2,290 2,209 2,281 2,681 2,790 2,500 Others Market Share 36.9% 35.5% 28.7% 31.5% 36.0% 38.4% 45.1% 24.4%
AT&T Total Units Sold 4,673 5,114 7,990 7,009 6,331 6,981 6,190 10,250 AT&T Total 100% 100% 100% 100% 100% 100% 100% 100%
Samsung Accused Smartphone Unit Sales To Be Deducted 2/Total Units - - 481 251 229 458 652 882
% of Strategy Analytic Estimates 0.0% 0.0% 160.5% 62.8% 65.5% 65.4% 100.3% 70.5%% of Total Market 0.0% 0.0% 3.8% 3.6% 3.6% 6.6% 10.5% 8.6%
Manufacturer Market Share After Mor-Flo Adjustment 3/Apple Units Sold 2,800 3,300 5,400 4,400 3,700 3,600 2,750 6,500
Apple Market Share 59.9% 64.5% 70.2% 65.1% 60.6% 55.2% 49.6% 69.4%
Samsung Units Sold 150 - - 149 121 242 - 368 Samsung Market Share 3.2% 0.0% 0.0% 2.2% 2.0% 3.7% 0.0% 3.9%
Others Units Sold 1,723 1,814 2,290 2,209 2,281 2,681 2,790 2,500 Others Market Share 36.9% 35.5% 29.8% 32.7% 37.4% 41.1% 50.4% 26.7%
AT&T Total Units Sold 4,673 5,114 7,690 6,758 6,102 6,523 5,540 9,368 AT&T Total 100% 100% 100% 100% 100% 100% 100% 100%
Sources/Notes:1/
2/
3/
Smartphone Mor-Flo Analysis - AT&T
(Units In Thousands)
Strategy Analytics, "USA Smartphone Vendor & OS Shipments by Operator: Q4 2010" and "USA Smartphone Vendor & OS Shipments by Operator: Q4 2011."Sales limited to smartphones sold at AT&T, which include Captivate, Galaxy S II (Skyrocket), Galaxy S II (AT&T Edition, 4G) and Infuse 4G (see p. 8).Manufacturer Market Share percentage after Mor-Flo adjustment is calculated by subtracting accused Samsung AT&T smartphone units from AT&T sales estimated by Strategy Analytics. For the second and third quarter of 2010 and 2011, Samsung sold more AT&T smartphone units than Strategy Analytics estimates, thus Samsung Units Sold after accused unit deductions was changed to 0 (from a negative units calculation) to reflect this event.
Page 12 of 18
Plaintiff's Exhibit No. 25A.12
Apple Inc. v. Samsung Electronics Co., LTD., et al.
Prepared by Invotex GroupSubmitted Under Seal; Highly Confidential;
Outside Counsel Eyes' Only
2010 Q1 2010 Q2 2010 Q3 2010 Q4 2011 Q1 2011 Q2 2011 Q3 2011 Q4Manufacturer Market Share 1/
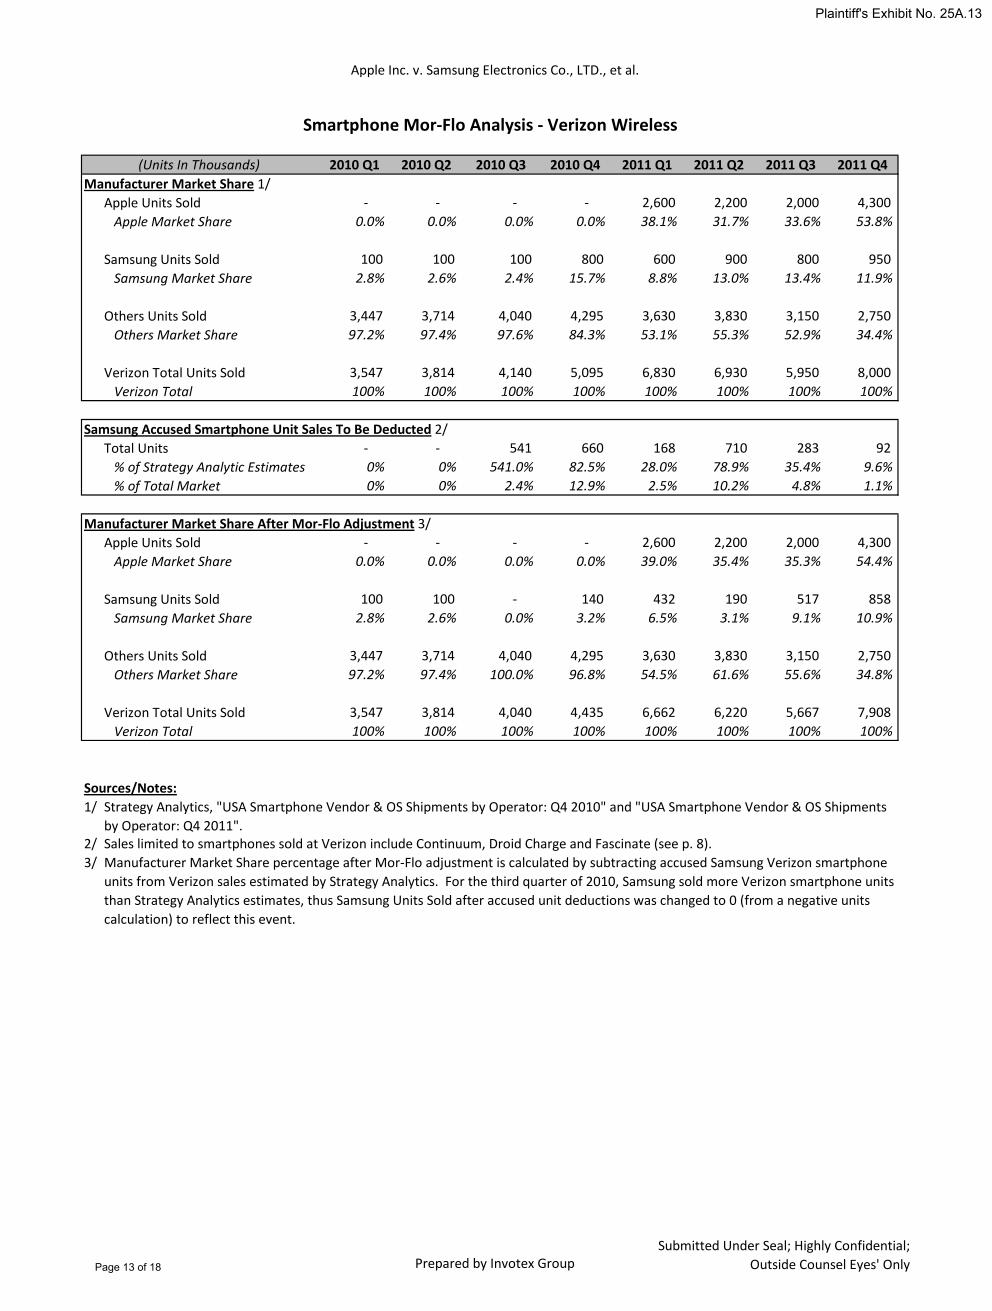
Apple Units Sold - - - - 2,600 2,200 2,000 4,300 Apple Market Share 0.0% 0.0% 0.0% 0.0% 38.1% 31.7% 33.6% 53.8%
Samsung Units Sold 100 100 100 800 600 900 800 950 Samsung Market Share 2.8% 2.6% 2.4% 15.7% 8.8% 13.0% 13.4% 11.9%
Others Units Sold 3,447 3,714 4,040 4,295 3,630 3,830 3,150 2,750 Others Market Share 97.2% 97.4% 97.6% 84.3% 53.1% 55.3% 52.9% 34.4%
Verizon Total Units Sold 3,547 3,814 4,140 5,095 6,830 6,930 5,950 8,000 Verizon Total 100% 100% 100% 100% 100% 100% 100% 100%
Samsung Accused Smartphone Unit Sales To Be Deducted 2/Total Units - - 541 660 168 710 283 92
% of Strategy Analytic Estimates 0% 0% 541.0% 82.5% 28.0% 78.9% 35.4% 9.6%% of Total Market 0% 0% 2.4% 12.9% 2.5% 10.2% 4.8% 1.1%
Manufacturer Market Share After Mor-Flo Adjustment 3/Apple Units Sold - - - - 2,600 2,200 2,000 4,300
Apple Market Share 0.0% 0.0% 0.0% 0.0% 39.0% 35.4% 35.3% 54.4%
Samsung Units Sold 100 100 - 140 432 190 517 858 Samsung Market Share 2.8% 2.6% 0.0% 3.2% 6.5% 3.1% 9.1% 10.9%
Others Units Sold 3,447 3,714 4,040 4,295 3,630 3,830 3,150 2,750 Others Market Share 97.2% 97.4% 100.0% 96.8% 54.5% 61.6% 55.6% 34.8%
Verizon Total Units Sold 3,547 3,814 4,040 4,435 6,662 6,220 5,667 7,908 Verizon Total 100% 100% 100% 100% 100% 100% 100% 100%
Sources/Notes:1/
2/3/
Smartphone Mor-Flo Analysis - Verizon Wireless
(Units In Thousands)
Strategy Analytics, "USA Smartphone Vendor & OS Shipments by Operator: Q4 2010" and "USA Smartphone Vendor & OS Shipments by Operator: Q4 2011".Sales limited to smartphones sold at Verizon include Continuum, Droid Charge and Fascinate (see p. 8). Manufacturer Market Share percentage after Mor-Flo adjustment is calculated by subtracting accused Samsung Verizon smartphone units from Verizon sales estimated by Strategy Analytics. For the third quarter of 2010, Samsung sold more Verizon smartphone units than Strategy Analytics estimates, thus Samsung Units Sold after accused unit deductions was changed to 0 (from a negative units calculation) to reflect this event.
Page 13 of 18
Plaintiff's Exhibit No. 25A.13
Apple Inc. v. Samsung Electronics Co., LTD., et al.
Prepared by Invotex GroupSubmitted Under Seal; Highly Confidential;
Outside Counsel Eyes' Only
2010 Q1 2010 Q2 2010 Q3 2010 Q4 2011 Q1 2011 Q2 2011 Q3 2011 Q4Manufacturer Market Share 1/
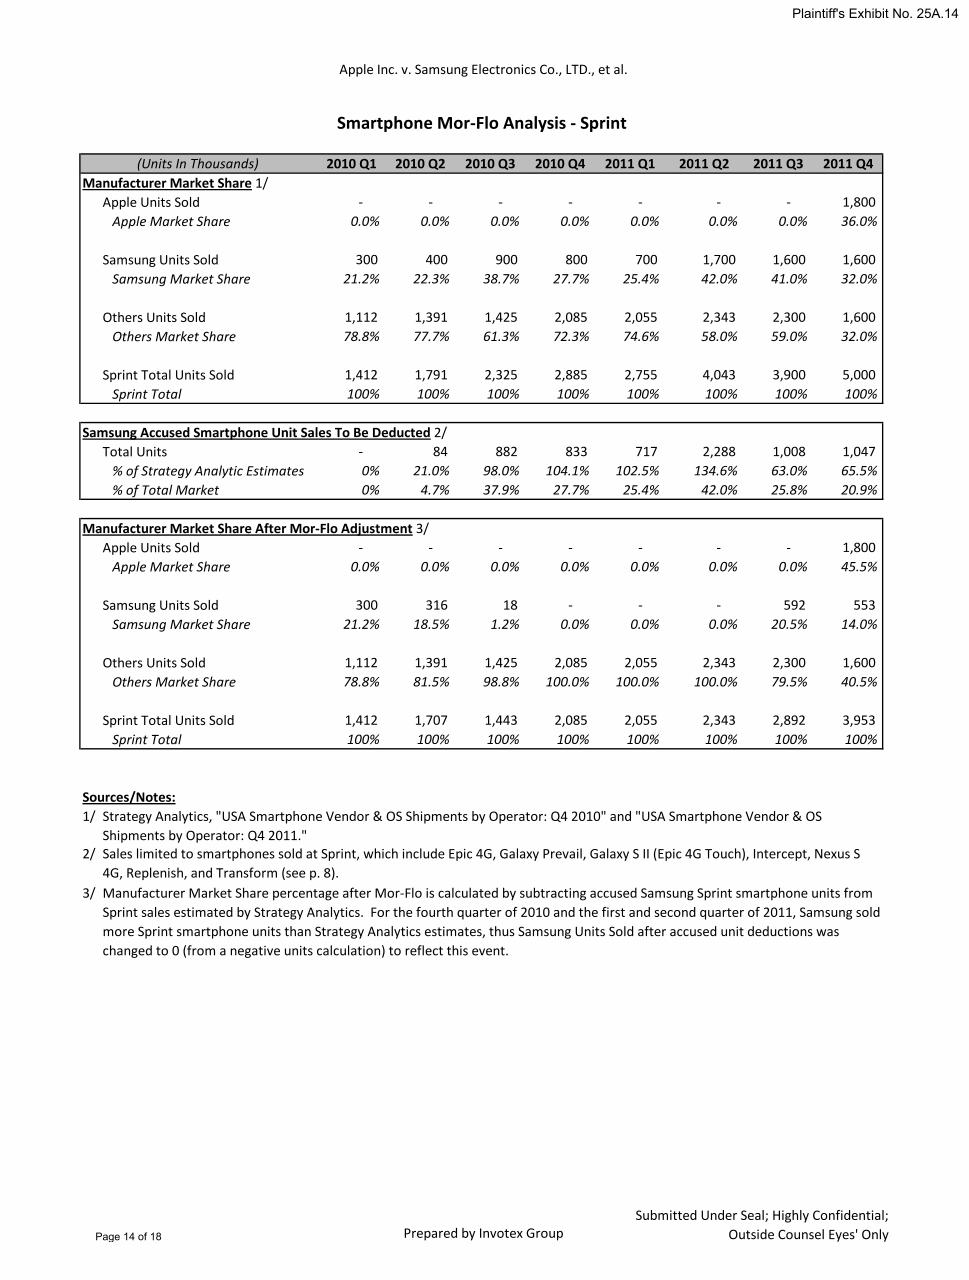
Apple Units Sold - - - - - - - 1,800 Apple Market Share 0.0% 0.0% 0.0% 0.0% 0.0% 0.0% 0.0% 36.0%
Samsung Units Sold 300 400 900 800 700 1,700 1,600 1,600 Samsung Market Share 21.2% 22.3% 38.7% 27.7% 25.4% 42.0% 41.0% 32.0%
Others Units Sold 1,112 1,391 1,425 2,085 2,055 2,343 2,300 1,600 Others Market Share 78.8% 77.7% 61.3% 72.3% 74.6% 58.0% 59.0% 32.0%
Sprint Total Units Sold 1,412 1,791 2,325 2,885 2,755 4,043 3,900 5,000 Sprint Total 100% 100% 100% 100% 100% 100% 100% 100%
Samsung Accused Smartphone Unit Sales To Be Deducted 2/Total Units - 84 882 833 717 2,288 1,008 1,047
% of Strategy Analytic Estimates 0% 21.0% 98.0% 104.1% 102.5% 134.6% 63.0% 65.5%% of Total Market 0% 4.7% 37.9% 27.7% 25.4% 42.0% 25.8% 20.9%
Manufacturer Market Share After Mor-Flo Adjustment 3/Apple Units Sold - - - - - - - 1,800
Apple Market Share 0.0% 0.0% 0.0% 0.0% 0.0% 0.0% 0.0% 45.5%
Samsung Units Sold 300 316 18 - - - 592 553 Samsung Market Share 21.2% 18.5% 1.2% 0.0% 0.0% 0.0% 20.5% 14.0%
Others Units Sold 1,112 1,391 1,425 2,085 2,055 2,343 2,300 1,600 Others Market Share 78.8% 81.5% 98.8% 100.0% 100.0% 100.0% 79.5% 40.5%
Sprint Total Units Sold 1,412 1,707 1,443 2,085 2,055 2,343 2,892 3,953 Sprint Total 100% 100% 100% 100% 100% 100% 100% 100%
Sources/Notes:1/
2/
3/
Smartphone Mor-Flo Analysis - Sprint
(Units In Thousands)
Strategy Analytics, "USA Smartphone Vendor & OS Shipments by Operator: Q4 2010" and "USA Smartphone Vendor & OS Shipments by Operator: Q4 2011."Sales limited to smartphones sold at Sprint, which include Epic 4G, Galaxy Prevail, Galaxy S II (Epic 4G Touch), Intercept, Nexus S 4G, Replenish, and Transform (see p. 8).Manufacturer Market Share percentage after Mor-Flo is calculated by subtracting accused Samsung Sprint smartphone units from Sprint sales estimated by Strategy Analytics. For the fourth quarter of 2010 and the first and second quarter of 2011, Samsung sold more Sprint smartphone units than Strategy Analytics estimates, thus Samsung Units Sold after accused unit deductions was changed to 0 (from a negative units calculation) to reflect this event.
Page 14 of 18
Plaintiff's Exhibit No. 25A.14
Google Confidential and Proprietary
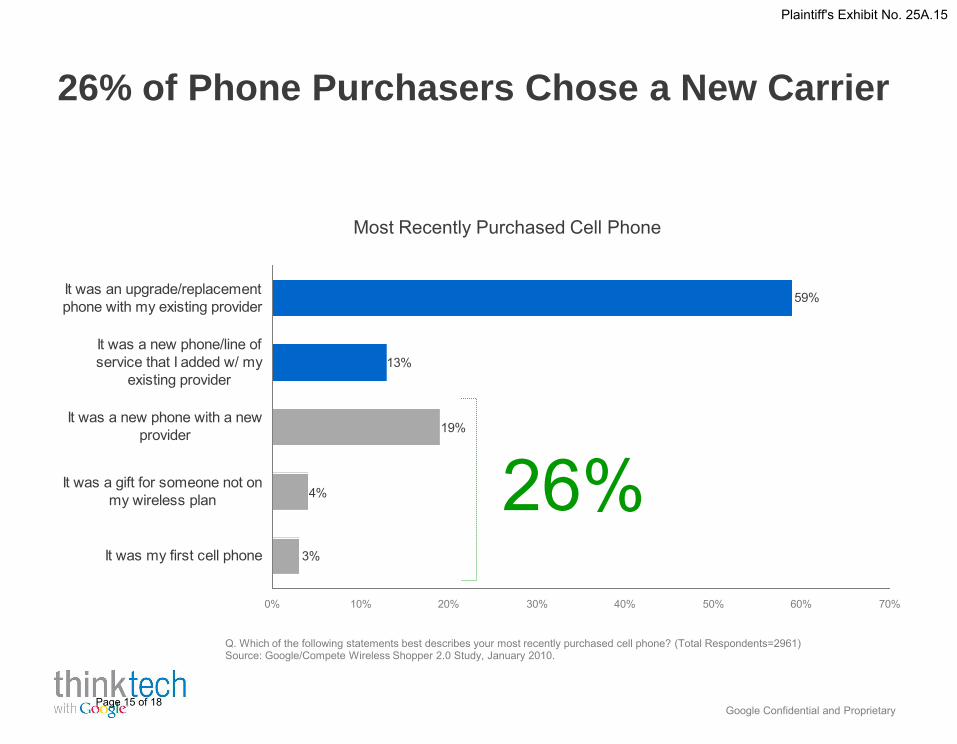
26% of Phone Purchasers Chose a New Carrier
6
Q. Which of the following statements best describes your most recently purchased cell phone? (Total Respondents=2961)Source: Google/Compete Wireless Shopper 2.0 Study, January 2010.
Most Recently Purchased Cell Phone
4%
3%
13%
59%
19%
0% 10% 20% 30% 40% 50% 60% 70%
It was my first cell phone
It was a gift for someone not onmy wireless plan
It was a new phone with a newprovider
It was a new phone/line ofservice that I added w/ my
existing provider
It was an upgrade/replacementphone with my existing provider
26%
Page 15 of 18
Plaintiff's Exhibit No. 25A.15
Apple Inc. v. Samsung Electronics Co., LTD., et al.
Prepared by Invotex GroupSubmitted Under Seal; Highly Confidential;
Outside Counsel Eyes' Only
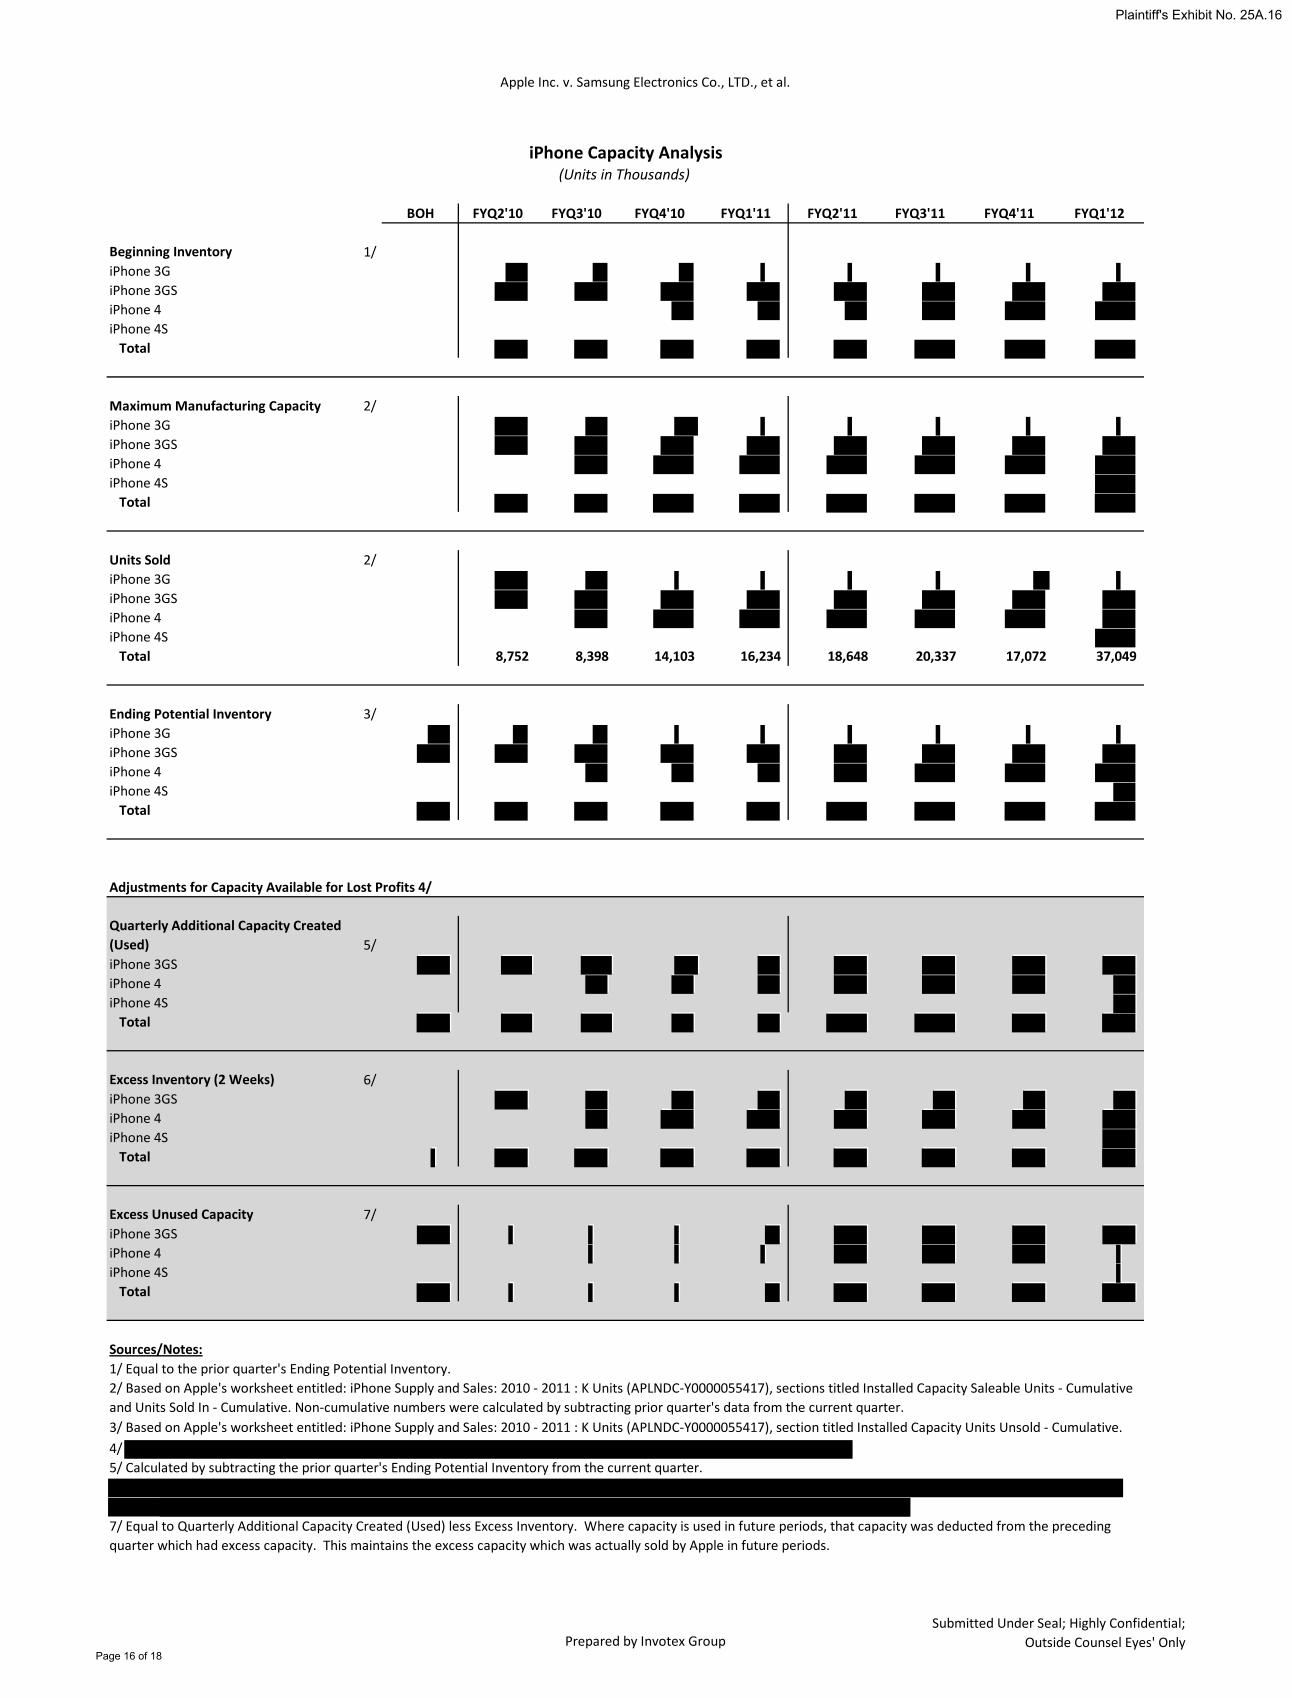
BOH FYQ2'10 FYQ3'10 FYQ4'10 FYQ1'11 FYQ2'11 FYQ3'11 FYQ4'11 FYQ1'12
Beginning Inventory 1/iPhone 3G iPhone 3GS iPhone 4 iPhone 4S
Total
Maximum Manufacturing Capacity 2/iPhone 3G iPhone 3GS iPhone 4 iPhone 4S
Total
Units Sold 2/iPhone 3G iPhone 3GS iPhone 4 iPhone 4S
Total 8,752 8,398 14,103 16,234 18,648 20,337 17,072 37,049
Ending Potential Inventory 3/iPhone 3G iPhone 3GS iPhone 4 iPhone 4S
Total
Adjustments for Capacity Available for Lost Profits 4/
Quarterly Additional Capacity Created (Used) 5/iPhone 3GS iPhone 4 iPhone 4S
Total
Excess Inventory (2 Weeks) 6/iPhone 3GS iPhone 4 iPhone 4S
Total
Excess Unused Capacity 7/iPhone 3GS iPhone 4 iPhone 4S
Total
Sources/Notes:1/ Equal to the prior quarter's Ending Potential Inventory.
4/ 5/ Calculated by subtracting the prior quarter's Ending Potential Inventory from the current quarter.
2/ Based on Apple's worksheet entitled: iPhone Supply and Sales: 2010 - 2011 : K Units (APLNDC-Y0000055417), sections titled Installed Capacity Saleable Units - Cumulative and Units Sold In - Cumulative. Non-cumulative numbers were calculated by subtracting prior quarter's data from the current quarter.
7/ Equal to Quarterly Additional Capacity Created (Used) less Excess Inventory. Where capacity is used in future periods, that capacity was deducted from the preceding quarter which had excess capacity. This maintains the excess capacity which was actually sold by Apple in future periods.
3/ Based on Apple's worksheet entitled: iPhone Supply and Sales: 2010 - 2011 : K Units (APLNDC-Y0000055417), section titled Installed Capacity Units Unsold - Cumulative.
iPhone Capacity Analysis(Units in Thousands)
Page 16 of 18
Plaintiff's Exhibit No. 25A.16
Apple Inc. v. Samsung Electronics Co., LTD., et al.
Prepared by Invotex GroupSubmitted Under Seal; Highly Confidential;
Outside Counsel Eyes' Only
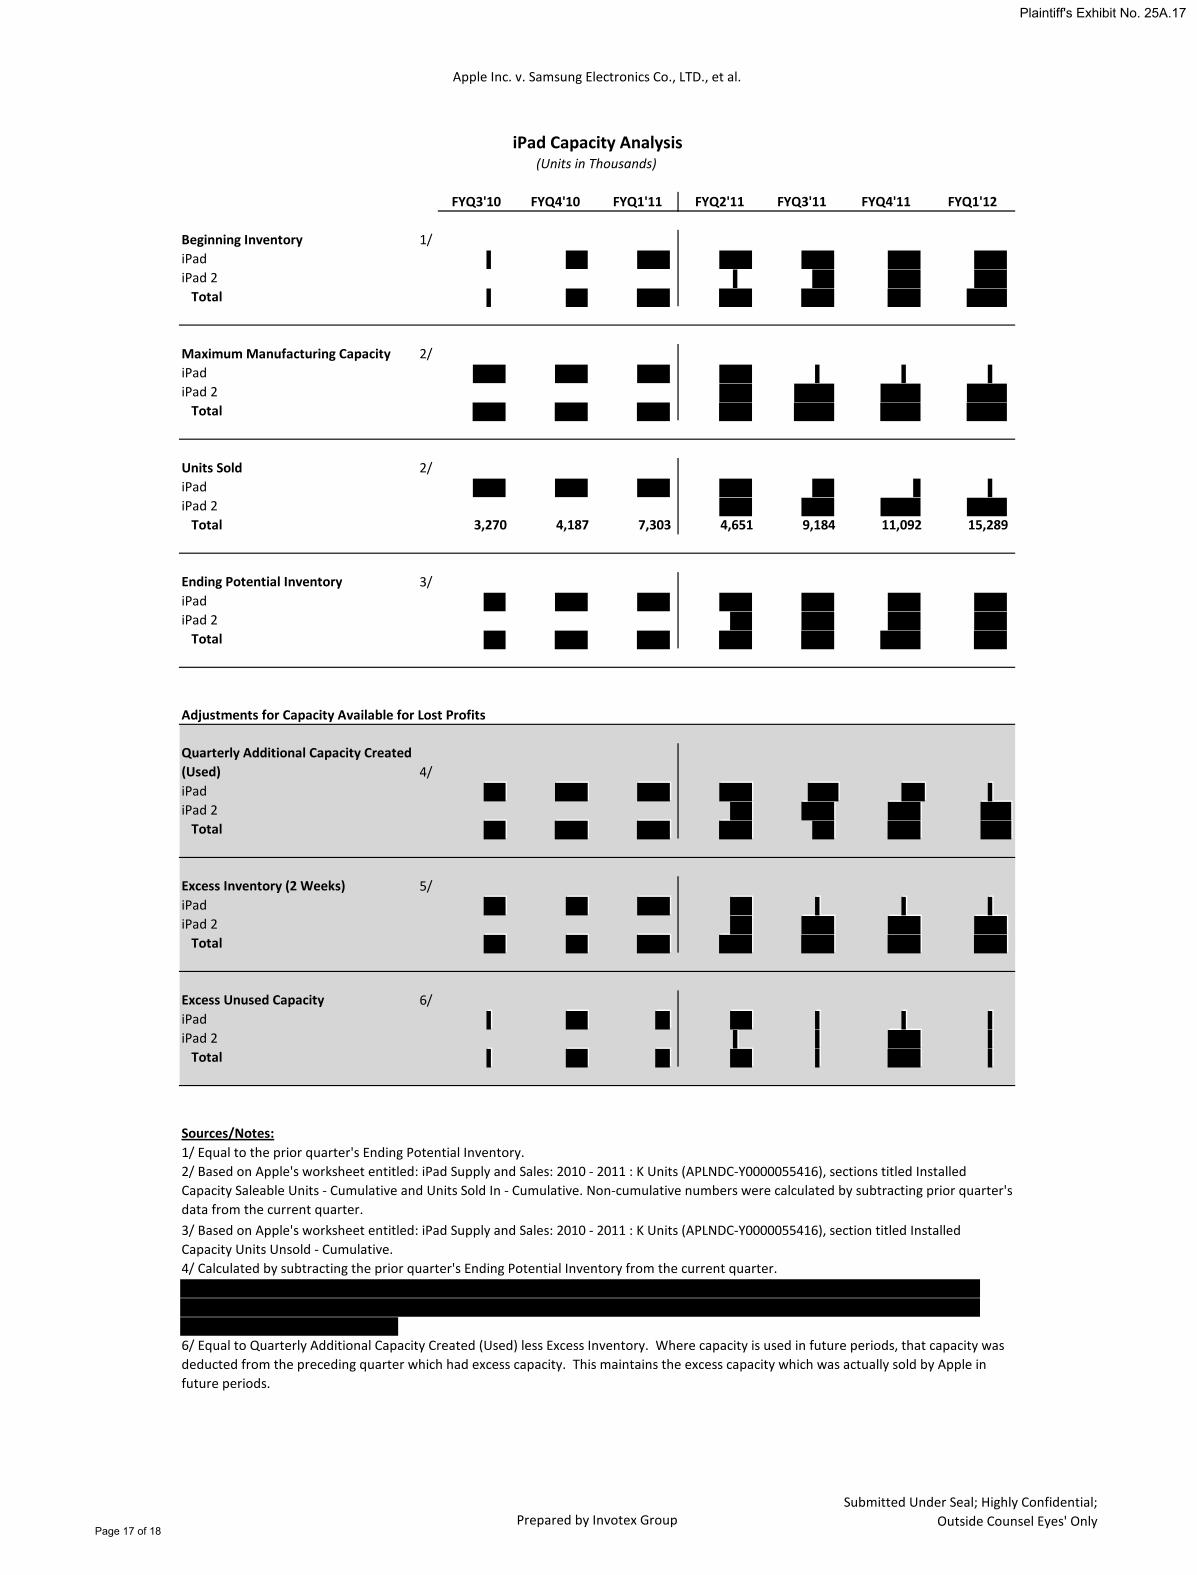
FYQ3'10 FYQ4'10 FYQ1'11 FYQ2'11 FYQ3'11 FYQ4'11 FYQ1'12
Beginning Inventory 1/iPad iPad 2
Total
Maximum Manufacturing Capacity 2/iPad iPad 2
Total
Units Sold 2/iPad iPad 2
Total 3,270 4,187 7,303 4,651 9,184 11,092 15,289
Ending Potential Inventory 3/iPad iPad 2
Total
Adjustments for Capacity Available for Lost Profits
Quarterly Additional Capacity Created (Used) 4/iPad iPad 2
Total
Excess Inventory (2 Weeks) 5/iPad iPad 2
Total
Excess Unused Capacity 6/iPad iPad 2
Total
Sources/Notes:1/ Equal to the prior quarter's Ending Potential Inventory.
4/ Calculated by subtracting the prior quarter's Ending Potential Inventory from the current quarter.
2/ Based on Apple's worksheet entitled: iPad Supply and Sales: 2010 - 2011 : K Units (APLNDC-Y0000055416), sections titled Installed Capacity Saleable Units - Cumulative and Units Sold In - Cumulative. Non-cumulative numbers were calculated by subtracting prior quarter's data from the current quarter.
6/ Equal to Quarterly Additional Capacity Created (Used) less Excess Inventory. Where capacity is used in future periods, that capacity was deducted from the preceding quarter which had excess capacity. This maintains the excess capacity which was actually sold by Apple in future periods.
3/ Based on Apple's worksheet entitled: iPad Supply and Sales: 2010 - 2011 : K Units (APLNDC-Y0000055416), section titled Installed Capacity Units Unsold - Cumulative.
iPad Capacity Analysis(Units in Thousands)
Page 17 of 18
Plaintiff's Exhibit No. 25A.17
Apple Inc. v. Samsung Electronics Co., LTD., et al.
Prepared by Invotex GroupSubmitted Under Seal; Highly Confidential;
Outside Counsel Eyes' Only
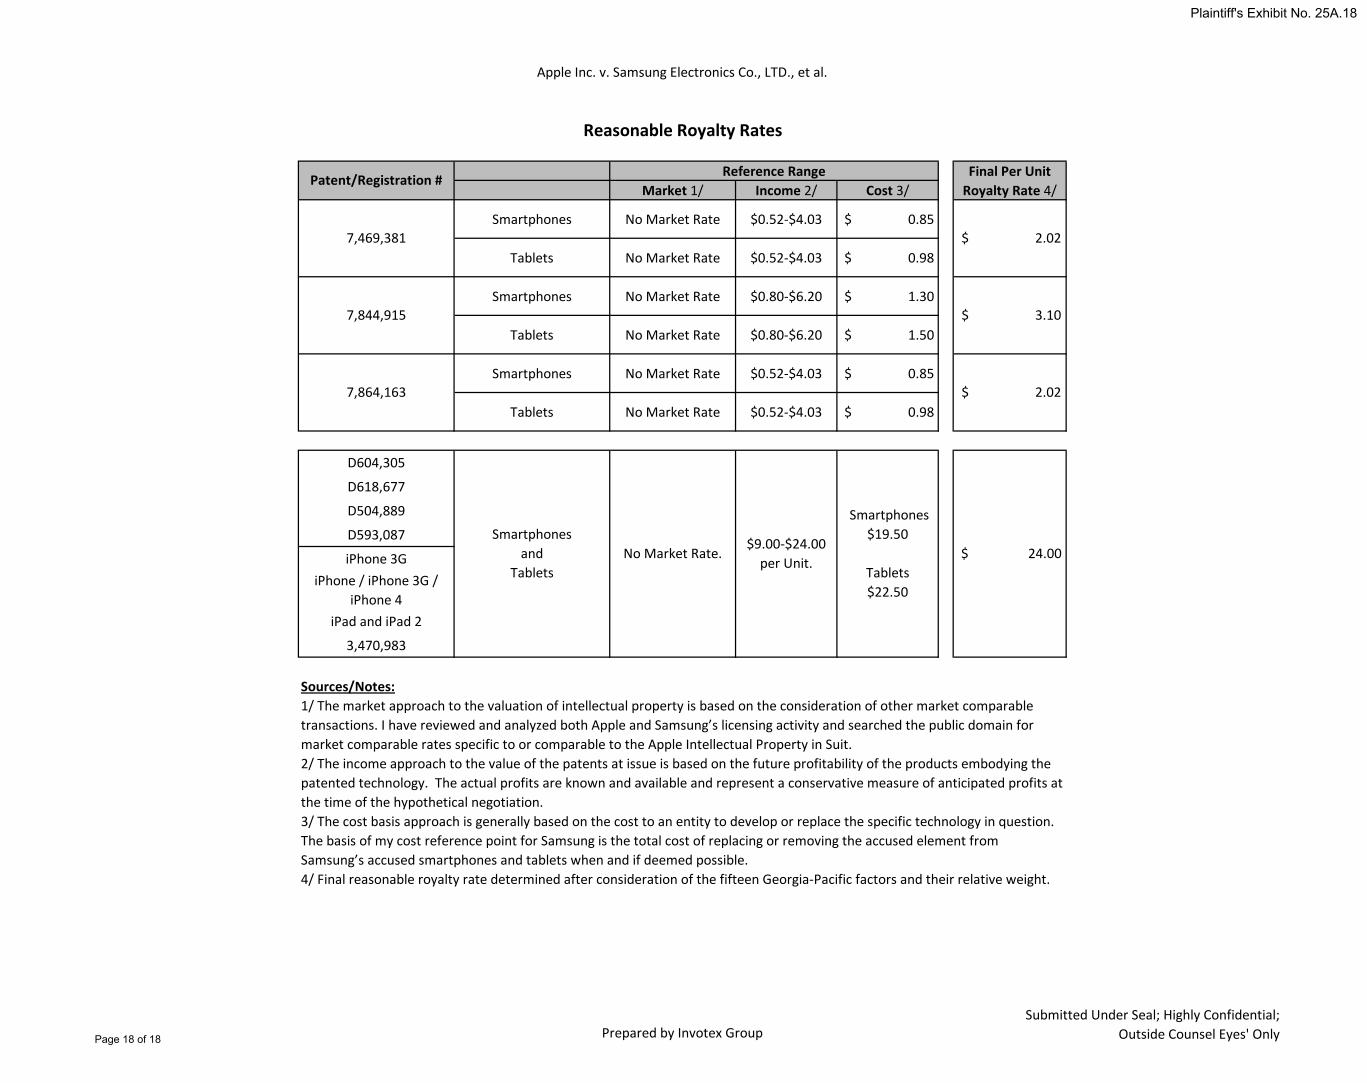
Market 1/ Income 2/ Cost 3/
Smartphones No Market Rate $0.52-$4.03 $ 0.85
Tablets No Market Rate $0.52-$4.03 $ 0.98
Smartphones No Market Rate $0.80-$6.20 $ 1.30
Tablets No Market Rate $0.80-$6.20 $ 1.50
Smartphones No Market Rate $0.52-$4.03 $ 0.85
Tablets No Market Rate $0.52-$4.03 $ 0.98
D604,305
D618,677
D504,889
D593,087
iPhone 3GiPhone / iPhone 3G /
iPhone 4iPad and iPad 2
3,470,983
Sources/Notes:
4/ Final reasonable royalty rate determined after consideration of the fifteen Georgia-Pacific factors and their relative weight.
1/ The market approach to the valuation of intellectual property is based on the consideration of other market comparable transactions. I have reviewed and analyzed both Apple and Samsung’s licensing activity and searched the public domain for market comparable rates specific to or comparable to the Apple Intellectual Property in Suit.2/ The income approach to the value of the patents at issue is based on the future profitability of the products embodying the patented technology. The actual profits are known and available and represent a conservative measure of anticipated profits at the time of the hypothetical negotiation.3/ The cost basis approach is generally based on the cost to an entity to develop or replace the specific technology in question. The basis of my cost reference point for Samsung is the total cost of replacing or removing the accused element from Samsung’s accused smartphones and tablets when and if deemed possible.
7,469,381 $ 2.02
$ 3.10
$ 2.02 7,864,163
7,844,915
No Market Rate.$9.00-$24.00
per Unit.
Smartphones$19.50
Tablets$22.50
$ 24.00 Smartphones
andTablets
Reasonable Royalty Rates
Patent/Registration # Reference Range Final Per Unit Royalty Rate 4/
Page 18 of 18
Plaintiff's Exhibit No. 25A.18


![[Critica] Apple's Weakness](https://img.pdfslide.net/doc/110x75/54b2dc494a7959d10e8b456b/critica-apples-weakness.jpg)