Embed Size (px)
Citation preview

CGIAR Research Program on
Climate Change, Agriculture and Food Security (CCAFS)
Summary of Baseline Household Survey Results:
Rakai District, South Central Uganda
November 2011
F. B. Kyazze and P. Kristjanson

2
Correct citation:
Kyazze, F.B., Kristjanson P. 2011. Summary of Baseline Household Survey Results: Rakai District, South
Central Uganda. CGIAR Research Program on Climate Change, Agriculture and Food Security (CCAFS).
Copenhagen, Denmark. Available online at: http://ccafs.cgiar.org/resources/baseline-surveys
Published by the CGIAR Research Program on Climate Change, Agriculture and Food Security (CCAFS).
CCAFS Coordinating Unit - Department of Agriculture and Ecology, Faculty of Life Sciences, University of
Copenhagen, Rolighedsvej 21, DK-1958 Frederiksberg C, Denmark. Tel: +45 35331046; Email:
Creative Commons License
This Report is licensed under a Creative Commons Attribution – NonCommercial–NoDerivs 3.0 Unported
License.
This publication may be freely quoted and reproduced provided the source is acknowledged. No use of this
publication may be made for resale or other commercial purposes.
© 2011 CGIAR Research Program on Climate Change, Agriculture and Food Security (CCAFS).
DISCLAIMER:
This report has been prepared as an output for the Integration for Decision Making Theme under the CCAFS
program and has not been peer reviewed. Any opinions stated herein are those of the author(s) and do not
necessarily reflect the policies or opinions of CCAFS. All images remain the sole property of their source and
may not be used for any purpose without written permission of the source.

3
Abstract Rakai District, in South Central Uganda, is predominantly agricultural, and people living here derive
their livelihoods largely from crops, livestock and natural resources. A baseline household-level
survey, led by the Climate Change, Agriculture and Food Security Consortium Research Program1
(CCAFS) was undertaken in late 2010, aimed at describing the characteristics of farming systems and
better understanding how they have changed over time. It also gathered information on the socio-
economic and demographic characteristics of these farming households, basic livelihood and welfare
indicators, agriculture and natural resources management practices and strategies, access to and use
of climate and agricultural-related information, and current risk management, mitigation and
adaptation practices. Randomly selected households were the units of analysis and a face-to-face
questionnaire was the primary tool that was used for data collection.
Findings from this baseline household study reveal that Rakai farms are diversified, with most
households producing and consuming a wide range of food crops. Two-thirds of households sell
some of the food crops they produce. Three-quarters of households also produce a cash crop
(typically coffee). Various fruits and vegetables are also produced. Eighty percent of households
have small livestock (sheep, goats, chickens or pigs), and one-fifth own cattle.
Other sources of income are very important in Rakai – only 11% of households reported receiving no
income from sources other than their own farms. Forty-one percent have a household member
working on someone else’s farm to earn income. Another 40% earn some off-farm income from
employment, business or remittances/gifts. Formal credit is being accessed by only 16% of
households, but informal loans are used by 28%.
Farmers have been making changes to their farming practices over the last 10 years in Rakai, and
these changes and the reasons behind them are explored in this report. Bananas, beans and maize
are currently the most important crops grown, and all three of these crops and being grown by more
households than a decade ago. Most households (88%) have introduced new crop varieties. The
biggest shifts have been towards higher yielding varieties, drought tolerant varieties, and disease
and pest-resistant varieties. Introducing shorter-cycle varieties has been a key change made in
relation to beans and maize, as has the introduction of intercropping. Between a third and a half of
households reported preparing their land and planting beans earlier than they use to, and over one-
third have done so for maize. Just over 40% of households have switched to planting pre-
treated/improved maize seed.
Why are they making these changes? Climate-related reasons were less frequently given than other
reasons by respondents. These other drivers of change included those related to prices, new pests
and diseases, and availability of higher yielding varieties. With respect to climate-related reasons,
changes made to bananas and maize were apparently partly driven by a perception of more overall
rainfall, while for beans it was less overall rainfall. For all three crops, these households agree that
an earlier start of the rains is a reason behind their change in behaviour.
1 For more information about CCAFS, see: http://www.ccafs.cgiar.org A community-level survey was also conducted in Rakai and those survey guidelines and reports will also be available on the website.

4
Changes are also being made to livestock practices. Over three-quarters of households are now
producing chickens, up from two-thirds a decade ago. Shifts away from pigs and dairy are also
occurring, and warrant further exploration. The main reasons why the various changes have taken
place within the livestock sector were market-related, including better prices for livestock products
and new opportunities to sell livestock products. The introduction of more productive, and more
disease resistant, livestock breeds, emerging diseases, and government and project influences were
other important reasons cited. Weather or climate-related reasons were only mentioned by a few
households, although more frequent floods and droughts were mentioned by 77% and 82% of
households, respectively.
Chemical fertilizer use is very low in Rakai, with only one-fifth of households reporting using
purchased fertilizers on their crops. Use of pesticides is much more widespread – 60% of households
purchase and use pesticides. Half of the surveyed households reported buying seed.
Many households receive and use weather-related information, particularly forecasts of the start of
the rains, extreme events, and pest or disease outbreaks. Only one-third of households receive daily
weather forecasts. One-half receive longer-run (2 t o 3 month) weather forecasts. Radio is the
predominant source of this information.
Agricultural and natural resource management-related groups are scarce in Rakai, with two-thirds of
households reporting not being members of any such group. Improvements in soil, water and land
management were reported. Three-quarters of households have introduced at least one type of
improved soil management technique, and 80% have made some agroforestry-related management
changes (e.g. planting trees on farms). However, no agricultural water management changes were
made by 71% of households over the last decade.
Keywords
Climate change; agriculture; Uganda; farming system; food security, adaptation, mitigation
About the authors Dr Florence Birungi Kyazze is a lecturer in the Department of Extension and Innovation Studies,
Makerere University. As a lecturer, Florence is charged with the responsibilities of teaching and
supervising students at both the graduate and undergraduate levels with a specific interest in
statistical methodologies, social research methods, program development, gender and evaluation.
Florence has also worked on a contractual basis with the National Cereals Program as senior social
scientist. Under this umbrella, Florence has conducted extensive social research in gender, value
chain analysis, curriculum development, community mobilization, and participatory approaches.
Florence is also a senior advisor and researcher for Women’s Initiative in Development and Para-
legal Activities Association and a member for the Association for International Agricultural and
Extension Education. Florence also does a lot of consultancy work in the field of social sciences.
Patti Kristjanson is an agricultural economist and research theme leader of the Climate Change,
Agriculture and Food Security Program, based at the World Agroforestry Center (ICRAF) in Nairobi
(www.ccafs.cgiar.org/our-work/research-themes/integration-decision-making/linking-knowledge-
action).

5
Table of Contents
Abstract ----------------------------------------------------------------------------------------------------------------------------------------------- 3
Keywords --------------------------------------------------------------------------------------------------------------------------------------------- 4
Table of Contents ----------------------------------------------------------------------------------------------------------------------------------- 5
1.0 Introduction ------------------------------------------------------------------------------------------------------------------------------ 6 1.1 Household Types and respondents ---------------------------------------------------------------------------------------------- 7
2.0 Household Demographics ------------------------------------------------------------------------------------------------------------- 7 2.1 Education Levels --------------------------------------------------------------------------------------------------------------------- 8
3.0 Sources of Livelihoods ----------------------------------------------------------------------------------------------------------------- 9 3.1 On-farm livelihood sources -------------------------------------------------------------------------------------------------------- 9 3.2 Off-farm livelihood sources ------------------------------------------------------------------------------------------------------- 11 3.3 Diversification Indicators ---------------------------------------------------------------------------------------------------------- 12 3.4 Sources of cash income ------------------------------------------------------------------------------------------------------------ 13
4.0 Crop, Livestock, Tree, Soil, Land, Water Management Changes ------------------------------------------------------------- 14 4.1 Most important crops and animals and changes made --------------------------------------------------------------------- 14
Crop management related changes ---------------------------------------------------------------------------------------------------- 15 Water management related changes -------------------------------------------------------------------------------------------------- 15 Soil Management related changes ------------------------------------------------------------------------------------------------------ 16 Tree/Agroforestry management related changes ----------------------------------------------------------------------------------- 16 Specific crop and animal management related changes ---------------------------------------------------------------------------- 16 Changes made with respect to crop varieties ---------------------------------------------------------------------------------------- 18 Changes in land and crop management practices ----------------------------------------------------------------------------------- 19 Changes and reasons for changes to the most important crops ------------------------------------------------------------------ 20
4.3 Livestock-related changes--------------------------------------------------------------------------------------------------------- 22 4.4 Adaptability/Innovation Indicator ----------------------------------------------------------------------------------------------- 24 4.5 Mitigation Indices------------------------------------------------------------------------------------------------------------------- 24
5.0 Food Security --------------------------------------------------------------------------------------------------------------------------- 26 5.1 Food Security Index ---------------------------------------------------------------------------------------------------------------- 27
6.0 Land and Water ------------------------------------------------------------------------------------------------------------------------ 27 6.1 Water for Agriculture -------------------------------------------------------------------------------------------------------------- 27 6.2 Land Use ------------------------------------------------------------------------------------------------------------------------------ 28
Hired Machinery or Labour --------------------------------------------------------------------------------------------------------------- 28
7.0 Inputs and Credit ----------------------------------------------------------------------------------------------------------------------- 28 7.2 Fertilizer Use ------------------------------------------------------------------------------------------------------------------------- 29
8.0 Climate & Weather Information ---------------------------------------------------------------------------------------------------- 30 8.1 Types of weather-related information ----------------------------------------------------------------------------------------- 30 8.2 Who is receiving and using weather-related information? ----------------------------------------------------------------- 31 8.3 Sources of assistance to climate crises ----------------------------------------------------------------------------------------- 33
9.0 Community Groups -------------------------------------------------------------------------------------------------------------------- 33
10.0 Assets ------------------------------------------------------------------------------------------------------------------------------------- 34 10.1 Asset Indicator ---------------------------------------------------------------------------------------------------------------------- 34
Appendix 1: Survey Process and Implementation ------------------------------------------------------------------------------------------ 36
Appendix Two: Randomly selected villages for the baseline study -------------------------------------------------------------------- 40

6
1.0 Introduction This report presents the results of an analysis of the CCAFS baseline household survey carried out in
late 2010/early 2011 in 7 villages, with 140 households, in Rakai District, located in the South
Western region of Uganda, west of Lake Victoria (Figure 1). Its southern boundaries are part of the
international boundary between Uganda and Tanzania. It is bordered by Masaka District in the East,
Kalangala District in the South-East and Mbarara District in the West and Lyantonde in the North.
The District Headquarters is located in Rakai Town, which is a distance of about 190km from
Kampala, the national capital. Rakai District has a total area of 4,124 km2. In 2002, the national
census estimated the population of the district at 405,600, with an annual growth rate of 3.8%.
Given those statistics, it was estimated that in 2010, the population of the district would be
approximately 546,600. Subsistence agriculture is the dominant economic activity, employing over
85% of the people. Crops grown include bananas, beans, potatoes, cassava, maize, sorghum, finger
millet, fruits and vegetables like tomatoes, pineapples, onions and cabbage. Coffee is the main cash
crop. Livestock raised includes cattle, goats, pigs and chicken. The rainfall is bimodal. The rainy
seasons are from March/April to May and from October to December. Rakai District also experiences
severe dry spells in the periods June–September and January–February.
The survey process is described in Appendix 1. The questionnaire and training materials associated
with it, including data entry and management guidelines can be found at:
www.ccafs.cgiar.org/resources/baseline-surveys. The list of villages randomly selected from the site
(a 10x10 km2 block chosen as the sampling frame) is found in Appendix 2.
Figure 1 shows the location of the Rakai site in south-western Uganda. We now turn to a summary of
the main findings of the analysis of the survey data, reported on according to each section of the
questionnaire.
Figure 1. Rakai research site, south-western Uganda
#
#
#
#
#
#
#
#
#
#
#
#
#
#
#
#
#
S S
S S S S
S
S S
S
S S
S S
S S
S S
S S
S S
S
S
S S
S
S S
S S
S S S
S
S S
S S
S
S S S S
S S
S
S S
S S
S S S S S
S S S
S S S
S S
S S
S S
S S
S
S
S
S
S S S
S
S
S
S S
S S
S S
S
S
S S
S
S
S S
S
S S
S
S S
R A K A I
I S I N G I R O
R u m a L a k e
S a n g a
N k o n i
N o m b i
M w e z a
R a k a i
L w e n g o K i z i b a
K i n o n i K y a n j a M a s a k a
B u k o t o
K a s a s a
B u r a m a R u g a g a B i z e r a
R u h i r a
G a y a z a
N y a n g a L w a n g a
K a s o z i
L w a n b a
R u g a g a
N a t e t e
K a k u t o
B i k i r a
L u s a k a
K i b i r a K i f u t a
Z z i m w e
K a b a l e
M a l o n g o M b i r i z i
M a k o n d o
K i r i m y a
K i r u m b a
K i r e t w a B u g a n z a
K a s u m b a
K a b i n g o
K i g a n d o
B u y a m b a K a g a m b a
M a g a b b i
K y o t e r a
L w e k u b a
K y a n j o j o
K a b u w o k o
N a k i y a g a
M u k o k o t e R u k u k u r u
K a r i t i m a
L w a m a g w a K a s a m b y a
K a m u k a l o
K a t e t e r o
M u t u k u l a
K a l i s i z o A k e i r u n g u
B w a l u m u l i
R w e s i r a b o
L y a n t o n d e G a m u g u n g u
N y a m i k u y u
K a t u n g u r u
L w a b i r i b a
S a n g o B a y
K y a m a g a n d a
K a n y a r i e r u K a b u r e g e y a
N y a m i y o n g o
K i n y a b w i l u
K y e n a n g a z i
K y a k u d d u s e B u y a g a B a y
D u m u P o i n t
D u w a f u B a y
K a n a b u l e m u
N y a b u s h e n y i
M i z i n d a B a y
K a g e r a R i v e r
R i v e r K a g e r a
L a k e K a r u n g a
L a k e N a b u g a b o
L a k e V i c t o r i a
B u s u n g w e I s l a n d
M u s a m b w a I s l a n d
K y a b a s i m b a P o i n t
L a k e K i j a n e b a l o l a
L a k e K i j a n e b a l o l a
M u s a m b w a T w i n
I s l a n d

7
1.1 Household Types and respondents
Almost 80% of the households that were interviewed in this survey were male-headed households,
with a wife or wives, implying two potential decision makers in these homes (Table 1.1). Households
with female heads (divorced, single or widowed) make up 19% of this sample. Roughly two-thirds of
the actual respondents were male and one-third women.
Table 1.1 Household type among study respondents in Rakai District
Household Type Number of
households
Percentage
of
households
Male headed with wife or wives 108 76
Male-headed (divorced, single, or
widowed)
5 4
Female headed (divorced, single or
widowed)
26 19
Female headed, husband away and
not making most decisions
1 1
Total 140 100
A diverse range of ethnic groups is represented across the surveyed households, including ten
different groups. The predominant ethnic group is Muganda (80% of surveyed households). Other
minority groups found here include Munyarwanda, Munyankole, Mutanzania, Mufumbira, Munyoro,
Mukiga, Mukoki, Murundi, and Madi, each with very small numbers of households.
2.0 Household Demographics
Household size varies between one and 30 persons, with a median size of 6 persons per household.
With respect to the ratio of working age adults to dependents (people aged less than 5 years or over
60 years), we can see in Figure 2.1 that just over 12% of these households (the green and blue
sections in Figure 2.1), may have issues with fewer working age adults in comparison to non-working
family members (under 40% of the household member are of working age, i.e. over 60% are
dependents).

8
Figure 2.1 Proportion of the household that is of working age
2.1 Education Levels
Table 2.1 indicates the highest level of education obtained by any household member in these
randomly chosen and interviewed households. For the majority of households, a primary level of
education (48%) was the highest level attained within their households, followed by secondary
school graduates (41%). Very few households (1%) had no formal education at all, and only 9% of
these households had a member with a post secondary education.
Table 2.1 Highest Level of Education Obtained by someone within the Household
Highest level of education of any
resident household member
Number of
households
% of
households
No formal education 2 1
Primary 67 48
Secondary 58 41
Post-secondary 13 9
Total 140 100

9
3.0 Sources of Livelihoods
3.1 On-farm livelihood sources Table 3.1 shows the diversity in production and the division of labour across these different
agricultural products. All households are producing food crops, and three-quarters are producing a
cash crop - coffee. Some type of processing of food crops is also happening in 75% of the
households. Fruits and vegetables are also being produced by 95% and 81% of the surveyed
households, respectively.
Table 3.1 Percentage of households producing various agricultural products and the division of
labour
Percentage of households that are producing the product, stating these household members do ‘most of the work’ in relation to this product:
Product % of households producing:
Man Woman Girls Boys Several hh members
Food crops (raw) 100 41 41 1 - 16
Food crops (processed – e.g. snack foods)
76 35 48 - - 17
Other/cash crops (tea, coffee, sisal, cotton, jute, sugar cane, etc.)
75 51 27 - 1 19
Fruits 95 34 41 - 2 23
Vegetables 81 11 70 - 1 19
Fodder 16 35 35 - - 30
Large livestock (cattle, buffalo, camels)
19 38 19 - 15
Small livestock (sheep, goats, pigs, chickens, donkeys)
81 25 51 - 2 21
Livestock products (milk, eggs, etc.) 61 23 50 1 1 23
Fish 0 - - - - -
Timber 13 72 6 - - 22
Fuelwood 46 27 40 2 3 24
Charcoal 0 - - - - -
Honey 5 100 - - - -
Manure/compost 61 32 52 1 1 14
Few households (19%) keep large livestock (cattle), though the majority (81%) keep small livestock
such as sheep, goats, chicken and pigs. It is also important to note the relatively high proportions of
households that produce manure (61%) and fuel wood (46%) for their own consumption on-farm.
10
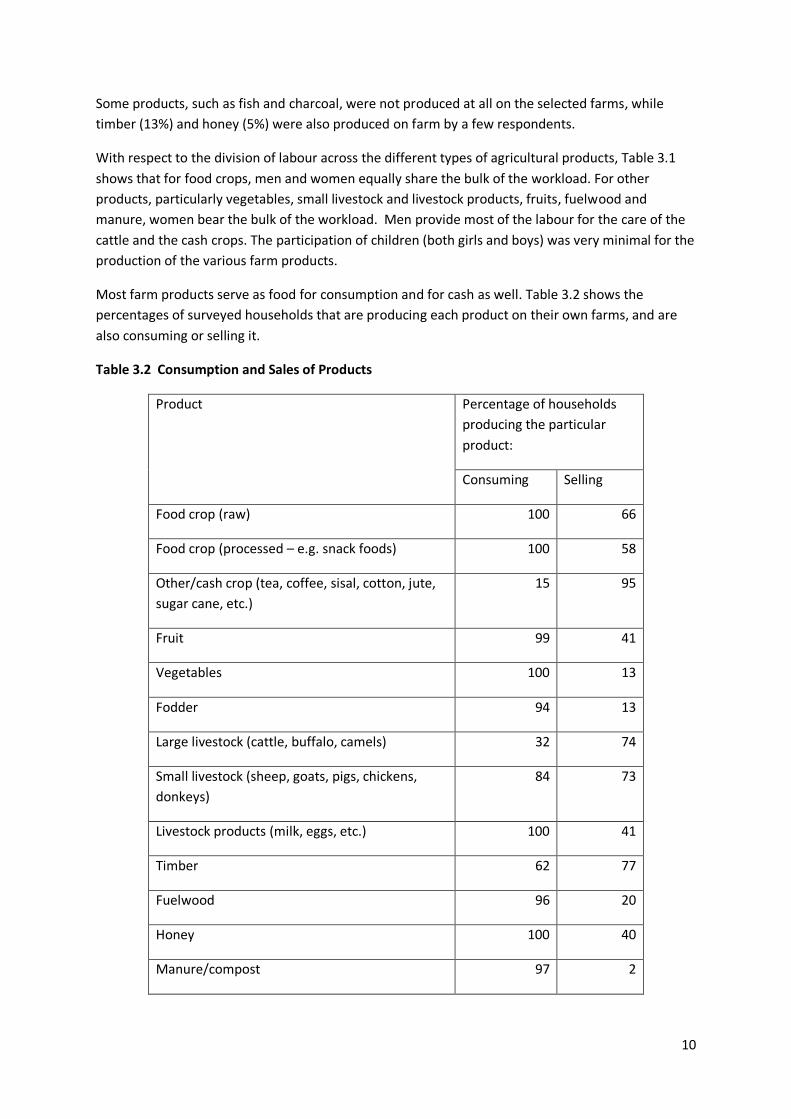
Some products, such as fish and charcoal, were not produced at all on the selected farms, while
timber (13%) and honey (5%) were also produced on farm by a few respondents.
With respect to the division of labour across the different types of agricultural products, Table 3.1
shows that for food crops, men and women equally share the bulk of the workload. For other
products, particularly vegetables, small livestock and livestock products, fruits, fuelwood and
manure, women bear the bulk of the workload. Men provide most of the labour for the care of the
cattle and the cash crops. The participation of children (both girls and boys) was very minimal for the
production of the various farm products.
Most farm products serve as food for consumption and for cash as well. Table 3.2 shows the
percentages of surveyed households that are producing each product on their own farms, and are
also consuming or selling it.
Table 3.2 Consumption and Sales of Products
Product Percentage of households
producing the particular
product:
Consuming Selling
Food crop (raw) 100 66
Food crop (processed – e.g. snack foods) 100 58
Other/cash crop (tea, coffee, sisal, cotton, jute,
sugar cane, etc.)
15 95
Fruit 99 41
Vegetables 100 13
Fodder 94 13
Large livestock (cattle, buffalo, camels) 32 74
Small livestock (sheep, goats, pigs, chickens,
donkeys)
84 73
Livestock products (milk, eggs, etc.) 100 41
Timber 62 77
Fuelwood 96 20
Honey 100 40
Manure/compost 97 2

11
All households consume the raw and processed food crops they are producing on their land as well
as the fruits, vegetables and livestock products. Most households producing fodder and
manure/compost on their farms are predominantly using it themselves.
In terms of selling, cash crops are of course important. Two-thirds of households are also selling raw
food crops and 58% processed food crops (e.g. snack foods). Forty-one percent of fruit producers
(which is almost all households) also sell some fruit.
The sale of small livestock and livestock products are also very important sources of livelihoods, with
three-quarters of producing households also selling livestock.
Timber is also an important source of income (although for only 13% of farms), as three-quarters of
those producing it on-farm are also selling it. Around half of households produce fuelwood on-farm
and one-fifth of those sell some.
3.2 Off-farm livelihood sources
Various farm products were also obtained from off-farm sources (Table 3.3). The most common
farm products obtained off-farm included food crops and fuel wood, as reported by 61% and 57% of
the surveyed households, respectively. Fruit (30%) and fish (28%) are also sourced by quite a few
households from off-farm sources. Fuelwood is gathered elsewhere by over half of households
(57%). Honey (12%), manure (11%), fodder (7%), and charcoal (6%) are other products that are
gathered off-farm by some households.
In terms of division of labour, it appears that men are more involved in gathering off-farm products
than are women. For example, more men (65%) than women (32%) participated in obtaining food
crops off-farm, and more men (52%) than women (31%) picked fruit. Men provided the labour for
tasks involving fish, charcoal and honey gathering off-farm. Women bear the main responsibility and
provide the labour for gathering wood for fuel, however. Like the on-farm products, the children’s
participation in tasks to obtain farm products off farm was minimal.

12
Table 3.3 Agricultural products coming from off-farm sources/areas and division of labour
Product
Percentage of households stating these household
members do ‘most of the work’ in relation to this
product:
% of
households
Man Woman Female
Child
Male
Child
Several
Food crop (raw) 61 65 32 0 0 2
Fruit 30 52 31 0 0 17
Fodder 7 60 0 0 0 40
Fish 28 85 5 0 3 8
Timber 9 92 8 0 0 0
Fuel wood 57 21 53 4 0 20
Charcoal 6 57 43 0 0 0
Honey 12 76 18 0 0 0
Manure/compost 11 80 13 0 0 7
3.3 Diversification Indicators A production diversification indicator was created by adding up the total number of agricultural products produced on-farm:
1=1-4 products (low production diversification)
2=5-8 products (intermediate production diversification)
3=more than 8 products (high production diversification)
On the selling/commercialization side, the total numbers of agricultural products produced on their own farms, with some of the products sold were added up:
0=no products sold (no commercialization)
1=1-2 products sold (low commercialization)
2=3-5 products sold (intermediate commercialization)
3=more than 5 products sold (high commercialization)

13
The results of these diversification indices for our surveyed households in Rakai are shown in Table
3.4. One-quarter of these households are highly diversified, producing more than 9 different types
of agricultural products. Almost 60% produce between 5 and 8 products, and 14% of these
households rely on a very few types of agricultural products for their livelihoods.
Very few households (7%) sell no agricultural products whatsoever. Another 28% sell only a couple,
and just below half sell between 3 and 5 different products. One-fifth of surveyed households are
highly diversified with respect to their farm income sources, selling more than 6 types of products.
Table 3.4 Production and Commercialization Diversification Indices
Production Diversification: % of households
1-4 products (low production diversification) 14
5-8 products (intermediate production diversification) 59
9 or more products (high production diversification) 27
Selling/Commercialization Diversification:
No products sold (no commercialization) 7
1-2 products sold (low commercialization) 28
3-5 products sold (intermediate commercialization) 45
6 or more products sold (high commercialization) 20
3.4 Sources of cash income Table 3.4 shows diversity of cash income sources from off-farm activities. Employment on other
peoples’ farms, other types of jobs, business, and remittances, are the most important sources of
cash income (other than from their own farms), with roughly 40% of these households reporting
receiving cash income from each of these sources.
Eleven percent of households receive no cash income from any off-farm sources. Loans are received
by 16% of households from a formal source (e.g. a bank) in the last year, but more (28%) have
received credit from an informal source (e.g. a group).

14
Table 3.4 Sources of cash income other than from own farm
Source of Cash Income % of
households
Employment on someone else’s farm 41
Other off-farm employment 41
Business 40
Remittances/gifts 37
Payments for environmental services 1
Payments from gov’t or other
projects/programs
14
Loan or credit from a formal institution 16
Informal loan or credit 28
Renting out farm machinery 6
Renting out your own land 9
No off-farm cash source 11
4.0 Crop, Livestock, Tree, Soil, Land, Water Management Changes
4.1 Most important crops and animals and changes made 94% of surveyed households had been living and farming in Rakai for at least 10 years. These
households were asked what their 3 most important crops are (from an overall livelihoods
perspective) now, and 10 years ago. These crops are banana (produced by 67% of the surveyed
households now and 52% then), beans (59% now and 55% then) and maize (54% now and 45%
then). So bananas, beans and maize have all increased in importance in this area.
Other relatively important crops cited were coffee (34%), cassava (30% of households included this
as one of their three most important crops), potatoes (19%), and sweet potatoes (12%). Fruits being
grown include mango, passion fruit, avocado and jackfruit, and important vegetables mentioned
were tomatoes and leafy vegetables.

15
With respect to livestock, the main animals now versus 10 years ago are: chickens (77% of household
now, 65% then), goats (62% now, 64% then), and pigs (44% now, 59% then). Dairy cow ownership is
also interesting to note, down from 38% of households 10 years ago versus 25% now.
They were then asked about what changes they had made in terms of introducing or testing any new
crops, or no longer growing a crop. Only 8% of households had not made any crop-related changes.
20% had made one change, 28% made two changes, 31% made three changes, and 13% made four
changes over the last 10 years.
The most commonly introduced new crops were potatoes (26% of households), cassava (25%),
avocado (16%) and beans (16%). Crops completely dropped by over one-third of households were
sorghum and peanuts. 30% of households had stopped growing peanuts, 24% beans, and 18% maize
in one growing season.
Crop management related changes
With respect to crop management-related changes, we examined whether households had made
one or more of the following changes over the last 10 years:
Introduced intercropping;
Earlier land preparation;
Earlier planting;
Later planting;
Expanded area;
Reduced area;
Started using pesticides/herbicides;
Integrated pest management;
Integrated crop management.
The results showed that one-half of households had made 3 or more of these cropping related
changes in the last decade, 43% had made one or two of these changes, and 6% had made none of
these changes.
Water management related changes
For the water management-related changes, the following changes in practice were considered:
Started irrigating;
Introduced micro-catchments;
Introduced improved irrigation;
Introduced improved drainage.
Here, we found that 71% of households had made none of these water management-related
changes, 23% had made one such change, and 6% had made two or more changes over the last
decade.

16
Soil Management related changes
For the soil management related changes, we considered the following behavioural changes:
Stopped burning;
Introduced crop cover;
Introduced ridges or bunds;
Introduced mulching;
Introduced terraces;
Introduced stone lines;
Introduced contour ploughing;
Introduced rotations;
Started using or using more mineral/chemical fertiliser;
Started using manure/compost.
The results show that one-quarter of these Rakai households have not made any of these soil
management-related improvements, one-quarter have introduced one new soil management
practice, and almost one-half reported having made two or more of these types of changes in the
last 10 years.
Tree/Agroforestry management related changes
The results show that 80% of households have made some tree/agroforestry management related
changes in the last decade.
Specific crop and animal management related changes
We found that Rakai households have made many changes to their farming practices over the last 10
years, affecting a wide diversity of crops, including cereals, legumes, roots, fruits, vegetables and
other crops. Table 4.1 shows the most common types of crops being newly introduced by farmers,
tested, or abandoned over the last decade.
It shows that while some farmers have stopped growing sorghum, maize or millet, other farmers
have tested or adopted them. This pattern also shows up for legumes, roots, fruits and vegetable
crops.

17
Table 4.1 Changes and crops affected
Type of Change Types of Crops
Cereals Legumes Roots Fruits Vegetables Others
New Crops
Introduced
Sorghum
Maize
Finger
millet
Beans
Peanuts
Peas
Sesame
Soya beans
Cassava
Sweet
potato
Potato
Yam
Mango
Citrus
Passion fruit
Pineapples
Jackfruit
Avocado
Leafy
vegetables
Carrots
Tomatoes
Pepper
Eggplants
Pumpkins
Banana
Coffee
Sugarcane
Tobacco
Cocoa
Vanilla
Trees
New Crops
Being Tested
Wheat
Finger
millet
Peanuts
Peas
Sesame
soya beans
Cassava
Sweet
potato
Potato
Yam
Citrus
Passion fruit
Pineapples
Jackfruit
Cabbage
Carrots
Leafy
vegetables
Peppers
Pumpkins
Onions
Tomatoes
Bananas
Coffee
Tobacco
Vanilla
Crops that
households
abandoned
totally
Sorghum
Maize
Finger
Millet
Millet
Beans
Peanuts
Peas
Sesame
Soya beans
Cassava
Sweet
potato
Yams
Potato
Pineapple
Leafy
vegetables
Onions
Tomatoes
Cabbage
Pumpkin
Banana
Coffee
Sugarcane
Tobacco
Vanilla
Crops that
household
abandoned for
a growing
season
Sorghum
Maize
Millet
Soybean
Beans
Peanuts
Peas
Sweet
potato
Cassava
Potato
Yams
Cabbage
Tomatoes
Peppers
Pumpkins
Tobacco
Vanilla
18
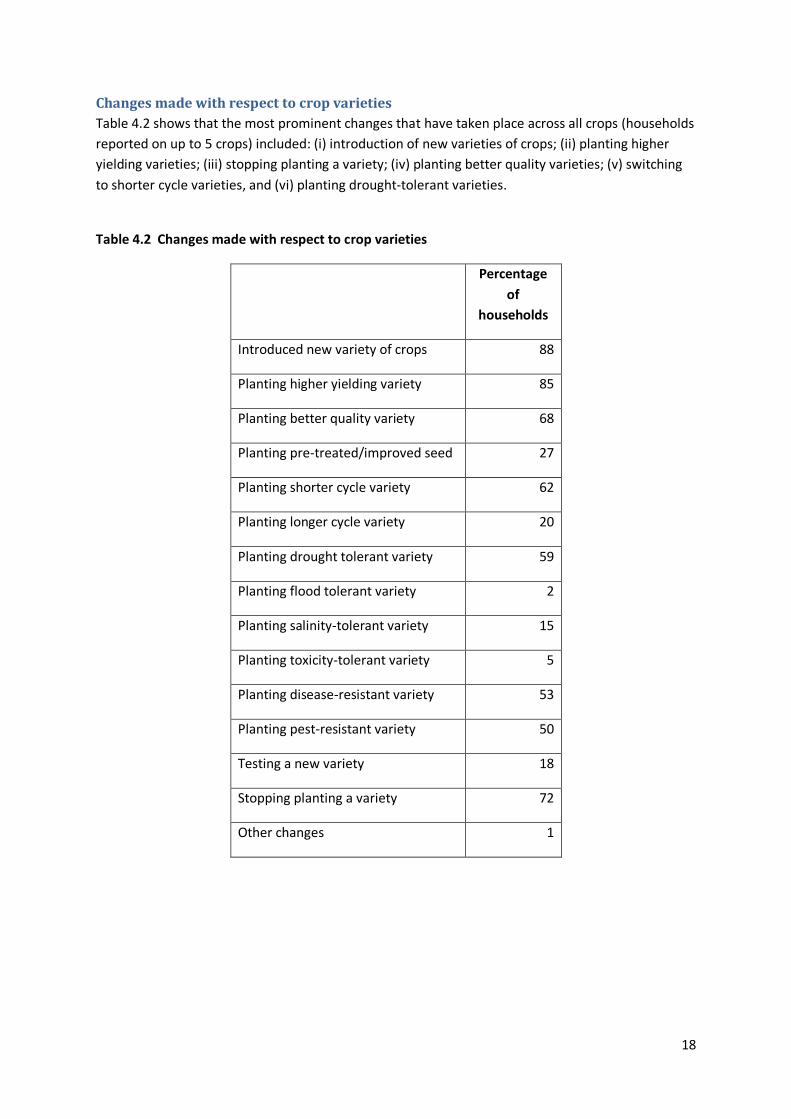
Changes made with respect to crop varieties
Table 4.2 shows that the most prominent changes that have taken place across all crops (households
reported on up to 5 crops) included: (i) introduction of new varieties of crops; (ii) planting higher
yielding varieties; (iii) stopping planting a variety; (iv) planting better quality varieties; (v) switching
to shorter cycle varieties, and (vi) planting drought-tolerant varieties.
Table 4.2 Changes made with respect to crop varieties
Percentage
of
households
Introduced new variety of crops 88
Planting higher yielding variety 85
Planting better quality variety 68
Planting pre-treated/improved seed 27
Planting shorter cycle variety 62
Planting longer cycle variety 20
Planting drought tolerant variety 59
Planting flood tolerant variety 2
Planting salinity-tolerant variety 15
Planting toxicity-tolerant variety 5
Planting disease-resistant variety 53
Planting pest-resistant variety 50
Testing a new variety 18
Stopping planting a variety 72
Other changes 1

19
Changes in land and crop management practices
Table 4.3 presents the land and crop management practice changes that have been made by the
surveyed households (each household reported on the changes they had made for up to 5 crops).
Twenty-nine different changes were mentioned across all crops. The most frequently mentioned
changes were: reductions, and in other cases, expansion in the area planted; introduction of
mulching (in the case of bananas); earlier land preparation and planting; starting to use manure or
compost; introducing intercropping; starting to use (or using more) pesticides; and introducing
micro-catchments.
Table 4.3 Changes with respect to land and crop management practices
Changes Made Percentage
of
households
Changes Made Percentage
of
households
Expanded area 62 Introduced improved irrigation 2
Reduced area 63 Introduced improved drainage 3
Started irrigating 10 Introduced mechanized farming 0
Stopped irrigating 5 Earlier land preparation 33
Stopped burning 0 Earlier planting 40
Introduced intercropping 41 Later planting 17
Introduced crop cover 4 Started using more mineral/chemical fertilisers
13
Introduced micro-catchments 22 Started using manure/compost 50
Introduced/built ridges or bunds
15 Stopped using manure/compost 1
Introduced mulching 57 Started using or using more pesticides/herbicides
39
Introduced terraces 1 Started using integrated pest management
11
Introduced stone lines 1 Started using integrated crop management
5
Introduced hedges 5 Others 1
Introduced contour ploughing
1
Introduced rotations 24

20
Some of the changes that have only been made by very few households in this area include: (i) use
of irrigation; (ii) introduction of crop cover; (iii) introduction of stone lines; (iv) introduction of
hedges; (v) introduction of contour ploughing; (v) introduction of improved drainage; (vi) use of
integrated crop management. There has been no introduction of mechanized farming by these
households.
Changes and reasons for changes to the most important crops
Table 4.4 examines the changes made to the most commonly grown crops — bananas, beans and
maize.
Table 4.4 Changes made in farming practices to Bananas, Beans and Maize (percentage of cases
for households growing these crops)
Change Bananas Beans Maize
New variety introduced 70 84 76
Higher yielding variety
introduced
48 69 69
Better quality variety
introduced
37 45 39
Drought tolerant variety
introduced
26 23 30
Stopped using a variety 30 52 44
Shorter-cycle variety
introduced
15 42 56
Planted pre-treated or
improved seed
9 20 41
Introduced mulching 68 0 0
Started using
manure/compost
55 3 6
Expanded planted area 34 24 25
Reduced planted area 20 34 21
Introduced intercrops 14 34 45
Earlier land preparation 2 40 29
Earlier planting 3 44 34
21
For all these crops, widespread changes have included the introduction of new varieties, particularly
higher yielding and better quality varieties. Also for all three crops, the introduction of drought
tolerant varieties has been a change made by many. Introducing shorter-cycle varieties has been a
key change made in relation to beans and maize, as has the introduction of intercropping. Between a
third and a half of these households have prepared their land and planted beans earlier than they
use to, and over one-third have done so for maize. Just over 40% of households have switched to
planting pre-treated/improved maize seed.
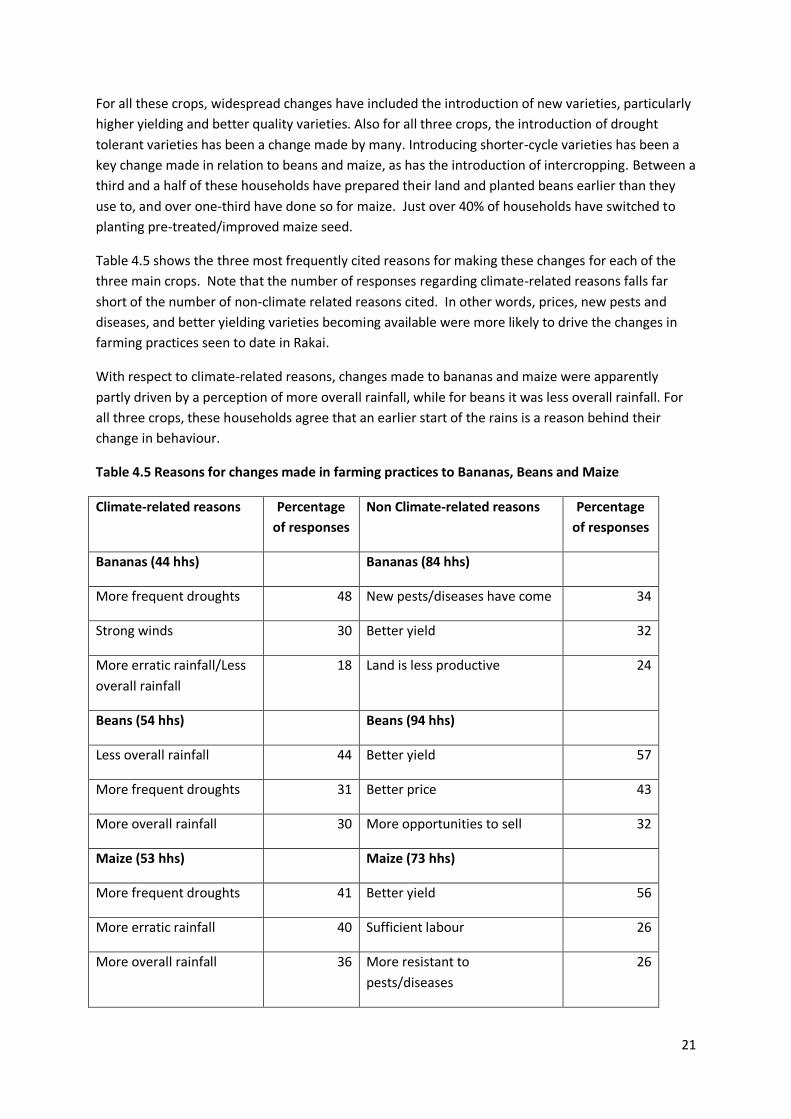
Table 4.5 shows the three most frequently cited reasons for making these changes for each of the
three main crops. Note that the number of responses regarding climate-related reasons falls far
short of the number of non-climate related reasons cited. In other words, prices, new pests and
diseases, and better yielding varieties becoming available were more likely to drive the changes in
farming practices seen to date in Rakai.
With respect to climate-related reasons, changes made to bananas and maize were apparently
partly driven by a perception of more overall rainfall, while for beans it was less overall rainfall. For
all three crops, these households agree that an earlier start of the rains is a reason behind their
change in behaviour.
Table 4.5 Reasons for changes made in farming practices to Bananas, Beans and Maize
Climate-related reasons Percentage
of responses
Non Climate-related reasons Percentage
of responses
Bananas (44 hhs) Bananas (84 hhs)
More frequent droughts 48 New pests/diseases have come 34
Strong winds 30 Better yield 32
More erratic rainfall/Less
overall rainfall
18 Land is less productive 24
Beans (54 hhs) Beans (94 hhs)
Less overall rainfall 44 Better yield 57
More frequent droughts 31 Better price 43
More overall rainfall 30 More opportunities to sell 32
Maize (53 hhs) Maize (73 hhs)
More frequent droughts 41 Better yield 56
More erratic rainfall 40 Sufficient labour 26
More overall rainfall 36 More resistant to
pests/diseases
26
22
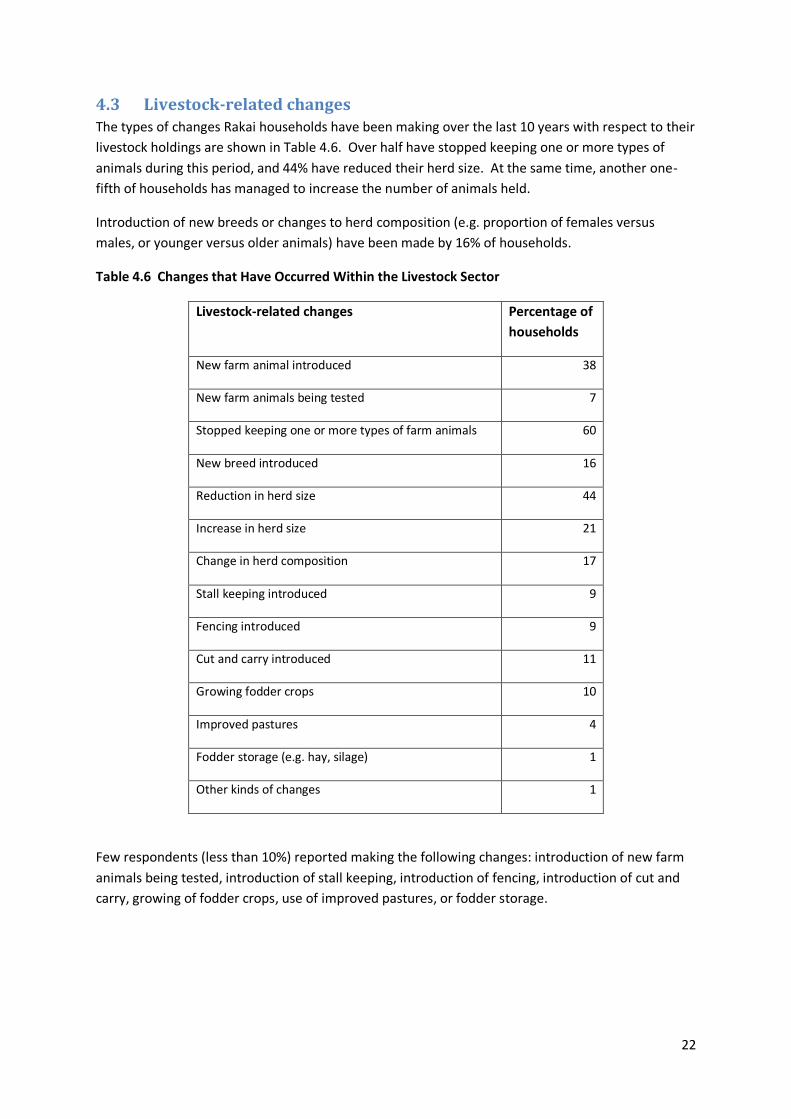
4.3 Livestock-related changes The types of changes Rakai households have been making over the last 10 years with respect to their
livestock holdings are shown in Table 4.6. Over half have stopped keeping one or more types of
animals during this period, and 44% have reduced their herd size. At the same time, another one-
fifth of households has managed to increase the number of animals held.
Introduction of new breeds or changes to herd composition (e.g. proportion of females versus
males, or younger versus older animals) have been made by 16% of households.
Table 4.6 Changes that Have Occurred Within the Livestock Sector
Livestock-related changes Percentage of
households
New farm animal introduced 38
New farm animals being tested 7
Stopped keeping one or more types of farm animals 60
New breed introduced 16
Reduction in herd size 44
Increase in herd size 21
Change in herd composition 17
Stall keeping introduced 9
Fencing introduced 9
Cut and carry introduced 11
Growing fodder crops 10
Improved pastures 4
Fodder storage (e.g. hay, silage) 1
Other kinds of changes 1
Few respondents (less than 10%) reported making the following changes: introduction of new farm
animals being tested, introduction of stall keeping, introduction of fencing, introduction of cut and
carry, growing of fodder crops, use of improved pastures, or fodder storage.
23
Table 4.7 Reasons for Changes in the Livestock Sector
Reasons Percentage of
hh’s citing
reason
related to
specific
animal types
Percentage of
hh’s citing
reason as not
animal
specific
Overall
Percentage
of
households
Better price 38 58 96
New opportunity to sell 37 58 95
More productive 37 57 94
More frequent droughts 11 82 92
More frequent floods 1 77 78
Higher tides 0 15 15
Frequent cyclones 0 11 11
More salinization 0 16 16
Insufficient labour 23 67 88
Able to hire labour 6 86 91
More resistant to diseases 19 75 92
New diseases are occurring 45 53 96
Government/ project told us to 5 89 94
Government/ project showed
us how
6 86 92
Policy changes 1 89 90
Others 24 1 24
Results in Table 4.7 show the main reasons why the various changes have taken place within the
livestock sector. Most of the weather or climate-related reasons were only mentioned by a few
households, although more frequent floods and droughts were mentioned by 77% and 82% of
households respectively when we consider reasons that were not animal specific. The most
prominent causes for the changes in the livestock sector that affected specific animal types were

24
market-related, including better price for livestock products, new opportunities to sell livestock
products. The introduction of more productive, and more disease resistant, livestock breeds were
other important reasons cited. Emerging diseases within the livestock sector were also a key reason
behind these changes. Government and project influences were high when considering changes not
specific to particular animal types.
4.4 Adaptability/Innovation Indicator An adaptability/Innovation Indicator was defined as the following:
0-1=zero or one change made in farming practices over last 10 years (low level)
1=2-10 changes made in farming practices (intermediate level)
2=11 or more changes made in farming practices (high level)
We see in Table 4.8 that only two households made zero or only one change in what and how they
farm over the last 10 years, 31% of households made between 2 and 10 changes, and 67% made 11
or more changes. In other words, two-thirds of these households have been adapting to their
changing circumstances and making a significant number of adjustments or changes in their farming
practices over the last 10 years. Further analysis, particularly of these more adaptive households, is
needed to better understand exactly what adaptations they have made and why.
Table 4.8 Adaptability/Innovation index
Number of changes made in
farming practices in last 10 years:
% of households
citing
Zero or One (low) 2
2-10 changes (intermediate) 31
11 or more changes (high) 67
4.5 Mitigation Indices Several climate mitigation-related behavioural changes were used to create the following indices:
Tree management:
This index shows whether a household has either protected or planted trees within the last year.
Soil amendments:
This index shows if the household has used fertilizer in the last year, or have started using fertilizer
or manure on at least one crop.

25
Input intensification
There are 7 ‘changes in agricultural practices/behaviour over the last 10 years’ considered here to
create an index with 3 levels - no intensification (none of the following), low intensification (1-3 of
the following), and high intensification (4-7 of the following). They are:
Purchased fertilizer
Started to irrigate
Started using manure/compost
Started using mineral/chemical fertilizers
Started using pesticides/herbicides
Started using integrated pest management techniques
Planted higher yielding varieties
Productivity Index
This index shows if a household has reported achieving a better yield from any crop, or that their
land is more productive for any crop over the last 10 years – such households are classified as
showing an "increase in productivity".
Table 4.9 shows the results for the mitigation-related indices for the surveyed households in Rakai.
94% of households reported some tree management activities over the last year, and 59%
undertook soil amendment (e.g. fertilization) actions. Virtually all surveyed households had
experienced increases in agricultural productivity. 9% have not increased their input use, 74% have
intensified their input use at a low level, and 17% at a higher level.
Table 4.9 Mitigation-related indices
Index No
(% of hh’s)
Yes
(% of hh’s)
Tree management 6 94
Soil amendments 41 59
Increase in productivity 1 99
Input intensification 9 Low-74
High-17

26
5.0 Food Security The monthly source of food for the family was queried, i.e. whether it came mainly from their own
farm, or elsewhere for each month (in an average year). Households were also asked during which
months of the year they struggled to have enough food to feed their family, from any source.
Figure 5.1 indicates that most households are getting their food main from their own farms in
January, February, July and August. During the period September through December, over one-half
of these households are relying largely on markets and other sources to feed their families.
Figure 5.1 Main source of food for the household
Figure 5.2 shows that over half of households actually experience food shortages from September through December. Figure 5.2 Hunger/Food shortage months

27
5.1 Food Security Index The food security index we created is based upon the number of months that the household has difficulty getting food from any source (i.e. from their own farm or stores, gifts, purchases or transfers). For our surveyed households in Rakai, only 10% are ‘food secure’ all year long. 15% have enough for at least 10-11 months of the year. 74% of these households struggle to get enough food to feed their family for more than 2 months out of a year. Table 5.1 Food Security Index
Percent of surveyed households reporting:
More than 6
hunger
months/year
5-6 hunger
months/
3-4 hunger
months/
1-2 hunger
months/
Food all year
round/No
hungry period
10 25 39 15 10
6.0 Land and Water
6.1 Water for Agriculture For the on-farm water sources (used for agricultural purposes, not for household use), we see the
number and percentage of households using each water source, and that 74% of households have
none of these agricultural water sources on their own farms (Table 6.1). Very few households are
using any type of irrigation (13%), or have tanks (12%) or dams/waterholes (8%).
Table 6.1 Water sources for agriculture on-farm
On-farm agricultural water source % of households
Irrigation 13
Tanks for water harvesting 12
Dams or waterholes 8
Boreholes 1
Water pumps 0
None of the above 74
In examining how this varies by household type (table not shown), the results showed that only 6
(22%) female-headed households had access to any on-farm source of agricultural water whereas 40
male-headed households (36%) did, so it appears that female-headed households are even more at
a disadvantage in this area.
28
6.2 Land Use The land available for each household includes both land that is owned by the household and land
that is rented. As seen in Table 6.2, just over half of households have access to less than one hectare
of land and just under half have access to between 1 and 5 hectares. Only a couple of households
have more than 5 hectares.
Table 6.2 Total land size accessed by households
Number of hectares of land owned
and rented in
% of households
Less than one hectare 51
1-5 hectares 48
Over 5 hectares 1
Mean land size in Rakai was 1.2 ha (median: 0.8 ha). Sixty-eight percent of households reported that
all the land they cultivate was owned by the household (i.e. none was rented-in). On the other hand,
84% of households reported that the land they use for grazing is rented-in, though only 4% use
communal land for grazing. Fifty-six percent of households allocated all the land they owned to food
production.
Hired Machinery or Labour
The results show that 42% of households sometimes hire farm labour, and male and female-headed
households are equally likely to hire farm labour. Farm machinery is seldom hired by these
households.
7.0 Inputs and Credit Table 7.1 shows that for our surveyed households, almost half bought seed in the last 12 months,
20% purchased fertilizer, 60% purchased pesticides, and 59% bought veterinary medicines. 26% of
households receive some credit for agricultural activities. Only one household had purchased
agricultural insurance.

29
Table 7.1 Purchased Input use
In the last year, did you use: % of
households
Purchased Seeds 48
Purchased Fertilizers 20
Purchased Pesticides 60
Veterinary medicine 59
Received credit for agricultural activities 26
Bought crop or livestock insurance 1
7.2 Fertilizer Use Table 7.2 shows the types of fertiliser households were using. As we saw above, only 1/5 of
households in this area are applying any types of chemical fertilizers at all. The most common
fertilizers applied are DAP, Urea and NPK. Percentages in this table are with respect to the
households that applied fertiliser.
Table 7.2 Type of fertilizers used
Fertilizer type % of households
Urea 30
NPK 18
DAP 37
CAN 4
Rock Phosphate 4
Local mixture 7
This survey did not obtain information on quantities of fertilisers applied. Just over 50% of
households who used fertiliser applied it to their most important crop. The crops to which fertiliser
was applied by the most households were maize (52% of those using fertiliser) and coffee (37% of
those using fertiliser).

30
8.0 Climate & Weather Information An analysis of which households are receiving any type of climate or weather information shows that
most households (84%) are receiving some type of weather or climate-related information. We next
looked at who is receiving what kinds of weather-related information within the households.
8.1 Types of weather-related information We see in Table 8.1 that the majority of farmers received forecasts of extreme events (79%), pests
and disease outbreaks (63%); and forecasts on the start of the rains (80%). Only 51% and 32% of the
respondents said they had heard a 2-3 month weather forecast, or a short-term forecast of the
weather for the next 1-3 days.
Table 8.1 Type of weather-related information received and used
Proportion of Farmers Receiving and Using
Weather-related Information to Change
Practices
Type of information % of
households
receiving
information
% of those
households
also receiving
advice with
information
% of
households
receiving
advice that
were able to
use it
Forecast of extreme event 79 76 88
Forecast of pest or disease outbreak 63 77 76
Forecast of the start of the rains 80 78 87
Forecast of the weather for 2-3
months
51 78 96
Forecast of the weather 1-3 days 32 78 94
For households that had received all these types of information, roughly three-quarters said they
also received some agricultural advice on how to use it. And it appears that the advice was useful, as
the vast majority receiving the advice were also able to use it to make adaptive changes to their
farming practices.
Tables 8.2 and 8.3 report on where these households are getting their weather information, and
who received it.

31
Table 8.2 Type and Sources of Climate and Weather Information
Percentage of Households Receiving Information from Various Sources
Type of information Radio TV Govt NGOs Friends News-
paper
Obser
vation
Local
groups
Forecast of extreme
event
87 1 2 2 13 1 11 14
Forecast of pest or
disease outbreak
81 - 9 - 16 2 2 16
Forecast of the start
of the rains
90 1 1 - 12 1 10 11
Forecast of the
weather for 2-3
months
89 1 - - 15 - 13 11
Forecast of the
weather for 1-3 days
69 2 - - 24 - 31 -
Radio is by far the most common source of weather-related information. These households are also
relying on friends and their own observations. Government agricultural extension officers were cited
as a source of information on predicted pest or disease outbreaks, but only by 9% of households.
Very few respondents received information from the television.
8.2 Who is receiving and using weather-related information? Table 8.3 shows which household members are receiving weather-related information.
Table 8.3 Gender breakdown of different kinds of weather-related information
Type of information
Who within the Household is Receiving
Weather Information
Men Women Both men
and women
Forecast of extreme event 34 20 46
Forecast of pest or disease outbreak 30 19 51
Forecast of the start of the rains 32 22 46
Forecast of the weather for 2-3
months
32 15 52
Forecast of the weather 2-3 days 20 13 67

32
For most types of weather-related information the information is received by men in about 30% of
households, by women in about 20% of households and by both men and women in 50% of
households. The exception is short-term weather forecast for the next 2 to 3 days which is received
by both men and women in two-thirds of the households that receive this information. These
figures are shown in Table 8.3 where the percentages are with respect to the households receiving
the information.
Few changes in practices were reported in response to the reception of weather information (Table
8.4). The most common change made in response to all types of weather information received was
in the timing of farming activities (e.g. planting). Pest and disease outbreak information was used to
inform changes in pesticide use. We see very little responsiveness in terms of changing crop types
or varieties in response to weather information.
Table 8.4 How Weather Information was used
Practices changed
Percent of households receiving information regarding:
extreme event info
start of the rains prediction
pest & disease outbreak prediction
2-3 month weather forecast
2-3 day weather forecast
Timing of farming activities
60 89 20 87 67
Crop type 4 3 4 6 3
Crop variety 1 0 4 0 0
Input use (seed, fertiliser, pesticides)
0 1 33 2 0
Manure/compost/mulch use
4 0 0 0 0
Field location 0 1 0 0 0
Planted trees 11 0 2 0 0
Land management practices
7 5 6 2 0
Soil and water conservation practices
8 7 2 0 3
Irrigation practices 1 0 0 0 0
Water management practices
5 1 0 0 3
Feed management 1 0 6 0 0
Note: the percentages above are with respect to households receiving information with advice that they were able to use.

33
8.3 Sources of assistance to climate crises Eight-seven percent of respondents stated they had experienced a climate crisis in the past 12
months. However, only 17% of these said they had ever received any assistance to overcome the
crisis. Table 8.5 indicates the sources of assistance for the different respondents
Table 8.5 Sources of Assistance to Climate Crises
Source of Assistance % of
households
receiving
assistance Friends, relatives, neighbors 22
Government agencies 50
Politicians, e.g. MPs 1
NGOs/CBOs 22
Religious organizations 6
Local community group 17
Note: Percentages here are with respect to the number of households receiving assistance for climate related crises.
9.0 Community Groups Respondents were asked if someone in the household was a member of an agricultural or natural
resource management related group. Such group membership appears to be quite low for Rakai
surveyed households. The most frequently joined group appears to be savings/credit groups, with
21% of households belonging to this type of group (Table 9.1). Sixty-four percent of households are
reportedly not members of any agricultural/natural resource management-related group.
Table 9.1 Group membership
Type of group % of households
Type of group % of households
Tree nursery/tree planting 7 Agricultural productivity enhancement related
15
Water catchment/management
6 Seed production 5
Soil improvement related 7 Vegetable production 7
Crop introduction/substitution
6 Other group not mentioned above?
4
Irrigation 2 Agricultural product marketing
7
Savings/credit related 21 No groups 64

34
10.0 Assets
10.1 Asset Indicator Households were asked about household assets they had, from a set list. The assets they were asked about include the following:
Energy: Solar panel, Generator (electric or diesel), Battery (large, e.g. car battery for power), Biogas
digester;
Information: Radio, Television, Cell phone, Computer, Internet access;
Production means: Tractor, Mechanical plough, Mill, Thresher;
Transport: Bicycle, Motorcycle, Car or truck;
Luxury items: Fridge, Air conditioning, Electric fan, Bank account, Improved Stove.
The total number of assets in all categories was added up and the following asset indicator created:
0=no assets (basic level) 1=1-3 assets (intermediate level) 2=4 or more assets (high level)
It is important to note that this indicator is not intended to include every possible type of asset, and that the checklist includes some indicators that we expect to see becoming more important in the future than they may be at present. It also does not include a critical asset for resource-poor households, livestock assets.
The results of the analysis for these Rakai households show that 10% have none of the household assets we inquired about, 66% of the surveyed households have between 1 and 3 of these assets, and 24% own 4 or more of these assets (Table 10.1). Table 10.1 Asset Indicator
Number of queried assets % of households
None (basic level) 10
1-3 (intermediate level) 66
4 or more 24
Table 10.2 shows the percentage of households with various assets and access to utilities. 85% of households own a radio and just over half have a cellphone. Sixty-one percent own a bicycle, and 16% have a motorcycle, but only 1% own a car or truck. Next to none have electricity or running water in their homes. Only 16% of these households have a bank account.

35
Table 10.2 Asset Ownership
Type of Asset % of
hhs
Type of Asset % of
hhs
Radio 85 Electric fan 2
Television 5 Thresher 0
Cell phone 54 Liquid pressurised gas 0
Bicycle 61 Internet access 0
Motorcycle 16 Boat 1
Car or truck 1 Fishing nets 2
Computer 1 Bank account 16
Solar panel 6
Tractor 1 Improved food/feed storage facility 12
Mechanical plough 0 Water storage tank (domestic water) 9
Mill 0 Improved housing (brick, concrete) 61
Improved stove 17 Well/borehole (for household water) 4
Generator (electric or diesel) 1 Running water in dwelling 1
Battery (large, e.g. car battery) 6 Electricity from a grid 3
Water pump/treadle pump 15 Improved housing (brick, concrete) 61
Biogas digester 1 Improved roofing (tin, tiles) 89
Refrigerator 2 Separate livestock housing 30
Air conditioning 0
With respect to food security-related assets, only 12% of households have some type of improved
grain/food storage facility, although 30% of them have separate housing facilities for their livestock,
suggesting how important those are to these families’ wellbeing. We see evidence of improved
housing/roofing by the majority of households, which is typically one of the first investments rural
households make when they have met their food and other basic needs. Encouraging to see is that
improved stoves have been adopted by 17% of households, and a few households have already
obtained solar panels (and one has a computer).
36
Appendix 1: Survey Process and Implementation In Rakai District, the unit of analysis for the CCAFS baseline survey was the household. Households
that were interviewed were selected through a rigorous sampling scheme that involved a three level
hierarchical multistage sampling procedure including: the Block, the Villages, and eventually the
Households. The procedures that follow explicitly describe how these sampling techniques were
conducted.
Block Selection
The research team carried out discussions with the District Agricultural Officer (DAO) to select the
block based on the criteria generated within the training manual. The criteria were discussed with
the DAO and the following criteria was agreed upon to select the 10×10 km block. The block should:
Represent research sites under different institutional arrangements.
Have contrasting climate-related problems and opportunities for intervention.
Have high potential sites where community members will produce impact and accept to
enhance up scaling.
Have key social economic issues including urbanization and gender participation.
Have evident participation of local and political leaders to scale up the generated results as
well as ensure the sustainability of the project result(s).
Have active presence of NGOs, research organization(s) as well as community based
organization(s) to facilitate the scaling up of the project activities Be safe to work in and be
accessible by the project team.
Using the above criteria, the team with the assistance of the District Agricultural Officer generated a
10km×10 kilometer block which included 4 sub-counties namely; Ddwaniro, Rakai, Byakabanda and
Lwanda. The block also had several NGOs/CBOs supporting agricultural related activities. Among
these were; World Vision, RACA, CIDI, LOVEM, CONCERN, Masaka District Diocese Development
Organisation (MADDDO), Rakai Aids Information Network (RAIN), and Community Enterprise
Development Organization (CEDO).
Village Selection
Subcounties are large administrative units that were further sub-divided into parishes to make it
easier to compile the village lists. The parishes are smaller administrative units that comprise the
sub-county and can further be sub-divided into villages. It was thus important for the team to
consult with the sub-county chiefs to generate the names of the parishes and subsequently the
names of the villages that comprised each parish. The parish was only used to make it easy for the
sub-county and parish chiefs to accurately identify the villages (see annex 1). All the villages in the
parishes were identified and also verified with the different parish chiefs. The list of villages was
used as a sampling frame to randomly select 7 villages to participate in the survey using the table of

37
random numbers adopted from the Statistical Package for the Social Sciences. This was a divergence
from the manual table of random numbers that was proposed in the trainer’s manual. Table 1
shows the villages that were selected to participate in the study.
Household Selection
The villages served as the entry points to develop a list of households that comprised the village.
The Local Council (LC) chairperson for each village was contacted and requested to identify four
other community members who were knowledgeable about the village boundaries as well as the
names of the households in each of the villages. Thus a total of five to ten persons was engaged in a
focus group meeting and facilitated to generate a participatory village map. Like the manual
stipulates, the village mapping was carried out in an open environment where other community
members dropped in and contributed towards the list. It was also made clear to the focus group
participants that participation in the village mapping did not necessarily confirm their participation
in the detailed household survey.
Also the maps were generated on pieces of manila sheet, where each household was allocated a
number on the map and written notes were taken to assign a household name to a household
number. These household names and numbers were entered into SPSS and computer based random
selector was used to generate the list of the households that will participate in the baseline survey. It
is also important to note that the number of households differed from village to village. Annex 2
shows the names of households in each of the village as well as the households that were selected
to participate in the survey.
Data Collection Procedures and Quality Assurance Strategies
Team Composition
The Rakai team was made up of six members with proven experience in conducting surveys. The
team included a Team Leader, a Site Supervisor, four enumerators and two data clerks (see the table
below).
Names and positions of responsibility for Rakai Site Team
Position Name
Site Coordinator Dr. Florence Birungi Kyazze
Site Supervisor Mr. Ahmed Zziwa
Enumerators Ms. Rebecca Mukebezi
Ms. Patria Nyabahutu
Mr. Owen Sseremba
Mr. Henry Magala
Data Clerks Ms. Judith Asiimwe
Ms. Stella Namazzi
To ensure that a competent and high quality team was assembled, a rigorous recruitment process,
as described below, was undertaken.

38
Enumerator and Supervisor Recruitment Process
The enumerators to participate in the baseline survey were recruited through an advertisement
process. Adverts were posted on public notice boards in Makerere University requesting for well
qualified research assistants to participate in a data collection exercise due in the month December.
The adverts emphasized the quality of the research assistants based on the guidelines that were
stipulated in the trainer’s manual. Ability to speak, write and read the local languages in the study
site was a requirement. The persons that were recruited were given an informal verbal interview by
the team leader but were also given the task of back translating the instrument that had been
translated in the common local language spoken in Rakai District. Four enumerators were thus
recruited to participate in the study.
The field supervisors were recruited through a solicitation process based on their wide experience in
designing and conducting qualitative and quantitative research. In addition, field supervisors were
recruited for their ability to effectively lead team as well as carry out an unbiased quality assurance
exercise. Also note that roles and duties of the different members were outlined as stipulated in the
training manual for CCAFS baseline study
Description of Data Collection Tools
The questionnaire, the major data collection instrument was development through joint efforts
between the CCAFS coordinating team and the national team leaders. After several consultations, a
final version written in English was recommended. The questionnaire, initially written in English, was
translated into Luganda, the local language spoken in Rakai District, to ensure that all enumerators
collected reliable of information. To ensure the quality of the translation, it was necessary to get the
questionnaire back-translated into English by another person. It was important to translate the
questionnaire into the local language because most of the study respondents were non-English
speakers.
Supervisor/Enumerator Training and Field Preparation Activities
Training of supervisors and enumerators was crucial to this exercise to ensure that good quality data
for the baseline. The training was carried out for both the supervisor and enumerators by the team
leader as per guidelines that are stipulated in training manual for the CCAFS baseline study. The
training was carried out using the local language as well as the translated questionnaire. Basically
the training;
Introduced the supervisor and enumerators to the objectives and the general outlay of the
survey instrument and the sampling procedures
Explained the roles of both the enumerators and supervisors as outlined in the training
manual
Provided hands on experience of how to collect the required data.
Data Collection Procedures
A formal appointment was made with each of the household that was selected to participate in the
survey. The LC village chiefs in each of the villages were requested to assist in delivering verbal

39
request to the selected households and receive confirmation on the best time and day when the
respondents will be available for the interview. On each of the days, enumerators were dropped
and picked from the various households to collect the required information, while the field
supervisor took the GPS reading for each of the household. At the end of each day, the field
supervisor scrutinized each of the completed questionnaires and held a one on one discussion with
the enumerator to effect the collection. At the end of the individual discussion, the field supervisor
convened a general meeting to forge and plan a way forward for the next day.
Data Entry Procedure and Analysis
Data was entered using CS-Pro software with technical backstopping from the CCAFS coordinating
desk. Since this was a new program, training activities on how to use the programme were
undertaken to ensure that data was entered accurately. The data entry process was entrusted to
data clerks each working parallel to the other on the same data set. It was critical that this was done
to ensure that clean data was entered. This was ensured by a feature in the CS-Pro software
component that could do comparison to identify if any difference existed within the same data set.
The compatibility of CS-Pro software with the SPSS software was an advantage that enabled the
team to export to data from CS-Pro to SPSS for basic descriptive statistical analyses. The major
statistical tools that were used were frequencies and means that enable the description of the
farming system as well as the trends for major socio-demographic characteristics of the farming
communities, basic livelihood and welfare indicators, agriculture and natural resources management
practices and strategies, access and use of climate and agricultural-related information; and current
risk management, mitigation and adaptation practices. Note that whereas applicable, the
frequencies are generated through the multi-responses feature of the SPSS program to ensure that
clear trends for the variation within the components of the farming system are captured concisely.

40
Appendix Two: Randomly selected villages for the baseline study
No. Village Selected Parish Sub-county
1. Kakumbiro Byakabanda Byakabanda
2. Bubba Kamukalo Byakabanda
3. Kyengeza Kasensero Lwanda
4. Kituntu Kiyovu Lwanda
5. Gosola Kiyovu Lwanda
6. Kijuna B Buyamba Ddwaniro
7. Kateera B Lwakaloolo Ddwaniro


![HPTN 068 Study Household Baseline Questionnaire …...Household Baseline Questionnaire 31 JANUARY 2011-- FINAL -- v1.0 [ ] [ ] Caregiver Relationship Codes Coding: List all household](https://img.pdfslide.net/doc/110x75/5f3b3afb5990ba394b68f5ae/hptn-068-study-household-baseline-questionnaire-household-baseline-questionnaire.jpg)


![Guiding focus group discussions [manual] · Baseline Household Level Questionnaire (CCAFS Household Baseline Survey 2010-12, ... class and age. In focus group discussions farmers](https://img.pdfslide.net/doc/110x75/5f4d59d4f0cfab39f828da03/guiding-focus-group-discussions-manual-baseline-household-level-questionnaire.jpg)